FINANCIAL RESULTS FY19
49
FINANCIAL RESULTS – FY19 MUMBAI 4 th May 2019 Aditya Birla Capital Limited Investor Presentation A Leading Financial Services Conglomerate
Transcript of FINANCIAL RESULTS FY19
FINANCIAL RESULTS – FY19
MUMBAI
4th May 2019
Aditya Birla Capital Limited
Investor Presentation
A Leading Financial Services Conglomerate
Table of contents
2Aditya Birla Capital Limited
1 | Overview Pg. 3 - 6
2 | Business-wise Performance Pg. 7 - 44
3 | Consolidated Financials & Other Annexures Pg. 45 - 49
NOTE 1: The financials of Aditya Birla Capital Ltd are consolidated financials prepared based on Ind AS unless otherwise specifiedNOTE 2: The financial figures in this presentation have been rounded off to the nearest Rs 1 Crore
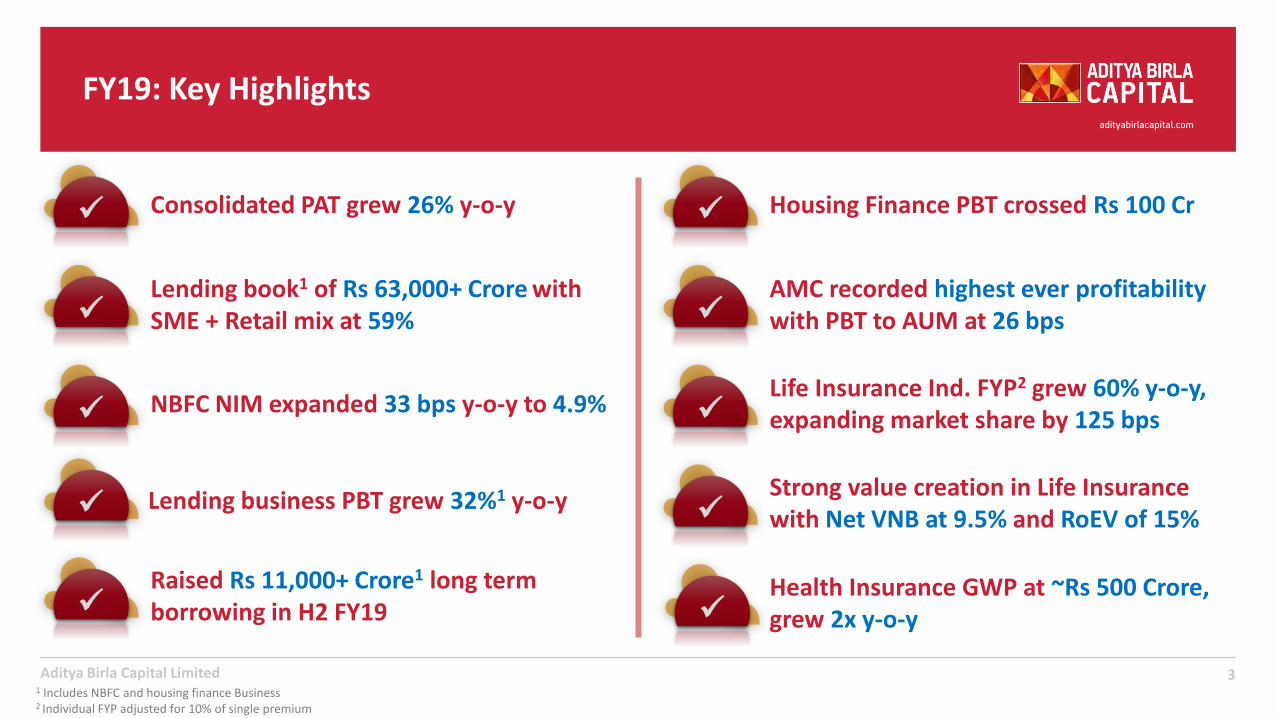
FY19: Key Highlights
3Aditya Birla Capital Limited
✓
✓
✓
✓
✓
✓
✓
1 Includes NBFC and housing finance Business2 Individual FYP adjusted for 10% of single premium
✓
Consolidated PAT grew 26% y-o-y
AMC recorded highest ever profitability with PBT to AUM at 26 bps
Life Insurance Ind. FYP2 grew 60% y-o-y,expanding market share by 125 bps
Strong value creation in Life Insurance with Net VNB at 9.5% and RoEV of 15%
Health Insurance GWP at ~Rs 500 Crore, grew 2x y-o-y
Housing Finance PBT crossed Rs 100 Cr
✓
Raised Rs 11,000+ Crore1 long term borrowing in H2 FY19
NBFC NIM expanded 33 bps y-o-y to 4.9%
Lending book1 of Rs 63,000+ Crore with SME + Retail mix at 59%
✓ Lending business PBT grew 32%1 y-o-y
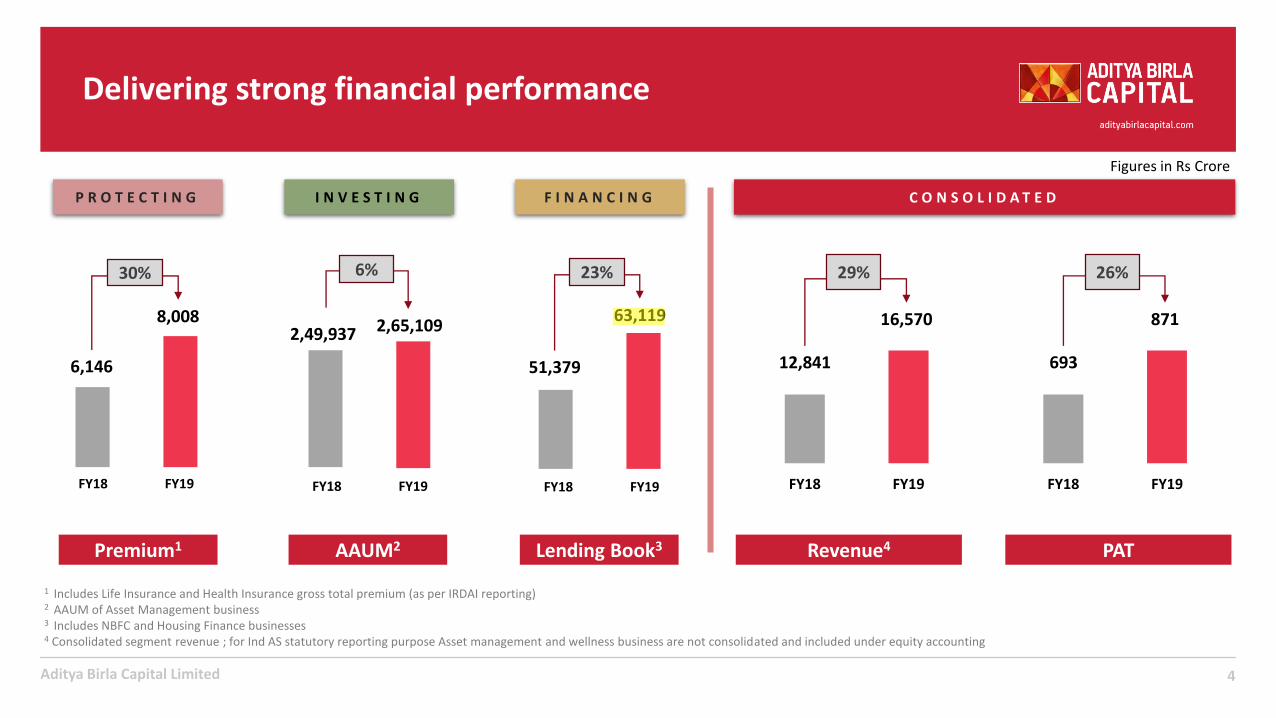
Delivering strong financial performance
4Aditya Birla Capital Limited
Figures in Rs Crore
1 Includes Life Insurance and Health Insurance gross total premium (as per IRDAI reporting)2 AAUM of Asset Management business3 Includes NBFC and Housing Finance businesses4 Consolidated segment revenue ; for Ind AS statutory reporting purpose Asset management and wellness business are not consolidated and included under equity accounting
Premium1
30%
FY19FY18
8,008
6,146
P R O T E C T I N G
AAUM2
6%
FY19FY18
2,65,1092,49,937
I N V E S T I N G
Lending Book3
23%
FY19FY18
63,119
51,379
F I N A N C I N G C O N S O L I D A T E D
29%
FY19FY18
16,570
12,841
Revenue4 PAT
26%
FY19FY18
871
693
nasir.sheikh
Highlight
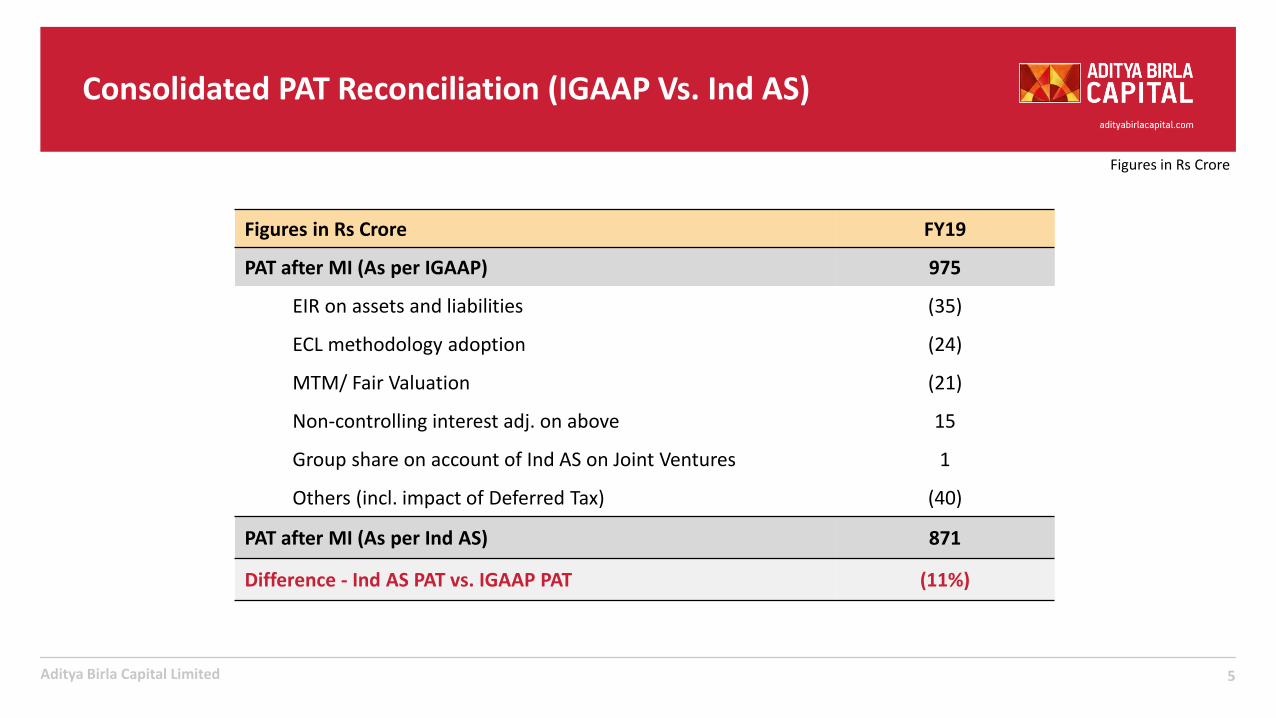
Consolidated PAT Reconciliation (IGAAP Vs. Ind AS)
5Aditya Birla Capital Limited
Figures in Rs Crore
Figures in Rs Crore FY19
PAT after MI (As per IGAAP) 975
EIR on assets and liabilities (35)
ECL methodology adoption (24)
MTM/ Fair Valuation (21)
Non-controlling interest adj. on above 15
Group share on account of Ind AS on Joint Ventures 1
Others (incl. impact of Deferred Tax) (40)
PAT after MI (As per Ind AS) 871
Difference - Ind AS PAT vs. IGAAP PAT (11%)
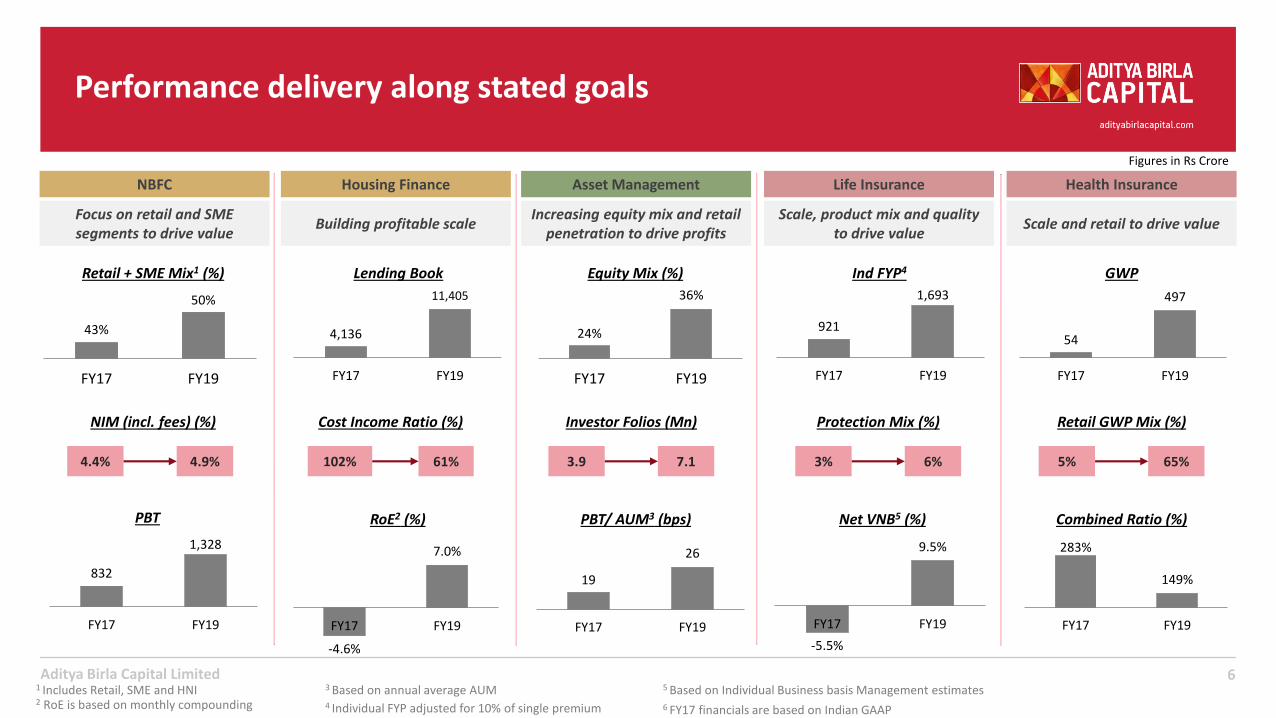
921
1,693
FY17 FY19
Protection Mix (%)
-5.5%
9.5%
FY17 FY19
Net VNB5 (%)
Scale, product mix and quality to drive value
Life Insurance
3% 6%
Ind FYP4
Cost Income Ratio (%)
-4.6%
7.0%
FY17 FY19
RoE2 (%)
Building profitable scale
Housing Finance
102% 61%
Lending Book
4,136
11,405
FY17 FY19
Retail GWP Mix (%)
283%
149%
FY17 FY19
Combined Ratio (%)
Scale and retail to drive value
Health Insurance
5% 65%
GWP
54
497
FY17 FY19
Retail + SME Mix1 (%)
NIM (incl. fees) (%)
Focus on retail and SME segments to drive value
NBFC
4.4% 4.9%
Investor Folios (Mn)
19
26
FY17 FY19
PBT/ AUM3 (bps)
Increasing equity mix and retail penetration to drive profits
Asset Management
3.9 7.1
Equity Mix (%)
Performance delivery along stated goals
6
Figures in Rs Crore
3 Based on annual average AUM4 Individual FYP adjusted for 10% of single premium
5 Based on Individual Business basis Management estimatesAditya Birla Capital Limited
6 FY17 financials are based on Indian GAAP
43%
50%
FY17 FY19
PBT
24%
36%
FY17 FY19
832
1,328
FY17 FY19
1 Includes Retail, SME and HNI2 RoE is based on monthly compounding

7
Aditya Birla Finance Limited
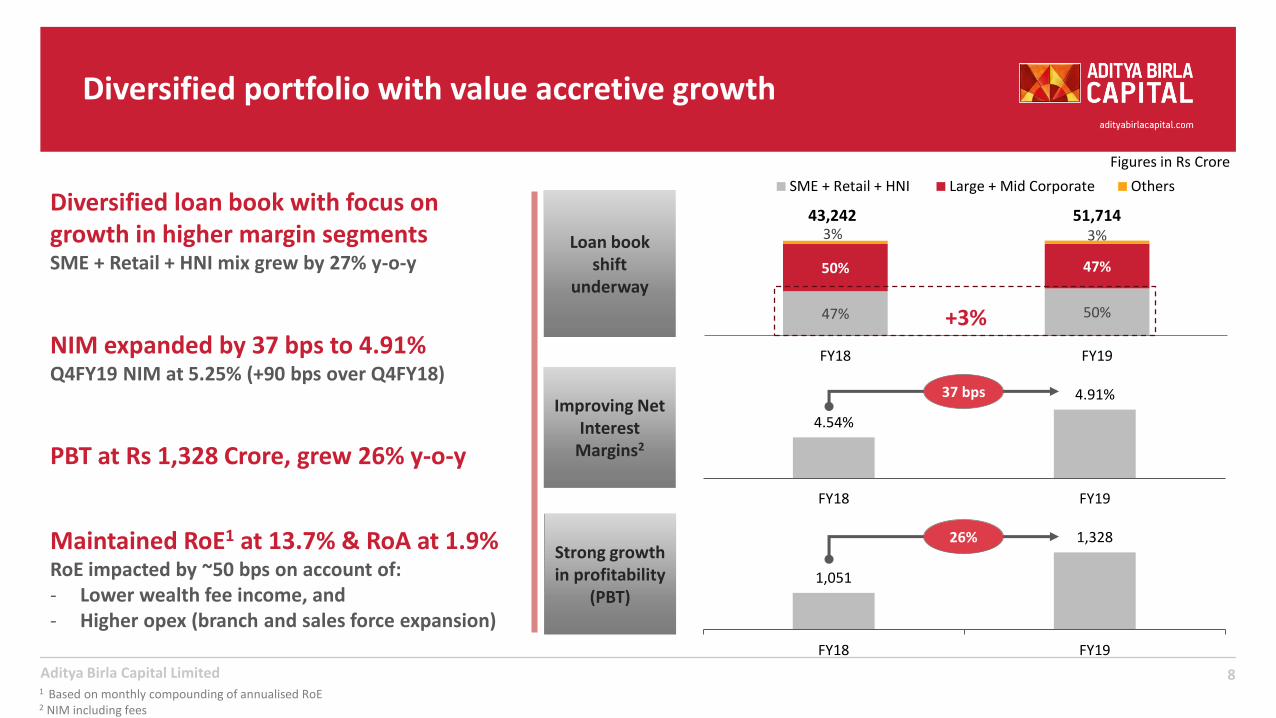
Diversified portfolio with value accretive growth
8Aditya Birla Capital Limited
Improving Net Interest
Margins2
Loan book shift
underway
47% 50%
50% 47%
3% 3%
FY18 FY19
SME + Retail + HNI Large + Mid Corporate Others
51,71443,242
+3%
4.54%
4.91%
FY18 FY19
Diversified loan book with focus on growth in higher margin segmentsSME + Retail + HNI mix grew by 27% y-o-y
Strong growth in profitability
(PBT)
Figures in Rs Crore
1,051
1,328
FY18 FY19
PBT at Rs 1,328 Crore, grew 26% y-o-y
NIM expanded by 37 bps to 4.91%Q4FY19 NIM at 5.25% (+90 bps over Q4FY18)
1 Based on monthly compounding of annualised RoE2 NIM including fees
Maintained RoE1 at 13.7% & RoA at 1.9%RoE impacted by ~50 bps on account of:- Lower wealth fee income, and - Higher opex (branch and sales force expansion)
37 bps
26%
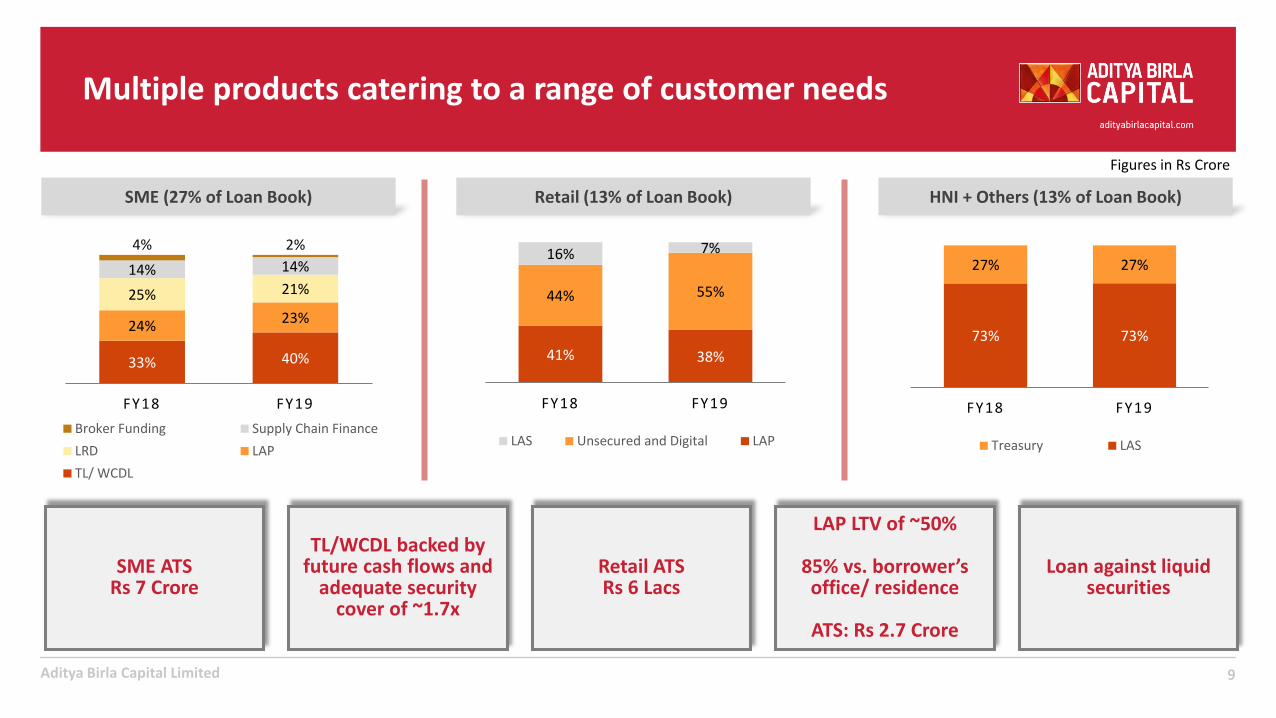
Multiple products catering to a range of customer needs
9Aditya Birla Capital Limited
Figures in Rs Crore
33% 40%
24%23%
25% 21%14% 14%
4% 2%
FY18 FY19
Broker Funding Supply Chain Finance
LRD LAP
TL/ WCDL
SME (27% of Loan Book)
41% 38%
44% 55%
16% 7%
FY18 FY19
LAS Unsecured and Digital LAP
Retail (13% of Loan Book)
73% 73%
27% 27%
FY18 FY19
Treasury LAS
HNI + Others (13% of Loan Book)
Loan against liquid securities
SME ATSRs 7 Crore
Retail ATSRs 6 Lacs
LAP LTV of ~50%
85% vs. borrower’s office/ residence
ATS: Rs 2.7 Crore
TL/WCDL backed by future cash flows and
adequate security cover of ~1.7x
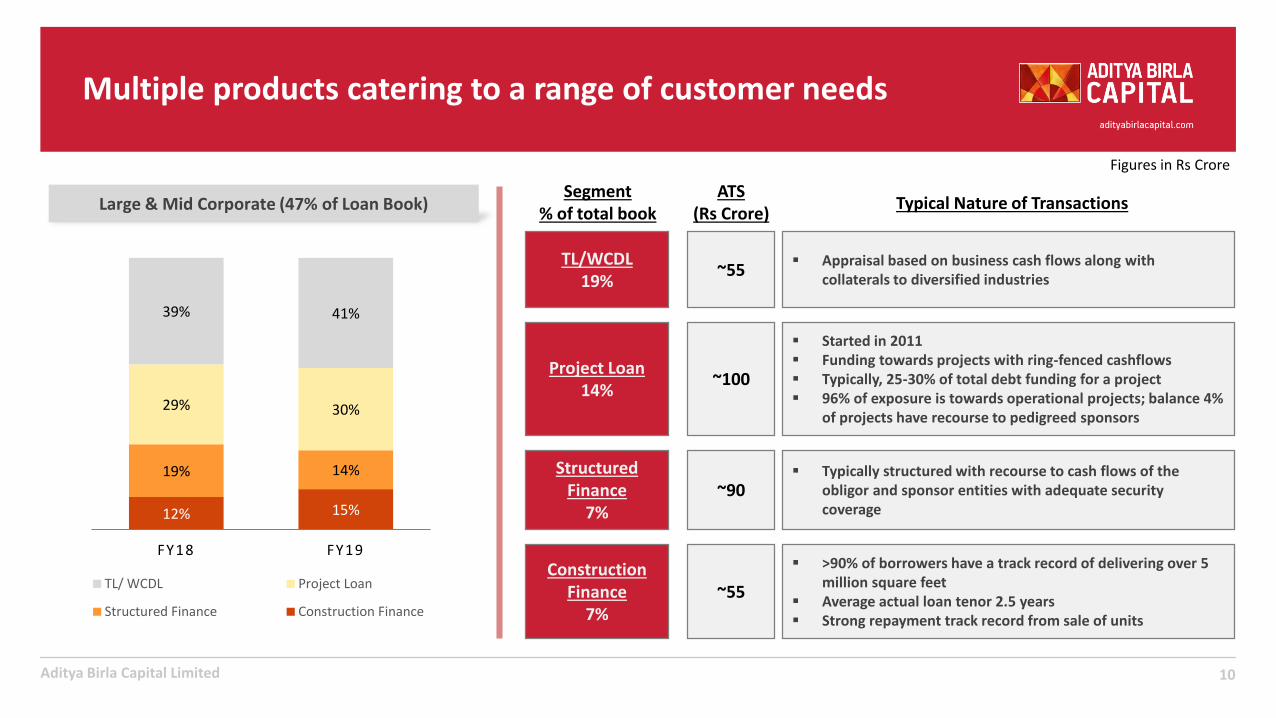
Multiple products catering to a range of customer needs
10Aditya Birla Capital Limited
Figures in Rs Crore
12% 15%
19% 14%
29% 30%
39% 41%
FY18 FY19
TL/ WCDL Project Loan
Structured Finance Construction Finance
Large & Mid Corporate (47% of Loan Book)
TL/WCDL19%
▪ Appraisal based on business cash flows along with collaterals to diversified industries
~55
Project Loan14%
▪ Started in 2011▪ Funding towards projects with ring-fenced cashflows▪ Typically, 25-30% of total debt funding for a project▪ 96% of exposure is towards operational projects; balance 4%
of projects have recourse to pedigreed sponsors
~100
Structured Finance
7%
▪ Typically structured with recourse to cash flows of the obligor and sponsor entities with adequate security coverage
~90
Construction Finance
7%
▪ >90% of borrowers have a track record of delivering over 5 million square feet
▪ Average actual loan tenor 2.5 years▪ Strong repayment track record from sale of units
~55
Segment% of total book
ATS (Rs Crore)
Typical Nature of Transactions
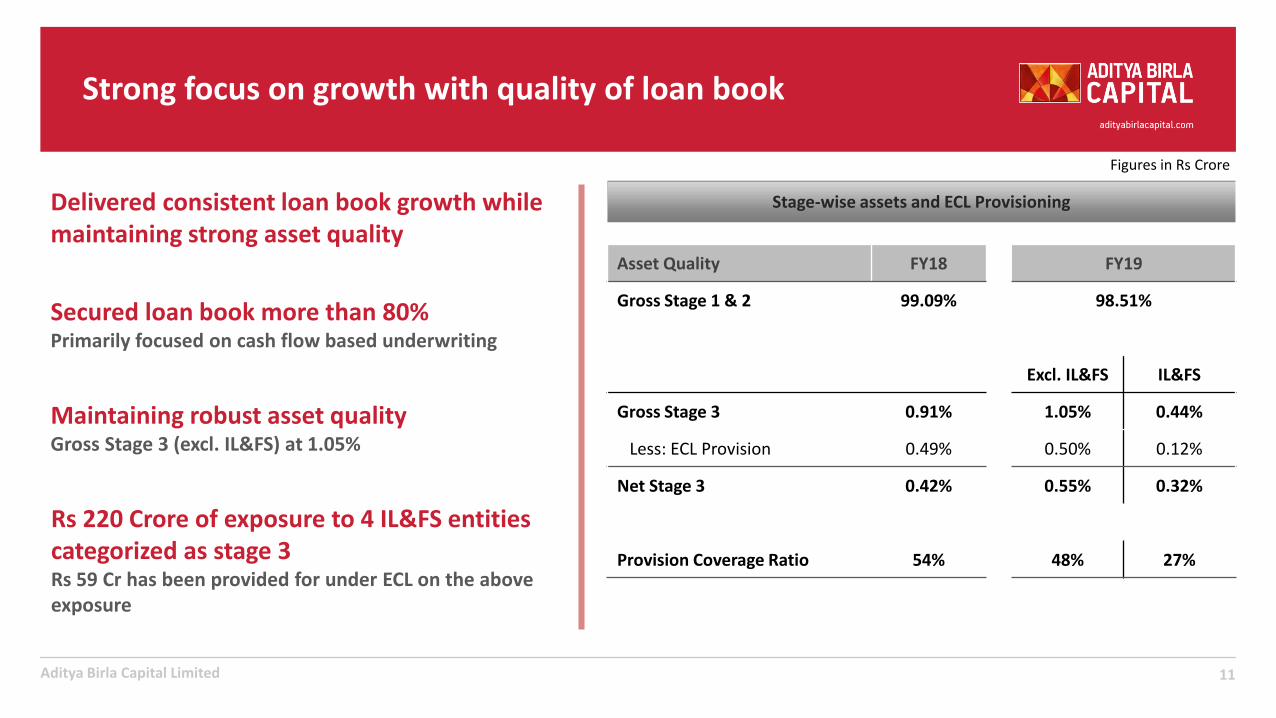
Strong focus on growth with quality of loan book
11Aditya Birla Capital Limited
Figures in Rs Crore
Maintaining robust asset qualityGross Stage 3 (excl. IL&FS) at 1.05%
Secured loan book more than 80%Primarily focused on cash flow based underwriting
Delivered consistent loan book growth while maintaining strong asset quality
Rs 220 Crore of exposure to 4 IL&FS entities categorized as stage 3 Rs 59 Cr has been provided for under ECL on the above exposure
Stage-wise assets and ECL Provisioning
Asset Quality FY18 FY19
Gross Stage 1 & 2 99.09% 98.51%
Excl. IL&FS IL&FS
Gross Stage 3 0.91% 1.05% 0.44%
Less: ECL Provision 0.49% 0.50% 0.12%
Net Stage 3 0.42% 0.55% 0.32%
Provision Coverage Ratio 54% 48% 27%
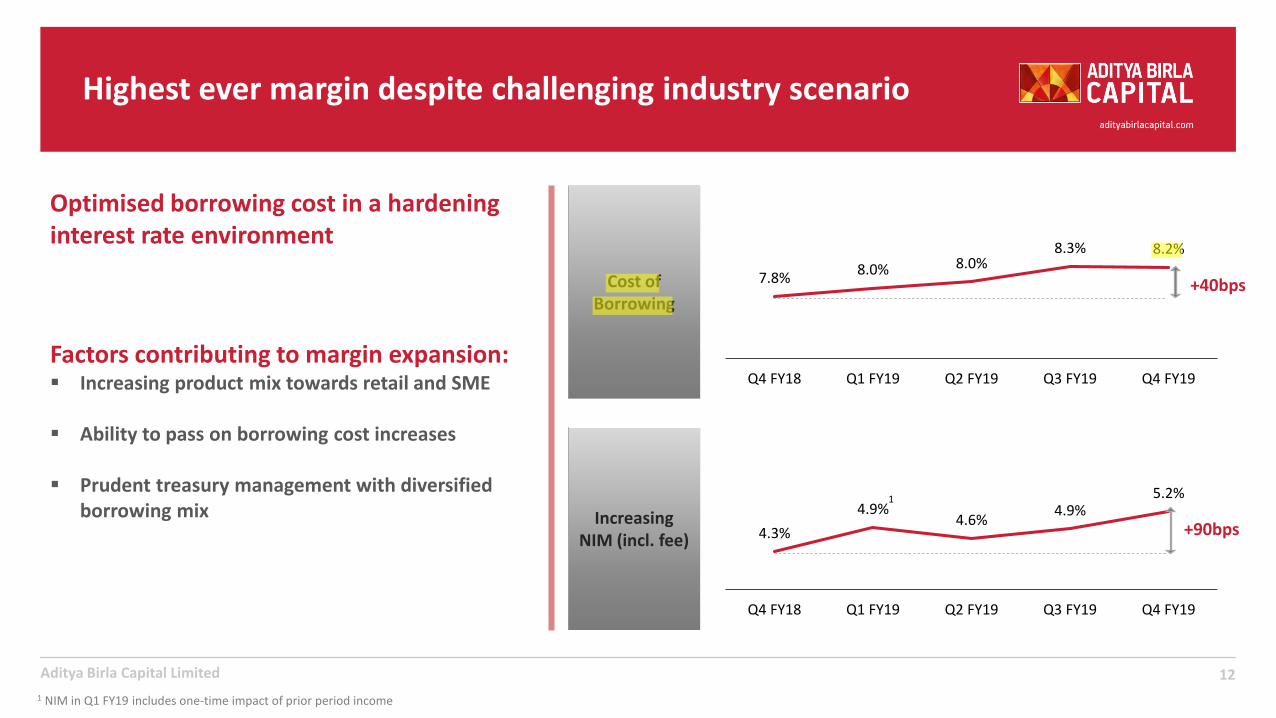
Highest ever margin despite challenging industry scenario
12Aditya Birla Capital Limited
Factors contributing to margin expansion:▪ Increasing product mix towards retail and SME
▪ Ability to pass on borrowing cost increases
▪ Prudent treasury management with diversified borrowing mix Increasing
NIM (incl. fee)
Cost of Borrowing
Optimised borrowing cost in a hardeninginterest rate environment
7.8%8.0% 8.0%
8.3% 8.2%
Q4 FY18 Q1 FY19 Q2 FY19 Q3 FY19 Q4 FY19
4.3%
4.9%4.6%
4.9%5.2%
Q4 FY18 Q1 FY19 Q2 FY19 Q3 FY19 Q4 FY19
+90bps
+40bps
1
1 NIM in Q1 FY19 includes one-time impact of prior period income
nasir.sheikh
Highlight
nasir.sheikh
Highlight
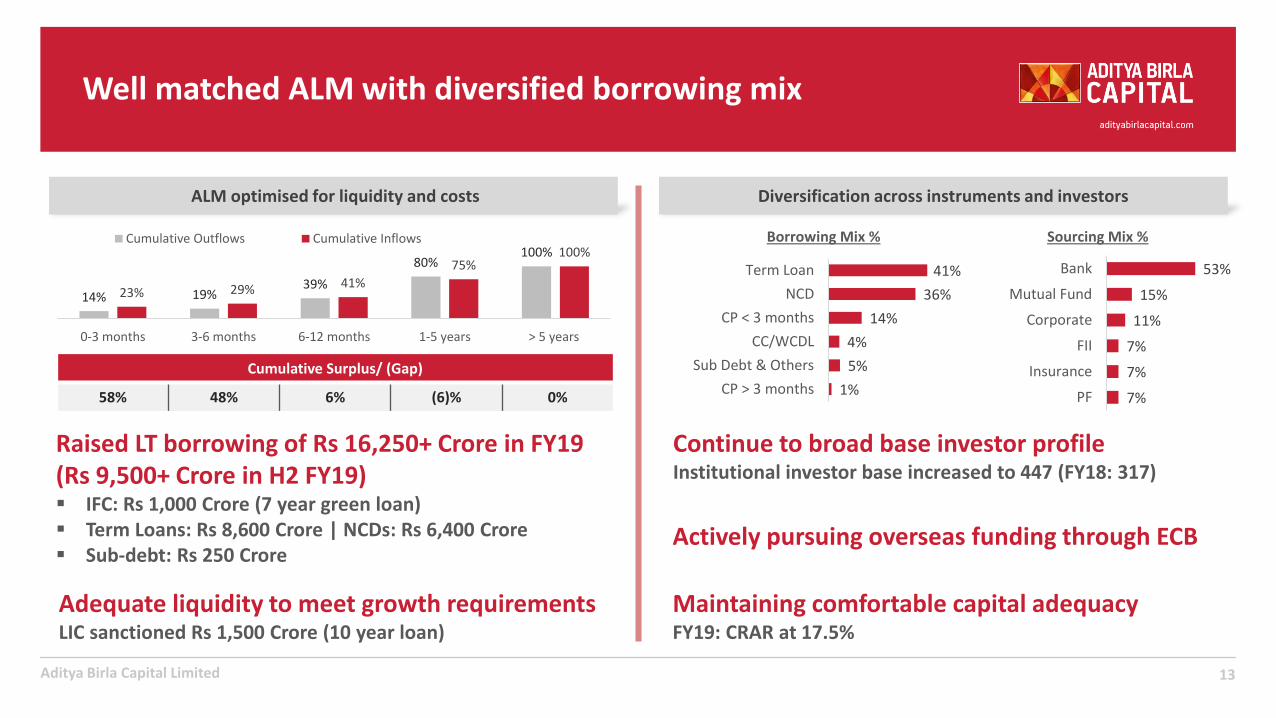
Well matched ALM with diversified borrowing mix
13Aditya Birla Capital Limited
Continue to broad base investor profile Institutional investor base increased to 447 (FY18: 317)
14% 19%39%
80%100%
23% 29% 41%
75%100%
0-3 months 3-6 months 6-12 months 1-5 years > 5 years
Cumulative Outflows Cumulative Inflows
ALM optimised for liquidity and costs
Raised LT borrowing of Rs 16,250+ Crore in FY19 (Rs 9,500+ Crore in H2 FY19)▪ IFC: Rs 1,000 Crore (7 year green loan)▪ Term Loans: Rs 8,600 Crore | NCDs: Rs 6,400 Crore▪ Sub-debt: Rs 250 Crore
Cumulative Surplus/ (Gap)
58% 48% 6% (6)% 0%
53%
15%
11%
7%
7%
7%
Bank
Mutual Fund
Corporate
FII
Insurance
PF
41%
36%
14%
4%
5%
1%
Term Loan
NCD
CP < 3 months
CC/WCDL
Sub Debt & Others
CP > 3 months
Borrowing Mix % Sourcing Mix %
Diversification across instruments and investors
Maintaining comfortable capital adequacyFY19: CRAR at 17.5%
Adequate liquidity to meet growth requirementsLIC sanctioned Rs 1,500 Crore (10 year loan)
Actively pursuing overseas funding through ECB
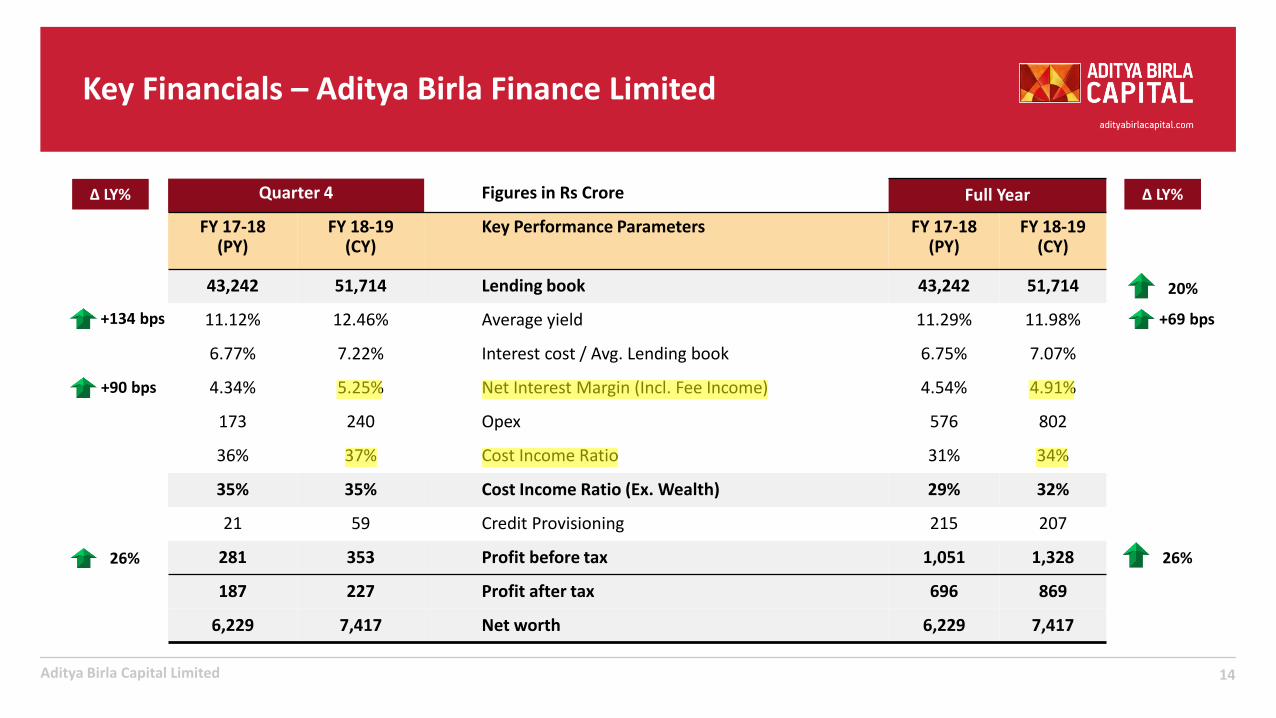
Key Financials – Aditya Birla Finance Limited
14Aditya Birla Capital Limited
Quarter 4 Figures in Rs Crore Full Year
FY 17-18 (PY)
FY 18-19 (CY)
Key Performance Parameters FY 17-18 (PY)
FY 18-19 (CY)
43,242 51,714 Lending book 43,242 51,714
11.12% 12.46% Average yield 11.29% 11.98%
6.77% 7.22% Interest cost / Avg. Lending book 6.75% 7.07%
4.34% 5.25% Net Interest Margin (Incl. Fee Income) 4.54% 4.91%
173 240 Opex 576 802
36% 37% Cost Income Ratio 31% 34%
35% 35% Cost Income Ratio (Ex. Wealth) 29% 32%
21 59 Credit Provisioning 215 207
281 353 Profit before tax 1,051 1,328
187 227 Profit after tax 696 869
6,229 7,417 Net worth 6,229 7,417
20%
26%
∆ LY%
26%
∆ LY%
+134 bps
+90 bps
+69 bps
nasir.sheikh
Highlight
nasir.sheikh
Highlight
nasir.sheikh
Highlight
nasir.sheikh
Highlight
nasir.sheikh
Highlight
nasir.sheikh
Highlight

15
Aditya Birla Housing Finance Limited
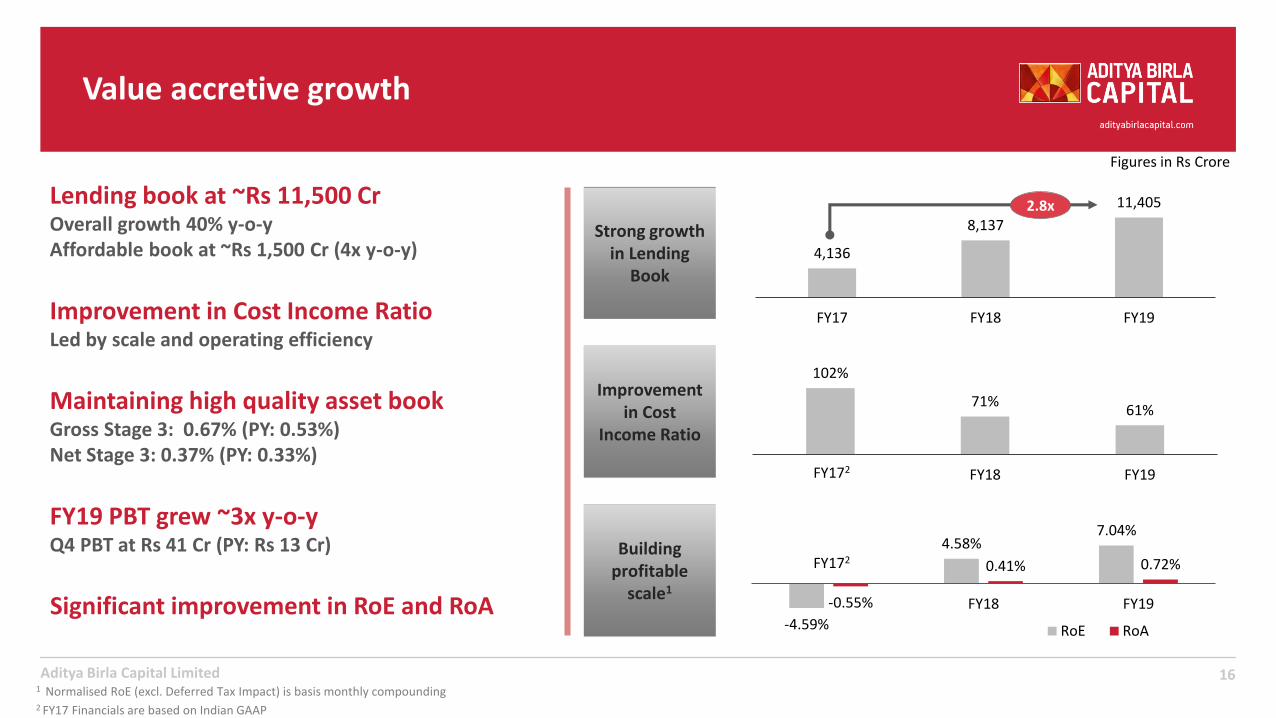
Value accretive growth
16Aditya Birla Capital Limited
102%
71%61%
FY18 FY19
Lending book at ~Rs 11,500 CrOverall growth 40% y-o-yAffordable book at ~Rs 1,500 Cr (4x y-o-y)
Figures in Rs Crore
Strong growth in Lending
Book
Improvement in Cost
Income Ratio
Building profitable
scale1
4,136
8,137
11,405
FY17 FY18 FY19Improvement in Cost Income RatioLed by scale and operating efficiency
FY19 PBT grew ~3x y-o-yQ4 PBT at Rs 41 Cr (PY: Rs 13 Cr)
Maintaining high quality asset bookGross Stage 3: 0.67% (PY: 0.53%) Net Stage 3: 0.37% (PY: 0.33%)
-4.59%
4.58%7.04%
-0.55%
0.41% 0.72%
FY18 FY19
RoE RoA
1 Normalised RoE (excl. Deferred Tax Impact) is basis monthly compounding
2.8x
FY172
2 FY17 Financials are based on Indian GAAP
FY172
Significant improvement in RoE and RoA
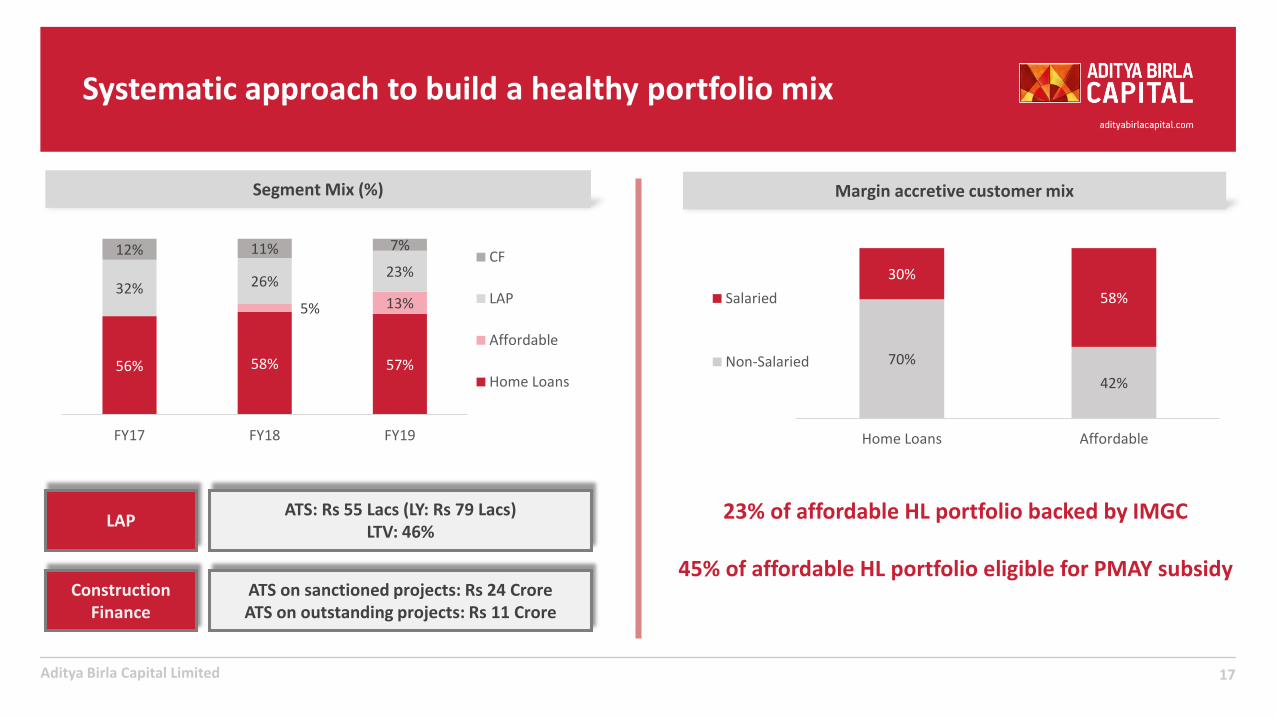
Systematic approach to build a healthy portfolio mix
17Aditya Birla Capital Limited
Segment Mix (%)
56% 58% 57%
5% 13%32% 26%
23%
12% 11% 7%
FY17 FY18 FY19
CF
LAP
Affordable
Home Loans
Margin accretive customer mix
70%
42%
30%
58%
Home Loans Affordable
Salaried
Non-Salaried
LAPATS: Rs 55 Lacs (LY: Rs 79 Lacs)
LTV: 46%
Construction Finance
ATS on sanctioned projects: Rs 24 CroreATS on outstanding projects: Rs 11 Crore
23% of affordable HL portfolio backed by IMGC
45% of affordable HL portfolio eligible for PMAY subsidy
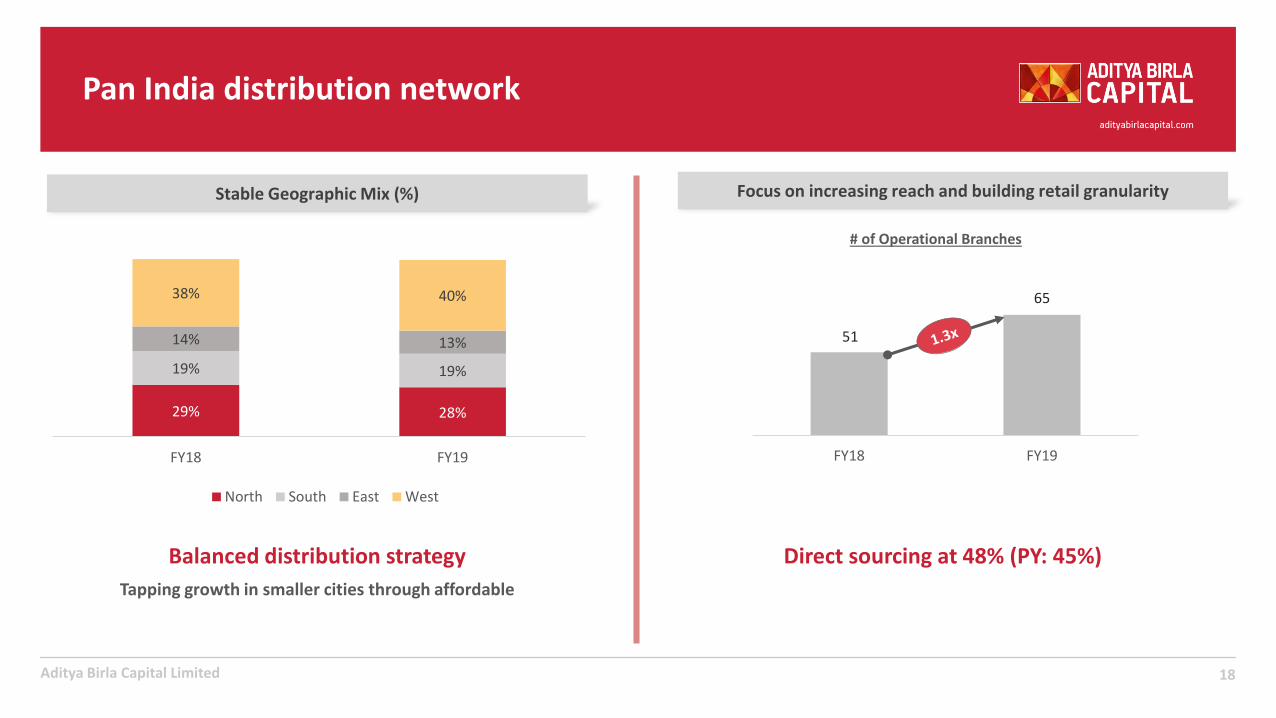
Pan India distribution network
18Aditya Birla Capital Limited
Focus on increasing reach and building retail granularityStable Geographic Mix (%)
29% 28%
19% 19%
14% 13%
38% 40%
FY18 FY19
North South East West
Balanced distribution strategy
Tapping growth in smaller cities through affordable
Direct sourcing at 48% (PY: 45%)
51
65
FY18 FY19
# of Operational Branches
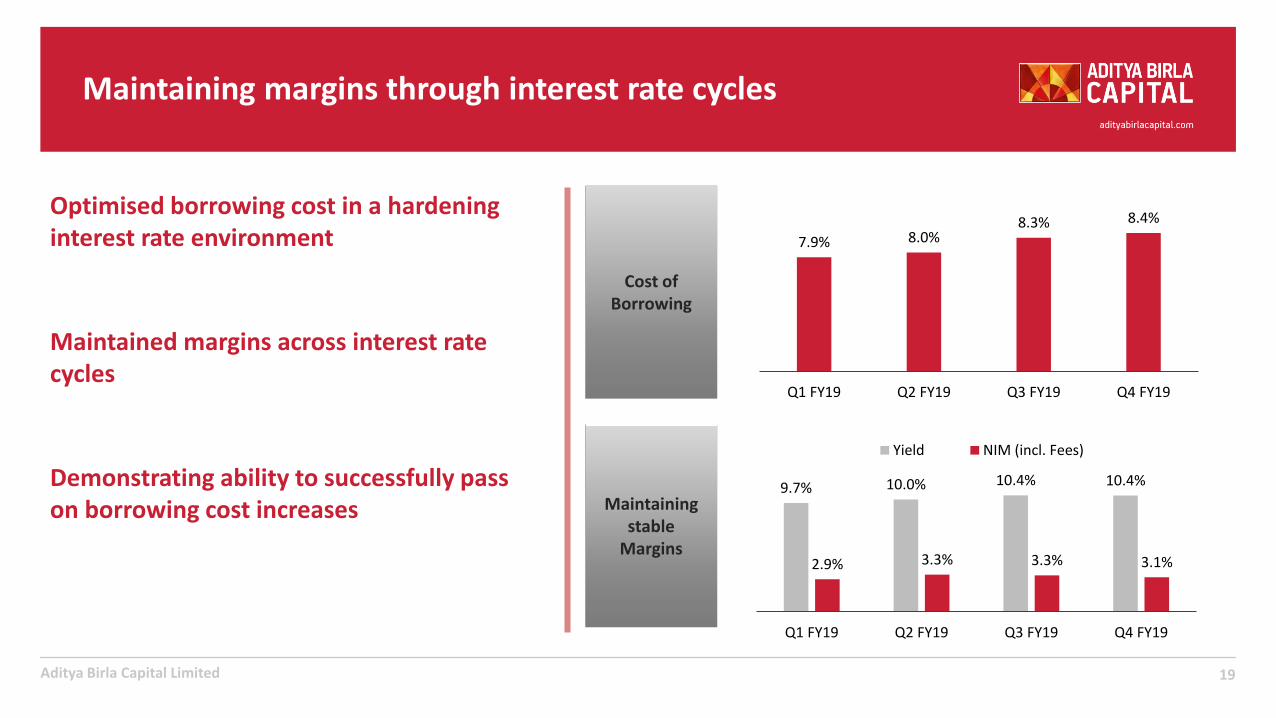
Maintaining margins through interest rate cycles
19Aditya Birla Capital Limited
Maintaining stable
Margins
Cost of Borrowing
9.7% 10.0% 10.4% 10.4%
2.9% 3.3% 3.3% 3.1%
Q1 FY19 Q2 FY19 Q3 FY19 Q4 FY19
Yield NIM (incl. Fees)
Optimised borrowing cost in a hardeninginterest rate environment 7.9% 8.0%
8.3% 8.4%
Q1 FY19 Q2 FY19 Q3 FY19 Q4 FY19
Demonstrating ability to successfully pass on borrowing cost increases
Maintained margins across interest rate cycles
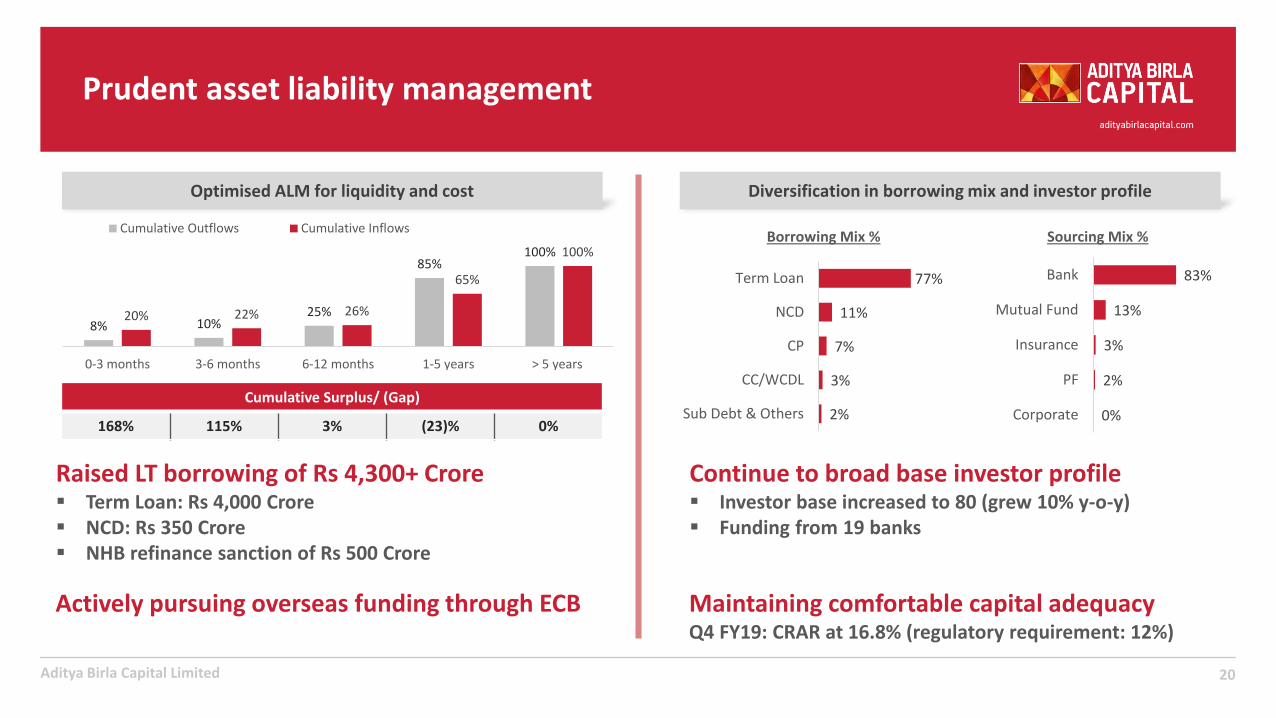
Prudent asset liability management
20Aditya Birla Capital Limited
Optimised ALM for liquidity and cost
8% 10%25%
85%100%
20% 22% 26%
65%
100%
0-3 months 3-6 months 6-12 months 1-5 years > 5 years
Cumulative Outflows Cumulative Inflows
Cumulative Surplus/ (Gap)
168% 115% 3% (23)% 0%
Diversification in borrowing mix and investor profile
Continue to broad base investor profile ▪ Investor base increased to 80 (grew 10% y-o-y)▪ Funding from 19 banks
83%
13%
3%
2%
0%
Bank
Mutual Fund
Insurance
PF
Corporate
77%
11%
7%
3%
2%
Term Loan
NCD
CP
CC/WCDL
Sub Debt & Others
Borrowing Mix % Sourcing Mix %
Maintaining comfortable capital adequacyQ4 FY19: CRAR at 16.8% (regulatory requirement: 12%)
Raised LT borrowing of Rs 4,300+ Crore▪ Term Loan: Rs 4,000 Crore▪ NCD: Rs 350 Crore▪ NHB refinance sanction of Rs 500 Crore
Actively pursuing overseas funding through ECB
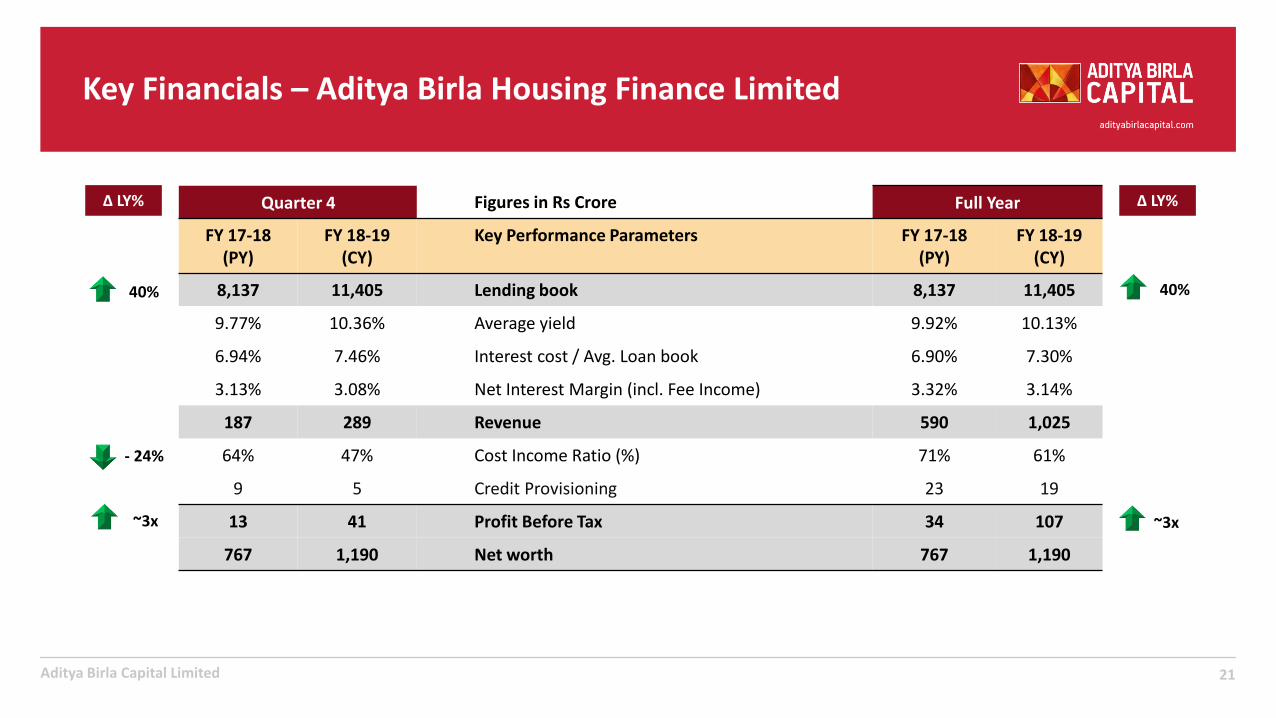
Key Financials – Aditya Birla Housing Finance Limited
21Aditya Birla Capital Limited
Quarter 4 Figures in Rs Crore Full Year
FY 17-18 (PY)
FY 18-19 (CY)
Key Performance Parameters FY 17-18 (PY)
FY 18-19 (CY)
8,137 11,405 Lending book 8,137 11,405
9.77% 10.36% Average yield 9.92% 10.13%
6.94% 7.46% Interest cost / Avg. Loan book 6.90% 7.30%
3.13% 3.08% Net Interest Margin (incl. Fee Income) 3.32% 3.14%
187 289 Revenue 590 1,025
64% 47% Cost Income Ratio (%) 71% 61%
9 5 Credit Provisioning 23 19
13 41 Profit Before Tax 34 107
767 1,190 Net worth 767 1,190
∆ LY%
40%
~3x
∆ LY%
40%
~3x
- 24%
22
Aditya Birla Sun Life AMC Limited
Profitable growth aided by improvement in asset mix
23Aditya Birla Capital Limited
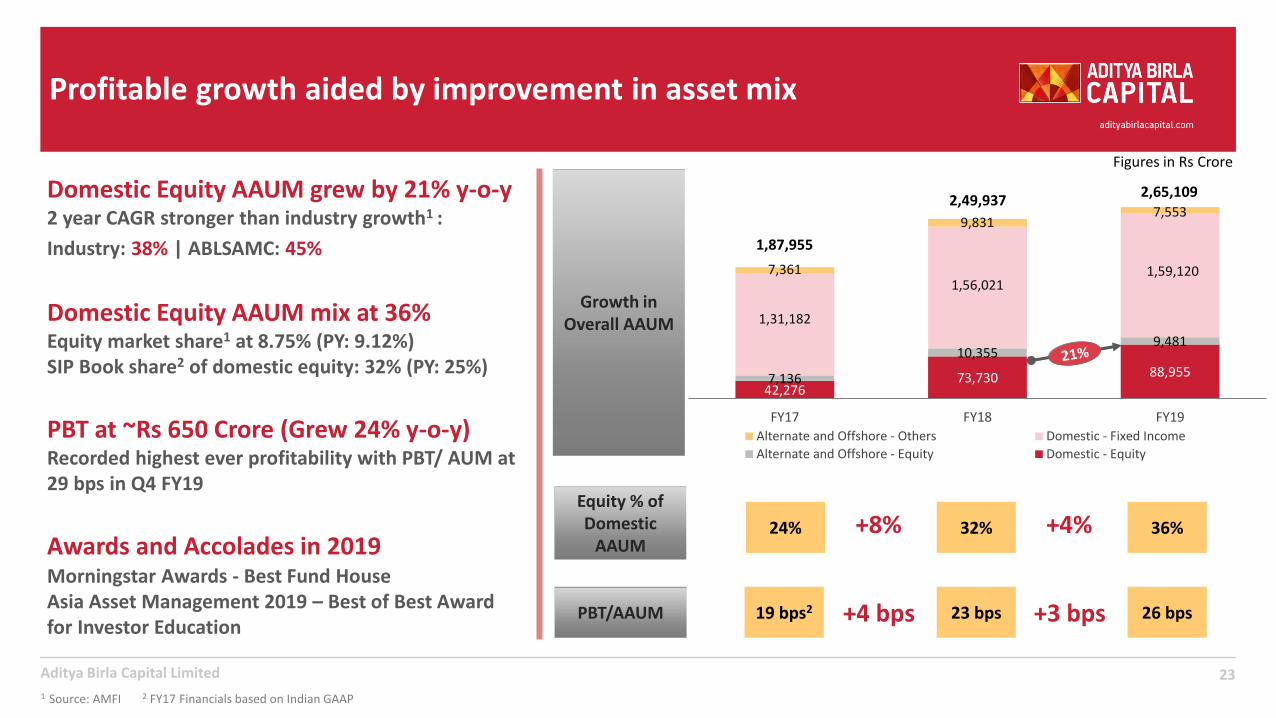
Figures in Rs Crore
Growth in Overall AAUM
1 Source: AMFI 2 FY17 Financials based on Indian GAAP
19 bps2 23 bps 26 bpsPBT/AAUM
42,27673,730 88,9557,136
10,3559,481
1,31,182
1,56,0211,59,1207,361
9,8317,553
FY17 FY18 FY19
Alternate and Offshore - Others Domestic - Fixed Income
Alternate and Offshore - Equity Domestic - Equity
2,49,9372,65,109
1,87,955
PBT at ~Rs 650 Crore (Grew 24% y-o-y)Recorded highest ever profitability with PBT/ AUM at 29 bps in Q4 FY19
Domestic Equity AAUM grew by 21% y-o-y2 year CAGR stronger than industry growth1 :
Industry: 38% | ABLSAMC: 45%
24% 32% 36%
Equity % of Domestic
AAUM+8% +4%
Domestic Equity AAUM mix at 36%Equity market share1 at 8.75% (PY: 9.12%)SIP Book share2 of domestic equity: 32% (PY: 25%)
Awards and Accolades in 2019Morningstar Awards - Best Fund HouseAsia Asset Management 2019 – Best of Best Award for Investor Education
+4 bps +3 bps
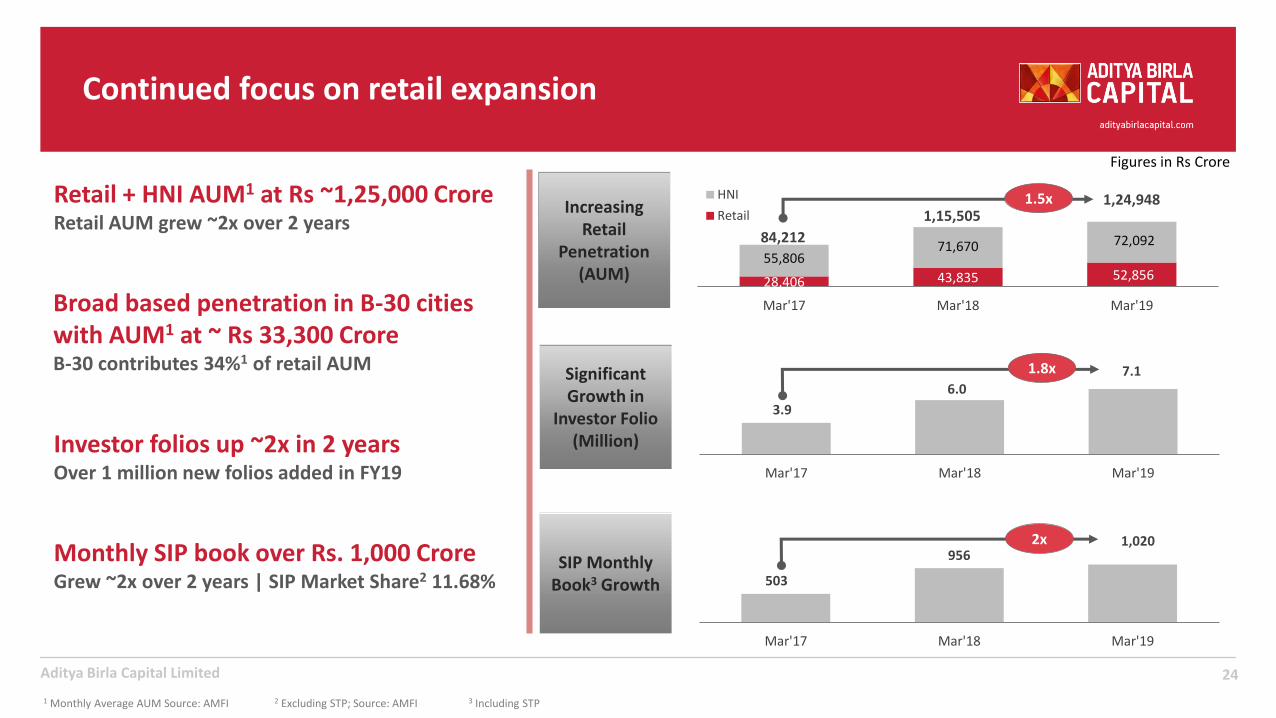
503
9561,020
Mar'17 Mar'18 Mar'19
3.9
6.07.1
Mar'17 Mar'18 Mar'19
Continued focus on retail expansion
24Aditya Birla Capital Limited
Significant Growth in
Investor Folio (Million)
SIP Monthly Book3 Growth
1 Monthly Average AUM Source: AMFI 2 Excluding STP; Source: AMFI 3 Including STP
1.8x
Broad based penetration in B-30 cities with AUM1 at ~ Rs 33,300 CroreB-30 contributes 34%1 of retail AUM
Retail + HNI AUM1 at Rs ~1,25,000 CroreRetail AUM grew ~2x over 2 years
Increasing Retail
Penetration (AUM)
2x
28,406 43,835 52,856 55,806
71,670 72,092
Mar'17 Mar'18 Mar'19
HNI
Retail 1,15,5051,24,948
84,212
1.5x
Figures in Rs Crore
Investor folios up ~2x in 2 yearsOver 1 million new folios added in FY19
Monthly SIP book over Rs. 1,000 CroreGrew ~2x over 2 years | SIP Market Share2 11.68%
Balanced Distribution Network
25Aditya Birla Capital Limited
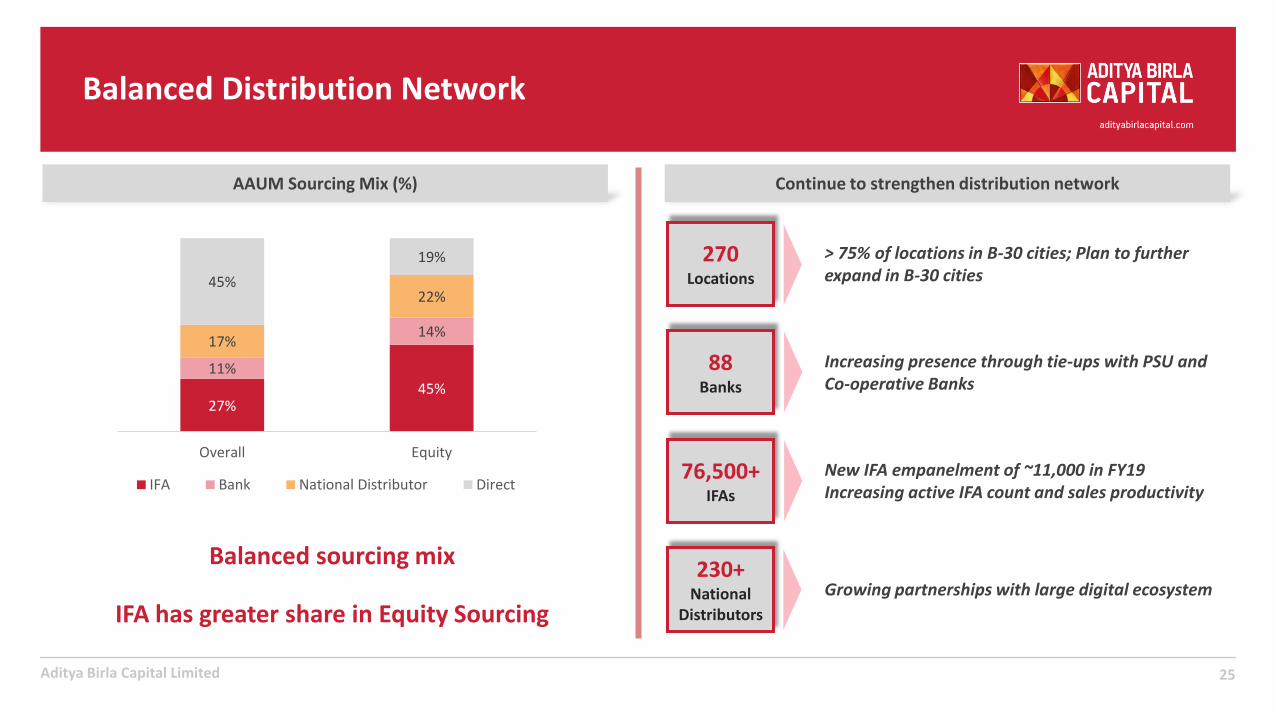
AAUM Sourcing Mix (%)
27%45%
11%
14%17%
22%45%
19%
Overall Equity
IFA Bank National Distributor Direct
IFA has greater share in Equity Sourcing
Continue to strengthen distribution network
270Locations
88Banks
230+National
Distributors
76,500+IFAs
> 75% of locations in B-30 cities; Plan to further expand in B-30 cities
Increasing presence through tie-ups with PSU and Co-operative Banks
New IFA empanelment of ~11,000 in FY19Increasing active IFA count and sales productivity
Growing partnerships with large digital ecosystem
Balanced sourcing mix
Key Financials – Aditya Birla Sun Life AMC Limited
26Aditya Birla Capital Limited
Quarter 4 Figures in Rs Crore Full Year
FY 17-18 (PY)
FY 18-19 (CY)
Key Performance Parameters FY 17-18 (PY)
FY 18-19 (CY)
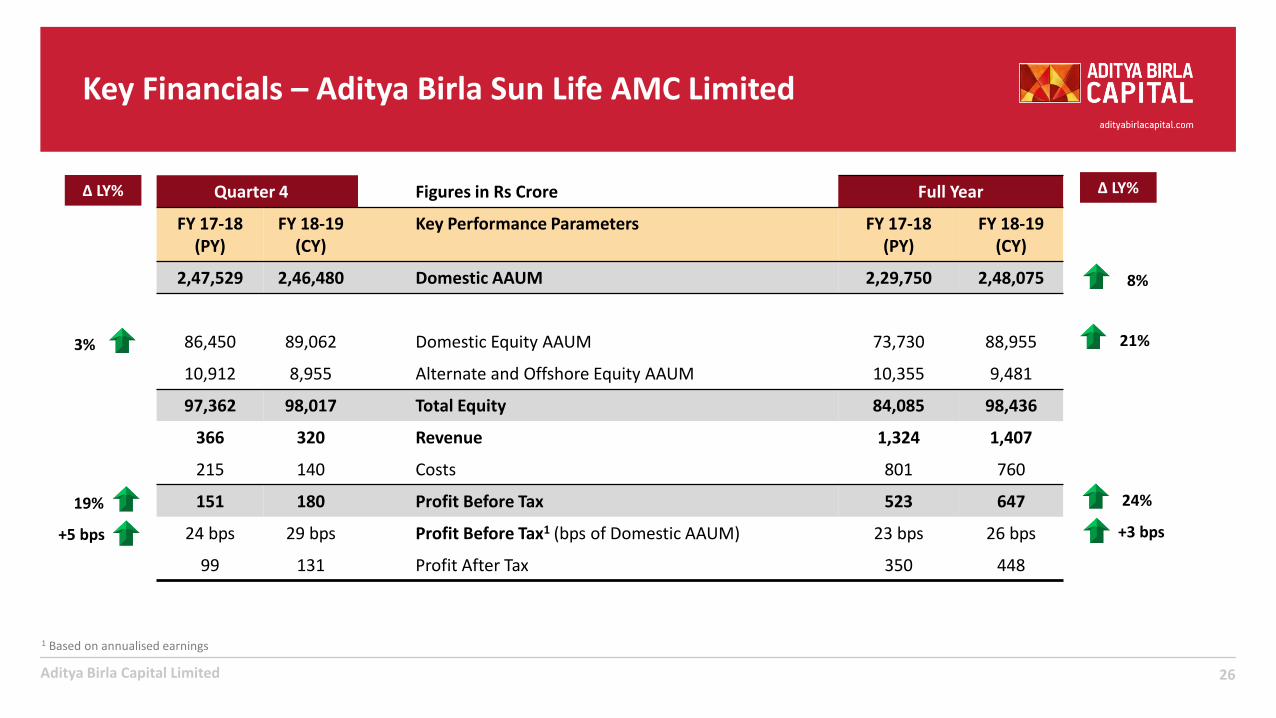
2,47,529 2,46,480 Domestic AAUM 2,29,750 2,48,075
86,450 89,062 Domestic Equity AAUM 73,730 88,955
10,912 8,955 Alternate and Offshore Equity AAUM 10,355 9,481
97,362 98,017 Total Equity 84,085 98,436
366 320 Revenue 1,324 1,407
215 140 Costs 801 760
151 180 Profit Before Tax 523 647
24 bps 29 bps Profit Before Tax1 (bps of Domestic AAUM) 23 bps 26 bps
99 131 Profit After Tax 350 448
∆ LY%
1 Based on annualised earnings
24%19%
∆ LY%
+5 bps +3 bps
3%
8%
21%
27
Aditya Birla Sun Life Insurance Limited
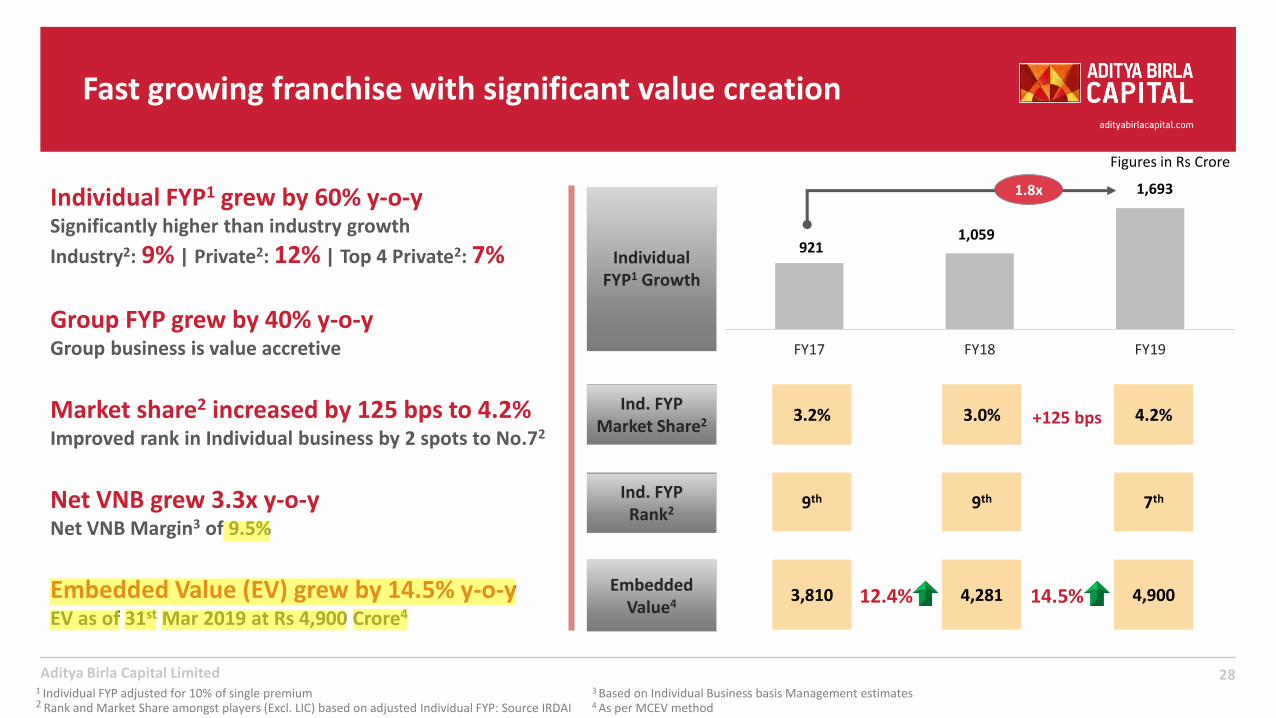
921 1,059
1,693
FY17 FY18 FY19
Fast growing franchise with significant value creation
28
Figures in Rs Crore
1 Individual FYP adjusted for 10% of single premium2 Rank and Market Share amongst players (Excl. LIC) based on adjusted Individual FYP: Source IRDAI
Group FYP grew by 40% y-o-y Group business is value accretive
Net VNB grew 3.3x y-o-yNet VNB Margin3 of 9.5%
Individual FYP1 Growth
Market share2 increased by 125 bps to 4.2%Improved rank in Individual business by 2 spots to No.72
Individual FYP1 grew by 60% y-o-y Significantly higher than industry growth
Industry2: 9% | Private2: 12% | Top 4 Private2: 7%
9th 7thInd. FYPRank2
9th
3.0% 4.2%+125 bpsInd. FYP
Market Share2 3.2%
Aditya Birla Capital Limited3 Based on Individual Business basis Management estimates4 As per MCEV method
Embedded Value (EV) grew by 14.5% y-o-yEV as of 31st Mar 2019 at Rs 4,900 Crore4
1.8x
4,281 4,900Embedded
Value43,810 12.4% 14.5%
anuj.jaiswal
Highlight
anuj.jaiswal
Highlight
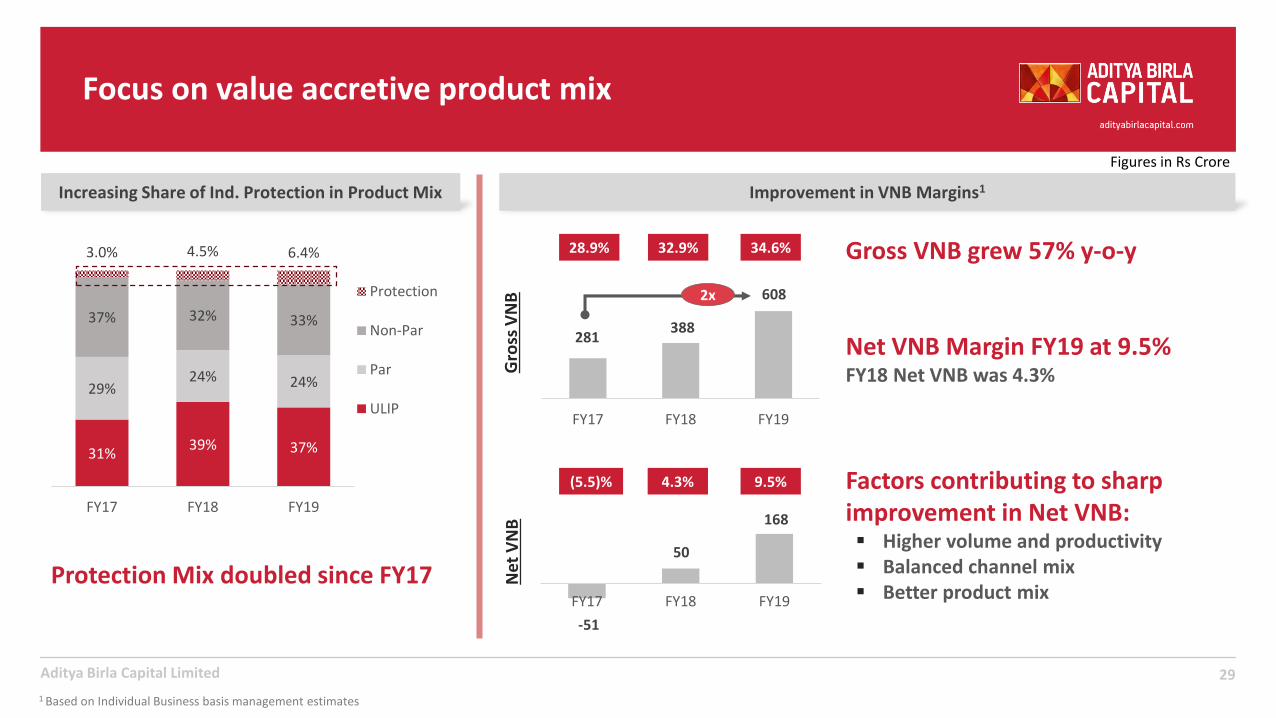
31%39% 37%
29%24% 24%
37% 32% 33%
3.0% 4.5% 6.4%
FY17 FY18 FY19
Protection
Non-Par
Par
ULIP
29
Protection Mix doubled since FY17
Aditya Birla Capital Limited
Focus on value accretive product mix
281 388
608
FY17 FY18 FY19
32.9% 34.6%
Increasing Share of Ind. Protection in Product Mix Improvement in VNB Margins1
Figures in Rs Crore
-51
50
168
FY17 FY18 FY19
4.3% 9.5%
Gro
ss V
NB
Net
VN
B
1 Based on Individual Business basis management estimates
Gross VNB grew 57% y-o-y
Net VNB Margin FY19 at 9.5% FY18 Net VNB was 4.3%
Factors contributing to sharp improvement in Net VNB:▪ Higher volume and productivity▪ Balanced channel mix▪ Better product mix
28.9%
(5.5)%
2x
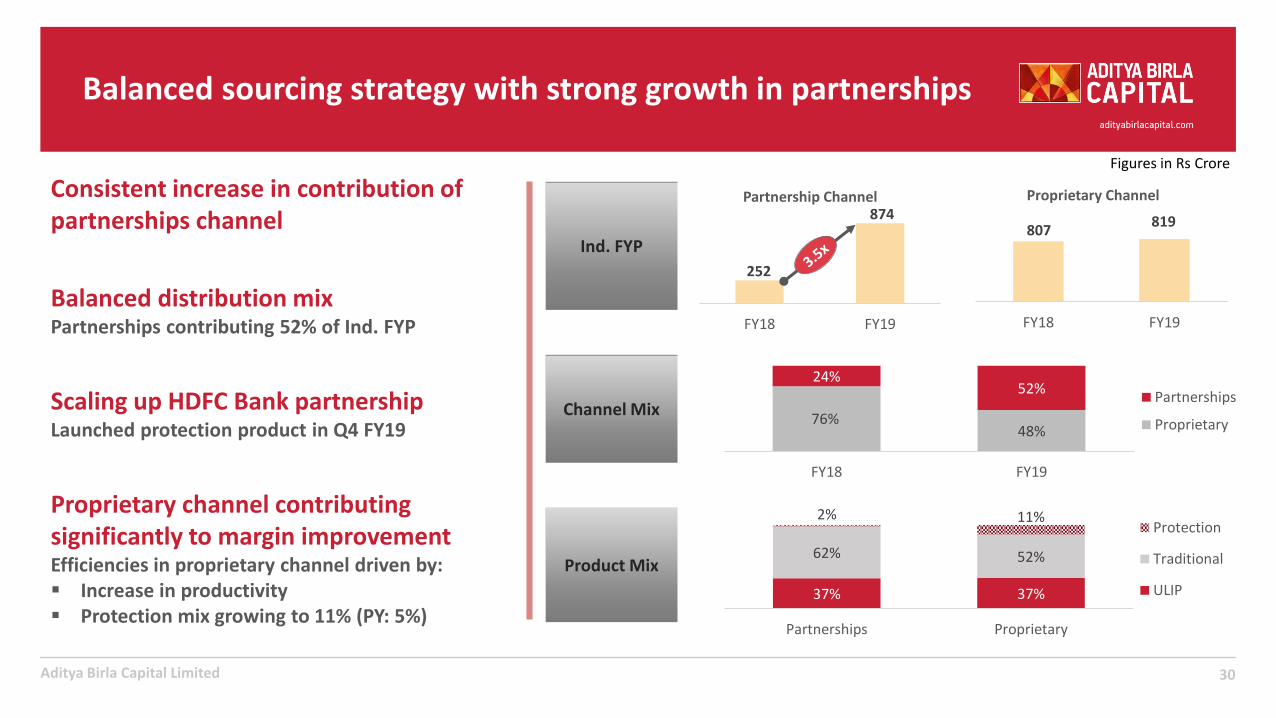
Balanced sourcing strategy with strong growth in partnerships
30
Ind. FYP
76%48%
24%52%
FY18 FY19
Partnerships
Proprietary
Consistent increase in contribution of partnerships channel 807
819
FY18 FY19
Proprietary Channel
252
874
FY18 FY19
Partnership Channel
Aditya Birla Capital Limited
Scaling up HDFC Bank partnershipLaunched protection product in Q4 FY19
Channel Mix
Product Mix
37% 37%
62% 52%
2% 11%
Partnerships Proprietary
Protection
Traditional
ULIP
Figures in Rs Crore
Proprietary channel contributing significantly to margin improvementEfficiencies in proprietary channel driven by:▪ Increase in productivity ▪ Protection mix growing to 11% (PY: 5%)
Balanced distribution mixPartnerships contributing 52% of Ind. FYP
31Aditya Birla Capital Limited
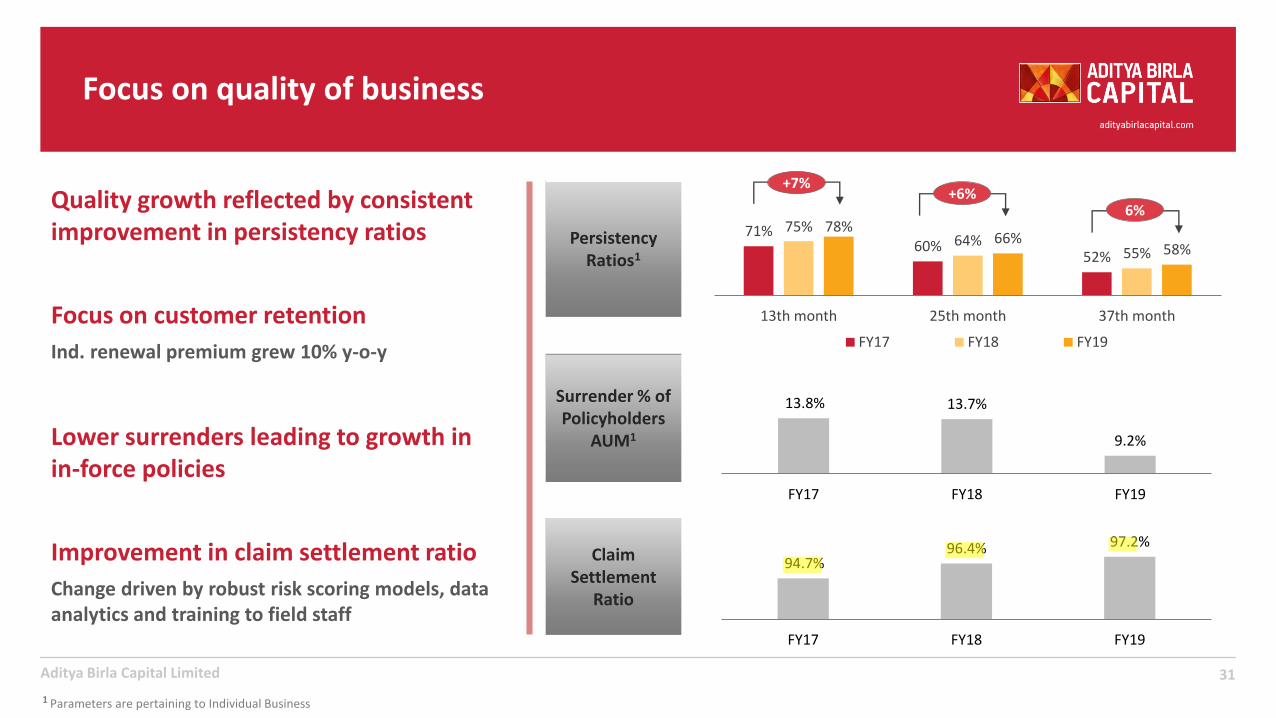
Focus on quality of business
1 Parameters are pertaining to Individual Business
Persistency Ratios1
Surrender % of Policyholders
AUM1
Claim Settlement
Ratio
71%60%
52%
75%64%
55%
78%66%
58%
13th month 25th month 37th month
FY17 FY18 FY19
+7%+6%
6%
13.8% 13.7%
9.2%
FY17 FY18 FY19
Quality growth reflected by consistent improvement in persistency ratios
Lower surrenders leading to growth in in-force policies
Focus on customer retention
Ind. renewal premium grew 10% y-o-y
94.7%96.4% 97.2%
FY17 FY18 FY19
Improvement in claim settlement ratio
Change driven by robust risk scoring models, data analytics and training to field staff
sowmya.s
Highlight
32Aditya Birla Capital Limited
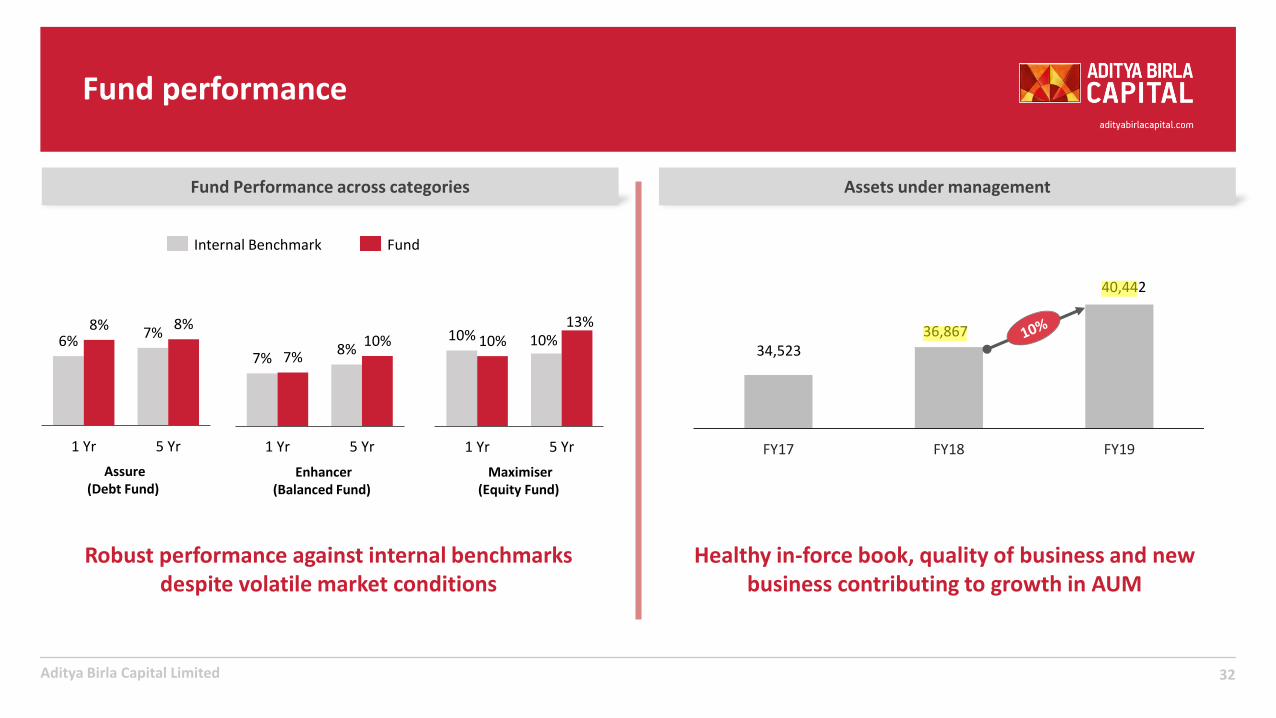
Fund performance
Assets under management
Healthy in-force book, quality of business and new business contributing to growth in AUM
Fund Performance across categories
6%7%
8% 8%
1 Yr 5 Yr
Enhancer (Balanced Fund)
Maximiser (Equity Fund)
Assure (Debt Fund)
7%8%7%
10%
1 Yr 5 Yr
10% 10%10%13%
1 Yr 5 Yr
FundInternal Benchmark
Robust performance against internal benchmarks despite volatile market conditions
34,523 36,867
40,442
FY17 FY18 FY19
sowmya.s
Highlight
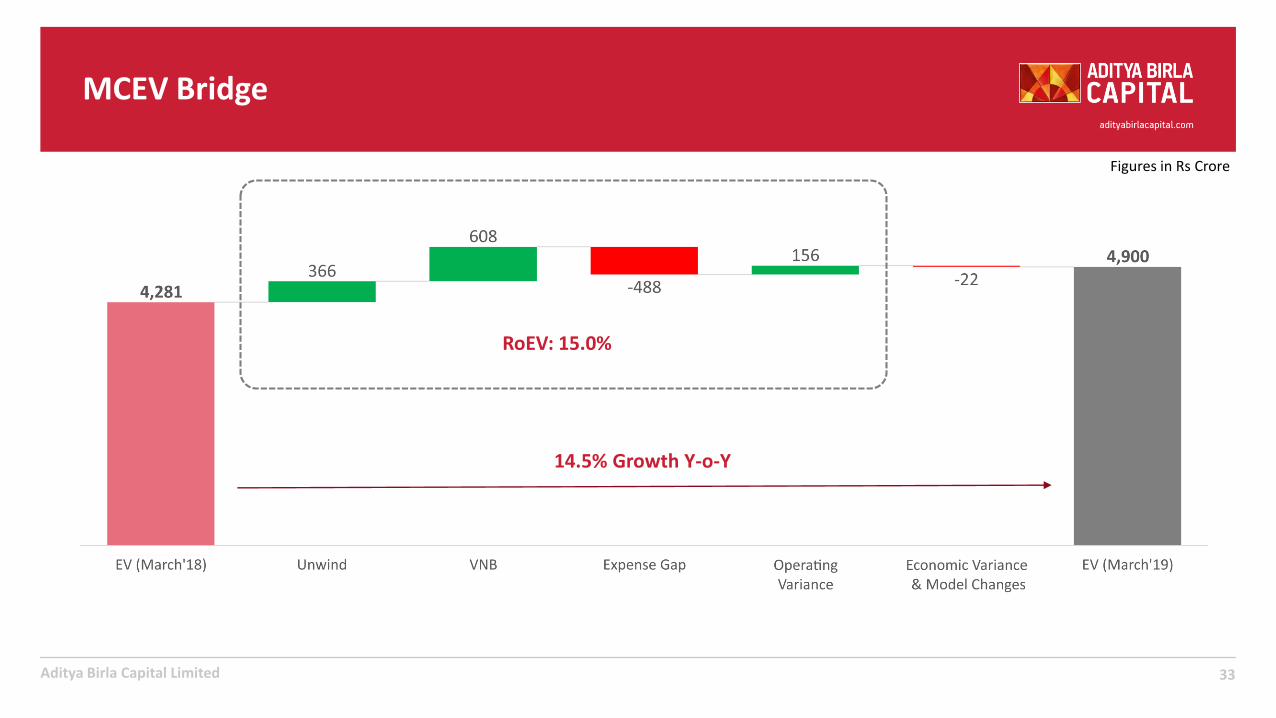
MCEV Bridge
33Aditya Birla Capital Limited
Figures in Rs Crore
RoEV: 15.0%
14.5% Growth Y-o-Y
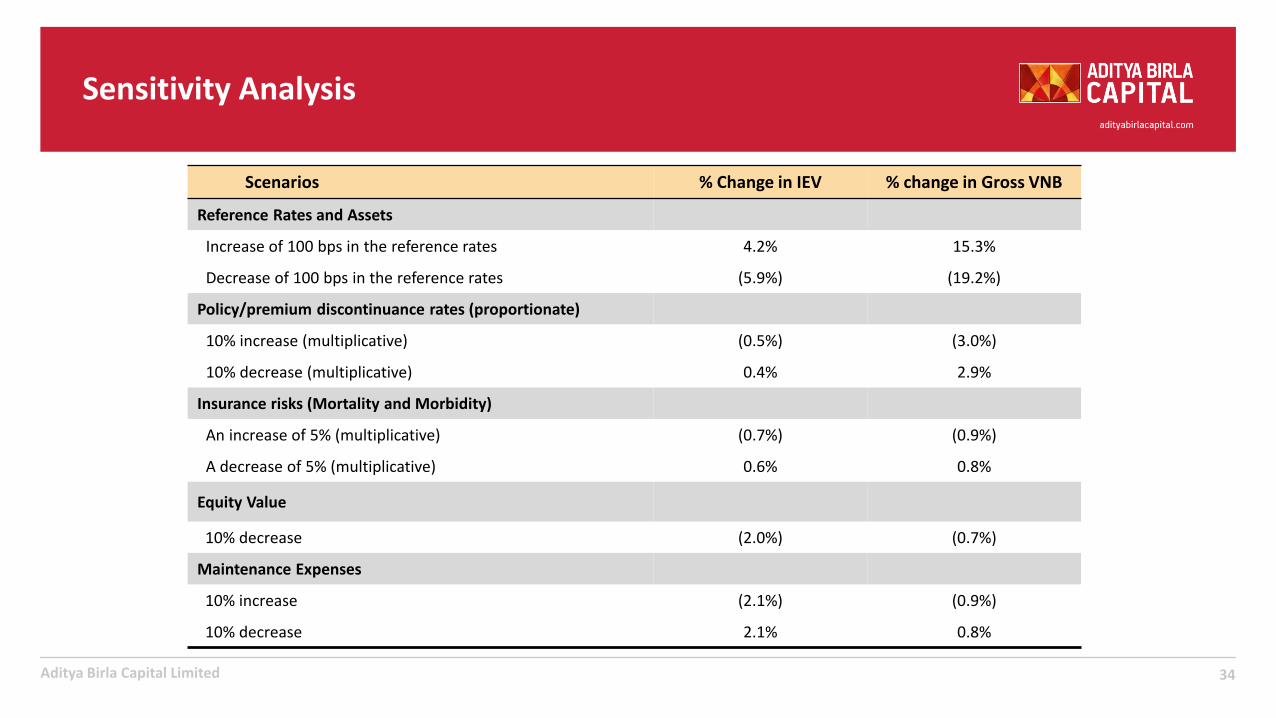
Sensitivity Analysis
34Aditya Birla Capital Limited
Scenarios % Change in IEV % change in Gross VNB
Reference Rates and Assets
Increase of 100 bps in the reference rates 4.2% 15.3%
Decrease of 100 bps in the reference rates (5.9%) (19.2%)
Policy/premium discontinuance rates (proportionate)
10% increase (multiplicative) (0.5%) (3.0%)
10% decrease (multiplicative) 0.4% 2.9%
Insurance risks (Mortality and Morbidity)
An increase of 5% (multiplicative) (0.7%) (0.9%)
A decrease of 5% (multiplicative) 0.6% 0.8%
Equity Value
10% decrease (2.0%) (0.7%)
Maintenance Expenses
10% increase (2.1%) (0.9%)
10% decrease 2.1% 0.8%
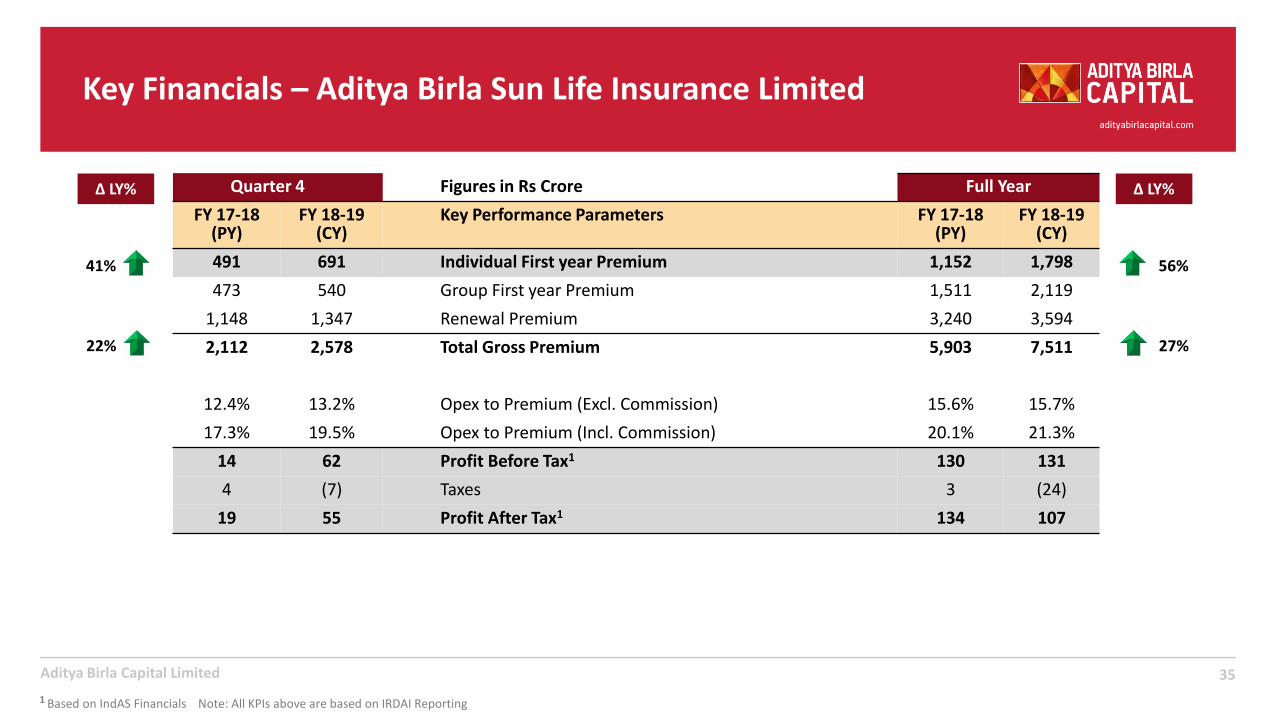
Key Financials – Aditya Birla Sun Life Insurance Limited
35Aditya Birla Capital Limited
Quarter 4 Figures in Rs Crore Full Year
FY 17-18 (PY)
FY 18-19 (CY)
Key Performance Parameters FY 17-18 (PY)
FY 18-19 (CY)
491 691 Individual First year Premium 1,152 1,798
473 540 Group First year Premium 1,511 2,119
1,148 1,347 Renewal Premium 3,240 3,594
2,112 2,578 Total Gross Premium 5,903 7,511
12.4% 13.2% Opex to Premium (Excl. Commission) 15.6% 15.7%
17.3% 19.5% Opex to Premium (Incl. Commission) 20.1% 21.3%
14 62 Profit Before Tax1 130 131
4 (7) Taxes 3 (24)
19 55 Profit After Tax1 134 107
∆ LY%
56%
∆ LY%
41%
1 Based on IndAS Financials Note: All KPIs above are based on IRDAI Reporting
27%22%
36
Aditya Birla Health Insurance Limited
Aditya Birla Capital Limited
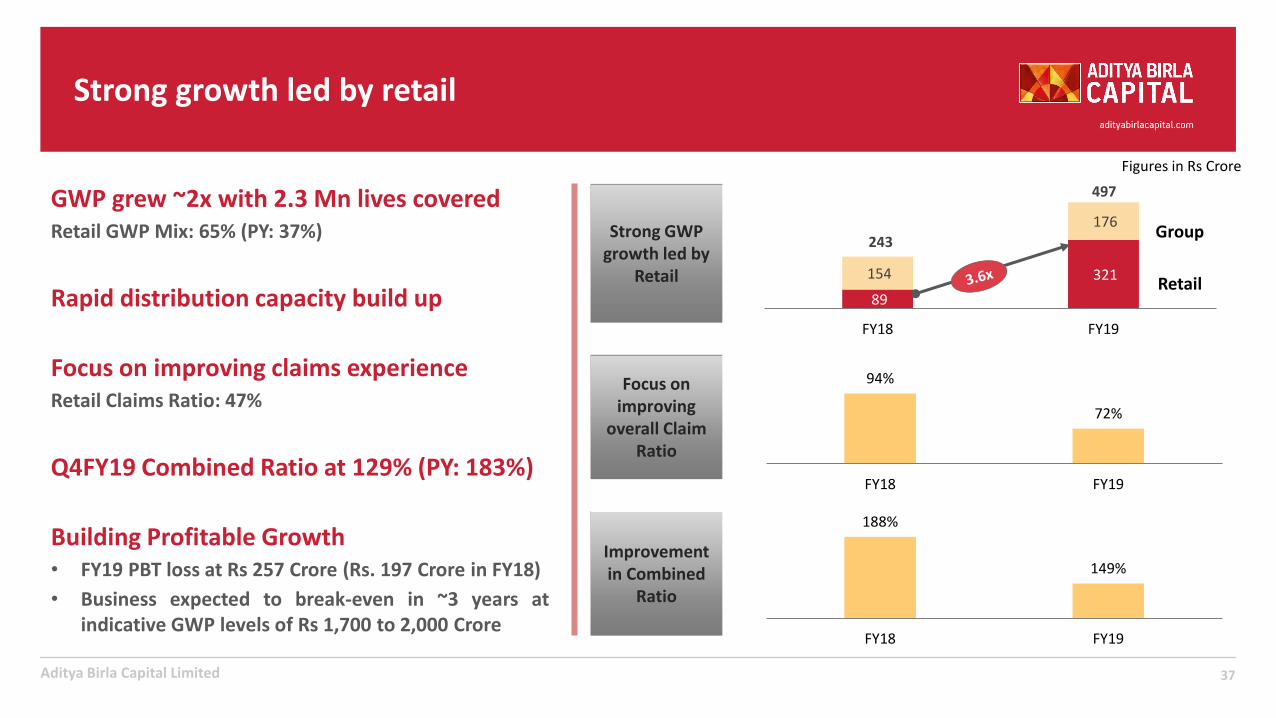
GWP grew ~2x with 2.3 Mn lives coveredRetail GWP Mix: 65% (PY: 37%)
Rapid distribution capacity build up
Building Profitable Growth• FY19 PBT loss at Rs 257 Crore (Rs. 197 Crore in FY18)
• Business expected to break-even in ~3 years atindicative GWP levels of Rs 1,700 to 2,000 Crore
Strong growth led by retail
89
321 154
176
FY18 FY19
Strong GWP growth led by
Retail Retail
Focus on improving
overall Claim Ratio
243
497
Group
Figures in Rs Crore
Improvement in Combined
Ratio
188%
149%
FY18 FY19
Focus on improving claims experienceRetail Claims Ratio: 47%
37
94%
72%
FY18 FY19Q4FY19 Combined Ratio at 129% (PY: 183%)
38Aditya Birla Capital Limited
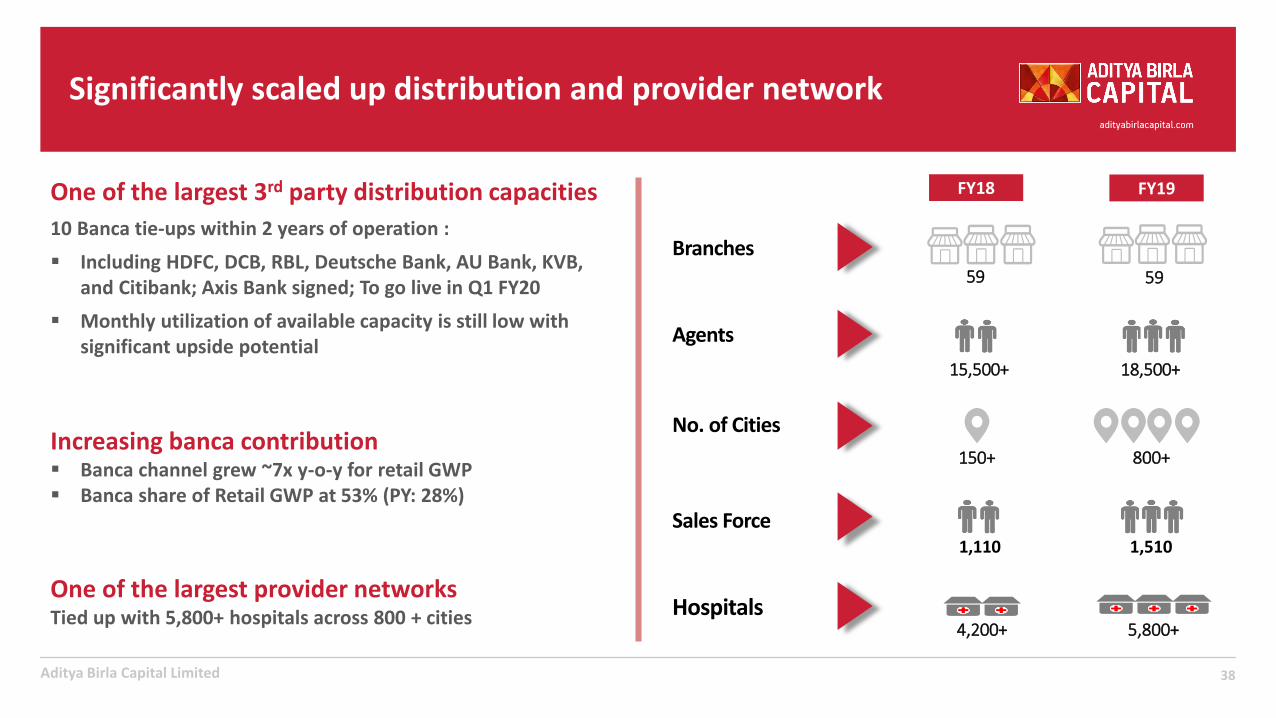
Significantly scaled up distribution and provider network
No. of Cities
Branches
Agents
150+
59
15,500+
FY18
Hospitals4,200+ 5,800+
800+
59
18,500+
Sales Force1,110 1,510
FY19One of the largest 3rd party distribution capacities
10 Banca tie-ups within 2 years of operation :
▪ Including HDFC, DCB, RBL, Deutsche Bank, AU Bank, KVB, and Citibank; Axis Bank signed; To go live in Q1 FY20
▪ Monthly utilization of available capacity is still low with significant upside potential
One of the largest provider networks Tied up with 5,800+ hospitals across 800 + cities
Increasing banca contribution▪ Banca channel grew ~7x y-o-y for retail GWP▪ Banca share of Retail GWP at 53% (PY: 28%)
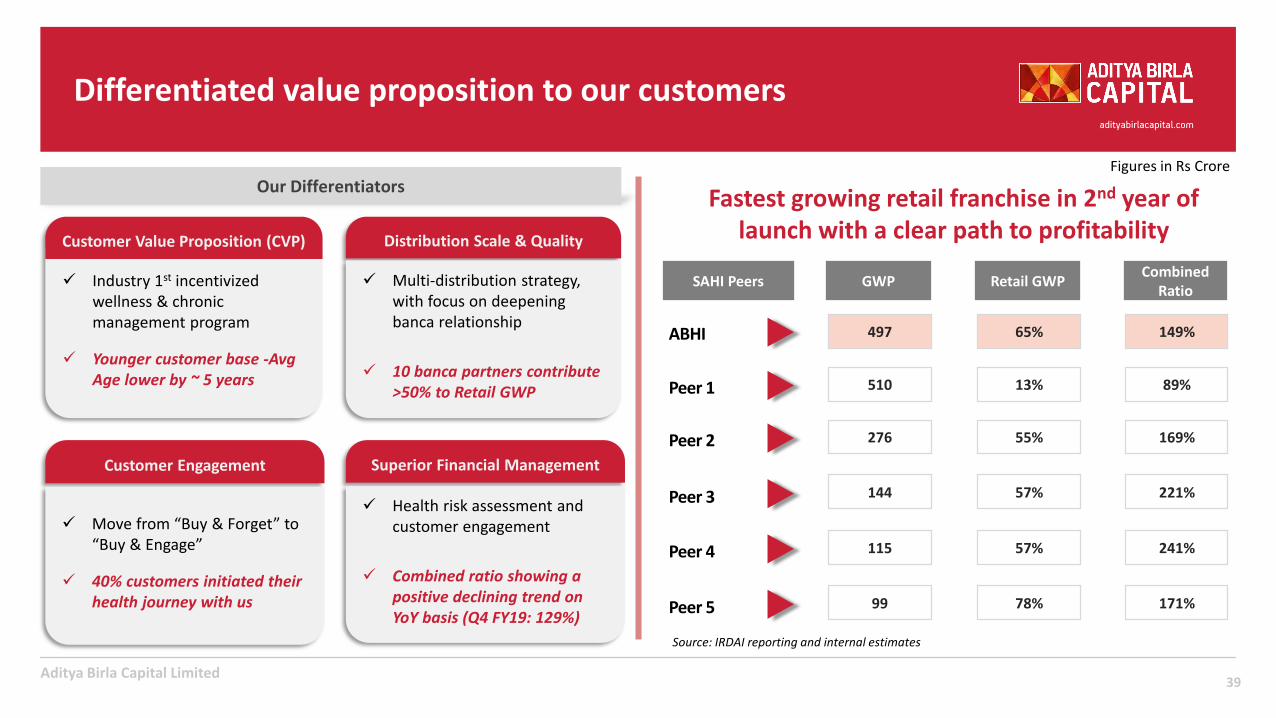
Differentiated value proposition to our customers
Figures in Rs Crore
✓ Industry 1st incentivized wellness & chronic management program
✓ Younger customer base -AvgAge lower by ~ 5 years
Customer Value Proposition (CVP)
✓ Multi-distribution strategy, with focus on deepening banca relationship
✓ 10 banca partners contribute >50% to Retail GWP
Distribution Scale & Quality
✓ Move from “Buy & Forget” to “Buy & Engage”
✓ 40% customers initiated their health journey with us
Customer Engagement
✓ Health risk assessment and customer engagement
✓ Combined ratio showing a positive declining trend on YoY basis (Q4 FY19: 129%)
Superior Financial Management
Our Differentiators
GWP Retail GWPCombined
RatioSAHI Peers
Fastest growing retail franchise in 2nd year of launch with a clear path to profitability
39
ABHI 497 65% 149%
Peer 2 276 55% 169%
Peer 4 115 57% 241%
Peer 5 99 78% 171%
Peer 3 144 57% 221%
Source: IRDAI reporting and internal estimates
Aditya Birla Capital Limited
Peer 1 510 13% 89%
Aditya Birla Capital Limited
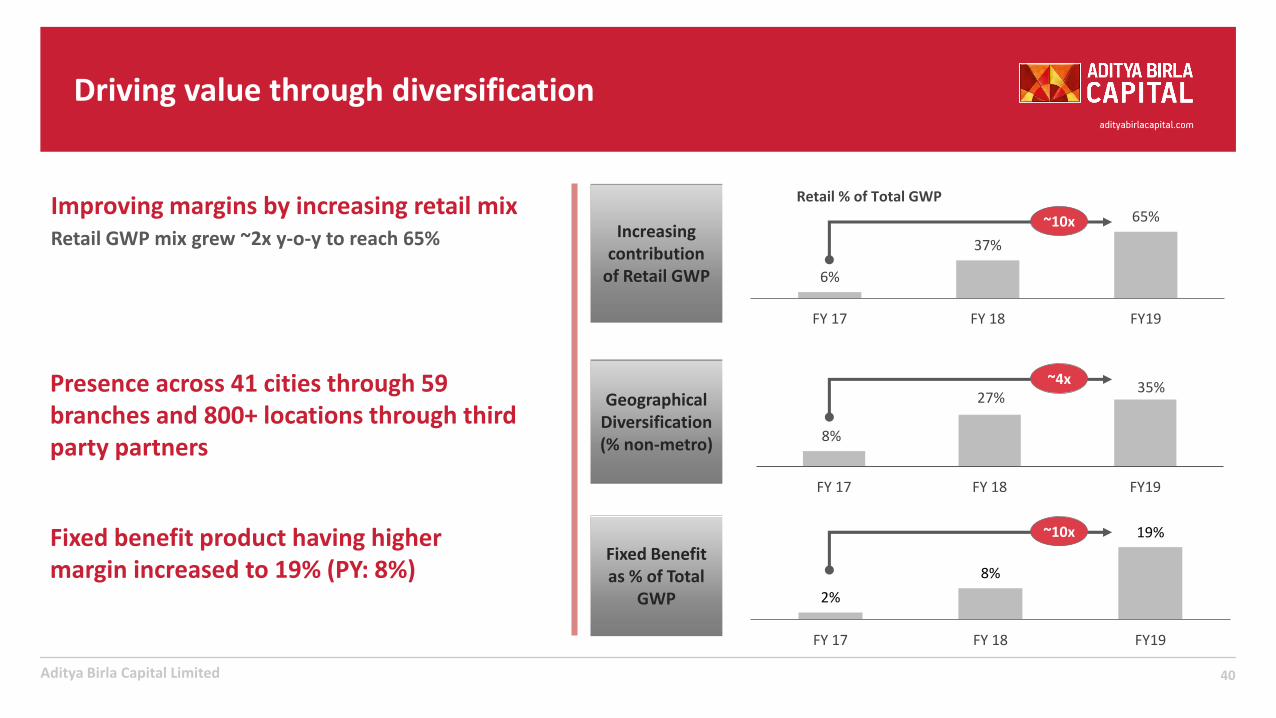
Improving margins by increasing retail mixRetail GWP mix grew ~2x y-o-y to reach 65%
Driving value through diversification
Increasing contribution
of Retail GWP
Geographical Diversification(% non-metro)
Fixed Benefit as % of Total
GWP
40
6%
37%
65%
FY 17 FY 18 FY19
8%
27%35%
FY 17 FY 18 FY19
2%
8%
19%
FY 17 FY 18 FY19
Retail % of Total GWP
Presence across 41 cities through 59 branches and 800+ locations through third party partners
Fixed benefit product having higher margin increased to 19% (PY: 8%)
~10x
~4x
~10x
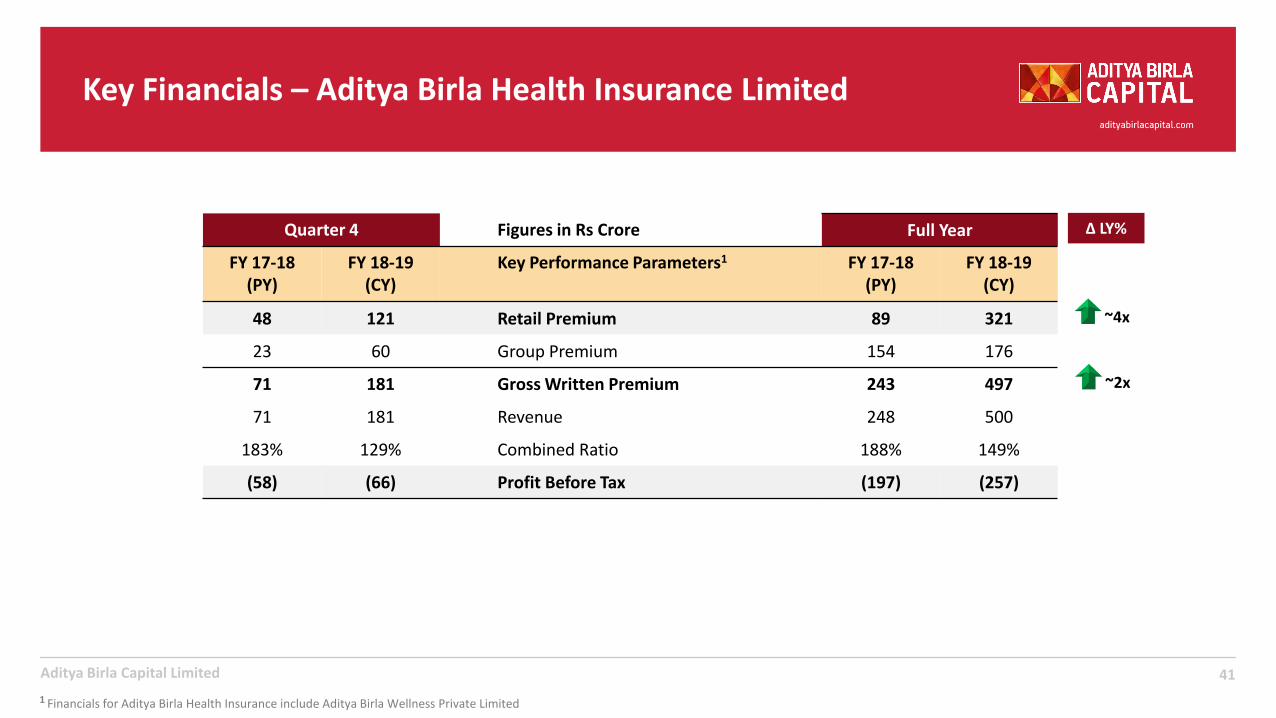
Key Financials – Aditya Birla Health Insurance Limited
41
Quarter 4 Figures in Rs Crore Full Year
FY 17-18 (PY)
FY 18-19 (CY)
Key Performance Parameters1 FY 17-18 (PY)
FY 18-19 (CY)
48 121 Retail Premium 89 321
23 60 Group Premium 154 176
71 181 Gross Written Premium 243 497
71 181 Revenue 248 500
183% 129% Combined Ratio 188% 149%
(58) (66) Profit Before Tax (197) (257)
∆ LY%
~4x
~2x
Aditya Birla Capital Limited
1 Financials for Aditya Birla Health Insurance include Aditya Birla Wellness Private Limited

Other Financial Services businesses
Other Financial Services Businesses
43Aditya Birla Capital Limited
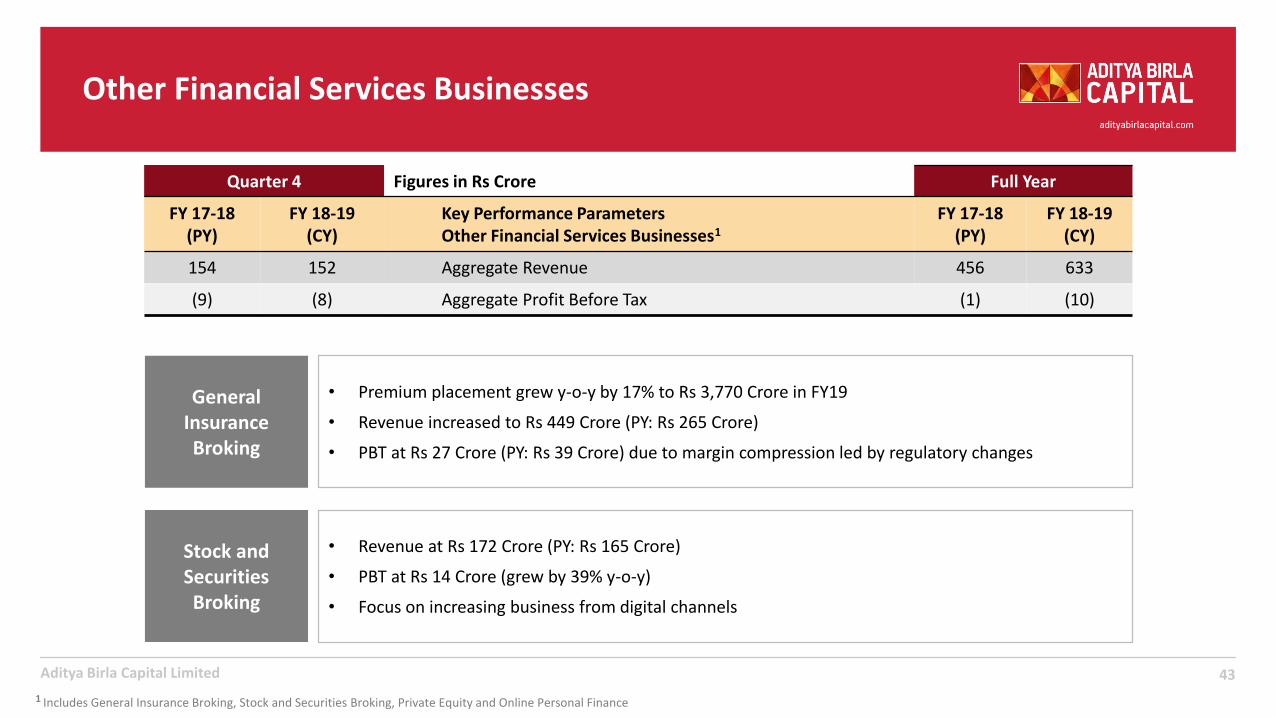
Quarter 4 Figures in Rs Crore Full Year
FY 17-18 (PY)
FY 18-19 (CY)
Key Performance ParametersOther Financial Services Businesses1
FY 17-18 (PY)
FY 18-19 (CY)
154 152 Aggregate Revenue 456 633
(9) (8) Aggregate Profit Before Tax (1) (10)
General Insurance Broking
• Premium placement grew y-o-y by 17% to Rs 3,770 Crore in FY19
• Revenue increased to Rs 449 Crore (PY: Rs 265 Crore)
• PBT at Rs 27 Crore (PY: Rs 39 Crore) due to margin compression led by regulatory changes
Stock and Securities Broking
• Revenue at Rs 172 Crore (PY: Rs 165 Crore)
• PBT at Rs 14 Crore (grew by 39% y-o-y)
• Focus on increasing business from digital channels
1 Includes General Insurance Broking, Stock and Securities Broking, Private Equity and Online Personal Finance
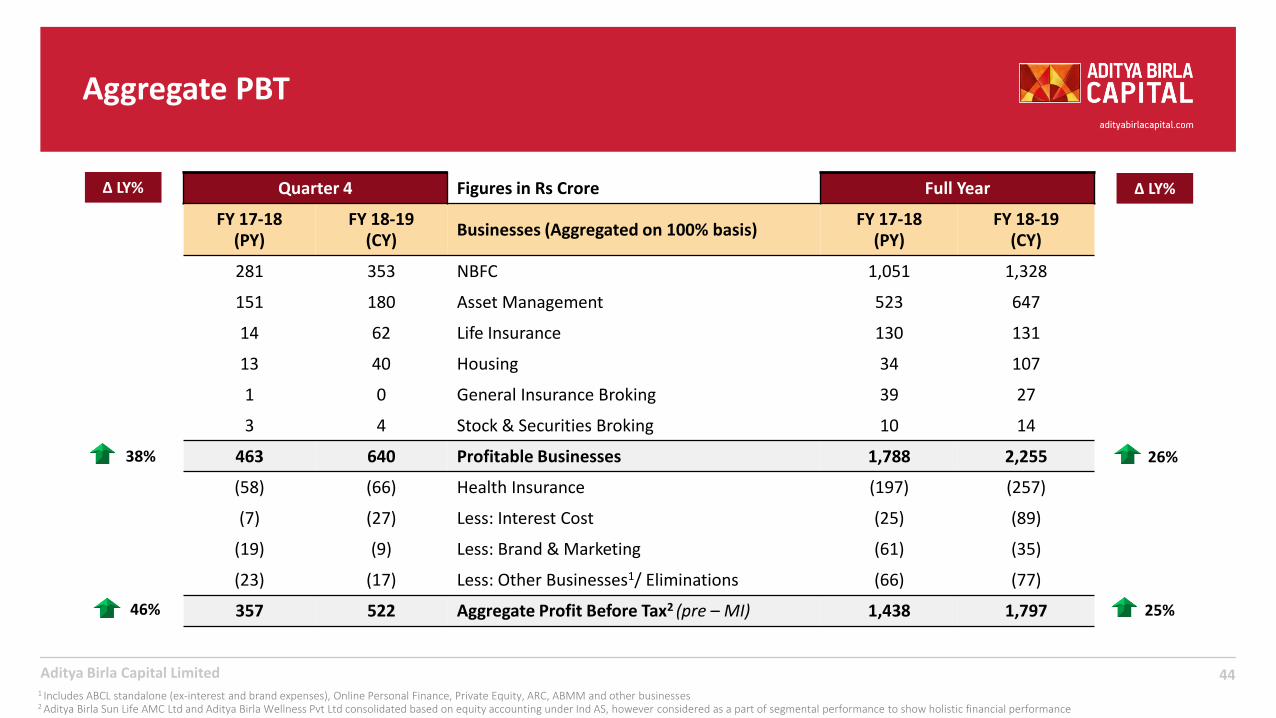
Aggregate PBT
44Aditya Birla Capital Limited1 Includes ABCL standalone (ex-interest and brand expenses), Online Personal Finance, Private Equity, ARC, ABMM and other businesses2 Aditya Birla Sun Life AMC Ltd and Aditya Birla Wellness Pvt Ltd consolidated based on equity accounting under Ind AS, however considered as a part of segmental performance to show holistic financial performance
Quarter 4 Figures in Rs Crore Full Year
FY 17-18 (PY)
FY 18-19 (CY)
Businesses (Aggregated on 100% basis)FY 17-18
(PY)FY 18-19
(CY)
281 353 NBFC 1,051 1,328
151 180 Asset Management 523 647
14 62 Life Insurance 130 131
13 40 Housing 34 107
1 0 General Insurance Broking 39 27
3 4 Stock & Securities Broking 10 14
463 640 Profitable Businesses 1,788 2,255
(58) (66) Health Insurance (197) (257)
(7) (27) Less: Interest Cost (25) (89)
(19) (9) Less: Brand & Marketing (61) (35)
(23) (17) Less: Other Businesses1/ Eliminations (66) (77)
357 522 Aggregate Profit Before Tax2 (pre – MI) 1,438 1,797
∆ LY%
38%
46%
26%
25%
∆ LY%

Annexure A
Consolidated Financials
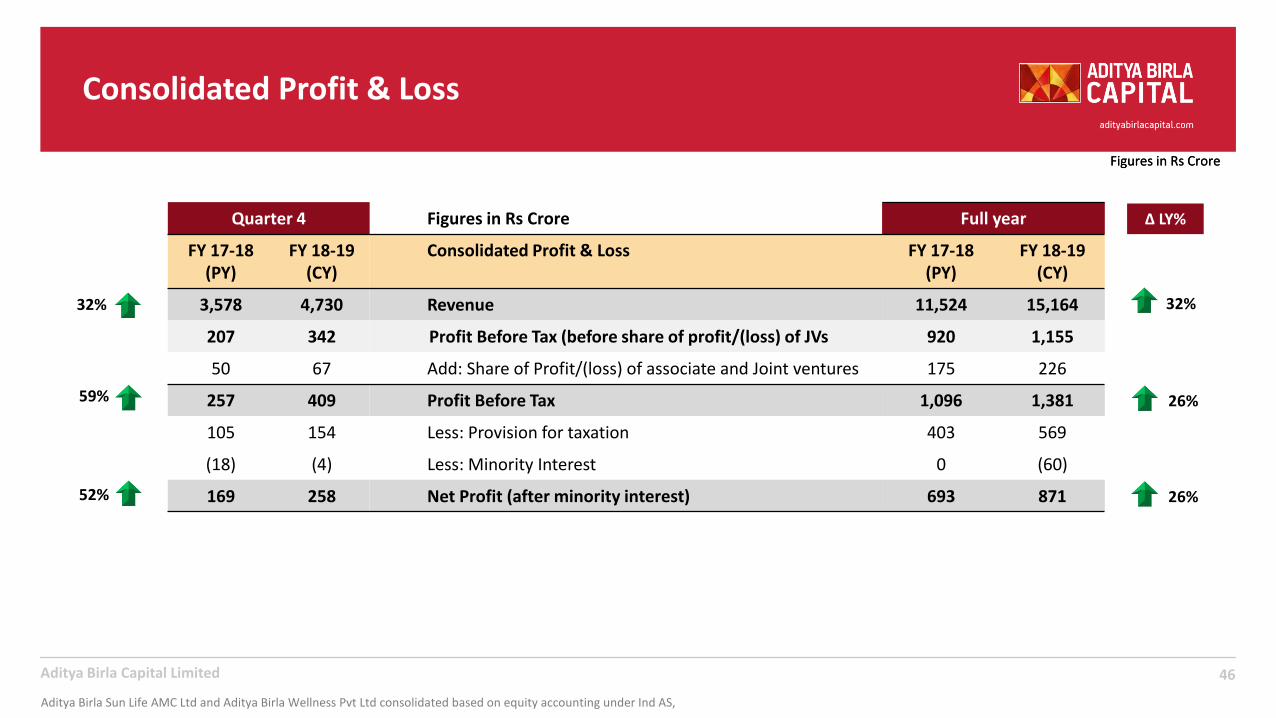
Consolidated Profit & Loss
46Aditya Birla Capital Limited
Figures in Rs Crore
Quarter 4 Figures in Rs Crore Full year
FY 17-18 (PY)
FY 18-19 (CY)
Consolidated Profit & Loss FY 17-18 (PY)
FY 18-19 (CY)
3,578 4,730 Revenue 11,524 15,164
207 342 Profit Before Tax (before share of profit/(loss) of JVs 920 1,155
50 67 Add: Share of Profit/(loss) of associate and Joint ventures 175 226
257 409 Profit Before Tax 1,096 1,381
105 154 Less: Provision for taxation 403 569
(18) (4) Less: Minority Interest 0 (60)
169 258 Net Profit (after minority interest) 693 871
Figures in Rs Crore
32%
26%
∆ LY%
26%
32%
52%
59%
Aditya Birla Sun Life AMC Ltd and Aditya Birla Wellness Pvt Ltd consolidated based on equity accounting under Ind AS,
Aditya Birla Capital Limited
47
CIN: L67120GJ2007PLC058890
Regd. Office: Indian Rayon Compound, Veraval – 362 266, Gujarat
Corporate Office: One Indiabulls Centre, Tower 1, Jupiter Mills Compound, 841, Senapati Bapat Marg, Elphinstone Road, Mumbai – 400 013
Website: www.adityabirlacapital.com
Disclaimer
48Aditya Birla Capital Limited
The information contained in this presentation is provided by Aditya Birla Capital Limited (“ABCL or the Company”), formerly known as Aditya Birla Financial Services Limited, to you solely for your reference. Any reference hereinto "the Company" shall mean Aditya Birla Capital Limited, together with its subsidiaries / joint ventures/affiliates. This document is being given solely for your information and for your use and may not be retained by you andneither this presentation nor any part thereof shall be (i) used or relied upon by any other party or for any other purpose; (ii) copied, photocopied, duplicated or otherwise reproduced in any form or by any means; or (iii) re-circulated, redistributed, passed on, published in any media, website or otherwise disseminated, to any other person, in any form or manner, in part or as a whole, without the prior written consent of the Company. Thispresentation does not purport to be a complete description of the markets conditions or developments referred to in the material.
Although care has been taken to ensure that the information in this presentation is accurate, and that the opinions expressed are fair and reasonable, the information is subject to change without notice, its accuracy, fairness orcompleteness is not guaranteed and has not been independently verified and no express or implied warranty is made thereto. You must make your own assessment of the relevance, accuracy and adequacy of the informationcontained in this presentation and must make such independent investigation as you may consider necessary or appropriate for such purpose. Neither the Company nor any of its directors, officers, employees or affiliates nor anyother person assume any responsibility or liability for, the accuracy or completeness of, or any errors or omissions in, any information or opinions contained herein, and none of them accept any liability (in negligence, orotherwise) whatsoever for any loss howsoever arising from any use of this presentation or its contents or otherwise arising in connection therewith. Any unauthorised use, disclosure or public dissemination of informationcontained herein is prohibited. The distribution of this presentation in certain jurisdictions may be restricted by law. Accordingly, any persons in possession of the aforesaid should inform themselves about and observe suchrestrictions. Any failure to comply with these restrictions may constitute a violation of applicable securities laws.
The statements contained in this document speak only as at the date as of which they are made and it, should be understood that subsequent developments may affect the information contained herein. The Company expresslydisclaims any obligation or undertaking to supplement, amend or disseminate any updates or revisions to any statements contained herein to reflect any change in events, conditions or circumstances on which any suchstatements are based. By preparing this presentation, neither the Company nor its management undertakes any obligation to provide the recipient with access to any additional information or to update this presentation or anyadditional information or to correct any inaccuracies in any such information which may become apparent. This document is for informational purposes and private circulation only and does not constitute or form part of aprospectus, a statement in lieu of a prospectus, an offering circular, offering memorandum, an advertisement, and should not be construed as an offer to sell or issue or the solicitation of an offer or an offer document to buy oracquire or sell securities of the Company or any of its subsidiaries or affiliates under the Companies Act, 2013, the Securities and Exchange Board of India (Issue of Capital and Disclosure Requirements) Regulations, 2018, each asamended, or any applicable law in India or as an inducement to enter into investment activity. No part of this document should be considered as a recommendation that any investor should subscribe to or purchase securities ofthe Company or any of its subsidiaries or affiliates and should not form the basis of, or be relied on in connection with, any contract or commitment or investment decision whatsoever. This document is not financial, legal, tax,investment or other product advice.
The Company, its shareholders, representatives and advisors and their respective affiliates also reserves the right, without advance notice, to change the procedure or to terminate negotiations at any time prior to the entry intoof any binding contract for any potential transaction. This presentation contains statements of future expectations and other forward-looking statements which involve risks and uncertainties. These statements includedescriptions regarding the intent, belief or current expectations of the Company or its officers with respect to the consolidated results of operations and financial condition, and future events and plans of the Company. Thesestatements can be recognised by the use of words such as “expects,” “plans,” “will,” “estimates,” or words of similar meaning. Such forward-looking statements are not guarantees of future performance and involve risks anduncertainties and actual results, performances or events may differ from those in the forward-looking statements as a result of various factors, uncertainties and assumptions including but not limited to price fluctuations, actualdemand, exchange rate fluctuations, competition, environmental risks, any change in legal, financial and regulatory frameworks, political risks and factors beyond the Company’s control. You are cautioned not to place unduereliance on these forward looking statements, which are based on the current view of the management of the Company on future events. No assurance can be given that future events will occur, or that assumptions are correct.The Company does not assume any responsibility to amend, modify or revise any forward-looking statements, on the basis of any subsequent developments, information or events, or otherwise.
Glossary
49Aditya Birla Capital Limited
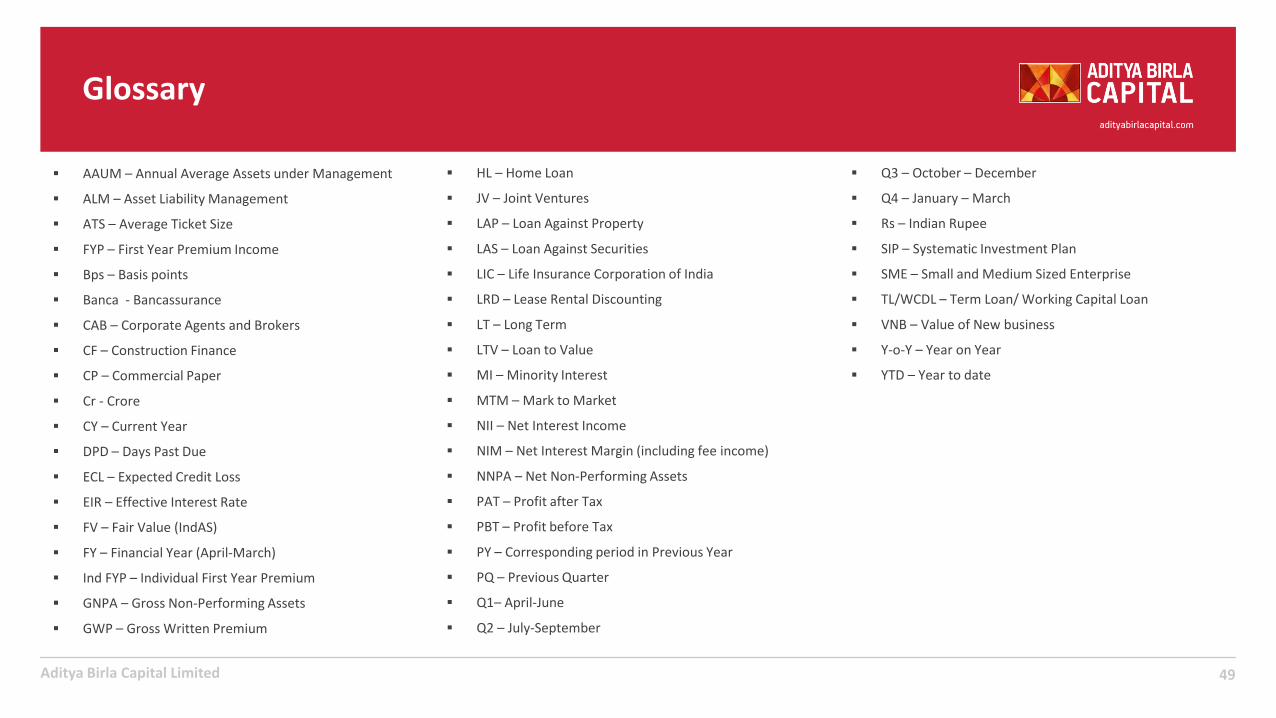
▪ HL – Home Loan
▪ JV – Joint Ventures
▪ LAP – Loan Against Property
▪ LAS – Loan Against Securities
▪ LIC – Life Insurance Corporation of India
▪ LRD – Lease Rental Discounting
▪ LT – Long Term
▪ LTV – Loan to Value
▪ MI – Minority Interest
▪ MTM – Mark to Market
▪ NII – Net Interest Income
▪ NIM – Net Interest Margin (including fee income)
▪ NNPA – Net Non-Performing Assets
▪ PAT – Profit after Tax
▪ PBT – Profit before Tax
▪ PY – Corresponding period in Previous Year
▪ PQ – Previous Quarter
▪ Q1– April-June
▪ Q2 – July-September
▪ AAUM – Annual Average Assets under Management
▪ ALM – Asset Liability Management
▪ ATS – Average Ticket Size
▪ FYP – First Year Premium Income
▪ Bps – Basis points
▪ Banca - Bancassurance
▪ CAB – Corporate Agents and Brokers
▪ CF – Construction Finance
▪ CP – Commercial Paper
▪ Cr - Crore
▪ CY – Current Year
▪ DPD – Days Past Due
▪ ECL – Expected Credit Loss
▪ EIR – Effective Interest Rate
▪ FV – Fair Value (IndAS)
▪ FY – Financial Year (April-March)
▪ Ind FYP – Individual First Year Premium
▪ GNPA – Gross Non-Performing Assets
▪ GWP – Gross Written Premium
▪ Q3 – October – December
▪ Q4 – January – March
▪ Rs – Indian Rupee
▪ SIP – Systematic Investment Plan
▪ SME – Small and Medium Sized Enterprise
▪ TL/WCDL – Term Loan/ Working Capital Loan
▪ VNB – Value of New business
▪ Y-o-Y – Year on Year
▪ YTD – Year to date