Financial Results for the First Half of FY ending …Currency exchange rate assumption in 2H :...
26
1 © Copyright 2016 Oki Electric Industry Co., Ltd. Financial Results for the First Half of FY ending March 31, 2017 October 28, 2016 Oki Electric Industry Co., Ltd.
Transcript of Financial Results for the First Half of FY ending …Currency exchange rate assumption in 2H :...

1© Copyright 2016 Oki Electric Industry Co., Ltd.
Financial Results for the First Half of FY ending March 31, 2017
October 28, 2016
Oki Electric Industry Co., Ltd.

2© Copyright 2016 Oki Electric Industry Co., Ltd.
Table of Contents
I. Financial results for the 1H, FY ending Mar. 2017
1. Overview of 1H
2. Summary of Financial Results
3. Segment Information (Net sales)
4. Segment Information (Operating income)
5. Changing Factors of Operating Income
6. Balance Sheets
7. Cash Flows
II. Full Year Projections for the FY ending Mar. 2017
1. Current Conditions
2. Revision of Full Year Projections
3. Segment Information

3© Copyright 2016 Oki Electric Industry Co., Ltd.
Overview of 1H Summary of Business
Domestic business was steady. In business overseas, sales and operating income failed to reach its original target due to the changes in business environment.
Appreciation of the yenForeign exchange losses in non-operating expenses were recorded as the results of the trend of strong yen after June 2016.
Cash FlowsCash flows increased due to reducing working capital. Financial stability is maintained.
ArbitrationHearing of arbitration in China still continues.
Extraordinary LossOKI recorded the loss related to the Antimonopoly Act.
4© Copyright 2016 Oki Electric Industry Co., Ltd.
Summary of Financial Results
FY end Mar. 2017
(Results)
Previous projections Variance
FY end Mar. 2016
(Results)Variance
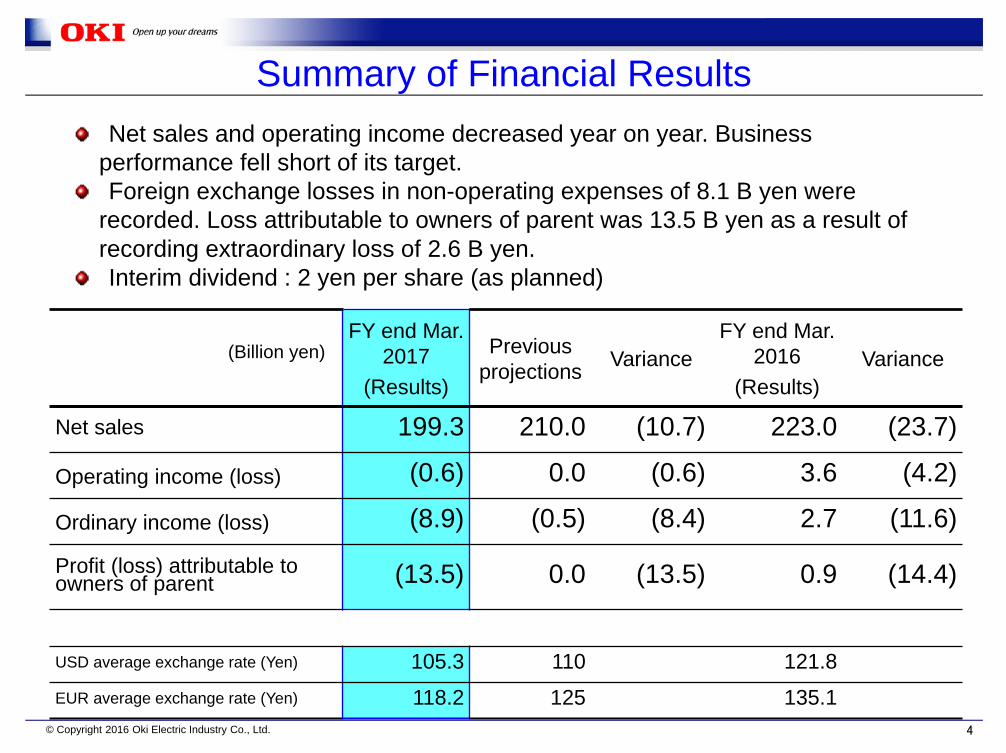
Net sales 199.3 210.0 (10.7) 223.0 (23.7)
Operating income (loss) (0.6) 0.0 (0.6) 3.6 (4.2)
Ordinary income (loss) (8.9) (0.5) (8.4) 2.7 (11.6)
Profit (loss) attributable to owners of parent (13.5) 0.0 (13.5) 0.9 (14.4)
USD average exchange rate (Yen) 105.3 110 121.8EUR average exchange rate (Yen) 118.2 125 135.1
Net sales and operating income decreased year on year. Business performance fell short of its target.Foreign exchange losses in non-operating expenses of 8.1 B yen were
recorded. Loss attributable to owners of parent was 13.5 B yen as a result of recording extraordinary loss of 2.6 B yen.Interim dividend : 2 yen per share (as planned)
(Billion yen)

5© Copyright 2016 Oki Electric Industry Co., Ltd.
Segment Information (Net sales)
FY end. Mar.2017(Results)
Previous projections Variance
FY end. Mar.2016(Results)
Variance
ICT 66.9 66.0 0.9 78.9 (12.0)
Mechatronics systems 49.0 51.0 (2.0) 55.0 (6.0)
Printers 54.3 64.0 (9.7) 59.1 (4.8)
EMS 20.9 21.0 (0.1) 20.6 0.3
Others 8.3 8.0 0.3 9.5 (1.2)
Total 199.3 210.0 (10.7) 223.0 (23.7)
ICT : Sales were beyond its plan though sales for telecom carriers and fire-fighting digital wireless systems decreased.Mechatronics systems: ATM market in China is in a lull. Business in Brazil, other countries and Japan basically turned out as planned.
Printers: Decreasing demand for office printers continued in addition to the impact of currency exchange.
(Billion yen)

6© Copyright 2016 Oki Electric Industry Co., Ltd.
Segment Information (Operating income/loss)
FY end. Mar.2017(Results)
Previous projections Variance
FY end. Mar.2016(Results)
Variance
ICT (0.3) (1.2) 0.9 0.8 (1.1)Mechatronics systems 1.3 2.3 (1.0) 3.5 (2.2)Printers (0.8) 0.0 (0.8) (0.5) (0.3)EMS 0.7 0.8 (0.1) 0.8 (0.1)Others 1.5 1.6 (0.1) 2.2 (0.7)
Corporate & Eliminations (3.1) (3.5) 0.4 (3.2) 0.1
Total (0.6) 0.0 (0.6) 3.6 (4.2)
Operating income totally worsened year on year due to the decline in sales volume and the impact of currency exchange.Profitability of ICT was improved compared with its plan due to the effect of reform of business structure.The drop in sales volume influenced in Mechatronics systems and Printers.

7© Copyright 2016 Oki Electric Industry Co., Ltd.
Changing Factors of Operating Income (year on year)
(0.6)FY15
Results FY16Results
(4.5)
(2.0) +2.0+1.5
3.6
(1.5)
Operating income decreased due to the drop in sales volume and the impact of currency exchange.
Changes in volume and product mix Changes
in price Reduction in production and procurement costs
Impact of currency exchange
(Billion yen)
Changes in fixed costs, etc.

8© Copyright 2016 Oki Electric Industry Co., Ltd.
Working capital was reduced due to correcting notes and accounts receivable and control the inventories.Levels of shareholders’ equity ratio and D/E ratio were maintained by squeezing the net assets.
(Billion yen) Sep. 2016 Mar. 2016 VarianceCurrent assets 237.4 277.6 (40.2)Fixed assets 134.6 134.1 0.5
Assets 371.9 411.8 (39.9)Current liabilities 182.8 199.2 (16.4)Fixed liabilities 96.1 105.2 (9.1)
Liabilities 278.9 304.4 (25.5)Shareholders’ equity 92.6 106.7 (14.1)Others 0.5 0.7 (0.2)
Net assets 93.1 107.4 (14.3)Total liabilities and net assets 371.9 411.8 (39.9)
Shareholders’ equity ratio (%) 24.9 25.9 ( 1.0)%D/E ratio (times) 1.2 1.1 +0.1pt
Balance Sheets

9© Copyright 2016 Oki Electric Industry Co., Ltd.
Cash Flows
(Billion yen)
FY end. March 2017
FY end. March 2016
Variance
Ⅰ Cash flows from operating activities 21.0 (3.5) 24.5Ⅱ Cash flows from investing activities (8.2) (9.2) 1.0Free cash flows (Ⅰ+Ⅱ) 12.8 (12.7) 25.5Ⅲ Cash flows from financing activities (15.9) 3.7 (19.6)
Cash and cash equivalents 43.0 44.5 (1.5)
Purchases of equipment (5.9) (6.5) 0.6Depreciation 6.8 6.9 (0.1)
Cash flows from operating activities improved drastically mainly due to amelioration in working capital.
Free Cash flows saw a net inflow of 12.8 B yen.

10© Copyright 2016 Oki Electric Industry Co., Ltd.
Table of Contents
I. Financial results for the 1H, FY ending Mar. 2017
1. Overview of 1H
2. Summary of Financial Results
3. Segment Information (Net sales)
4. Segment Information (Operating income)
5. Changing Factors of Operating Income
6. Balance Sheets
7. Cash Flows
II. Full Year Projections for the FY ending Mar. 2017
1. Current Conditions
2. Revision of Full Year Projections
3. Segment Information

11© Copyright 2016 Oki Electric Industry Co., Ltd.
Current Conditions
Summary of BusinessATM market in China is expected to be in a lull in overseas business
though domestic business remains steady. Competition in office
printers business increasingly intensifies mainly in Europe and the
U.S.
Appreciation of the yenRecent trend of strong yen continues for a time though level of
currency exchange fluctuated unsteadily from the beginning of this
fiscal year .
Full Year ProjectionsOKI revises its full year projections under the premise noted above.

12© Copyright 2016 Oki Electric Industry Co., Ltd.
FY end. Mar.2017(Revised on
Oct. 28, 2016)
Previous projections
VarianceFY end.
Mar.2016(Results)
Variance
Net sales 465.0 500.0 (35.0) 490.3 (25.3)Operating income 15.0 20.0 (5.0) 18.6 (3.6)Ordinary income 6.0 18.0 (12.0) 11.4 (5.4)Profit attributable to owners of parent 3.0 12.0 (9.0) 6.6 (3.6)
USD average exchange rate (Yen) 105.5 110 120.2EUR average exchange rate (Yen) 116.8 125 132.6
Revision of Full Year Projections
Year-end dividend plan: 30 yen* per share (as planned)Currency exchange rate assumption in 2H : ¥105/USD, ¥115/EUR
*OKI consolidated every ten shares of its common stock into one share on October 1, 2016.
(Billion yen)

13© Copyright 2016 Oki Electric Industry Co., Ltd.
Segment Information (Full Year)
FY end. Mar.2017(Revised on
Oct. 28, 2016)
Previous projections
VarianceFY end.
Mar.2016(Results)
Variance
ICTNet sales 180.0 188.0 (8.0) 191.2 (11.2)
Operating income 13.5 13.5 0.0 11.6 1.9
Mechatronics Systems
Net salesOperating income
105.0 112.0 (7.0) 113.7 (8.7)1.5 5.5 (4.0) 6.0 (4.5)
PrintersNet sales 115.0 133.0 (18.0) 124.6 (9.6)
Operating income 0.0 2.5 (2.5) 1.4 (1.4)
EMSNet sales 47.0 48.0 (1.0) 42.4 4.6
Operating income 2.5 2.5 0.0 2.3 0.2
OthersNet sales 18.0 19.0 (1.0) 18.5 (0.5)
Operating income 3.0 3.5 (0.5) 4.2 (1.2)Eliminates &
Corp. Operating income (5.5) (7.5) 2.0 (6.9) 1.4
Total Net sales 465.0 500.0 (35.0) 490.3 (25.3)Operating income 15.0 20.0 (5.0) 18.6 (3.6)
* ICT and Mechatronics are restated.
ICT: Operating income is expected to work out as planned though sales will decrease as a result of reviewing projects.Mechatronics Systems: ATM market in China is in a lull. Business in Japan, Brazil, and other countries goes approximately as planned.Printers: Sales of office printers mainly overseas are in the slump though strategic products and the effect of M&A contribute to its performance.
(Billion yen)

14© Copyright 2016 Oki Electric Industry Co., Ltd.
Reference

15© Copyright 2016 Oki Electric Industry Co., Ltd.
Segment Information (Full-year Net Sales and Operating Income)
Net Sales Operating Income

16© Copyright 2016 Oki Electric Industry Co., Ltd.
Quarterly Transition of Net Sales and Operating Income

17© Copyright 2016 Oki Electric Industry Co., Ltd.
Quarterly Transition of Net Sales and Operating Income(ICT)

18© Copyright 2016 Oki Electric Industry Co., Ltd.
Quarterly Transition of Net Sales and Operating Income(Mechatronics Systems)

19© Copyright 2016 Oki Electric Industry Co., Ltd.
Quarterly Transition of Net Sales and Operating Income(Printers)

20© Copyright 2016 Oki Electric Industry Co., Ltd.
Quarterly Transition of Net Sales and Operating Income(EMS)

21© Copyright 2016 Oki Electric Industry Co., Ltd.
Sales by Region
22© Copyright 2016 Oki Electric Industry Co., Ltd.
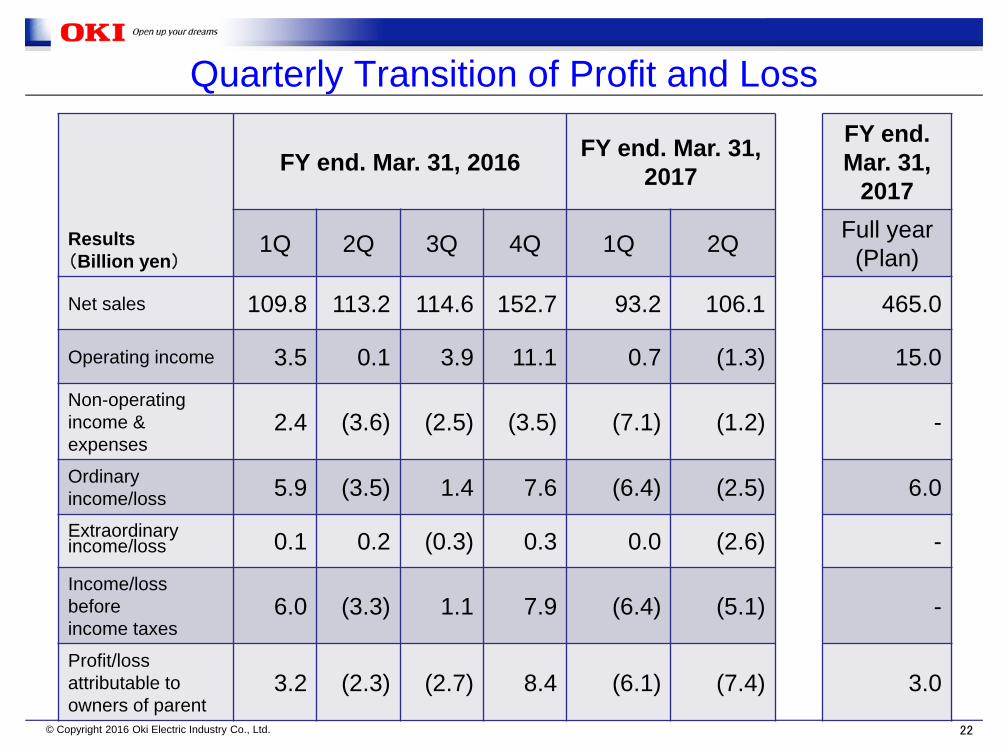
Quarterly Transition of Profit and Loss
Results(Billion yen)
FY end. Mar. 31, 2016 FY end. Mar. 31,2017
FY end. Mar. 31,
2017
1Q 2Q 3Q 4Q 1Q 2Q Full year (Plan)
Net sales 109.8 113.2 114.6 152.7 93.2 106.1 465.0
Operating income 3.5 0.1 3.9 11.1 0.7 (1.3) 15.0
Non-operating income & expenses
2.4 (3.6) (2.5) (3.5) (7.1) (1.2) -
Ordinary income/loss 5.9 (3.5) 1.4 7.6 (6.4) (2.5) 6.0
Extraordinary income/loss 0.1 0.2 (0.3) 0.3 0.0 (2.6) -
Income/loss before income taxes
6.0 (3.3) 1.1 7.9 (6.4) (5.1) -
Profit/loss attributable to owners of parent
3.2 (2.3) (2.7) 8.4 (6.1) (7.4) 3.0

23© Copyright 2016 Oki Electric Industry Co., Ltd.
Financial Highlights
Results(Billion yen)
FY end. Mar. 31, 2016 FY end. Mar. 31, 2017
1Q 2Q 3Q 4Q 1Q 2Q
Total assets 421.9 412.5 414.8 411.8 387.1 371.9
Net assets 119.8 113.6 110.6 107.4 99.2 93.1
Interest-bearing debt 109.5 114.8 118.3 122.1 118.7 107.8
Shareholders’ equity 118.8 112.8 110.3 106.7 98.7 92.6Shareholders’ equity ratio (%) 28.1 27.3 26.6 25.9 25.5 24.9
D/E ratio (times) 0.9 1.0 1.1 1.1 1.2 1.2
Free cash flows 1.6 (14.3) (0.3) (3.4) 16.1 (3.3)Cash and cash equivalents 53.7 44.5 45.5 46.3 57.1 43.0USD average exchange rate (Yen) 121.4 122.2 121.5 115.5 108.2 102.4EUR average exchange rate (Yen) 134.2 135.9 133.0 127.2 122.0 114.3

24© Copyright 2016 Oki Electric Industry Co., Ltd.
(0.6)FY16Original Plan FY16
Result
(1.0) 0
+2.0
0
(0.5)(1.0)
1H Changing Factors of Operating Income(vs. original plan)
Changes in fixed costs, etc.
Impact of currency exchange
Reduction in production and procurement costs
Changes in price
Changes in volume and product mix
Fixed costs are reduced against the drop in sales volume and the impact of currency exchange.
(Billion yen)

25© Copyright 2016 Oki Electric Industry Co., Ltd.
2.2 3.5
4.1 2.0
2.7 3.0
0.9 1.02.01.8
FY end. Mar.2016 FY end. Mar.2017
Others
EMS
Printers
MechatronicssystemsICT
Property, Plant & Eqip.
3.9 5.0
5.0 4.0
2.4 2.0
2.0 2.0
FY end. Mar.2016 FY end. Mar.2017
Others
Printers
Mechatronicssystems
ICT
R&D Expenses
[Depreciation]11.2 12.0
(Plan)
13.3 13.011.511.7
Capital Expenditure and R&D Expenses Projections
(Billion yen)
[Capital Expenditure]
(Plan)

26© Copyright 2016 Oki Electric Industry Co., Ltd.
Notice
• The projections and plans in this material are based on information currently available to OKI as of the date of publication and certain assumptions judged as rational, therefore actual results are subject to change depending upon the changes of business environments and other conditions.
• Indication method of amounts in hundred millions (yen) are as follow:Amounts in each item are rounded to the nearest hundred million yen. Variances are calculated in the hundred millions.