Financial Results for Fiscal Year 2015 -...
37
Brother Industries, Ltd. May 9, 2016 Information on this report, other than historical facts, refers to future prospects and performance, and has been prepared by our Management on the basis of information available at the time of the announcement. This covers various risks, including, but not limited to, economic conditions, customer demand, foreign currency exchange rates, tax rules, regulation and other factors. As a result, actual future performance may differ from any forecasts contained on this report. Financial Results for Fiscal Year 2015 (ended March 31, 2016)
Transcript of Financial Results for Fiscal Year 2015 -...

Brother Industries, Ltd.May 9, 2016
Information on this report, other than historical facts, refers to future prospects and performance, and has been prepared by our Management on the basis of information available at the time of the announcement. This covers various risks, including, but not limited to, economic conditions, customer demand, foreign currency exchange rates, tax rules, regulation and other factors. As a result, actual future performance may differ from any forecasts contained on this report.
Financial Results for Fiscal Year 2015(ended March 31, 2016)

© 2016 Brother Industries, Ltd. All Rights Reserved.
Highlight for FY2015

© 2016 Brother Industries, Ltd. All Rights Reserved. 3
Highlight for FY2015
Sales reached a record high primarily due to the new consolidated company Domino, despite negative factors, such as growing macroeconomic uncertainty and significantly decreased sales of machine tools.
Operating income decreased by 18%. However, it maintained almost the same level of profit as last yearʼs, excluding the impact from the consolidation of Domino and a negative impact from forex, mainly due to the yenʼs appreciation against the Euro.
Ordinary profit decreased by 6%. However, it increased year-on-year in real terms, excluding the impact from the consolidation of Domino.
(100 Millions of Yen)
FY15 FY14 Rate of Change(w/o forex impact) 15Q4 14Q4 Rate of Change
(w/o forex impact)
5.5% -5.2%(+4.0%) (-1.2%)
Operating Income 473 575 -17.8% 77 117 -34.1%
Current Profits 486 516 -5.7% 73 92 -20.2%
Income before Tax 493 654 -24.5% 58 78 -25.3%
Net Income 310 540 -42.5% 57 59 -4.1%
Exchange Rates
USD 120.16 110.03 116.95 119.56
EUR 132.36 138.68 128.94 136.10
Net Sales 7,0727,459 1,8581,762

© 2016 Brother Industries, Ltd. All Rights Reserved.
Highlight by business segment
4
(100 Millions of Yen)
Net Sales FY15 FY14 Rate of Change Rate of Change(w/o forex impact)
Total 7,459 7,072 5.5% 4.0%
Printing & Solutions 4,768 4,743 0.5% -0.6%
Personal & Home 528 514 2.6% 0.0%
Machinery & Solution 814 1,006 -19.1% -22.2%
Network & Contents 537 490 9.7% 9.5%
Industrial Parts 183 174 5.0% 3.4%
Domino business 483 - - -
Other 146 145 0.5% 0.4%
Operating Margin FY15 FY14 Rate of Change
Total 473 575 -17.8%
Printing & Solutions 342 357 -4.3%
Personal & Home 48 49 -1.7%
Machinery & Solution 104 162 -36.1%
Network & Contents -3 -9 -
Industrial Parts 9 3 207.0%
Domino business -20 - -
Other 13 12 2.9%
Adjustment -20 - -

© 2016 Brother Industries, Ltd. All Rights Reserved.
Communications & Printing equipment / Electronic stationery
Printing & Solutions
5
Inkjet MFCDCP-T700W
Black & White All-in-One
MFC-L5800DW
Document ScannerADS-3600W
(100 Millions of Yen)
FY14 FY15 Change
Net Sales
Printing & Solutions 4,743 4,768 0.5%
4,218 4,215 -0.1%
525 553 5.4%
Operating Income
Printing & Solutions 357 342 -4.3%
Communication & Printingequipment
Electronic stationery
Highlight by business segment
<Net sales>(Communications & Printing equipment )Sales remained at almost the same level as last year due to steady sales of color laser MFC and the launch of inkjet MFC with high-yield ink tanks, despite the severe business environment due to maturity of the printing market and the economic slowdown in emerging markets.
(Electronic stationery)Sales steadily increased in the labeling business and solution business as well, despite the economic slowdown in China and other emerging markets.
<Operating income>Operating income remained at the same level as last year, excluding a negative impact from a stronger Yen against the Euro.

© 2016 Brother Industries, Ltd. All Rights Reserved. 6
Personal & HomeHome sewing machines
Embroidery machine VR100
Cutting machineScanNCut 650W
Highlight by business segment
FY14 FY15 Change
Net Sales 514 528 2.6%
Operating Income 49 48 -1.7%
(100 Millions of Yen)
<Net sales>Sales of mid-range/high-end models steadily increased globally, despite the economic slowdown in Russia. Especially in Western Europe, sales for the year were strong with record high sales achieved in many countries.
<Operating income>Operating income margin retained a high profitability of approximately 9%, although operating income decreased due to the economic slowdown in Russia and a change in the product mix.

© 2016 Brother Industries, Ltd. All Rights Reserved.
Machinery & SolutionIndustrial sewing machines/Machine tools
7
SPEEDIOS500X1
SPEEDIOS1000X1
NEXIOS7300A
Highlight by business segment
FY14 FY15 Change
Net Sales
Machinery & Solution 1,006 814 -19.1%
Industrial sewing machi 273 308 12.7%
Machine tools 733 506 -30.9%
Operating Income
Machinery & Solution 162 104 -36.1%
(100 Millions of Yen)<Net sales>(Industrial sewing machines )Strategic lock stich model S7300A enjoyed a good reputation. Sales increased even though China experienced economic slowdown.
(Machine tools)Demand from IT customers peaked in the first half of the year. Sales to the automobile and motorcycle industries steadily increased with the strengthened product lineup.
<Operating income>In industrial machines, operating income rose due to an improvement in profit margin because sales of new lock stich S7300A were robust, and owing to steady sales of garment printers. However, operating income in the entire business decreased because operating income in machine tools significantly dropped due to shrinking demand from the IT industry.

© 2016 Brother Industries, Ltd. All Rights Reserved. 8
Network & Contents Online karaoke machines
Highlight by business segment
FY14 FY15 Change
Net Sales 490 537 9.7%
Operating Income -9 -3 -
(100 Millions of Yen)
New models, Joysound Max and Joysound Hibiki, were launched for the first time in approximately three years. With all music played by using musical instruments, which is the industryʼs first, as well as the industryʼs largest number of songs available, these models provide overwhelming performance.
<Net sales>Amid slowdown in the karaoke market, sales increased due to the launch of new models, Joysound Max and Joysound Hibiki, and new consolidated subsidiary Teichiku Entertainment, Inc.
<Operating income>Operating losses were recorded for two consecutive years due to increases in sales promotion and music production costs associated with the launch of the new models and owing to deferred income resulting from an increase in rental transaction volume.
*Impairment loss on subsidiary sharesWe calculated an impairment loss for the shares of consolidated subsidiary Xing Inc. under “Accounting Standard for Financial Instruments” because the actual value of the shares significantly fell due to deterioration in Xingʼs financial position, and recorded approximately 10.2 billion yen as a loss on valuation of shares of affiliates in the extraordinary loss items of our non-consolidated financial statements for the year ended March 31, 2016. (There was no impact on our consolidated financial statements because the amount was eliminated on consolidation.)

© 2016 Brother Industries, Ltd. All Rights Reserved. 9
Industrial partsReducer・Gear
GTR F Series
Highlight by business segment
FY14 FY15 Change
Net Sales 174 183 5.0%
Operating Income 3 9 207.0%
(100 Millions of Yen)
Helical gear Hypoid gear
<Net sales>Despite a decrease in sales of reducers in Japan, the entire sales increased by approximately 5% due to steadily growing sales in the Americas.
<Operating income>Profitability improved due to increased sales.
*Change of business segmentsTo accelerate synergies between businesses, industrial parts will be integrated into the Machinery and Solution business in FY 2016. (Machinery and Solution business will be renamed Machinery business in FY 2016.)

© 2016 Brother Industries, Ltd. All Rights Reserved.
Domino Business
10
Americas23%
Europe50%
Asia/ others27%
< Sales breakdown by region >
<(Ref.) sales comparison by region>
*FY2015 is 9 month figures after newly consolidation with Brother group
Highlight by business segment
FY15 Changex FX
Net Sales 483 3.2%
Americas 112 2.8%
Europe 239 5.6%
Asia & Others 133 2.0%
<Net sales>In the cording business, sales as a whole increased steadily and maintained single digit year-on-year growth.In the digital printing business, sales rose with an annual growth rate of over 15% due to growing needs for digital printing.
<Operating income>Domino group maintained a profit margin of approximately 15%.However, operating loss was recorded in Brother consolidation due to the amortization of goodwill.(With Brotherʼs adoption of IFRS, goodwill will not be amortized from FY 2016.)

© 2016 Brother Industries, Ltd. All Rights Reserved.
Forecast for FY2016

© 2016 Brother Industries, Ltd. All Rights Reserved.
2018 Performance goal (IFRS)
750B.JPY
60B.JPY
8.0%
Salesrevenue
Operating income
Operating income
rate
Mid-Term Business Strategy “CS B2018”
12

© 2016 Brother Industries, Ltd. All Rights Reserved.
Concept of strengthen our businesses in CS B2018
Concept of strengthen our businesses in CS B2015
Expected to be growth drivers of the entire group
Expected to contribute to overall group profit as future cash cow groups
Communications&
Printing equipment
Promote growth strategies across all businesses
Placed the printing related business as the primary axis inside the head office, and growth strategies promoted across all businesses
E-stationery P&H M&S N&C New
business
Growthbusiness New business
Communications&
Printing equipmentN&C
Businesses for profitability enhancement
Growth businesses and new businesses
• Dominobusiness
• Industrial printing• Factory automation• Solution
• P&H• E-stationery• Machinery business
Clearly differentiate between “businesses for profitability enhancement” and “businesses for growth” and reallocate our resources to strengthen the portfolio
Policy to strengthen our businesses in CS B2018
Reallocation of HR/
investment
13
© 2016 Brother Industries, Ltd. All Rights Reserved.
Change of business segments
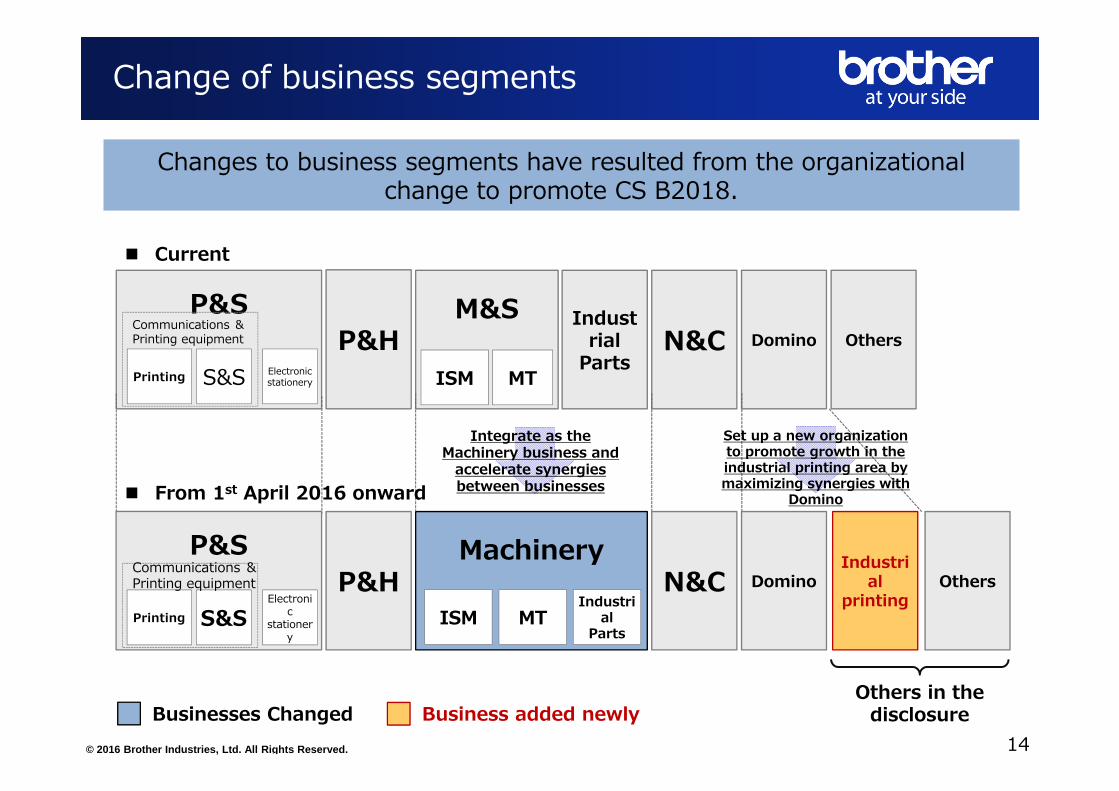
Changes to business segments have resulted from the organizational change to promote CS B2018.
OthersP&H N&CIndustri
al printing
DominoMachinery
MTIndustri
alParts
ISM
P&H N&CIndust
rialParts
Domino Others
P&S
・Printing S&S Electronic stationery
M&S
MTISM
Communications &Printing equipment
P&S
・Printing S&SElectroni
c stationer
y
Communications &Printing equipment
Current
14
Integrate as the Machinery business and
accelerate synergies between businesses
Set up a new organization to promote growth in the industrial printing area by maximizing synergies with
Domino
Others in the disclosure Businesses Changed Business added newly
From 1st April 2016 onward

© 2016 Brother Industries, Ltd. All Rights Reserved. 15
P&S
P&H
Main measures in FY2016
Communications & Printing equipment・Establish a new marketing strategy to survive in the SOHO market・Shift to a proposal-based business to establish a presence in the SMB area・Change into a highly profitable product mix, aiming to enhance profitability in emerging markets・Promote approaches to increase sales of genuine consumables
Electronic stationery・Maintain the overwhelming position of No.1 in the labeling market・Increase sales in the solution business area
Home sewing machines
・Maintain global No.1 market share・Strengthen sales activities to expand share in the mid-range/high-end markets・Enhance development of sales channels towards growth in the craft area

© 2016 Brother Industries, Ltd. All Rights Reserved.
Main measures in FY2016
16
Machinery
Domino
N&C
Industrial sewing machines・Enhance structure to support sales growth in the expanding Asian markets.・Strengthen R&D and sales to evolve the garment printer business
Machine tools・Strengthen sales and service capabilities to increase sales to the automobile and motorcycle industries・Optimize production structure with an eye to a recovery in demand from IT related customers
Industrial parts・In the reducers business, aim to increase sales of gear motors mainly in the USA・Transform into a highly profitable product mix by focusing on gears for robots
・Invest in sales/service network to strengthen sales・Realize synergies with Brother (in R&D and production)・Increase production facilities (in U.K. and China)
・Dispose of underperforming businesses, such as the content business, and restrain new business plans/investments・Improve profitability in existing stores by closing underperforming stores

© 2016 Brother Industries, Ltd. All Rights Reserved.
Forecast for FY2016
IFRS (Ref.) J-GAAP
17
FY16 FY16 FY15 Rate of Change(w/o forex impact)
-4.1%(+3.3%)
Business Segment Profit 460 Operating Income 400 473 -15.4%
Operating Profit 450 Current Profits 380 486 -21.8%
Income before Tax 450 Income before Tax 365 493 -26.0%
Net Income 315 Net Income 255 310 -17.8%
Exchange Rates Exchange Rates
USD 110.00 USD 110.00 120.16
EUR 125.00 EUR 125.00 132.36
7,150 7,459Sales Revenue 6,575 Net Sales
(100 Millions of Yen)
<Main impacts due to the adoption of IFRS>*Sales (Sales revenue)Primarily in the P&S business, most of sales promotion and advertising expenses associated with sales of products will be deduced from sales as discounts in real terms.*Operating profitWhile goodwill is amortized regularly under Japanese GAAP, it is not amortized under IFRS.(An impairment test shall be performed each period, and an impairment loss shall be recognized, if needed.)*Corporate taxTax rate will become stable because the way tax effects on unrealized profits are recorded will change.
© 2016 Brother Industries, Ltd. All Rights Reserved. 18
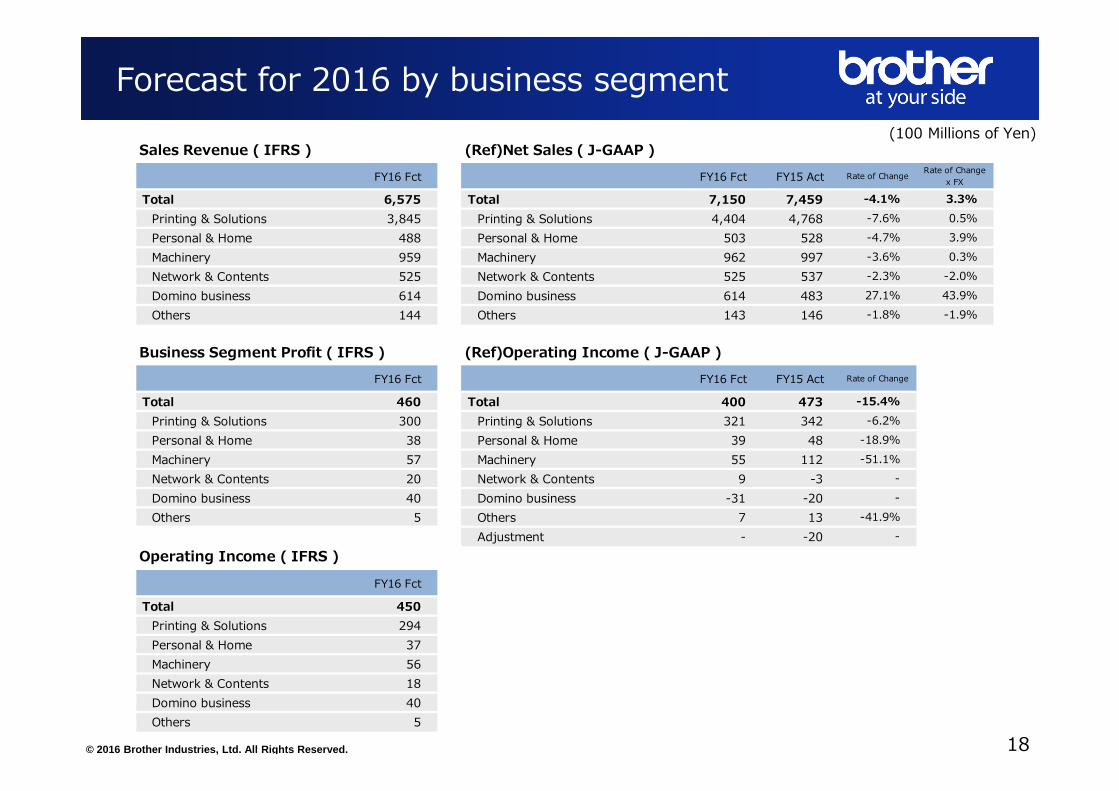
Forecast for 2016 by business segment(100 Millions of Yen)
Sales Revenue ( IFRS ) (Ref)Net Sales ( J-GAAP )FY16 Fct FY16 Fct FY15 Act Rate of Change Rate of Change
x FX
Total 6,575 Total 7,150 7,459 -4.1% 3.3%Printing & Solutions 3,845 Printing & Solutions 4,404 4,768 -7.6% 0.5%Personal & Home 488 Personal & Home 503 528 -4.7% 3.9%Machinery 959 Machinery 962 997 -3.6% 0.3%Network & Contents 525 Network & Contents 525 537 -2.3% -2.0%Domino business 614 Domino business 614 483 27.1% 43.9%Others 144 Others 143 146 -1.8% -1.9%
Business Segment Profit ( IFRS ) (Ref)Operating Income ( J-GAAP )FY16 Fct FY16 Fct FY15 Act Rate of Change
Total 460 Total 400 473 -15.4%Printing & Solutions 300 Printing & Solutions 321 342 -6.2%Personal & Home 38 Personal & Home 39 48 -18.9%Machinery 57 Machinery 55 112 -51.1%Network & Contents 20 Network & Contents 9 -3 -Domino business 40 Domino business -31 -20 -Others 5 Others 7 13 -41.9%
Adjustment - -20 -
Operating Income ( IFRS )FY16 Fct
Total 450Printing & Solutions 294Personal & Home 37Machinery 56Network & Contents 18Domino business 40Others 5

© 2016 Brother Industries, Ltd. All Rights Reserved.
65 65 64 78
94 94
32
100
32.9% 36.0%
50.2%
33.0%
30.1% 29.7%
Buyback sharesTotal dividend amountTotal return ratio
24 24 2430
36 36
32.9% 36.0% 33.2%14.5%
30.1% 29.7%
Dividend per stockDividend payout ratio
19
Dividend and Payout ratio
2012 2013 20142011 2015
<Dividend record>
<Total return ratio>
Basic policy remains unchanged with consolidated payout ratio of about 30% Stable return to shareholders
2016Fct
2012 2013 20142011 2015 2016Fct

© 2016 Brother Industries, Ltd. All Rights Reserved.
8.7%7.2% 6.9%
16.8%
9.2%
2011 2012 2013 2014 2015 2016Fct(IFRS)
20
ROE record
ROE based onbusiness profit
13.1%
ROE for FY 2016 is forecasted to be 9%+
9%+

Appendix

© 2016 Brother Industries, Ltd. All Rights Reserved.
54 68
357 342
4.4% 6.0%7.5% 7.2%
14Q4 15Q4 14TY 15TY
14Q4 15Q4 ChangeChange
x FX 14TY 15TY ChangeChange
x FX
Net Sales 1,238 1,135 -8.4% -3.2% 4,743 4,768 0.5% -0.6%
Communications & Printing equipme 1,099 997 -9.3% -4.1% 4,218 4,215 -0.1% -1.0%
Americas 446 399 -10.4% -5.1% 1,680 1,733 3.2% -2.1%
Europe 376 355 -5.6% -0.2% 1,417 1,367 -3.5% 0.2%
Asia & Others 167 133 -20.0% -11.6% 694 645 -7.1% -7.9%
Japan 111 109 -1.7% -1.7% 427 470 10.1% 10.1%
Electronic stationery 139 138 -0.6% 4.3% 525 553 5.4% 2.9%
Americas 68 67 -1.6% 2.8% 253 278 9.6% 3.0%
Europe 42 42 1.2% 6.6% 158 158 0.3% 3.7%
Asia & Others 18 16 -9.0% -0.1% 78 77 -1.9% -3.7%
Japan 11 12 12.0% 12.0% 35 40 13.5% 13.5%
Operating Income 54 68 357 342
139 138
525 553
14Q4 15Q4 14TY 15TY
1,099 997
4,218 4,215
14Q4 15Q4 14TY 15TY22
Printing & Solutions Sales & Operating Income< Results for FY2015 ( ended March 31, 2016 ) >
<Net Sales>Communications & Printing equipment
<Net Sales>Electronic stationery
<Operating Income>
(100 Millions of Yen)
© 2016 Brother Industries, Ltd. All Rights Reserved.
7 5
49 48
5.7% 4.3%9.6% 9.2%
14Q4 15Q4 14TY 15TY
130 113
514 528
14Q4 15Q4 14TY 15TY
23
(100 Millions of Yen)
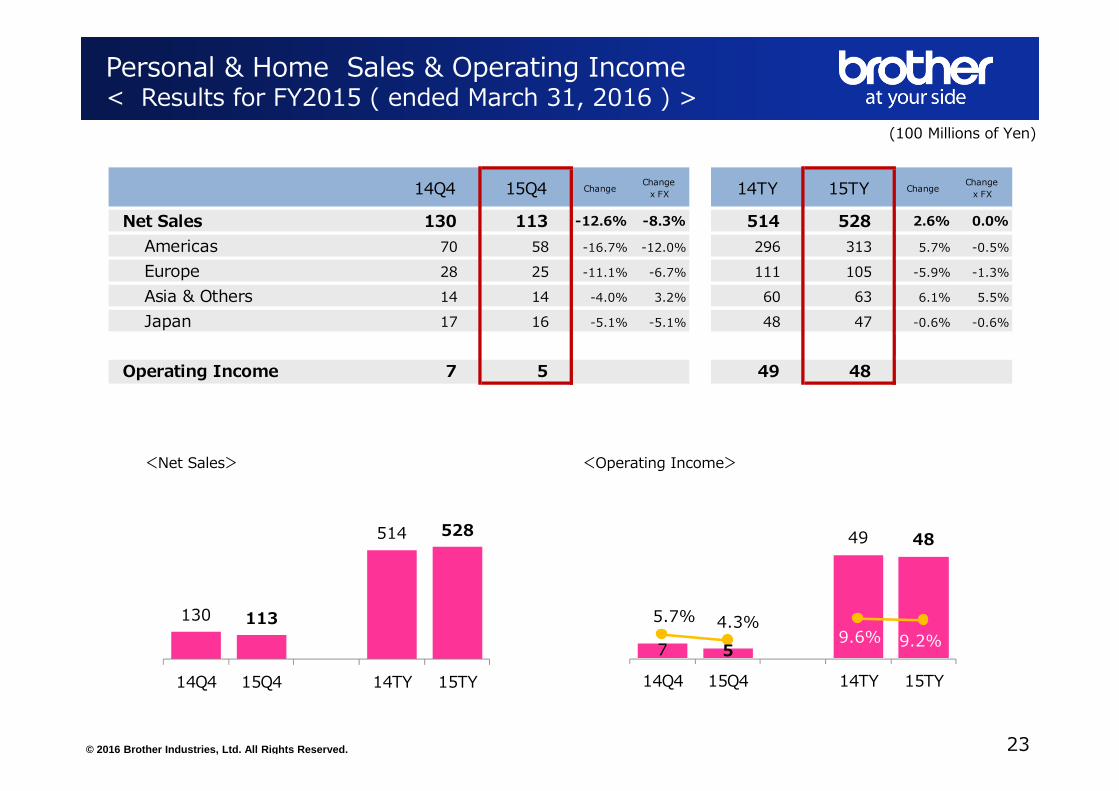
Personal & Home Sales & Operating Income< Results for FY2015 ( ended March 31, 2016 ) >
14Q4 15Q4 Change Changex FX 14TY 15TY Change Change
x FX
Net Sales 130 113 -12.6% -8.3% 514 528 2.6% 0.0%
Americas 70 58 -16.7% -12.0% 296 313 5.7% -0.5%
Europe 28 25 -11.1% -6.7% 111 105 -5.9% -1.3%
Asia & Others 14 14 -4.0% 3.2% 60 63 6.1% 5.5%
Japan 17 16 -5.1% -5.1% 48 47 -0.6% -0.6%
Operating Income 7 5 49 48
<Net Sales> <Operating Income>

© 2016 Brother Industries, Ltd. All Rights Reserved.
457
162
10416.4%
4.8% 16.1% 12.7%
14Q4 15Q4 14TY 15TY
20085
733
506
14Q4 15Q4 14TY 15TY
73 71
273 308
14Q4 15Q4 14TY 15TY
14Q4 15Q4 Change Changex FX 14TY 15TY Change Change
x FX
Net Sales 273 157 -42.6% -41.2% 1,006 814 -19.1% -22.2%
Industrial sewing machines 73 71 -2.3% 1.4% 273 308 12.7% 6.3%Americas 14 13 -2.1% 2.0% 54 63 16.8% 7.5%
Europe 11 10 -4.2% 0.2% 43 46 7.5% 12.6%
Asia & Others 46 46 -0.6% 3.0% 169 192 13.5% 4.9%
Japan 2 1 -34.9% -34.9% 7 6 -7.8% -7.8%
Machine tools 200 85 -57.3% -56.7% 733 506 -30.9% -32.8%Americas 7 6 -7.3% - 29 25 -12.8% -
Europe 5 3 -47.3% - 23 19 -16.9% -
Asia & Others 171 58 -66.2% - 622 392 -37.0% -
Japan 17 19 10.3% - 59 71 18.8% -
Operating Income 45 7 162 104
24
(100 Millions of Yen)
Machinery & Solution Sales & Operating Income< Results for FY2015 ( ended March 31, 2016 ) >
<Net Sales>Industrial sewing machines
<Net Sales>Machine tools
<Operating Income>

© 2016 Brother Industries, Ltd. All Rights Reserved.
10
3
-9 -3
7.4%2.1%
-1.7%-0.5%
14Q4 15Q4 14TY 15TY
14Q4 15Q4 Change 14TY 15TY Change
Net Sales 138 129 -6.7% 490 537 9.7%
Operating Income 10 3 -9 -3
25
(100 Millions of Yen)
Network & Contents Sales & Operating Income< Results for FY2015 ( ended March 31, 2016 ) >
<Net Sales> <Operating Income>
138 129
490 537
14Q4 15Q4 14TY 15TY

© 2016 Brother Industries, Ltd. All Rights Reserved.
1 3
3
9 2.0%
5.6%1.6%
4.8%
14Q4 15Q4 14TY 15TY
45 47
174 183
14Q4 15Q4 14TY 15TY
26
(100 Millions of Yen)
Industrial Part Sales & Operating Income< Results for FY2015 ( ended March 31, 2016 ) >
14Q4 15Q4 Change Changex FX 14TY 15TY Change Change
x FX
Net Sales 45 47 3.3% 4.3% 174 183 5.0% 3.4%
Americas 5 7 28.3% 31.0% 23 28 23.1% 12.6%
Asia & Others 1 4 182.7% 208.5% 5 15 217.3% 209.3%
Japan 39 36 -6.0% -6.0% 147 140 -4.5% -4.5%
Operating Income 1 3 3 9
<Net Sales> <Operating Income>

© 2016 Brother Industries, Ltd. All Rights Reserved. 27
Dominoʼs OP income 67Amortization of goodwill ▲50Amortization of intangible assets ▲25Other* ▲12
Domino business OP income ▲20
<Breakdown of operating income of Domino business>
67▲50
▲25
▲12 ▲20
Dominoʼs OP income
Amortization of
goodwill
Amortization of intangible
assets
Other Domino business OP
income
(100 Millions of Yen)
Domino Business Sales & Operating Income< Results for FY2015 ( ended March 31, 2016 ) >
*Other mainly represents an adjustment from IFRS to J-GAAP.
Americas23%
Europe50%
Asia & Others27%
<Sales by Regions>
FY15 Changex FX
Net Sales 483 3.2%
Americas 112 2.8%
Europe 239 5.6%
Asia & Others 133 2.0%
*Ref: Year-on-year growth rate by geography(local currency basis)

© 2016 Brother Industries, Ltd. All Rights Reserved.
342 321 294
7.2% 7.3% 7.6%
15ACT(J-GAAP)
16FCT(J-GAAP)
16FCT(IFRS)
553 525456
15ACT(J-GAAP)
16FCT(J-GAAP)
16FCT(IFRS)
4,215 3,8783,389
15ACT(J-GAAP)
16FCT(J-GAAP)
16FCT(IFRS)
(100 Millions of Yen)
28
15TY ACT(J-GAAP)
16TY FCT(J-GAAP)
Change Changex FX
16TY FCT(IFRS)
Net Sales 4,768 4,404 -7.6% 0.5% Sales Revenue 3,845 Communications & Printing eq 4,215 3,878 -8.0% 0.1% Communications & Printing eq 3,389
Americas 1,733 1,542 -11.0% -0.6% Americas 1,252Europe 1,367 1,262 -7.7% -1.1% Europe 1,124Asia & Others 645 600 -7.0% 3.7% Asia & Others 559Japan 470 475 1.1% 1.1% Japan 455
Electronic stationery 553 525 -4.9% 3.5% Electronic stationery 456Americas 278 259 -6.5% 3.6% Americas 213Europe 158 150 -5.3% 1.4% Europe 138Asia & Others 77 73 -5.2% 5.3% Asia & Others 65Japan 40 43 7.8% 7.8% Japan 40
Operating Income 342 321 Business Segment Profit 300 Operating Income 294
Printing & Solutions Sales & Operating Income< Forecast for FY2016 ( ending March 31, 2017 ) >
<Sales>Communications & Printing equipment
<Sales>Electronic stationery
<Operating Income>

© 2016 Brother Industries, Ltd. All Rights Reserved.
4839 37
9.2% 7.8% 7.6%
15ACT(J-GAAP)
16FCT(J-GAAP)
16FCT(IFRS)
528 503 488
15ACT(J-GAAP)
16FCT(J-GAAP)
16FCT(IFRS)
29
(100 Millions of Yen)
15TY ACT(J-GAAP)
16TY FCT(J-GAAP)
Change Changex FX
16TY FCT(IFRS)
Net Sales 528 503 -4.7% 3.9% Sales Revenue 488
Americas 313 291 -7.0% 3.7% Americas 282
Europe 105 97 -7.5% -2.0% Europe 97
Asia & Others 63 64 0.9% 10.4% Asia & Others 62
Japan 47 52 9.1% 9.1% Japan 47
Operating Income 48 39 Business Segment Profit 38 Operating Income 37
<Sales> <Operating Income>
Personal & Home Sales & Operating Income< Forecast for FY2016 ( ending March 31, 2017 ) >

© 2016 Brother Industries, Ltd. All Rights Reserved.
112
55 56
11.3%
5.7% 5.8%
15TY ACT(J-GAAP)
16TY FCT(J-GAAP)
16TY FCT(IFRS)
308 314 314
506 446 443
183 202 202
15TY ACT(J-GAAP)
16TY FCT(J-GAAP)
16TY FCT(IFRS)
30
(100 Millions of Yen)
15TY ACT(J-GAAP)
16TY FCT(J-GAAP)
Change Changex FX
16TY FCT(IFRS)
Net Sales 997 962 -3.6% 0.3% Sales Revenue 959
Industrial sewing machines 308 314 2.2% 0.3% Industrial sewing machines 314
Machine tools 506 446 -12.0% -10.7% Machine tools 443
Industrial Parts 183 202 10.1% 12.7% Industrial Parts 202
Operating Income 112 55 Business Segment Profit 57
Operating Income 56
<Sales> <Operating Income>997 962 959
Industrial sewing machines
Machine Tools
Industrial Parts
Machinery Business Sales & Operating Income< Forecast for FY2016 ( ending March 31, 2017 ) >

© 2016 Brother Industries, Ltd. All Rights Reserved.
15TY ACT(J-GAAP)
16TY FCT(J-GAAP)
Change Changex FX
16TY FCT(IFRS)
Net Sales 997 962 -3.6% 0.3% Sales Revenue 959
Industrial sewing machines 308 314 2.2% 10.9% Industrial sewing machines 314
Americas 63 59 -5.0% 5.0% Americas 59
Europe 46 49 5.7% 12.1% Europe 49
Asia & Others 192 199 3.6% 12.7% Asia & Others 199
Japan 6 7 6.1% 6.1% Japan 7
Machine tools 506 446 -12.0% -10.7% Machine tools 443
Americas 25 28 13.6% - Americas 28
Europe 19 26 32.3% - Europe 26
Asia & Others 392 305 -22.1% - Asia & Others 302
Japan 71 87 22.7% - Japan 87
Industrial Parts 183 202 10.1% 12.7% Industrial Parts 202
Americas 28 29 3.8% 13.7% Americas 29
Europe - - - - Europe -
Asia & Others 15 17 14.3% 27.4% Asia & Others 17
Japan 140 156 10.9% 10.9% Japan 156
Operating Income 112 55 Business Segment Profit 57
Operating Income 56
31
(100 Millions of Yen)
Machinery Business Sales & Operating Income< Forecast for FY2016 ( ending March 31, 2017 ) >

© 2016 Brother Industries, Ltd. All Rights Reserved. 32
(100 Millions of Yen)
15TY ACT(J-GAAP)
16TY FCT(J-GAAP)
Change16TY FCT
(IFRS)
Net Sales 537 525 -2.3% Sales Revenue 525
Operating Income -3 9 Business Segment Profit 20
Operating Income 18
537 525 525
15TY ACT(J‐GAAP)
16TY FCT(J‐GAAP)
16TY FCT(IFRS)
-3
9
18
-0.5%
1.7%3.4%
15TY ACT(J-GAAP)
16TY FCT(J-GAAP)
16TY FCT(IFRS)
<Sales> <Operating Income>
Network & Contents Sales & Operating Income< Forecast for FY2016 ( ending March 31, 2017 ) >

© 2016 Brother Industries, Ltd. All Rights Reserved.
483
614 614
15TY ACT(J-GAAP)
16TY FCT(J-GAAP)
16TY FCT(IFRS)
-20 -31
40
-4.2%
-5.0%
6.5%
15TY ACT(J-GAAP)
16TY FCT(J-GAAP)
16TY FCT(IFRS)
33
(100 Millions of Yen)
15TY ACT(J-GAAP)
16TY FCT(J-GAAP)
16TY FCT(IFRS)
Net Sales 483 614 Sales Revenue 614Americas 112 138 Americas 138Europe 239 310 Europe 310Asia & Others 133 165 Asia & Others 165
Operating Income -20 -31 Business Segment Profit 40 Operating Income 40
<Sales> <Operating Income>
Domino Business Sales & Operating Income< Forecast for FY2016 ( ending March 31, 2017 ) >

© 2016 Brother Industries, Ltd. All Rights Reserved. 34
Main Factors for Changes in Operating Income
<Q4>
<2015TY>

© 2016 Brother Industries, Ltd. All Rights Reserved.
1,034 1,0711,251 1,292 1,224 1,302 1,400 1,375
1,269
3.4 3.64.2
3.5 3.7 4.0 4.0 3.9 4.1
Mar-14 Jun-14 Sep-14 Dec-14 Mar-15 Jun-15 Sep-15 Dec-15 Mar-16
119 129
341
400376
81 98
282343
377
122 124
425 460 454
35
Inventories(100 Millions of yen)
R&D expenses(100 Millions of Yen)
Capital expenditure / Depreciation & amortization (100 Millions of Yen)
(Number of months)
R&D expenses / Capital expenditure /Depreciation and amortization / Inventories
14Q4Act
15TYAct
14TYAct
15Q4Act
Inventories Inventories / Cost of sales
Capital expenditureDepreciation & amortization
*Jun-15 actual for Inventories does not include Domino business figures.
16TYFct
14Q4Act
15TYAct
14TYAct
15Q4Act
16TYFct

© 2016 Brother Industries, Ltd. All Rights Reserved.
Changes in PL presentation resulting from the transition to IFRS
Adopt IFRS voluntarily and start disclosing financial results under IFRS at the FY 2016 Q1 earnings announcement.
Net Sales
Cost of salesGross profitSG&A
sales promotion expenses
Operating incomeNon-operating income
Non-operating expenses
sales discounts Current profitsExtraordinary income
Extraordinary expensesIBT
Sales Revenue(Gross)items deducted from sales
Sales Revenue(Net)Cost of salesGross profitSG&A
Business Segment profit
Other operating income
Other operating expenses
Operating incomeFinance incomeFinance costShare of profit of investments accounted for using the equity method
IBT
J-GAAP IFRS
For financial results by business segment, both business segment profit and operating profit will be disclosed. The notion of business segment profit is similar to that of operating profit under Japanese GAAP.
36