Financial Results for Fiscal 2015, the Year Ended … · Financial Results for Fiscal 2015, ... P6....
18
Financial Results for Fiscal 2015, the Year Ended February 28, 2015 http://www.star-m.jp * The projections in this document are based on information available at the time of release of this report and certain assumptions the Company considers reasonable. The Company does not promise that these projections will be achieved. Actual results may differ materially from projections due to a variety of factors. Code 7718 April 9, 2015
Transcript of Financial Results for Fiscal 2015, the Year Ended … · Financial Results for Fiscal 2015, ... P6....

Financial Results for Fiscal 2015, the Year Ended February 28, 2015
http://www.star-m.jp
* The projections in this document are based on information available at the time of release of this report and certain assumptions the Company considers reasonable. The Company does not promise that these projections will be achieved. Actual results may differ materially from projections due to a variety of factors.
Code 7718 April 9, 2015
1
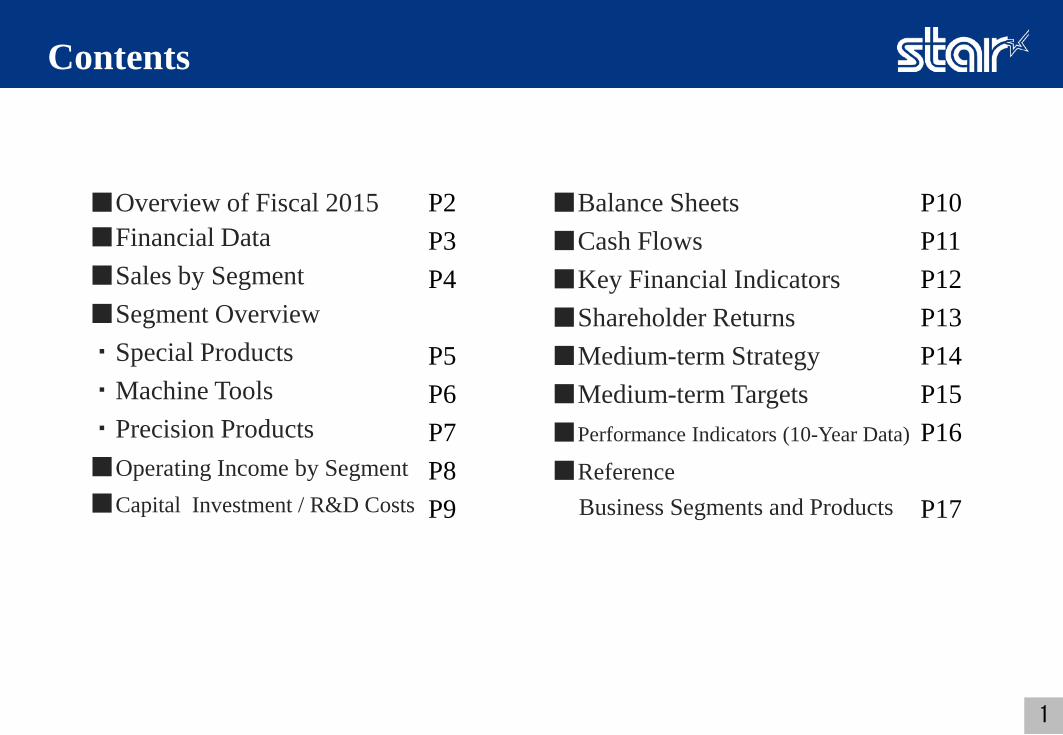
Contents
■Overview of Fiscal 2015 ■Financial Data ■Sales by Segment ■Segment Overview ・Special Products ・Machine Tools ・Precision Products ■Operating Income by Segment ■Capital Investment / R&D Costs
■Balance Sheets ■Cash Flows ■Key Financial Indicators ■Shareholder Returns ■Medium-term Strategy ■Medium-term Targets ■Performance Indicators (10-Year Data)
■Reference Business Segments and Products
P2 P3 P4
P5 P6 P7 P8 P9
P10 P11 P12 P13 P14 P15 P16
P17

Overview of Fiscal 2015
2
■Net Sales :¥50.95 billion 17.2% up YoY ■Operating Income: ¥5.47 billion 110.1% up YoY ■Ordinary Income : ¥6.15 billion 91.1% up YoY ■Net Income : ¥4.69 billion 310.7% up YoY
Due also to the yen weakening, sales increased across all business segments, centered on machine tools.
Sales increased year on year, and earnings substantially increased year on year.
Substantially higher earnings on sales growth year on year.
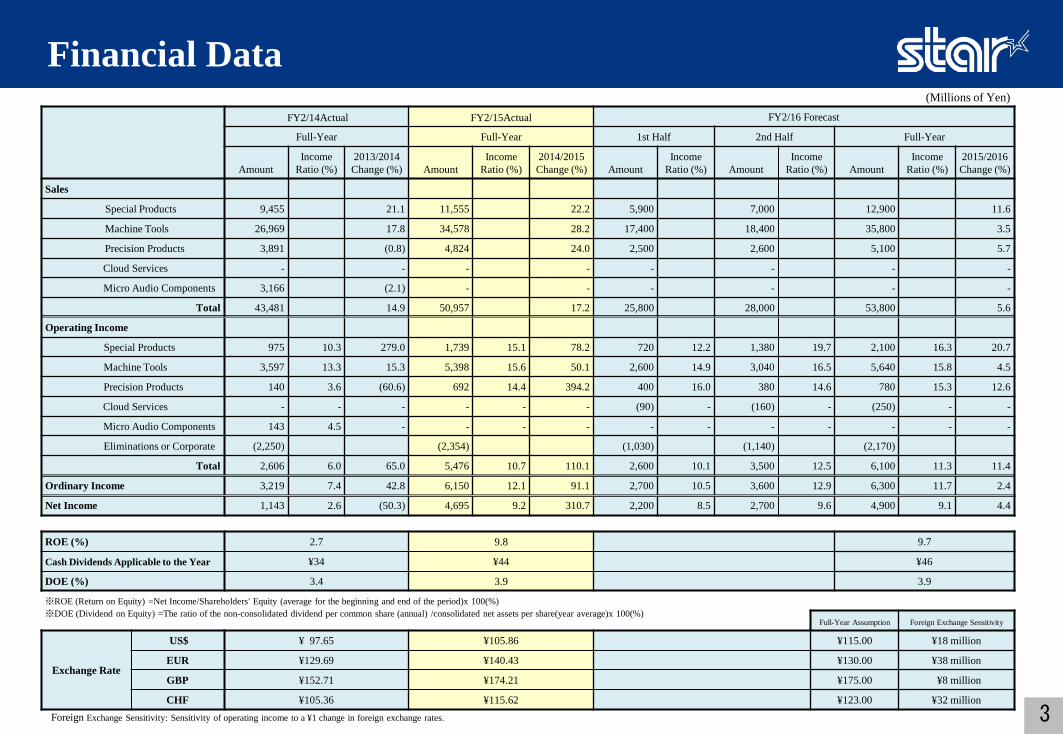
FY2/14Actual FY2/15Actual FY2/16 Forecast
Full-Year Full-Year 1st Half 2nd Half Full-Year
Amount Income
Ratio (%) 2013/2014 Change (%) Amount
Income Ratio (%)
2014/2015 Change (%) Amount
Income Ratio (%) Amount
Income Ratio (%) Amount
Income Ratio (%)
2015/2016 Change (%)
Sales
Special Products 9,455 21.1 11,555 22.2 5,900 7,000 12,900 11.6
Machine Tools 26,969 17.8 34,578 28.2 17,400 18,400 35,800 3.5
Precision Products 3,891 (0.8) 4,824 24.0 2,500 2,600 5,100 5.7
Cloud Services - - - - - - - -
Micro Audio Components 3,166 (2.1) - - - - - -
Total 43,481 14.9 50,957 17.2 25,800 28,000 53,800 5.6
Operating Income
Special Products 975 10.3 279.0 1,739 15.1 78.2 720 12.2 1,380 19.7 2,100 16.3 20.7
Machine Tools 3,597 13.3 15.3 5,398 15.6 50.1 2,600 14.9 3,040 16.5 5,640 15.8 4.5
Precision Products 140 3.6 (60.6) 692 14.4 394.2 400 16.0 380 14.6 780 15.3 12.6
Cloud Services - - - - - - (90) - (160) - (250) - -
Micro Audio Components 143 4.5 - - - - - - - - - - -
Eliminations or Corporate (2,250) (2,354) (1,030) (1,140) (2,170)
Total 2,606 6.0 65.0 5,476 10.7 110.1 2,600 10.1 3,500 12.5 6,100 11.3 11.4
Ordinary Income 3,219 7.4 42.8 6,150 12.1 91.1 2,700 10.5 3,600 12.9 6,300 11.7 2.4
Net Income 1,143 2.6 (50.3) 4,695 9.2 310.7 2,200 8.5 2,700 9.6 4,900 9.1 4.4
ROE (%) 2.7 9.8 9.7
Cash Dividends Applicable to the Year ¥34 ¥44 ¥46
DOE (%) 3.4 3.9 3.9
※ROE (Return on Equity) =Net Income/Shareholders' Equity (average for the beginning and end of the period)x 100(%)
Full-Year Assumption Foreign Exchange Sensitivity
Exchange Rate
US$ ¥ 97.65 ¥105.86 ¥115.00 ¥18 million
EUR ¥129.69 ¥140.43 ¥130.00 ¥38 million
GBP ¥152.71 ¥174.21 ¥175.00 ¥8 million
CHF ¥105.36 ¥115.62 ¥123.00 ¥32 million
3
(Millions of Yen)
※DOE (Dividend on Equity) =The ratio of the non-consolidated dividend per common share (annual) /consolidated net assets per share(year average)x 100(%)
Financial Data
Foreign Exchange Sensitivity: Sensitivity of operating income to a ¥1 change in foreign exchange rates.

Sales by Segment
4
Special Products
Micro Audio Components
Machine Tools
Precision Products
20,000
40,000
60,000
3,233 3,922
22,897
7,806
37,858
FY2/13
3,166 3,891
26,969
9,455
43,481
FY2/14
4,824
34,578
11,555
50,957
FY2/15
5,100
35,800
12,900
53,800
FY2/16(Est.) 0
(Millions of Yen)

Sales Volume by POS Printers Type
Special Products
・In the U.S. and Japanese markets, sales centered on applications for payment systems using smartphones and tablets (mobile POS system) were strong. Sales also grew in the European market alongside the gradual economic recovery.
・Sales increased in the Asian market, with sales of dot-matrix printers increased in China .
Sales
Sales Volume by Region
5
Dot Matrix
Thermal and Others
Dot Matrix
Thermal and Others
America Europe Asia Japan and exports, etc.
5,000
10,000
15,000
1,338
6,467
7,806
FY2/13
1,460
7,994
9,455
FY2/14
2,163
9,391
11,555
FY2/15
2,403
10,496
12,900
FY2/16(Est.) 0
(Millions of Yen)
200
400
600
178
340
519
FY2/13
128
353
481
FY2/14
159
407
566
FY2/15
168
428
597
FY2/16(Est.) 0
(Thousand Units)
200
400
600
46
116
128
229
519
FY2/13
40 82
127
231
481
FY2/14
58
97
131
278
566
FY2/15
58
103
150
284
597
FY2/16(Est.) 0
(Thousand Units)

Machine Tools Sales Volume by Region
Sales by Region
Sales
・ Sales in the European market increased sharply, reflecting solid sales amid a continuing recovery in orders, mainly in the automotive-related sector.
・ Sales in the U.S. market were at the same level year on year, primarily due to a lagging recovery in sales in the mainstay medical equipment-related sector.
・ Sales increased substantially in the Asian market, with strong sales in the automobile-,communications-,and medical equipment-related sectors in mainly East Asia.
・ Sales increased significantly in the Japanese market, reflecting strong sales primarily in the automotive-related sector.
6
Overseas
Domestic
America Asia
Domestic Europe
America Asia
Domestic Europe
10,000
20,000
30,000
40,000
3,756
19,140
22,897
FY2/13
3,891
23,077
26,969
FY2/14
5,234
29,343
34,578
FY2/15
4,658
31,141
35,800
FY2/16(Est.) 0
(Millions of Yen)
1,000
2,000
3,000
353
519
328
637
1,837
FY2/13
351
526
308
699
1,884
FY2/14
450
686
297
1,004
2,437
FY2/15
400
644
286
1,278
2,608
FY2/16(Est.) 0
(Units)
10,000
20,000
30,000
40,000
3,756
8,714
6,042
4,383
22,897
FY2/13
3,891
10,671
7,141
5,264
26,969
FY2/14
5,234
14,682
7,199
7,461
34,578
FY2/15
4,658
13,069
7,730
10,341
35,800
FY2/16(Est.) 0
(Millions of Yen)

Sales of Non-wristwatch Components
Precision Products
Sales
・ Sales of wristwatch components increased markedly due to strong sales to wristwatch makers.
・ In non-wristwatch components, overseas sales were brisk for automotive-related components , for medical equipment-related components. Consequently overall sales in non-wristwatch components increased year on year.
7
Wristwatch Components
Non-wristwatch Components Others Medical Air Conditioning Automotive HDD
2,000
4,000
6,000
1,652
2,269
3,922
FY2/13
1,363
2,528
3,891
FY2/14
1,900
2,924
4,824
FY2/15
1,912
3,187
5,100
FY2/16(Est.) 0
(Millions of Yen)
1,000
2,000
3,000
4,000
597
841
288
370
2,269
FY2/13
575
932
486
440
2,528
FY2/14
594
1,078
509
220
522
2,924
FY2/15
548
1,217
557
285
577
3,187
FY2/16(Est.) 0
(Millions of Yen)
170 92

Cloud Services
Operating Income by Segment
8
Operating Income Ratio
Special Products Machine Tools Precision Products
*Operating income totals exclude eliminations and corporate.
(Millions of Yen)
3,120
257
1,579
FY2/13
3,597
975
2,606
FY2/14
692
5,398
1,739
5,476
FY2/15
780
5,640
2,100
6,100
FY2/16(Est.)
4.2% 6.0%
10.7% 11.3%
140 143 -191
355 -250 0
Micro Audio Components

Capital Investment / R&D Costs 【Scheduled Main Uses of Capital Investment】
Special Products Precision Products Head Office and Others
Breakdown
Special Products Dies, etc., for new models
Machine Tools
Productive facilities for Rationalization , replacement and maintenance , etc.
Precision Products
Extension of domestic factory and expansion of production facilities, etc.
Head Office and Others Related to information systems, etc.
Machine Tools
Depreciation
Capital Investment
1,000
2,000
3,000
4,000
5,000
1,327
2,696
159 4,373
FY2/13
268
1,098
77 1,492
FY2/14 199 312
1,389
204 2,104
FY2/15
373
902
1,285
379
2,941
FY2/16(Est.) 0
(Millions of Yen)
2,371
188 48
1,742 1,885 1,924
R&D Costs (Millions of Yen)
FY2/13 FY2/14 FY2/15 FY2/16(Est.)
R&D costs 1,894 1,946 1,947 1,961
9

Balance Sheets
10
Assets Liabilities/Net assets
60
70
80
76.1% 75.5%
(%)
20,000
40,000
60,000
80,000
3,261
13,476
11,398
9,148
13,987
52,564
FY2/13
3,742
14,326
12,748
12,115
15,279
59,302
FY2/14
4,418
15,308
3,379
16,440
14,807
15,905
70,260
FY2/15
4,600
15,200
14,800
15,500
17,900
70,000
FY2/16(Est.) 0
(Millions of Yen)
2,000 1,089 1,291
Cash and deposit
Trade notes and accounts receivable
Inventories
Other current assets
Property, plant and equipment
Other fixed assets
20,000
40,000
60,000
80,000
40,710
4,269
5,281
52,564
FY2/13
45,697
5,428
5,651
59,302
FY2/14
51,902
6,560
9,179
70,260
FY2/15
51,043
8,457
6,400
70,000
FY2/16(Est.) 0
(Millions of Yen)
303
2,000
2,000
523
617
2,000 2,000
2,100
Trade notes and accounts payable Short-term debt Other current liabilities Total long-term liabilities
Total net assets
Ratio of Net Cash (to Total Assets) Equity Ratio 40
10
30
20
(%)
22.7% 22.8% 22.4% 19.8%
71.5% 72.4%

Cash Flows
11
Net cash provided by operating activities
Net cash used in investing activities
Free cash flow
(Millions of Yen)
6,000
7,000
5,000
4,000
3,000
2,000
1,000
0
-1,000
-2,000
-3,000
483
-1,424
-1,907
2,596
141
-2,455
FY2/13 FY2/14 FY2/15 FY2/16(Est.)
4,326
1,825
-2,500
6,600
4,800
-1,800

Key Financial Indicators
EPS (Earnings Per Share)
ROE (Return on Equity)
6.0%
¥54.66
(Yen)
0
30
60
90
120
FY2/13 FY2/14 FY2/15 FY2/16(Est.)
¥27.17
¥111.36 ¥116.04
2.7%
9.8% 9.7%
0
5
10
15
(%)
12

Shareholder Returns
13
Year-end Dividend Per Share Interim Dividend Per Share
DOE (Dividend on Equity)
(%)
10
20
30
40
50
(Dividend Payout Ratio 54.9%)
FY2/13
(Dividend Payout Ratio 125.1%)
FY2/14
(Dividend Payout Ratio 39.5%)
FY2/15
(Dividend Payout Ratio 39.6%)
FY2/16(Est.) 0
(Yen)
3.3% 3.4%
3.9% 3.9%
5
4
3
2
1
0
¥30 ¥34
¥44 ¥46
¥15
¥15
¥17
¥17
¥25
¥19
¥23
¥23

Medium-term Strategy
-Capture high shares in global niche markets
-Concentrate business resources on highly profitable products and markets
-Create high-value-added products
-Strengthen our sales organization in emerging markets
-Build an optimal production system by utilizing overseas production bases
- Implement business alliances and M&As to strengthen our core competencies
We aim to ensure profitability and raise growth opportunities, and steadily make sustained returns to shareholders, by optimizing the
allocation of business resources and by restructuring our businesses.
Ensure Profitability
Raise Growth
Opportunities Maintain
Soundness
-Equity ratio : 70 - 75% -Ratio of net cash (to total assets) : 20 - 25% -Enhancement of shareholder returns ・Dividend payout ratio : 40% or more ・Dividend on equity : 4.5% or more
14

Medium-term Targets
15
(100 Millions of Yen)
FY2/15 Actual FY2/16 Plan FY2/18 Targets Amount Income Ratio Amount Income Ratio Amount Income Ratio
Sales Special Products 115 129 150 Machine Tools 345 358 385 Precision Products 48 51 55 Cloud Services - - 10
Total 509 538 600
Operating Income 54 10.7% 61 11.3% 80 13.3%
Ordinary Income 61 12.1% 63 11.7% 80 13.3%
Net Income 46 9.2% 49 9.1% 60 10.0%
ROE 9.8% 9.7% 11.0%
EPS ¥111.36 ¥116.04 ¥142.09 Cash Dividends Applicable to the Year ¥44 ¥46 ¥60 DOE 3.9% 3.9% 4.5%
■Net Sales ¥60.0 billion ■Operating Income ¥8.0 billion ■Net Income ¥6.0 billion
■ROE (Return on Equity) 11% or more ■EPS (Earnings Per Share) ¥140 or more ■Shareholder Returns Consolidated Dividend Payout Ratio 40% or more
DOE (Dividend on Equity) 4.5% or more

Performance Indicators (10-Year Data)
16
Net Sales (Millions of Yen)
Operating Income
(Millions of Yen)
Ordinary Income
(Millions of Yen)
Net Income (Millions of Yen)
EPS (Yen)
ROE (%)
DOE (%)
Dividends Per Share
(Yen) Income
Ratio(%) Income
Ratio(%) Income
Ratio(%)
FY2/06 54,788 8,108 14.8 8,386 15.3 5,151 9.4 95.60 10.1 2.2 21.0
FY2/07 62,670 10,444 16.7 10,862 17.3 7,012 11.2 131.09 12.2 3.0 32.0
FY2/08 73,883 14,651 19.8 15,170 20.5 8,080 10.9 150.74 12.8 4.7 56.0
FY2/09 56,952 8,544 15.0 8,923 15.7 4,338 7.6 85.66 7.3 3.8 45.0
FY2/10 29,180 (3,984) - (3,884) - (8,555) - (187.95) - 2.2 22.0
FY2/11 35,717 1,428 4.0 1,194 3.3 161 0.5 3.71 0.4 2.5 22.0
FY2/12 41,654 3,952 9.5 4,025 9.7 2,426 5.8 56.94 6.7 3.0 26.0
FY2/13 37,858 1,579 4.2 2,254 6.0 2,299 6.1 54.66 6.0 3.3 30.0
FY2/14 43,481 2,606 6.0 3,219 7.4 1,143 2.6 27.17 2.7 3.4 34.0
FY2/15 50,957 5,476 10.7 6,150 12.1 4,695 9.2 111.36 9.8 3.9 44.0
FY2/16(Est.) 53,800 6,100 11.3 6,300 11.7 4,900 9.1 116.04 9.7 3.9 46.0

17
Reference:Business Segments and Products
POS Printer TSP100ECO
Mobile Printer SM-S210i
Special Products
Card Reader/Writer TCP300Ⅱ
Machine Tools
Wristwatch Components
Non-Wristwatch Components (Automotive, Air Conditioning, HDD and Medical Components)
Precision Products
(Automotive Components)
CNC Swiss Type Automatic Lathe SV-38R
CNC Swiss Type Automatic Lathe ST-20
CNC Swiss Type Automatic Lathe SW-12RII