Financial Requirements of urban Sanitation in india · Water and Sanitation Program: guidance note...
28
WATER AND SANITATION PROGRAM: GUIDANCE NOTE The Water and Sanitation Program is a multi-donor partnership, part of the World Bank Group’s Water Global Practice, supporting poor people in obtaining affordable, safe, and sustainable access to water and sanitation services. Financial Requirements of Urban Sanitation in India An Exploratory Analysis March 2016
Transcript of Financial Requirements of urban Sanitation in india · Water and Sanitation Program: guidance note...

Water and Sanitation Program: guidance note
the Water and Sanitation Program is a multi-donor partnership, part of the World Bank group’s Water global Practice, supporting poor people in obtaining affordable, safe, and sustainable access to water and sanitation services.
Financial Requirements of urban Sanitation in india
an exploratory analysis
march 2016

2
Financial Requirements of Urban Sanitation in India An Exploratory Analysis
AcknowledgmentsThe authors gratefully acknowledge the support provided by the Central Public Health and Environmental Engineering Organization, Ministry of Urban Development, Delhi.
The team would like to thank Almud Weitz, Regional Team Leader, Water and Sanitation Program – South Asia for her support and encouragement for the study and the report. The team further appreciates the insights and critique provided by our reviewers. Reviewers included Isabel Blackett, Christiaan Heymans from Water and Sanitation Program; Srinivasa Rao Podipireddy of the World Bank; and A.S. Bhal, Economic Advisor, Ministry of Urban Development.
The Task Team Leader for supervising the development of this Guidance Note was Joseph Ravi Kumar. Rajiv Raman was responsible for the research and drafting of the note. The responsibility of all errors and omissions rests with the drafting team.
The Water and Sanitation Program is a multi-donor partnership, part of the World Bank Group’s Water Global Practice, supporting poor people in obtaining affordable, safe, and sustainable access to water and sanitation services. WSP’s donors include Australia, Austria, Denmark, Finland, France, the Bill & Melinda Gates Foundation, Luxembourg, Netherlands, Norway, Sweden, Switzerland, United Kingdom, United States, and the World Bank. The findings, interpretations, and conclusions expressed herein are entirely those of the author and should not be attributed to the World Bank or its affiliated organizations, or to members of the Board of Executive Directors of the World Bank or the governments they represent.
© 2015 International Bank for Reconstruction and Development/The World Bank Group© 2015 Water and Sanitation Program (WSP)
www.wsp.org | www.worldbank.org/water

1
Financial Requirements of Urban Sanitation in India An Exploratory Analysis
www.wsp.org
Table of contentsExecutive Summary 3
Financial Requirements of Urban Sanitation in India 5
1. BackgRoUnd 5
Policy and Program for Urban Services 6
2. StUdy oBjEctIvE 8
3. thE modEl 9
The Working of the Model 9 Data Sources and Limitations 12
4. FInancIal REqUIREmEntS FoR URBan SanItatIon 13
Structure of Household Sanitation Arrangements 13 Wastewater Generation and Treatment 14 Projected Financial Requirements 15 Phasing of Financial Requirements 18
5. conclUSIon 19
Next Steps 19
Bibliography 20
annexes:1. Unit Costs Taken in the Model 212. A Brief Comparison with Alternate Projections 23
list of tablesES1 Investment Requirements for Urban Sanitation during FY 2013-202 (at 2011 Prices) 41. Investment Requirements for Urban Sanitation during FY 2013-32 (at 2011 Prices) 152. Distribution of Sanitation Facilities across MPCE Quintiles - Urban 17
list of Figures1. Latrine Facility Accessed by Urban Households – 2011 62. Distribution of Household Sanitation Arrangements (2011-31) 133. Projected Wastewater Volumes (in million liter per day ( MLD)) 14A1: Projected Capital Investment Requirements for Urban Sanitation (2012-32) 23
list of Box1. User Financing in Alandur, Tamil Nadu 16

2
Financial Requirements of Urban Sanitation in India An Exploratory Analysis
Abbreviations and AcronymsBSuP Basic Services for the Urban Poor
Bot Build-own-transfer
cdP City development Plan
cHeePo Central Public Health and environmental engineering organization
cPcB Central Pollution Control Board
ct Community toilet
cSP City Sanitation Plan
dRP detailed Project report
gdP gross domestic Product
goi government of india
FY Financial Year
HPec High Powered expert Committee
HSt household-sanitation-transition
iec information, education and Communication
iHSdP integrated Housing and Slum development Program
JnnuRM Jawaharlal nehru national Urban renewal mission
lpcd liter per capita per day
Mgi mcKinsey global institute
MLd million liter per day
Moud ministry of Urban development
MPce monthly Per Capita expenditure
nFHS national Family Health Survey
nSSo national Sample Survey organisation
nuSP national Urban Sanitation Policy
o&M operations and maintenance
odF open defecation Free
PPP Private Public Partnership
Pt Public toilet
RaY rajiv awas Yojana
SLB Service Level Benchmark
StP Sewage treatment Plant
uLB Urban Local Body
uidSSMt Urban infrastructure development Scheme for Small and medium towns
uig Urban infrastructure and governance
un United nations
WSP Water and Sanitation Program

3
Financial Requirements of Urban Sanitation in India An Exploratory Analysis
www.wsp.org
Executive SummaryIndia has witnessed changing trajectories of urban growth in the past and is now poised to more than double its urban population during the next 20 years. This will be one of the fastest urban transformations witnessed in history, by sheer numbers. Currently, characterized by partial provision of sewerage networks in Indian cities (covering less than a third of households), high proportion of onsite sanitation systems (septic tank systems and pit latrines, serving about 47 percent urban households), and poorly maintained public and community toilets, the sanitation situation is worrisome. It is, in fact, often cited as a cause for poor public health outcomes and also poses a danger to the country’s freshwater resources.
The Government of India signaled a response to this development and infrastructure challenge of urban India through the launch of a flagship program for urban renewal, infrastructure development, service delivery and wide-ranging urban sector reforms – Jawaharlal Nehru National Urban Renewal Mission (JNNURM) – in 2005. The JNNURM was followed by the National Urban Sanitation Policy (NUSP) in 2008 that spells out the goal of citywide safe sanitation provision. In the roll-up to the 12th Five Year Plan, a High Powered Expert Committee (HPEC), headed by Dr. Isher Judge Ahluwalia, estimated the financing requirements (report presented in 2011) for urban infrastructure services over the 2011-31 period. For this purpose, the HPEC formulated a strategy for moving sanitation in urban India to a sewer network-based one and estimated the investment requirements. At the same time, the Water and Sanitation Program (WSP), in continuation with its earlier work of reviewing the state of urban sanitation services (2008), explored an alternate trajectory, keeping in mind the mix of urban sanitation arrangements,
and examining other enabling investments that would need to be made.
This document is based on an exercise that used the 2006-11 data1 on urban sanitation arrangements to model the likely changes to household sanitation over the 2011-31 period. The model has followed the trend elements visible in the 2006 and 2011 data, and made a few assumptions to keep overall trends in line. It also uses unit cost data from projects compiled at WSP and adjusted to 2011 prices. This model was supplemented with available data on wastewater collection and treatment infrastructure, to examine the infrastructure requirements and hence investment needs. In light of the NUSP, the model also incorporated provisions for increasing household sanitation access and for the safe collection and treatment of excreta from households dependent on onsite sanitation. Provision has been made for awareness creation and capacity building of relevant stakeholders, supplementing investments in infrastructure. These are seen as necessary transition period initiatives that would need to accompany the move to an increasingly sewer network-based sanitation infrastructure, during the significant time period for its achievement.
The model indicates that following current trends, urban India will more than double – in terms of households – over the 2011-31 period, and connect an additional 89 million households to the sewer network. By 2031, households using onsite sanitation arrangements will continue to co-exist, but be relegated to about a third of the households. Wastewater collection and treatment capacities will expand to capture 74 percent and treat 86 percent of the wastewater generated. Septage facilities would progressively expand to manage the emptying and treatment of the households using toilets connected to septic tanks and pit latrines.
1 The National Family Health Survey (NFHS) data of 2006 and the Census data of 2011 have been used as they provide the best available details of household sanitation arrangements and the time period also reflects the on-ground impacts of the early years of the urban renewal mission initiatives.

4
Financial Requirements of Urban Sanitation in India An Exploratory Analysis
The projected financial requirement for the provision of urban sanitation is presented for each plan period in Table ES.1. Capital expenditure is estimated for new construction and replacements separately for community sanitation (public or community facilities), wastewater collection and treatment (sewer network and treatment plants) and for household sanitation (individual toilets including new and for the migration between technology options amongst existing). Similarly, operations and maintenance (O&M) expenditure is estimated for community sanitation and the wastewater collection and treatment components.
ConclusionThe model (Table ES1) estimates a capital requirement of INR 5,193 billion and an operating expenditure requirement of INR 2,647 billion over the 2012-32 period. The loading of capital expenditure is higher in the second five year period
(2018-22) periods, while the operating expenditure increases over the different periods.
There is a significant share of investment anticipated from the household sector – about 30 percent of the total capital expenditure – for the urban sanitation transition to happen along assumed lines.
The additional elements of community sanitation facilities and septage treatment are incorporated to achieve meaningful results during the transition period, provide alternatives to the current practice, and protect freshwater sources urgently.
Programmatic support requirements for behavior change, administration, capacity building at states and Urban Local Bodies (ULBs) and project management support for treatment facilities are estimated at about 12 percent of capital investments.
FiVe YeaR PeRiod 2013-17 2018-22 2023-27 2028-32 total
caPitaL inVeStMentS duRing FiVe YeaR PeRiodS in Million inR
new infrastructure + Replacement
Community sanitation 65,991 24,253 20,758 19,555 130,557
Wastewater collection and treatment 616,369 991,437 773,279 638,184 3,019,268
Septage collection and treatment 136,272 318,402 4,428 4,211 463,314
Household investments 365,272 402,608 424,419 387,735 1,580,034
5,193,172
o&M eXPendituRe duRing FiVe YeaR PeRiodS in Million inR
Community sanitation 77,806 38,314 14,457 8,991 139,567
Wastewater collection and treatment 363,091 574,413 782,201 777,294 2,496,999
Septage collection and treatment 3,291 7,601 105 99 11,096
2,647,662
SuPPoRt coStS duRing PLan PeRiodS in Million inR
information, education and Communication (ieC) campaign, administration, capacity building, project development and project management for waste water projects
134,888 183,839 158,242 135,841 612,811
total capital + o&M + Support 1,759,689 2,533,266 2,177,784 1,971,811 8,442,550
Source: Model estimates.
Table eS1: INvESTMENT REqUIREMENTS FOR URBAN SANITATION DURING FY 2013-202 (AT 2011 PRICES)

5
Financial Requirements of Urban Sanitation in India An Exploratory Analysis
www.wsp.org
1.
In the west, urbanization intensified with the advent of the industrial revolution. However, urbanization in the non-western world lends itself as a defining feature in the 20th century and later. The pattern of urbanization is also found to be different across the developed and developing countries, with the latter as a group displaying a predominantly rural character (World Urbanization Prospects, 2011). Across the world’s regions, South Asia is more rural and has significantly lower levels of per capita income than other regions with the exception of Africa and, not surprisingly, displays a modest pace of urbanization. However, even with low rates of urbanization, this presents enormous challenges due to the pressure on urban services that urban growth causes, often exacerbated by high poverty and inequities.
India has witnessed changing trajectories of urban growth – an annual rate of growth of 3.5 percent during the 1940s; followed by a substantially lower rates of growth in the 1950s and 1960s, attributed to the adoption of a rigorous definition of urban centers in the Census of 1961; an all-time high rate of annual growth of 3.8 percent during the 1970s; and then the deceleration in urban growth over the 1980s (3.1 percent) and 1990s (2.7 percent). The provisional population totals of the Census 2011 indicate that urban growth is picking up again – the annual rate of growth was 3.2 percent during the 2001-11 decade. About 31.2 percent of India’s population, or 377 million people, lived in urban areas in 2011 – having grown from 286 million in 2001. Indian cities have diversity in size, administrative arrangements,2 socioeconomic compositions, and are growing rapidly.
Urbanization has shown significant positive linkages with economic growth. Urban India accounted for 62 to 63 percent of the country’s Gross Domestic Product (GDP) in 2009-10. Research by McKinsey Global Institute estimates
that, by 2030, Indian cities could generate 70 percent of new jobs created, account for more than 70 percent of the GDP and drive a near four-fold increase in per capita incomes across the nation (MGI, 2010). However, this positive facet of urbanization is tainted by the poor quality of life for a substantial proportion of the population, and made worse by low service levels in sanitation.
Nearly 48 million people residing in urban India defecate in the open daily (Census of India, 2011). Urban India is characterized by partial provision of sewerage networks in Indian cities (covering less than a third of households), high proportion of onsite sanitation systems (septic tank systems and pit latrines, serving about 47 percent urban households) and poorly maintained public and community toilets. Lack of space, insecure tenure, economic barriers and scarcity of water combine with behavioral reasons, force a significant proportion of the urban poor to bear the indignity of defecating in the open. This is exacerbated by low provision of facilities for wastewater treatment, existing treatment facilities working below par, ineffective conveyance of wastewater combined with wrongful release of untreated wastewater to lakes, rivers and water bodies.
Only 200 cities/towns in India (of a total 7,933 towns according to Census 2011 of which 4,041 are statutory towns) have a partial sewerage network (MoUD, 2010) and even large cities such as Bengaluru or Hyderabad have a significant onsite sanitation provision (HPEC, 2011). According to Census 2011, 32.7 percent of the urban population (that is, 78.9 million households) had access to a piped sewer system (25.78 million households), 47 percent of the urban population relied on onsite sanitation (38.2 percent connected to septic tanks (30.09 million households), 6.4 percent connected to pit latrines (5.60 million households)
2 The HPEC recognized the different institutional realities of municipal corporations (Nagar Nigams), municipalities (Nagar Palikas) and Nagar Panchayats and thus the challenges of governance in the context of the differentiated institutional structure of the third tier.
Background
Financial Requirements of Urban Sanitation in India

6
Financial Requirements of Urban Sanitation in India An Exploratory Analysis
and the remaining3 to other onsite systems), 6 percent accessed public latrines (4.74 million households) and 12.6 percent of the urban population still defecates in the open (9.96 million households). The existing wastewater treatment infrastructure also needs attention, as treated effluents from 46 of 79 sewage treatment plants (under utility/ULB ownership), assessed by the Central Pollution Control Board (CPCB) in 2007, failed to comply with the CPCB discharge standards (CII, cited in HPEC 2011). Also, according to CPCB(CPCB, 2009), the installed sewage treatment capacity is only 30 percent of requirement, with capacity utilization of about 72 percent, thus indicating that only about 22 percent of sewage generated in urban India is treated before disposal. Similarly, a CPCB study on the Ganga water quality (2009) also found that the existing wastewater treatment (Class 1 and 2 towns) plants were capable of only treating 44 percent of the wastewater generated in these towns. The sanitation rating of 423 Class I cities done in 2009-10 by the Ministry of Urban Development (MoUD), Government of India (GoI) revealed that only 20 cities passed the receiving water quality tests.
Policy and Program for Urban ServicesMoving forward from a limited program and policy mandate for urban areas historically, that too concentrated on urban poverty alleviation schemes, GoI launched, in 2008, the National Urban Sanitation Policy (NUSP) aiming at totally sanitized, healthy and liveable urban centers sustaining good public health and environmental outcomes. It attempted to provide a roadmap for mainstreaming sanitation initiatives towards Open Defecation Free (ODF) cities and integrated citywide sanitation for universal access, safe collection and conveyance, and safe disposal/reuse after treatment of all human excreta in urban India. The policy highlighted poor awareness, existing social and occupational aspects of sanitation, fragmented approaches to sanitation service provision and the need to take cognizance of demands and preferences of households, while increasing technology options and giving due priority to reaching the unserved and the poor. While the NUSP provides an overarching framework for sanitation, GoI recognizes that sanitation is a state subject and on ground implementation and sustenance of public health and environmental outcomes requires strong state and city level initiatives (State Sanitation Strategies and City Sanitation Plans (CSPs)). Preceding the NUSP was the launch of the Jawaharlal Nehru National Urban Renewal Mission (JNNURM), urban India’s national flagship program.
The JNNURM was launched in 2005 as the national flagship program for urban renewal, infrastructure development, service delivery and wide-ranging urban sector reforms. It seeks to build the capacities of cities for management, using inherent financial and technical resources with adequate support from the states and GoI, to create and manage infrastructure for providing improved urban services. The Mission seeks to achieve the objective of integrated development of cities, for which the cities are required to formulate a City Development Plan (CDP), bringing out a long-term vision for the cities and supporting their efforts through funding of project proposals (11th Five Year Plan, GoI). The JNNURM is currently limited to 65 cities which include mega cities (seven), state capitals (17), other Class I cities with populations exceeding a million (11) and 30 other cities included for their religious or/and tourist importance.
3 The remaining households have latrines that dispose night soil to open drains or are serviced by humans/animals for night soil disposal.
4.74
2.70
5.60
30.09
25.78
9.96
FIGURe 1: LATRINE FACILITY ACCESSED BY URBAN HOUSEHOLDS – 2011
Household with latrines - WC to piped sewerHousehold with latrines - WC to septic tankHousehold with latrines - WC to pitHousehold with latrines - other on-site systemsHousehold accessing public latrinesHouseholds defecating in open
Note: Figures in the pie chart denote households in million.
7
Financial Requirements of Urban Sanitation in India An Exploratory Analysis
www.wsp.org
4 These other sources mentioned include private investments through the Private Public Partnership route and raising finances through the bond market; however, the MoUD has till date sought additional outlays from the Ministry of Finance and the Planning Commission without much success (Report of Standing Committee on Urban Development, April 2012).
The emphasis of the NUSP is on improving the efficiency of existing sanitation infrastructure and service delivery through a participatory, demand-responsive and citywide approach. Therefore, GoI continues to explore synergies of its various programs to provide assistance for funding projects proposed as part of CSPs through its schemes such as JNNURM, Urban Infrastructure Development Scheme for Small and Medium Towns (UIDSSMT), 10 percent Lump Sum for North-Eastern States, Satellite Township Scheme, and so on. The JNNURM has four components, namely:
� Urban Infrastructure and Governance (UIG) for Mission cities;
� UIDSSMT Basic Services for the Urban Poor (BSUP) for Mission cities; and
� Integrated Housing and Slum Development Program (IHSDP) for non-Mission cities.
The 11th Five Year Plan estimated the investment needs for basic urban services to be INR 1.29 trillion and postulated that 54 percent of this would come from the central sector, 27 percent from the states, 16 percent from institutions and external aid agencies, and the remaining (3 percent) through private sector investments. Of the central sector share, the Plan provided an outlay of INR 0.5 trillion over the 2007-12 period and left the balance to be covered from other sources.4 About INR 0.47 trillion is reported to have been expended over the 11th plan period (2007-12) from the central sector outlay (PC, 2011).
Of the 527 UIG projects approved, 151 pertain to water supply, 110 to sewerage and 72 to drainage. In terms of costs, water supply, sewerage and storm water drain account for 33 percent, 24 percent and 14 percent, respectively, of all approved project costs (KCS, 2011; PC Working Group Report, 2012).

8
Financial Requirements of Urban Sanitation in India An Exploratory Analysis
2.
The United Nations (UN) Urbanization Prospects report (2009) indicated that the world will become predominantly urban in a few years. The increasing interest in urban affairs (policy and praxis), the renewal mission and the shift in global economic growth towards China and India fuelled increased interest in urbanization, services and investment needs. Following the history of various committees or institutions mandated (Rakesh Mohan Committee, 1996; HUDCO, 2000) to estimate aggregate levels of total annual investment requirements for urban infrastructure, the High Powered Expert Committee (HPEC) was tasked (2008) by the Planning Commission to estimate the demand for urban infrastructural services, along with other issues relevant to the conceptualization and management of these.
In 2010, McKinsey Global Institute (MGI) brought out its report “India’s Urban Awakening,” exploring the evolution trajectory of urban India and problems/opportunities that it would need to cope with or address. The HPEC presented its analysis and recommendations in May 2011. Both these initiatives have different treatments of how they have addressed urbanization (for example, population trajectories vary) and the assumptions that have been made (per capita water supply requirements, goal of fully-sewered cities, and so on) for exploring the possible solutions and roadmaps. Both have been carried out before the publication of Census 2011 results (for household amenities), and all estimates are hinged on a composite of assumptions regarding ownership, transition possibilities and anticipated investments.
The Water and Sanitation Program’s (WSP’s) work in 2008 looking at the state of urban sanitation and environmental sanitation services (Review of Sewerage and Sanitation Intervention in Urban India, 2008) was revisited and reworked to accommodate the newer elements of data – revised norms of provision, updated/revised unit costs, population totals, and data on household amenities from Census 2011, and so on. This current body of work highlights the issue that urban
India possesses a mix of onsite and sewered sanitation systems and that a provision of sewerage networks and treatment systems would not lead to a mass shift from the user side.
Onsite sanitation systems are usually invested in by households and maintained by them through access to market service providers (for example, masons, septage collectors, and so on). Apart from state-assisted capital investments (like in the Integrated Low Cost Sanitation Scheme for the poor households), these capital investments are mostly private and from households. In the coming years, without concomitant efforts and investments in behavior change, the urban household sanitation structure will continue to exhibit a mix of different sanitation technologies and arrangements – onsite, sewered, shared/community/public and household ownership. The composition could show variation depending on the incentives provided at the city level through programmatic interventions using behavior change and market-linked approaches. The objective of this study was to review and refine earlier work on financing needs of the urban sanitation sector and, based thereon, project investment requirements for addressing the full cycle of sanitation in urban areas, that is, providing universal access (for resident households and floating populations), and for safe collection, conveyance and treatment of human excreta.
This exercise does not purport to be an exhaustive estimation, and can be said to suffer, like other studies above, from providing only an aggregative national level picture, albeit, using reasonable assumptions about unit costs, as well as the likely sectoral transformation. The picture available from detailed estimates and Detailed Project Reports (DPRs) under CSPs are likely to be different at that scale. Software and program management costs have been factored in as a percentage of the investments estimated for infrastructure creation and maintenance. A further limitation of this review is that it stops at estimating financial requirements, and does not delve into the financing sources or models.
Study Objective

9
Financial Requirements of Urban Sanitation in India An Exploratory Analysis
www.wsp.org
3.
The current model estimates investments required from household and state sectors for providing access to sanitation, and creation plus operations of the collection-transportation-treatment cycle for wastewater volumes projected over the 2012-31 period. This includes accounting for extending access to the currently unserved households; ensuring provision and access to the new additional households; and accommodating for migration of households from one technology to another (for example, from onsite septic tank to sewer connection). The model also accounts for wastewater generation, its collection and transportation (network and pumping) and treatment to disposal standards (safe treatment), and also safe collection and treatment of septage coming from households to septic tanks.
Both the HPEC and MGI models have estimated slightly differing population growth trajectories to compute investment estimates. The MGI growth model is reportedly based on underlying economic growth assumptions (and hence urbanizing population), and the sewage model driven by quantity (and hence water demand and thus population with service assumptions) and coverage (network length for population). The HPEC growth model is based on population increase in urban India trended from the 1981-2001 numbers and sewage model driven by quantity (with stated government service norms) and unit costs derived from JNNURM project database analysis. Thus, both models are predominantly driven by the population-increase behavior and directed by stated goals (that is, 100 percent coverage by access to sanitation by 2030 in the MGI model and by 2031 in the HPEC model). The current model – discussed in this paper – is also based on projected population increases (and hence households
and hence wastewater volumes), but is aligned by the household-sanitation-transition (HST) assumption. The HST is a matrix of household sanitation technologies that defines what proportion of new sanitation adopting households would choose a particular sanitation treatment technology or arrangement – septic tank, pit latrine, sewer – and what proportion of existing users are likely to migrate (for example, from septic tank to sewer). This is based on available historical data and modulated to accommodate the latrine stock trends visible over the 2006-11 period. The base scenario estimates a transition that is in line with available data from the National Family Health Survey (NFHS -2006) and Census of India (2011) for most components and modulated by the incremental adoption5 of the sewer option annually, along with similar creation of wastewater collection and treatment capacities. The Working of the Model1. Population Projection: The model uses simple linear
trend estimation (from historical data) for plotting the annual urban population over the 2012-31 period.
2. Water and Wastewater quantum: Water supply provision is kept at 135 liter per capita per day (lpcd) as per the Central Public Health and Environmental Engineering Organization (CPHEEO) norm for demand estimations and 80 percent of this is taken as the wastewater flow, following CPHEEO planning norms.
3. mix of technical options and arrangements: The sanitation technology and arrangement (use of Public Toilet (PT)/Community Toilet (CT)) and baseline number/proportion of households resorting to open defecation) is derived from NFHS (2006) and Census (2011) data, and changes estimated for the 2012-31 period, with the following assumptions:
The Model
5 This amounts to an average of 3.1 million households annually during the 12th Plan period, increasing to 5.6 million during the 15th plan period.

10
Financial Requirements of Urban Sanitation in India An Exploratory Analysis
� The new households will adopt sanitation technologies in the same proportion as the structure of toilet stock in the preceding year, for example, since the toilets connected to sewers made up 32.7 percent of the households in 2011, 32.7 percent of additional households in 2012 will adopt the sewer option;
� Keeping the additional households increment to various toilet technology categories, the transition amongst existing toilet technologies – from “pit latrine” to “septic tanks,” from “septic tanks” to “sewer,” and so on – is modulated to keep to existing trends – of decrease or increase – visible in the analysis of 2006 and 2011 data;
� It is estimated that about half of the urban population, that migrated over the preceding one year for employment or residence from rural areas, falls in the lowest four expenditure decile (NSSO, 2008), and could be assumed to be amongst the economically weaker sections. About 20 percent of urban households do not have access to safe sanitation within their premises – 12.6 percent resort to open defecation, 6 percent access public facilities and about 1.7 percent dispose excreta into drains or use service latrines (Census, 2011). There would be a need for cities to reduce the number of households resorting to open defecation (12.6 percent plus possibly half of the in-migrant poor) in the short term through the provision6 of communal/public facilities, while planning for housing and allied initiatives that would ensure movement towards individual latrines as a longer term solution. Thus, the model assumes the provision of community sanitation or public sanitation facilities during the initial period, with the need reducing over time. This will happen since BSUP and IHSDP interventions will promote a mix of communal and individual facilities (more of the former initially), achieve traction and move towards
individual sanitation arrangements in its expanded Rajiv Awas Yojana (RAY) program. Recognizing that this would require a behavior change, the NUSP advocates the need to raise community awareness and participation as a means to improve sanitation;
� A portion of existing households with sanitation access make the migration to the sewer option (about 3 percent or 2.8 million households7 in 2012 going up to 3.5 million by the end of the 12th Plan period and onwards to 6.1 million or 4 percent by 2031). This will be a reflection of a) a greater number of households becoming connected to existing sewers, and b) sewers being planned and implemented in new greenfield colonizations, and/or in existing settlements; and
� The decreasing trends observed in the stock of households with toilets connected to a “pit latrine”, “others” is maintained, as also the decreasing trend of households with no toilets. This trend of households with no access to toilets could be influenced by the pace of city sanitation plans – activated and made operational – and the provision of community facilities as discussed earlier. With a stated goal and operational plan, one could carry out a sensitivity analysis on this. At this stage that is not attempted.
4. Septage management: In light of the NUSP and advisory on septage (MoUD, 2012), the HPEC trajectories and possible initiatives during the 12th plan, it is assumed that cities would create septage treatment facilities to manage the treatment of septage from toilets connected to septic tanks. With the creation of wastewater treatment facilities in the mission cities (accounting for about 42 percent of the urban population), about 50 percent of the septage arising in urban areas is assumed to be treated at these sites, and the provision of septage treatment facilities designed for 50 percent of the remaining urban households
6 The resolution of all the tenure and economic issues is not felt possible in the short run and hence this two-step resolution.7 The NFHS (2006) data indicate 18.8 percent of urban households connected to sewers (estimated as 12.6 million households), which has increased to 25.8 million in 2011 (Census, 2011), which indicates an addition of about 2.6 million annually over the five years. Assuming that a substantial reason for this uptake is the grounding of JNNURM, the model has assumed a similar range of conversion. It is also felt that unless proactive steps are taken to ease the process of connection (household investment a major factor), connection rates could taper off and hence fewer households connecting are assumed in the 13th plan. In reality, this obstacle might play out differently with fewer conversions at the earlier stages, followed by increased connections later, but keeping to the aggregate volume over the model period.
11
Financial Requirements of Urban Sanitation in India An Exploratory Analysis
www.wsp.org
with septic tanks. This is felt adequate for handling pit-emptying and other maintenance loads arising from ‘pit latrines’ and ‘others’, as cities will also need to move concomitantly to a scheduled emptying/cleaning cycle. It is also assumed that treatment capacities would be ramped up to cover full treatment of existing septage load by the end of the 13th plan period.
5. Wastewater collection and treatment: The starting point for wastewater collection efficiency is taken as 42 percent in line with the estimates from the Service Level Benchmark pilots and treatment efficiency at 22 percent as reported by CPCB in 2009. The ramp-up of collection efficiency – a function of network coverage and connectivity – is geared to cover existing wastewater load captured by the end of the model period (2031); treatment capacities are ramped up to cover fully the wastewater arising from sewer-connected households and half of the septic tank-connected households (owing to creation of supplementary septage treatment facilities) by the end of the 2022 with even annual increments thereafter.
Other relevant assumptions made in the model are:
costs � The unit costs for onsite sanitation and community
sanitation options have been taken from field projects over 2001-06 and revised for 2011 prices by factoring8 for annual inflation @ 6.5 percent;
� The unit costs for sewerage networks and treatment have been taken from MoUD where available. The network cost (per capita) has been taken from the HPEC estimate which has been worked from JNNURM CDP data;
� The replacement costs for sewerage networks and treatment infrastructure have been taken from norms followed for design life by CPHEEO (30 years and 15 years, respectively); and
� The household, community and citywide infrastructure unit costs are detailed in Annex 1. This note has attempted to capture the financial requirements for various categories of sanitation, which include capital expenditures, operating expenditures, replacement costs and support requirements in terms of Information, Education and Communication (IEC), capacity building, and administrative requirements. Annex 1 provides the list of capital requirements for sanitation investments, which have been used in the model estimation.
growth and composition of technical optionsThe transition matrix detailing changes in household sanitation arrangements has been derived based on the following assumptions:
� The changes in household sanitation structure as of 2011 (Census 2011) have been incorporated;
� The HPEC has indicated a backlog of 65 percent uncovered (by sewers) households in urban India (and thus 35 percent households connected to sewers) based on their analysis of CDP data and Census data. The current model uses Census (2011) data, indicating a sewer connectivity of 33 percent; and
� Households with septic tank arrangements will continue to be predominant for some time. Also, survey issues with identifying pit latrines as different from septic tanks have alerted us to the need to possibly keep the composite class9 and ensure that these together account for about 48 percent. It is to be kept in mind that if JNNURM cities push for full (or high) sewer connectivity, it will only account for 42 percent of the total urban population. Keeping current trends, the model estimates that sewer connectivity will reach 63 percent by 2031. In case of a more aggressive trajectory, the anticipated outcomes could be analyzed through appropriate sensitivity analysis, which is not attempted at present.
8 The Reserve Bank of India’s estimated historical average long-term inflation rate is 7.5 percent (Mohanty, 2011). However, a conservative estimate of 6.5 percent has been taken for the model. Appropriate sensitivity analysis can be carried out for other inflation estimators.9 The households with onsite sanitation arrangements include flush/pour-flush connections to septic tanks (38.2 percent), to pit latrines (7.1 percent), other systems (1.7 percent) and with night soil serviced by humans/animals (0.5 percent) or disposed to drain (1.2 percent).

12
Financial Requirements of Urban Sanitation in India An Exploratory Analysis
OthersThe model imposes these assumptions and creates the transition matrix indicating migration amongst existing sanitation users and adoption amongst new households. With an estimated population and hence households, the model then estimates the capital investments and operations and maintenance (O&M) expenditure required for household sanitation provision (basically CT/PT provision). The household O&M of individual toilets is not captured at present.
Additionally, the model then estimates wastewater generation and thereafter calculates the capital expenditure requirements and O&M expenditure for the collection and treatment of wastewater and septage on an annual basis.
Data Sources and limitationsA simple linear projection in urban population over the 2012-31 period has been considered. Costs have been derived from field/project data10 in the case of onsite and community options, while citywide estimates are pegged at MoUD unit costs or, if not available, the unit costs derived by HPEC are used.
The current sparse data on JNNURM implementation progress, and poor data on coverage of households by sewers11 at the city levels, make the estimation of trends in sewer-adoption a difficult one. It is to be noted the Census 2011 data on households connected to sewers could bear with some caution,12 even though this is the most comprehensive source of data at present. At the current juncture, the rating of cities on sanitation and the Service Level Benchmarks (SLBs) are attempts by GoI for strengthening data collection and reporting which would help in improved planning.
10 Unit costs for onsite and community sanitation were not available from MoUD or HPEC at the time of model generation.11 At this point, we have no clear estimate of what the conversion/adoption rate would be for existing latrine owners in urban India where sewer networks are being put in place.12 A cursory examination of data for the states indicates data showing households connected to sewers in most districts of Kerala. Reportedly, the state has only two cities having working sewerage systems and hence networks. However, households connected to sewers are reported in most districts (14)!

13
Financial Requirements of Urban Sanitation in India An Exploratory Analysis
www.wsp.org
4
Structure of Household Sanitation arrangementsThe linear trend assumed with Census 2001 and 2011 provides the base scenario. With the assumptions made on technology migration and adoption and the resulting transition matrix, the projected distribution of sanitation arrangements for urban households is detailed in Figure 2.
As the number of households in urban India increase from 78.9 million in 2011 to 169 million (a factor of 2+) in 2031, the following changes are signaled by the model:
� Households using pit latrines continue to be present (owing partially to sanitation program support for poor households) and increase as a proportion from 5 million (6 percent) to 16 million (10 percent) over the 20 year period;
� Households using septic tanks are still significant and while absolute numbers show a marginal increase – from 30 million in 2011 to 37 million by 2031 – their share decreases from 31 percent in 2011 to 22 percent by 2031;
� Households using community toilets decrease as a proportion up to nearly zero by 2031 (less than 1 percent);
Financial Requirements for Urban Sanitation
FIGURe 2: DISTRIBUTION OF HOUSEHOLD SANITATION ARRANGEMENTS (2011-31)
Flush/pour flush connected to sewerFlush/pour flush connected to septic tanksPour flush connected to pit
Pour flush connected to otherHouseholds accessing community/public toilet none
2011
2012
2013
2014
2015
2016
2017
2018
2019
2020
2021
2022
2023
2024
2025
2026
2027
2028
2029
2030
2031
180
160
140
120
100
80
60
40
20
0
num
ber
of
urb
an H
ous
eho
lds
(in M
illio
n)

14
Financial Requirements of Urban Sanitation in India An Exploratory Analysis
� Households using “other” types of latrines increase marginally over the 2012-31 period, but decrease in proportion from about 3 percent in 2011 to less than 2 percent by 2031; and
� Households connected to sewers increase from 25.8 million in 2011 to 106.1 million by 2031 (a factor of 4).
Unlike the HPEC estimation which assumes conversion of urban India into a fully-sewered domain over the 2012-31 period, this scenario supposes that urban India will continue to have a mix of sanitation technologies and arrangements, with sewer connectivity reaching 63 percent by the end of the 2012-31 period, thus adding about 81 million households to this category over the period.
Wastewater Generation and TreatmentThe projected population and the incorporation of the sanitation transition and assumed water supply of 135 lpcd in the urban centers would give rise to wastewater generated
by households as detailed in Figure 3. The historical performance of collection (network) and treatment has been modulated for an improved performance during the 2012-31 period (see model assumptions, pages 3-4) to estimate the quantum of wastewater collected and treated safely.
The estimation follows the existing pattern of collection and treatment lagging generation. The total wastewater generated in urban India (which is a function of the water supply and hence population) from all households increases from 40,727 million liter per day (MLD) in 2011 to 49,199 MLD by 2017, 55,805 MLD by 2021 and 76,465 MLD by 2031. The wastewater collected (a function of network expansion and connections) increases from 17,065 MLD in 2011 to 27,994 MLD in 2017, 37,334 MLD in 2021 and 58,802 MLD by 2031. Wastewater treatment capacities,13 over the period, increase from 9,035 MLD in 2011 to 27,023 MLD in 2017, 39,622 MLD in 2021 and to 69,583 MLD by 2031.
FIGURe 3: PROJECTED WASTEWATER vOLUMES (IN MILLION LITER PER DAY (MLD))
Wastewater generated (mLd) Wasterwater Collection (mLd) Wastewater treatment Capacity (mLd)
13 Treatment capacities are assumed to increase faster than collection and conveyance, as the latter has a perceived lag due to pace of network construction and connectivity, a trend visible in the JNNURM cities currently.
2012
2013
2014
2015
2016
2017
2018
2019
2020
2021
2022
2023
2024
2025
2026
2027
2028
2029
2030
2031
90,000
80,000
70,000
60,000
50,000
40,000
30,000
20,000
10,000
0
Was
tew
ater
in M
Ld 18,662
76,465
58,802
27,023
55,805
69,583
49,199
42,031
14,640
27,994
37,334
39,622
Years
15
Financial Requirements of Urban Sanitation in India An Exploratory Analysis
www.wsp.org
It is expected that households with toilets connected to the sewer would be discharging their wastewater fully into the network, while a portion of the wastewater arising from the onsite sanitation category (pit latrines and septic tank toilets) is treated onsite. The wastewater arising from the third category of households – those that have no access to toilets, use community facilities or ‘other’ type of toilets – would be managed through the septage treatment facilities created in the interim and graduate to collection and treatment through the sewer network when the infrastructure becomes available and connected.
At present, the collection and treatment are geared – in the model – to handle the wastewater generated by households connected to the sewers and half of the wastewater arising from households with septic tanks. However, the gap between generation, collection and treatment would be fully addressed only when all households have access to sanitation facilities and these facilities are connected to the sewer network or safe onsite sanitation and complemented by adequate septage clearance and treatment facilities. It
is anticipated that the mix of onsite and network (sewer) sanitation arrangements will exist – even in the future – unless other variables that decide household connection preferences are addressed. These variables include cost and other inconvenience factors such as distance to sewer, need for significant reworking of household engineering for aligning with sewer, so on.
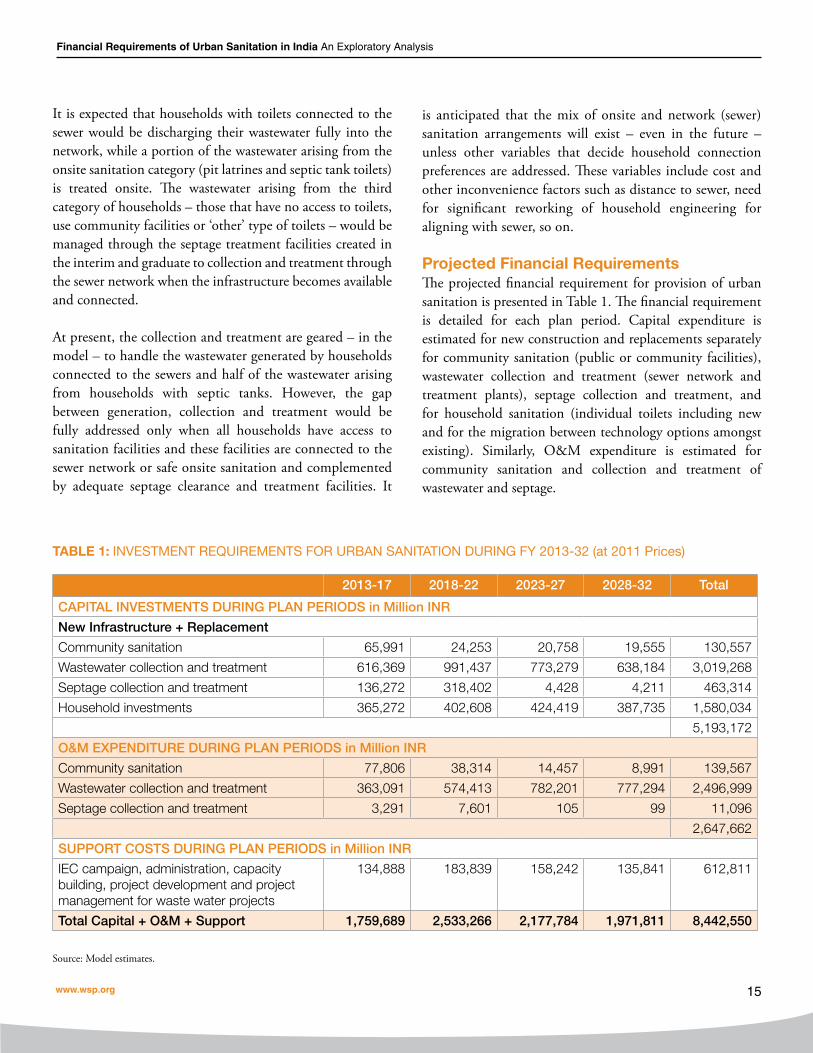
Projected Financial RequirementsThe projected financial requirement for provision of urban sanitation is presented in Table 1. The financial requirement is detailed for each plan period. Capital expenditure is estimated for new construction and replacements separately for community sanitation (public or community facilities), wastewater collection and treatment (sewer network and treatment plants), septage collection and treatment, and for household sanitation (individual toilets including new and for the migration between technology options amongst existing). Similarly, O&M expenditure is estimated for community sanitation and collection and treatment of wastewater and septage.
2013-17 2018-22 2023-27 2028-32 total
caPitaL inVeStMentS duRing PLan PeRiodS in Million inR
new infrastructure + Replacement
Community sanitation 65,991 24,253 20,758 19,555 130,557
Wastewater collection and treatment 616,369 991,437 773,279 638,184 3,019,268
Septage collection and treatment 136,272 318,402 4,428 4,211 463,314
Household investments 365,272 402,608 424,419 387,735 1,580,034
5,193,172
o&M eXPendituRe duRing PLan PeRiodS in Million inR
Community sanitation 77,806 38,314 14,457 8,991 139,567
Wastewater collection and treatment 363,091 574,413 782,201 777,294 2,496,999
Septage collection and treatment 3,291 7,601 105 99 11,096
2,647,662
SuPPoRt coStS duRing PLan PeRiodS in Million inR
ieC campaign, administration, capacity building, project development and project management for waste water projects
134,888 183,839 158,242 135,841 612,811
total capital + o&M + Support 1,759,689 2,533,266 2,177,784 1,971,811 8,442,550
Source: Model estimates.
Table 1: INvESTMENT REqUIREMENTS FOR URBAN SANITATION DURING FY 2013-32 (at 2011 Prices)
16
Financial Requirements of Urban Sanitation in India An Exploratory Analysis
Over the 2012-32 period, the financial requirement for the proposed capital expenditure (including programmatic support) makes up about INR 5,805 billion (69 percent of the total requirement including both new infrastructure and replacement of ageing infrastructure), while operating expenditure accounts for about INR 2,647 billion. In the progressive build-up of sanitation facilities, accounting for the current backlog, capital expenditure is highest during the 14th plan period (2023-27). Within the requirements for capital expenditure, the household sector is expected to invest about 30 percent of the capital expenditure requirements (towards new toilets and transition to different technologies amongst existing ones), while citywide
community sanitation provision would account for about 3 percent, and septage treatment facilities about 9 percent. The wastewater collection network and treatment systems would account for the remaining 58 percent of capital expenditure requirements.
The bulk of the operating expenditure requirement (94 percent) is accounted for by the wastewater collection network and treatment plants, while 5 percent of the O&M requirements are for the maintenance of citywide community sanitation facilities, and septage treatment accounts for less than 1 percent. The operations expenses of septage facilities are anticipated to be covered by household user charges for
bOx 1: USER FINANCING IN ALANDUR, TAMIL NADU
alandur raised equity funds from the public by way of ‘one-time deposits’ or ‘connection charges’, an average of inr 5,000 per household for the underground sewerage project. about 40 percent of the total project cost was met by raising equity contribution in this project. the state has been following a similar financial model for all the 40 sewerage projects that are being executed. on an average, about 20 percent of the project cost is raised by way of ‘public contribution’, which helps in bringing in free money to the projects resulting in a huge impact on tariffs proposed.
alandur Sewerage Project: Private Public Partnership (PPP) in Sewage treatment Plant (StP) development and Leveraging user Financing
the alandur sewerage project, initiated in 1996, is the first project in india using a PPP framework (Build-own-transfer (Bot) format) and presents a unique case in the area of PPP in the urban sanitation sector. alandur has a population of approximately 125,000, one-fourth of which lives in slums. it has developed mainly as a residential suburb of Chennai. the proposed sewerage system was to be developed for the targeted population of about 300,000 persons and had the following components: a) a sewerage network consisting of the main sewer line, branch sewer line and manholes; b) construction of a sewage pumping station; c) a StP; and d) low cost sanitation. the construction of the underground sewerage system was done through an engineering, procurement and construction contract and the StP was constructed on a Bot basis. the o&m of the sewerage system, including sewer lines,
pump houses, pumping plants, are carried out by the municipality.
However, the Bot contractor will operate and maintain the StP during the lease period of 14 years and hand it over to the municipality at the end of the lease period.
the financing of the project was done in a unique fashion through the collection of one-time deposits from users. the project mobilized one-time deposits in the form of connection charges from the citizens of alandur. Public awareness and support were sought through an extensive communication campaign. over inr 160 million or 40 percent of the project cost of inr 350 million came from such user deposits. other elements of the funding mix included loans – inr 160 million (46 percent), capital grants – inr 40 million (11 percent) and connection fees – inr 10 million (3 percent).
eventually the project connected 32,000 users and 43 percent of the slum households in the city took individual connections. over 14 Cts were also built as part of the project for urban poor. a notable feature is the tariff structure, developed on full user charge recovery with cross subsidies for the poor. the municipality collects differential user charges based on the size of the property.
While the project has faced a number of challenges, including delays in operator selection for o&m, miscommunication on separate upfront payment and connection fee, and so on, it demonstrates the scope for implementing sanitation schemes through the PPP route and offers useful lessons in this regard.

17
Financial Requirements of Urban Sanitation in India An Exploratory Analysis
www.wsp.org
the collection, transport and treatment (as practiced in cities currently). The Urban Local Bodies (ULBs) would need to find avenues for requisite funds, or have access to this quantum of funds for sustaining the community/public facilities.
The proportion of household investment to make this progress on urban sanitation is significant. While some are households that make transitions across the sanitation ladder, others are new households that build sanitation facilities. Amongst these are also the poor households who seek to access household sanitation. It is felt that the pace of progress on the city-sanitation front would depend significantly on how household investments are timed and, hence, there is the possible need to examine options for facilitating these, especially for the poor. Incentivization of access (appropriate connection charges and a user fee structure that encourages connection) would be important as is the maintenance of credibility regarding network performance and sorting out of other issues such as tenure for encouraging connection to network. Possibly, the pilot BSUP/IHSDP projects would provide useful learning. Cities in India have been experimenting with a combination of measures (see Box 1 for Alandur’s experience) to finance sanitation investments and also to generate revenue to cover the O&M expenditure.
Table 2, derived from National Sample Survey Organisation (NSSO) data (2009 survey), highlights the fact that amongst the lowest Monthly Per Capita Expenditure (MPCE) quintile of households, 33 percent are without latrines, while in the next higher quintile 20 percent of households do not have latrines. In other words, of the about 13 percent households (Census, 2011) not having a latrine, about 11 percent belong to the lowest two quintiles.
Also, the current basis of planning water supply and sewerage infrastructure, based on population and a supply norm plus the absence of any reliable estimates for groundwater use in urban India, is likely to place at risk the investment planning for city infrastructure (Planning Comm. Working Group 2012). The water flow within an urban domain is currently assumed to be a norm x population estimate. However, in reality, urban households depend significantly on groundwater directly (own well) or indirectly (through private water suppliers such as tankers, and so on). Also, cities report significant losses in distribution. So it is moot to assume that something in excess of the official water supply estimate is what is flowing within the city. What are the return flows from this water used? Seemingly, a significant proportion is recharging city groundwater and possibly also contaminating it (Hunse et al, 2011). Most cities do not have accurate estimates of households connected to the network and there are at least some households that connect toilet outlets to storm water drains. Estimates like the ones made by HPEC assume full connectivity, a possibility very much untested in the Indian context. The model findings (as also HPEC estimates) highlight the need for a large quantum of investments. However, they do suggest that a mix of options would be a reality and initiatives to address these are needed for a direction towards the overall goal of a “sanitarily safe” urban India. Adequate information on the emerging scenarios, through programmed sensitivity-analysis on such models, would provide the answer for ‘what-if ’ questions arising in planning and programmatic design and enable derisking of investments that are contingent on a “single solution” – sewer networks – and open up the need to plan and finance transition strategies (for example, community facilities, septage treatment, and so on). There are significant efforts from the household and private sector in the current
MPce Quintile class no latrine Service Pit Septic tank/Flush others all
0-20 33% 3% 11% 49% 2% 100%
20-40 20% 2% 10% 66% 1% 100%
40-60 10% 2% 11% 76% 1% 100%
60-80 4% 1% 8% 86% 1% 100%
80-100 1% 1% 3% 94% 0% 100%
all 11% 2% 8% 77% 1% 100%
Table 2: DISTRIBUTION OF SANITATION FACILITIES ACROSS MPCE qUINTILES - URBAN
Source: NSSO, 2010a.

18
Financial Requirements of Urban Sanitation in India An Exploratory Analysis
management of sanitation and wastewater and this needs to be better understood, to enable a more cohesive effort.
Phasing of Financial RequirementsThe phasing of financial requirements estimated by the model over the plan periods predicates a steady movement towards sanitation provision and creation of network and treatment infrastructure. The anticipated investments total INR 7,562 billion over the 20-year period, with public investment coming to about INR 5,982 billion. Of the total investment, 20 percent of the investments are anticipated in the 12th Plan period, 26 percent in the 13th plan period, 29 percent in the 14th plan period and another 26 percent in the 15th plan period. While the capital expenditure portion increases over the 12th to 14th plan periods and then reduces, the operating expenditure estimate increases over the four plan periods.
At the time of the launch of the national government’s flagship program, the JNNURM, the government had committed to an investment outlay of INR 660,850 million over a seven-year period. At the end of the seven year period, allocations fell short of this commitment, and totaled up to INR 451,006 million (68 percent of commitment). Program management bottlenecks leading to delays in fund release and
low completion rate of projects at the urban centers have been reported as the major reasons (CPR, 2013). The anticipated capital investment requirements (including programmatic support) over the plan periods during the 2012-32 period start with a comparable but higher investment of INR 697,947 during the 12th plan period, increasing by about a third through the next two plan periods before decreasing in the last plan period. Considering the need to sustain and complete works taken up, the history of lower fund utilization and, hence allocation, will need to be addressed. The financial reforms underway in the ULBs and in the fund transfer mechanisms to ULBs will also need to take account of the increasing expenditure on O&M envisaged over the period.
However, going by the goals assumed by the HPEC, this could be accelerated (finishing the backlog of sanitation investments by 2021) and the fact that city infrastructure investments is likely to approximate a step function (due to economic capacities of STPs), appropriate scenario analysis of possible trajectories could be indicative of different phasing of investments needed. In such scenario analysis, the gross investment estimate is not expected to change; however, the time periods of investments could.

19
Financial Requirements of Urban Sanitation in India An Exploratory Analysis
www.wsp.org
5.
� The model estimates a capital requirement of INR 5,193 billion and an operating expenditure requirement of INR 2,647 billion over the FY 2012-32 period. Capital expenditure is higher in the 12th to 14th plan periods, while the operating expenditure increases over the different plan periods;
� These investments in infrastructure and operations enable increased access to sewer-based networks by almost a factor of four (increasing from 26 million households in 2011 to 106 million households in 2031), and decrease the number of households without access to household sanitation from about 10 million households to 0.3 million households;
� There is a significant share of investment anticipated from the household sector – about 30 percent of the capital expenditure;
� The additional elements of community sanitation facilities and septage treatment need to be stressed to achieve meaningful results during the transition period,
provide alternatives to the current practice, and protect freshwater sources urgently; and
� Possible variations could arise from the trajectory of sewer-adoption followed and hence is dependent on the approach
Next Steps � As programmatic costs shall need to be added to
these estimates to cover for the softer aspects of ULB capacity building, ULB-citizen interfaces, incentives (financial and others), it is desirable that a set of programmatic approaches be defined by inputs and outcomes; and the resultant activities estimated for cost and time to incorporate into alternate scenarios in this model; and
� Sensitivity analysis for the key inputs – population, unit costs (and hence inflation estimate) – and scenario-building for different trajectories can be developed and would assist in program design.
Conclusion

20
Financial Requirements of Urban Sanitation in India An Exploratory Analysis
CPR. 2013. Budget Briefs – JNNURM. Accountability Initiative. Centre for Policy Research, New Delhi. Vol. 5, Issue 7, March 2013.
GoI. 2007. Eleventh Five Year Plan. Chapter 11 - Urban Infrastructure, Housing, Basic Services and Poverty Alleviation. Planning Commission.
HPEC. 2011. Report on Indian Urban Infrastructure and Services. The High Powered Expert Committee (HPEC) for Estimating the Investment Requirements for Urban Infrastructure Services. Chair: Dr. Isher Judge Ahluwalia.
Hunse, T.M. et al. 2011. Hydrogeological mapping of Bangalore city. Memoir of the Geological Society of India. No. 79. 2011. Editor: Subhajyoti Das. pp. 77-103.
Lok Sabha.2012. Report of the Standing Committee on Urban Development. Lok Sabha Secretariat, New Delhi.
Mohanty, Deepak. 2011. Changing Inflation Dynamics in India. Speech by Mr. Deepak Mohanty, Executive Director, Reserve Bank of India, delivered at the Motilal Nehru National Institute of Technology (MNNIT), Allahabad on August 13, 2011.
Ministry of Finance. 2007-2013. India Budget, Expenditure Budget, Vol. 1, Central Plan Outlay for States and UTs. Different Years. Available online at: www.indiabudget.nic.in
MoUD. n.d. Report of the Committee set up to frame National Sustainable Habitat Standards for the Urban Water
Supply and Sewerage sector. Ministry of Urban Development, Government of India. New Delhi.
MoUD. 2011. Unit Costs for Water Supply and Sewerage Projects.
NSSO. 2008. Migration in India, 2007-2008. NSS 64th Round (July 2007-June 2008). National Sample Survey Office, National Statistical Organisation, Ministry of Statistics and Programme Implementation, Government of India.
NSSO. 2010a. Housing Condition and Amenities in India, 2008-09. NSS 65th Round (July 2008-June 2009). National Sample Survey Office, National Statistical Organisation, Ministry of Statistics and Programme Implementation, Government of India.
NSSO. 2010b. Some Characteristics of Urban Slums, 2008-09. NSS 65th Round (July 2008-June 2009). National Sample Survey Office, National Statistical Organisation, Ministry of Statistics and Programme Implementation, Government of India.
Plannning Commission. 2012. Report of the Working Group on Urban and Industrial Water Supply and Sanitation for the Twelfth Five-Year Plan (2012-17). Planning Commission, New Delhi.
Planning Commission. 2012. Report of the Working Group on Financing Urban Infrastructure for the Twelfth Five-Year Plan (2012-17). Planning Commission, New Delhi.
Bibliography

21
Financial Requirements of Urban Sanitation in India An Exploratory Analysis
www.wsp.org
annex 1
a. HouSeHoLd unit coStS (in inR)
adapted from WSP (2005), adjusted for 2011
adopted unit costs - caPeX per Household
1 Pit Latrine 13,894
2 WC with Sewer Connection (a+d+e) 10,926
3 WC with Septic tank (a+d+F) 22,293
4 Sewer Connection 3,570
5 Upgrade existing Service/other Latrine to Sewer 4,858
6 Upgrade existing Service/other Latrine to Septic tank 16,225
7 Upgrade existing PF Latrine to Sewer 4,677
8 Upgrade existing Service/other latrine to Pit Latrine 5,756
note:1 Unit cost for base year = initial cost + (base year - estimation year) * 6.50 % * initial cost
2 Average family size assumed as 5 persons per household
B. coMMunitY inFRaStRuctuRe coStS
adapted from WSP (2005), refer aa29, adjusted for 2011
adopted unit costs - caPeX per Household
1 Community toilet Block 7,585
2 Septage treatment Plant 597 inr/HH
adopted unit costs - oPeX per Household
1 Community toilet Block 1,834
Replacement costs after useful Life
1 Ct - Useful Life factor 5%
2 replacement CaPeX per Household 7,585
c. citY-Wide aSSetS
SeWeRage
adopted unit costs - caPeX per Household Moud norm HPec estimate
1 Comprehensive Sewerage Project (network+pumping+treatment) 19,980 20,935
2 network including Pumping 13,820
3 StP only 3,649 7,165
Unit Costs Taken in the Model
Contd...

22
Financial Requirements of Urban Sanitation in India An Exploratory Analysis
adopted unit costs - caPeX per MLd
1 Comprehensive sewerage project (network+pumping+treatment) 33,300,000
2 network including pumping 27,218,000
3 StP only 6,082,000
adopted unit costs - oPeX per Household/Year Moud norm HPec estimate
1 Comprehensive sewerage project (network+pumping+treatment) 1,565
2 network including pumping
3 StP only
adopted unit costs - oPeX per MLd/Year
1 network including pumping 1,204,500
2 treatment (StP) 1,971,000
Replacement costs after useful Life (as percentage of capex)
1 network useful life (averaged 20 years) factor 4%
2 treatment useful life (15 years) factor 6.67%
other costs (as percentage of caPeX)
ieC campaigning (includes public consultations) 4%
administration, training & capacity building and project development 7%
Project management (includes appointing consultants for project management (PmC) for waste water projects only)
2%

23
Financial Requirements of Urban Sanitation in India An Exploratory Analysis
www.wsp.org
a brief Comparison with alternate ProjectionsA brief comparison of the model scenario with the HPEC and MGI estimates is provided in Figure A1.
Note: The model’s estimate includes a household sector investment of INR 1,580 billion and is estimated at 2011 prices. The other estimates project a total investment for sanitation infrastructure and do not explicitly mention
annex 2
FIGURe a1: PROJECTED CAPITAL INvESTMENT REqUIREMENTS FOR URBAN SANITATION (2012-32)
Capital investment Household investment
6,000,000
5,000,000
4,000,000
3,000,000
2,000,000
1,000,000
0WSP Estimate HPEC Estimate MGI Estimate
inve
stm
ent
estim
ate
in m
illio
n R
upee
s
household investments. Also, HPEC estimates are factored at 2009 prices, while the MGI estimate is based on 2008 prices and a currency conversion rate of US$1 = INR 46.
Also, the model’s estimate is based on a household-transition between technology options built on historical data and trended for increased connectivity to sewers. The HPEC and MGI models seem to aim for full sewer connectivity over the 20-year period.
1,580,034
3,613,139
2,426,884 2,438,000

Notes:


Water and Sanitation ProgramThe World BankHindustan Times House18-20, Kasturba Gandhi Marg, New Delhi 110001, India
Telephone: (91-11) 41479301, 49247601 E-mail: [email protected] www.wsp.orgworldbank.org/water@WorldBankWater