Financial Repression in Transition Output Reduction and Hyperinflation in the Formerly Soviet...
23
Financial Repression in Transition Output Reduction and Hyperinflation in the Formerly Soviet Economies UNC-MGIMO Seminar, 27 April 2001
-
Upload
jasmine-jennings -
Category
Documents
-
view
217 -
download
1
Transcript of Financial Repression in Transition Output Reduction and Hyperinflation in the Formerly Soviet...

Financial Repression in Transition
Output Reduction and Hyperinflation in the Formerly
Soviet Economies
UNC-MGIMO Seminar, 27 April 2001

Thesis Financial Repression contributed to the
output reduction and hyperinflation observed in the former Soviet economies in the 1990s.
Sustainable recovery from this depression requires governments in these economies to follow policies that eliminate financial repression.
Definition: Financial Repression
In financial repression, artificially low quantities of saving are channeled into the formal banking system.
This is the outcome of policies that artificially limit the interest rate offered to depositors in that system or threaten the security of deposits there.
Definition: Sustainable Recovery
A sustainable recovery is characterized by non-inflationary economic growth not reliant upon foreign saving for its continuation.
Foreign saving is the purchase of domestic debt and equity by foreign nationals: it is the counterpart of a current-account deficit.
Testing the thesis
First: demonstrate the logical consistency of the argument in a theoretical model.
Second: test the predictions of the model econometrically for Ukraine.

Theoretical building blocks Output depends upon the cost and
availability of credit. The saving (non-consumption) choice
depends upon the real interest rate on saving instruments and the real value of accumulated wealth.
Financial repression reduces desired saving and credit availability: output falls as firms are rationed, hyperinflation follows as saving is induced.

PE
FE
nn*
*
Equilibrium without Financial Repression

Inflationary Consequences of Financial Repression
With excess demand for saving, the real interest rate will rise.
The government has another tool to raise saving. It can induce saving by lowering the value of accumulated wealth. Inflation does this.

Financial Equilibrium for Earmarked Instruments
HH
at-1/(1+ t)
DD
t*
0 at-1/(1+ t)*

Inflation/Output Dynamics
HH
at-1/(1+ t)
DD
o= v
0
ii
Bv
ao
i
iii
Bii
Bi
Biii
i
rii
rv
B
DRri
ii
’

Financial Fragmentation: the Foreign Exchange
Market
HH
q
*
v
0
’
SS
qvq*
45o
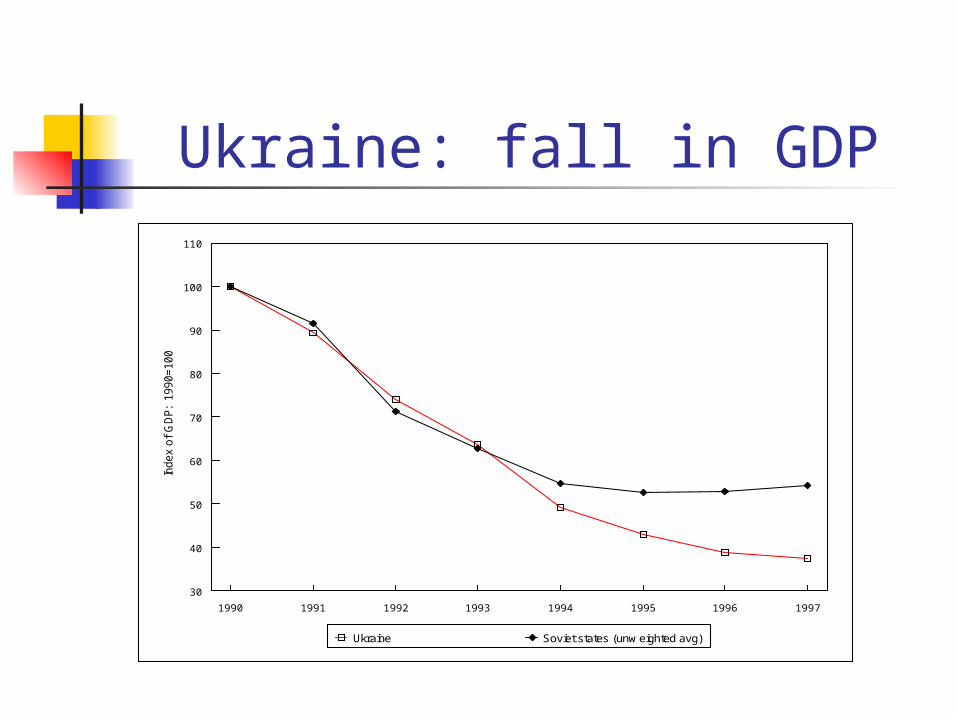
Ukraine: fall in GDP
30
40
50
60
70
80
90
100
110
Index o
f G
DP: 1
990=100
1990 1991 1992 1993 1994 1995 1996 1997
Ukraine Soviet states (unw eighted avg)

Ukraine: Hyperinflation
0
500
1000
1500
2000
2500
3000
3500
4000
4500
5000
Perc
ent A
nnua
l Inf
latio
n R
ate
1991 1992 1993 1994 1995 1996 1997
Ukraine Soviet states (unw eighted avg)
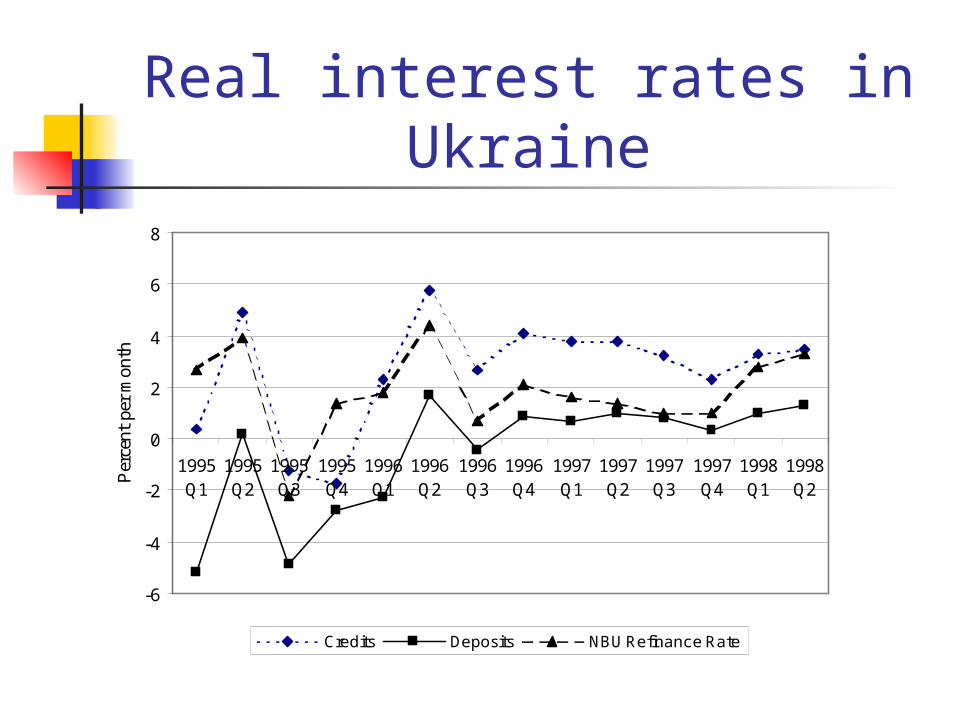
Real interest rates in Ukraine
-6
-4
-2
0
2
4
6
8
1995Q1
1995Q2
1995Q3
1995Q4
1996Q1
1996Q2
1996Q3
1996Q4
1997Q1
1997Q2
1997Q3
1997Q4
1998Q1
1998Q2P
erce
nt p
er m
onth
Credits Deposits NBU Refinance Rate

Output depends on credit availability
GDP Function Regression Results
(Quarterly data, 1993/1 to 1998/3)
Dependent variable: ln(yt)
Intercept -4.14 -1.71
(0.88) (0.72)
ln(Wt-1/Pt-1) 0.60 0.44
(0.10) (0.14)
ln(Ryt) 0.90 0.62
(0.12) (0.14)
ln(CRt)* 0.24(0.10)
ln(CRt-1/PBt-1) 0.11
(0.03)
R2 0.85 0.92
F(.) 30.32 59.65
N 19 19
* – Treated as simultaneously determined variable. Instruments include lagged endogenous variables, budget deficit, and exogenous regressors in these equations.

Inflation to induce saving
Dependent variable: t
Intercept -118.04 -106.20
(50.17) (49.93)
t-1 -4.53 -4.35
(3.27) (3.21)
at-1 3.19 2.51
(1.04) (1.13)
µt ---- 0.50
(0.36)
R2 0.36 0.41
F(x,23-x) 5.88 4.70
N 23 23
For the F statistic, x=2 for the first equation and x=3 in the second equation. Standard errors
in parentheses.

Saving Allocation Responded to Real-interest-rate movements
Household portfolio decisions show significant support for theory. (Table 4)
Enterprise portfolio decisions follow quite different incentives.
The role of foreign-currency denominated instruments is also in line with theory. (Table 5)

Sustainable Growth?
-1000
-750
-500
-250
0
250
500
750
1000
1/1995
3/1995
1/1996
3/1996
1/1997
3/1997
1/1998
3/1998
1/1999
3/1999
mill
ions
USD
Net foreign investment Net increase in FX reserves
Conclusions to paper Financial repression is
demonstrated as a logically consistent cause of both output reduction and hyperinflation.
Evidence from Ukraine supports this thesis.

Financial Repression and the Financial Crisis of 1998 Was the non-inflationary growth in
Russia and Ukraine prior to August 1998 sustainable?
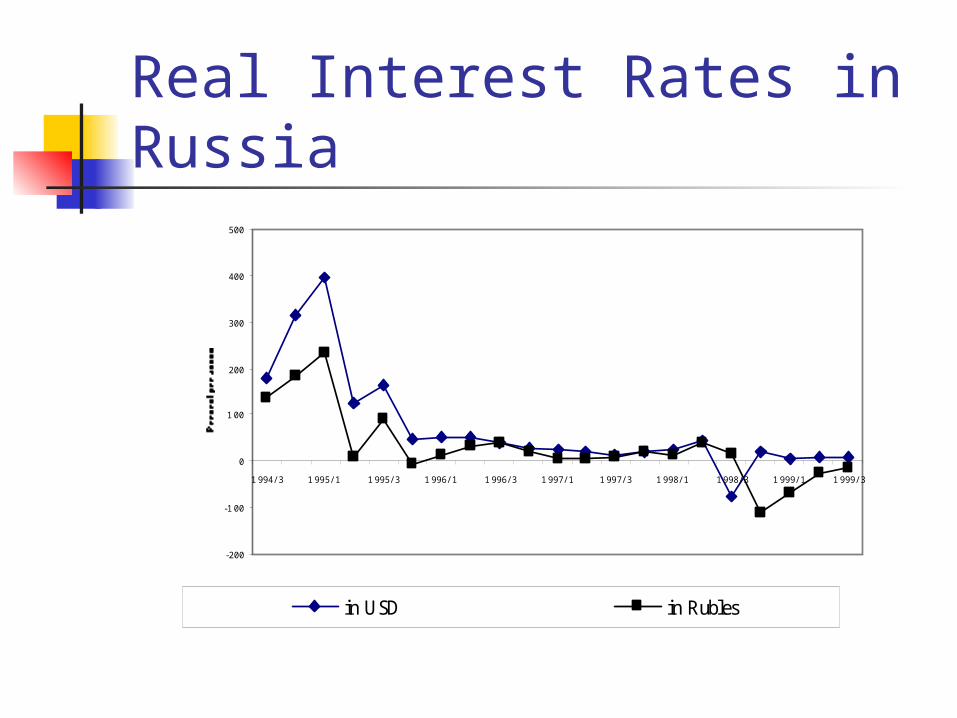
Real Interest Rates in Russia
-200
-100
0
1 00
200
300
400
500
1 994/ 3 1 995/ 1 1 995/ 3 1 996/ 1 1 996/ 3 1 997/ 1 1 997/ 3 1 998/ 1 1 998/ 3 1 999/ 1 1 999/ 3
in USD in Rubles

Sustainable Growth in Russia?
0
5000
10000
15000
20000
25000
1993/ 4 1994/ 2 1994/ 4 1995/ 2 1995/ 4 1996/ 2 1996/ 4 1997/ 2 1997/ 4 1998/ 2 1998/ 4 1999/ 2 1999/ 4
Total FX reserves IMF Credit/Loans Outstanding

Russian Borrowing at the IMF
0
500
1000
1500
2000
2500
3000
3500
4000
4500
5000
1992 1993 1994 1995 1996 1997 1998 1999 2000
mill
ion
s o
f S
DR
s
Disbursed by IMF Russian repurchases