Financial Report - uco.rutgers.edu Fiscal Year... · Kate Sweeney Anne M. Thomas, Emerita Edgar...
75
- i - Financial Report 2015-2016
Transcript of Financial Report - uco.rutgers.edu Fiscal Year... · Kate Sweeney Anne M. Thomas, Emerita Edgar...

- i -
Financial Report 2015-2016

- ii -

- iii -
Table of Contents
Governors and Trustees ........................................................................................................................................................... iv
Letter from the Executive Vice President for Finance and Administration, and University Treasurer ................................ 1
Independent Auditors’ Report ................................................................................................................................................. 2
Management’s Discussion and Analysis (unaudited) .............................................................................................................. 5
Basic Financial Statements
Statements of Net Position ............................................................................................................................................. 18
Statements of Revenues, Expenses, and Changes in Net Position ............................................................................... 20
Statements of Cash Flows ............................................................................................................................................... 22
Notes to the Financial Statements
1. Summary of Significant Accounting and Reporting Policies ........................................................................... 24
2. Adoption of Accounting Pronouncements ....................................................................................................... 28
3. Cash and Cash Equivalents and Investments ................................................................................................... 29
4. Accounts Receivable and Allowance for Doubtful Accounts ........................................................................... 37
5. Net Patient Service Revenues ............................................................................................................................ 38
6. Capital Assets ..................................................................................................................................................... 39
7. Accounts Payable and Accrued Expenses .......................................................................................................... 40
8. Noncurrent Liabilities ........................................................................................................................................ 40
9. Commercial Paper .............................................................................................................................................. 41
10. Long-Term Liabilities ......................................................................................................................................... 42
11. Derivative Financial Instruments ...................................................................................................................... 48
12. Commitments .................................................................................................................................................... 50
13. Natural Expenses by Functional Classification ................................................................................................. 51
14. Employee Benefits .............................................................................................................................................. 53
15. Compensated Absences ..................................................................................................................................... 59
16. Risk Management ............................................................................................................................................... 60
17. Contingencies ..................................................................................................................................................... 61
18. One Washington Park ....................................................................................................................................... 61
19. Component Unit – Rutgers University Foundation ........................................................................................ 62
20. Component Unit – University Physician Associates of New Jersey, Inc. and Affiliate ................................... 67
Required Supplementary Information (unaudited)
Schedules of Employer Contributions ........................................................................................................................... 70
Schedules of Proportionate Share of the Net Pension Liability ................................................................................... 70
University Administrative Officers ......................................................................................................................................... 71

- iv -
Governors and Trustees During the Year Ended June 30, 2016 Board of Governors Greg Brown, Chair Kenneth M. Schmidt, Vice Chair Mark A. Angelson Robert L. Barchi, ex officio Dorothy W. Cantor Margaret T. Derrick Lora L. Fong Mark P. Hershhorn Susan M. McCue
Martin Perez Joseph M. Rigby Dudley H. Rivers, Jr. Richard W. Roper Sandy J. Stewart Candace L. Straight William M. Tambussi Ann B. Gould, Faculty Representative
Samuel Rabinowitz, Faculty Representative Alexandra M. Williams, Student Representative OFFICERS OF THE BOARD J. Michael Gower, Treasurer Kimberlee M. Pastva, Interim Secretary
Board of Trustees
Frank B. Hundley, Chair William E. Best, Vice Chair Heather C. Taylor, Vice Chair Michael W. Azzara Rahn Kennedy Bailey Robert L. Barchi, ex officio Felix M. Beck, Emeritus Gregory Bender Dominick J. Burzichelli John Herbert Carman, Emeritus Peter Cartmell, Emeritus Mary J. Chyb, Emerita Kevin J. Collins, Emeritus Hollis A. Copeland Anthony J. Covington Alan M. Crosta, Jr. Steven M. Darien Marisa A. Dietrich Carleton C. Dilatush, Emeritus Mary I. DiMartino Teresa A. Dolan James F. Dougherty Norman H. Edelman Robert P. Eichert, Emeritus Jeanne M. Fox, Emerita Ronald J. Garutti
Ronald W. Giaconia, Emeritus Rochelle Gizinski, Emerita Evangeline Gomez Leslie E. Goodman, Emeritus M. Wilma Harris Robert A. Hering, Emeritus Carleton A. Holstrom, Emeritus Paul B. Jennings, Emeritus Nimesh S. Jhaveri Roberta Kanarick Tilak Lal Robert A. Laudicina, Emeritus Walter L. Leib, Emeritus Richard A. Levao, Emeritus Jennifer Lewis-Hall Debra Ann Lynch Duncan L. MacMillan, Emeritus Rashida V. MacMurray-Abdullah Amy B. Mansue Robert E. Mortensen Patricia Nachtigal, Emerita Gene O'Hara, Emeritus Dean J. Paranicas, Emeritus Daniel J. Phelan Jose A. Piazza George A. Rears Norman Reitman, Emeritus
James H. Rhodes Alejandro Roman Carole Sampson-Landers Richard H. Shindell Susan Stabile Dorothy M. Stanaitis, Emerita Robert L. Stevenson, Emeritus Abram J. Suydam, Emeritus Kate Sweeney Anne M. Thomas, Emerita Edgar Torres Michael R. Tuosto, Emeritus Ronald D. Wilson Asha Samant, Faculty Representative Menahem Spiegel, Faculty Representative Diana Gonzalez, Student Representative Christina G. McGinnis, Student Representative OFFICERS OF THE BOARD J. Michael Gower, Treasurer Kimberlee M. Pastva, Interim Secretary

- 1-
Executive Vice President for Finance and Administration and University Treasurer [email protected] Rutgers, The State University of New Jersey Phone: 848-932-4300 83 Somerset Street – Room 305 Fax: 732-932-4273 New Brunswick, New Jersey 08901-1281
November 28, 2016
President Robert L. Barchi
The Board of Governors
The Board of Trustees
of Rutgers, The State University of New Jersey
I am pleased to submit the Annual Financial Report of Rutgers, The State University of
New Jersey for the year ended June 30, 2016, the third year following the consolidation with units
formerly part of the University of Medicine and Dentistry of New Jersey. The report contains the
KPMG LLP Independent Auditors’ Report on the university’s financial statements. The financial
information presented in this report is designed to assist the reader in comprehending the scope of the
university’s use of resources in meeting its primary missions of instruction, research, public service,
and healthcare.
The report sets forth the complete and permanent record of the financial status of the university
for the year.
Respectfully submitted,
J. Michael Gower
Executive Vice President for Finance
and Administration, and University Treasurer

- 2 -
KPMG LLP is a Delaware limited liability partnership, the U.S. member firm of KPMG International Cooperative (“KPMG International”), a Swiss entity.
- 3-
- 4 -

- 5-
Management’s Discussion and Analysis (unaudited) June 30, 2016 The following management’s discussion and analysis (MD&A) provides a comprehensive overview of the financial position of Rutgers, The State University of New Jersey (the university) at June 30, 2016 and 2015, and its changes in financial position for the fiscal year then ended with fiscal year 2014 data presented for comparative purposes. Management has prepared the basic financial statements and related footnote disclosures along with this MD&A in accordance with generally accepted accounting principles as defined by the Governmental Accounting Standards Board for public colleges and universities. This MD&A should be read in conjunction with the audited financial statements and related footnotes of the university, which directly follow the MD&A. In fiscal 2016, the financial reporting entity of Rutgers included 34 degree granting schools, of which 25 offered graduate programs of study with over 67,000 students enrolled in these programs. These schools are located at Rutgers University–New Brunswick, Rutgers University–Newark, and Rutgers University–Camden. Rutgers Biomedical and Health Sciences, a division within Rutgers, is closely aligned with Rutgers University–New Brunswick. The university also maintains educational services in many other communities throughout the State of New Jersey. The university operates research and institutional facilities on 6,088 acres in all 21 counties and 78 municipalities. The university’s financial report includes three basic financial statements: the Statement of Net Position, the Statement of Revenues, Expenses, and Changes in Net Position, and the Statement of Cash Flows. These statements focus on the financial condition of the university, the changes in financial position, and cash flows of the university’s business type activities as a whole rather than the accountability of funds. The financial statements also include the financial activity of the units of the New Market Tax Credit (NMTC) Transaction (One Washington Park), which include One Washington Park Capital, LLC, RUN Investments, LLC, and One Washington Park Holdings, LLC. The One Washington Park units provide financing services to the university classifying it as a component unit blended with those of the university. The financial statements for the Rutgers University Foundation (the foundation) and University Physicians Associates of New Jersey, Inc. and Affiliate (UPA) are presented discretely. The foundation was formed to aid the university in obtaining private funds and other resources to meet the needs and achieve the goals of the university. UPA supports Rutgers Biomedical and Health Sciences through administrative assistance to clinical faculty of the New Jersey Medical School. Financial Highlights The university’s financial condition at June 30, 2016 improved modestly with an increase in net position of $101.0 million. Total operating revenues increased by $93.3 million, or 3.9%, with increases of 5.0% in net student tuition and fees, 3.7% in auxiliary net revenues, 3.1% in net patient service revenues, 25.5% in other operating revenues, and a decrease of 1.7% in grant and contract revenue. Operating expense increased by $102.4 million, or 3.0%, while net non-operating revenues decreased by $42.2 million, or 4.2%, primarily as a result of a decrease in fair value of investments. The university was required to reduce its beginning balance in net position by $1,280.5 million to reflect the cumulative effect of the pension liability through 2014. Total net position was therefore restated as of July 1, 2014, to $1,787.9 million. As a result, the university’s net position increased through fiscal 2015 by $126.6 million to $1,914.5 million as of June 30, 2015. The university’s total operating revenues amounted to $2,402.6 million in fiscal 2015. The major components of operating revenues are student tuition and fees (net of scholarship allowances) of $863.1 million, grant and contracts revenues of $584.9 million, and net patient service revenues of $518.0 million. As the State University of New Jersey, the appropriation from the State represents a vital part of the university’s funding. In fiscal 2016, the State appropriations, including fringe benefits paid directly by the state, decreased slightly. In fiscal 2015, the state maintained the base appropriation as constant. Tuition revenue is another significant source of funding for the university. In fiscal 2016, in addition to an increase in tuition rates averaging 3.6% (3.0% in 2015), enrollment was at its highest with 67,556 students (66,013 students in 2015). State appropriations, as well as contributions, investment income, and governmental student aid, are shown as non-operating revenue.

- 6 -
As presented in the chart below, net student tuition and fees, state appropriations, grants and contracts revenue and net patient service revenues are the primary sources of revenue for the university.
Statement of Net Position The Statement of Net Position presents the financial position of the university at the end of the fiscal year and includes all assets (current and noncurrent), deferred outflows of resources, liabilities (current and noncurrent), deferred inflows of resources, and net position (the difference between total assets, deferred outflows of resources, total liabilities, and deferred inflows of resources) of the university. Current assets are classified as such if they are available to satisfy current liabilities, which are generally defined as being due within one year of the date of the statement of net position. Net position is one indicator of the financial condition of the university, while the change in net position is an indicator of whether the overall financial condition has improved or worsened during the year.
Student Tuition and Fees, net, 25.5%
State Appropriations, 21.9%
Grants and Contracts Revenue, 16.2%
Auxiliary Enterprises, 9.0%
Net Patient Service Revenues, 15.1%
Governmental Student Aid, 5.3%
Investment Income, 0.7%
Other, 4.9% Contributions, 1.4%

- 7-
A summarized comparison of the university’s assets, deferred outflows of resources, liabilities, deferred inflows of resources, and net position at June 30, 2016, 2015, and 2014 is as follows (dollars in thousands):
2016
GASB 68 Adjustment
2016 Net of GASB 68
2015
GASB 68 Adjustment
2015 Net of GASB 68
2014
Assets Current assets $1,191,125)
$ —)
$1,191,125)
$1,240,318)
$ —)
$1,240,318)
$1,274,310)
Noncurrent assets Endowment,
restricted and other noncurrent cash and investments 1,319,456)
—)
1,319,456)
1,350,224)
—)
1,350,224)
1,415,327)
Capital assets, net 3,439,243)
—)
3,439,243)
3,235,141)
—)
3,235,141)
3,051,175)
Other assets 117,161)
—)
117,161)
126,989)
—)
126,989)
128,957)
Total Assets 6,066,985)
—)
6,066,985)
5,952,672)
—)
5,952,672)
5,869,769)
Deferred Outflows of Resources 379,367)
(245,778)
133,589)
171,594)
(73,845)
97,749)
97,582)
Total Assets and Deferred Outflows of Resources 6,446,352)
(245,778)
6,200,574)
6,124,266)
(73,845)
6,050,421)
5,967,351)
Liabilities Current liabilities 633,296)
—)
633,296)
598,164)
—)
598,164)
653,819)
Noncurrent liabilities 3,752,206)
(1,644,741)
2,107,465)
3,543,956)
(1,354,656)
2,189,300)
2,245,178)
Total Liabilities 4,385,502)
(1,644,741)
2,740,761)
4,142,120)
(1,354,656)
2,787,464)
2,898,997)
Deferred Inflows of Resources 45,342)
(45,342)
—)
67,660)
(67,660)
—)
—)
Net Position Net investment in
capital assets 1,601,474)
—)
1,601,474)
1,457,539)
—)
1,457,539)
1,351,416)
Restricted - nonexpendable 582,007)
—)
582,007)
563,890)
—)
563,890)
548,115)
Restricted - expendable 471,944)
—)
471,944)
470,931)
—)
470,931)
460,048)
Unrestricted (639,917)
1,444,305)
804,388)
(577,874)
1,348,471)
770,597)
708,775)
Total Net Position (Deficit) $2,015,508)
$1,444,305)
$3,459,813)
$1,914,486)
$1,348,471)
$3,262,957)
$3,068,354)
Current Assets and Current Liabilities Current assets include unrestricted and restricted cash and cash equivalents, investments that mature within one year, receivables, inventories and other short-term assets. Noncurrent assets include unrestricted investments that mature in more than a year, as well as cash and cash equivalents and investments that are restricted by donors or external parties as to their use. Receivables deemed to be collectible in more than a year are also included as noncurrent. Current assets decreased $49.2 million in 2016 and $34.0 million in 2015, primarily as a result of investments held by trustees decreasing in both years.

- 8 -
Deferred outflows of resources are the consumption of net position that is applicable to a future reporting period. In 2016 and 2015, deferred outflows of resources increased $207.8 million and $74.0 million, respectively, primarily as a result of the adjustment for GASB 68. Without this adjustment, deferred outflows of resources decreased $38.0 million in 2016 and only $0.2 million in 2015. Current liabilities include all liabilities that are payable within the next fiscal year. Unearned revenues, principally from summer programs and grant revenue received in advance, are also presented as current liabilities. Liabilities that are due to be paid beyond the next fiscal year are reported as noncurrent liabilities. Current liabilities, in fiscal 2016, increased $35.1 million primarily as a result of an increase in year-end payables to the State of New Jersey for employee benefits due to an increase in the fringe benefit rate, an increase in salaries payable year end accrual due to an additional two days of salary expense accrued at year end, and finally, an increase in outstanding payments due to contractors for capital related projects. Current liabilities decreased $55.7 million in fiscal 2015 primarily as a result of a reduction in the current portion of university debt issues. The university’s current assets cover current liabilities by a factor of 1.9 times in 2016 and 2.1 times in 2015, an indicator of good liquidity and the ability to bear short term demands on working capital. The university’s current assets also cover over four months of its total operating expenses, excluding depreciation in 2016 and 2015. Endowment and Other Investments The primary financial objective of the investment management of the endowment is to preserve and enhance its real (inflation-adjusted) purchasing power while providing a relatively predictable, stable, and constant (in real terms) stream of earnings for current use. The long term investment goal of the endowment is to attain a total return of at least 4.0% plus inflation, fees, and costs. The investment objectives of the endowment are based upon a long-term investment horizon allowing interim fluctuations to be viewed in an appropriate perspective. A major portion of the university’s endowment is maintained in the long term investment pool managed by the university’s Joint Investment Committee. The total annual return for the long-term investment pool was 0.9% and 2.9% in fiscal years 2016 and 2015, respectively. The average annual return over the 5 year period ending June 30, 2016 and 2015, was 5.6% and 9.4%, respectively. The university distributes endowment earnings in a way that balances the annual support needed for operational purposes against the requirement to preserve the future purchasing power of the endowment. The endowment spending-rate policy is based on total return, not just cash earnings. The total distribution for the endowment was $38.1 million in fiscal 2016 and $33.2 million in 2015. The university’s endowments consist of permanent (true), term and quasi endowments. Permanent or true endowments are funds received from donors stipulating that the principal gift remain inviolate and be invested in perpetuity with the income generated from the investment to be expended for a specific purpose as designated by the donor. These permanent endowments increased $19.4 million to $582.0 million for fiscal 2016 and increased $14.8 million to $562.6 million for fiscal 2015. Term endowments are those funds received from donors that function as endowments until a specified event occurs. The university’s term endowments decreased by $2.4 million to $47.5 million in fiscal 2016 and increased $1.2 million to $49.9 million in fiscal 2015. Quasi endowments consist of restricted expendable gifts and unrestricted funds that have been designated by the university for long-term investment purposes, and therefore, act as endowments. The university’s quasi endowments increased by $67.6 million in fiscal 2016 to $370.0 million and increased $22.1 million in fiscal 2015 to $302.4 million. From a net position perspective, earnings from the endowment, while expendable, are mostly restricted in use by the donors. It is important to note that of the university’s endowment funds, only $230.7 million, or 23.1%, can be classified as unrestricted net position in 2016 and $152.2 million, or 16.6% in 2015. From this unrestricted endowment, a significant portion of the income is internally designated by the university for scholarships, fellowships, professorships, and research efforts. Capital Assets and Debt Activities The University Physical Master Plan, Rutgers 2030, envisions development at Rutgers over a 15 year time frame and is comprehensive in its scope taking into account buildings, the natural and constructed landscape, transportation and infrastructure. While our physical master plan provides guidance and vision for capital projects over the next 15 years, many projects are now under way that will dramatically improve the student experience on our campuses, support our strengths in arts and sciences, and grow critical disciplines. These projects have been made possible by the generosity of
- 9-
our private donors, by creative partnerships with the public sector, and by funds made available through the historic Building Our Future Bond Act approved by New Jersey voters in November 2012, as well as other state bond programs. The Building Our Future Bond Act authorized the state to issue bonds totaling $750.0 million to help increase academic capacity at New Jersey institutions of higher education. In May 2013, the state issued general obligation bonds totaling $350.0 million of which $100.0 million was for the Building Our Future Program. The university will receive a total of $173.9 million from this program. The university recorded $45.7 million in revenue from this program in 2016 and $54.4 million in revenue in 2015. In addition to the Building Our Future Bond Act, the state has also authorized the issuance of bonds to fund several higher education initiatives. In September of 2014, the New Jersey Educational Facilities Authority (NJEFA) issued series 2014A bonds pursuant to the Higher Education Facilities Trust Fund Act (HEFT) in the amount of $199.9 million. This program authorizes the state to issue bonds for institutions of higher education in New Jersey for the purpose of the construction, reconstruction, development, extension, and improvement of instructional, laboratory, communication and research facilities. The university will receive $69.0 million from this program. In 2016, the university recorded $23.6 million in revenue from the HEFT program. In 2015, the university recorded $23.3 million from this program. NJEFA also issued $203.3 million in Series 2014A-D bonds under the Higher Education Capital Improvement Fund Act (HECIF) in April 2014. HECIF provides funds to certain public and private institutions of higher education in the State for the purpose of paying the costs, or a portion of the costs, of certain capital improvements authorized in accordance with the Capital Improvement Fund Act. The university has been awarded $97.3 million from this program. In 2016, the university recorded $32.5 million, and $8.4 million in revenue from these bonds in 2016 and 2015, respectively. The university will also receive funds under the Technology Infrastructure Fund Act which created the Higher Education Technology Infrastructure Fund (HETI). HETI funds are required to be used to develop technology infrastructure within and among New Jersey’s institutions of higher education in order to provide access effectively and efficiently to information, educational opportunities and workforce training, and to enhance the connectivity of higher education institutions to libraries and elementary and secondary schools. NJEFA issued Series 2014 in the amount of $38.1 million in January 2014. Rutgers will receive a total of $3.3 million for several technology projects. The university recorded $0.5 million, and $2.4 million in revenue from this program in 2016 and 2015, respectively. Finally, the state authorized NJEFA to issue Series 2014 Higher Education Equipment Leasing Fund bonds in the amount of $89.3 million under the Higher Education Equipment Leasing Fund Act (ELF). This act authorizes NJEFA to issue bonds to finance the purchase of any property consisting of, or relating to, scientific, engineering, technical, computer, communications, and instructional equipment for lease to public and private institutions of higher education in the State. The university has been awarded $43.8 million from this bond issue for the purchase of this type of equipment. The university recorded $10.6 million, and $17.3 million in revenue from this program in 2016 and 2015, respectively. On June 15, 2006, the Board of Governors and Board of Trustees of the university approved a comprehensive debt policy for the university to provide an internal strategic framework for capital planning and overall debt management. In 2008, the Board of Governors and the Board of Trustees of the university approved a commercial paper program. The commercial paper program is being used for the interim financing of capital projects and temporary funding of outstanding debt issues. In 2016, the university issued 2016 Series M in the amount of $164.6 million and commercial paper in the amount of $3.0 million to refund Series 2003D and Series 2004 Certificates of Participation (COP). In 2015, the university issued commercial paper in the amount of $30.7 million to refund Series 2003D and 2004 COP. The funds received from these state programs, university bonds and other funds received by the university have resulted in the $204.1 million increase in fiscal 2016 ($184.0 million in 2015) in capital assets, net. Capital additions primarily comprise replacement, renovation and new construction of academic and research facilities as well as significant investments in equipment, including information technology. Several major projects completed during fiscal 2016 include: Construction of an approximately 500 bed residence hall in New Brunswick for honors students including
programming space, office space, common space and other amenities to enhance undergraduate honors research work. The Honors College will create an environment for our brightest students to share space with faculty and deans in order to foster mentorships, cultural exchanges and academic engagement.
- 10 -
Construction of a 78,000 square foot facility for the Institute of Food, Nutrition and Health on the Cook Campus that will contain state-of-the-art laboratories, community clinics, a children’s nutrition center and preschool as well as a dining facility offering health food options
Renovation of 305 Cooper Street, the Genet Taylor House, includes renovation of the existing 6,685 square feet as well as an addition to the building that will include stairs, elevator and offices for the Department of English on the Camden Campus.
Construction of a new Nursing and Science Building in Camden which will include state-of-the-art teaching spaces consistent with the current pedagogical trends in Nursing and Science education.
Expansion of the Life Sciences Center in Newark that will physically link existing facilities and provide opportunities for synergy among all life sciences departments by creating shared core functions, flexible research space for both existing and potential future programs and academic support spaces for all disciplines.
Several major projects completed during fiscal 2015 include: Conversion of 15 Washington Street Newark into a mixed use 260,000 sq. ft. residence to house 175 graduate and
185 undergraduate students on the Newark Campus. Upgrades of Wessels, Leupp, Pell, Hegeman Halls on the College Avenue Campus to meet current buildings codes
and address function efficiencies. In addition, at June 30, 2016 and 2015, the university had various projects under construction or in the design stage. Significant projects include: Construction of a new facility for the Department of Chemistry and Chemical Biology on the Busch Campus that
will feature 145,000 square feet of flexible research space and classrooms designed to facilitate collaborative research and learning, providing a state-of-the-art facility to train the next generation of globally engaged scientists and support the needs of the chemical industry in New Jersey and beyond.
Construction of the first new academic building on College Avenue in more than 50 years. The Rutgers Academic Building is an approximately 175,000 square foot academic building for the Rutgers University School of Arts and Sciences consisting of approximately 2,500 seats of classroom space in the form of modern lecture halls as well as departmental office space.
At June 30, 2015, the university had additional projects under construction or in the design stage. These significant projects included: Construction of an approximately 500 bed residence hall in New Brunswick for honors students including
programming space, office space, common space and other amenities to enhance undergraduate honors research work. The Honors College will create an environment for our brightest students to share space with faculty and deans in order to foster mentorships, cultural exchanges and academic engagement.
Construction of a 78,000 square foot facility for the Institute for Food, Nutrition and Health on the Cook Campus that will contain state-of-the-art laboratories, community clinics, a children’s nutrition center and preschool as well as a dining facility offering health food options.
Renovation of 305 Cooper Street, the Genet Taylor House, includes renovation of the existing 6,685 sq. ft. as well as an addition to the building that will include stairs, elevator and offices for the Department of English on the Camden Campus.
Net Pension Liability In June 2012, GASB issued Statement No. 68 Accounting and Financial Reporting for Pensions (GASB 68). This statement addresses accounting and financial reporting for pensions that are provided to the employees of state and local governmental employers through pension plans that are administered through trusts. The university participates in the Public Employees Retirement System (PERS) and the Police and Firemen’s Retirement System (PFRS), both defined benefit cost-sharing multiple-employer pension plans. GASB 68 requires that the proportionate share of the net pension liability be recognized by each participating employer in the plan. The net pension liability is the portion of the actuarial present value of projected benefit payments attributed to past periods of employee service net of the pension plan’s fiduciary net position. A cost-sharing employer is also required to recognize its proportionate share of pension expense and report deferred outflows and deferred inflows of resources for its proportionate share. The changes in net pension liability adjusted for the deferred inflows and deferred outflows of resources result in pension expense. Prior to 2015, the university only recognized pension expense for these plans up to the amount contributed to the plan by the state as indicated within the fringe benefit rate provided by the state. In 2016, this contribution amounted to $22.9 million, and

- 11-
in 2015, this contribution amounted to $16.2 million. Under GASB 68, the pension expense recorded was $122.3 million and $80.6 million in 2016 and 2015, respectively. Historically, the state has directly covered pension contributions on behalf of the university and has no current plans to change that. GASB 68 also required the recording of the deferred outflow of resources of $245.8 million and $73.8 million, a net pension liability of $1,644.7 million and $1,354.7 million and a deferred inflow of resources of $45.3 million and $67.7 million in 2016 and 2015, respectively. The university was also required to adjust the beginning net unrestricted position by ($1,280.5) million in 2015 to reflect the cumulative effect of implementation from prior years. In order to provide a comparison of 2016 and 2015 to 2014, the amounts recorded as a result of GASB 68 have been shown separately. Net Position Net Position represents the residual interest in the university’s assets and deferred outflows of resources after the deduction of its liabilities and deferred inflows of resources. The change in net position measures whether the overall financial condition has improved or deteriorated during the year. Net position consists of four major categories; net investment in capital assets, restricted net position (nonexpendable and expendable), and unrestricted net position. Prior to the pension adjustment required by GASB 68, the university’s net position increased by $196.9 million in 2016 ($194.6 million in 2015). As a result of the amounts recorded for pension expense under GASB 68, the July 1, 2014 net position was restated by $1,280.5 million. The fiscal year 2016 activity recorded was $37.4 million ($68.0 million in 2015). The first category, net investment in capital assets, represents the university’s capital assets of land, buildings and equipment net of accumulated depreciation and net of outstanding principal balances of debt attributable to the acquisition, construction or improvement of those assets. The increase of $143.9 million in fiscal 2016, and $106.1 million in fiscal 2015, resulted primarily from the various construction projects listed above. The next category is restricted net position, which is divided into two categories, nonexpendable and expendable. Nonexpendable restricted net position are those resources that have been set aside and invested as required by the provider of the resources. These funds are not available for expenditures, but rather must be invested in perpetuity with the earnings on those investments to be used as specified by the external donor at the time the resources are received. The nonexpendable net position includes the permanent and term endowments mentioned previously under the Endowment and Other Investments section. The restricted nonexpendable net position increased by $18.1 million and $15.8 million in fiscal 2016 and 2015, respectively. Expendable restricted net position is available for expenditure by the university but must be spent for purposes as specified by external donors. This category includes contributions received from donors and unspent income from endowed funds. There was an increase of $1.0 million and $10.9 million in fiscal 2016 and 2015, respectively. The final category is unrestricted net position. Unrestricted net position is available to the institution for any lawful purpose. Substantially all of the university’s unrestricted net position has been designated by the governing boards or management to support specific programs such as student activities, research projects, continuing education and summer programs, agricultural experiment station activities, junior year abroad programs, auxiliary enterprises and other self-supporting organized activities relating to educational departments as well as capital projects. Many of these designations result from the funds being earned through special purpose fees charged for the specific purposes. The university, therefore, has an obligation to its students to maintain these funds for the purposes that they were received. Prior to the adjustments for GASB 68, there was an increase of $33.7 million and $61.8 million in unrestricted net assets for 2016 and 2015, respectively. The pension expense increased $95.1 million in fiscal 2016 resulting in a deficit unrestricted net position of ($639.9) million. The unrestricted net position beginning balance was adjusted by $1,280.5 million at July 1, 2014 with the implementation of GASB 68 and the pension expense was increased by $68.0 million in 2015 resulting in a deficit unrestricted net position of ($577.9) million. This deficit, in both years, is due to recording the university’s full pension expense under GASB 68. The state is expected to cover this cost.

- 12 -
Statement of Revenues, Expenses, and Changes in Net Position The Statement of Revenues, Expenses, and Changes in Net Position presents the revenues earned and the expenses incurred during the fiscal year. Activities are classified as either operating, non-operating, or other. Revenues received and expenses incurred as a result of the university providing goods and services to its customers are considered operating. Non-operating revenues are those received for which goods and services are not directly provided. The financial reporting model classifies state appropriations and gifts as non-operating revenues. The operating deficit demonstrates the university’s dependency on state support and gifts. In addition, appropriations, grants and gifts received by the university, specifically for capital expenditures as well as gifts received from donors as endowments, are reported as other revenues. A summary of the university’s revenues, expenses, and changes in net position for the years ended June 30, 2016, 2015, and 2014 is as follows (dollars in thousands).
2016
GASB 68 Adjustment
2016 net of GASB 68
Adjustment
2015
GASB 68 Adjustment
2015 net of GASB 68
Adjustment
2014
Operating revenues Student tuition and fees (net
of scholarship allowances) $905,762)
$ —)
$905,762)
$863,051)
$ —)
$863,051)
$820,229)
Grants and contracts 575,198)
—)
575,198)
584,867)
)—)
584,867)
579,695)
Auxiliary enterprises (net of scholarship allowances) 317,429)
—)
317,429)
306,260)
—)
306,260)
291,460)
Net patient service revenues 533,932)
—)
533,932)
518,019)
—)
518,019)
487,578)
Other operating revenues 163,661)
—)
163,661)
130,439)
—)
130,439)
126,880)
Total operating revenues 2,495,982)
—)
2,495,982)
2,402,636)
—)
2,402,636)
2,305,842)
Operating expenses 3,514,152)
(95,834)
3,418,318)
3,411,728)
(67,973)
3,343,755)
3,324,016)
Operating loss (1,018,170)
95,834)
(922,336)
(1,009,092)
67,973)
(941,119)
(1,018,174)
Non-operating revenues (expenses)
State appropriations (including fringe benefits paid directly by the state) 775,666)
—)
775,666)
781,884)
—)
781,884)
777,393)
Contributions 51,367)
—)
51,367)
52,416)
—)
52,416)
40,625)
Endowment and investment income 23,539)
—)
23,539)
23,287)
—)
23,287)
15,678)
Net increase/(decrease) in fair value of investments (4,159)
—)
(4,159)
24,212)
—)
24,212)
102,931)
Governmental Student Aid 188,625)
—)
188,625)
188,707)
—)
188,707)
174,104)
Interest on capital asset related debt (83,866)
—)
(83,866)
(80,214)
—)
(80,214)
(83,053)
Net other non-operating revenues 8,609)
—)
8,609)
11,715)
—)
11,715)
17,760)
Net non-operating revenues 959,781)
—)
959,781)
1,002,007)
—)
1,002,007)
1,045,438)
(Loss)/Income before other revenues (58,389)
95,834)
37,445)
(7,085)
67,973)
60,888)
27,264)
Other revenues 159,411)
—)
159,411)
133,715)
—)
133,715)
40,977)
Increase in net position 101,022)
95,834)
196,856)
126,630)
67,973)
194,603)
68,241)
Net position at beginning of year 1,914,486)
1,348,471)
3,262,957)
1,787,856)
1,280,498)
3,068,354)
3,000,113)
Net position at end of year $2,015,508)
$1,444,305)
$3,459,813)
$1,914,486)
$1,348,471)
$3,262,957)
$3,068,354)

- 13-
Operating revenues represent 70.4% and 68.9% of total revenues in 2016 and 2015, respectively. Significant components of operating revenues include the following: Student tuition and fees, net of scholarship allowances are the largest component of operating revenues. Tuition and fees are reflected net of scholarship allowances, which represent scholarships and fellowships applied to student accounts for tuition and residence fees. These scholarships and fellowships are funded through federal and state grant programs and gifts raised by the university. The university provided $261.3 million of a total $319.9 million of student aid directly to student accounts. The remaining $58.6 million was paid to students and is reflected as scholarships and fellowships expense. Scholarship allowances allocated to tuition and fees amounted to $215.2 million. Another $46.1 million was allocated to residence fees, which are included in auxiliary revenues. Tuition and fees, net of scholarship allowances, increased $42.7 million in 2016. The increase resulted primarily from an average increase in tuition rates of 3.6% for undergraduate students, an increase of 2.3% in student fees and an enrollment peak of 67,556 for 2016. In 2015, tuition and fees, net of scholarship allowances increased $42.9 million. Tuition rates were increased in fiscal 2015 by an average of 3.0%, while student fees increased an average of 2.8% in New Brunswick and 3.8% in Camden. Enrollment reached a peak of 66,013 in 2015. In 2015, the university also changed its procedures for recognizing tuition revenue from its summer session programs. The university now recognizes the revenue earned from summer programs run prior to June 30 in the current year and defers revenue for courses held after June 30. In the past, all summer session revenue was deferred to the following year. This change has resulted in an increase in revenue of approximately $20.0 million in 2015. Grants and Contracts includes revenues for sponsored programs from federal, state and nongovernmental grants and contracts that normally provide for the recovery of direct and indirect costs, or expenses. While the university experienced significant challenges in novating awards after the merger and additional delays in awards as a result of sequestration in 2014, all awards from the former UMDNJ were novated in 2015. Renewals and new awards continue to be received. In 2016, new research grants and sponsored programs totaled $637.9 million, an increase of 4.1%. In 2015, the university succeeded in obtaining new grants with over 2,800 new awards totaling over $612.5 million representing an 18.3% increase in awards. Federal awards for research reached $335.5 million and $303.2 million in 2016 and 2015, respectively, a 10.7% increase. Awards from the National Science Foundation (NSF) accounted for $55.3 million and $55.5 million in 2016 and 2015, respectively, or a 0.4% decrease from this agency. Awards received from the State of New Jersey for research and sponsored programs decreased by 16.3% in 2016, but increased by 36.8% in 2015 to a total of $148.9 million and $177.8 million, respectively. Awards from nongovernmental sources amounted to $153.5 million and $131.7 million in 2016 and 2015, respectively. The following table summarizes the research awards received by the university over the last 10 years.

- 14 -
In fiscal 2016, Federal Grants and Contracts revenue amounted to $301.7 million or 52.4% of total grants and contracts revenue. This year the university was awarded grants from various federal agencies including: The National Institute of Neurological Disorders and Stroke (NINDS) awarded to Jay Tischfield, founding director
of Rutgers University Cell and DNA Repository, RUCDR Infinite Biologics, $1.2 million to manage the NINDS stem cell repository and provide a comprehensive range of stem cell related services to researches worldwide investigating diseases such as Parkinson’s and ALS.
The National Institute for Health (NIH) awarded David Perlin, professor in the Rutgers New Jersey Medical School, $5.3 million to support the Center for Excellence in Translational Research program to develop therapeutic countermeasures to high-threat bacterial agents.
The NIH also awarded Joachim Kohn $1.2 million to support his project on an investigational new drug application (IND) for intravenous cP12 and pre-IND studies of intravenous topical cNP5 for limiting burn injury progression.
Elisa Bandera at the Rutgers Cancer Institute of New Jersey for research into obesity, related comorbidities, and breast cancer outcomes in African Americans was awarded $1.1 million from NIH.
In fiscal 2015, Federal Grants and Contracts revenue amounted to $302.5 million or 51.7% of total grants and contracts revenue. In 2015, the university was awarded grants from various federal agencies including: Under the Defense Advanced Research Projects Agency's Pathogen Predators program, Daniel Kadouri, associate
professor in the Rutgers School of Dental Medicine, Rutgers Biomedical and Health Sciences, is the principal investigator of an award with an anticipated total funding of $7.0 million over a three year period. The university received the first $2.1 million in 2015. This project will examine the therapeutic potential of two types of predatory bacteria that kill germs that have developed a resistance to antibiotics.
The National Institute of Biomedical Imaging and Bioengineering awarded a grant to Prabhas Moghe, distinguished professor of Biomedical Engineering and Chemical and Biochemical Engineering, and Richard Riman, distinguished professor of Materials Science and Engineering, both in the School of Engineering, Rutgers–New Brunswick, for their project “Earth Nanocrystals and Infrared Light Reveal Cancerous Tumors and Cardiovascular Lesions.” This is a four year grant with total anticipated funding of $2.0 million, of which $0.5 million was awarded in 2015.
In fiscal 2016, State and Municipal Grants and Contracts revenue amounted to $153.8 million or 26.7% of total grants and contracts revenue. The following are some of the grants received this year from various state agencies: The New Jersey Department of Children and Families awarded Judy Postmus, associate professor and director,
Center on Violence Against Women and Children; Sara Munson, executive director, Institute for Families; and Cassandra Simmel, associate professor, School of Social Work, an award totaling $1.0 million. The project is titled, “Adoption Certification Program”.
The New Jersey Department of Transportation awarded Charles Brown, adjunct professor, Edward J. Bloustein School of Planning and Public Policy, and senior research specialist, Alan M. Voorhees Transportation Center, an award totaling $0.6 million. The project is titled “New Jersey Bicycle and Pedestrian Resource Center” and is to motivate, educate and empower citizens to create safer and more accessible walking and bicycling environments through cutting edge research, education, and sharing of resources.
In fiscal 2015, State and Municipal Grants and Contracts was $165.2 million or 28.2% of total grants and contracts revenue. The following are some of the grants received in 2015 from various state agencies. The State of New Jersey Department of Transportation awarded Ali Maher, professor in the Department of Civil
and Environmental Engineering and director of the Center for Advanced Infrastructure and Transportation, Rutgers–New Brunswick, a $4.5 million grant from for “Utilization of Pneumatic Flow Tube Mixing Technique.”
The New Jersey Department of Education awarded Cynthia Blitz, executive director of the Center for Effective School Practices and associate research professor in the Graduate School of Education, Rutgers–New Brunswick, a $7.4 million grant for her project, “New Jersey Early Learning Training Academy.”

- 15-
Distinguished professor of public policy and director of the Center for State Health Policy, Rutgers–New Brunswick, Joel Cantor, is the principal investigator of a $3 million award from the Centers for Medicare and Medicaid Services for work on “New Jersey State Healthcare Innovation Project.”
Finally, in fiscal 2016, Nongovernmental Grants and Contracts revenue amounted to $119.7 million or 20.8% of total grants and contracts revenue. Some of the awards received this year included the following: The Surdna Foundation awarded $0.5 million to principal investigator, Christopher Obropta, associate professor,
Department of Environmental and Biological Services, and extension specialist in water resources, Rutgers Cooperative Extension, for a project titled, “New Technical Assistance Program for Combined Sewer Overflow Communities”. The purpose of this project is to expand the statewide program that assists New Jersey communities in implementing green infrastrucure solutions to stormwater challenges, targeting communities with combined sewer overflow systems.
The Robert Wood Johnson Foundation awarded $0.8 million to principal investigator, Joel Cantor, distinguished professor, Department of Public Policy, and director, Center for State Health Policy, for a project titled “New Jersey Perspectives on Health and Well-Being Project”. This funding will support development and implementation of polling under the New Jersey Perspectives on Health and Well-Being project.
Finally, in fiscal 2015, Nongovernmental Grants and Contracts was $117.2 million or 20.0% of total grants and contracts revenue. Some of the awards received in 2015 include the following: The Foundation for Newark’s Future awarded Roland Anglin, director of the Joseph Cornwall Center for
Metropolitan Studies, Rutgers–Newark, $1.5 million for his project “New City of Learning Collaborative.”
The Bill and Melinda Gates Foundation awarded Anushua Sinha, associate professor of preventive medicine and community health, Rutgers New Jersey Medical School, a $750,000 grant to support “Maternal Pertussis Immunization Cost Effectiveness Analysis.”
The Hunt Alternatives Fund awarded a grant of $400,000 to Kelly Dittmar, assistant professor in the Department of Political Science, Faculty of Arts and Sciences, Rutgers–Camden, and scholar at the Center for American Women and Politics at the Eagleton Institute of Politics, Rutgers–New Brunswick, for her project “Women Representing in an Era of Party Polarization.”
Auxiliary enterprise revenues include revenues from the university’s housing, dining facilities and other student related services, as well as other business type activities such as the bookstore and the golf course that provide support to the university’s primary missions of education, research and public service. Auxiliary revenues of $363.5 million were offset by scholarship allowances of $46.1 million in 2016. Housing and dining revenues totaled $226.8 million, or 62.4%, of total gross auxiliary revenues. Housing rates increased 2.8% while dining rate increased ranged from 2.1% to 2.4% in 2016. Auxiliary expenses totaled $288.7 million in 2016, a decrease of $0.2 million compared to 2015. Housing and dining expenditures totaled $141.0 million or 48.8% of total auxiliary expenditures in 2016. In 2015, auxiliary revenues, net of scholarship allowances, increased by $14.8 million, while expenditures decreased by $4.1 million. Net patient services revenues include revenues related to patient care services, which are generated within RBHS behavioral healthcare, faculty practice operations, community healthcare centers, cancer and contract activities, under contractual arrangements with governmental payers and private insurers. In fiscal 2016, this revenue was $533.9 million, an increase of $15.9 million or 3.1% over fiscal 2015 revenue of $518.0 million, and $487.6 million in fiscal 2014. The increases in 2016 and 2015 were primarily due to increases in patient service revenues at the Cancer Institute of New Jersey and University Behavioral Health Care.

- 16 -
Operating expenses are reported by functional classification in the Statements of Revenue, Expenses, and Changes in Net Position and by natural classification in the notes to the financial statements (See Note 13). The following tables summarize the university’s operating expenses by functional and natural classification. Operating Expenses by Functional Classification
(dollars in thousands)
2016
GASB 68 Adjustment
2016 net of GASB 68
Adjustment 2015 GASB 68
Adjustment
2015 net of GASB 68
Adjustment 2014 Instruction $914,508 ($43,016) $871,492 $883,213 ($29,334) $853,879 $849,438 Sponsored Research 348,052 —)) 348,052 355,769 —)) 355,769 358,231 Other Separately Budgeted
Research 105,169 (3,511) 101,658 98,331 (2,550) 95,781 76,467 Other Sponsored Programs 196,682 —) 196,682 206,779 —)) 206,779 87,977 Extension and Public Service 51,595 (3,429) 48,166 50,395 (1,450) 48,945 146,128 Academic Support 129,483 (4,684) 124,799 125,477 (3,079) 122,398 123,342 Student Services 105,216 (3,382) 101,834 93,050 (2,333) 90,717 107,332 Operation and Maintenance of
Plant 216,132 (6,485) 209,647 205,281 (4,674) 200,607 207,167 General Administration and
Institutional 264,165 (10,113) 254,052 243,608 (7,314) 236,294 260,811 Scholarships and Fellowships 58,596 (280) 58,316 54,201 (215) 53,986 52,517 Depreciation 151,254 —) 151,254 152,525 —)) 152,525 147,629 Patient Care Services 684,222 (14,955) 669,267 653,446 (12,504) 640,942 613,492 Auxiliary Enterprises 288,680 (5,979) 282,701 288,869 (4,520) 284,349 292,991 Other Operating Expenses 398 —) 398 784 —)) 784 494 Total Operating Expenses $3,514,152 ($95,834) $3,418,318 $3,411,728 ($67,973) $3,343,755 $3,324,016 Operating Expenses by Natural Classification
(dollars in thousands)
2016 GASB 68
Adjustment
2016 net of GASB 68
Adjustment 2015 GASB 68
Adjustment
2015 net of GASB 68
Adjustment 2014 Salaries and Wages $1,824,819 $ —) $1,824,819 $1,775,349 $ —)) $1,775,349 $1,752,152 Fringe Benefits 632,569 (95,834) 536,735 582,430 (67,973) 514,457 543,132 Supplies and Services 838,059 —) 838,059 838,553 —)) 838,553 815,680 Scholarships and Fellowships 67,451 —) 67,451 62,871 —)) 62,871 65,423 Depreciation 151,254 —) 151,254 152,525 —)) 152,525 147,629 Total Operating Expenses $3,514,152 ($95,834) $3,418,318 $3,411,728 ($67,973) $3,343,755 $3,324,016
The natural classification of expenses demonstrates that the major expenditure of the university in 2016 is salaries and wages accounting for more than 51.9% of total operating expenses with the GASB 68 adjustment (52.0% in 2015) and 53.4% without the adjustment in 2016 (53.1% in 2015). Negotiated salary increases were implemented this year resulting in an average increase in salaries of 2.0% (a 2.0% increase in 2015). Fringe benefits also increased significantly this year primarily resulting from the changes required under GASB 68. In 2016, prior to GASB 68, the university’s pension expense amounted to $22.9 million ($16.2 million in 2015). Pension expense under GASB 68 amounted to $95.1 million in 2016 ($80.6 million in 2015) resulting in an increase in pension expense of $72.2 million ($68.0 million in 2015). State appropriations, including fringe benefits paid directly by the State, decreased $6.2 million in fiscal 2016. The university’s base appropriations decreased by $15.3 million as a result of reductions in New Jersey Department of State (DOS) funding. Fringe benefits paid directly by the State increased $9.0 million in 2016, primarily the result of increasing pension and healthcare costs. The university received an appropriation from the New Jersey Department of State (DOS) totaling $394.0 million in 2016 and $409.2 million in 2015 for the New Brunswick (including RBHS and the Agricultural Experiment Station), Newark and Camden Campuses. In addition, the university received an appropriation from the New Jersey Department of Health in the amount of $28.0 million in 2016 and 2015 for the Rutgers Cancer Institute of New Jersey (CINJ). The university also received an appropriation from the New Jersey Department of Human Services (DHS) totaling $18.0 million in 2016 and 2015 for the Rutgers University Behavioral Health Care Centers (UBHC). Total appropriations for the year amounted to $439.9 million and $455.2 million in 2016 and 2015, respectively. Fringe benefits are also paid directly by the State and totaled $335.7 million and $326.7 million in fiscal 2016 and 2015, respectively.

- 17-
Governmental Student Aid is also a significant component of non-operating revenues. The university’s students benefit from various federal programs, such as, Pell Grants and the Federal Supplemental Educational Opportunity Grants. In addition, the State provides aid through the Tuition Aid Grant (TAG) program and the Educational Opportunity Fund (EOF). The university received a total of $83.0 million in 2016 from federal programs or a 1.5% increase over the $81.8 million received in 2015. The university also received $105.6 million from the state this year or a decrease of 1.3% from the $106.9 million received in 2015. Other revenues and expenses consist of grants and gifts received by the university for capital projects, as well as additions to permanent endowments. The university received a total of $124.7 million in 2016 for capital grants and gifts. The increase from fiscal 2015 was due to $4.5 million in gifts received for the Global Village Learning Center project and an increase of $5.4 million received from the State of New Jersey. The university received $34.7 million in fiscal 2016 and $20.7 million in 2015 to add to our endowment as a result of the foundation’s campaign. The increase was due to a greater number of gifts received which were $1.0 million or greater. Economic Factors that will affect the future The university continues to maintain a strong financial position. After a decrease in direct state support of $15.3 million in fiscal year 2016, direct state support for fiscal year 2017 increased by $1.0 million, as a result of a capital appropriation for the planning of a new School of Business facility on the Camden Campus. In addition, the university increased tuition rates by only 1.7% for in-state students and out-of-state students in 2017, the lowest increase in five years. We will continue to meet our funding challenges through savings from increased efficiency and reduced administrative costs, revenue from nontraditional education programs, public-private partnerships, clinical care enterprises, increased grants and contracts, greater philanthropy and other sources. During the past year, the university embarked on a new plan to update the institution’s Enterprise Resource Planning (ERP) systems. With the implementation in October 2016, the major areas of focus include: creating a new university chart of accounts, implementing a more responsive suite of online tools for financial reporting, budgeting and planning, expanding the use of a streamlined, paperless system for procurement, and finally, to support faculty research, a new implementation of products for sponsored projects, pre-award function, integrated financial management and general research administration. The university continues to attract a high quality, diverse population of students. Growth in the size of the first-year classes has led to an overall enrollment increase of more than 1,700 students in the fall 2016 semester. The university maintains a state, national, and global reach by attracting competitive applicants from all 50 states and over 140 countries. As a result of the various state bond programs and other financing sources, the university has numerous construction and renovation projects underway. New capital construction in progress includes the renovation of buildings in Newark to support the Express Newark Initiative and upgraded space for the Newark Biology, Chemistry and Neuroscience departments, a new Nursing and Science Building in Camden, additions to William Levine Hall at the Ernest Mario School of Pharmacy and construction of a Chemistry and Chemical Biology facility, which will be a new academic building on the Busch Campus slated to be completed in the fall of 2017. These projects will provide additional space and resources for our growing institution.

- 18 -
STATEMENTS OF NET POSITION June 30, 2016 and 2015 (dollars in thousands
Component Unit
Component Unit
Rutgers, The State University of New Jersey
Rutgers University Foundation
University Physician Associates of New Jersey,
Inc. and Affiliates
2016
2015 2016 2015
2016 2015
ASSETS:
Current Assets
Cash and Cash Equivalents $100,885
$167,663 $527 $1,649
$25,723 $17,235
Cash and Cash Equivalents - Restricted 183,544
131,782 18,205 22,299
4,587 5,603
Short-Term Investments 523,583
439,925 —) —)
28,099 27,726
Short-Term Investments - Restricted 86
27,061 5,097 10,919
—) —)
Investments Held by Trustees - Restricted —)
69,153 —) —)
—) —)
Accounts Receivable, net 370,687
387,589 3,951 3,605
—) —) Contributions Receivable, net – Current
Portion —)
—) 32,115 43,324
—) —)
Inventories 4,131
3,909 —) —)
—) —)
Prepaid Expenses and Other Assets 8,209
13,236 311 658
44 647
Total Current Assets 1,191,125
1,240,318 60,206 82,454
58,453 51,211
)
Noncurrent Assets
Cash and Cash Equivalents 60,347
87,957 —) —)
—) —)
Cash and Cash Equivalents - Restricted 256,206
318,483 —) —)
—) —)
Long-Term Investments 3
13,045 2,058 8,656
—) —)
Long-Term Investments - Restricted 978,094
849,519 6,391 8,835
—) —)
Investments Held by Trustees - Restricted 24,806
81,220 —) —)
—) —)
Accounts Receivable, net 115,786
124,604 —) —)
—) —) Contributions Receivable, net –
Noncurrent Portion —)
—) 39,133 27,549
—) —) Cash Surrender Value of Whole Life
Insurance Policies —)
—) 699 687
—) —)
Other Noncurrent Assets 1,375
2,385 —) —)
—) —)
Capital Assets, net 3,439,243
3,235,141 —) —)
75 112
Total Noncurrent Assets 4,875,860
4,712,354 48,281 45,727
75 112
TOTAL ASSETS 6,066,985
5,952,672 108,487 128,181
58,528 51,323
)
DEFERRED OUTFLOWS OF RESOURCES:
Loss on Refunding 85,156
71,832 —) —)
—) —)
Pension Related 245,778
73,845 —) —)
—) —)
Interest Rate Swaps 48,433
25,917 —) —)
—) —) TOTAL DEFERRED OUTFLOWS OF
RESOURCES 379,367
171,594 —) —)
—) —)
)
TOTAL ASSETS AND DEFERRED
OUTFLOWS OF RESOURCES 6,446,352
6,124,266 108,487 128,181
58,528 51,323

- 19-
STATEMENTS OF NET POSITION
June 30, 2016 and 2015
(dollars in thousands)
Component Unit Component Unit
Rutgers, The State University of New Jersey
Rutgers University Foundation
University Physician Associates of New Jersey,
Inc. and Affiliates
2016 2015 2016
2015 2016
2015
LIABILITIES:
Current Liabilities
Accounts Payable and Accrued Expenses 392,587) 354,505) 2,819
4,065 23,735
11,183
Payable to Rutgers, The State University of New Jersey —)) —)) —)
220 14,746
10,874
Unearned Revenue 93,019) 92,912) 25
—) —)
—) Payroll Withholdings 21,834) 22,797) —)
—) —)
—)
Other Payables 2,305) 2,235) —)
—) —)
—) Annuities Payable – Current Portion —)) —)) 800
854 —)
—)
Short-Term Liabilities 65,608) 65,833) —)
—) —)
—) Long-Term Liabilities - Current
Portion 57,943) 59,882) —)
—) —)
—) Total Current Liabilities 633,296) 598,164) 3,644
5,139 38,481
22,057
)
Noncurrent Liabilities
Accounts Payable and Accrued Expenses 47,201) 44,590) 412
425 —)
14,254
Unearned Revenue 100,447) 169,700) —)
—) —)
—) Derivative Instruments 48,433) 25,917) —)
—)
—)
Annuities Payable – Noncurrent Portion —)) —)) 6,186
6,493 —)
—)
Net Pension Liability 1,644,741) 1,354,656) —) —) —) —) Long-Term Liabilities – Noncurrent
Portion 1,911,384) 1,949,093) —)
—) —)
—) Total Noncurrent Liabilities 3,752,206) 3,543,956) 6,598
6,918 —)
14,254
TOTAL LIABILITIES 4,385,502) 4,142,120) 10,242
12,057 38,481
36,311 DEFERRED INFLOWS OF RESOURCES:
Pension Related 45,342) 67,660) —) —) —) —) TOTAL LIABILITIES AND DEFERRED INFLOWS OF RESOURCES 4,430,844) 4,209,780) 10,242
12,057) 38,481
36,311)
)
NET POSITION (DEFICIT):
Net Investment in Capital Assets 1,601,474) 1,457,539) —)
—) —)
—) Restricted for
Nonexpendable
Instruction 240,519) 231,291) 654
1,615 —)
—)
Scholarships and Fellowships 249,718) 249,401) 3,938
6,514 —)
—) Libraries 9,420) 9,833) 229
—) —)
—)
Other 82,350) 73,365) 437
333 —)
—) Expendable
Instruction 152,825) 151,702) 11,972
15,699 —)
—) Research 65,296) 65,924) 20,377
28,588 —)
—)
Scholarships and Fellowships 83,999) 83,834) 8,998
9,651 —)
—) Libraries 12,001) 13,179) 570
719 —)
—)
Loans 77,183) 76,607) 1
1 —)
—) Capital Projects 24,986) 23,958) 25,960
27,547 —)
—)
Debt Service Reserve 9,009) 15,639) —)
—) —)
—) Healthcare and Professional Services 9,841) 9,676) —)
—) —)
—)
Other 36,804) 30,412) 21,554
14,650 —)
—) Unrestricted (639,917) (577,874) 3,555
10,807 20,047
15,012
TOTAL NET POSITION (DEFICIT) $2,015,508 $1,914,486) $98,245
$116,124 $20,047
$15,012
See accompanying notes to the financial statements.

- 20 -
STATEMENTS OF REVENUES, EXPENSES, AND CHANGES IN NET POSITION For the Years Ended June 30, 2016 and 2015 (dollars in thousands)
Component Unit Component Unit
Rutgers, The State University of New Jersey
Rutgers University Foundation
University Physician Associates of New Jersey,
Inc. and Affiliates
2016 2015 2016
2015 2016
2015
OPERATING REVENUES:
Student Tuition and Fees (net of
scholarship allowances of $215,188 in 2016 and $205,331 in 2015) $905,762) $863,051) $ —)
$ —) $ —)
$ —)
Federal Grants & Contracts 301,680) 302,504) —)
—) —)
—) State & Municipal Grants &
Contracts 153,793) 165,153) —)
—) —)
—) Nongovernmental Grants &
Contracts 119,725) 117,210) 42,299)
57,758) —)
—) Auxiliary Enterprises (net of
scholarship allowances of $46,110 in 2016 and $43,307 in 2015) 317,429) 306,260) —)
—) —)
—)
Net Patient Service Revenues 533,932) 518,019) —)
—) 120,469
112,707) Other Operating Revenues 163,661) 130,439) 6,274)
5,891) 2,593
91)
Total Operating Revenues 2,495,982) 2,402,636) 48,573)
63,649) 123,062
112,798) )
OPERATING EXPENSES:
Educational and General
Instruction 914,508) 883,213) —)
—) —)
—) Sponsored Research 348,052) 355,769) —)
—) —)
—)
Other Separately Budgeted Research 105,169) 98,331) —)
—) —)
—)
Other Sponsored Programs 196,682) 206,779) —)
—) —)
—) Extension and Public Service 51,595) 50,395) —)
—) —)
—)
Academic Support 129,483) 125,477) —)
—) —)
—) Student Services 105,216) 93,050) —)
—) —)
—)
Operations and Maintenance of Plant 216,132) 205,281) —)
—) —)
—)
General Administration and Institutional 264,165) 243,608) 30,873)
27,347) 20,217
20,585)
Scholarships and Fellowships 58,596) 54,201) —)
—) —)
—) Depreciation 151,254) 152,525) —)
—) —)
—)
Patient Care Services 684,222) 653,446) —)
—) 49,070
45,392) Auxiliary Enterprises 288,680) 288,869) —)
—) —)
—)
Distributions to Rutgers, The State University of New Jersey —) —) 119,917)
103,877) —)
—)
Distributions to Douglass Associate Alumnae —) —) 55)
85) —)
—)
Other Operating Expenses 398) 784) —)
—) 49,227
45,220) Total Operating Expenses 3,514,152) 3,411,728) 150,845)
131,309) 118,514
111,197)
Operating (Loss)/Income (1,018,170) (1,009,092) (102,272)
(67,660) 4,548
1,601) (Continued)

- 21-
STATEMENTS OF REVENUES, EXPENSES, AND CHANGES IN NET POSITION For the Years Ended June 30, 2016 and 2015 (dollars in thousands)
Component Unit Component Unit
Rutgers, The State University of New Jersey
Rutgers University Foundation
University Physician Associate of New Jersey,
Inc. and Affiliates
2016 2015 2016
2015 2016
2015
NON-OPERATING REVENUES (EXPENSES):
State Appropriations 439,930) 455,194) —)
—) —)
—) State Paid Fringe Benefits 335,736) 326,690) —)
—) —)
—)
Administrative Fees and Support from Rutgers, The State University of New Jersey —) —) 14,576)
14,560) —)
—)
Noncash Support from Rutgers, The State University of New Jersey —) —) 1,840)
1,457) —)
—)
Federal Appropriations 7,429) 7,346) —)
—) —)
—) Federal Student Aid 83,038) 81,774) —)
—) —)
—)
State Student Aid 105,587) 106,933) —)
—) —)
—) Contributions 51,367) 52,416) 10,887)
13,854) —)
—)
Endowment and Investment Income (net of investment management fees for the university of $6,041 in 2016 and $5,353 in 2015) 23,539) 23,287) 349)
479 514)
4446)
Net (Decrease)/Increase in Fair Value of Investments (4,159) 24,212) (224)
(270) (27)
455)
Interest on Capital Asset Related Debt (83,866) (80,214) —)
—) —)
—)
Loss on Disposal of Capital Assets (206) (928) —)
—) —)
—)
Other Non-operating Revenues/(Expenses) 1,386) 5,297) 359)
(1,086) —)
—)
Total Net Non-operating Revenues 959,781) 1,002,007) 27,787)
28,994) 487)
901)
)
(Loss)/Income before Other
Revenues (Expenses) (58,389) (7,085) (74,485)
(38,666) 5,035)
2,502) )
Capital Grants and Gifts 124,702) 112,994) 19,221)
14,426) —)
—) Additions to Permanent
Endowments 34,709) 20,721) 37,385)
27,809) —)
—) Increase in Net Position 101,022) 126,630) (17,879)
3,569) 5,035)
2,502)
)
Net Position –
Beginning of the Year 1,914,486) 1,787,856) 116,124)
112,555) 15,012)
12,510)
Net Position - End of the Year $2,015,508) $1,914,486) $98,245)
$116,124) $20,047)
$15,012) See accompanying notes to the financial statements.
- 22 -
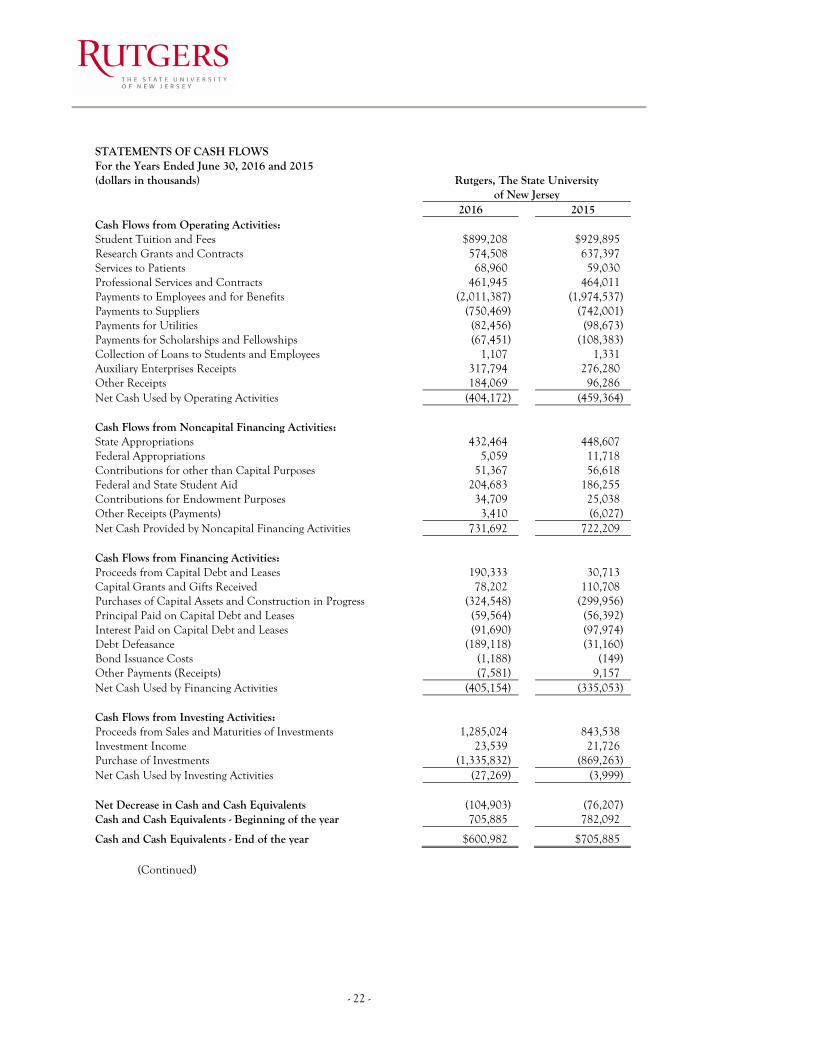
STATEMENTS OF CASH FLOWS For the Years Ended June 30, 2016 and 2015 (dollars in thousands) Rutgers, The State University
of New Jersey 2016 2015 Cash Flows from Operating Activities: Student Tuition and Fees $899,208) $929,895) Research Grants and Contracts 574,508) 637,397) Services to Patients 68,960) 59,030) Professional Services and Contracts 461,945) 464,011) Payments to Employees and for Benefits (2,011,387) (1,974,537) Payments to Suppliers (750,469) (742,001) Payments for Utilities (82,456) (98,673) Payments for Scholarships and Fellowships (67,451) (108,383) Collection of Loans to Students and Employees 1,107) 1,331) Auxiliary Enterprises Receipts 317,794) 276,280) Other Receipts 184,069) 96,286) Net Cash Used by Operating Activities (404,172) (459,364)
Cash Flows from Noncapital Financing Activities: State Appropriations 432,464) 448,607) Federal Appropriations 5,059) 11,718) Contributions for other than Capital Purposes 51,367) 56,618) Federal and State Student Aid 204,683) 186,255) Contributions for Endowment Purposes 34,709) 25,038) Other Receipts (Payments) 3,410) (6,027) Net Cash Provided by Noncapital Financing Activities 731,692) 722,209)
Cash Flows from Financing Activities: Proceeds from Capital Debt and Leases 190,333) 30,713) Capital Grants and Gifts Received 78,202) 110,708) Purchases of Capital Assets and Construction in Progress (324,548) (299,956) Principal Paid on Capital Debt and Leases (59,564) (56,392) Interest Paid on Capital Debt and Leases (91,690) (97,974) Debt Defeasance (189,118) (31,160) Bond Issuance Costs (1,188) (149) Other Payments (Receipts) (7,581) 9,157) Net Cash Used by Financing Activities (405,154) (335,053)
Cash Flows from Investing Activities: Proceeds from Sales and Maturities of Investments 1,285,024) 843,538) Investment Income 23,539) 21,726) Purchase of Investments (1,335,832) (869,263) Net Cash Used by Investing Activities (27,269) (3,999)
Net Decrease in Cash and Cash Equivalents (104,903) (76,207) Cash and Cash Equivalents - Beginning of the year 705,885) 782,092)
Cash and Cash Equivalents - End of the year $600,982) $705,885)
(Continued)

- 23-
STATEMENTS OF CASH FLOWS For the Years Ended June 30, 2016 and 2015 (dollars in thousands)
Reconciliation of Operating Loss to 2016 2015 Net Cash Used by Operating Activities:
Operating Loss ($1,018,170) ($1,009,092) Adjustments to Reconcile Operating Loss to Net Cash
Used by Operating Activities: State Paid Fringe Benefits 335,736) 326,690) Depreciation 151,254) 152,525) Amortization 810) 810) Provision for Bad Debts 20,084) 30,862)
Changes in Assets and Liabilities:
Receivables (11,022) (36,562) Inventories (222) 624) Prepaid Expenses and Other Assets 5,226) 8,983) Accounts Payable and Accrued Expenses 17,626) 11,497) Unearned Revenue 107) (13,671) Payroll Withholdings (963) 3,729) Other Payables (472) (3,732) Net Pension Liability 95,834) 67,973)
Net Cash Used by Operating Activities ($404,172) ($459,364)
See accompanying notes to the financial statements.

- 24 -
NOTE 1 - SUMMARY OF SIGNIFICANT ACCOUNTING AND REPORTING POLICIES Organization Rutgers, The State University of New Jersey (the university), one of the nation’s nine colonial colleges, consists of 34 schools and colleges located at campuses in New Brunswick and adjacent areas, Newark and Camden, and maintains educational services in many other communities throughout the State of New Jersey (the State). The university is the State University of New Jersey and the Land Grant College of the State of New Jersey. The university was created as a body corporate and politic with the title “The Trustees of Queens College in New Jersey” by royal charter granted by King George III, on November 10, 1766. In 1945, an act of the State Legislature designated Rutgers as the State University of New Jersey to be utilized as an instrumentality of the State for providing public higher education and thereby increasing the efficiency of its public school system. The university’s title was changed to “Rutgers, The State University” and its charter was amended and supplemented by an act of the Legislature of the State in 1956 (the Rutgers Law). Effective July 1, 2013, the New Jersey Medical and Health Sciences Education Restructuring Act (the Act), (Chapter 45, P.L. 2012), went into effect. The Act integrated the Cancer Institute of New Jersey and all units of the University of Medicine and Dentistry of New Jersey (UMDNJ), except University Hospital (UH) in Newark and the School of Osteopathic Medicine (SOM) in Stratford, into Rutgers. The UMDNJ schools and units transferred to Rutgers and joined the existing Rutgers School of Nursing, Rutgers Ernest Mario School of Pharmacy and the Rutgers Institute of Health, Health Care Policy and Aging Research to form the Rutgers Biomedical and Health Sciences (RBHS) division. Basis of Accounting The basic financial statements of the university have been prepared on the accrual basis of accounting, using the economic resources measurement focus, and in accordance with generally accepted accounting principles as prescribed by the Governmental Accounting Standards Board (GASB). The university reports as a special purpose government engaged only in business type activities as defined in GASB Statement No. 34 Basic Financial Statements – and Management’s Discussion and Analysis – for State and Local Governments as amended by GASB Statement No. 35 Basic Financial Statements – and Management’s Discussion and Analysis – Public Colleges and Universities. Business type activities are those that are financed in whole or in part by fees charged to external parties for goods or services. GASB Statement No. 34 requires that the financial statements be presented on a comprehensive entity-wide basis, reporting the university as an economic unit. Reporting Entity The university’s financial statements and notes thereto include the financial statements of the Rutgers University Foundation (the foundation), the units of the New Market Tax Credit (NMTC) Transaction (One Washington Park), which include One Washington Park Capital, LLC, Parkside RUN Investments, LLC, One Washington Park Holdings, LLC, and Washington Park Fund, LLC, and the University Physician Association of New Jersey, Inc. and Affiliate (UPA). The foundation is a legally separate, not-for-profit organization, which exists solely for the benefit of the university and was formed to aid the university to obtain private funds and other resources to meet the needs and achieve the goals of the university for which adequate funds may not be available from other sources. To fulfill this mission, the foundation solicits and receives gifts and pledges from private sources including individuals, corporations, and foundations. All of the financial data for the foundation is from their audited financial statements, reported in accordance with generally accepted accounting principles promulgated by GASB. The foundation is discretely presented in the university’s financial report as it would be misleading to exclude them and they exist for the direct benefit of the university, its students, and faculty. Copies of the foundation’s financial statements can be obtained by writing to the foundation at Rutgers University Foundation, Winants Hall, 7 College Avenue, New Brunswick, NJ 08901. The governing body of the One Washington Park entities is primarily the same as that of the university, and they provide financing services to the university classifying them as blended component units. Copies of the financial statements for One Washington Park may be obtained by writing to the Executive Director of Business and Financial Services, 249 University Avenue, Room 306, Newark, NJ 07102-1896. UPA, a not-for-profit organization, was incorporated on August 16, 1984. Located in Newark, New Jersey, its primary purpose was to support the UMDNJ through administrative assistance to clinical faculty of the New Jersey Medical School (NJMS). An agreement between UPA and UMDNJ (the Affiliation Agreement) established activities to be

- 25-
performed by UPA in support of UMDNJ. During 1992, UPA established the Doctors’ Center Management Corporation (DCMC) to manage the Doctors Office Center. DCMC is considered an affiliate of UPA and is included in the UPA financial statements. Pursuant to the Act, UMDNJ ceased to exist and NJMS was incorporated within the university. Also effective July 1, 2013, the Affiliation Agreement between UPA and UMDNJ was amended to state that, as of that date, the parties to the Affiliation Agreement are Rutgers and UPA, the effect of which is that Rutgers succeeds to UMDNJ’s obligations under the agreement (which expires on October 31, 2018). The UPA became a component unit of the university due to the integration under the Act and meets the criteria to be reported as a discretely presented component unit of the university since there is a financial benefit and as it would be misleading to exclude the UPA as a result of the nature and significance of their relationship. UPA’s combined financial statements were prepared on a modified basis of cash receipts and disbursements, which is a comprehensive basis of accounting other than accounting principles generally accepted in the United States of America. Separate financial statements for the UPA can be obtained by writing to the Executive Director/ Chief Executive Officer, University Physician Associates of New Jersey, Inc., 30 Bergen Street, ASMC 12, Room 1205, Newark, New Jersey 07107. Under GASB Statement No. 61, The Financial Reporting Omnibus, an amendment of GASB Statement No. 14, The Financial Reporting Entity, and GASB Statement No. 34, the university is considered a component unit of the State of New Jersey for financial reporting purposes. Accordingly, the university’s financial statements are included in the State of New Jersey’s Comprehensive Annual Financial Report. Cash and Cash Equivalents Current cash and cash equivalents, which are both unrestricted and restricted in nature, consist of cash on hand, and all highly liquid investments with an original maturity of three months or less except for those managed as a component of the university’s investment portfolio. Noncurrent unrestricted cash and cash equivalents consist of funds that are not externally restricted and are to be used to purchase plant related items not related to capital construction. Noncurrent restricted cash and cash equivalents are externally restricted to maintain sinking or reserve funds, purchase or construct capital or other noncurrent assets, or are related to endowed funds. Investments Investments are recorded in the statements of net position at fair value, amortized cost and net asset value depending on asset type. Investments measured at fair value are based upon quoted market prices for identical or similar assets, sometimes using observable and unobservable inputs such as exchange rates, options, etc.; while investment assets such as money market funds and commercial paper are held at amortized cost., Investments in alternative investment funds are generally reported as a practical expedient to fair value as provided by external investment managers which are reviewed and evaluated by the university’s management for reasonableness. Investments with a maturity greater than one year and investments externally restricted for endowment purposes, to maintain sinking or reserve funds, and to purchase or construct capital or other noncurrent assets, including investments held by trustees, are classified as noncurrent assets in the statements of net position. The year-to-year change in the fair value of investments is reported in the statements of revenues, expenses, and changes in net position as net increase in fair value of investments. Funds Held in Trust Funds held in trust by others or not in the possession of, nor under the control of, the university are not included in the university’s accompanying financial statements because they do not meet eligibility requirements for recognition. The market value of such funds aggregated approximately $60.0 million at June 30, 2016 ($63.7 million in 2015). Income derived from such irrevocable trust funds held by others, aggregating approximately $2.2 million in 2016 ($2.2 million in 2015), is reported in the accompanying financial statements as non-operating revenue. Prior to July 1, 2013, the New Jersey Health Foundation (NJHF) operated to support medical, dental and other healthcare education and research of UMDNJ and for other scientific, charitable, literary and educational purposes. As a result of the integration of UMDNJ, except for UH and SOM, into the university, the fundraising function for the resulting RBHS division was assumed by the foundation on July 1, 2013. The NJHF is not considered a component unit within the university. However, the NJHF holds permanently restricted net assets for RBHS that consist of endowment contributions from donors with income to be used for specific or general purposes, as well as temporarily restricted net assets for RBHS subject to donor imposed stipulations that will be met by actions of NJHF or by the passage of time.

- 26 -
Inventories Inventories are stated at lower of cost or market. Cost is determined principally on a first-in, first-out basis. Capital Assets Capital assets consist of land, buildings, land improvements and infrastructure, equipment, construction in progress and art collections. Capital assets are recorded at cost at the date of acquisition, or fair market value on the date of gift if donated, and are shown net of accumulated depreciation. Depreciation on buildings, land improvements and infrastructure, and equipment is calculated using the straight-line method over the assets’ estimated useful lives, ranging from 5 to 50 years. Library books totaling approximately 6.1 million volumes in 2016 (6.0 million volumes in 2015) have not been capitalized. The capitalization threshold is $5,000 and above. Works of art or historical treasures that are held for public exhibition, education, or research in furtherance of public service are capitalized at the acquisition value of the item at the time of acquisition. Unearned Revenue Unearned revenue includes summer session activity for July and August which will be recognized as revenue and expense in the following fiscal year. In addition, capital State grants, including the Capital Improvement Fund (CIF), Equipment Leasing Fund (ELF), the Higher Education Technology Infrastructure (HETI), and the Higher Education Facilities Trust (HEFT), for which all eligibility requirements for revenue recognition have not been met, are included as noncurrent unearned revenue. Net Position (Deficit) Net position is the difference between the university’s assets and deferred outflows of resources, and its liabilities and deferred inflows of resources. These resources are classified for accounting and reporting purposes into four categories as follows: Net investment in capital assets represents the university’s investment in capital assets, net of outstanding debt obligations related to those capital assets. Restricted net position – nonexpendable consists of endowment and similar type funds for which donors or other outside sources have stipulated, as a condition of the gift instrument, that the principal is to be maintained inviolate and in perpetuity, and invested for the purpose of producing income, which may either be expended or added to principal. Restricted net position – expendable includes all resources for which the university is legally or contractually obligated to spend the resources in accordance with restrictions imposed by external third parties as well as Perkins loans and U.S. government grants refundable. Unrestricted net position (deficit) represents resources available to the university for educational and general operations and spendable endowment income. These resources are derived from student tuition and fees, state appropriations, net patient service revenue, and sales and services of educational departments and auxiliary enterprises. Auxiliary enterprises and several academic programs, such as summer session and continuing education, are substantially self-supporting activities that provide services for students, faculty and staff. Under the university’s decentralized management structure, it is the responsibility of individual departments to determine whether to first apply restricted or unrestricted resources when an expense is incurred for purposes for which both restricted and unrestricted net position is available.

- 27-
Revenue Recognition Revenues from student tuition and fees and auxiliary enterprises are presented net of scholarship allowances applied to student accounts and are recognized in the period earned. Other payments made directly to students are presented as scholarships and are included in operating expenses in the period incurred. Grants and contracts revenue is comprised mainly of funds received from grants from federal, State of New Jersey and municipal and other nongovernmental sources and is recognized when all eligibility requirements for revenue recognition are met, which is generally the period in which the related expenses are incurred. Net patient services revenues are generated from patient care services and include the university’s behavioral healthcare, cancer and contract activities and the operations of faculty practice plans. Net patient service revenues are recorded in the period in which the services are provided and are reported at estimated net realizable amounts from patients, third party payors and others. Amounts recorded are net of allowances to give recognition to differences between charges and reimbursement rates from third faculty practice party payors. Reimbursement from third party payors varies, depending upon the type and level of care provided. Certain net revenues received are subject to audit and retroactive adjustments for which amounts are accrued on an estimated basis in the period the related services are rendered and adjusted in future periods as final settlements are determined. Revenue from State appropriations is recognized in the fiscal year for which the State of New Jersey appropriates the funds to the university. The university is fiscally dependent upon these appropriations. Contributions are recognized as revenues when all eligibility requirements are met, which is generally in the period donated. Additions to permanent endowments are recognized upon receipt. Endowment and investment income is recognized in the period earned. Classification of Revenue The university’s policy for defining operating activities in the statements of revenues, expenses, and changes in net position are those that serve the university’s principal purpose and generally result from exchange transactions such as the payment received for services and payment made for the purchase of goods and services. Examples include (1) student tuition and fees, net of scholarship allowances, (2) auxiliary enterprises, net of scholarship allowances, (3) most federal, state and municipal and other nongovernmental grants and contracts, and (4) net patient services. Non-operating revenues include activities that have the characteristics of nonexchange transactions, such as operating appropriations from the State, student aid, endowment and investment income and contributions. Interest on capital asset related debt is reported as non-operating expenses. Scholarships and Fellowships Scholarships, fellowships or stipends include payments made directly to students in the form of student aid. Any aid applied directly to the students’ accounts in payment of tuition and fees, housing charges and dining services is reflected as a scholarship allowance and is deducted from the university’s revenues. Certain governmental grants, such as Pell grants, and other federal, state or nongovernmental programs, are recorded as non-operating revenues in the university’s financial statements. To the extent that revenues from such programs are used to satisfy tuition and fees and other student charges, the university has recorded a scholarship discount and allowance. The university received $76.3 million during the year ended June 30, 2016 ($74.9 million in 2015), from the Federal Pell Grant program, and $93.9 million during the year ended June 30, 2016 ($92.7 million in 2015), from Tuition Aid Grants, from the State of New Jersey, the largest state student aid program. The university distributes loans to students under the Federal Direct Student Loan Program. Under this program, the U.S. Department of Education makes interest subsidized and unsubsidized loans, through schools, directly to students. During the year ended June 30, 2016, the university disbursed $420.3 million ($409.6 million in 2015) under the Federal Direct Student Loan Program. Direct student loans receivable are not included in the university’s statements of net position since they are repayable directly to the U.S. Department of Education.

- 28 -
Income Taxes The university is exempt from income taxes on related income pursuant to federal and state tax laws as an instrumentality of the State of New Jersey. Use of Estimates The preparation of financial statements in conformity with U.S. generally accepted accounting principles requires management to make estimates and assumptions that affect the reported amounts of assets and liabilities and disclosure of contingent assets and liabilities at the date of the financial statements and the reported amounts of revenues and expenses during the reporting period. Actual results could differ from those estimates. Accounting Pronouncements Applicable to the System, Issued but Not Yet Effective In June 2015, the GASB issued Statement No 75, Accounting and Financial Reporting for Postemployment Benefits Other Than Pensions (GASB 75). The statement addresses accounting and financial reporting for other postemployment benefits (OPEB) that are provided to the employees of state and local governmental employers. GASB 75 establishes standards for recognizing and measuring liabilities, deferred outflows of resources, deferred inflows of resources, and expenses related to OPEB in the basic financial statements, in addition to requiring more extensive note disclosures and required supplementary information. GASB 75 will be effective for periods beginning after June 15, 2017. The university is evaluating the impact of this new statement. In January 2016, the GASB issued Statement No. 80, Blending Requirements for Certain Component Units – An Amendment of GASB Statement No. 14 (GASB 80). This statement improves financial reporting by clarifying the financial statement presentation requirements for certain component units and amends the blending requirements for the financial statement presentation of component units of all state and local governments. The additional criterion requires blending of a component unit incorporated as a not-for-profit corporation in which the primary government is the sole corporate member. The additional criterion does not apply to component units included in the financial reporting entity pursuant to the provisions of GASB 39. GASB 80 will be effective for reporting periods beginning after June 30, 2016. The university is evaluating the impact of this new statement. In March 2016, the GASB issued Statement No. 81, Irrevocable Split-Interest Agreements (GASB 81). This statement is to improve accounting and financial reporting for irrevocable split-interest agreements by providing recognition and measurement guidance for situations in which a government is a beneficiary of the agreement. This statement requires that a government that receives resources pursuant to an irrevocable split-interest agreement recognize assets, liabilities, and deferred inflows of resources at the inception of the agreement and that a government recognizes revenue when the resources become applicable to the reporting period. GASB 81 will be effective for reporting periods beginning after December 15, 2016, and should be applied retroactively. The university is evaluating the impact of this new statement. NOTE 2 – ADOPTION OF ACCOUNTING PRONOUNCEMENTS The university adopted GASB Statement No, 72, Fair Value Measurement and Application (GASB 72). The statement addresses accounting and financial reporting issues related to fair value measurements of assets and liabilities. GASB 72 identifies various approaches to measuring fair value and levels of inputs based on the objectivity of the data used to measure fair value. It provides additional fair value application guidance and requires enhanced disclosures about fair value measurements. The impact on the financial statements is disclosures only.
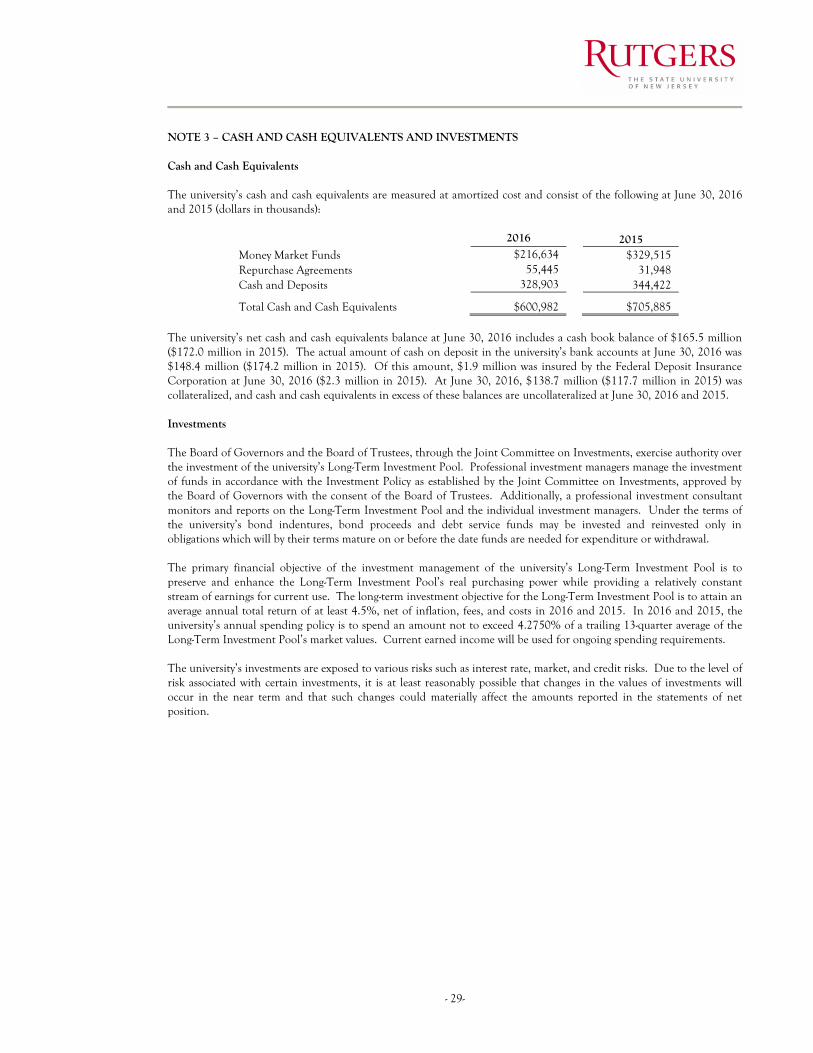
- 29-
NOTE 3 – CASH AND CASH EQUIVALENTS AND INVESTMENTS Cash and Cash Equivalents The university’s cash and cash equivalents are measured at amortized cost and consist of the following at June 30, 2016 and 2015 (dollars in thousands):
2016 2015
Money Market Funds $216,634 $329,515 Repurchase Agreements 55,445 31,948 Cash and Deposits 328,903 344,422
Total Cash and Cash Equivalents $600,982
$705,885 The university’s net cash and cash equivalents balance at June 30, 2016 includes a cash book balance of $165.5 million ($172.0 million in 2015). The actual amount of cash on deposit in the university’s bank accounts at June 30, 2016 was $148.4 million ($174.2 million in 2015). Of this amount, $1.9 million was insured by the Federal Deposit Insurance Corporation at June 30, 2016 ($2.3 million in 2015). At June 30, 2016, $138.7 million ($117.7 million in 2015) was collateralized, and cash and cash equivalents in excess of these balances are uncollateralized at June 30, 2016 and 2015. Investments The Board of Governors and the Board of Trustees, through the Joint Committee on Investments, exercise authority over the investment of the university’s Long-Term Investment Pool. Professional investment managers manage the investment of funds in accordance with the Investment Policy as established by the Joint Committee on Investments, approved by the Board of Governors with the consent of the Board of Trustees. Additionally, a professional investment consultant monitors and reports on the Long-Term Investment Pool and the individual investment managers. Under the terms of the university’s bond indentures, bond proceeds and debt service funds may be invested and reinvested only in obligations which will by their terms mature on or before the date funds are needed for expenditure or withdrawal. The primary financial objective of the investment management of the university’s Long-Term Investment Pool is to preserve and enhance the Long-Term Investment Pool’s real purchasing power while providing a relatively constant stream of earnings for current use. The long-term investment objective for the Long-Term Investment Pool is to attain an average annual total return of at least 4.5%, net of inflation, fees, and costs in 2016 and 2015. In 2016 and 2015, the university’s annual spending policy is to spend an amount not to exceed 4.2750% of a trailing 13-quarter average of the Long-Term Investment Pool’s market values. Current earned income will be used for ongoing spending requirements. The university’s investments are exposed to various risks such as interest rate, market, and credit risks. Due to the level of risk associated with certain investments, it is at least reasonably possible that changes in the values of investments will occur in the near term and that such changes could materially affect the amounts reported in the statements of net position.

- 30 -
The university’s investments consist of the following at June 30, 2016 and 2015 (dollars in thousands):
2016 2015
Commercial Paper $40,035 $114,696 Common Stock 121,592 102,310 Government Agencies 26,815 144,283 Government Bonds 126,311 27,406 Corporate Bonds 3,545 2,858 Mutual Funds – Common Stock 469,502 415,032 Mutual Funds – Corporate Bonds 16,383 15,220 Mutual Funds – Government Agencies 195,846 160,571 Mutual Funds – Other Fixed Income 126,256 102,931 Fixed Income Fund 26,350 24,760 Hedge Fund 199,310 209,730 Private Equity/Venture Capital 82,214 81,336 Real Estate 57,051 49,607 Real Assets 30,794 24,617 Other 4,568 4,566
Total $1,526,572 $1,479,923 The hedge fund description includes: Credit, Long/Short Equity, Global Macro and Multi-Strategy and Other Hedge Funds. Fair Value Measurement Fair value is defined as the price that would be received to sell an asset or paid to transfer a liability in an orderly transaction between market participants at the financial statement measurement date. The fair value hierarchy categorizes the inputs to valuation techniques used to measure fair value into three levels as follows: Level 1 – unadjusted quoted prices for identical assets or liabilities in active markets that a government can access at the measurement date. Level 2 – quoted prices other than those included within Level 1 and other inputs that are observable for an asset or liability, either directly or indirectly. Level 3 – unobservable inputs for an asset or liability. The fair value hierarchy gives the highest priority to Level 1 inputs and the lowest priority to Level 3. When the fair value of an asset or a liability is measured using inputs from more than one level of the fair value hierarchy, the measurement is considered to be based on the lowest priority level that is significant to the entire measurement. While the university believes its valuation methods are appropriate and consistent with other market participants, the use of different methodologies or assumptions to determine the fair value of certain financial instruments could result in a different estimate of fair value at the reporting date. The following is a description of the valuation methodologies used for instruments measured at fair value: All or a portion of the following categories were classified in Level 1 of the hierarchy as they are valued using prices quoted in active markets: Common Stock, Mutual Funds – Common Stock, Mutual Funds – Government Agencies, Mutual Funds – Other Fixed Income.
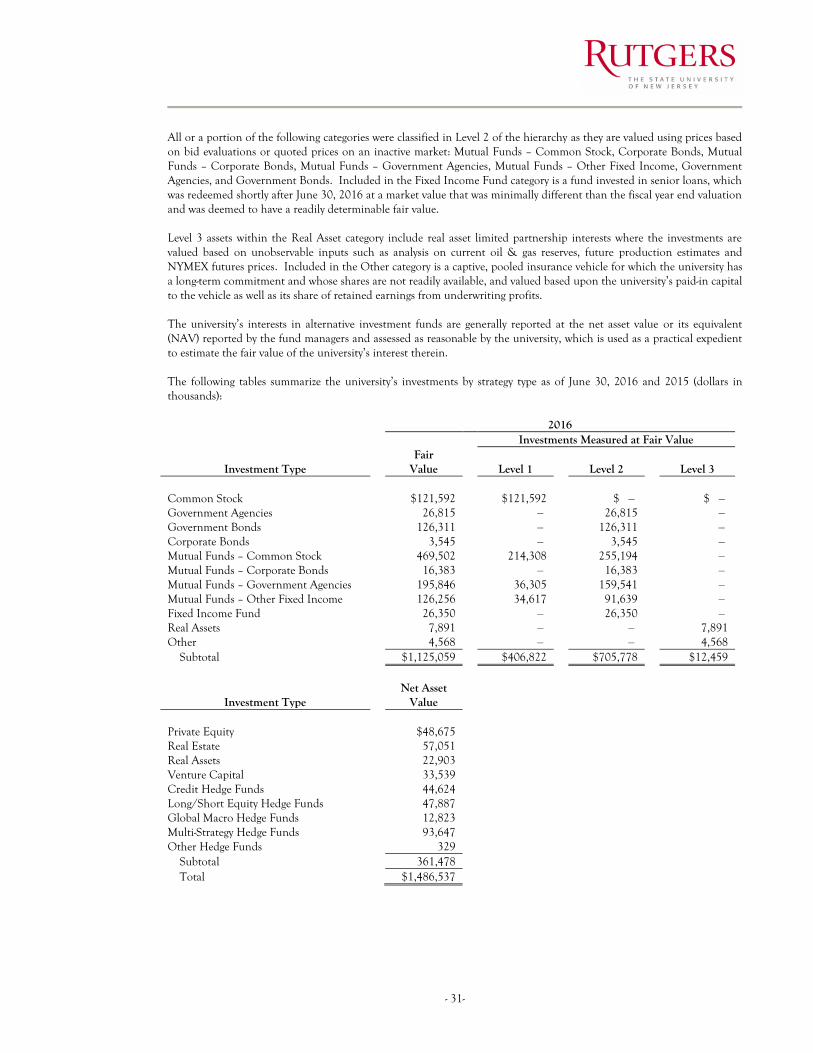
- 31-
All or a portion of the following categories were classified in Level 2 of the hierarchy as they are valued using prices based on bid evaluations or quoted prices on an inactive market: Mutual Funds – Common Stock, Corporate Bonds, Mutual Funds – Corporate Bonds, Mutual Funds – Government Agencies, Mutual Funds – Other Fixed Income, Government Agencies, and Government Bonds. Included in the Fixed Income Fund category is a fund invested in senior loans, which was redeemed shortly after June 30, 2016 at a market value that was minimally different than the fiscal year end valuation and was deemed to have a readily determinable fair value. Level 3 assets within the Real Asset category include real asset limited partnership interests where the investments are valued based on unobservable inputs such as analysis on current oil & gas reserves, future production estimates and NYMEX futures prices. Included in the Other category is a captive, pooled insurance vehicle for which the university has a long-term commitment and whose shares are not readily available, and valued based upon the university’s paid-in capital to the vehicle as well as its share of retained earnings from underwriting profits. The university’s interests in alternative investment funds are generally reported at the net asset value or its equivalent (NAV) reported by the fund managers and assessed as reasonable by the university, which is used as a practical expedient to estimate the fair value of the university’s interest therein. The following tables summarize the university’s investments by strategy type as of June 30, 2016 and 2015 (dollars in thousands):
2016
Investments Measured at Fair Value
Fair
Investment Type
Value
Level 1
Level 2
Level 3 SPACE
Common Stock
$121,592
$121,592
$ ‒)
$ ‒) Government Agencies 26,815 ‒) 26,815 ‒) Government Bonds 126,311 ‒) 126,311 ‒) Corporate Bonds
3,545
‒)
3,545
‒)
Mutual Funds – Common Stock 469,502 214,308 255,194 ‒) Mutual Funds – Corporate Bonds
16,383
‒)
16,383
‒)
Mutual Funds – Government Agencies
195,846
36,305
159,541
‒) Mutual Funds – Other Fixed Income
126,256
34,617
91,639
‒)
Fixed Income Fund 26,350 ‒) 26,350 ‒) Real Assets 7,891 ‒) ‒) 7,891 Other 4,568 ‒) ‒) 4,568
Subtotal
$1,125,059
$406,822
$705,778
$12,459 SPACE
Net Asset
Investment Type
Value
Private Equity
$48,675
Real Estate 57,051
Real Assets
22,903
Venture Capital
33,539
Credit Hedge Funds
44,624
Long/Short Equity Hedge Funds
47,887
Global Macro Hedge Funds
12,823
Multi-Strategy Hedge Funds
93,647
Other Hedge Funds
329
Subtotal
361,478
Total
$1,486,537

- 32 -
2015
Investments Measured at Fair Value
Fair
Investment Type
Value
Level 1
Level 2
Level 3 SPACE
Common Stock
$102,310
$102,310
$ ‒)
$ ‒) Government Agencies 144,283 ‒) 144,283 ‒) Government Bonds 27,406 ‒) 27,406 ‒) Corporate Bonds
2,858
‒)
2,858
‒)
Mutual Funds – Common Stock 415,032 129,110 285,922 ‒) Mutual Funds – Corporate Bonds
15,220
‒)
15,220
‒)
Mutual Funds – Government Agencies
160,571
24,100
136,471
‒) Mutual Funds – Other Fixed Income
102,931
31,501
71,430
‒)
Real Assets
3,056
‒)
‒)
3,056 Other
4,566
‒)
‒)
4,566
Subtotal
$978,233
$287,021
$683,590
$7,622 SPACE
Net Asset
Investment Type
Value
Fixed Income Fund $24,760 Private Equity
47,609
Real Estate 49,607 Real Assets
21,561
Venture Capital
33,727
Credit Hedge Funds
41,124
Long/Short Equity Hedge Funds
45,945
Global Macro Hedge Funds
27,826
Multi-Strategy Hedge Funds
94,410
Other Hedge Funds
425
Subtotal
386,994
Total
$1,365,227
Investments Measured at Net Asset Value In addition to traditional stocks and fixed-income securities, the university also holds alternative investment funds including hedge fund, private equity, venture capital, real estate and real asset strategies. Alternative investments are typically subject to restrictions that limit the university’s ability to withdraw capital after such investment and, most often in hedge funds, limit the amount that may be withdrawn as of a given redemption date. The redemption terms of the university’s investments in hedge fund strategies funds vary greatly (as described below). Generally, the university has no discretion to withdraw its investments in private equity, venture capital, real estate and real asset funds; distributions are made when sales of assets are made within the funds.

- 33-
The university is obligated in most alternative strategies to fund investment opportunities as they arise up to specified commitment levels over a period of several years. These commitments have fixed expiration dates and other termination clauses. The following table represents the unfunded commitments, redemption frequency and redemption notice period for investments measured at NAV as of June 30, 2016 and 2015 (dollars in thousands):
Investment Type
2016 Unfunded
Commitments
2015 Unfunded
Commitments
Redemption Frequency
Redemption Notice Period
Private Equity
$73,951 $45,498
Illiquid
N/A
Real Estate 21,070 19,795 Illiquid N/A
Real Assets
18,496 30,234
Illiquid
N/A
Venture Capital
21,450 6,389
Illiquid
N/A
Credit Hedge Funds
N/A N/A
Quarterly, Annually
45 - 90 days
Long/Short Equity Hedge Funds
N/A N/A Monthly, Quarterly,
Annually 45 - 60 days
Global Macro Hedge Funds
N/A N/A
Quarterly
90 days
Multi-Strategy Hedge Funds
N/A N/A Quarterly, Semi-
Annually, Annually, Rolling Two-years
60 - 90 days
Total
$134,967 $101,916
Because of the inherent uncertainties of valuation, these net asset values may differ significantly from values that would have been used had a ready market existed, and the differences could be material. Such valuations are determined by fund managers and generally consider variables such as operating results, comparable earnings multiples, projected cash flows, recent sales prices, and other pertinent information, and may reflect discounts for the illiquid nature of certain investments held. Management’s estimate of the lives of the funds could vary significantly depending on the investment decisions of the external fund managers, changes in the university’s portfolio, and other circumstances. Furthermore, the university’s obligation to fund the commitments noted above may be waived by the fund manager for a variety of reasons including market conditions and/or changes in investment strategy. The university does have various sources of internal liquidity at its disposal, including cash and cash equivalents, which are available to fund the required commitments.

- 34 -
Strategy Descriptions Private Equity – Funds that typically invest in private companies or engage in buyouts of public companies with the intent of improving their portfolio companies by investing in their growth as well as implementing operational and financial best practices. These strategies are implemented through illiquid vehicles and cannot be redeemed. The investment periods of these funds typically range from 2 – 5 years with full terms of 10 – 12 years. Capital is distributed back as the fund’s investments are liquidated over that time period. Real Estate – This strategy includes funds that invest in the equity or debt of real estate assets or businesses related to the real estate industry. These strategies are implemented through illiquid vehicles and cannot be redeemed. The investment periods of these funds typically range from 2 – 5 years with full terms of 10 – 12 years. Capital is distributed back as the fund’s investments are liquidated over that time period. Real Assets – This strategy includes funds that invest in businesses or physical commodities in a wide variety of asset classes including but not limited to - energy, infrastructure, metals and mining, and other commodity-related industries. These strategies are implemented through illiquid vehicles and cannot be redeemed. The investment periods of these funds typically range from 2 – 5 years with full terms of 10 – 12 years. Capital is distributed back as the fund’s investments are liquidated over that time period. Venture Capital – Funds that invest in early, mid and late stage high growth companies, which are typically at the cutting edge of innovation in their specific fields. These are typically higher risk/reward opportunities in the fields of technology and medicine of which the companies will generally have negative cash flow at the start. These strategies are implemented through illiquid vehicles and cannot be redeemed. The investment periods of these funds typically range from 2 – 5 years with full terms of 10 – 12 years. Capital is distributed back as the fund’s investments are liquidated over that time period. Credit Hedge Funds – Strategies that typically invest both long and short in high yield and high grade bonds, structured products, and distressed debt strategies that take advantage of corporate securities in default, under bankruptcy protection, in distress, or in liquidation. Two of the current investments within the portfolio have redemption restriction mechanisms whereas once a redemption is submitted the investor can only receive 25% of its capital per quarter. Long/Short Equity Hedge Funds – Strategies that typically invest in long and short positions primarily in publicly traded equities. Within this portfolio there is one position that currently has a redemption restriction until April 1, 2018 and will revert back to quarterly liquidity once that restriction has passed. Global Macro Hedge Funds – Strategies which base its exposures on economic and political views and outcomes from around the world and in many markets. Funds of this nature can invest in a wide variety of securities such as equity, fixed income, currencies, commodities and futures markets. Multi-Strategy Hedge Funds – Multi-strategy hedge funds consist of variety of investment strategies such as equity long/short, convertible bond arbitrage, credit, merger and statistical arbitrage, event driven, etc. in order to lower and diversify risk as well as reduce volatility. Other Hedge Funds – Legacy hedge fund positions which have been redeemed from but continue to be liquidated.

- 35-
Interest Rate Risk Interest rate risk is the risk that changes in interest rates will adversely affect the fair value of an investment. The operating funds of the university are managed against the expected cash requirements of these funds. The university projects its cash requirements and arranges investment maturities accordingly. Special attention is given to the interest rate environment in times of economic growth or downturns. The table below reflects the operation of this process. Endowment funds have a much longer outlook and are invested by professional managers against an index as provided in the university’s investment guidelines. For the university, the following table summarizes the maturities of investments that are subject to interest rate risk at June 30, 2016 and 2015 (dollars in thousands): 2016
Investment Maturities (in years)
Fair
Less
More
Investment Type Value
Than 1
1-5
6-10
Than 10
U.S. Government Bonds $126,311 $123,584 $ —) )$1,086 $1,641 U.S. Government Agencies 26,815 26,808 —) 7 —) Corporate Bonds 3,545 —) 544 2,344 657 Mutual Funds – Corporate
Bonds, Government Agencies, and Other Fixed Income
338,485 338,485 —) —) —) Total $495,156 $488,877 $544 $3,437 $2,298
2015
Investment Maturities (in years)
Fair
Less
More
Investment Type Value
Than 1
1-5
6-10
Than 10
U.S. Government Bonds $27,406 $24,950 $ —) $1,055 $1,401 U.S. Government Agencies 144,283 110,319 33,931 33 —) Corporate Bonds 2,858 145 546 1,544 623 Mutual Funds – Corporate
Bonds, Government Agencies, and Other Fixed Income
278,722 278,722 —) —) —) Total $453,269 $414,136 $34,477 $2,632 $2,024
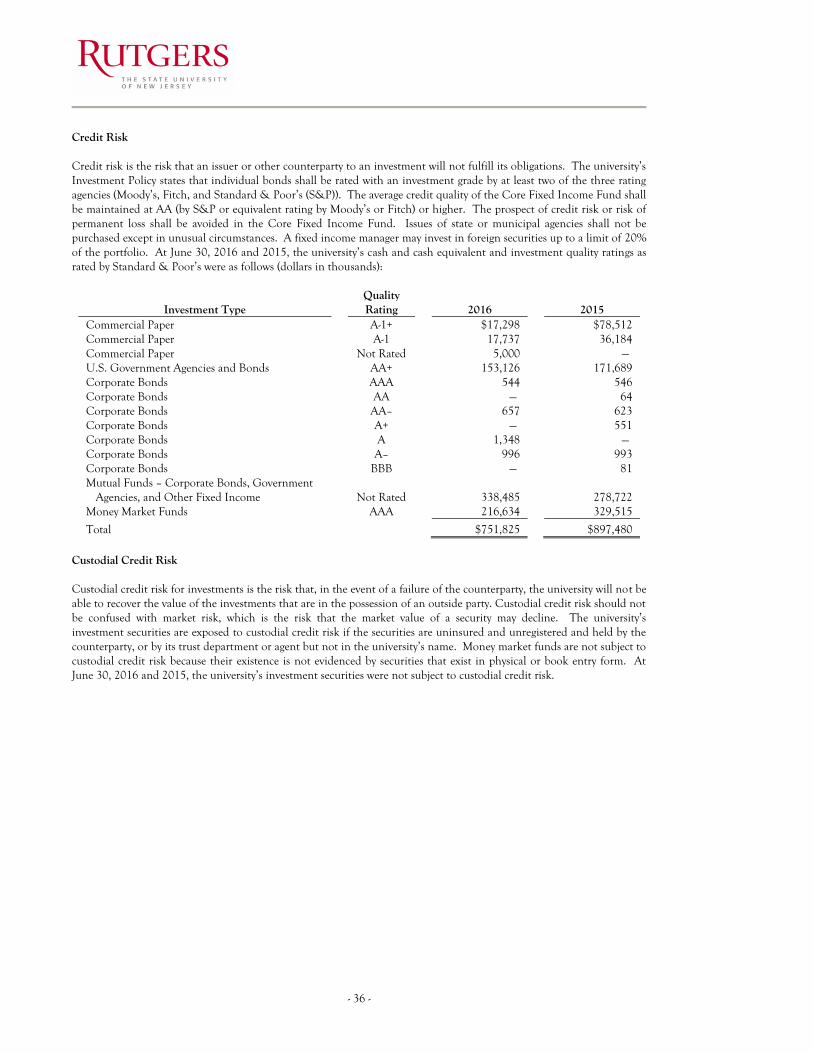
- 36 -
Credit Risk Credit risk is the risk that an issuer or other counterparty to an investment will not fulfill its obligations. The university’s Investment Policy states that individual bonds shall be rated with an investment grade by at least two of the three rating agencies (Moody’s, Fitch, and Standard & Poor’s (S&P)). The average credit quality of the Core Fixed Income Fund shall be maintained at AA (by S&P or equivalent rating by Moody’s or Fitch) or higher. The prospect of credit risk or risk of permanent loss shall be avoided in the Core Fixed Income Fund. Issues of state or municipal agencies shall not be purchased except in unusual circumstances. A fixed income manager may invest in foreign securities up to a limit of 20% of the portfolio. At June 30, 2016 and 2015, the university’s cash and cash equivalent and investment quality ratings as rated by Standard & Poor’s were as follows (dollars in thousands):
Investment Type Quality Rating
2016
2015
Commercial Paper A-1+ $17,298 $78,512 Commercial Paper A-1 17,737 36,184 Commercial Paper Not Rated 5,000 —) U.S. Government Agencies and Bonds AA+
153,126 171,689
Corporate Bonds AAA
544 546 Corporate Bonds AA
—) 64
Corporate Bonds AA– 657 623 Corporate Bonds A+ —) 551 Corporate Bonds A 1,348 —) Corporate Bonds A– 996 993 Corporate Bonds BBB —) 81 Mutual Funds – Corporate Bonds, Government
Agencies, and Other Fixed Income
Not Rated
338,485 278,722 Money Market Funds AAA
216,634 329,515
Total
$751,825 $897,480 Custodial Credit Risk Custodial credit risk for investments is the risk that, in the event of a failure of the counterparty, the university will not be able to recover the value of the investments that are in the possession of an outside party. Custodial credit risk should not be confused with market risk, which is the risk that the market value of a security may decline. The university’s investment securities are exposed to custodial credit risk if the securities are uninsured and unregistered and held by the counterparty, or by its trust department or agent but not in the university’s name. Money market funds are not subject to custodial credit risk because their existence is not evidenced by securities that exist in physical or book entry form. At June 30, 2016 and 2015, the university’s investment securities were not subject to custodial credit risk.

- 37-
Investments - Endowment Funds The majority of endowment funds assets are in the Long-Term Investment Pool. Each individual fund subscribes to or disposes of units in the pools on the basis of the per-unit market value at the beginning of the three-month period within which the transaction takes place. At June 30, 2016, the fair value of the Long-Term Investment Pool was $953.7 million ($879.4 million in 2015). In addition, the aggregate endowment market value of funds separately invested was $45.8 million at June 30, 2016 ($36.8 million in 2015). The investment appreciation was $125.1 million at June 30, 2016 ($161.3 million in 2015). These amounts are included in restricted nonexpendable, restricted expendable and unrestricted net position. The university employs a spending policy which provides for annual spending at a stated rate determined by the Joint Investment Committee of the Board of Governors and the Board of Trustees. Income earned above the stated rate is reinvested and added to the endowment principal, while any shortfall is covered by capital appreciation. The university complies with the “Uniform Prudent Management of Institutional Funds Act” (UPMIFA) P.L. 2009, Chapter 64, adopted by New Jersey. This law speaks to the management and use of funds held by charitable institutions. NOTE 4 – ACCOUNTS RECEIVABLE AND ALLOWANCE FOR DOUBTFUL ACCOUNTS Accounts receivable are shown net of the allowance for doubtful accounts and are comprised of the following at June 30, 2016 and 2015 (dollars in thousands):
Accounts Receivable
Allowance
Net 2016
Government Grants and Other Sponsored Programs Receivable $127,399 $1,690 $125,709
Plant Receivable 90,303 —) 90,303 Student Notes Receivable 75,133 6,256 68,877 Patient Accounts Receivable 62,665 13,089 49,576 Federal and State Governments Receivable 39,748 —) 39,748 Student Accounts Receivable 38,755 8,833 29,922 Affiliate Receivable 66,601 8,385 58,216 Other Receivable 25,494 1,372 24,122
Total $526,098 $39,625 $486,473

- 38 -
Accounts Receivable
Allowance
Net 2015
Government Grants and Other Sponsored Programs Receivable $130,879 $1,714 $129,165
Plant Receivable 88,069 —) 88,069 Student Notes Receivable 75,596 6,089 69,507 Patient Accounts Receivable 59,912 12,574 47,338 Federal and State Governments Receivable 40,297 —) 40,297 Student Accounts Receivable 29,412 8,211 21,201 Affiliate Receivable 84,250 6,063 78,187 Other Receivable 39,826 1,397 38,429
Total $548,241 $36,048 $512,193 The allowances for doubtful accounts and notes are based upon management’s best estimate of uncollectible accounts and notes at June 30, 2016 and 2015, considering type, age, collection history and other appropriate factors. NOTE 5 – NET PATIENT SERVICE REVENUES Net patient service revenues include revenues related to patient care services, which are generated within RBHS behavioral healthcare, community healthcare centers, cancer and contract activities and the operations of faculty practice plans. Net revenues generated from faculty practice plans totaled $239.0 million in 2016 ($233.7 million in 2015), while revenues from a contract with the State of New Jersey Department of Corrections totaled $149.4 million in 2016 ($145.9 million in 2015), and revenues from other professional contracts and agreements totaled $77.8 million in 2016 ($80.0 million in 2015). University Behavioral Health Care (UBHC) provides care to patients who meet certain criteria defined by the New Jersey Department of Health and Senior Services and the Department of Human Services without charge or at amounts less than their established rates. UBHC and other units maintain records to identify and monitor the level of charity care they provide, which includes the amount of gross charges foregone for services and supplies furnished. Patient care revenues from these units totaled $67.7 million in 2016 ($58.4 million in 2015). Net patient service revenues are comprised of the following at June 30, 2016 and 2015 (dollars in thousands):
2016 2015 Gross Charges $848,760) $820,281) Deductions from Gross Charges
Contractual and Other Allowances (294,744) (271,400) Provision for Bad Debts (20,084) (30,862)
Net Patient Service Revenues $533,932) $518,019)

- 39-
NOTE 6 – CAPITAL ASSETS The detail of capital assets activity for the years ended June 30, 2016 and 2015 is as follows (dollars in thousands):
July 1, 2015
Additions
Retirements/ Capitalization
June 30, 2016
Capital Assets Not Being Depreciated: Land $77,223 $703 $ —)) $77,926
Capitalized Art Collections 60,360 246 —)) 60,606 Construction in Progress 370,852 319,282 288,975) 401,159
Total 508,435 320,231 288,975) 539,691 Capital Assets Being Depreciated:
Land Improvements 331,636 26,358 —)) 357,994 Buildings 4,058,454 297,248 37,251) 4,318,451 Equipment 917,973 39,047 6,877) 950,143
Total 5,308,063 362,653 44,128) 5,626,588 Less Accumulated Depreciation:
Land Improvements 255,546 12,893 —)) 268,439 Buildings 1,593,708 93,268 615) 1,686,361 Equipment 732,103 45,093 4,960) 772,236
Total 2,581,357 151,254 5,575) 2,727,036 Net Capital Assets Being Depreciated 2,726,706 211,399 38,553) 2,899,552 Total Capital Assets, net $3,235,141 $531,630 $327,528) $3,439,243
During 2016, the university capitalized interest expense of $13.2 million in construction in progress in the accompanying statements of net position.
July 1, 2014
Additions
Retirements/ Capitalization
June 30, 2015
Capital Assets Not Being Depreciated: Land $74,088 $3,135 $ —) $77,223
Capitalized Art Collections 59,795 565 —) 60,360 Construction in Progress 222,478 260,806 112,432 370,852
Total 356,361 264,506 112,432 508,435 Capital Assets Being Depreciated:
Land Improvements 321,423 10,213 —) 331,636 Buildings 3,935,639 122,954 139 4,058,454 Equipment 876,268 54,209 12,504 917,973
Total 5,133,330 187,376 12,643 5,308,063 Less Accumulated Depreciation:
Land Improvements 242,516 13,030 —) 255,546 Buildings 1,499,076 94,737 105 1,593,708 Equipment 696,924 44,758 9,579 732,103
Total 2,438,516 152,525 9,684 2,581,357 Net Capital Assets Being Depreciated 2,694,814 34,851 2,959 2,726,706 Total Capital Assets, net $3,051,175 $299,357 $115,391 $3,235,141
During 2015, the university capitalized interest expense of $13.9 million in construction in progress in the accompanying statements of net position.

- 40 -
NOTE 7 – ACCOUNTS PAYABLE AND ACCRUED EXPENSES Accounts payable and accrued expenses consist of the following at June 30, 2016 and 2015 (dollars in thousands):
2016 2015
Vendors $125,100 $130,560 Accrued Salaries and Benefits 131,475 101,203 Compensated Absences 88,436 89,169 Workers Compensation 32,839 35,653 Interest Payable 12,879 10,155 Retainage 11,075 8,989 Other Accrued Expenses 37,984 23,366
Total Accounts Payable and Accrued Expenses $439,788 $399,095 NOTE 8 – NONCURRENT LIABILITIES Noncurrent liability activity for the years ended June 30, 2016 and 2015 is as follows (dollars in thousands):
July 1, 2015 Additions Reductions June 30, 2016 Current Portion
Accounts Payable and Accrued Expenses $399,095 $58,921 $18,228 $439,788 $392,587
Net Pension Liabilities 1,354,656 412,822 122,737 1,644,741 —) Unearned Revenue 262,612 —) 69,146 193,466 93,019 Long-Term Liabilities 2,008,975 192,328 231,976 1,969,327 57,943 Total Noncurrent
Liabilities $4,025,338 $664,071 $442,087 $4,247,322 $543,549
space space
July 1, 2014 Additions Reductions June 30, 2015 Current Portion
Accounts Payable and Accrued Expenses $393,872 $35,669 $30,446 $399,095 $354,505
Net Pension Liabilities 1,292,754 79,778 17,876 1,354,656 —) Unearned Revenue 276,348 657 14,393 262,612 92,912 Long-Term Liabilities 2,138,182 —) 129,207 2,008,975 59,882 Total Noncurrent
Liabilities $4,101,156 $116,104 $191,922 $4,025,338 $507,299 At July 1, 2014, net pension liabilities were restated due to GASB 68.

- 41-
NOTE 9 – COMMERCIAL PAPER The university has a combined taxable and tax-exempt commercial paper program that provides for interim or short-term financing of various capital projects, equipment, refundings and for other lawful purposes. The Board approved a maximum outstanding at any time of $500.0 million, provided the maximum principal amount will not exceed the amount secured by a Liquidity Facility. The current Liquidity Facility is provided by Wells Fargo Bank, N.A. (the Liquidity Provider) up to $200.0 million, through a Standby Commercial Paper Purchase Agreement, that terminates on April 10, 2018. The university has covenanted with the Liquidity Provider to maintain a Liquidity Ratio of 0.45 to 1.00 in fiscal year 2016 and 0.40 to 1.00 in fiscal year 2015. The university was in compliance with the covenant at June 30, 2016 and June 30, 2015. Commercial paper activity as of June 30, 2016 is as follows (dollars in thousands):
July 1, 2015
Additions
Retirements
June 30, 2016
Taxable $35,120
$2,965
$2,090
$35,995 Tax-exempt 30,713
–
1,100
29,613
Total Short-Term Liabilities $65,833
$2,965
$3,190
$65,608 Commercial paper activity as of June 30, 2015 is as follows (dollars in thousands):
July 1, 2014
Additions
Retirements
June 30, 2015
Taxable $48,475
$ –
$13,355
$35,120 Tax-exempt –
30,713
–
30,713
Total Short-Term Liabilities $48,475
$30, 713
$13,355
$65,833

- 42 -
NOTE 10 – LONG TERM LIABILITIES Long-term liability activity for the year ended June 30, 2016 is as follows (dollars in thousands):
Maturity Date
Interest Rates
July 1, 2015
Additions
Retirements and Payments
June 30, 2016
Current Portion
Notes: U.S. Department of Education
2021
5.50%
$663)
$ ‒)
$106)
$557)
$112) City of Camden
2023
1.00%
348)
‒)
52)
296)
53)
New Jersey Department of Human Services
2018
0.00%
311)
‒)
‒)
311)
‒)
RWJ University Hospital
2016
Variable Rate
333)
‒)
333)
‒)
‒) Bonds Payable:
General Obligation Bonds: 2002 Series A
2018
Variable Rate
33,000)
‒)
10,600)
22,400)
11,000) 2009 Series F
2039
2.00% - 5.00%
194,735)
‒)
172,840)
21,895)
7,000)
2009 Series G
2039
Variable Rate
70,490)
‒)
1,810)
68,680)
1,880) 2010 Series H
2040
3.776% - 5.665%
390,990)
‒)
‒)
390,990)
‒)
2010 Series I
2029
2.00% - 5.00%
30,875)
‒)
5,145)
25,730)
1,310) 2013 Series J
2036
1.00% - 5.00%
328,840)
‒)
5,490)
323,350)
5,695)
2013 Series K
2033
0.40% - 4.712%
122,370)
‒)
5,560)
116,810)
5,585) 2013 Series L
2043
1.00% - 5.00%
339,195)
‒)
6,735)
332,460)
3,815)
2016 Series M
2039
3.00% - 5.00%
‒)
164,610)
‒)
164,610)
‒) Other Long-Term Obligations:
New Jersey Educational Facilities Authority:
Higher Education Capital Improvement Fund, Series 2002 A
2022
3.00% - 5.25%
264)
‒)
‒)
264)
‒)
Higher Education Capital Improvement Fund, Series 2005 A
2019
3.00% - 5.00%
21,790)
‒)
4,545)
17,245)
4,780)
Higher Education Capital Improvement Fund, Series 2006 A
2022
4.00% - 4.50%
21,125)
‒)
96)
21,029)
101)
Higher Education Capital Improvement Fund, Series 2014 A
2033
3.50% - 5.00%
30,179)
‒)
1,018)
29,161)
1,059)
Dormitory Safety Trust Fund, Series 2001 A
2016
0.00%
2,040)
‒)
2,040)
‒
‒)
Dormitory Safety Trust Fund, Series 2001 B
2016
0.00%
32)
‒)
32)
‒
‒)
Higher Education Equipment Leasing Fund, Series 2014 A
2023
5.00%
8,362)
‒)
1,522)
6,840)
1,599)
Capital Lease Obligations: Housing Authority of the City of New
Brunswick
2020
3.00% - 5.00%
17,535)
‒)
3,175)
14,360)
3,330) Robert Wood Johnson University
Hospital Sublease
2020
3.00% - 5.00%
(3,091)
‒)
(559)
(2,532)
(587) New Jersey Economic Development
Authority: College Avenue Redevelopment
Project
2046
4.00% - 5.00%
237,055)
‒)
‒)
237,055)
3,615) 15 Washington Street Housing
Project
2031
3.10%
58,330)
‒)
1,755)
56,575)
2,500) University Hospital Space Leases:
Ambulatory Care Center, 140 Bergen St.
2089
4.16%1
17,566)
1,492)
41)
19,017)
42) New Jersey Medical School, 150
Bergen St.
2089
4.16%1
14,921)
1,268)
35)
16,154)
36) Equipment Leases
Various
639)
‒)
523)
116)
78) Loan Payable:
New Brunswick Development Corporation:
15 Washington Street Housing Project
2025
3.46%1
‒)
2,200)
188)
2,012)
194)
1,938,897)
169,570)
223,082)
1,885,385)
53,197) Unamortized Bond Discounts
‒)
(1,080)
(11)
(1,069)
(45) Unamortized Bond Premiums
70,078)
23,838)
8,905)
85,011)
4,791)
Total Long-Term Liabilities
$2,008,975)
$192,328)
$231,976)
$1,969,327)
$57,943) 1 Effective interest rate.

- 43-
Long-term liability activity for the year ended June 30, 2015 is as follows (dollars in thousands):
Maturity Date
Interest Rates
July 1, 2014
Additions
Retirements and Payments
June 30, 2015
Current Portion
Notes: U.S. Department of Education
2021
5.50%
$763)
$ ‒)
$100)
$663)
$106) City of Camden
2023
1.00%
399)
‒)
51)
348)
52)
New Jersey Department of Human Services
2018
0.00%
414)
‒)
103)
311)
‒)
RWJ University Hospital
2016
Variable Rate
700)
‒)
367)
333)
333) Bonds Payable:
General Obligation Bonds: 2002 Series A
2018
Variable Rate
43,200)
‒)
10,200)
33,000)
10,600) 2003 Series D
2019
3.00% - 4.125%
5,415)
‒)
5,415)
‒)
‒)
2009 Series F
2039
2.00% - 5.00%
201,140)
‒)
6,405)
194,735)
6,655) 2009 Series G
2039
Variable Rate
72,235)
‒)
1,745)
70,490)
1,810)
2010 Series H
2040
3.776% - 5.665%
390,990)
‒)
‒)
390,990)
‒) 2010 Series I
2029
2.00% - 5.00%
36,090)
‒)
5,215)
30,875)
5,145)
2013 Series J
2036
1.00% - 5.00%
334,185)
‒)
5,345)
328,840)
5,490) 2013 Series K
2033
0.40% - 4.712%
127,725)
‒)
5,355)
122,370)
5,560)
2013 Series L
2043
1.00% - 5.00%
346,165)
‒)
6,970)
339,195)
6,735) Other Long-Term Obligations:
New Jersey Educational Facilities Authority:
Higher Education Capital Improvement Fund, Series 2002 A
2022
3.00% - 5.25%
506)
‒)
242)
264)
‒)
Higher Education Capital Improvement Fund, Series 2005 A
2019
3.00% - 5.00%
25,873)
‒)
4,083)
21,790)
4,545)
Higher Education Capital Improvement Fund, Series 2006 A
2022
4.00% - 4.50%
21,218)
‒)
93)
21,125)
96)
Higher Education Capital Improvement Fund, Series 2014 A
2033
3.50% - 5.00%
30,179)
‒)
‒)
30,179)
1,018)
Dormitory Safety Trust Fund, Series 2001 A
2016
0.00%
4,080)
‒)
2,040)
2,040)
2,040)
Dormitory Safety Trust Fund, Series 2001 B
2016
0.00%
65)
‒)
33)
32)
32)
Higher Education Equipment Leasing Fund, Series 2014 A
2023
5.00%
9,657)
‒)
1,295)
8,362)
1,522)
Capital Lease Obligations: Housing Authority of the City of New
Brunswick
2020
3.00% - 5.00%
20,560)
‒)
3,025)
17,535)
3,175) Robert Wood Johnson University
Hospital Sublease
2020
3.00% - 5.00%
(3,624)
‒)
(533)
(3,091)
(559) Certificates of Participation, Series 2004
2038
3.50% - 5.00
26,115)
‒)
26,115)
‒)
‒)
New Jersey Economic Development Authority:
College Avenue Redevelopment Project
2046
4.00% - 5.00%
237,055)
‒)
‒)
237,055)
‒)
15 Washington Street Housing Project
2031
3.10%
58,330)
‒)
‒)
58,330)
‒) University Hospital Space Leases:
Ambulatory Care Center, 140 Bergen St.
2089
4.16%1
18,334)
‒)
768)
17,566)
738) New Jersey Medical School, 150
Bergen St.
2089
4.16%1
15,574)
‒)
653)
14,921)
627)
Equipment Leases
Various
1,491)
‒)
852)
639)
523) Loan Payable:
New Jersey Community Capital CDE I, LLC
2.33%1
36,355)
‒)
36,355)
‒)
‒) New Jersey Community Capital CDE II,
LLC
1.45%1
2,588)
‒)
2,588)
‒)
‒)
2,063,777)
‒)
124,880)
1,938,897)
56,243) Unamortized Bond Premiums
74,405)
‒)
4,327)
70,078)
3,639)
Total Long-Term Liabilities
$2,138,182)
$ ‒)
$129,207)
$2,008,975)
$59,882) 1 Effective interest rate.

- 44 -
Bonds Payable The university issues general obligation bonds to (i) provide financing of various capital projects, (ii) provide for the refinancing of certain outstanding commercial paper and (iii) provide for the current and/or advance refunding of all or a portion of certain outstanding bonds of the university. These bonds are payable from revenues and other legally available funds. The bonds are secured under the provisions of an Indenture of Trust dated February 1, 2002 by and between the university and U.S. Bank, N.A. All bonds bear interest at fixed rates with the exception of 2002 Series A and 2009 Series G, which bear interest at variable rates. These bonds are secured by a Liquidity Facility through a Standby Bond Purchase Agreement. The current Liquidity Facility for the 2002 Series A and the 2009 Series G bonds are provided by TD Bank, N.A. until May 1, 2018 and by U.S. Bank, N.A. until May 4, 2018, respectively. As of June 30, 2016 and 2015, no funds have been drawn against these agreements. Debt service to maturity for all General Obligation Bonds, using variable rates as of June 30, 2016 and using the net interest rate swap payments as of June 30, 2016 (See NOTE 11 for additional information about derivatives), are as follows (dollars in thousands):
Fixed Rate Bonds
Variable Rate Bonds
Interest Rate
Year
Principal
Interest
Principal
Interest
Swaps, Net
Total 2017
$23,405 $67,552 $12,880 $346 $3,211 $107,394
2018
24,535 66,662 13,350 366 2,682 107,595 2019
41,900 65,707 2,030 324 2,210 112,171
2020 37,570 63,938 2,110 314 2,141 106,073 2021 38,760 62,282 2,195 304 2,069 105,610
2022-2026
226,620 282,018 12,335 1,344 9,162 531,479 2027-2031
294,620 219,033 14,995 1,011 6,886 536,545
2032-2036
281,190 142,303 18,310 604 4,114 446,521 2037-2041
273,475 77,685 12,875 130 889 365,054
2042-2043
133,770 10,115 — — — 143,885
Total
$1,375,845 $1,057,295 $91,080 $4,743 $33,364 $2,562,327 Refunding Activity During fiscal year 2016, the university issued General Obligation Refunding Bonds, 2016 Series M for $164.6 million and $3.0 million of taxable commercial paper to refund a portion of General Obligation Bonds, 2009 Series F. As part of the refunding, the university reduced its total debt service over the next 24 years by $21.9 million and obtained an economic gain (difference between the present values of the old and new debt service payments less escrow funds used) of $17.0 million. The difference between the reacquisition price and the net carrying amount of the old debt of $18.7 million is being deferred and amortized as a reduction to interest expense through the year 2039 using the effective interest method. During fiscal year 2015, the university issued $30.7 million of tax-exempt commercial paper to refund in whole General Obligation Bonds 2003 Series D and Certificates of Participation Series 2004. The difference between the reacquisition price and the net carrying amount of the old debt of $0.4 million is being deferred and amortized as a reduction to interest expense through the year 2038 using the effective interest method. Other Long-Term Obligations Under the provisions of the State of New Jersey Higher Education Capital Improvement Fund Act (CIF), the Higher Education Equipment Leasing Fund Act (ELF), and the Dormitory Safety Trust Fund Act (DSTF), the university has been allocated funds from bonds issued by the New Jersey Educational Facilities Authority to finance various capital expenditures. The university is obligated to pay amounts equal to one-third and 25% of the amount necessary to pay the principal and interest on the portion of the CIF and ELF bonds, respectively.
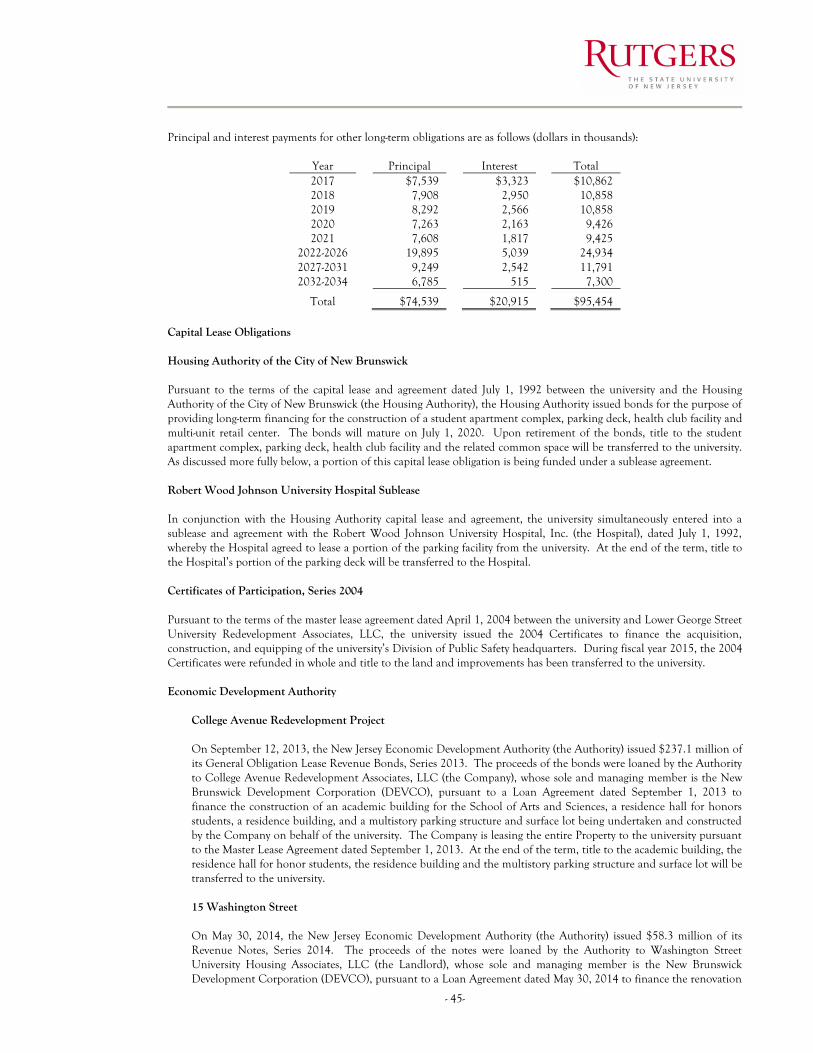
- 45-
Principal and interest payments for other long-term obligations are as follows (dollars in thousands):
Year
Principal
Interest Total 2017
$7,539 $3,323 $10,862
2018
7,908 2,950 10,858 2019
8,292 2,566 10,858
2020 7,263 2,163 9,426 2021 7,608 1,817 9,425
2022-2026
19,895 5,039 24,934 2027-2031
9,249 2,542 11,791
2032-2034
6,785 515 7,300
Total
$74,539 $20,915 $95,454 Capital Lease Obligations Housing Authority of the City of New Brunswick Pursuant to the terms of the capital lease and agreement dated July 1, 1992 between the university and the Housing Authority of the City of New Brunswick (the Housing Authority), the Housing Authority issued bonds for the purpose of providing long-term financing for the construction of a student apartment complex, parking deck, health club facility and multi-unit retail center. The bonds will mature on July 1, 2020. Upon retirement of the bonds, title to the student apartment complex, parking deck, health club facility and the related common space will be transferred to the university. As discussed more fully below, a portion of this capital lease obligation is being funded under a sublease agreement. Robert Wood Johnson University Hospital Sublease In conjunction with the Housing Authority capital lease and agreement, the university simultaneously entered into a sublease and agreement with the Robert Wood Johnson University Hospital, Inc. (the Hospital), dated July 1, 1992, whereby the Hospital agreed to lease a portion of the parking facility from the university. At the end of the term, title to the Hospital’s portion of the parking deck will be transferred to the Hospital. Certificates of Participation, Series 2004 Pursuant to the terms of the master lease agreement dated April 1, 2004 between the university and Lower George Street University Redevelopment Associates, LLC, the university issued the 2004 Certificates to finance the acquisition, construction, and equipping of the university’s Division of Public Safety headquarters. During fiscal year 2015, the 2004 Certificates were refunded in whole and title to the land and improvements has been transferred to the university. Economic Development Authority
College Avenue Redevelopment Project On September 12, 2013, the New Jersey Economic Development Authority (the Authority) issued $237.1 million of its General Obligation Lease Revenue Bonds, Series 2013. The proceeds of the bonds were loaned by the Authority to College Avenue Redevelopment Associates, LLC (the Company), whose sole and managing member is the New Brunswick Development Corporation (DEVCO), pursuant to a Loan Agreement dated September 1, 2013 to finance the construction of an academic building for the School of Arts and Sciences, a residence hall for honors students, a residence building, and a multistory parking structure and surface lot being undertaken and constructed by the Company on behalf of the university. The Company is leasing the entire Property to the university pursuant to the Master Lease Agreement dated September 1, 2013. At the end of the term, title to the academic building, the residence hall for honor students, the residence building and the multistory parking structure and surface lot will be transferred to the university.
15 Washington Street On May 30, 2014, the New Jersey Economic Development Authority (the Authority) issued $58.3 million of its Revenue Notes, Series 2014. The proceeds of the notes were loaned by the Authority to Washington Street University Housing Associates, LLC (the Landlord), whose sole and managing member is the New Brunswick Development Corporation (DEVCO), pursuant to a Loan Agreement dated May 30, 2014 to finance the renovation
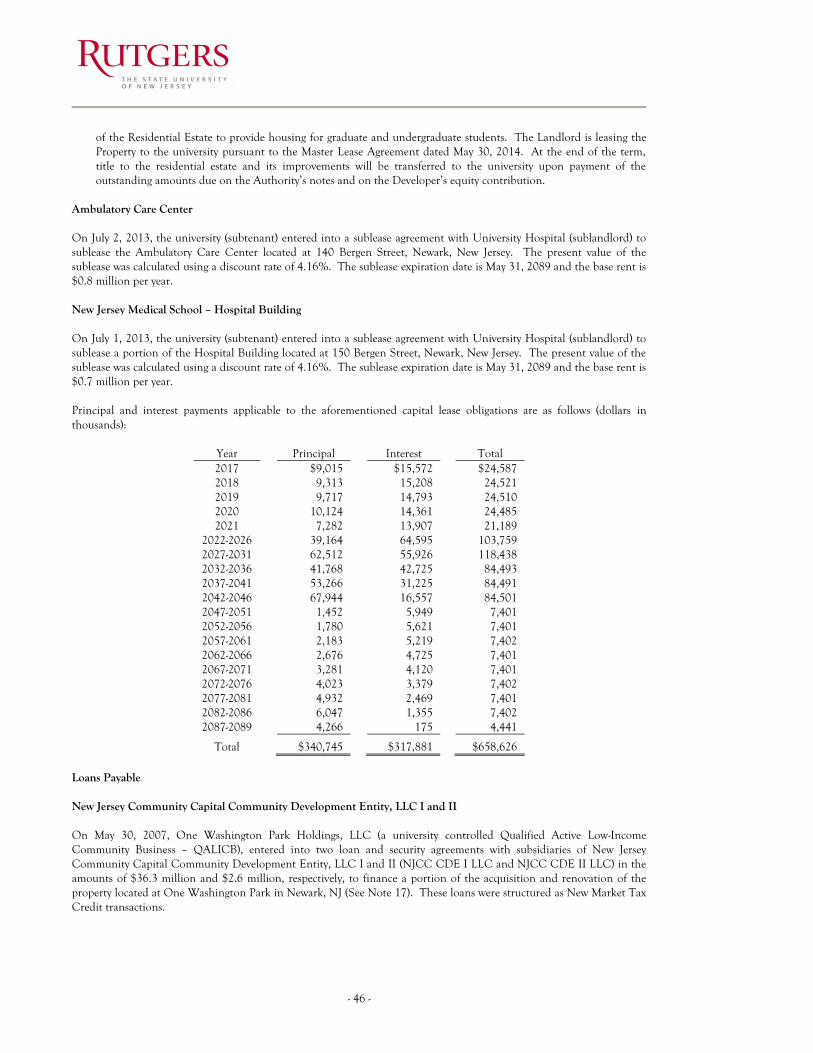
- 46 -
of the Residential Estate to provide housing for graduate and undergraduate students. The Landlord is leasing the Property to the university pursuant to the Master Lease Agreement dated May 30, 2014. At the end of the term, title to the residential estate and its improvements will be transferred to the university upon payment of the outstanding amounts due on the Authority’s notes and on the Developer’s equity contribution.
Ambulatory Care Center On July 2, 2013, the university (subtenant) entered into a sublease agreement with University Hospital (sublandlord) to sublease the Ambulatory Care Center located at 140 Bergen Street, Newark, New Jersey. The present value of the sublease was calculated using a discount rate of 4.16%. The sublease expiration date is May 31, 2089 and the base rent is $0.8 million per year. New Jersey Medical School – Hospital Building On July 1, 2013, the university (subtenant) entered into a sublease agreement with University Hospital (sublandlord) to sublease a portion of the Hospital Building located at 150 Bergen Street, Newark, New Jersey. The present value of the sublease was calculated using a discount rate of 4.16%. The sublease expiration date is May 31, 2089 and the base rent is $0.7 million per year. Principal and interest payments applicable to the aforementioned capital lease obligations are as follows (dollars in thousands):
Year
Principal
Interest Total 2017
$9,015 $15,572 $24,587
2018
9,313 15,208 24,521 2019
9,717 14,793 24,510
2020 10,124 14,361 24,485 2021 7,282 13,907 21,189
2022-2026
39,164 64,595 103,759 2027-2031
62,512 55,926 118,438
2032-2036 41,768 42,725 84,493 2037-2041 53,266 31,225 84,491 2042-2046 67,944 16,557 84,501 2047-2051 1,452 5,949 7,401 2052-2056 1,780 5,621 7,401 2057-2061 2,183 5,219 7,402 2062-2066 2,676 4,725 7,401 2067-2071 3,281 4,120 7,401 2072-2076 4,023 3,379 7,402 2077-2081 4,932 2,469 7,401 2082-2086 6,047 1,355 7,402 2087-2089
4,266 175 4,441
Total
$340,745 $317,881 $658,626 Loans Payable New Jersey Community Capital Community Development Entity, LLC I and II On May 30, 2007, One Washington Park Holdings, LLC (a university controlled Qualified Active Low-Income Community Business – QALICB), entered into two loan and security agreements with subsidiaries of New Jersey Community Capital Community Development Entity, LLC I and II (NJCC CDE I LLC and NJCC CDE II LLC) in the amounts of $36.3 million and $2.6 million, respectively, to finance a portion of the acquisition and renovation of the property located at One Washington Park in Newark, NJ (See Note 17). These loans were structured as New Market Tax Credit transactions.

- 47-
On December 1, 2014, the New Markets Tax Credit structure was liquidated through a series of Distribution Agreements and Assignment Agreements, One Washington Park Holdings, LLC acquired the membership interests and assets of NJCC CDE I LLC and NJCC CDE II LLC, including the loans. As both lender and borrower, the loans were forgiven and these loans are no longer outstanding as of June 30, 2015. Miscellaneous Equipment Leases The university has entered into certain lease-purchase agreements for equipment. The following represents the book value of the university’s equipment capital leases at June 30, 2016 and 2015:
2016 2015 Cost $7,022) $7,022) Accumulated Depreciation (6,336) (5,075)
Net Book Value $686) $1,947) LEAP School Bond Financing Guaranty In 2003, the Delaware River Port Authority issued $8.5 million of Charter School Project Bonds, Series 2003 (LEAP Academy University Charter School, Inc.) to finance the costs of the design, development, construction and equipping of the LEAP Academy University Charter School, which is adjacent to the Camden Campus. During fiscal year 2015, the New Jersey Economic Development Authority issued $10.0 million of Charter School Revenue Bonds, Series 2014 to refund, among others, in whole the Series 2003 Bonds. As part of the university’s commitment to contributing to the community of the City of Camden, the university guarantees the payment of the principal and interest on the Bonds through its maturity in 2028. Bank Line of Credit In December 2015, the university entered into a $100.0 million revolving credit agreement with a bank to provide liquidity for working capital and to finance capital projects. This line of credit agreement has an expiration date of December 15, 2016. As of June 30, 2016, no funds have been drawn against this agreement. Defeased Bonds The university has defeased various bonds with the proceeds of new debt or with university funds. The funds are deposited to an irrevocable escrow trust account for the payment of the principal, interest, and call premiums, if any, on the refunded bonds. The defeased bonds and the related trusts are not reflected in the accompanying financial statements. As of June 30, 2016 and 2015, the university’s defeased debt is as follows (dollars in thousands):
Amount Defeased
Final Maturity/Call
Date
Amount Outstanding at June 30, 2016
Amount Outstanding at June 30, 2015
NJEFA Revenue Refunding Bonds, 2009 Series B
$214,885
6/1/2019
$189,116
$198,503
General Obligation Bonds, 2009 Series F
$166,185
5/1/2019
$166,185
—
Total
$381,070 $355,301 $198,503

- 48 -
NOTE 11 – DERIVATIVE FINANCIAL INSTRUMENTS The university has entered into four separate pay-fixed, receive-variable interest rate swaps in order to protect against adverse changes in cash flows caused by variable prices, costs, rates, or terms that cause future prices to be uncertain. These swaps are valued using a market approach that considers benchmark interest rates and, therefore, are classified in Level 2 of the fair value hierarchy. For the years ended June 30, 2016 and 2015, the university had the following derivative instruments outstanding (dollars in thousands):
Notional Amount
Fair Value
Swap #
Type
Objective
2016
2015
Effective Date
Termination Date
Terms
Counterparty Credit Rating
(Moody’s/S&P)
2016
2015
1
Pay fixed, receive variable interest rate swap
Hedge of changes in cash flows on variable-rate General Obligation Bond
$22,400
$33,200
2/4/2002
5/1/2018
Pay fixed 3.960%, receive SIFMA swap index
Aa3/A+
($1,062)
($2,129)
2
Pay fixed, receive variable interest rate swap
Hedge of changes in cash flows on variable-rate General Obligation Bond and General Obligation Commercial Paper
100,000
100,000
5/1/2008
11/1/2038
Pay fixed 4.080%, receive 100% of 3-Month LIBOR
Aa3/AA‒
(43,975)
(20,511)
3
Pay fixed, receive variable interest rate swap
Hedge of changes in cash flows on variable-rate General Obligation Bond
13,150
14,905
5/1/2007
5/1/2027
Pay fixed 3.824%, receive SIFMA swap index
Aa2/AA‒
(2,567)
(1,948)
4
Pay fixed, receive variable interest rate swap
Hedge of changes in cash flows on variable-rate General Obligation Commercial Paper
13,500
13,500
3/1/2012
11/1/2017
Pay fixed 5.127%, receive 100% of 1-Month LIBOR
Aa2/AA‒
(829)
(1,329)
$149,050
$161,605
($48,433)
($25,917)

- 49-
Risk The use of derivatives may introduce certain risks for the university, including the following: Credit Risk: As of June 30, 2016 and 2015, the university was not exposed to credit risk with its swap counterparties because all of the swaps had negative fair values. To mitigate credit risk, the university and the counterparties require the posting of collateral based on their respective credit rating. The amount of (i.e., value of) such collateral shall equal the market value of the swap in excess of the applicable collateral threshold based on the rating of such counterparty at such time. The table below shows when collateralization would be required or triggered.
Ratings by Moody’s and S&P
Swap #1 Collateral Threshold
Swap #2, 3, 4 Collateral Threshold
Aaa/AAA $30.0 million Infinite Aa3/AA– $25.0 million Infinite
A1/A+ Zero $20.0 million A2/A Zero $10.0 million
A3/A– Zero $10.0 million Baa1/BBB+ Zero $5.0 million Baa2/BBB Zero $5.0 million
Baa3/BBB– Zero Zero Below Baa3/BBB– or not rated Zero Zero
As of June 30, 2016, the university was required to post collateral totaling to $27.2 million. No collateral was required to be posted in 2015. Basis Risk: There is a risk that the variable payment received on interest rate swaps will not match the variable payment on the bonds or commercial paper. This risk is known as basis risk. Swaps totaling to $149.1 million have basis risk because the interest rates on the bonds and commercial paper are reset periodically by the remarketing agent or commercial paper dealer and may not exactly match the variable receipt on the interest rate swaps which are based on a percentage of either LIBOR or SIFMA indexes. Rollover Risk: The university is exposed to rollover risk on swaps only if the counterparty exercises its termination option, in which case the university will not realize the synthetic rate offered by the swaps on the underlying debt issues. Termination Risk: The university or any of the involved counterparties may terminate any of the swaps if the other party fails to perform under the terms of the contract. If a swap is terminated, the variable rate debt issue would no longer carry a synthetic fixed interest rate. Also, if at termination a swap has a negative fair value, the university would be liable to the appropriate counterparty for a payment equal to the swap's fair value. The counterparty for swap #1 has an optional termination provision in which they will have the right, but not the obligation to terminate the swap transaction in whole on each day that the daily weighted average of the Municipal Swap Index for any immediately preceding rolling consecutive 180 day period within the exercise period is more than 7.0% per annum. The exercise period began on November 1, 2004 and is up to, but excluding, the termination date of May 1, 2018. The date on which the counterparty for swap #1 exercises its right to terminate the transaction is defined as the optional termination date. If the counterparty for swap #1 exercises its right to terminate the transaction, the university shall pay two business days after the optional termination date the fixed amount for the period from and including the last fixed rate payer payment date to but excluding the optional termination date, and the counterparty for swap #1 will pay two business days after the optional termination date the floating amount for the period from and including the last floating rate payer payment date to but excluding the optional termination date. Upon payment and receipt of these amounts, neither party shall have any further payment obligations related to this transaction.

- 50 -
NOTE 12 – COMMITMENTS At June 30, 2016, the estimated cost of capital projects under construction, in the design stage with approved sources of funding, and in the design stage pending determination of sources of funding, aggregated approximately $755.6 million ($783.3 million in 2015). Anticipated sources of funding for these projects are summarized as follows (dollars in thousands):
Total Project Funding
Received at June 30, 2016
Additional Funding Required at
June 30, 2016
Estimated Total Cost
Borrowing $141,247 $58,200 $199,447 State 224,153 74,823 298,976 Gifts and Other Sources 182,315 74,895 257,210
Total $547,715 $207,918 $755,633 The university leases certain space used in general operations. Rental expense was approximately $15.3 million in 2016 ($13.4 million in 2015). The leases are non-cancelable and have been classified as operating leases which are expected to expire through 2046. Minimum annual rental commitments approximate the following (dollars in thousands):
Year Amount 2017 $12,518 2018 10,993 2019 9,854 2020 8,018 2021 6,093
2022-2026 24,742 2027-2031 11,339 2032-2036 8,164 2037-2041 8,164 2042-2046 723
Total $100,608

- 51-
NOTE 13 – NATURAL EXPENSES BY FUNCTIONAL CLASSIFICATION The university reports operating expenses by functional classification. Details of these expenses by natural classification at June 30, 2016 and 2015 are as follows (dollars in thousands):
Salaries and Wages
Fringe Benefits
Supplies and
Services
Scholarships &
Fellowships
Depreciation
2016 Total
Instruction $582,735
$210,648
$107,259
$13,866
$ —)
$914,508
Sponsored Research 141,094
45,079
161,826
53
—)
348,052
Other Separately Budgeted Research 58,535
18,872
26,133
1,629
—)
105,169
Other Sponsored Programs 114,081
36,519
45,441
641
—)
196,682
Extension and Public Service 29,647
12,426
8,840
682
—)
51,595
Academic Support 70,863
25,778
31,094
1,748
—)
129,483
Student Services 49,117
18,308
30,371
7,420
—)
105,216
Operation & Maintenance of Plant 90,744
35,094
88,968
1,326
—)
216,132
General Administrative and Institutional 149,946
59,706
52,262
2,251
—)
264,165
Scholarships and Fellowships 4,464
391
30,622
23,119
—)
58,596
Depreciation —)
—)
—)
—)
151,254
151,254
Patient Care Services 425,791
127,757
130,674
—)
—)
684,222
Auxiliary Enterprises 107,802
41,991
124,171
14,716
—)
288,680
Other Operating Expenses —)
—)
398
—)
—)
398
Total Operating Expenses $1,824,819
$632,569
$838,059
$67,451
$151,254
$3,514,152

- 52 -
Salaries and Wages
Fringe Benefits
Supplies and
Services
Scholarships &
Fellowships Depreciation
2015 Total
Instruction $574,345 $189,945 $104,994 $13,929 $ —) $883,213
Sponsored Research 141,231 44,543 169,942 53 —) 355,769
Other Separately Budgeted Research 51,066 16,694 29,521 1,050 —) 98,331
Other Sponsored Programs 101,931 48,018 56,320 510 —) 206,779
Extension and Public Service 27,771 9,452 12,532 640 —) 50,395
Academic Support 70,847 21,623 32,466 541 —) 125,477
Student Services 47,745 16,272 22,358 6,675 —) 93,050
Operation and Maintenance of Plant 80,928 31,394 91,974 985 —) 205,281
General Administration and Institutional 139,508 46,918 55,278 1,904 —) 243,608
Scholarships and Fellowships 4,706 321 25,214 23,960 —) 54,201
Depreciation —) —) —) —) 152,525 152,525
Patient Care Services 424,107 120,717 108,622 —) —) 653,446
Auxiliary Enterprises 111,164 36,533 128,548 12,624 —) 288,869
Other Operating Expenses —) —) 784 —) —) 784
Total Operating Expenses $1,775,349 $582,430 $838,553 $62,871 $152,525 $3,411,728
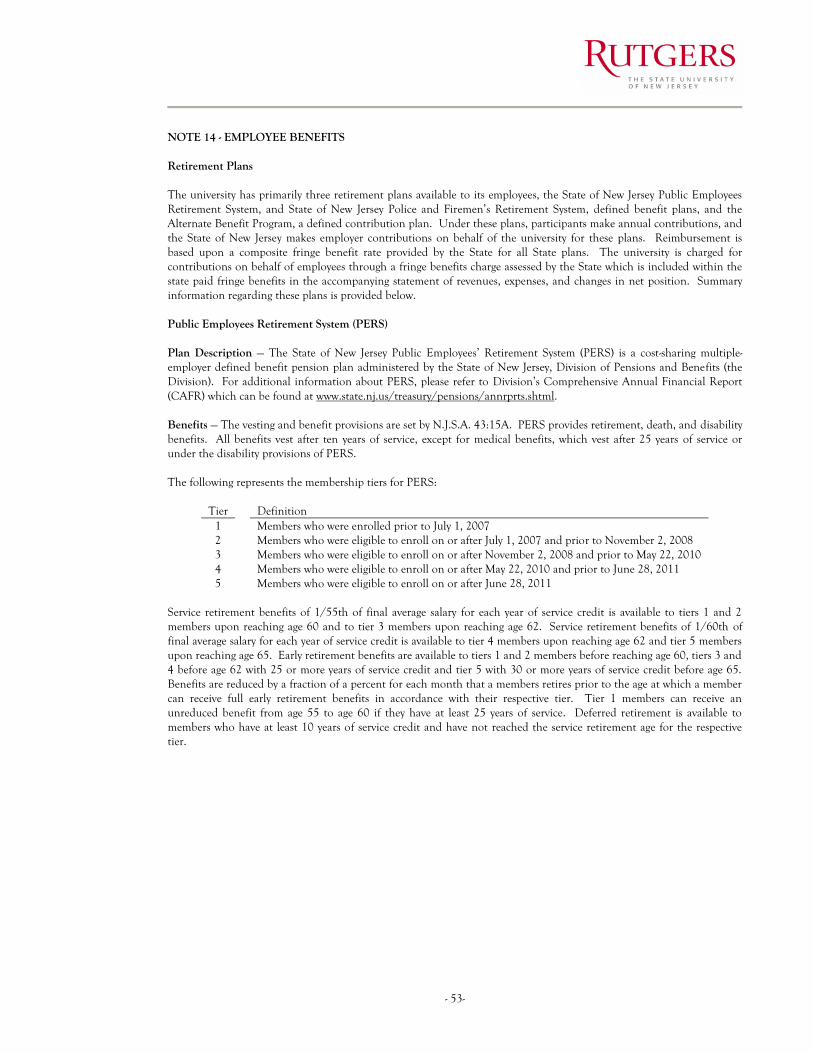
- 53-
NOTE 14 - EMPLOYEE BENEFITS Retirement Plans The university has primarily three retirement plans available to its employees, the State of New Jersey Public Employees Retirement System, and State of New Jersey Police and Firemen’s Retirement System, defined benefit plans, and the Alternate Benefit Program, a defined contribution plan. Under these plans, participants make annual contributions, and the State of New Jersey makes employer contributions on behalf of the university for these plans. Reimbursement is based upon a composite fringe benefit rate provided by the State for all State plans. The university is charged for contributions on behalf of employees through a fringe benefits charge assessed by the State which is included within the state paid fringe benefits in the accompanying statement of revenues, expenses, and changes in net position. Summary information regarding these plans is provided below. Public Employees Retirement System (PERS) Plan Description — The State of New Jersey Public Employees’ Retirement System (PERS) is a cost-sharing multiple-employer defined benefit pension plan administered by the State of New Jersey, Division of Pensions and Benefits (the Division). For additional information about PERS, please refer to Division’s Comprehensive Annual Financial Report (CAFR) which can be found at www.state.nj.us/treasury/pensions/annrprts.shtml. Benefits — The vesting and benefit provisions are set by N.J.S.A. 43:15A. PERS provides retirement, death, and disability benefits. All benefits vest after ten years of service, except for medical benefits, which vest after 25 years of service or under the disability provisions of PERS. The following represents the membership tiers for PERS:
Tier Definition 1 Members who were enrolled prior to July 1, 2007 2 Members who were eligible to enroll on or after July 1, 2007 and prior to November 2, 2008 3 Members who were eligible to enroll on or after November 2, 2008 and prior to May 22, 2010 4 Members who were eligible to enroll on or after May 22, 2010 and prior to June 28, 2011 5 Members who were eligible to enroll on or after June 28, 2011
Service retirement benefits of 1/55th of final average salary for each year of service credit is available to tiers 1 and 2 members upon reaching age 60 and to tier 3 members upon reaching age 62. Service retirement benefits of 1/60th of final average salary for each year of service credit is available to tier 4 members upon reaching age 62 and tier 5 members upon reaching age 65. Early retirement benefits are available to tiers 1 and 2 members before reaching age 60, tiers 3 and 4 before age 62 with 25 or more years of service credit and tier 5 with 30 or more years of service credit before age 65. Benefits are reduced by a fraction of a percent for each month that a members retires prior to the age at which a member can receive full early retirement benefits in accordance with their respective tier. Tier 1 members can receive an unreduced benefit from age 55 to age 60 if they have at least 25 years of service. Deferred retirement is available to members who have at least 10 years of service credit and have not reached the service retirement age for the respective tier.

- 54 -
Contributions — Covered university employees were required by PERS to contribute 7.06% of their annual compensation during fiscal year 2016 (6.92% in 2015). The PERS contribution rate will increase by 0.14% each year until the 7.5% contribution rate is reached by July 1, 2018. The State contributes the remaining amounts necessary to pay benefits when due. The State contribution is based upon annual actuarially determined percentages of total compensation of all active members. The State’s pension contribution is based on an actuarially determined amount which includes the employer portion of the normal cost and an amortization of the unfunded accrued liability. A contribution on behalf of the university is included within the State’s contribution. The contribution requirements of the plan members and the university are established and may be amended by the State. Employees can also make voluntary contributions to two optional State of New Jersey tax-deferred investment plans, the Supplemental Annuity Collective Trust (SACT) and the Additional Contributions Tax Sheltered (ACTS) programs. Both plans are subject to limits within the Internal Revenue Code. The State issues publicly available financial reports that include financial statements and required supplementary information for PERS. These reports may be obtained by writing to the State of New Jersey, Division of Pensions and Benefits, PO Box 295, Trenton, NJ 08625-0295. Police and Firemen’s Retirement System (PFRS) Plan Description — The State of New Jersey Police and Firemen’s Retirement System (PFRS) is a cost-sharing multiple-employer defined benefit pension plan administered by the State of New Jersey, Division of Pensions and Benefits (the Division). For additional information about PFRS, please refer to Division’s Comprehensive Annual Financial Report (CAFR) which can be found at www.state.nj.us/treasury/pensions/annrpts.shtml. Benefits — The vesting and benefit provisions are set by N.J.S.A. 43:16A. PFRS provides retirement as well as death and disability benefits. All benefits vest after ten years of service, except disability benefits which vest after four years of service. The following represents the membership tiers for PFRS:
Tier Definition 1 Members who were enrolled prior to May 22, 2010 2 Members who were eligible to enroll on or after May 22, 2010 and prior to June 28, 2011 3 Members who were eligible to enroll on or after June 28, 2011
Service retirement benefits are available at age 55 and are generally determined to be 2% of final compensation for each year of creditable service, as defined, up to 30 years plus 1% for each year of service in excess of 30 years. Members may seek special retirement after achieving 25 years of creditable service, in which benefits would equal 65% (tiers 1 and 2 members) and 60% (tier 3 members) of final compensation plus 1% for each year of creditable service over 25 years but not to exceed 30 years. Members may elect deferred retirement benefits after achieving ten years of service, in which case benefits would begin at age 55 equal to 2% of final compensation for each year of service. Contributions — The State’s pension contribution is based on an actuarially determined amount which includes the employer portion of the normal cost and an amortization of the unfunded accrued liability. A contribution on behalf of the university is included within the State’s contribution. Pursuant to the provisions of Chapter 78, P.L. 2011, the active member contribution rate increased from 8.5% to 10.0% in October 2011. Net Pension Liability, Deferred Amounts Related to Pensions and Pension Expense The university’s respective net pension liability, deferred outflow of resources, deferred inflows of resources, and pension expense related to PERS and PFRS are calculated by the State of New Jersey Division of Pension and Benefits. At June 30, 2016, the university reported a liability of $1,566.1 million and $78.6 million for PERS and PFRS, respectively ($1,292.2 million and $62.4 million for PERS and PFRS, respectively, in 2015), for its proportionate share of the respective PERS and PFRS net pension liabilities. The total pension liability used to calculate the net pension liability at June 30, 2016 was determined by an actuarial valuation as of June 30, 2014 and rolled forward to the measurement date of June 30, 2015 for both PERS and PFRS. The total pension liability used to calculate the net pension liability at June 30, 2015 was determined by an actuarial valuation as of June 30, 2013 and rolled forward to the measurement date of June 30, 2014 for both PERS and PFRS. The university’s proportionate share of the respective net pension liabilities for the fiscal year was based on actual contributions to PERS and PFRS on behalf of the university relative to the total
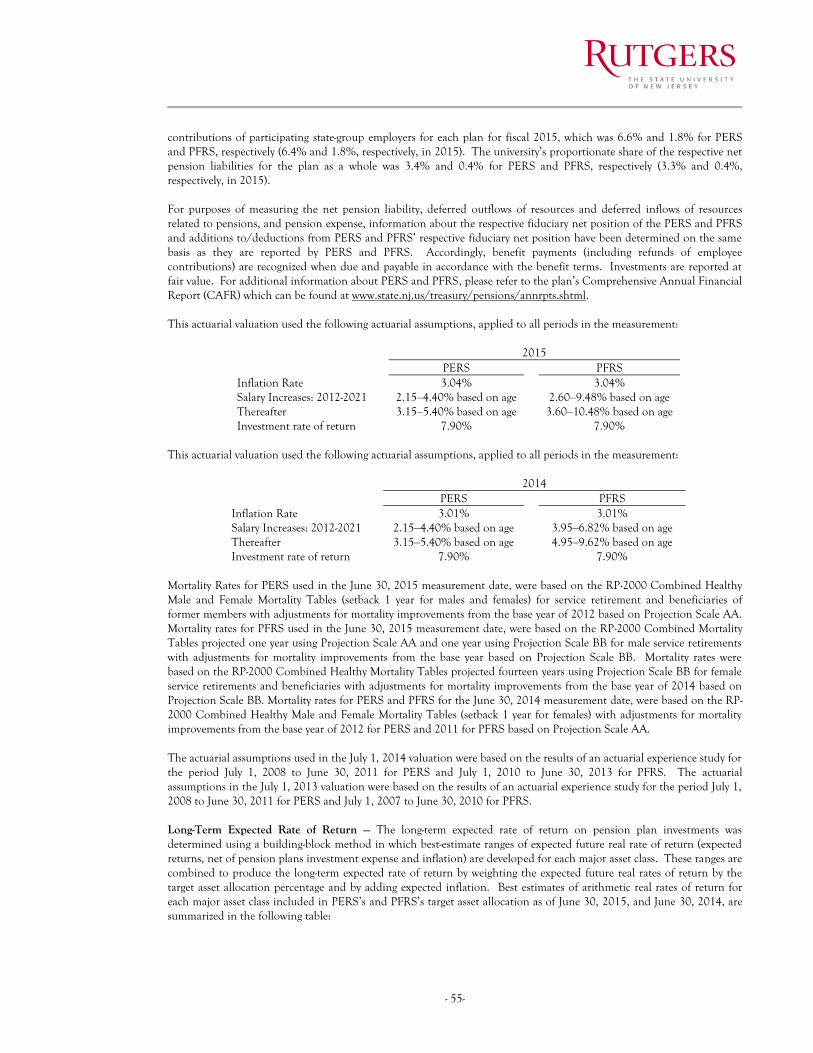
- 55-
contributions of participating state-group employers for each plan for fiscal 2015, which was 6.6% and 1.8% for PERS and PFRS, respectively (6.4% and 1.8%, respectively, in 2015). The university’s proportionate share of the respective net pension liabilities for the plan as a whole was 3.4% and 0.4% for PERS and PFRS, respectively (3.3% and 0.4%, respectively, in 2015). For purposes of measuring the net pension liability, deferred outflows of resources and deferred inflows of resources related to pensions, and pension expense, information about the respective fiduciary net position of the PERS and PFRS and additions to/deductions from PERS and PFRS’ respective fiduciary net position have been determined on the same basis as they are reported by PERS and PFRS. Accordingly, benefit payments (including refunds of employee contributions) are recognized when due and payable in accordance with the benefit terms. Investments are reported at fair value. For additional information about PERS and PFRS, please refer to the plan’s Comprehensive Annual Financial Report (CAFR) which can be found at www.state.nj.us/treasury/pensions/annrpts.shtml. This actuarial valuation used the following actuarial assumptions, applied to all periods in the measurement:
2015 PERS PFRS Inflation Rate 3.04% 3.04% Salary Increases: 2012-2021 2.15–4.40% based on age 2.60–9.48% based on age Thereafter 3.15–5.40% based on age 3.60–10.48% based on age Investment rate of return 7.90% 7.90%
This actuarial valuation used the following actuarial assumptions, applied to all periods in the measurement:
2014 PERS PFRS Inflation Rate 3.01% 3.01% Salary Increases: 2012-2021 2.15–4.40% based on age 3.95–6.82% based on age Thereafter 3.15–5.40% based on age 4.95–9.62% based on age Investment rate of return 7.90% 7.90%
Mortality Rates for PERS used in the June 30, 2015 measurement date, were based on the RP-2000 Combined Healthy Male and Female Mortality Tables (setback 1 year for males and females) for service retirement and beneficiaries of former members with adjustments for mortality improvements from the base year of 2012 based on Projection Scale AA. Mortality rates for PFRS used in the June 30, 2015 measurement date, were based on the RP-2000 Combined Mortality Tables projected one year using Projection Scale AA and one year using Projection Scale BB for male service retirements with adjustments for mortality improvements from the base year based on Projection Scale BB. Mortality rates were based on the RP-2000 Combined Healthy Mortality Tables projected fourteen years using Projection Scale BB for female service retirements and beneficiaries with adjustments for mortality improvements from the base year of 2014 based on Projection Scale BB. Mortality rates for PERS and PFRS for the June 30, 2014 measurement date, were based on the RP-2000 Combined Healthy Male and Female Mortality Tables (setback 1 year for females) with adjustments for mortality improvements from the base year of 2012 for PERS and 2011 for PFRS based on Projection Scale AA. The actuarial assumptions used in the July 1, 2014 valuation were based on the results of an actuarial experience study for the period July 1, 2008 to June 30, 2011 for PERS and July 1, 2010 to June 30, 2013 for PFRS. The actuarial assumptions in the July 1, 2013 valuation were based on the results of an actuarial experience study for the period July 1, 2008 to June 30, 2011 for PERS and July 1, 2007 to June 30, 2010 for PFRS. Long-Term Expected Rate of Return — The long-term expected rate of return on pension plan investments was determined using a building-block method in which best-estimate ranges of expected future real rate of return (expected returns, net of pension plans investment expense and inflation) are developed for each major asset class. These ranges are combined to produce the long-term expected rate of return by weighting the expected future real rates of return by the target asset allocation percentage and by adding expected inflation. Best estimates of arithmetic real rates of return for each major asset class included in PERS’s and PFRS’s target asset allocation as of June 30, 2015, and June 30, 2014, are summarized in the following table:

- 56 -
2015
Asset Class Target
Allocation
Long-Term Expected Real Rate of Return
Cash 5.00%) 1.04%) U.S. Treasuries 1.75%) 1.64%) Investment Grade Credit 10.00%) 1.79%) Mortgages 2.10%) 1.62%) High Yield Bonds 2.00%) 4.03%) Inflation-Indexed Bonds 1.50%) 3.25%) Broad U.S. Equities 27.25%) 8.52%) Developed Foreign Equities 12.00%) 6.88%) Emerging Market Equities 6.40%) 10.00%) Private Equity 9.25%) 12.41%) Hedge Funds/Absolute Return 12.00%) 4.72%) Real Estate (Property) 2.00%) 6.83%) Commodities 1.00%) 5.32%) Global Debt ex U.S. 3.50%) (0.40%) REIT 4.25%) 5.12%) 2014
Asset Class Target
Allocation
Long-Term Expected Real Rate of Return
Cash 6.00%) 0.80%) Core Bonds 1.00%) 2.49%) Intermediate-Term Bonds 11.20%) 2.26%) Mortgages 2.50%) 2.17%) High Yield Bonds 5.50%) 4.82%) Inflation-Indexed Bonds 2.50%) 3.51%) Broad U.S. Equities 25.90%) 8.22%) Developed Foreign Equities 12.70%) 8.12%) Emerging Market Equities 6.50%) 9.91%) Private Equity 8.25%) 13.02%) Hedge Funds/Absolute Return 12.25%) 4.92%) Real Estate (Property) 3.20%) 5.80%) Commodities 2.50%) 5.35%)
Discount Rate — The discount rate used to measure the total pension liability for PERS was 4.90% and 5.39% as of June 30, 2015 and 2014, respectively. The discount rate used to measure the total pension liability for PFRS was 5.79% and 6.32% as of June 30, 2015 and 2014, respectively. This single blended discount rate was based on the long-term expected rate of return on pension plan investments of 7.90%, and a municipal bond rate of 3.80% and 4.29% as of June 30, 2015 and 2014, respectively, based on the Bond Buyer Go 20-Bond Municipal Bond Index which includes tax-exempt general obligation municipal bonds with an average rating of AA/Aa or higher. The projection of cash flows used to determine the discount rate assumed that contributions from plan members will be made at the current member contribution rates and that the contributions from employers will be made based on the average of the last five years of contributions made in relation to the last five years of actuarially recommended contributions. Based on those assumptions, the plan’s fiduciary net position was projected to be available to make projected future benefit payments of current plan members through 2033 for PERS and 2045 for PFRS. Therefore, the long-term expected rate of return on plan investments was applied to projected benefit payments through 2033 for PERS and 2045 for PFRS, and the municipal bond rate was applied to projected benefit payments after that date in determining the total pension liability. Sensitivity of the Collective Net Pension Liability to Changes in the Discount Rate — The following presents the collective net pension liability of the university, measured as of June 30, 2015, and June 30, 2014, respectively, calculated using the discount rate as disclosed above as well as what the collective net pension liability would be if it was calculated using a discount rate that is 1-percentage point lower or 1-percentage point higher than the current rate (dollars in thousands):
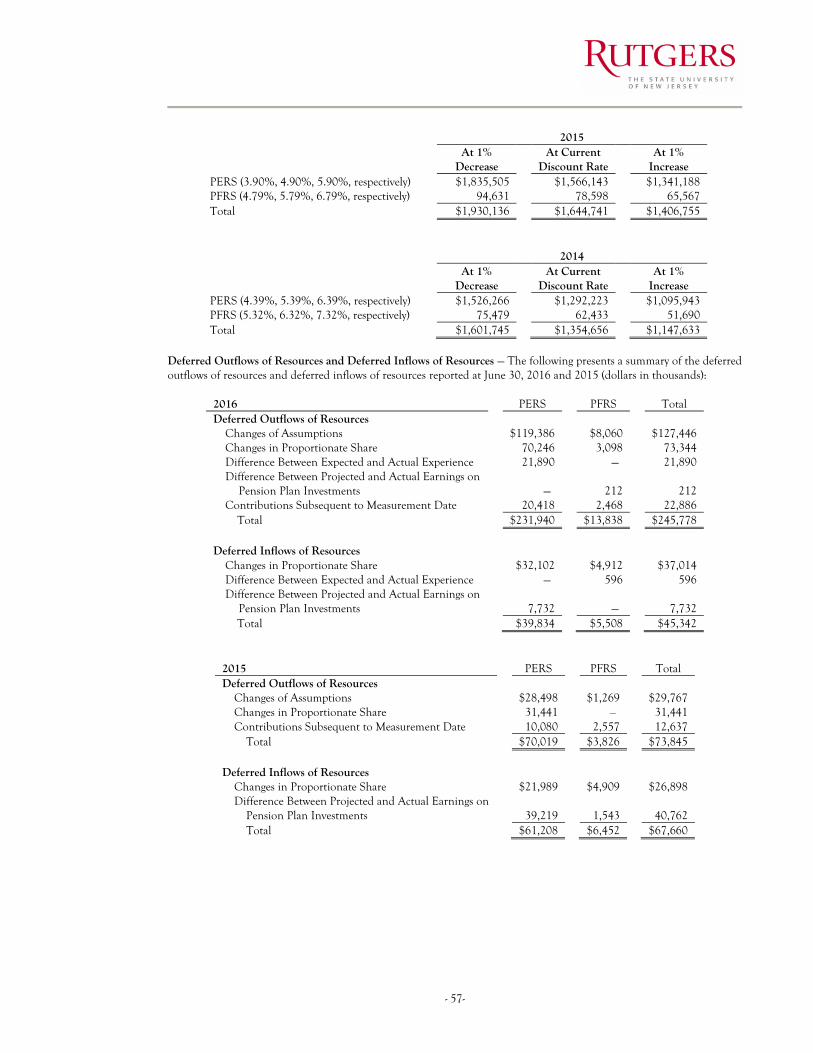
- 57-
2015
At 1%
Decrease At Current
Discount Rate At 1%
Increase PERS (3.90%, 4.90%, 5.90%, respectively) $1,835,505 $1,566,143 $1,341,188 PFRS (4.79%, 5.79%, 6.79%, respectively) 94,631 78,598 65,567 Total $1,930,136 $1,644,741 $1,406,755 2014
At 1%
Decrease At Current
Discount Rate At 1%
Increase PERS (4.39%, 5.39%, 6.39%, respectively) $1,526,266 $1,292,223 $1,095,943 PFRS (5.32%, 6.32%, 7.32%, respectively) 75,479 62,433 51,690 Total $1,601,745 $1,354,656 $1,147,633
Deferred Outflows of Resources and Deferred Inflows of Resources — The following presents a summary of the deferred outflows of resources and deferred inflows of resources reported at June 30, 2016 and 2015 (dollars in thousands):
2016 PERS PFRS Total Deferred Outflows of Resources
Changes of Assumptions $119,386 $8,060 $127,446 Changes in Proportionate Share 70,246 3,098 73,344 Difference Between Expected and Actual Experience 21,890 —) 21,890 Difference Between Projected and Actual Earnings on
Pension Plan Investments —) 212 212 Contributions Subsequent to Measurement Date 20,418 2,468 22,886
Total $231,940 $13,838 $245,778 Deferred Inflows of Resources
Changes in Proportionate Share $32,102 $4,912 $37,014 Difference Between Expected and Actual Experience —) 596 596 Difference Between Projected and Actual Earnings on
Pension Plan Investments 7,732 —) 7,732 Total $39,834 $5,508 $45,342
2015 PERS PFRS Total Deferred Outflows of Resources
Changes of Assumptions $28,498 $1,269 $29,767 Changes in Proportionate Share 31,441 ‒) 31,441 Contributions Subsequent to Measurement Date 10,080 2,557 12,637
Total $70,019 $3,826 $73,845 Deferred Inflows of Resources
Changes in Proportionate Share $21,989 $4,909 $26,898 Difference Between Projected and Actual Earnings on
Pension Plan Investments 39,219 1,543 40,762 Total $61,208 $6,452 $67,660
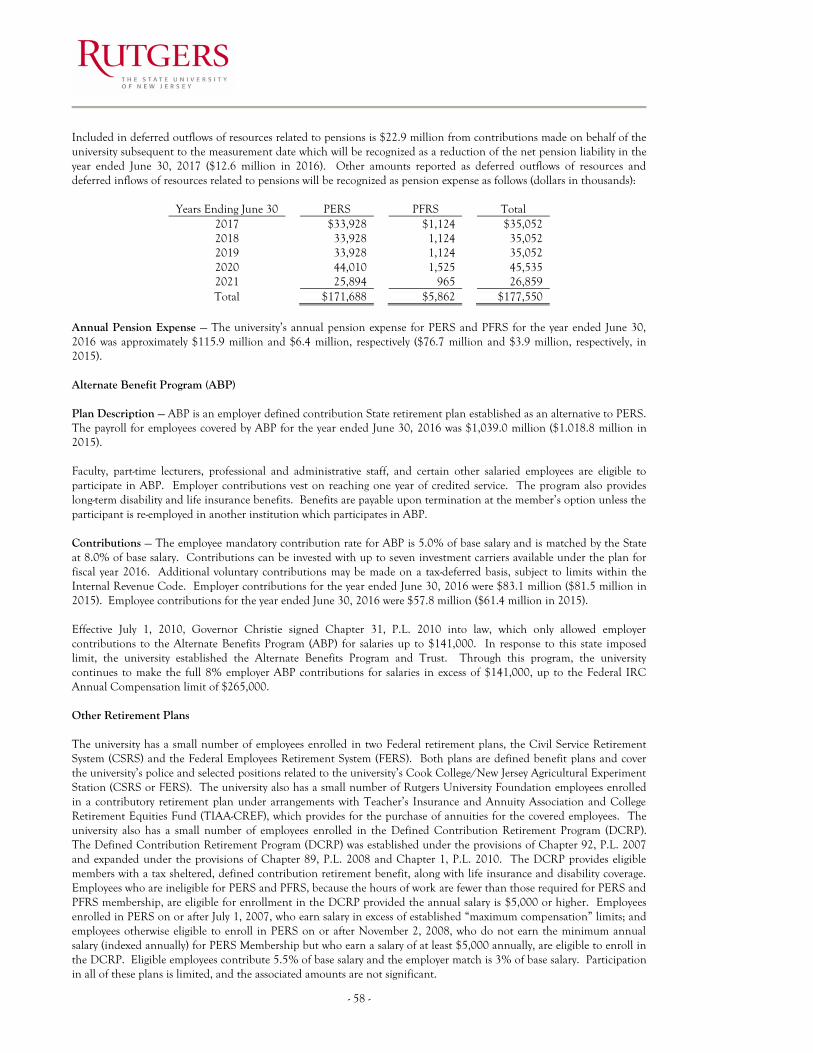
- 58 -
Included in deferred outflows of resources related to pensions is $22.9 million from contributions made on behalf of the university subsequent to the measurement date which will be recognized as a reduction of the net pension liability in the year ended June 30, 2017 ($12.6 million in 2016). Other amounts reported as deferred outflows of resources and deferred inflows of resources related to pensions will be recognized as pension expense as follows (dollars in thousands):
Years Ending June 30 PERS PFRS Total 2017 $33,928 $1,124 $35,052 2018 33,928 1,124 35,052 2019 33,928 1,124 35,052 2020 44,010 1,525 45,535 2021 25,894 965 26,859 Total $171,688 $5,862 $177,550
Annual Pension Expense — The university’s annual pension expense for PERS and PFRS for the year ended June 30, 2016 was approximately $115.9 million and $6.4 million, respectively ($76.7 million and $3.9 million, respectively, in 2015). Alternate Benefit Program (ABP) Plan Description — ABP is an employer defined contribution State retirement plan established as an alternative to PERS. The payroll for employees covered by ABP for the year ended June 30, 2016 was $1,039.0 million ($1.018.8 million in 2015). Faculty, part-time lecturers, professional and administrative staff, and certain other salaried employees are eligible to participate in ABP. Employer contributions vest on reaching one year of credited service. The program also provides long-term disability and life insurance benefits. Benefits are payable upon termination at the member’s option unless the participant is re-employed in another institution which participates in ABP. Contributions — The employee mandatory contribution rate for ABP is 5.0% of base salary and is matched by the State at 8.0% of base salary. Contributions can be invested with up to seven investment carriers available under the plan for fiscal year 2016. Additional voluntary contributions may be made on a tax-deferred basis, subject to limits within the Internal Revenue Code. Employer contributions for the year ended June 30, 2016 were $83.1 million ($81.5 million in 2015). Employee contributions for the year ended June 30, 2016 were $57.8 million ($61.4 million in 2015). Effective July 1, 2010, Governor Christie signed Chapter 31, P.L. 2010 into law, which only allowed employer contributions to the Alternate Benefits Program (ABP) for salaries up to $141,000. In response to this state imposed limit, the university established the Alternate Benefits Program and Trust. Through this program, the university continues to make the full 8% employer ABP contributions for salaries in excess of $141,000, up to the Federal IRC Annual Compensation limit of $265,000. Other Retirement Plans The university has a small number of employees enrolled in two Federal retirement plans, the Civil Service Retirement System (CSRS) and the Federal Employees Retirement System (FERS). Both plans are defined benefit plans and cover the university’s police and selected positions related to the university’s Cook College/New Jersey Agricultural Experiment Station (CSRS or FERS). The university also has a small number of Rutgers University Foundation employees enrolled in a contributory retirement plan under arrangements with Teacher’s Insurance and Annuity Association and College Retirement Equities Fund (TIAA-CREF), which provides for the purchase of annuities for the covered employees. The university also has a small number of employees enrolled in the Defined Contribution Retirement Program (DCRP). The Defined Contribution Retirement Program (DCRP) was established under the provisions of Chapter 92, P.L. 2007 and expanded under the provisions of Chapter 89, P.L. 2008 and Chapter 1, P.L. 2010. The DCRP provides eligible members with a tax sheltered, defined contribution retirement benefit, along with life insurance and disability coverage. Employees who are ineligible for PERS and PFRS, because the hours of work are fewer than those required for PERS and PFRS membership, are eligible for enrollment in the DCRP provided the annual salary is $5,000 or higher. Employees enrolled in PERS on or after July 1, 2007, who earn salary in excess of established “maximum compensation” limits; and employees otherwise eligible to enroll in PERS on or after November 2, 2008, who do not earn the minimum annual salary (indexed annually) for PERS Membership but who earn a salary of at least $5,000 annually, are eligible to enroll in the DCRP. Eligible employees contribute 5.5% of base salary and the employer match is 3% of base salary. Participation in all of these plans is limited, and the associated amounts are not significant.
- 59-
Deferred Compensation Plan University employees with membership in PERS, ABP or PFRS are eligible to participate in the State of New Jersey’s Employees Deferred Compensation Plan created in accordance with Internal Revenue Code Section 457. The plan permits employees to elect pre-tax and/or after-tax Roth contributions to invest a portion of their base salary until future years. The deferred compensation is not available to employees until termination, retirement, death or unforeseeable emergency. The plan is administered by Prudential Financial. The plan does not include any matching employer (State) contributions. All amounts of compensation deferred under the plan, all property and rights purchased with those amounts and all income attributable to those amounts, property or rights, are held in trust by the State for the exclusive benefit of the participating employees and their beneficiaries. Postemployment Benefits Other Than Pension In addition to providing pension benefits, the State provides certain health care and life insurance benefits for the university’s retired employees, in accordance with State statutes. Full health coverage is provided to eligible employees retiring with 25 years of service credited on or before June 30, 1997 in one of the State of New Jersey’s mandatory pension plans. Employees retiring with 25 years of service credited after June 30, 1997 may share in the cost of the health care provided under the State Plan according to the terms specified in the appropriate bargaining unit agreement in effect at the time the employee reaches 25 years of credited service. The rules governing the contribution rate are the same as that for active employees. Since the costs of these programs are the responsibility of the State and the retired employees, the amounts are not available to the university and no expenses or liabilities for these benefits are reflected in the university’s financial statements. NOTE 15 - COMPENSATED ABSENCES The university accounts for compensated absences as directed by GASB Statement No. 16, Accounting for Compensated Absences. A liability for compensated absences (i.e. unused vacation, sick leave, and paid leave bank days attributable to services already rendered and not contingent on a specific event that is outside the control of the employer and employee is accrued as employees earn the rights to the benefits. The university recorded a liability for accumulated vacation time in the amount of $66.6 million at June 30, 2016 ($68.9 million in 2015). The liability is calculated based upon employees’ accrued vacation time as of the statement of net position date and is recorded in accounts payable and accrued expenses in the accompanying statements of net position. Payments for accumulated sick leave balances are made to retiring employees upon regular retirement. The payout to retirees for unused accumulated sick time is calculated at the lesser of ½ the value of earned time or $15,000. Employees separating from the university service prior to retirement are not entitled to payments for accumulated sick leave balances. The university recorded a liability for accumulated sick leave balances in the amount of $17.8 million at June 30, 2016 ($16.3 million in 2015) which is included in noncurrent accounts payable and accrued expenses in the accompanying statements of net position. The university also recorded a liability for paid leave bank days in the amount of $4.0 million at June 30, 2016 ($4.0 million in 2015), which is included in noncurrent accounts payable and accrued expenses in the accompanying statements of net position. Employees began using these days on July 1, 2010, and may continue for the duration of employment with the university. Once these days are exhausted, the employee will not be eligible for any additional days.

- 60 -
NOTE 16 - RISK MANAGEMENT In 1980, the university, jointly with 15 other higher education institutions, established Genesis Ltd. (Genesis), a Class 2 reinsurer under the Insurance Act of 1978 of Bermuda. Genesis, a Captive Reinsurance Company, was formed to reinsure general liability, professional liability, and automobile liability risks of its shareholders. In 2004, the university and its 15 partners formed a Vermont Reciprocal Risk Retention Group, Pinnacle Consortium of Higher Education (Pinnacle), to enhance and support the insurance programs and provide fronting services for Genesis. The primary purpose of this second alternate risk funding company was to reduce costs, reduce collateral requirements for Genesis and provide the flexibility to conduct business in the U.S. The insurance policies have deductibles that vary by policy, the most significant of which provides for the payment of general liability claims. Effective January 1, 2016, in order to eliminate certain redundancies and gain further operational efficiency, the Shareholders and Subscribers of Genesis and Pinnacle, respectively, consolidated the insurance operations into Pinnacle in a two-step process by: discontinuing Genesis in Bermuda, and, immediately merging it into Pinnacle, with Pinnacle remaining as the surviving entity. Pinnacle assumed all of Genesis’ obligations as reinsurer of Pinnacle, and is holding all of the assets previously held by Genesis to support such obligations. Going forward, Pinnacle will retain all of the risk that previously was ceded to Genesis. The university is self-insured for workers compensation and retains various deductibles for general liability, automobile liability, and all risk property insurance. The total liability at June 30, 2016 for these items is $32.8 million ($35.6 million in 2015). The reserve balance recorded at June 30, 2016 is $37.0 million ($32.5 million in 2015). No discount rate is used. The self-insurance reserve represents the estimated ultimate cost of settling claims and related expenses resulting from events that have occurred. The reserve includes the amount that will be required for future payments of claims that have been reported and claims related to events that have occurred but have not been reported (IBNR). The university participates in the State’s Medical Malpractice Self-Insurance Fund (the Fund) which is used to pay malpractice claims and insurance premiums for the university. The contributions made during the current fiscal year by the university and its affiliate hospitals, UPA, Department of Corrections (DOC), and faculty practice plans are equal to the amount established in memoranda agreements between the Department of the Treasury and the university. If the contributions are insufficient to pay claims expenditures, the State’s General Fund will be used to pay remaining claims. Payment of claims from the Fund totaled $38.7 million in 2016 ($50.7 million in 2015). Contributions to the Fund from the State totaled $44.0 million in 2016 ($38.8 million in 2015), while contributions from RBHS affiliates, DOC, and faculty practice plans totaled $9.5 million in 2016 ($10.7 million in 2015). The university has accrued expenses for deductibles and incurred but not reported liabilities in the statements of net position. The accrued expenses are based on estimates by management and third party claims administrators and generally represent the present value of the unpaid claims including the estimates for claims incurred but not reported.

- 61-
NOTE 17 - CONTINGENCIES The university is a party to various legal actions arising in the ordinary course of its operations. While it is not feasible to predict the ultimate outcome of these actions, it is the opinion of management that the resolution of these matters will not have a material adverse effect on the university’s financial statements. The university receives funds from federal, state and private agencies under grants and contracts for research, training and other activities. The costs, both direct and indirect, charged to these grants and contracts are subject to audit and possible disallowance by the sponsoring agency. It is the university’s belief that any disallowances or adjustments would not have a significant effect on the university’s financial statements. In connections with the settlement of two cases that initially resulted in a Deferred Prosecution Agreement with the United States Attorney for the District of New Jersey, the University of Medicine and Dentistry of New Jersey (UMDNJ) entered into a five year Corporate Integrity Agreement (CIA) with the Office of the Inspector General (OIG) of the Federal Department of Health and Human Services in September 2009. Under the terms of the CIA, UMDNJ agreed to adhere to requirements that ensure regulatory and legal compliance with all Federal healthcare programs. Pursuant to a letter agreement between the university and the OIG, the university assumed UMDNJ’s obligations under the CIA to the extent those obligations relate to the units of UMDNJ acquired by the university pursuant to the New Jersey Medical and Health Sciences Education Restructuring Act. In March 2015, the university received confirmation from the Office of the Inspector General (OIG) of the United States Department of Health and Human Services that RBHS fulfilled its requirements under the Corporate Integrity Agreement (CIA) (September 2009 through September 2014), originally between the University of Medicine and Dentistry of New Jersey (UMDNJ) and the OIG and subsequently between RBHS and OIG pursuant to the integration of UMDNJ and Rutgers, The State University of New Jersey. With the expiration of the CIA, RBHS is released from its reporting requirements to the OIG but will continue to implement its robust healthcare compliance program developed over the last six years. NOTE 18 – ONE WASHINGTON PARK In September 2006, the university’s Board of Governors authorized the negotiation and execution of a contract of purchase and sale and arrangement for construction financing for the Rutgers Newark Business School’s relocation to One Washington Park, Newark, New Jersey, where space was consolidated for faculty offices and classrooms. The building was converted into a condominium in which 11 floors of the building along with a 15,000 square foot addition located at grade level reconstituted as the Rutgers Business School space. The overall project budget included the following: (i) the acquisition of the Rutgers Business School Space, (ii) the construction costs needed to build out the interior and exterior of such space, (iii) the construction costs needed to improve and repair certain common elements and common building systems in the building, (iv) the fee required under the Architect’s Contract, and (v) other non-construction related costs. The overall project cost was $83.0 million. Funding for this project came from several sources, particularly, in fiscal year 2006, the State of New Jersey made a special appropriation to the university in the amount of $18.0 million earmarked specifically for the Business School. The university is also participating in the New Markets Tax Credit (NMTC) program administered by the U.S. Treasury’s Community Development Financial Institutions Fund (CDFI) and entered into a transaction with City National Bank of New Jersey, PNC Bank, National Community Investment Fund, and New Jersey Community Capital, also known as a Community Development Entity (CDE). The NMTC compliance period ended as of December 1, 2014. When the transaction was completed, the university controls the property indirectly through its blended component units, Parkside RUN Investments, LLC and One Washington Park Holdings, LLC (QALICB). On October 15, 2009, the new home of the Rutgers Business School at One Washington Park was officially opened. Classes began in the facility at the start of the 2009 fall semester. The building houses Rutgers Business school classes, faculty and staff offices, departments, centers, and a police substation for added security.

- 62 -
NOTE 19 - COMPONENT UNIT - RUTGERS UNIVERSITY FOUNDATION Cash, Cash Equivalents, and Investments The foundation’s cash and cash equivalents consist of the following as of June 30, 2016 and 2015 (dollars in thousands):
2016 2015 Money Market Account $881 $1,753 Cash and Deposits 17,851 22,195
$18,732 $23,948 The Board of Overseers, through its Investment Committee, has authority over the investment of foundation funds. Professional investment managers are engaged by the foundation to buy, sell, invest, and reinvest portions of the assets in accordance with the investment policies and objectives established by the Investment Committee. The primary financial objective of the foundation’s investment management of assets for the General Endowment Fund is to earn the highest yield possible without unnecessary risk to principal. To achieve the goals of safety, liquidity, and return, the assets in the General Endowment Fund are invested in laddered high quality short term fixed income securities and/or an institutional money market fund. The objective for the Planned Giving Portfolio is to maximize long term total return through a combination of income and capital appreciation in a prudent manner. To achieve the goals of growth and income, the assets within the Planned Giving Portfolio are divided into an equity portion (equities including convertibles and cash devoted to equities) and a fixed income portion (bonds, notes, nonconvertible preferred stock, and cash devoted to fixed income). In addition, the Planned Giving Portfolio is subject to state mandated investment restrictions for annuities issued in the states of Florida and California. Fair Value Measurement Fair value is defined as the price that would be received to sell an asset or paid to transfer a liability in an orderly transaction between market participants at the financial statement measurement date. The fair value hierarchy categorizes the inputs to valuation techniques used to measure fair value into three levels as follows: Level 1 – unadjusted quoted prices for identical assets or liabilities in active markets that a government can access at the measurement date. Level 2 – quoted prices other than those included within Level 1 and other inputs that are observable for an asset or liability, either directly or indirectly. Level 3 – unobservable inputs for an asset or liability. The fair value hierarchy gives the highest priority to Level 1 inputs and the lowest priority to Level 3. When the fair value of an asset or liability is measured using inputs from more than one level of the fair value hierarchy, the measurement is considered to be based on the lowest priority level that is significant to the entire measurement. While the entity believes its valuation methods are appropriate and consistent with other market participants, the use of different methodologies or assumptions to determine the fair value of certain financial instruments could result in a different estimate of fair value at the reporting date.

- 63-
The following is a description of the valuation methodologies used for instruments measured at fair value: U.S. Treasury Securities – The fair value of U.S. Treasury securities is the market value using quoted market prices. Mortgage-backed Securities – The fair value of mortgage-backed securities is the market value using quoted market prices. Preferred Stock – The fair value of preferred stock is the market value using quoted market prices (Level 1) and sensitivity analysis of the relationship between bond and equity values for preferred stock with observable inputs (Level 2) and unobservable inputs (Level 3). Equity Securities – The fair value of equity securities is the market value based on quoted market prices. Fixed Income Mutual Funds – The fair value of equity securities is the market value based on quoted market prices. Real Estate – The fair value of real estate is the value based on the initial recognition of the assets when they are donated to the foundation based on a qualified appraisal or similar real estate market value. Privately Held Securities – The fair market value of privately held securities is the value based upon the initial recognition of the asset when donated to the foundation. There are no observable markets for the assets. The foundation’s investments are summarized in the following table by their fair value hierarchy as of June 30, 2016 (dollars in thousands):
2016
Investments by Fair Value Level
Investment Type Fair Value Level 1 Level 2 Level 3
U.S. Treasury Securities $372
$372 $ ‒) $ ‒) Mortgage-backed Securities 1 1 ‒) ‒)
Preferred Stock 255 133 109 13
Fixed Income Mutual Funds 7,821 7,821 ‒) ‒) Equity Securities 4,897 4,897 ‒) ‒) Real Estate 140 ‒) 140 ‒)
Privately Held Securities 60 ‒) ‒) 60
$13,546
$13,224 $249 $73

- 64 -
The foundation’s investments are summarized in the following table by their fair value hierarchy as of June 30, 2015 (dollars in thousands):
2015
Investments by Fair Value Level
Investment Type Fair Value Level 1 Level 2 Level 3
U.S. Treasury Securities $387
$387 $ ‒) $ ‒) Mortgage-backed Securities 1 1 ‒) ‒) Foreign Debt Securities 335 335 ‒) ‒)
Preferred Stock 271 134 126 11 Fixed Income Mutual Funds 16,832 16,832 ‒) ‒) Equity Securities 10,510 10,510 ‒) ‒)
Real Estate 15 ‒) 15 ‒)
Privately Held Securities 60 ‒) ‒) 60
$28,411
$28,199 $141 $71
Custodial Credit Risk – The foundation’s deposits are exposed to custodial credit risk if they are not covered by depository insurance and the deposits are: uncollateralized, collateralized with securities held by the pledging financial institution, or collateralized with securities held by the pledging financials institution’s trust department or agent, but not in the foundation’s name. The deposit risk is that, in the event of the failure of a depository financial institution, the foundation will not be able to recover deposits or will not be able to recover collateral securities that are in the possession of an outside party. The foundation’s investment securities are exposed to custodial credit risk if the securities are uninsured, are not registered in the name of the foundation and are held by either: the counterparty or the counterparty’s trust department of agent, but not in the foundation’s name. The investment risk is that, in the event of the failure of the counterparty to a transaction, the foundation will not be able to recover the value of the investment of collateral securities that are in the possession of an outside party. The custodial credit risk associated with the foundation’s cash and cash equivalents includes uncollateralized deposits, including any bank balance that is collateralized with securities held by pledging financial institutions, or by its trust department or agent, but not in the foundation’s name. As of June 30, 2016, the amount on deposit with the banks was $17.9 million ($22.1 million in 2015). As of June 30, 2016 and 2015, the foundation had insured deposits up to the Federal Deposit Insurance Corporation (FDIC) coverage limits totaling $0.3 million. Cash and cash equivalents in excess of those balances are uncollateralized. As of June 30, 2016 and 2015, the foundation’s investments were either insured, registered, or held by the foundation’s agent in the foundation’s name, except for money market and mutual funds, which are not subject to custodial credit risk because their existence is not evidenced by securities that exist in physical or book entry form. Concentration of Credit Risk – The foundation limits the concentration of credit risk by placing a limit on the amount the investment managers may invest in any one issuer. No initial purchase of an equity or fixed income security in any one issuer should exceed 5% of the portion of the foundation’s assets under management by each investment manager. In addition, no single equity security should be greater than 10% of the market value of the foundation’s assets under management. As of June 30, 2016 and 2015, there are no investments in any one issuer greater than 5% of total investments. Credit Risk – GASB Statement No. 40 requires that disclosure be made as to the credit rating of all fixed income securities except obligations of the U.S. government or obligations explicitly guaranteed by the U.S. government. The foundation’s investment policy states that individual bonds shall be rated investment grade by at least two recognized or authorized rating agencies (Moody’s and Standard & Poor’s). The average credit quality of the fixed income securities must be maintained at a Class “BBB/Baa” or higher as rated by both standard services (Moody’s and Standard & Poor’s). Up to 10% of the investment manager’s portfolio may be invested in securities rated “BBB/Baa” or lower as rated by both standard services (Moody’s and Standard & Poor’s). The dollar-weighted average rating of the fixed income portfolio for each manager of marketable bonds shall be “A/A” or better.

- 65-
As of June 30, 2016 and 2015, the foundation’s investment quality ratings as rated by Standard & Poor’s were as follows (dollars in thousands):
Investment Type Quality Rating 2016 2015 U.S. Treasury and Agency Securities AA+ $372 $387 Mortgage-backed Securities AA+ 1 1 Foreign Debt Securities A+ —) 335 Preferred Stock A+ 1 1 Preferred Stock BBB 46 82 Preferred Stock BBB– 67 62 Preferred Stock BB+ 13 12 Preferred Stock BB 56 94 Preferred Stock BB– 14 20 Preferred Stock Not Rated 58 —) Fixed Income Mutual Funds Not Rated 7,821 16,832
Total $8,449 $17,826 Interest Rate Risk – This is the risk that changes in interest rates will adversely affect the fair value of an investment. The foundation does not have a provision in the investment policy that limits investment maturities as a means of managing its exposure to fair value losses arising from increasing interest rates. While the general provisions of the investment strategy should be implemented with a long term perspective, all holdings must be sufficiently liquid so as to allow liquidation of the entire portfolio on one month’s notice. In addition, annuity pooled investments in the planned giving portion of the portfolio are governed by the New Jersey Prudent Investor Act. The required reserves for this pool are reviewed utilizing actuarial assumptions of the charitable gift annuity assets. The following table summarizes the maturities as of June 30, 2016 and 2015 (dollars in thousands):
2016 Investment Maturities (in years)
Investment Type Fair Value Less than 1 1 — 5 6 — 10 More than 10 U.S. Treasury Securities $372 $7 $359 $6 $ —) Mortgage-backed Securities 1 —) —) —) 1 Preferred Stock 255 27 126 27 75 Fixed Income Mutual
Funds
7,821 —) 5,363 2,458 —)
Total $8,449 $34 $5,848 $2,491 $76
2015 Investment Maturities (in years)
Investment Type Fair Value Less than 1 1 — 5 6 — 10 More than 10 U.S. Treasury Securities $387 $10 $285 $92 $ —) Mortgage-backed Securities 1 —) —) —) 1 Foreign Debt Securities 335 335 —) —) —) Preferred Stock 271 20 75 24 152 Fixed Income Mutual
Funds
16,832 8,039 1,950 6,843 —)
Total $17,826 $8,404 $2,310 $6,959 $153
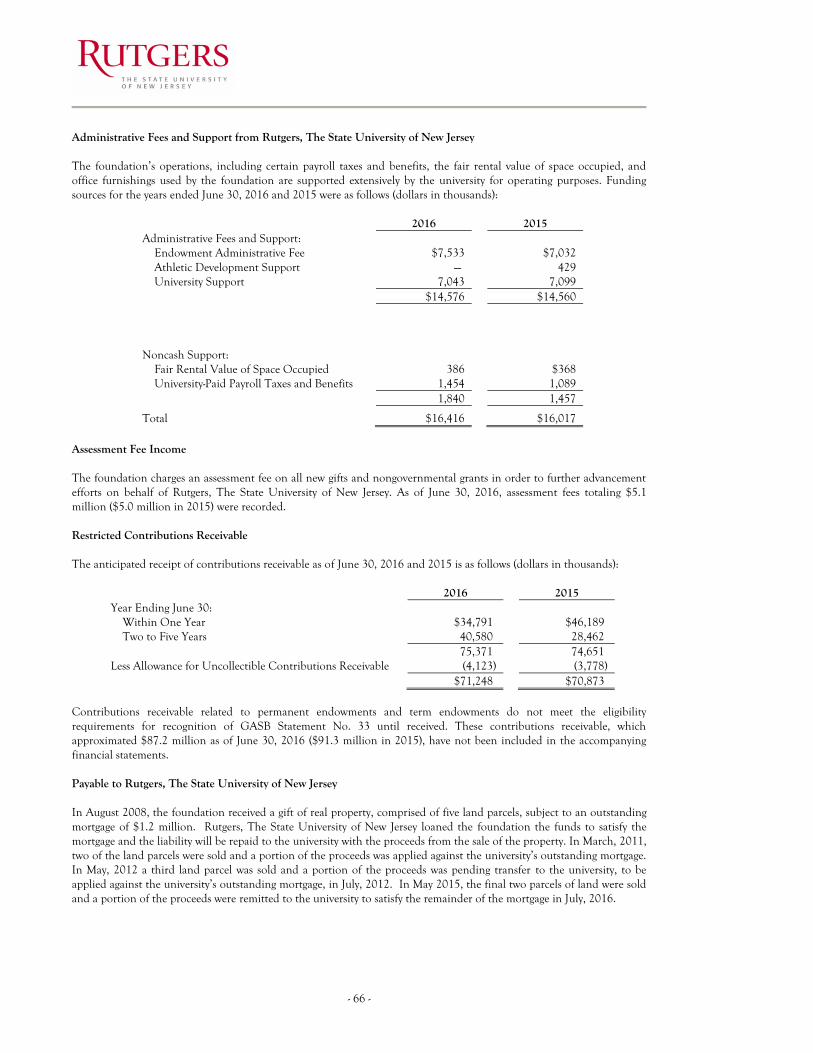
- 66 -
Administrative Fees and Support from Rutgers, The State University of New Jersey The foundation’s operations, including certain payroll taxes and benefits, the fair rental value of space occupied, and office furnishings used by the foundation are supported extensively by the university for operating purposes. Funding sources for the years ended June 30, 2016 and 2015 were as follows (dollars in thousands):
2016 2015 Administrative Fees and Support:
Endowment Administrative Fee $7,533 $7,032 Athletic Development Support —) 429 University Support 7,043 7,099
$14,576 $14,560 Noncash Support:
Fair Rental Value of Space Occupied 386 $368 University-Paid Payroll Taxes and Benefits 1,454 1,089 1,840 1,457
Total $16,416 $16,017 Assessment Fee Income The foundation charges an assessment fee on all new gifts and nongovernmental grants in order to further advancement efforts on behalf of Rutgers, The State University of New Jersey. As of June 30, 2016, assessment fees totaling $5.1 million ($5.0 million in 2015) were recorded. Restricted Contributions Receivable The anticipated receipt of contributions receivable as of June 30, 2016 and 2015 is as follows (dollars in thousands):
2016 2015 Year Ending June 30:
Within One Year $34,791) $46,189) Two to Five Years 40,580) 28,462)
75,371) 74,651) Less Allowance for Uncollectible Contributions Receivable (4,123) (3,778) $71,248) $70,873)
Contributions receivable related to permanent endowments and term endowments do not meet the eligibility requirements for recognition of GASB Statement No. 33 until received. These contributions receivable, which approximated $87.2 million as of June 30, 2016 ($91.3 million in 2015), have not been included in the accompanying financial statements. Payable to Rutgers, The State University of New Jersey In August 2008, the foundation received a gift of real property, comprised of five land parcels, subject to an outstanding mortgage of $1.2 million. Rutgers, The State University of New Jersey loaned the foundation the funds to satisfy the mortgage and the liability will be repaid to the university with the proceeds from the sale of the property. In March, 2011, two of the land parcels were sold and a portion of the proceeds was applied against the university’s outstanding mortgage. In May, 2012 a third land parcel was sold and a portion of the proceeds was pending transfer to the university, to be applied against the university’s outstanding mortgage, in July, 2012. In May 2015, the final two parcels of land were sold and a portion of the proceeds were remitted to the university to satisfy the remainder of the mortgage in July, 2016.
- 67-
University Receipts on Foundation Pledges The foundation records pledges receivables, and the associated gift income, for nonendowment related gifts and private grants based upon written commitments from these entities. From individual donors, the written support is primarily in the form of a fund agreement signed by both the donor(s) and the foundation. Private grants obtained from private corporations and foundations are recorded upon confirmation of the grant award to the university via correspondence from the private organization. Payments on these pledges are not all received at the foundation, as some payments are made directly to the university. Any payments made directly to the university are captured in the foundation’s statements of revenues, expenses and changes in net position as gift revenue as well as distributions to the university. The total of these payments to the university as of June 30, 2016 was $20.5 million ($25.7 million in 2015). NOTE 20 – COMPONENT UNIT – UNIVERSITY PHYSICIAN ASSOCIATES OF NEW JERSEY, INC. AND AFFILIATE The following information has been taken from UPA’s audited financial statements which were prepared in accordance with financial pronouncements of the Financial Accounting Standards Board. The accompanying combined financial statements of UPA are prepared on a modified cash basis of accounting, which is a comprehensive basis of accounting other than accounting principles generally accepted in the United States of America. Investments and Assets Whose Use is Limited Cash and Cash Equivalents – Restricted This amount represents funds held in one depository account for the repayment of liabilities to the New Jersey Medical School Deans’ Fund. Assets limited as to use at June 30, 2016 and 2015 is set forth in the following table (dollars in thousands):
2016 2015 Cash and Cash Equivalents – Restricted $4,587 $5,603
$4,587 $5,603 Investments The composition of investments at June 30, 2016 and 2015 is set forth in the following table (dollars in thousands):
2016 2015 Cash and Cash Equivalents $1,792 $1,781 Marketable Equity Securities 18,392 18,121 U.S. Government Securities 4,011 3,984 Bonds 3,904 3,840
Total Short-term Investments $28,099 $27,726

- 68 -
The fair value of UPA’s financial assets that are measured on a recurring basis at June 30, 2016 and 2015 are as follows (dollars in thousands):
Assets Valuation
Techniques(1)
Quoted Priced in
Active Markets Level 1
Significant Other
Observable Inputs Level 2
Significant Unobservable
Inputs Level 3
2016 Total Fair
Value Marketable Equity
Securities
M $18,392 $ —) $ —) $18,392 U.S. Government
Securities
M —) 4,011 —) 4,011 Bonds M —) 3,904 —) 3,904
Total Assets $18,392 $7,915 $ —) $26,307
Assets Valuation
Techniques(1)
Quoted Priced in
Active Markets Level 1
Significant Other
Observable Inputs Level 2
Significant Unobservable
Inputs Level 3
2015 Total Fair
Value Marketable Equity
Securities
M $18,121 $ —) $ —) $18,121 U.S. Government
Securities
M —) 3,984 —) 3,984 Bonds M —) 3,840 —) 3,840
Total Assets $18,121 $7,824 $ —) $25,945 (1) The three valuation techniques are market approach (M), cost approach (C), and income approach (I). At June 30, 2016, there was approximately $1.8 million ($1.8 million in 2015) of cash and cash equivalents in investments within the statement of net position that are excluded from the charts above as they are not considered recurring fair value measurements. The following methods and assumptions were used to estimate the fair value of each class of assets: Marketable Equity Securities – Fair value estimates for publicly traded equity securities are based on quoted market prices are classified as Level 1. UPA does not adjust the quoted price for such assets. U.S. Government Securities and Bonds – The estimated fair values are based on other market data for the same or comparable instruments and transactions in establishing the prices. Fair values of debt securities that do not trade on a regular basis in active markets of priced using a model-based valuation are classified as Level 2. Transactions with Related Parties The Board of Directors of UPA includes certain participating UPA physicians, the Dean of Rutgers New Jersey Medical School and the Senior Vice President for Finance and Administration of Rutgers University. Transactions between UPA, Rutgers University and UPA physicians are handled in accordance with the Affiliation Agreement. Under the terms of the affiliation agreement between Rutgers University and UPA, all professional fees collected by UPA will be distributed in varying proportions to the following: UPA participating physicians – Faculty members who are required to or permitted to participate in the faculty
practice plan. Included are full time, part time, and voluntary faculty.
Rutgers New Jersey Medical School department Funds – 7% of gross patient service on system and off system collections are paid into the Departmental Chairs Fund.

- 69-
Rutgers New Jersey Medical School Deans’ Fund – 7% of gross patient service on system and off system collections are paid into the Deans’ Fund.
Participant fund – These are funds voluntarily voted on by participants through their specific departments within Rutgers New Jersey Medical School, with varying amounts allocated for each participant.
Rutgers University medical malpractice fund – 3% of gross patient service on system and off system collections are paid into Rutgers University’s self-insured pool for medical malpractice coverage per the affiliation agreement.
The payables to related parties as of June 30, 2016 and 2015, are as follows (dollars in thousands):
2016 2015 Payable to Rutgers University Medical Malpractice Fund $667 $569) Payable to New Jersey Medical School Mandatory Department Account 3,650 3,189) Payable to New Jersey Medical School Deans’ Fund 6,438 7,116) Payable to Voluntary Department Account 2,004 2,048) Payable to Voluntary Division Account 1,986 1,922) Payable to Voluntary Group Account 74 90) Payable to Voluntary Inter-Departmental Account 29 (4) Payable to Voluntary Practice Group Account 23,632 7,127)
Total Current Liabilities 38,480 22,057) Payable to Voluntary Practice Group Account —) 14,254)
Total Liabilities $38,480 $36,311) Lease Commitments UPA originally leased 47,500 square feet of rental space located in the Doctor’s Office Center in Newark, New Jersey from UMDNJ. UMDNJ and UPA entered into a lease dated May 7, 2001, with four subsequent addendums to extend the terms of the lease. The fourth addendum effective January 1, 2006 has extended to lease to December 31, 2006 under the same terms and conditions set forth in the May 7, 2001 lease, which is subject to renewal. Effective July 1, 2013, the lease agreement between UPA and UMDNJ was amended to state that, as of that date, the parties to the Lease Agreement are Rutgers University and UPA. Total rental expense in fiscal year 2016 was $1.2 million ($1.8 million in 2015).

- 70 -
REQUIRED SUPPLEMENTARY INFORMATION (UNAUDITED)
Schedules of Employer Contributions
For the years Ended June 30, 2016 and 2015
(dollars in thousands)
Public Employees' Retirement System (PERS) 2016 2015 Contractually Required Contribution $20,418 $14,888 Contributions in relation to the Contractually Required Contribution 20,418 14,888 Contribution Deficiency (Excess) —) —) University Employee Covered Payroll (as of Fiscal Year End) $296,594 $294,526 Contributions as a percentage of Employee Covered Payroll 6.88% 5.05%
Police and Firemen's Retirement System (PFRS) 2016 2015 Contractually Required Contribution $2,468 $1,298 Contributions in relation to the Contractually Required Contribution 2,468 1,298 Contribution Deficiency (Excess) —) —) University Employee Covered Payroll (as of Fiscal Year End) $8,091 $8,466 Contributions as a percentage of Employee Covered Payroll 30.50% 15.33%
Schedules of Proportionate Share of the Net Pension Liability
For the years Ended June 30, 2016 and 2015
(dollars in thousands)
Public Employees' Retirement System (PERS) 2016 2015 University Proportionate Share of the Net Pension Liability – State Group 6.60% 6.42% University Proportionate Share of the Net Pension Liability – Total Plan 3.39% 3.33% University Proportionate Share of the Net Pension Liability $1,566,143 $1,292,223 University Employee Covered-Payroll (for year ended as of measurement date) $294,526 $299,132 University Proportionate Share of the Net Pension Liability as a Percentage of
the Employee Covered-Payroll 531.75% 431.99% Plan Fiduciary Net Position as a Percentage of the Total Pension Liability 38.21% 42.74%
Police and Firemen's Retirement System (PFRS) 2016 2015 University Proportionate Share of the Net Pension Liability – State Group 1.83% 1.76% University Proportionate Share of the Net Pension Liability – Total Plan 0.35% 0.36% University Proportionate Share of the Net Pension Liability $78,598 $62,433 University Employee Covered-Payroll (for year ended as of measurement date) $8,466 $9,043 University Proportionate Share of the Net Pension Liability as a Percentage of
the Employee Covered-Payroll 928.40% 690.40% Plan Fiduciary Net Position as a Percentage of the Total Pension Liability 52.84% 58.86%
- 71-
University Administrative Officers
Robert L. Barchi, M.D., Ph.D. President
Nancy E. Cantor, Ph.D.
Chancellor, Rutgers University–Newark
Richard L. Edwards, Ph.D. Chancellor, Rutgers University–New Brunswick
Phoebe A. Haddon, J.D.
Chancellor, Rutgers University–Camden
Brian L. Strom, M.D., M.P.H. Chancellor, Rutgers Biomedical and Health Sciences and
Executive Vice President for Health Affairs
Antonio Calcado, M.P.A. Senior Vice President for Institutional Planning and Operations
Vivian Fernández, M.B.A.
Senior Vice President for Human Resources and Organizational Effectiveness
Timothy J. Fournier, Ed.D., M.B.A. Senior Vice President for Enterprise Risk Management, Ethics, and Compliance
J. Michael Gower, M.B.A.
Executive Vice President for Finance and Administration, and University Treasurer
Patrick E. Hobbs, J.D. Director of Intercollegiate Athletics
John J. Hoffman, J.D.
Senior Vice President and General Counsel
Nevin E. Kessler, M.A. President of the Rutgers University Foundation and
Executive Vice President for Development and Alumni Relations
Barbara A. Lee, Ph.D., J.D. Senior Vice President for Academic Affairs
Courtney O. McAnuff, M.P.A.
Vice President for Enrollment Management
Peter J. McDonough, Jr., B.A. Senior Vice President for External Affairs
Christopher J. Molloy, Ph.D.
Senior Vice President for Research and Economic Development
Michele L. Norin, M.Ed. Senior Vice President and Chief Information Officer
Kimberlee M. Pastva, J.D. Secretary of the University
Donna K. Thornton, M.P.A.
Vice President for Alumni Relations, Annual Giving and Communications