FINANCIAL REPORT NINE MONTHS ENDING JUNE 30, 2021
59
1 FINANCIAL REPORT NINE MONTHS ENDING JUNE 30, 2021 These statements are unaudited and are not the official financial statements of the City but rather are a review of the progress to date each quarter as it relates to the budget. The official financial statements of the City are included in the Comprehensive Annual Financial Report and will be presented to the City Council in the first quarter of each calendar year following the end of each fiscal year (September 30th). Attached are financial schedules setting forth the status of the major General Government, Special Revenue, Capital Projects and Proprietary Funds for the City of Pensacola for the six months ended June 30, 2021. The financial schedules compare actual results for the nine-month period against the City’s budget and against comparable percentages of a year ago. Such comparisons are useful in projecting potential problem areas, allowing management to take early corrective action. The City’s debt service and investment schedules are also attached for Council’s review. As previously reported to Council, the COVID- 19 Pandemic continues to have some negative effects on the economy and social activities. However, despite the impacts from the COVID-19 Pandemic, Half-Cent Sales Tax, Local Option Sales Tax, and the Local Option Gasoline Tax revenues have shown above average growth through the third quarter of FY 2021. The COVID-19 Pandemic did affect the Half-Cent Sales Tax and Local Option Sales Tax revenues during FY 2020. The Half-Cent Sales Tax decreased 2.28% and Local Option Sales Tax revenue decreased by 2.84% from FY 2019 to FY 2020. There is consistent revenue growth in the third quarter of FY 2021. However, other revenues have decreased from prior fiscal year, particularly, within the Franchise Fees due to the continuing effects associated with the COVID-19 Pandemic on business operations and energy consumption. Both revenues and expenditures continue to be closely monitored to assure a balanced budget. Expenditures in total are in line with budgeted projections. Significant variances from the current approved budget are noted in the individual fund narrative below. The City of Pensacola has been allocated a total of $19.1 million as part of the Federal response to the COVID-19 Pandemic. The American Rescue Plan Act (ARPA) of 2021 was enacted on March 11, 2021 to assist local governments experiencing revenue shortfalls and higher expenses responding to the Pandemic. Through July 2021 City Council has approved ARPA allocations totaling $10,282,640 on Supplemental No.’s 2021-36 and 2021-40, those appropriations include Premium Pay in the amount of $3,520,000 for front line City workers whose job put them at an increased risk of contracting COVID. An appropriation of $88,000 for Vaccination Incentive Pay available to all city employees that participate and to encourage increased vaccination rates at the City. Other appropriations include $450,000 for ARPA Administration and Grant Compliance, $1,665,000 for Facility Improvements that mitigate or prevent the spread of COVID, and $4,559,640 for Recovery of Revenue Loss for various funds.
Transcript of FINANCIAL REPORT NINE MONTHS ENDING JUNE 30, 2021

1
FINANCIAL REPORT NINE MONTHS ENDING JUNE 30, 2021
These statements are unaudited and are not the official financial statements of the City but rather are a review of the progress to date each quarter as it relates to the budget. The official financial statements of the City are included in the Comprehensive Annual Financial Report and will be presented to the City Council in the first quarter of each calendar year following the end of each fiscal year (September 30th). Attached are financial schedules setting forth the status of the major General Government, Special Revenue, Capital Projects and Proprietary Funds for the City of Pensacola for the six months ended June 30, 2021. The financial schedules compare actual results for the nine-month period against the City’s budget and against comparable percentages of a year ago. Such comparisons are useful in projecting potential problem areas, allowing management to take early corrective action. The City’s debt service and investment schedules are also attached for Council’s review. As previously reported to Council, the COVID- 19 Pandemic continues to have some negative effects on the economy and social activities. However, despite the impacts from the COVID-19 Pandemic, Half-Cent Sales Tax, Local Option Sales Tax, and the Local Option Gasoline Tax revenues have shown above average growth through the third quarter of FY 2021. The COVID-19 Pandemic did affect the Half-Cent Sales Tax and Local Option Sales Tax revenues during FY 2020. The Half-Cent Sales Tax decreased 2.28% and Local Option Sales Tax revenue decreased by 2.84% from FY 2019 to FY 2020. There is consistent revenue growth in the third quarter of FY 2021. However, other revenues have decreased from prior fiscal year, particularly, within the Franchise Fees due to the continuing effects associated with the COVID-19 Pandemic on business operations and energy consumption. Both revenues and expenditures continue to be closely monitored to assure a balanced budget. Expenditures in total are in line with budgeted projections. Significant variances from the current approved budget are noted in the individual fund narrative below. The City of Pensacola has been allocated a total of $19.1 million as part of the Federal response to the COVID-19 Pandemic. The American Rescue Plan Act (ARPA) of 2021 was enacted on March 11, 2021 to assist local governments experiencing revenue shortfalls and higher expenses responding to the Pandemic. Through July 2021 City Council has approved ARPA allocations totaling $10,282,640 on Supplemental No.’s 2021-36 and 2021-40, those appropriations include Premium Pay in the amount of $3,520,000 for front line City workers whose job put them at an increased risk of contracting COVID. An appropriation of $88,000 for Vaccination Incentive Pay available to all city employees that participate and to encourage increased vaccination rates at the City. Other appropriations include $450,000 for ARPA Administration and Grant Compliance, $1,665,000 for Facility Improvements that mitigate or prevent the spread of COVID, and $4,559,640 for Recovery of Revenue Loss for various funds.
2
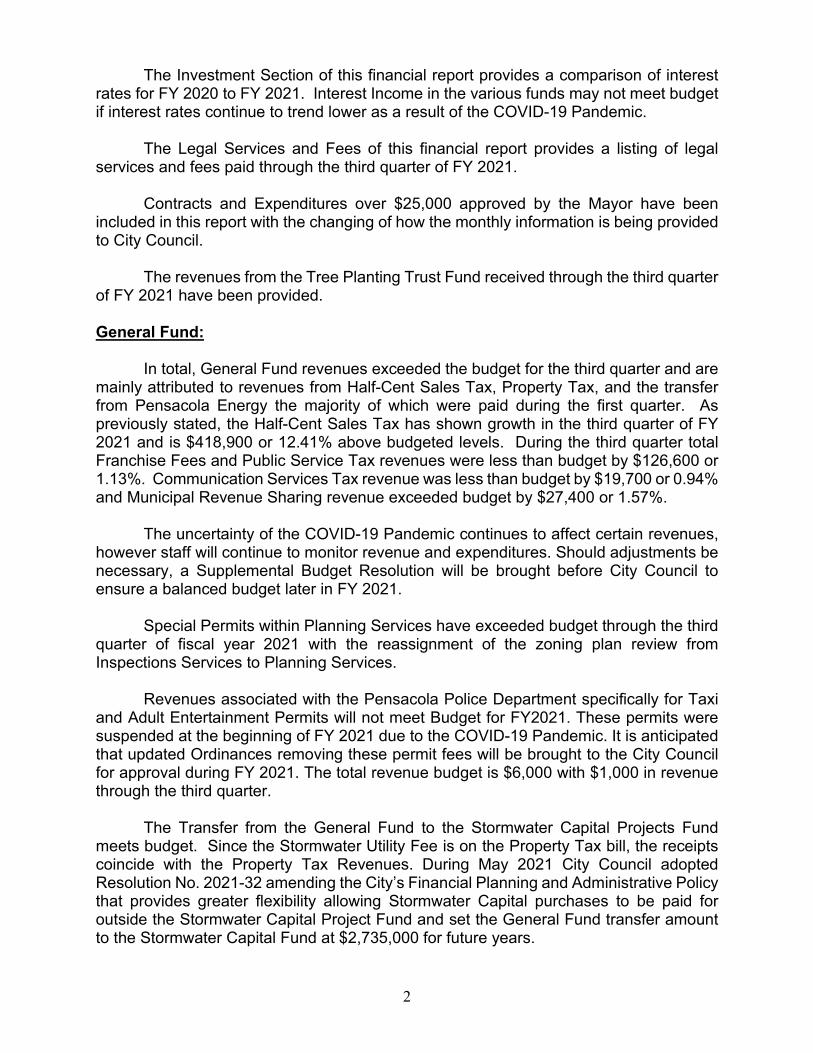
The Investment Section of this financial report provides a comparison of interest rates for FY 2020 to FY 2021. Interest Income in the various funds may not meet budget if interest rates continue to trend lower as a result of the COVID-19 Pandemic. The Legal Services and Fees of this financial report provides a listing of legal services and fees paid through the third quarter of FY 2021.
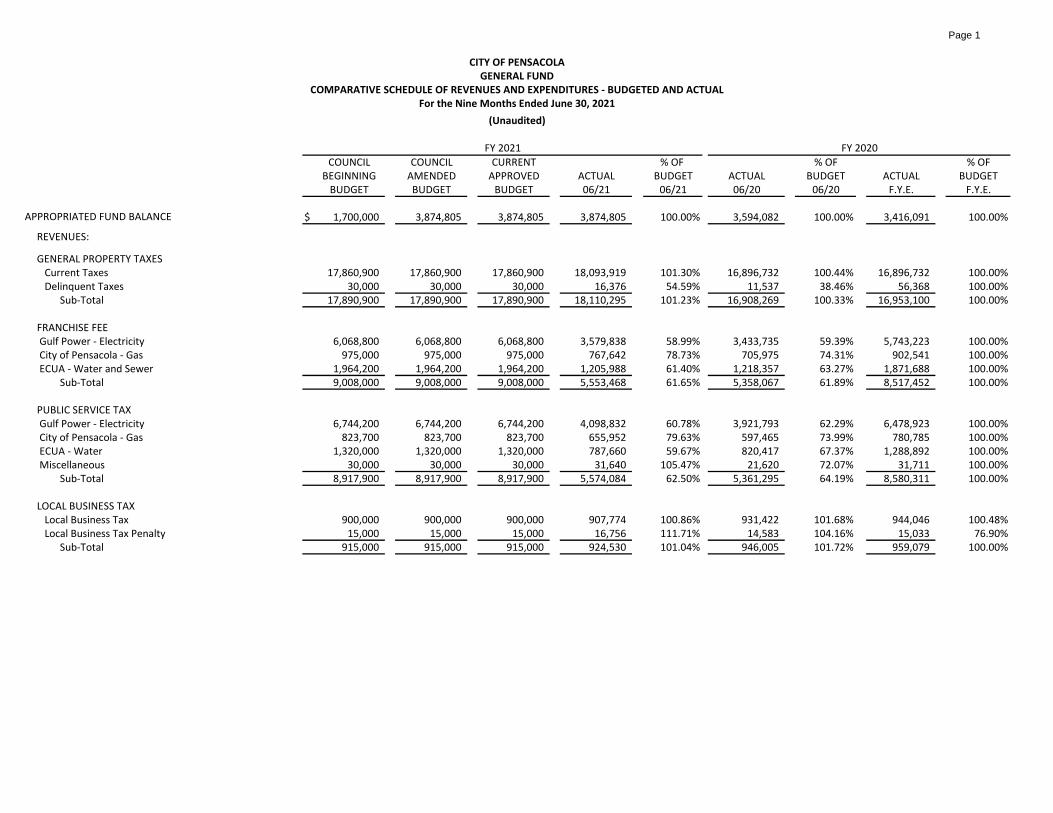
Contracts and Expenditures over $25,000 approved by the Mayor have been included in this report with the changing of how the monthly information is being provided to City Council. The revenues from the Tree Planting Trust Fund received through the third quarter of FY 2021 have been provided. General Fund: In total, General Fund revenues exceeded the budget for the third quarter and are mainly attributed to revenues from Half-Cent Sales Tax, Property Tax, and the transfer from Pensacola Energy the majority of which were paid during the first quarter. As previously stated, the Half-Cent Sales Tax has shown growth in the third quarter of FY 2021 and is $418,900 or 12.41% above budgeted levels. During the third quarter total Franchise Fees and Public Service Tax revenues were less than budget by $126,600 or 1.13%. Communication Services Tax revenue was less than budget by $19,700 or 0.94% and Municipal Revenue Sharing revenue exceeded budget by $27,400 or 1.57%.
The uncertainty of the COVID-19 Pandemic continues to affect certain revenues, however staff will continue to monitor revenue and expenditures. Should adjustments be necessary, a Supplemental Budget Resolution will be brought before City Council to ensure a balanced budget later in FY 2021. Special Permits within Planning Services have exceeded budget through the third quarter of fiscal year 2021 with the reassignment of the zoning plan review from Inspections Services to Planning Services. Revenues associated with the Pensacola Police Department specifically for Taxi and Adult Entertainment Permits will not meet Budget for FY2021. These permits were suspended at the beginning of FY 2021 due to the COVID-19 Pandemic. It is anticipated that updated Ordinances removing these permit fees will be brought to the City Council for approval during FY 2021. The total revenue budget is $6,000 with $1,000 in revenue through the third quarter.
The Transfer from the General Fund to the Stormwater Capital Projects Fund meets budget. Since the Stormwater Utility Fee is on the Property Tax bill, the receipts coincide with the Property Tax Revenues. During May 2021 City Council adopted Resolution No. 2021-32 amending the City’s Financial Planning and Administrative Policy that provides greater flexibility allowing Stormwater Capital purchases to be paid for outside the Stormwater Capital Project Fund and set the General Fund transfer amount to the Stormwater Capital Fund at $2,735,000 for future years.

3
Third quarter expenditures in total were within budget. All General Fund capital equipment has been funded in Local Option Sales Tax Series IV, therefore the only savings that can be realized are in operating and personal services. Tree Planting Trust Fund The Tree Planting Trust Fund revenue and expenditures are recorded in the General Fund. For the third quarter the Tree Planting Trust Fund account contributions and interest income equaled $11,600 with expenditures or encumbrances totaling $16,400.
A schedule of the revenues received through the third quarter of FY 2021 has been provided along with the address of the property, the district the property is within, the amount received and the reason for the removal of the tree.
The balance in the Tree Planting Trust Fund at the end of the third quarter was $522,900.
Park Purchases Trust Fund The Park Purchases Trust Fund revenue and expenditures are recorded in the General Fund. For the third quarter the Park Purchases Trust Fund account contributions and Interest Income received was $8,400. There were no expenditures or encumbrances. The unencumbered balance in the Park Purchases Trust Fund at the end of the third quarter was $119,100. At the April 8, 2021 City Council Meeting, Supplemental Budget Resolution No. 2021-19 was adopted appropriating $110,000 from the unencumbered Park Purchases Trust Fund for the purchase of property to expand Magee Field. This appropriation will leave an unencumbered fund balance of $9,100 in the Park Purchases Trust Fund. Housing Initiatives Fund
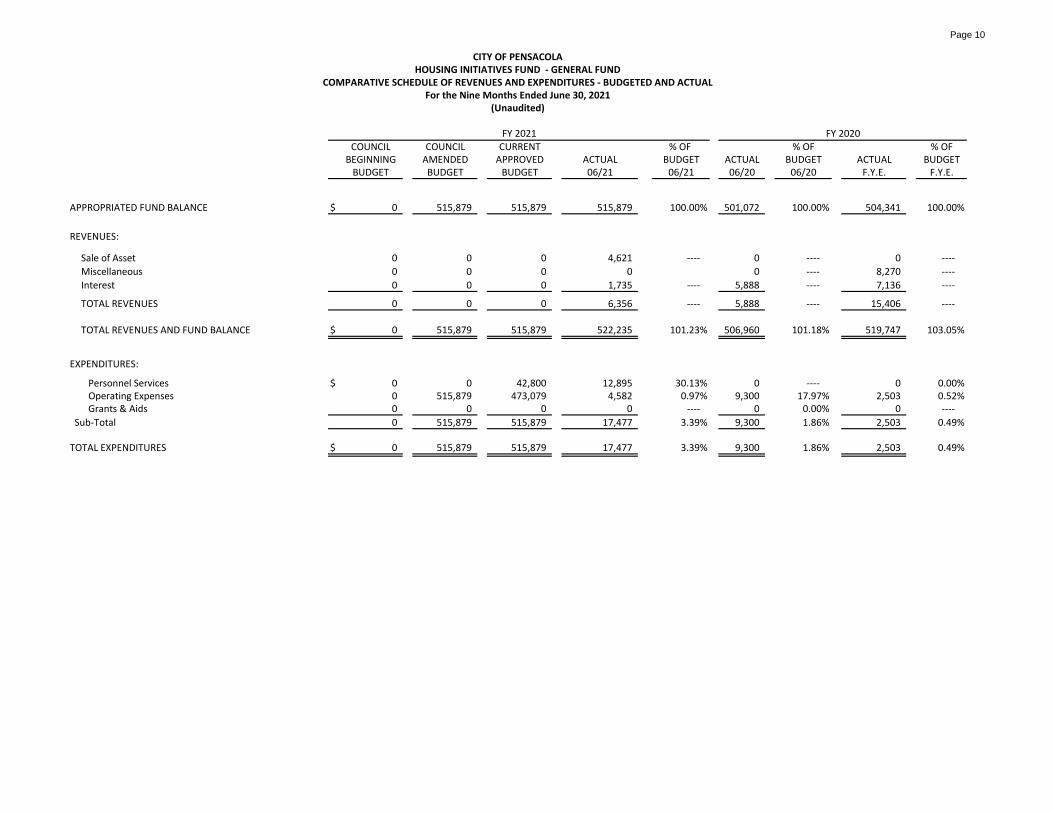
The Housing Initiatives Fund is dedicated to receive specified funds to supplement existing and future adopted Housing Program Initiatives. This initiative moves City-owned surplus properties back into productive use through the development and sale of surplus properties. The proceeds from those sales can be dedicated to expanding existing homeowner assistance programs. These funds have been recorded in the General Fund as the “Housing Initiatives Fund”.
On September 10, 2020, City Council adopted Supplemental Budget Resolution No.
2020-36 that shifted the balance of the City’s General Fund Inner City Housing Initiatives Fund to the Housing Initiatives Fund in an effort to consolidate those funds to be used towards the purpose of implementing the 500 Homes in Five Years Initiative.

4
For the third quarter of FY 2021 the Housing Initiatives Fund account contributions plus interest income equaled $6,400 and the expenditures totaled $17,500. The total balance in the Housing Initiatives Fund at the end of the third quarter was $504,500.
Local Option Gasoline Tax Fund: Local Option Gasoline Tax revenues of $926,300 exceeded budget by $26,300 or 2.92% through the third quarter of FY 2021. Stormwater Utility Fund:
Total Stormwater Utility Fee revenue of $2,801,100 represents 102.42% of budgeted Stormwater Utility Fee Revenue for the fiscal year.
Fund expenditures are consistent with budget for the third quarter. As previously
mentioned, a projected fund balance for future year appropriations was $67,300 after the adoption of Supplemental Budget Resolution No. 2020-59. The resolution included a drawdown of fund balance for the refurbishment of a Street Sweeper and to address the decrease in State Right of Way Maintenance revenues due to the construction and repairs of the General Daniel “Chappie” James Bridge. The FY 2022 Budget includes an increase in the Stormwater Utility Fee ESU rate, increasing from $72.24 per ESU to $76.12 with a subsequent increase in the FY 2023 Budget to the maximum amount approved by City Council of $80 per ESU over the next two-year period in order to provide sufficient funding for the ongoing replacement of capital equipment and operations.
In December 2020, City Council allocated $250,000 from the Local Option Sales
Tax Fund on Supplemental Budget Resolution No. 2020-59 for the replacement of a Street Sweeper.
Parking Management Fund:
For the third quarter of FY 2021 revenues exceeded expenses by $51,600. Since FY 2021 is the first year Parking Management came under the management of the City, there is no year over year comparative data. Parking revenues were impacted during the first months of FY 2021 by COVID-19 and the closure of the General Daniel "Chappie" James Jr. Bridge due to Hurricane Sally damage, however parking activities since that time continue to increase through the third quarter.
Expenditures for Parking Management were consistent with budget.
Parking Management is now collecting the Boat Launch Fees. Currently two of
the four boat ramp locations are active, Bayou Texar and 17th Avenue, the other two locations at Sanders Beach and Bayview Park that were damaged by Hurricane Sally remain non-operational. Boat Launch Fees in the amount of $9,800 were collected in the third quarter of this fiscal year due to this damage. However, Boat Launch Fees are anticipated to meet budget by fiscal year end since most of the revenues are deposited during the summer months.

5
Municipal Golf Course Fund:
During the third quarter FY 2021, the Golf Course expenditures (including total City sponsored pension costs) exceeded revenues by $124,100 before the General Fund subsidy of $187,500. When compared to FY 2020, revenue for this fiscal year is $40,000 more than the prior year third quarter revenues. This increase in revenues is mainly due to the warmer weather and essential services provided at Osceola during the COVID-19 Pandemic. The Golf Course was not required to shut down during the COVID-19 Pandemic, thus the increased play resulted as the ability to be socially distant was made possible at the Osceola Golf Course.
During the third quarter of FY 2020, 16,101 rounds were played plus 4,771 of
driving range usage and in the third quarter of FY 2021, 16,503 rounds were played plus 4,980 of driving range usage, an increase of 402 rounds and an increase of 209 driving range usage. Staff will continue to advertise the golf course through local media outlets as well as continue to keep the golf course’s website updated. Additionally, Staff will continue to monitor revenues and implement various strategies as appropriate.
Concession payments from Fusion Grill, Inc. are current through the third quarter
of FY 2021. Expenditures at the Golf Course are consistent with the adopted FY 2021 Budget.
Inspection Services Fund:
In total, revenues (including total City sponsored pension costs) exceeded expenses by $786,200. When compared to FY 2020, revenues for this fiscal year exceeded prior year through third quarter by $976,000. This is due to the continued strong construction activity locally, an influx of repair permits from Hurricane Sally Damage, and demand for housing. Revenue increases are primarily in Building Permits, Zoning Review and Permit Application Fees.
Expenditures for Inspection Services were consistent with budget.
Roger Scott Tennis Center:
The City’s three-year contract that began on January 1, 2018 with Gulf Coast Tennis Group, LLC for the operation and management of the Roger Scott Tennis Center continues to be extended monthly while new contract negotiations continue. The new contract language is still in review by City Staff and the operation management agreement is month by month until the new contract is executed. As part of the current contract, the City receives a minimum annual guaranteed revenue of $125,000, which is estimated to fund the City’s cost of operations. For the third quarter, revenue exceeded expenditures by $61,200. Activity at the Roger Scott Tennis Center has declined due to the COVID-19 Pandemic, but continues to increase over the prior year’s activity for the third quarter. Expenditures are not anticipated to exceed budget by fiscal year end.

6
To help businesses cope with the economic impacts of COVID-19, the City offered a commercial rent/lease deferral program to qualified lessees through June 30, 2020. Under the program, businesses were allowed to apply for deferrals on rent payments due in April, May, and June. Deferred payments are required to be paid in equal installments over a 12 month period or over the months remaining on the existing lease, whichever is the lesser period, commencing July 1, 2020, along with the rent/lease payment, which is also due on those dates. The following is a comparison of the activity at Roger Scott Tennis Center between Fiscal Years 2020 and 2021.
Community Maritime Park Management Services Fund:
For the third quarter of FY 2021, Park Operations revenues were higher than expenses by $75,600 (excluding Renewal & Replacement). The higher than normal revenues can be attributed to the “Parcel Option Payments” which were $356,500 for the third quarter. Expenditures normally exceed revenues through the fourth quarter of the fiscal year when the majority of the revenues generated at the Community Maritime Park are received or accrued. When compared to FY 2020, revenue for this fiscal year is $399,800 higher the prior year for the third quarter and is from the aforementioned Parcel Option Payments.
The Community Maritime Park is another area that has been impacted by the
COVID-19 Pandemic. There are limited activities at the park due to COVID, however Baseball Season resumed on May 4, 2021 with the first home game on May 11, 2021. Large event activities at the Park will generate parking revenues that have been absent since the beginning of the pandemic. Additional park activities continue to resume at the park through the remainder of the fiscal year.
Events held at the stadium include Fireworks, Free Yoga classes, a Summer Movie
Night Series with Fireworks, a new Ballpark Golf Competition, Pensacola Food Truck Festival, Gourmet Dining at the Home with the Blue Wahoos Diamond Dinners, along with the Blue Wahoos baseball & University of West Florida football games. Due to COVID-19, wearing a face mask and physical distancing is required inside of the Blue
3RD QTR 3RD QTR
FY 2020 FY 2021 DIFF
Daily Participants
Hard Courts 921 867 (54)
All Courts (Includes Clay Courts) 2,341 1,938 (403)
Sub-Total 3,262 2,805 (457)
Playing Members 15,467 15,422 (45)
Sub-Total 18,729 18,227 (502)
Instructional Students 19,136 18,528 (608)
Rentals/Special Events/Programs 6,427 7,061 634
Total Players 44,292 43,816 (476)

7
Wahoos Stadium and while moving throughout the ballpark to help all enjoy the shows and activities.
Expenditures were consistent with budget.
Local Option Sales Tax Fund:
Third quarter revenues exceeded budget by $611,000 or 9.92%. Expenditures in total were consistent with budget for the third quarter. Once the final impact is known of the COVID-19 Pandemic to the Local Option Sales Tax revenues, projects may need to be adjusted to address any revenue shortfall, should it appear to impact the life of the Local Option Sales Tax Series IV plan. At the end of FY 2020 LOST revenue came in $612,500 under the original budgeted amount of $9,397,800. The LOST Series IV Plan is an 11 year plan, therefore it is anticipated that over the lifespan of LOST IV, future year revenues would increase enough to cover the shortfall experienced in FY 2020. Should FY 2021 revenues continue to exceed budget by fiscal year end, adjustments will be made to future year revenues back to pre-COVID levels.
All bond eligible expenses have been accounted for separately. An extension of the Local Option Sales Tax was approved in November 2014 and began January 1, 2018. It will expire on December 31, 2028. This is the fourth series of the Local Option Sales Tax. However, on October 18, 2017, the City issued the $25 million Infrastructure Sales Surtax Revenue bond, Series 2017 in order to fund projects identified in the LOST IV Plan.
It is anticipated that a draw upon the City’s pooled cash to cover cash shortfalls in the fund will occur. This is projected to be necessary through the end of the life of the LOST IV Series. Also, fund balance may be negative based on anticipated project completion dates.
Stormwater Capital Projects Fund:
The General Fund transfer in the amount of $2,735,000 to the Stormwater Capital Projects Fund will no longer equal the revenue fee collection in the Stormwater Utility Fund. During May 2021 City Council adopted Resolution No. 2021-32 amending the City’s Financial Planning and Administrative Policy that provides greater flexibility allowing Stormwater Capital purchases to be paid for outside the Stormwater Capital Project Fund and set the General Fund transfer amount to the Stormwater Capital Fund at $2,735,000 for future years.
Third quarter expenditures were within budget. Gas Utility Fund:
Appropriated fund balance in the amount of $2,810,000 and operating revenue exceeded gas operating expenses and encumbrances (including total City sponsored pension costs) by $1.05 million for the third quarter. The majority of capital outlay, debt

8
service and transfer expenditures occurred in the first quarter but will level out over the remainder of the fiscal year. FY 2021 revenues were above third quarter FY 2020 revenues of which the majority is due to an increase in Residential User Fees in the amount of $2,101,600 and Transportation User Fees in the amount of $582,100. This can be mainly attributed to increases in gas costs.
Pensacola Energy utilizes recovery mechanisms for Weather Normalization Adjustment (WNA), Purchase Gas Adjustment (PGA) from the warm winter and an additional 10¢ in the Purchase Gas Adjustment (PGA) calculation to restore the Pensacola Energy reserve. The Reserve Recovery Rate was suspended for the third quarter and remains at the amount of $1,103,400 collected through the second quarter.
As reflected in the rate study and in accordance with the plan that Pensacola
Energy submitted to the state Public Service Commission for the replacement of cast iron and steel pipes, the Infrastructure Cost Recovery began in FY 2013. This fee is charged for expenses that were made in the prior fiscal year. For the third quarter of FY 2021, $3,007,900 has been received from Infrastructure Cost Recovery Revenue.
Pensacola Energy’s rate structure allows for an annual inflation adjustment
component based on the Consumer Price Index (CPI) providing funding needed for operations and capital requirements to maintain the natural gas system. There was no increase for FY 2021 and there is no increase proposed in the FY 2022 Budget due to continued recovery from the COVID-19 Pandemic.
In total, expenses for the Gas Utility Fund were consistent with budget for the third
quarter.
Sanitation Fund:
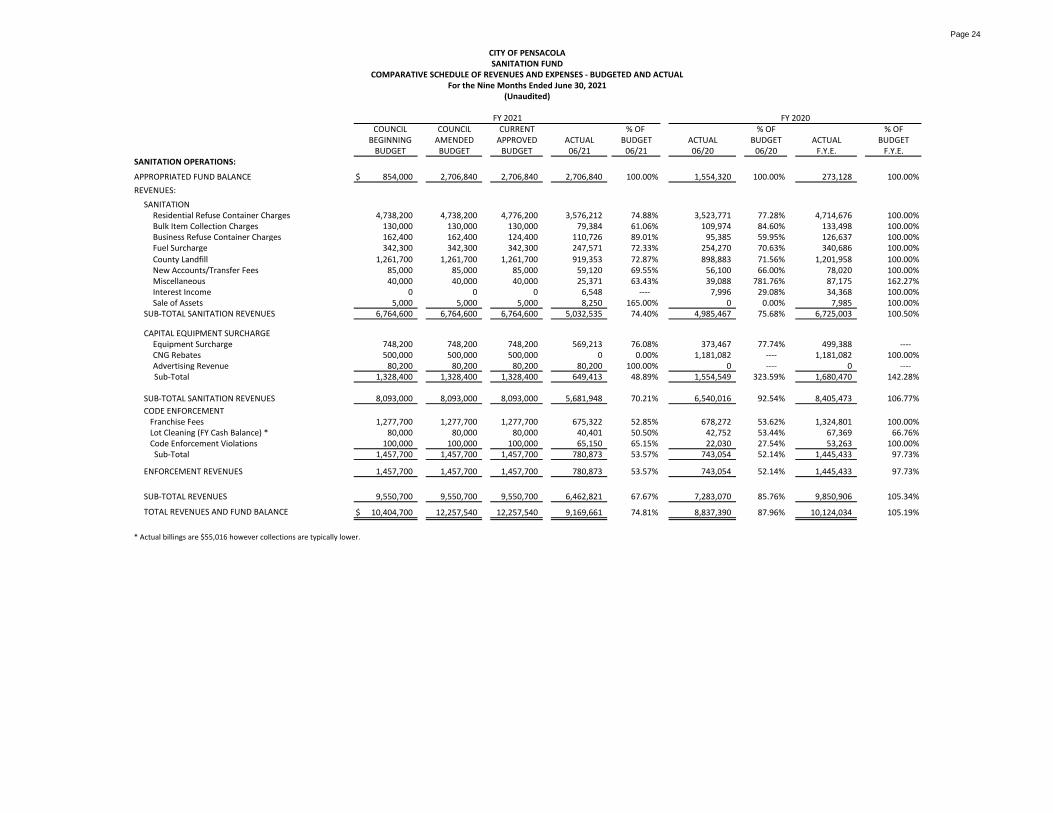
In total, appropriated fund balance in the amount of $2,706,800 and operating revenue were below operating expenses and encumbrances (including total City sponsored pension costs) by $901,500 for the third quarter. This is mainly due to the purchase of capital equipment through the third quarter of FY 2021. Sanitation Fund revenues for FY 2021 were $820,200 below the FY 2020 revenues for the same time period due to no revenue being received from the Federal CNG rebates which have been used to offset the cost of capital equipment.
Sanitation customers started paying a surcharge for fuel/lubricants in April
2007. Through July 31, 2021, fuel surcharge revenues were below expenditures by $11,500. The fuel surcharge rate increased from $1.30 to $1.40 effective August 2021. It is anticipated that with this increase in the fuel surcharge will meet budget by fiscal year end.
Due to the impacts of COVID-19 felt within the community, no sanitation rate
increase based on CPI was included in the FY 2021 Budget. However, a $1.00 per month increase to the Sanitation Equipment Surcharge was included in FY 2021 to provide

9
funding for much needed capital equipment replacements. In order to maintain future operations and capital requirements, an increase based on CPI is proposed in the FY 2022 Budget. This increase is based on the CPI increase that was not included in the FY 2021 Budget (1.5%) due to the COVID Pandemic and the regular CPI adjustment for the FY 2022 Budget (2.6%).
In total, third quarter Sanitation expenses were consistent with budget. Port Fund:
For the third quarter the Port had an appropriated fund balance of $251,700 and operating revenue (including $82,500 transfers in from the Local Option Sales Tax Fund) were above operating expenses and encumbrances (including total City sponsored pension costs) by $2,245,900. Operating revenues for FY 2021 were $1,857,200 above the FY 2020 operating revenues for the same time period. The majority of this increase is due to an increase in Storage, Property Rental, and Hurricane Sally Insurance revenue. Revenue increases can be attributed to increased vessel traffic through the third quarter and Port Tariff rate revisions that went into effect in February 2021, which included increases dockage rates and security fees, as well as the increased importation of wind generator component feedstocks for the local GE plant.
Port expenses, in total, were at budget and are $221,900 above FY 2020 expenses
for the same time period. Due to the previously mentioned increased activity, revenues and expenses continue to be closely monitored at the Port.
Airport Fund:
Appropriated fund balance of $9.2 million and operating revenue exceeded expenses and encumbrances (including total City sponsored pension costs) by $7,120,100 for the third quarter. The Airport has received funds from the CARES Act to help with Operations and Maintenance recovery of the COVID-19 Pandemic as well as supplementing any revenue shortfalls. To date the Airport has received $10.1 million in total CARES funding. The second Federal allocation of COVID Funding for the Airport will be used to offset operating expenses such as payroll and janitorial services.
When comparing the month of June 2020 to the month of June 2021, passenger
traffic at Pensacola International Airport has increased by 253%. For the nine months that comprised the third quarter of FY 2021 (October through June), the number of total passengers increased by 25.4% over the same period in FY 2020. The increase is due the COVID-19 Pandemic recovery.
Airport operating revenues were $1,457,500 below the FY 2020 operating revenue
for the same time period. Airline Revenues were also below the prior year by $2,665,700 and Non-Airline Revenues were $1,208,200 above the prior fiscal year. The decrease in Airline Revenues is a direct result of the impacts from the COVID-19 Pandemic and are mainly from Airline Rentals, Baggage Handling System, Loading Bridge Fees, and Apron Area Rental Fees totaling a $2,645,600 decrease over the prior year. Signatory Air Carrier Landing fees are currently $0.29 per 1,000 lbs. as compared to last fiscal year when the

10
charge was $0.48 per 1,000 lbs. All Air Carrier Landing Fees are recalculated annually. The bulk of the Non-Airline Revenue increase is from Gift Shop, Restaurant & Lounge, Rental Cars, and Rental Car CFC Revenue that is above the prior fiscal year by $1,287,500.
It should be noted, that the Airport’s agreement with the airlines provides for the
airlines to fund any shortfall, excluding incentives, should they occur. City Council has approved new airline agreements establishing the business strategy and rate making formula for the Pensacola International Airport. These five-year agreements use an industry-standard structure to allow the Airport to continue to maintain full financial self-sufficiency with no reliance on the City’s General Fund.
Expenses for the third quarter are consistent with budget.
Insurance Retention Fund / Central Services Fund: These funds are categorized as internal service funds. They provide services to the City’s other operating funds. Revenues and expenses in these funds were consistent with budgeted levels. Investment Schedule / Debt Service Schedule: Also provided for information is a listing of City investments and a listing of the City’s various debt issues. The weighted interest rates received on investments during the third quarter of the last three fiscal years are as follows:
FY 2021 FY 2020 FY 2019
April 0.20% 1.50% 2.21%May 0.20% 1.51% 2.28%June 0.19% 1.36% 2.25%
Legal Costs Schedule:
A schedule of legal costs paid to attorneys and/or firms who have provided services to the City has also been included in the quarterly report. This schedule lists the payee, the amount paid and the nature of the services provided to the City. Contracts/Expenditures Over $25,000:
A schedule of contracts and expenditures over $25,000 approved by the Mayor have been included for the months of April, May, and June.

11
Tree Planting Trust Fund:
The Tree Planting Trust Fund Schedule in this financial report provides the revenues received through the third quarter of FY 2021 along with the address of the property, the district the property is within, the amount received and the reason for the removal of the tree.
Page 1
COUNCIL COUNCIL CURRENT % OF % OF % OFBEGINNING AMENDED APPROVED ACTUAL BUDGET ACTUAL BUDGET ACTUAL BUDGET
BUDGET BUDGET BUDGET 06/21 06/21 06/20 06/20 F.Y.E. F.Y.E.
$ 1,700,000 3,874,805 3,874,805 3,874,805 100.00% 3,594,082 100.00% 3,416,091 100.00%
REVENUES:
GENERAL PROPERTY TAXES Current Taxes 17,860,900 17,860,900 17,860,900 18,093,919 101.30% 16,896,732 100.44% 16,896,732 100.00% Delinquent Taxes 30,000 30,000 30,000 16,376 54.59% 11,537 38.46% 56,368 100.00% Sub-Total 17,890,900 17,890,900 17,890,900 18,110,295 101.23% 16,908,269 100.33% 16,953,100 100.00%
FRANCHISE FEE Gulf Power - Electricity 6,068,800 6,068,800 6,068,800 3,579,838 58.99% 3,433,735 59.39% 5,743,223 100.00% City of Pensacola - Gas 975,000 975,000 975,000 767,642 78.73% 705,975 74.31% 902,541 100.00% ECUA - Water and Sewer 1,964,200 1,964,200 1,964,200 1,205,988 61.40% 1,218,357 63.27% 1,871,688 100.00% Sub-Total 9,008,000 9,008,000 9,008,000 5,553,468 61.65% 5,358,067 61.89% 8,517,452 100.00%
PUBLIC SERVICE TAX Gulf Power - Electricity 6,744,200 6,744,200 6,744,200 4,098,832 60.78% 3,921,793 62.29% 6,478,923 100.00% City of Pensacola - Gas 823,700 823,700 823,700 655,952 79.63% 597,465 73.99% 780,785 100.00% ECUA - Water 1,320,000 1,320,000 1,320,000 787,660 59.67% 820,417 67.37% 1,288,892 100.00% Miscellaneous 30,000 30,000 30,000 31,640 105.47% 21,620 72.07% 31,711 100.00% Sub-Total 8,917,900 8,917,900 8,917,900 5,574,084 62.50% 5,361,295 64.19% 8,580,311 100.00%
LOCAL BUSINESS TAX Local Business Tax 900,000 900,000 900,000 907,774 100.86% 931,422 101.68% 944,046 100.48% Local Business Tax Penalty 15,000 15,000 15,000 16,756 111.71% 14,583 104.16% 15,033 76.90% Sub-Total 915,000 915,000 915,000 924,530 101.04% 946,005 101.72% 959,079 100.00%
CITY OF PENSACOLAGENERAL FUND
COMPARATIVE SCHEDULE OF REVENUES AND EXPENDITURES - BUDGETED AND ACTUALFor the Nine Months Ended June 30, 2021
(Unaudited)
APPROPRIATED FUND BALANCE
FY 2021 FY 2020

Page 2
COUNCIL COUNCIL CURRENT % OF % OF % OF
BEGINNING AMENDED APPROVED ACTUAL BUDGET ACTUAL BUDGET ACTUAL BUDGETBUDGET BUDGET BUDGET 06/21 06/21 06/20 06/20 F.Y.E. F.Y.E.
REVENUES: (continued)
LICENSES, PERMITS & PENALTIES Special Permits (Planning) 45,000 45,000 45,000 79,468 176.60% 84,675 169.35% 108,194 100.00% Taxi Permits 8,000 8,000 8,000 0 0.00% 3,370 56.17% 3,401 100.00% Fire Permits 23,000 23,000 23,000 13,585 59.07% 17,090 81.38% 21,300 100.00% Tree Removal & Pruning Permits 0 0 0 2,775 ---- 2,950 ---- 2,475 100.00% Sub-Total 76,000 76,000 76,000 95,828 126.09% 108,085 140.37% 135,370 100.00%
INTERGOVERNMENTAL FEDERAL Payment in Lieu of Taxes 10,500 10,500 10,500 12,949 123.32% 9,197 54.10% 9,198 100.00%
STATE 1/2 Cent Sales Tax 5,262,900 5,262,900 5,262,900 3,793,881 72.09% 3,153,651 59.91% 4,917,734 100.00% Beverage License Tax 110,000 110,000 110,000 123,785 112.53% 118,421 107.66% 120,552 100.00% Mobile Home Tax 11,000 11,000 11,000 8,970 81.55% 8,636 78.51% 11,881 100.67% Communication Services Tax 3,148,100 3,148,100 3,148,100 2,065,186 65.60% 2,109,907 68.68% 3,185,927 100.00% State Rev Sharing - Motor Fuel Tax 541,300 541,300 541,300 400,487 73.99% 388,315 72.46% 532,969 100.00% State Rev Sharing - Sales Tax 1,853,700 1,853,700 1,853,700 1,370,795 73.95% 1,326,100 73.68% 1,821,496 100.00% Gas Rebate Municipal Vehicles 12,000 12,000 12,000 14,672 122.27% 12,775 106.46% 26,691 100.00% Fire Fighter Supplemental Compensation 45,000 45,000 45,000 30,517 67.82% 23,413 53.21% 45,299 100.00% Sub-Total 10,994,500 10,994,500 10,994,500 7,821,242 71.14% 7,150,415 65.80% 10,671,747 100.00%
OTHER CHARGES FOR SERVICESSwimming Pool Fees 0 0 0 204 ---- 65 ---- 68 100.00%Boat Launch Fees 18,000 0 0 0 ---- 4,588 22.94% 4,613 100.00%Esc. School Board - SRO 345,700 345,700 345,700 200,876 58.11% 192,430 72.62% 244,563 100.00%ECSD - 911 Calltakers 244,500 244,500 244,500 237,128 96.98% 228,765 92.99% 246,000 100.00%Downtown Improvement Board - COPS 60,000 60,000 60,000 30,000 50.00% 30,000 50.00% 45,000 100.00%State Traffic Signal Maintenance 326,600 326,600 326,600 0 0.00% 0 0.00% 368,949 100.00%State Street Light Maintenance 312,700 312,700 312,700 396,762 126.88% 0 0.00% 359,051 100.00%State Reimbursable Agreements 100,000 480,576 480,576 195,870 40.76% 0 ---- 211,305 100.00%Miscellaneous 45,000 45,000 45,000 20,694 45.99% 20,404 45.34% 23,681 100.00%
Sub-Total 1,452,500 1,815,076 1,815,076 1,081,534 59.59% 476,252 35.52% 1,503,230 100.00%
CITY OF PENSACOLAGENERAL FUND
(Unaudited)
COMPARATIVE SCHEDULE OF REVENUES AND EXPENDITURES - BUDGETED AND ACTUALFor the Nine Months Ended June 30, 2021
FY 2021 FY 2020

Page 3
COUNCIL COUNCIL CURRENT % OF % OF % OFBEGINNING AMENDED APPROVED ACTUAL BUDGET ACTUAL BUDGET ACTUAL BUDGET
BUDGET BUDGET BUDGET 06/21 06/21 06/20 06/20 F.Y.E. F.Y.E.
REVENUES: (continued)
FINES, FORFEITURES & PENALTIES POLICE Court Fines 12,500 12,500 12,500 7,803 62.42% 10,463 83.70% 12,977 100.00% Traffic Fines 110,000 110,000 110,000 47,509 43.19% 64,509 75.89% 84,988 100.00%
OTHER FINES Miscellaneous 6,000 6,000 6,000 1,000 16.67% 2,998 49.97% 3,436 100.00% Sub-Total 128,500 128,500 128,500 56,312 43.82% 77,970 75.33% 101,401 100.00%
INTEREST Investments and Deposits 0 0 0 78,017 ---- 129,495 40.47% 406,521 96.27% Sub-Total 0 0 0 78,017 ---- 129,495 40.47% 406,521 96.27%
OTHER REVENUES Miscellaneous 400,000 400,000 400,000 226,965 56.74% 277,864 69.47% 571,958 98.12% Miscellaneous - Saenger Facility Fee 75,000 75,000 75,000 0 0.00% 0 0.00% 61,402 100.00% Sale of Assets 50,000 50,000 50,000 33,746 67.49% 31,944 63.89% 89,569 100.00% Sub-Total 525,000 525,000 525,000 260,711 49.66% 309,808 59.01% 722,929 98.51%
Sub-Total Revenues 49,908,300 50,270,876 50,270,876 39,556,021 78.69% 36,825,661 76.68% 48,551,140 99.95%
TRANSFERS INGas Utility Fund 8,000,000 8,000,000 8,000,000 8,000,000 100.00% 8,000,000 100.00% 8,000,000 100.00%
Sub-Total 8,000,000 8,000,000 8,000,000 8,000,000 100.00% 8,000,000 100.00% 8,000,000 100.00%
TOTAL REVENUES 57,908,300 58,270,876 58,270,876 47,556,021 81.61% 44,825,661 80.01% 56,551,140 99.95%
TOTAL REVENUES AND FUND BALANCE $ 59,608,300 62,145,681 62,145,681 51,430,826 82.76% 48,419,743 81.22% 59,967,231 99.96%
FY 2021 FY 2020
CITY OF PENSACOLAGENERAL FUND
COMPARATIVE SCHEDULE OF REVENUES AND EXPENDITURES - BUDGETED AND ACTUALFor the Nine Months Ended June 30, 2021
(Unaudited)
Page 4
COUNCIL COUNCIL CURRENT % OF % OF % OFBEGINNING AMENDED APPROVED ACTUAL BUDGET ACTUAL BUDGET ACTUAL BUDGET
BUDGET BUDGET BUDGET 06/21 06/21 06/20 06/20 F.Y.E. F.Y.E.
EXPENDITURES:
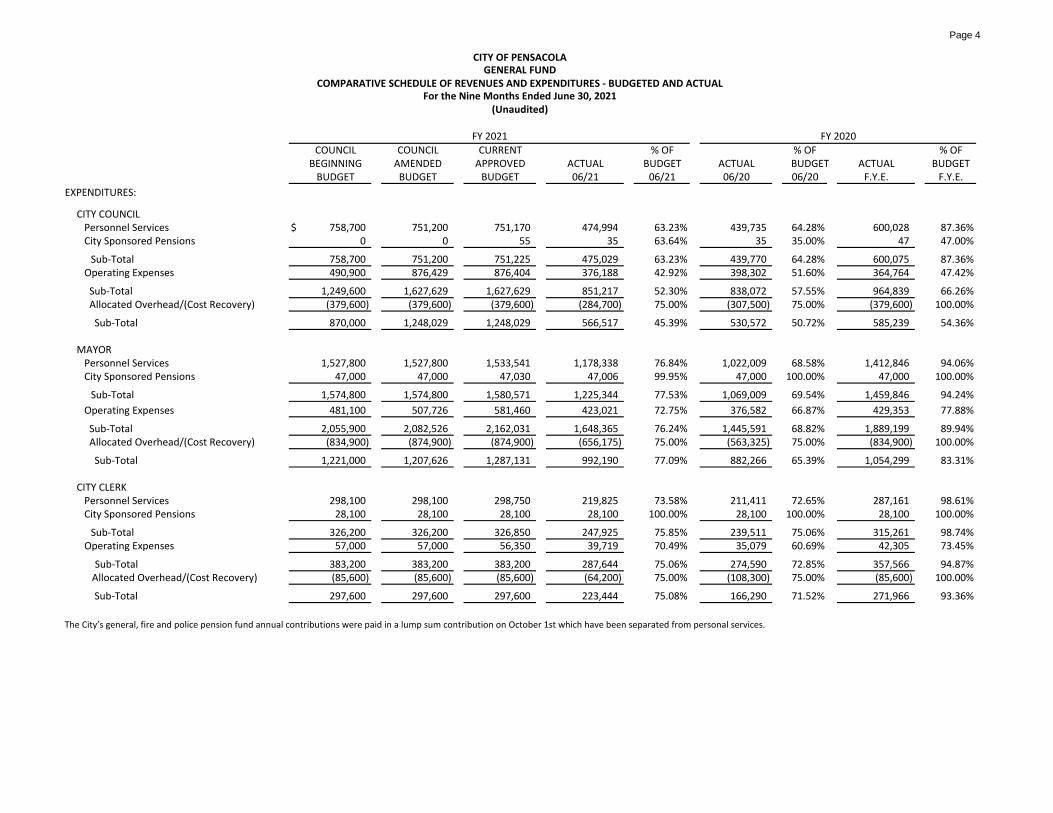
CITY COUNCIL Personnel Services $ 758,700 751,200 751,170 474,994 63.23% 439,735 64.28% 600,028 87.36% City Sponsored Pensions 0 0 55 35 63.64% 35 35.00% 47 47.00%
Sub-Total 758,700 751,200 751,225 475,029 63.23% 439,770 64.28% 600,075 87.36% Operating Expenses 490,900 876,429 876,404 376,188 42.92% 398,302 51.60% 364,764 47.42%
Sub-Total 1,249,600 1,627,629 1,627,629 851,217 52.30% 838,072 57.55% 964,839 66.26% Allocated Overhead/(Cost Recovery) (379,600) (379,600) (379,600) (284,700) 75.00% (307,500) 75.00% (379,600) 100.00%
Sub-Total 870,000 1,248,029 1,248,029 566,517 45.39% 530,572 50.72% 585,239 54.36%
MAYOR Personnel Services 1,527,800 1,527,800 1,533,541 1,178,338 76.84% 1,022,009 68.58% 1,412,846 94.06% City Sponsored Pensions 47,000 47,000 47,030 47,006 99.95% 47,000 100.00% 47,000 100.00%
Sub-Total 1,574,800 1,574,800 1,580,571 1,225,344 77.53% 1,069,009 69.54% 1,459,846 94.24%
Operating Expenses 481,100 507,726 581,460 423,021 72.75% 376,582 66.87% 429,353 77.88%
Sub-Total 2,055,900 2,082,526 2,162,031 1,648,365 76.24% 1,445,591 68.82% 1,889,199 89.94% Allocated Overhead/(Cost Recovery) (834,900) (874,900) (874,900) (656,175) 75.00% (563,325) 75.00% (834,900) 100.00%
Sub-Total 1,221,000 1,207,626 1,287,131 992,190 77.09% 882,266 65.39% 1,054,299 83.31%
CITY CLERK Personnel Services 298,100 298,100 298,750 219,825 73.58% 211,411 72.65% 287,161 98.61% City Sponsored Pensions 28,100 28,100 28,100 28,100 100.00% 28,100 100.00% 28,100 100.00%
Sub-Total 326,200 326,200 326,850 247,925 75.85% 239,511 75.06% 315,261 98.74% Operating Expenses 57,000 57,000 56,350 39,719 70.49% 35,079 60.69% 42,305 73.45%
Sub-Total 383,200 383,200 383,200 287,644 75.06% 274,590 72.85% 357,566 94.87% Allocated Overhead/(Cost Recovery) (85,600) (85,600) (85,600) (64,200) 75.00% (108,300) 75.00% (85,600) 100.00%
Sub-Total 297,600 297,600 297,600 223,444 75.08% 166,290 71.52% 271,966 93.36%
FY 2021 FY 2020
The City’s general, fire and police pension fund annual contributions were paid in a lump sum contribution on October 1st which have been separated from personal services.
CITY OF PENSACOLAGENERAL FUND
COMPARATIVE SCHEDULE OF REVENUES AND EXPENDITURES - BUDGETED AND ACTUALFor the Nine Months Ended June 30, 2021
(Unaudited)

Page 5
COUNCIL COUNCIL CURRENT % OF % OF % OFBEGINNING AMENDED APPROVED ACTUAL BUDGET ACTUAL BUDGET ACTUAL BUDGET
BUDGET BUDGET BUDGET 06/21 06/21 06/20 06/20 F.Y.E. F.Y.E.
EXPENDITURES: (continued)
LEGAL Personnel Services 917,200 917,200 917,200 736,324 80.28% 637,201 72.59% 866,275 98.69% City Sponsored Pensions 18,900 18,900 18,900 18,900 100.00% 18,900 100.00% 18,900 100.00%
Sub-Total 936,100 936,100 936,100 755,224 80.68% 656,101 73.17% 885,175 98.71% Operating Expenses 200,100 200,100 200,100 95,206 47.58% 93,651 54.61% 123,488 72.00%
Sub-Total 1,136,200 1,136,200 1,136,200 850,430 74.85% 749,752 70.19% 1,008,663 94.43% Allocated Overhead/(Cost Recovery) (296,600) (296,600) (296,600) (222,450) 75.00% (202,800) 75.00% (296,600) 100.00%
Sub-Total 839,600 839,600 839,600 627,980 74.80% 546,952 68.56% 712,063 92.28%
HUMAN RESOURCES Personnel Services 883,000 883,000 887,417 652,025 73.47% 613,032 74.87% 826,663 99.96% City Sponsored Pensions 107,700 107,700 107,832 107,803 99.97% 107,800 99.91% 107,836 99.94%
Sub-Total 990,700 990,700 995,249 759,828 76.35% 720,832 77.78% 934,499 99.96% Operating Expenses 183,600 193,600 189,051 136,559 72.23% 121,661 53.38% 180,764 82.27%
Sub-Total 1,174,300 1,184,300 1,184,300 896,387 75.69% 842,493 72.97% 1,115,263 96.59% Allocated Overhead/(Cost Recovery) (375,900) (375,900) (375,900) (281,925) 75.00% (256,650) 75.00% (375,900) 100.00%
Sub-Total 798,400 808,400 808,400 614,462 76.01% 585,843 72.11% 739,363 94.95%
NON-DEPARTMENTAL FUNDING Operating Expenses 4,174,300 4,651,882 4,651,882 3,932,432 84.53% 3,644,748 85.57% 3,785,493 89.14% Sub-Total 4,174,300 4,651,882 4,651,882 3,932,432 84.53% 3,644,748 85.57% 3,785,493 89.14%
FINANCIAL SERVICES Personnel Services 1,834,700 1,842,200 1,854,790 1,359,654 73.31% 1,188,525 71.97% 1,644,354 99.10% City Sponsored Pensions 257,900 257,900 258,410 258,201 99.92% 258,193 99.92% 258,295 99.96%
Sub-Total 2,092,600 2,100,100 2,113,200 1,617,855 76.56% 1,446,718 75.75% 1,902,649 99.21% Operating Expenses 380,700 409,893 396,793 278,933 70.30% 283,193 70.57% 338,787 86.10%
Sub-Total 2,473,300 2,509,993 2,509,993 1,896,788 75.57% 1,729,911 74.85% 2,241,436 96.98% Allocated Overhead/(Cost Recovery) (1,445,000) (1,445,000) (1,445,000) (1,083,750) 75.00% (1,166,250) 75.00% (1,445,000) 100.00%
Sub-Total 1,028,300 1,064,993 1,064,993 813,038 76.34% 563,661 74.54% 796,436 91.95%
FY 2020FY 2021
GENERAL FUNDCOMPARATIVE SCHEDULE OF REVENUES AND EXPENDITURES - BUDGETED AND ACTUAL
CITY OF PENSACOLA
For the Nine Months Ended June 30, 2021
(Unaudited)
The City’s general, fire and police pension fund annual contributions were paid in a lump sum contribution on October 1st which have been separated from personal services.
Page 6
COUNCIL COUNCIL CURRENT % OF % OF % OFBEGINNING AMENDED APPROVED ACTUAL BUDGET ACTUAL BUDGET ACTUAL BUDGET
BUDGET BUDGET BUDGET 06/21 06/21 06/20 06/20 F.Y.E. F.Y.E.
EXPENDITURES: (continued)
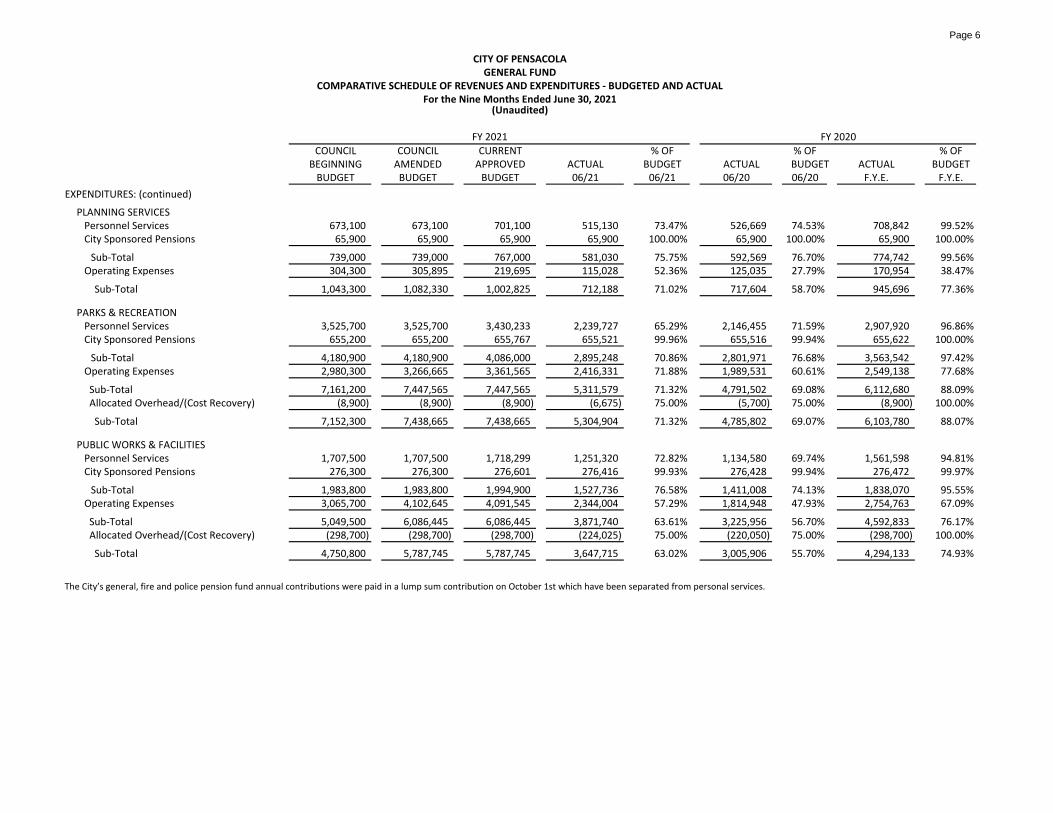
PLANNING SERVICES Personnel Services 673,100 673,100 701,100 515,130 73.47% 526,669 74.53% 708,842 99.52% City Sponsored Pensions 65,900 65,900 65,900 65,900 100.00% 65,900 100.00% 65,900 100.00%
Sub-Total 739,000 739,000 767,000 581,030 75.75% 592,569 76.70% 774,742 99.56% Operating Expenses 304,300 305,895 219,695 115,028 52.36% 125,035 27.79% 170,954 38.47%
Sub-Total 1,043,300 1,082,330 1,002,825 712,188 71.02% 717,604 58.70% 945,696 77.36%
PARKS & RECREATION Personnel Services 3,525,700 3,525,700 3,430,233 2,239,727 65.29% 2,146,455 71.59% 2,907,920 96.86% City Sponsored Pensions 655,200 655,200 655,767 655,521 99.96% 655,516 99.94% 655,622 100.00%
Sub-Total 4,180,900 4,180,900 4,086,000 2,895,248 70.86% 2,801,971 76.68% 3,563,542 97.42% Operating Expenses 2,980,300 3,266,665 3,361,565 2,416,331 71.88% 1,989,531 60.61% 2,549,138 77.68%
Sub-Total 7,161,200 7,447,565 7,447,565 5,311,579 71.32% 4,791,502 69.08% 6,112,680 88.09% Allocated Overhead/(Cost Recovery) (8,900) (8,900) (8,900) (6,675) 75.00% (5,700) 75.00% (8,900) 100.00%
Sub-Total 7,152,300 7,438,665 7,438,665 5,304,904 71.32% 4,785,802 69.07% 6,103,780 88.07%
PUBLIC WORKS & FACILITIES Personnel Services 1,707,500 1,707,500 1,718,299 1,251,320 72.82% 1,134,580 69.74% 1,561,598 94.81% City Sponsored Pensions 276,300 276,300 276,601 276,416 99.93% 276,428 99.94% 276,472 99.97%
Sub-Total 1,983,800 1,983,800 1,994,900 1,527,736 76.58% 1,411,008 74.13% 1,838,070 95.55% Operating Expenses 3,065,700 4,102,645 4,091,545 2,344,004 57.29% 1,814,948 47.93% 2,754,763 67.09%
Sub-Total 5,049,500 6,086,445 6,086,445 3,871,740 63.61% 3,225,956 56.70% 4,592,833 76.17% Allocated Overhead/(Cost Recovery) (298,700) (298,700) (298,700) (224,025) 75.00% (220,050) 75.00% (298,700) 100.00%
Sub-Total 4,750,800 5,787,745 5,787,745 3,647,715 63.02% 3,005,906 55.70% 4,294,133 74.93%
CITY OF PENSACOLA
FY 2020
The City’s general, fire and police pension fund annual contributions were paid in a lump sum contribution on October 1st which have been separated from personal services.
GENERAL FUNDCOMPARATIVE SCHEDULE OF REVENUES AND EXPENDITURES - BUDGETED AND ACTUAL
(Unaudited)For the Nine Months Ended June 30, 2021
FY 2021

Page 7
COUNCIL COUNCIL CURRENT % OF % OF % OFBEGINNING AMENDED APPROVED ACTUAL BUDGET ACTUAL BUDGET ACTUAL BUDGET
BUDGET BUDGET BUDGET 06/21 06/21 06/20 06/20 F.Y.E. F.Y.E.
EXPENDITURES: (continued)
FIRE Personnel Services 7,747,700 7,999,000 7,994,770 5,938,017 74.27% 5,437,677 73.30% 7,439,736 99.91% City Sponsored Pensions 1,281,500 1,281,500 1,286,730 1,285,457 99.90% 1,135,716 99.82% 1,165,462 99.98%
Sub-Total 9,029,200 9,280,500 9,281,500 7,223,474 77.83% 6,573,393 76.83% 8,605,198 99.92% Operating Expenses 1,666,000 1,700,371 1,699,371 1,127,165 66.33% 1,044,911 64.97% 1,441,284 92.88%
Sub-Total 10,695,200 10,980,871 10,980,871 8,350,639 76.05% 7,618,304 74.95% 10,046,482 98.84%
POLICE Personnel Services 15,387,800 15,387,800 15,301,395 11,138,862 72.80% 11,010,510 73.90% 14,803,268 95.80% City Sponsored Pensions 4,461,700 4,461,700 4,466,823 4,465,334 99.97% 4,564,204 99.88% 4,566,435 99.86%
Sub-Total 19,849,500 19,849,500 19,768,218 15,604,196 78.94% 15,574,714 80.00% 19,369,703 96.72% Operating Expenses 3,903,000 3,903,440 3,984,722 2,984,540 74.90% 2,849,860 67.89% 3,511,968 96.45%
Sub-Total 23,752,500 23,752,940 23,752,940 18,588,736 78.26% 18,424,574 77.85% 22,881,671 96.68%
TRANSFERS OUTMunicipal Golf Course Fund 250,000 250,000 250,000 187,500 75.00% 187,500 75.00% 250,000 100.00%Stormwater Capital Projects Fund 2,735,000 2,735,000 2,735,000 2,735,000 100.00% 2,728,664 99.77% 2,732,167 100.00%
Sub-Total 2,985,000 2,985,000 2,985,000 2,922,500 97.91% 2,916,164 97.69% 2,982,167 100.00%
---- ---- ---- TOTAL EXPENDITURES $ 59,608,300 62,145,681 62,145,681 47,296,745 76.11% 44,388,686 74.46% 55,198,788 92.01%
(Unaudited)
The City’s general, fire and police pension fund annual contributions were paid in a lump sum contribution on October 1st which have been separated from personal services.
FY 2021 FY 2020
CITY OF PENSACOLAGENERAL FUND
COMPARATIVE SCHEDULE OF REVENUES AND EXPENDITURES - BUDGETED AND ACTUALFor the Nine Months Ended June 30, 2021

Page 8
COUNCIL COUNCIL CURRENT % OF % OF % OFBEGINNING AMENDED APPROVED ACTUAL BUDGET ACTUAL BUDGET ACTUAL BUDGET
BUDGET BUDGET BUDGET 06/21 06/21 06/20 06/20 F.Y.E. F.Y.E.
APPROPRIATED FUND BALANCE $ 0 528,007 528,007 528,007 100.00% 100,000 100.00% 71,500 100.00%
REVENUES:
Tree Trust Fund 0 0 0 9,800 ---- 27,700 ---- 28,500 100.00%
Interest 0 0 0 1,776 ---- 5,823 ---- 7,056 ----
TOTAL REVENUES 0 0 0 11,576 ---- 33,523 ---- 35,556 124.76%
TOTAL REVENUES AND FUND BALANCE $ 0 528,007 528,007 539,583 102.19% 133,523 133.52% 107,056 107.06%
EXPENDITURES:
Operating Expenses 0 528,007 528,007 16,390 3.10% 0 0.00% 0 0.00%
Sub-Total 0 528,007 528,007 16,390 3.10% 0 0.00% 0 0.00%
TOTAL EXPENDITURES $ 0 528,007 528,007 16,390 3.10% 0 0.00% 0 0.00%
TREE PLANTING TRUST - GENERAL FUNDCITY OF PENSACOLA
(Unaudited)
FY 2021 FY 2020
For the Nine Months Ended June 30, 2021COMPARATIVE SCHEDULE OF REVENUES AND EXPENDITURES - BUDGETED AND ACTUAL

Page 9
COUNCIL COUNCIL CURRENT % OF % OF % OFBEGINNING AMENDED APPROVED ACTUAL BUDGET ACTUAL BUDGET ACTUAL BUDGET
BUDGET BUDGET BUDGET 06/21 06/21 06/20 06/20 F.Y.E. F.Y.E.
APPROPRIATED FUND BALANCE $ 0 0 0 0 ---- 0 100.00% 0 ----
REVENUES:
Park Purchases Fund 0 0 0 8,075 ---- 0 100.00% 0 ----
Interest 0 0 0 372 ---- 1,283 ---- 1,555 ----
TOTAL REVENUES 0 0 0 8,447 ---- 1,283 158.20% 1,555 ----
TOTAL REVENUES AND FUND BALANCE $ 0 0 0 8,447 ---- 1,283 ---- 1,555 ----
EXPENDITURES:
Personnel Services $ 0 0 0 0 ---- 0 ---- 0 ---- Operating Expenses 0 0 0 0 ---- 0 ---- 0 ---- Capital Outlay 0 0 0 0 ---- 0 ---- 0 ----
Sub-Total 0 0 0 0 ---- 0 ---- 0 ----
TOTAL EXPENDITURES $ 0 0 0 0 ---- 0 ---- 0 ----
FY 2021 FY 2020
(Unaudited)
CITY OF PENSACOLAPARK PURCHASES - GENERAL FUND
COMPARATIVE SCHEDULE OF REVENUES AND EXPENDITURES - BUDGETED AND ACTUALFor the Nine Months Ended June 30, 2021
Page 10
COUNCIL COUNCIL CURRENT % OF % OF % OFBEGINNING AMENDED APPROVED ACTUAL BUDGET ACTUAL BUDGET ACTUAL BUDGET
BUDGET BUDGET BUDGET 06/21 06/21 06/20 06/20 F.Y.E. F.Y.E.
APPROPRIATED FUND BALANCE $ 0 515,879 515,879 515,879 100.00% 501,072 100.00% 504,341 100.00%
REVENUES:
Sale of Asset 0 0 0 4,621 ---- 0 ---- 0 ----
Miscellaneous 0 0 0 0 0 ---- 8,270 ----
Interest 0 0 0 1,735 ---- 5,888 ---- 7,136 ----
TOTAL REVENUES 0 0 0 6,356 ---- 5,888 ---- 15,406 ----
TOTAL REVENUES AND FUND BALANCE $ 0 515,879 515,879 522,235 101.23% 506,960 101.18% 519,747 103.05%
EXPENDITURES:
Personnel Services $ 0 0 42,800 12,895 30.13% 0 ---- 0 0.00% Operating Expenses 0 515,879 473,079 4,582 0.97% 9,300 17.97% 2,503 0.52% Grants & Aids 0 0 0 0 ---- 0 0.00% 0 ----
Sub-Total 0 515,879 515,879 17,477 3.39% 9,300 1.86% 2,503 0.49%
TOTAL EXPENDITURES $ 0 515,879 515,879 17,477 3.39% 9,300 1.86% 2,503 0.49%
FY 2021 FY 2020
(Unaudited)
CITY OF PENSACOLAHOUSING INITIATIVES FUND - GENERAL FUND
COMPARATIVE SCHEDULE OF REVENUES AND EXPENDITURES - BUDGETED AND ACTUALFor the Nine Months Ended June 30, 2021

Page 11
COUNCIL COUNCIL CURRENT % OF % OF % OFBEGINNING AMENDED APPROVED ACTUAL BUDGET ACTUAL BUDGET ACTUAL BUDGET
BUDGET BUDGET BUDGET 06/21 06/21 06/20 06/20 F.Y.E F.Y.E.
APPROPRIATED FUND BALANCE $ 159,500 159,500 159,500 159,500 100.00% 168,900 100.00% 182,594 100.00%
REVENUES:
Gasoline Tax (6 cent local) 1,370,000 1,370,000 1,370,000 926,253 67.61% 854,803 62.39% 1,301,270 100.00%Interest 0 0 0 5,255 ---- 9,412 62.75% 27,364 100.00%
Sub-Total 1,370,000 1,370,000 1,370,000 931,508 67.99% 864,215 62.40% 1,328,634 100.00%
TOTAL REVENUES 1,370,000 1,370,000 1,370,000 931,508 67.99% 864,215 62.40% 1,328,634 100.00%---- ----
TOTAL REVENUES AND FUND BALANCE $ 1,529,500 1,529,500 1,529,500 1,091,008 71.33% 1,033,115 66.49% 1,511,228 100.00%
EXPENDITURES:
Allocated Overhead/(Cost Recovery) 7,200 7,200 7,200 5,400 75.00% 23,925 75.00% 7,200 100.00%
Sub-Total 7,200 7,200 7,200 5,400 75.00% 23,925 75.00% 7,200 100.00%---- ---- ---- TRANSFERS OUT
LOGT Debt Service Fund 1,522,300 1,522,300 1,522,300 0 0.00% 854,803 56.16% 1,504,028 100.00%
TOTAL EXPENDITURES $ 1,529,500 1,529,500 1,529,500 5,400 0.35% 878,728 56.55% 1,511,228 100.00%
FY 2021 FY 2020
(Unaudited)
CITY OF PENSACOLALOCAL OPTION GASOLINE TAX FUND
COMPARATIVE SCHEDULE OF REVENUES AND EXPENDITURES - BUDGETED AND ACTUALFor the Nine Months Ended June 30, 2021

Page 12
COUNCIL COUNCIL CURRENT % OF % OF % OFBEGINNING AMENDED APPROVED ACTUAL BUDGET ACTUAL BUDGET ACTUAL BUDGET
BUDGET BUDGET BUDGET 06/21 06/21 06/20 06/20 F.Y.E F.Y.E.
APPROPRIATED FUND BALANCE $ 244,300 350,500 350,500 350,500 100.00% 0 0.00% 428,333 100.00%
REVENUES:
Stormwater Utility Fees 2,730,000 2,730,000 2,730,000 2,799,669 102.55% 2,726,710 99.88% 2,726,710 100.00% Delinquent Stormwater Utility Fee 5,000 5,000 5,000 1,415 28.30% 1,954 39.08% 5,457 100.00% Miscellaneous 0 0 0 0 ---- 2,852 ---- 2,852 100.00%
CHARGES FOR SERVICES:
State Right of Way Maintenance 99,600 89,400 89,400 37,589 42.05% 67,660 67.93% 89,427 100.00% Interest Income 0 0 0 3,891 ---- 7,548 150.96% 12,571 100.00%TOTAL REVENUES 2,834,600 2,824,400 2,824,400 2,842,564 100.64% 2,806,724 98.84% 2,837,017 100.00%
TOTAL REVENUES AND FUND BALANCE $ 3,078,900 3,174,900 3,174,900 3,193,064 100.57% 2,806,724 85.89% 3,265,350 100.00%
EXPENDITURES:
STORMWATER O & M Personnel Services $ 945,100 945,100 944,470 731,227 77.42% 640,578 67.63% 914,903 97.12% City Sponsored Pensions 285,400 285,400 286,030 285,613 99.85% 285,678 99.97% 285,779 100.00%
Sub-Total 1,230,500 1,230,500 1,230,500 1,016,840 82.64% 926,256 75.13% 1,200,682 97.79% Operating Expenses 574,600 578,600 578,123 284,966 49.29% 398,964 66.63% 526,284 94.26% Capital Outlay 0 5,000 5,000 5,000 100.00% 0 ---- 0 0.00% Allocated Overhead/(Cost Recovery) 206,100 206,100 206,100 154,575 75.00% 147,225 75.00% 206,100 100.00%
Sub-Total 2,011,200 2,020,200 2,019,723 1,461,381 72.36% 1,472,445 72.61% 1,933,066 96.79%
STREET CLEANING Personnel Services 447,100 447,100 446,759 334,586 74.89% 338,987 79.78% 452,267 99.99% City Sponsored Pensions 77,200 77,200 77,541 77,266 99.65% 77,270 99.97% 77,292 100.00%
Sub-Total 524,300 524,300 524,300 411,852 78.55% 416,257 82.89% 529,559 99.99% Operating Expenses 427,900 514,900 515,377 319,448 61.98% 318,115 67.09% 474,495 99.26% Capital Outlay 0 0 0 0 ---- 130,626 87.08% 130,627 90.09% Allocated Overhead/(Cost Recovery) 115,500 115,500 115,500 86,625 75.00% 85,200 75.00% 115,500 100.00%
Sub-Total 1,067,700 1,154,700 1,155,177 817,925 70.81% 950,198 76.63% 1,250,181 98.58%
TOTAL EXPENDITURES $ 3,078,900 3,174,900 3,174,900 2,279,306 71.79% 2,422,643 74.13% 3,183,247 97.49%
(Unaudited)
CITY OF PENSACOLASTORMWATER UTILITY FUND
COMPARATIVE SCHEDULE OF REVENUES AND EXPENDITURES - BUDGETED AND ACTUALFor the Nine Months Ended June 30, 2021
FY 2021 FY 2020

Page 13
COUNCIL COUNCIL CURRENT % OF % OF % OFBEGINNING AMENDED APPROVED ACTUAL BUDGET ACTUAL BUDGET ACTUAL BUDGET
BUDGET BUDGET BUDGET 06/21 06/21 06/20 06/20 F.Y.E. F.Y.E.
APPROPRIATED FUND BALANCE $ 0 0 0 0 ---- 0 ---- 0 ----
REVENUES:
Dumpster Loan Repayment 0 6,000 6,000 4,500 75.00% 0 ---- 0 ----
Miscellaneous 0 0 0 73 ---- 0 ---- 0 ----
Intrest Income 0 0 0 388 ---- 0 ---- 0 ----
CHARGES FOR SERVICES:
Boat Launch Fees 0 0 0 9,840 ---- 0 ---- 0 ----
Parking Fines 0 375,796 375,796 266,639 70.95% 0 ---- 0 ----
Parking Lot 0 126,988 126,988 57,480 45.26% 0 ---- 0 ----
Parking Garage 0 491,976 491,976 98,349 19.99% 0 ---- 0 ----
Parking Meters 0 205,644 205,644 130,665 63.54% 0 ---- 0 ----
Parking on St Dumpsters 0 1,500 1,500 5,777 385.13% 0 ---- 0 ----
SUB-TOTAL REVENUES 0 1,207,904 1,207,904 573,711 47.50% 0 ---- 0 ----
TOTAL REVENUES 0 1,207,904 1,207,904 573,711 47.50% 0 ---- 0 ----
TOTAL REVENUES AND FUND BALANCE $ 0 1,207,904 1,207,904 573,711 47.50% 0 ---- 0 ----
EXPENDITURES:
Personnel Services $ 0 493,450 495,550 214,305 43.25% 0 ---- 0 ---- Operating Expenses 0 651,954 641,954 262,159 40.84% 0 ---- 0 ---- Capital Outlay 0 22,500 30,400 15,634 51.43% 0 ---- 0 Allocated Overhead/(Cost Recovery) 0 40,000 40,000 30,000 75.00% 0 ---- 0 ----
Sub-Total 0 1,207,904 1,207,904 522,098 43.22% 0 ---- 0 ----
TOTAL EXPENDITURES $ 0 1,207,904 1,207,904 522,098 43.22% 0 ---- 0 ----
FY 2021 FY 2020
(Unaudited)
CITY OF PENSACOLAPARKING MANAGEMENT FUND
COMPARATIVE SCHEDULE OF REVENUES AND EXPENDITURES - BUDGETED AND ACTUALFor the Nine Months Ended June 30, 2021

Page 14
COUNCIL COUNCIL CURRENT % OF % OF % OFBEGINNING AMENDED APPROVED ACTUAL BUDGET ACTUAL BUDGET ACTUAL BUDGET
BUDGET BUDGET BUDGET 06/21 06/21 06/20 06/20 F.Y.E. F.Y.E.
APPROPRIATED FUND BALANCE $ 0 6,025 6,025 6,025 100.00% 4,800 100.00% (23,926) 100.00%
REVENUES:GOLF COURSE CHARGES
Green Fees 280,300 280,300 280,300 244,854 87.35% 229,802 81.35% 307,373 100.00%Electric Cart Rentals 86,800 86,800 86,800 85,401 98.39% 76,144 87.72% 104,129 100.00%Pull Cart Rentals 100 100 100 220 220.00% 156 78.00% 181 100.00%Concessions 18,000 18,000 18,000 15,000 83.33% 13,500 75.00% 18,000 100.00%Pro Shop Sales 13,000 13,000 13,000 14,845 114.19% 10,408 85.31% 14,788 100.01%Tournaments 53,000 53,000 53,000 26,004 49.06% 26,285 47.88% 34,840 100.00%Driving Range 30,500 30,500 30,500 33,189 108.82% 24,232 79.45% 33,358 100.00%Capital Surcharge 37,000 37,000 37,000 29,920 80.86% 29,220 73.05% 38,907 100.00%Miscellaneous 0 0 0 0 ---- 0 ---- 0 ---- Interest Income 0 0 0 715 ---- 392 ---- 2,250 100.00%
SUB-TOTAL REVENUES 518,700 518,700 518,700 450,148 86.78% 410,139 78.11% 553,826 100.00%
TRANSFERS IN GENERAL FUND 250,000 250,000 250,000 187,500 75.00% 187,500 75.00% 250,000 100.00%
TOTAL REVENUES 768,700 768,700 768,700 637,648 82.95% 597,639 77.10% 803,826 100.00%---- ----
TOTAL REVENUES AND FUND BALANCE $ 768,700 774,725 774,725 643,673 83.08% 602,439 77.25% 779,900 100.00%
EXPENDITURES:
OPERATIONS Personnel Services $ 383,400 383,400 383,400 276,046 72.00% 261,401 69.37% 358,599 95.17% City Sponsored Pensions 47,000 47,000 47,000 47,000 100.00% 47,000 100.00% 47,000 100.00%
Sub-Total 430,400 430,400 430,400 323,046 75.06% 308,401 72.77% 405,599 95.71%
Operating Expenses 338,300 344,325 344,325 251,220 72.96% 230,130 64.63% 277,597 77.95%---- ---- 0 0 0 0 0 ---- 0 ----
TOTAL EXPENDITURES $ 768,700 774,725 774,725 574,266 74.13% 538,531 69.05% 683,196 87.60%
MUNICIPAL GOLF COURSE FUNDCITY OF PENSACOLA
(Unaudited)
FY 2021 FY 2020
For the Nine Months Ended June 30, 2021COMPARATIVE SCHEDULE OF REVENUES AND EXPENDITURES - BUDGETED AND ACTUAL
The City’s general, fire and police pension fund annual contributions were paid in a lump sum contribution on October 1st which have been separated from personal services.

Page 15
COUNCIL COUNCIL CURRENT % OF % OF % OFBEGINNING AMENDED APPROVED ACTUAL BUDGET ACTUAL BUDGET ACTUAL BUDGET
BUDGET BUDGET BUDGET 06/21 06/21 06/20 06/20 F.Y.E. F.Y.E.
APPROPRIATED FUND BALANCE $ 0 8,972 8,972 8,972 100.00% 0 ---- (100,449) 100.00%
REVENUES:
Building Permits 860,000 892,700 892,700 1,413,586 158.35% 642,180 87.56% 886,975 100.14% Electrical Permits 210,000 210,000 210,000 160,474 76.42% 140,771 62.12% 194,041 100.00% Gas Permits 48,000 48,000 48,000 40,400 84.17% 34,575 80.22% 45,175 100.00% Plumbing Permits 140,000 140,000 140,000 88,808 63.43% 83,088 64.21% 108,850 100.00% Mechanical Permits 94,500 94,500 94,500 66,233 70.09% 66,407 74.28% 84,731 100.00% Miscellaneous Permits 7,000 7,000 7,000 5,200 74.29% 2,425 29.94% 3,148 100.00% Zoning Review & Inspection Fees 32,100 32,100 32,100 35,800 111.53% 28,050 28.54% 40,750 100.00% Permit Application Fee 295,600 295,600 295,600 356,640 120.65% 216,074 78.40% 297,754 100.00% Tree Removal & Pruning Permits 0 0 0 1,125 ---- 900 ---- 975 100.00% Lien Search Fees 0 0 0 17,450 ---- 5,975 ---- 11,500 100.00% Interest Income 0 0 0 1,198 ---- (517) ---- 625 100.00% Sale of Asset 0 0 0 0 ---- 0 ---- 2,200 100.00% Miscellaneous 0 0 0 0 ---- 0 ---- 28,826 100.00%SUB-TOTAL REVENUES 1,687,200 1,719,900 1,719,900 2,186,914 127.15% 1,219,928 76.06% 1,705,550 100.07%TRANSFERS IN GENERAL FUND 0 0 0 0 ---- 0 ---- 0 ---- TOTAL REVENUES 1,687,200 1,719,900 1,719,900 2,186,914 127.15% 1,219,928 76.06% 1,705,550 100.07%---- ----
TOTAL REVENUES AND FUND BALANCE $ 1,687,200 1,728,872 1,728,872 2,195,886 127.01% 1,219,928 76.06% 1,605,101 100.07%
EXPENDITURES:
OPERATIONS Personnel Services $ 942,200 942,200 943,850 756,437 80.14% 648,830 77.68% 892,894 98.59% City Sponsored Pensions 141,800 141,800 141,926 141,885 99.97% 141,879 99.98% 141,909 100.00%---- ----
Sub-Total 1,084,000 1,084,000 1,085,776 898,322 82.74% 790,709 80.92% 1,034,803 98.78%---- ---- Operating Expenses 390,000 404,263 402,487 324,090 80.52% 215,462 56.39% 240,894 80.65% Capital Outlay 0 27,409 27,409 27,409 100.00% 10,325 60.74% 10,325 23.25% Sub-Total 1,474,000 1,515,672 1,515,672 1,249,821 82.46% 1,016,496 73.86% 1,286,022 92.47%
Allocated Overhead/(Cost Recovery) 213,200 213,200 213,200 159,900 75.00% 170,700 75.00% 213,200 100.00%
Sub-Total 1,687,200 1,728,872 1,728,872 1,409,721 81.54% 1,187,196 74.02% 1,499,222 93.47%----
TOTAL EXPENDITURES $ 1,687,200 1,728,872 1,728,872 1,409,721 81.54% 1,187,196 74.02% 1,499,222 93.47%
INSPECTION SERVICES FUNDCITY OF PENSACOLA
(Unaudited)
FY 2021 FY 2020
For the Nine Months Ended June 30, 2021COMPARATIVE SCHEDULE OF REVENUES AND EXPENDITURES - BUDGETED AND ACTUAL
The City’s general, fire and police pension fund annual contributions were paid in a lump sum contribution on October 1st which have been separated from personal services.

Page 16
COUNCIL COUNCIL CURRENT % OF % OF % OFBEGINNING AMENDED APPROVED ACTUAL BUDGET ACTUAL BUDGET ACTUAL BUDGET
BUDGET BUDGET BUDGET 06/21 06/21 06/20 06/20 F.Y.E. F.Y.E.
APPROPRIATED FUND BALANCE $ 0 0 0 0 ---- 16,500 100.00% 16,500 100.00%
REVENUES:CHARGES FOR SERVICES
Scott Tennis Pro Revenue 125,000 125,000 125,000 109,375 87.50% 75,521 60.42% 106,771 100.00%Scott Tennis Pro Shop Lease 3,700 3,700 3,700 707 19.11% 2,056 55.57% 3,883 100.03%Interest Income 0 0 0 600 ---- 717 ---- 2,295 100.00%
TOTAL REVENUES 128,700 128,700 128,700 110,682 86.00% 78,294 60.83% 112,949 100.00%---- ----
TOTAL REVENUES AND FUND BALANCE $ 128,700 128,700 128,700 110,682 86.00% 94,794 65.29% 129,449 100.00%
EXPENDITURES:
OPERATIONS Operating Expenses $ 128,700 128,700 128,700 49,458 38.43% 57,145 41.05% 73,964 59.92% Capital Outlay 0 0 0 0 ---- 5,339 88.98% 5,339 88.98%
Sub-Total 128,700 128,700 128,700 49,458 38.43% 62,484 43.03% 79,303 61.26%
TOTAL EXPENDITURES $ 128,700 128,700 128,700 49,458 38.43% 62,484 43.03% 79,303 61.26%
(Unaudited)
CITY OF PENSACOLAROGER SCOTT TENNIS CENTER
COMPARATIVE SCHEDULE OF REVENUES AND EXPENDITURES - BUDGETED AND ACTUALFor the Nine Months Ended June 30, 2021
FY 2021 FY 2020

Page 17
COUNCIL COUNCIL CURRENT % OF % OF % OFBEGINNING AMENDED APPROVED ACTUAL BUDGET ACTUAL BUDGET ACTUAL BUDGET
BUDGET BUDGET BUDGET 06/21 06/21 06/20 06/20 F.Y.E. F.Y.E.
PARK OPERATIONS:
APPROPRIATED FUND BALANCE $ 32,800 61,743 61,743 61,743 100.00% 1,542 100.00% 157,730 100.00%
REVENUES:COMMUNITY MARITIME PARK Event Scheduling Management Rentals 34,000 34,000 34,000 13,800 40.59% 6,700 36.22% 6,700 100.00% Vendor Kiosk Management ---- Kiosk Sales 3,800 3,800 3,800 (100) -2.63% (300) -16.67% (300) ---- Donations 0 0 0 0 ---- 3,500 ---- 3,500 100.00%Parking Management 103,000 103,000 103,000 52,399 50.87% 0 0.00% 0 ---- City Hall Parking 27,000 27,000 27,000 11,981 44.37% 0 0.00% 0 ---- Lease Fees 147,000 147,000 147,000 109,761 74.67% 102,323 68.22% 153,484 100.00%User Fees Northwest Florida Professional Baseball 175,000 175,000 175,000 131,250 75.00% 131,250 75.00% 175,000 100.00% University of West Florida 25,000 25,000 25,000 0 0.00% 16,667 66.67% 16,667 100.00%Surcharge Attendance 273,100 273,100 273,100 0 0.00% 0 0.00% 125,000 100.00%Naming Rights 112,500 112,500 112,500 28,125 25.00% 28,125 25.00% 112,500 100.00%Community Event Concessions 28,000 28,000 28,000 0 0.00% 16,499 55.00% 16,499 99.99%Parcels Option Payments 0 362,213 362,213 356,499 98.42% 10,045 42.56% 0 ---- Other Charges for Services 23,300 23,300 23,300 10,970 47.08% 0 ---- 24,068 100.00%Miscellaneous Revenue 0 0 0 58 ---- 57 163 100.62% Sub-Total 951,700 1,313,913 1,313,913 714,743 54.40% 314,979 32.13% 633,281 99.95%
TOTAL REVENUES 951,700 1,313,913 1,313,913 714,743 54.40% 314,979 32.13% 633,281 99.95%
TOTAL REVENUES AND FUND BALANCE $ 984,500 1,375,656 1,375,656 776,486 56.44% 316,521 32.24% 791,011 99.96%
CITY OF PENSACOLACOMMUNITY MARITIME PARK MANAGEMENT SERVICES FUND
COMPARATIVE SCHEDULE OF REVENUES AND EXPENDITURES - BUDGETED AND ACTUALFor the Nine Months Ended June 30, 2021
(Unaudited)
FY 2021 FY 2020

Page 18
COUNCIL COUNCIL CURRENT % OF % OF % OFBEGINNING AMENDED APPROVED ACTUAL BUDGET ACTUAL BUDGET ACTUAL BUDGET
BUDGET BUDGET BUDGET 06/21 06/21 06/20 06/20 F.Y.E. F.Y.E.EXPENDITURES
COMMUNITY MARITIME PARK Personnel Services $ 121,700 121,700 121,700 23,167 19.04% 30,268 24.87% 36,012 29.59% Operating Expenses 842,800 1,233,956 1,233,956 615,980 49.92% 515,072 61.31% 609,396 93.81% Sub-Total 964,500 1,355,656 1,355,656 639,147 47.15% 545,340 56.70% 645,408 83.68%
DEBT SERVICE Principal 20,000 20,000 20,000 20,000 100.00% 0 0.00% 20,000 100.00% Sub-Total 20,000 20,000 20,000 20,000 100.00% 0 0.00% 20,000 100.00%
TOTAL PARK OPERATIONS EXPENDITURES $ 984,500 1,375,656 1,375,656 659,147 47.92% 545,340 55.54% 665,408 84.09%
PARK RENEWAL AND REPLACEMENT:
APPROPRIATED FUND BALANCE $ 0 7,285 7,285 7,285 100.00% 277,180 ---- 0 ----
REVENUES:Variable Ticket 129,300 129,300 129,300 8,208 6.35% (1,992) -1.38% (1,992) ---- Interest Income 0 0 0 3,453 ---- 5,597 ---- 16,586 100.01% Sub-Total 129,300 129,300 129,300 11,661 9.02% 3,605 2.50% 14,594 88.00%
TOTAL REVENUES AND FUND BALANCE $ 129,300 136,585 136,585 18,946 13.87% 280,785 194.99% 14,594 88.00%
EXPENDITURES Operating Expenses 129,300 136,585 136,585 7,285 5.33% 53,071 31.00% 45,786 86.27% Capital Outlay 0 0 0 0 ---- 201,948 ---- 201,948 80.78%
Sub-Total 129,300 136,585 136,585 7,285 5.33% 255,019 148.98% 247,734 81.74%
TOTAL RENEWAL AND REPLACEMENT EXPENDITURES $ 129,300 136,585 136,585 7,285 5.33% 255,019 148.98% 247,734 81.74%
TOTAL FUND:
TOTAL REVENUES AND FUND BALANCE $ 1,113,800 1,512,241 1,512,241 795,432 52.60% 597,306 53.05% 805,605 99.72%
TOTAL EXPENDITURES $ 1,113,800 1,512,241 1,512,241 666,432 44.07% 800,359 69.41% 913,142 83.44%
FY 2021 FY 2020
For the Nine Months Ended June 30, 2021(Unaudited)
CITY OF PENSACOLACOMMUNITY MARITIME PARK MANAGEMENT SERVICES FUND
COMPARATIVE SCHEDULE OF REVENUES AND EXPENDITURES - BUDGETED AND ACTUAL

Page 19
COUNCIL COUNCIL CURRENT % OF % OF % OFBEGINNING AMENDED APPROVED ACTUAL BUDGET ACTUAL BUDGET ACTUAL BUDGET
BUDGET BUDGET BUDGET 06/21 06/21 06/20 06/20 F.Y.E F.Y.E.LOCAL OPTION SALES TAX FUND:
APPROPRIATED FUND BALANCE $ 870,000 31,552,624 31,552,624 31,552,624 100.00% 32,592,121 100.00% 34,804,608 100.00%
REVENUES:
1-CT Local Option Sales Tax 9,466,400 9,466,400 9,466,400 6,868,518 72.56% 5,658,242 60.21% 8,698,809 100.00%Interest 0 0 0 10,626 ---- 24,038 ---- 67,600 100.00%Miscellaneous 0 0 0 10,000 ---- 18,900 ---- 18,899 100.00%---- ---- ---- ---- TOTAL REVENUES 9,466,400 9,466,400 9,466,400 6,889,144 72.77% 5,701,180 60.67% 8,785,308 100.00%---- ----
TOTAL REVENUES AND FUND BALANCE $ 10,336,400 41,019,024 41,019,024 38,441,768 93.72% 38,293,301 91.20% 43,589,916 100.00%
EXPENDITURES:
CAPITAL PROJECTS Operating Expenses 4,000 64,764 538,855 532,758 98.87% 1,370,075 369.63% 1,382,745 94.21% Capital Outlay 6,034,200 20,420,830 19,946,739 9,951,673 49.89% 4,921,604 26.13% 3,088,246 15.97% Sub-Total 6,038,200 20,485,594 20,485,594 10,484,431 51.18% 6,291,679 32.75% 4,470,991 21.49%
TRANSFER OUTPort of Pensacola 0 239,768 239,768 82,498 34.41% 93,897 26.21% 118,454 33.07%Pensacola International Airport 0 15,995,462 15,995,462 680,007 4.25% 1,692,921 9.34% 2,128,692 11.75%
Sub-Total 0 16,235,230 16,235,230 762,505 4.70% 1,786,818 9.67% 2,247,146 12.16%
DEBT SERVICE
Principal 3,821,400 3,821,400 3,821,400 3,821,387 100.00% 3,728,729 100.00% 3,728,729 100.00% Interest 476,800 476,800 476,800 476,658 99.97% 569,757 99.99% 569,757 100.00%
Sub-Total 4,298,200 4,298,200 4,298,200 4,298,045 100.00% 4,298,486 100.00% 4,298,486 100.00%
TOTAL EXPENDITURES $ 10,336,400 41,019,024 41,019,024 15,544,981 37.90% 12,376,983 29.48% 11,016,623 25.27%----
CITY OF PENSACOLA
(Unaudited)
FY 2021 FY 2020
For the Nine Months Ended June 30, 2021COMPARATIVE SCHEDULE OF REVENUES AND EXPENDITURES - BUDGETED AND ACTUAL
LOCAL OPTION SALES TAX

Page 20
COUNCIL COUNCIL CURRENT % OF % OF % OFBEGINNING AMENDED APPROVED ACTUAL BUDGET ACTUAL BUDGET ACTUAL BUDGET
BUDGET BUDGET BUDGET 06/21 06/21 06/20 06/20 F.Y.E F.Y.E.LOST SERIES 2017 PROJECT FUND: ---- APPROPRIATED FUND BALANCE $ 0 1,030,879 1,030,879 1,030,879 100.00% 7,176,184 100.00% 7,176,184 100.00%
REVENUES:
Interest 0 0 0 0 ---- 30,590 ---- 60,805 99.99%
TOTAL REVENUES 0 0 0 0 ---- 30,590 ---- 60,805 99.99%
TOTAL REVENUES AND FUND BALANCE $ 0 1,030,879 1,030,879 1,030,879 100.00% 7,206,774 100.43% 7,236,989 100.00%
EXPENDITURES:
CAPITAL PROJECTS Capital Outlay 0 1,030,879 1,030,879 1,030,875 100.00% 6,104,636 85.07% 6,206,114 85.76%
Sub-Total 0 1,030,879 1,030,879 1,030,875 100.00% 6,104,636 85.07% 6,206,114 85.76%----
TOTAL LOST IV BOND EXPENDITURES $ 0 1,030,879 1,030,879 1,030,875 100.00% 6,104,636 85.07% 6,206,114 85.76%
TOTAL:
TOTAL REVENUES AND FUND BALANCE $ 10,336,400 42,049,903 42,049,903 39,472,647 93.87% 45,500,075 92.54% 50,826,905 100.00%
TOTAL EXPENDITURES $ 10,336,400 42,049,903 42,049,903 16,575,856 39.42% 18,481,619 37.59% 17,222,737 33.89%
FY 2020
Note. The Lost Series 2017 Project Fund was funded with the issuance of the Infrastructure Sales Surtax Revenue Bond, Series 2017 on October 18, 2017.
CITY OF PENSACOLALOCAL OPTION SALES TAX
COMPARATIVE SCHEDULE OF REVENUES AND EXPENDITURES - BUDGETED AND ACTUALFor the Nine Months Ended June 30, 2021
(Unaudited)
FY 2021

Page 21
COUNCIL COUNCIL CURRENT % OF % OF % OFBEGINNING AMENDED APPROVED ACTUAL BUDGET ACTUAL BUDGET ACTUAL BUDGET
BUDGET BUDGET BUDGET 06/21 06/21 06/20 06/20 F.Y.E F.Y.E.
APPROPRIATED FUND BALANCE $ 0 4,497,859 4,497,859 4,497,859 100.00% 5,093,802 100.00% 5,093,802 100.00%
REVENUES:
Interest 0 0 0 17,686 ---- 33,147 80.85% 82,335 100.00% Transfer In From General Fund 2,735,000 2,735,000 2,735,000 2,735,000 100.00% 2,728,664 99.77% 2,732,167 100.00%TOTAL REVENUES 2,735,000 2,735,000 2,735,000 2,752,686 100.65% 2,761,811 99.49% 2,814,502 100.00%---- ----
TOTAL REVENUES AND FUND BALANCE $ 2,735,000 7,232,859 7,232,859 7,250,545 100.24% 7,855,613 99.82% 7,908,304 100.00%
EXPENDITURES:
CAPITAL PROJECTS Personal Services $ 0 0 0 0 ---- 11,510 98.32% 11,510 98.32% Operating Expenses 500,000 1,174,914 1,001,532 648,980 64.80% 833,354 48.04% 919,295 57.71% Capital Outlay 2,045,400 5,868,345 6,041,727 3,367,823 55.74% 2,128,966 35.38% 2,254,269 36.87%
Sub-Total 2,545,400 7,043,259 7,043,259 4,016,803 57.03% 2,973,830 38.30% 3,185,074 41.26%
Allocated Overhead/(Cost Recovery) 189,600 189,600 189,600 142,200 75.00% 161,400 75.00% 189,600 100.00%
TOTAL EXPENDITURES $ 2,735,000 7,232,859 7,232,859 4,159,003 57.50% 3,135,230 39.29% 3,374,674 42.67%
COMPARATIVE SCHEDULE OF REVENUES AND EXPENDITURES - BUDGETED AND ACTUALSTORMWATER CAPITAL PROJECTS FUND
CITY OF PENSACOLA
(Unaudited)
FY 2021 FY 2020
For the Nine Months Ended June 30, 2021

Page 22` ``
COUNCIL COUNCIL CURRENT % OF % OF % OFBEGINNING AMENDED APPROVED ACTUAL BUDGET ACTUAL BUDGET ACTUAL BUDGET
BUDGET BUDGET BUDGET 06/21 06/21 06/20 06/20 F.Y.E. F.Y.E.
GAS OPERATIONS:
APPROPRIATED FUND BALANCE $ 0 2,810,039 2,810,039 2,810,039 100.00% 1,957,685 100.00% 1,957,685 100.00%
REVENUES:
GASResidential User Fees 21,950,900 21,950,900 21,950,900 18,824,631 85.76% 16,723,037 70.84% 21,276,188 100.00%Commercial User Fees 13,168,500 13,168,500 13,168,500 9,399,735 71.38% 9,096,314 67.26% 11,942,163 100.00%Municipal User Fees 282,900 282,900 282,900 226,135 79.93% 224,928 71.54% 306,148 100.00%Interruptible User Fees 3,185,400 3,185,400 3,185,400 2,312,915 72.61% 2,376,367 77.33% 3,137,564 60.74%Transportation User Fees 5,477,200 5,477,200 5,477,200 4,762,172 86.95% 4,180,000 67.30% 5,543,148 157.68%Compressed Natural Gas 922,500 922,500 922,500 691,410 74.95% 661,350 72.82% 884,013 100.00%Miscellaneous Charges 567,900 567,900 567,900 483,540 85.15% 370,405 66.87% 463,747 99.98%New Accounts/Turn-on Fees 711,700 711,700 711,700 365,200 51.31% 376,466 53.00% 480,905 100.00%Interest Income 0 0 0 87,792 ---- 128,796 64.40% 374,848 100.00%Infrastructure Cost Recovery 3,350,900 3,350,900 3,350,900 3,007,869 89.76% 2,617,135 74.78% 3,118,130 100.00%Cookbooks 0 0 0 7,206 ---- 3,749 ---- 5,210 100.00%Sale of Asset 0 0 0 3,836 ---- 6,250 ---- 58,836 100.00%
TOTAL REVENUES 49,617,900 49,617,900 49,617,900 40,172,441 80.96% 36,764,797 69.89% 47,590,900 100.00%---- ---- ----
TOTAL REVENUES AND FUND BALANCE $ 49,617,900 52,427,939 52,427,939 42,982,480 81.98% 38,722,482 70.97% 49,548,585 100.00%
EXPENSES:
GAS OPERATION & MAINTENANCE Personnel Services $ 8,524,700 8,524,700 8,522,700 5,801,242 68.07% 5,548,279 67.16% 7,479,634 90.54%
City Sponsored Pensions 1,397,700 1,397,700 1,399,700 1,398,918 99.94% 1,398,894 99.96% 1,399,291 99.99%Sub-Total 9,922,400 9,922,400 9,922,400 7,200,160 72.56% 6,947,173 71.91% 8,878,925 91.91%
Operating Expenses 26,691,700 27,421,479 27,421,479 20,488,410 74.72% 20,174,995 62.75% 24,975,279 94.12% Capital Outlay 1,671,500 3,751,760 3,751,760 3,220,213 85.83% 1,203,162 87.58% 723,940 35.94%
Sub-Total 38,285,600 41,095,639 41,095,639 30,908,783 75.21% 28,325,330 65.59% 34,578,144 90.49%TRANSFERS OUT
General Fund 8,000,000 8,000,000 8,000,000 8,000,000 100.00% 8,000,000 100.00% 8,000,000 100.00%
Sub-Total 8,000,000 8,000,000 8,000,000 8,000,000 100.00% 8,000,000 100.00% 8,000,000 100.00%
Allocated Overhead/(Cost Recovery) 1,309,000 1,309,000 1,309,000 981,750 75.00% 1,011,375 75.00% 1,309,000 100.00%
` ``
(Unaudited)
FY 2021 FY 2020
The City’s general, fire and police pension fund annual contributions were paid in a lump sum contribution on October 1st which have been separated from personal services.
CITY OF PENSACOLAGAS UTILITY FUND
COMPARATIVE SCHEDULE OF REVENUES AND EXPENSES - BUDGETED AND ACTUALFor the Nine Months Ended June 30, 2021

Page 23
COUNCIL COUNCIL CURRENT % OF % OF % OFBEGINNING AMENDED APPROVED ACTUAL BUDGET ACTUAL BUDGET ACTUAL BUDGET
BUDGET BUDGET BUDGET 06/21 06/21 06/20 06/20 F.Y.E. F.Y.E.
EXPENSES: (continued)
DEBT SERVICE Interest 228,300 228,300 228,300 246,218 107.85% 264,221 99.97% 264,221 98.02% Principal 1,795,000 1,795,000 1,795,000 1,795,000 100.00% 1,759,000 100.00% 1,759,000 100.00%
Sub-Total 2,023,300 2,023,300 2,023,300 2,041,218 100.89% 2,023,221 100.00% 2,023,221 99.74%---- ---- ----
TOTAL GAS OPERATIONS EXPENSES $ 49,617,900 52,427,939 52,427,939 41,931,751 79.98% 39,359,926 72.14% 45,910,365 92.66%
The City’s general, fire and police pension fund annual contributions were paid in a lump sum contribution on October 1st which have been separated from personal services.
(Unaudited)
FY 2021 FY 2020
CITY OF PENSACOLAGAS UTILITY FUND
COMPARATIVE SCHEDULE OF REVENUES AND EXPENSES - BUDGETED AND ACTUALFor the Nine Months Ended June 30, 2021
Page 24
COUNCIL COUNCIL CURRENT % OF % OF % OFBEGINNING AMENDED APPROVED ACTUAL BUDGET ACTUAL BUDGET ACTUAL BUDGET
BUDGET BUDGET BUDGET 06/21 06/21 06/20 06/20 F.Y.E. F.Y.E.SANITATION OPERATIONS:
APPROPRIATED FUND BALANCE $ 854,000 2,706,840 2,706,840 2,706,840 100.00% 1,554,320 100.00% 273,128 100.00%
REVENUES:
SANITATION Residential Refuse Container Charges 4,738,200 4,738,200 4,776,200 3,576,212 74.88% 3,523,771 77.28% 4,714,676 100.00%Bulk Item Collection Charges 130,000 130,000 130,000 79,384 61.06% 109,974 84.60% 133,498 100.00%Business Refuse Container Charges 162,400 162,400 124,400 110,726 89.01% 95,385 59.95% 126,637 100.00%Fuel Surcharge 342,300 342,300 342,300 247,571 72.33% 254,270 70.63% 340,686 100.00%
County Landfill 1,261,700 1,261,700 1,261,700 919,353 72.87% 898,883 71.56% 1,201,958 100.00%New Accounts/Transfer Fees 85,000 85,000 85,000 59,120 69.55% 56,100 66.00% 78,020 100.00%Miscellaneous 40,000 40,000 40,000 25,371 63.43% 39,088 781.76% 87,175 162.27%Interest Income 0 0 0 6,548 ---- 7,996 29.08% 34,368 100.00%Sale of Assets 5,000 5,000 5,000 8,250 165.00% 0 0.00% 7,985 100.00%
SUB-TOTAL SANITATION REVENUES 6,764,600 6,764,600 6,764,600 5,032,535 74.40% 4,985,467 75.68% 6,725,003 100.50%
CAPITAL EQUIPMENT SURCHARGEEquipment Surcharge 748,200 748,200 748,200 569,213 76.08% 373,467 77.74% 499,388 ---- CNG Rebates 500,000 500,000 500,000 0 0.00% 1,181,082 ---- 1,181,082 100.00%Advertising Revenue 80,200 80,200 80,200 80,200 100.00% 0 ---- 0 ----
Sub-Total 1,328,400 1,328,400 1,328,400 649,413 48.89% 1,554,549 323.59% 1,680,470 142.28%
SUB-TOTAL SANITATION REVENUES 8,093,000 8,093,000 8,093,000 5,681,948 70.21% 6,540,016 92.54% 8,405,473 106.77%
CODE ENFORCEMENT Franchise Fees 1,277,700 1,277,700 1,277,700 675,322 52.85% 678,272 53.62% 1,324,801 100.00% Lot Cleaning (FY Cash Balance) * 80,000 80,000 80,000 40,401 50.50% 42,752 53.44% 67,369 66.76% Code Enforcement Violations 100,000 100,000 100,000 65,150 65.15% 22,030 27.54% 53,263 100.00% Sub-Total 1,457,700 1,457,700 1,457,700 780,873 53.57% 743,054 52.14% 1,445,433 97.73%
ENFORCEMENT REVENUES 1,457,700 1,457,700 1,457,700 780,873 53.57% 743,054 52.14% 1,445,433 97.73%
SUB-TOTAL REVENUES 9,550,700 9,550,700 9,550,700 6,462,821 67.67% 7,283,070 85.76% 9,850,906 105.34%
TOTAL REVENUES AND FUND BALANCE $ 10,404,700 12,257,540 12,257,540 9,169,661 74.81% 8,837,390 87.96% 10,124,034 105.19%
* Actual billings are $55,016 however collections are typically lower.
FY 2021 FY 2020
CITY OF PENSACOLASANITATION FUND
COMPARATIVE SCHEDULE OF REVENUES AND EXPENSES - BUDGETED AND ACTUALFor the Nine Months Ended June 30, 2021
(Unaudited)

Page 25
COUNCIL COUNCIL CURRENT % OF % OF % OFBEGINNING AMENDED APPROVED ACTUAL BUDGET ACTUAL BUDGET ACTUAL BUDGET
BUDGET BUDGET BUDGET 06/21 06/21 06/20 06/20 F.Y.E. F.Y.E.SANITATION OPERATIONS CONTINUED:
EXPENSES:
SANITATION SERVICES Personnel Services $ 2,452,200 2,452,200 2,469,653 1,957,719 79.27% 1,646,732 69.64% 2,234,165 96.44% City Sponsored Pensions 390,000 390,000 390,432 390,398 99.99% 390,390 99.97% 390,513 99.99%
Sub-Total 2,842,200 2,842,200 2,860,085 2,348,117 82.10% 2,037,122 73.94% 2,624,678 96.95% Operating Expenses 3,799,000 3,812,070 3,734,615 2,691,711 72.07% 2,329,919 71.72% 3,350,864 99.99% Allocated Overhead/(Cost Recovery) 489,100 489,100 489,100 366,825 75.00% 315,075 75.00% 489,100 100.00%
Sub-Total 7,130,300 7,143,370 7,083,800 5,406,653 76.32% 6,684,637 78.76% 6,464,642 98.74%
CAPITAL EQUIPMENT 0
Capital Outlay 1,672,300 3,511,522 3,571,092 3,499,235 97.99% 0 ---- 1,674,540 82.58%
Sub-Total 1,672,300 3,511,522 3,571,092 3,499,235 97.99% 0 ---- 1,674,540 82.58%
DEBT SERVICE Interest 4,500 4,500 4,500 4,445 98.78% 7,339 99.18% 7,339 99.18% Principal 139,900 139,900 139,900 139,880 99.99% 137,020 99.94% 137,020 99.94%
Sub-Total 144,400 144,400 144,400 144,325 99.95% 144,359 99.90% 144,359 99.90%---- ----
SUB-TOTAL SANITATION EXPENSES 8,947,000 10,799,292 10,799,292 9,050,213 83.80% 6,828,996 79.12% 8,283,541 95.00%
CODE ENFORCEMENT PROGRAM Personnel Services 678,300 678,300 678,136 473,742 69.86% 483,198 78.85% 665,421 99.93% City Sponsored Pensions 194,700 194,700 194,864 194,801 99.97% 189,571 99.99% 189,624 100.00%
Sub-Total 873,000 873,000 873,000 668,543 76.58% 672,769 83.84% 855,045 99.94% Operating Expenses 369,200 369,748 369,748 187,100 50.60% 163,126 45.41% 207,867 74.94% Capital Outlay 0 0 0 0 ---- 58,372 98.94% 58,372 98.94% Allocated Overhead/(Cost Recovery) 112,400 112,400 112,400 84,300 75.00% 78,150 75.00% 112,400 100.00%
Sub-Total 1,354,600 1,355,148 1,355,148 939,943 69.36% 972,417 73.40% 1,233,684 94.59%
CODE ENFORCEMENT ZONING/HOUSING Personnel Services 64,300 64,300 64,261 46,626 72.56% 46,332 75.14% 62,532 99.17% City Sponsored Pensions 28,100 28,100 28,139 28,138 100.00% 28,137 99.99% 28,150 100.00%
Sub-Total 92,400 92,400 92,400 74,764 80.91% 74,469 82.93% 90,682 99.42% Operating Expenses 10,700 10,700 10,700 6,207 58.01% 5,943 57.14% 7,620 84.75% Capital Outlay 0 0 0 0 ---- 0 ---- 0 ---- Sub-Total 103,100 103,100 103,100 80,971 78.54% 80,412 80.25% 98,302 98.11%
SUB-TOTAL CODE ENFORCEMENT 1,457,700 1,458,248 1,458,248 1,020,914 70.01% 1,052,829 73.88% 1,331,986 94.84%----
TOTAL EXPENSES $ 10,404,700 12,257,540 12,257,540 10,071,127 82.16% 7,881,825 78.38% 9,615,527 94.98%
TOTAL FUND:
TOTAL REVENUES AND FUND BALANCE $ 10,404,700 12,257,540 12,257,540 9,169,661 74.81% 8,837,390 87.96% 10,124,034 105.19%
TOTAL EXPENSES $ 10,404,700 12,257,540 12,257,540 10,071,127 82.16% 7,881,825 78.38% 9,615,527 94.98%
FY 2021 FY 2020
The City’s general, fire and police pension fund annual contributions were paid in a lump sum contribution on October 1st which have been separated from personal services.
(Unaudited)
CITY OF PENSACOLASANITATION FUND
COMPARATIVE SCHEDULE OF REVENUES AND EXPENSES - BUDGETED AND ACTUALFor the Nine Months Ended June 30, 2021

Page 26
CITY OF PENSACOLAPORT FUND
COMPARATIVE SCHEDULE OF REVENUES AND EXPENSES - BUDGETED AND ACTUALFor the Nine Months Ended June 30, 2021
FY 2021 FY 2020COUNCIL COUNCIL CURRENT % OF % OF % OF
BEGINNING AMENDED APPROVED ACTUAL BUDGET ACTUAL BUDGET ACTUAL BUDGETBUDGET BUDGET BUDGET 06/21 06/21 06/20 06/20 F.Y.E. F.Y.E.
APPROPRIATED FUND BALANCE $ 0 251,717 251,717 251,717 100.00% 187,407 100.00% (439,820) 100.00%
REVENUES:
PORT Handling 30,900 30,900 30,900 10,174 32.93% 5,589 21.33% 9,516 100.00%Wharfage 382,500 382,500 382,500 323,156 84.49% 442,290 126.19% 706,220 100.00%Storage 401,400 401,400 401,400 554,603 138.17% 293,796 95.02% 412,628 100.00%Dockage 654,400 654,400 654,400 377,160 57.63% 381,240 67.90% 552,354 100.00%Water Sales 6,000 6,000 6,000 10,207 170.12% 2,812 46.87% 3,262 100.00%Property Rental 595,300 595,300 595,300 544,955 91.54% 493,487 87.34% 594,830 100.00%Stevedore Fees 31,800 31,800 31,800 9,157 28.80% 5,939 18.68% 11,078 100.00%Harbor 24,400 24,400 24,400 28,445 116.58% 24,205 120.42% 34,865 100.00%Security Fees 87,500 87,500 87,500 56,942 65.08% 72,778 117.76% 114,338 100.00%Interior Lighting 115,000 115,000 115,000 108,207 94.09% 106,198 92.35% 181,976 100.00%Miscellaneous/Billed 15,000 15,000 15,000 20,565 137.10% 43,547 290.31% 60,526 100.00%Seville Harbor Lease 46,100 46,100 46,100 38,468 83.44% 0 ---- 0 0.00%Sale of Asset 0 0 0 0 ---- 0 ---- 1,850 100.00%Miscellaneous/Non-Billed 0 0 0 600 ---- 804 ---- 804 100.12%Miscellaneous -Ins Proceeds - Sally 0 0 0 1,650,924 ---- 0 ---- 0 ---- Cedar Street Lease/Parking Lot 65,700 65,700 65,700 49,800 75.80% 49,800 75.80% 59,760 100.00%Interest Income 0 0 0 8,359 ---- 634 ---- 11,020 100.00%
SUB-TOTAL OPERATING REVENUES 2,456,000 2,456,000 2,456,000 3,791,722 154.39% 1,923,119 90.38% 2,755,027 97.85%TRANSFERS IN LOCAL OPTION SALES TAX FUND 0 239,768 239,768 82,498 34.41% 93,897 26.21% 118,454 33.07%TOTAL REVENUES 2,456,000 2,695,768 2,695,768 3,874,220 143.71% 2,017,016 81.13% 2,873,481 90.54%
TOTAL REVENUES AND FUND BALANCE $ 2,456,000 2,947,485 2,947,485 4,125,937 139.98% 2,204,423 82.46% 2,433,661 89.02%---- ----
EXPENSES:
OPERATIONS & MAINTENANCE Personnel Services $ 862,500 862,500 862,139 602,116 69.84% 571,429 72.21% 779,809 93.23% City Sponsored Pensions 108,500 108,500 108,861 108,609 99.77% 108,604 99.98% 108,641 99.82% Sub-Total 971,000 971,000 971,000 710,725 73.20% 680,033 75.57% 888,450 93.99% Operating Expenses 1,291,800 1,382,099 1,381,859 868,305 62.84% 738,000 63.47% 948,648 89.09% Capital Outlay 80,000 481,186 481,426 216,158 44.90% 152,517 30.88% 135,352 24.60%
Sub-Total 2,342,800 2,834,285 2,834,285 1,795,188 63.34% 1,570,550 61.43% 1,972,450 77.04%
Allocated Overhead/(Cost Recovery) 113,200 113,200 113,200 84,900 75.00% 87,600 75.00% 113,200 100.00%`
TOTAL EXPENSES $ 2,456,000 2,947,485 2,947,485 1,880,088 63.79% 1,658,150 62.02% 2,085,650 78.01%
(Unaudited)
The City’s general, fire and police pension fund annual contributions were paid in a lump sum contribution on October 1st which have been separated from personal services.

Page 27
COUNCIL COUNCIL CURRENT % OF % OF % OFBEGINNING AMENDED APPROVED ACTUAL BUDGET ACTUAL BUDGET ACTUAL BUDGET
BUDGET BUDGET BUDGET 06/21 06/21 06/20 06/20 F.Y.E F.Y.E.
APPROPRIATED FUND BALANCE $ 2,093,500 9,237,113 9,237,113 9,237,113 100.00% 7,747,793 100.00% 7,747,793 100.00%
REVENUES:
AIRLINE REVENUES Loading Bridges Fees 405,000 405,000 405,000 118,724 29.31% 396,434 107.14% 550,062 100.00% Air Carrier Landing Fees 1,751,000 1,751,000 1,751,000 319,349 18.24% 342,412 48.92% 479,692 100.00% Cargo Landing Fees 100,000 100,000 100,000 34,031 34.03% 51,983 64.98% 67,620 100.00% Apron Area Rental 790,000 790,000 790,000 364,947 46.20% 650,442 108.41% 854,164 100.00% Cargo Apron Area Rental 63,000 63,000 63,000 69,420 110.19% 67,437 79.34% 96,526 100.00% Baggage Handling System 1,214,000 1,214,000 1,214,000 341,830 28.16% 1,256,320 98.30% 1,677,013 100.00% Ron Ramp 10,000 10,000 10,000 69,137 691.37% 50,190 1673.00% 70,455 100.00% Airline Rentals 2,748,000 2,748,000 2,748,000 1,041,399 37.90% 2,209,318 88.37% 2,932,954 100.00%SUBTOTAL AIRLINE REVENUES 7,081,000 7,081,000 7,081,000 2,358,837 33.31% 5,024,536 89.47% 6,728,486 100.00%
NON-AIRLINE REVENUES U.S.Government 96,000 96,000 96,000 72,000 75.00% 72,000 75.00% 96,000 100.00% Rental Cars 2,910,300 2,910,300 2,910,300 3,968,088 136.35% 3,119,092 77.98% 3,880,205 92.33% Rental Car Customer Facility Charge (Garage) 730,000 730,000 730,000 586,955 80.40% 524,068 60.59% 706,116 100.00%
CFC - Rental Car Svc Facility 1,124,000 1,124,000 1,124,000 1,680,849 149.54% 1,500,735 54.37% 2,019,059 100.00%Rental Car Service Facility Rent 250,000 250,000 250,000 204,590 81.84% 194,991 78.00% 262,983 100.00%
Fixed Base Operators 220,000 220,000 220,000 148,601 67.55% 160,508 74.31% 212,179 100.00% Restaurant and Lounge 466,000 466,000 466,000 533,748 114.54% 421,136 61.48% 522,770 100.00% Advertising 95,000 95,000 95,000 123,216 129.70% 106,254 85.00% 139,338 100.00% Hangar Rentals 75,000 75,000 75,000 103,987 138.65% 73,251 81.39% 102,480 100.00% ST Ground Lease 260,000 260,000 260,000 201,220 77.39% 198,777 76.45% 265,552 100.00%
Airport & 12th 167,600 167,600 167,600 137,655 82.13% 336,302 102.84% 400,200 100.00% Parking Lot 4,250,500 4,250,500 4,250,500 3,564,994 83.87% 3,593,861 59.90% 4,265,619 100.00% Gift Shop 211,200 211,200 211,200 314,812 149.06% 169,033 52.82% 240,246 100.00% Taxi Permits 137,700 137,700 137,700 84,616 61.45% 104,885 80.68% 137,937 100.00% LEO/TSA Security 100,000 100,000 100,000 83,710 83.71% 73,200 73.20% 109,800 100.00%
Commercial Property Rentals 327,000 327,000 327,000 277,186 84.77% 237,985 125.26% 313,214 100.00%GSA/TSA Term Rent 160,000 160,000 160,000 125,840 78.65% 122,345 58.26% 161,792 100.00%
Miscellaneous 123,800 123,800 123,800 235,685 190.38% 149,652 115.12% 184,235 100.00% Interest Income 0 0 0 179,102 ---- 253,300 281.44% 863,252 100.00% Sale of Asset 0 0 0 0 ---- 7,250 ---- 7,250 100.00%SUB-TOTAL NON-AIRLINE REVENUES 11,704,100 11,704,100 11,704,100 12,626,854 107.88% 11,418,625 67.79% 14,890,227 97.88%
TOTAL OPERATING REVENUES 18,785,100 18,785,100 18,785,100 14,985,691 79.77% 16,443,161 73.21% 21,618,713 98.53%
TOTAL REVENUES AND FUND BALANCE $ 20,878,600 28,022,213 28,022,213 24,222,804 86.44% 24,190,954 80.08% 29,366,506 98.91%
FY 2021 FY 2020
CITY OF PENSACOLAAIRPORT FUND
COMPARATIVE SCHEDULE OF REVENUES AND EXPENSES - BUDGETED AND ACTUALFor the Nine Months Ended June 30, 2021
(Unaudited)

Page 28
COUNCIL COUNCIL CURRENT % OF % OF % OFBEGINNING AMENDED APPROVED ACTUAL BUDGET ACTUAL BUDGET ACTUAL BUDGET
BUDGET BUDGET BUDGET 06/21 06/21 06/20 06/20 F.Y.E F.Y.E.
EXPENSES:
OPERATION & MAINTENANCE Personnel Services $ 4,457,000 4,471,200 4,469,400 3,074,475 68.79% 2,998,053 71.26% 4,039,998 94.49% City Sponsored Pensions 725,800 725,800 727,600 726,261 99.82% 719,328 98.77% 720,983 98.89%
Sub-Total 5,182,800 5,197,000 5,197,000 3,800,736 73.13% 3,717,381 75.32% 4,760,981 95.13% Operating Expenses 9,927,900 13,831,982 13,677,981 6,837,145 49.99% 9,080,651 59.73% 9,602,869 66.10%
Capital Outlay 659,000 3,884,331 4,038,332 3,601,677 89.19% 1,411,109 28.34% 963,804 19.07%
Sub-Total 15,769,700 22,913,313 22,913,313 14,239,558 62.15% 14,209,141 56.57% 15,327,654 62.34%
CARES ACT FUNDING (a) Cares Act Personnel Services 0 0 0 (2,273,664) ---- (1,236,283) ---- (1,832,909) ---- Cares Act Operating Expenses 0 0 0 (2,907,889) ---- (2,197,756) ---- (3,167,091) ---- Sub-Total 0 0 0 (5,181,553) ---- (3,434,039) ---- (5,000,000) ----
DEBT SERVICE GARB Interest 647,800 647,800 647,800 541,794 83.64% 588,669 83.26% 565,599 80.00% Principal 2,210,900 2,210,900 2,210,900 1,768,600 79.99% 1,715,200 80.00% 1,715,200 80.00%
Sub-Total 2,858,700 2,858,700 2,858,700 2,310,394 80.82% 2,303,869 80.81% 2,280,799 80.00%
DEBT SERVICE CFC Interest 322,200 322,200 322,200 38,937 12.08% 100,763 31.27% 105,918 32.87% Principal 1,242,900 1,242,900 1,242,900 0 0.00% 0 0.00% 0 0.00%
Sub-Total 1,565,100 1,565,100 1,565,100 38,937 2.49% 100,763 6.44% 105,918 6.77%
Allocated Overhead/(Cost Recovery) General Fund 685,100 685,100 685,100 513,825 75.00% 504,825 75.00% 685,100 100.00%
TOTAL OPERATING EXPENSES $ 20,878,600 28,022,213 28,022,213 11,921,161 42.54% 13,684,559 45.30% 13,399,471 45.13%
(a) On May 18, 2020, Pensacola International Airport was awarded $11,081,566 in CARES funding to help cover operating, maintenance and debt service expenses. The award period is 4 years.
(Unaudited)
FY 2021 FY 2020
CITY OF PENSACOLAAIRPORT FUND
The City’s general, fire and police pension fund annual contributions were paid in a lump sum contribution on October 1st which have been separated from personal services.
COMPARATIVE SCHEDULE OF REVENUES AND EXPENSES - BUDGETED AND ACTUALFor the Nine Months Ended June 30, 2021

Page 29
COUNCIL COUNCIL CURRENT % OF % OF % OFBEGINNING AMENDED APPROVED ACTUAL BUDGET ACTUAL BUDGET ACTUAL BUDGET
BUDGET BUDGET BUDGET 06/21 06/21 06/20 06/20 F.Y.E. F.Y.E.
APPROPRIATED FUND BALANCE $ 0 0 0 0 ---- 0 ---- 0 ----
REVENUES:
Service Fees 1,517,700 1,517,700 1,517,700 1,153,776 76.02% 997,642 72.15% 1,458,513 86.27%
TOTAL REVENUES 1,517,700 1,517,700 1,517,700 1,153,776 76.02% 997,642 72.15% 1,458,513 86.27%
TOTAL REVENUES AND FUND BALANCE $ 1,517,700 1,517,700 1,517,700 1,153,776 76.02% 997,642 72.15% 1,458,513 86.27%
EXPENSES:
RISK MANAGEMENT Personnel Services $ 611,900 611,900 611,834 500,590 81.82% 424,595 73.86% 477,590 82.13% City Sponsored Pensions 53,800 53,800 53,866 53,851 99.97% 53,849 99.98% 53,867 99.99%
Sub-Total 665,700 665,700 665,700 554,441 83.29% 478,444 76.10% 531,457 83.64%
Operating Expenses 651,500 651,500 651,500 454,763 69.80% 396,680 67.62% 692,792 78.03%
Sub-Total 1,317,200 1,317,200 1,317,200 1,009,204 76.62% 875,124 72.01% 1,224,249 80.37%
CITY CLINIC Personnel Services 140,400 140,400 140,342 98,183 69.96% 79,063 71.27% 101,406 91.41% City Sponsored Pensions 24,900 24,900 24,958 24,951 99.97% 24,944 99.94% 24,959 100.00%
Sub-Total 165,300 165,300 165,300 123,134 74.49% 104,007 76.53% 126,365 92.98%
Operating Expenses 35,200 35,200 35,200 21,438 60.90% 18,511 58.77% 25,037 79.48%
Sub-Total 200,500 200,500 200,500 144,572 72.11% 122,518 73.19% 151,402 90.44%
TOTAL EXPENSES $ 1,517,700 1,517,700 1,517,700 1,153,776 76.02% 997,642 72.15% 1,375,651 81.37%
The City’s general, fire and police pension fund annual contributions were paid in a lump sum contribution on October 1st which have been separated from personal services.
(Unaudited)
CITY OF PENSACOLARISK MANAGEMENT SERVICES
COMPARATIVE SCHEDULE OF REVENUES AND EXPENSES - BUDGETED AND ACTUALFor the Nine Months Ended June 30, 2021
FY 2021 FY 2020

Page 30
COUNCIL COUNCIL CURRENT % OF % OF % OFBEGINNING AMENDED APPROVED ACTUAL BUDGET ACTUAL BUDGET ACTUAL BUDGET
BUDGET BUDGET BUDGET 06/21 06/21 06/20 06/20 F.Y.E. F.Y.E.
APPROPRIATED FUND BALANCE $ 0 0 0 0 ---- 430,000 100.00% 430,000 100.00%
REVENUES:
Service Fees Mail Room 88,100 88,100 88,100 66,840 75.87% 66,466 77.11% 80,944 93.90% Innovation & Technology 2,953,400 3,460,063 3,460,063 2,383,052 68.87% 2,206,698 72.10% 2,589,307 84.61% Engineering 843,900 843,900 843,900 567,973 67.30% 491,769 59.35% 683,257 82.46% Central Garage 1,869,600 1,875,013 1,875,013 1,303,617 69.53% 1,173,303 72.18% 1,711,451 105.29%
TOTAL REVENUES 5,755,000 6,267,076 6,267,076 4,321,482 68.96% 3,938,236 70.32% 5,064,959 90.43%
TOTAL REVENUES AND FUND BALANCE $ 5,755,000 6,267,076 6,267,076 4,321,482 68.96% 3,312,689 54.93% 5,494,959 91.12%
EXPENSES:
MAIL ROOM Personnel Services $ 49,900 49,900 49,890 34,325 68.80% 34,797 74.68% 48,464 104.00% City Sponsored Pensions 18,900 18,900 18,910 18,902 99.96% 18,902 99.98% 18,904 100.02%
Sub-Total 68,800 68,800 68,800 53,227 77.36% 53,699 81.98% 67,368 102.85%
Operating Expenses 19,300 19,300 19,300 13,613 70.53% 12,767 61.68% 16,648 80.43%
Sub-Total Mail Room 88,100 88,100 88,100 66,840 75.87% 66,466 77.11% 84,016 97.47%
INNOVATION & TECHNOLOGY Personnel Services 1,506,500 1,506,500 1,507,675 949,203 62.96% 872,643 77.74% 1,192,762 107.73% City Sponsored Pensions 192,300 192,300 192,363 192,354 100.00% 192,352 99.99% 192,371 100.04%
Sub-Total 1,698,800 1,698,800 1,700,038 1,141,557 67.15% 1,064,995 81.00% 1,385,133 106.59% Operating Expenses 1,203,700 1,660,467 1,658,727 1,164,007 70.17% 1,096,872 66.62% 1,157,466 69.53% Capital Outlay 50,900 100,796 101,298 77,488 76.50% 44,831 45.31% 47,984 49.93% Sub-Total Technology Resources 2,953,400 3,460,063 3,460,063 2,383,052 68.87% 2,206,698 72.10% 2,590,583 84.65%
CITY OF PENSACOLACENTRAL SERVICES FUND
COMPARATIVE SCHEDULE OF REVENUES AND EXPENSES - BUDGETED AND ACTUALFor the Nine Months Ended June 30, 2021
FY 2021 FY 2020
The City’s general, fire and police pension fund annual contributions were paid in a lump sum contribution on October 1st which have been separated from personal services.
(Unaudited)

Page 31
COUNCIL COUNCIL CURRENT % OF % OF % OFBEGINNING AMENDED APPROVED ACTUAL BUDGET ACTUAL BUDGET ACTUAL BUDGET
BUDGET BUDGET BUDGET 06/21 06/21 06/20 06/20 F.Y.E. F.Y.E.
ENGINEERING Personnel Services 623,900 623,900 623,748 386,019 61.89% 319,587 52.02% 469,919 76.49% City Sponsored Pensions 85,200 85,200 85,352 85,275 99.91% 85,275 99.98% 85,301 99.99%
Sub-Total 709,100 709,100 709,100 471,294 66.46% 404,862 57.86% 555,220 79.35%
Operating Expenses 134,800 140,213 140,213 96,679 68.95% 77,382 64.82% 98,779 82.75%
Capital Outlay 0 0 0 0 ---- 9,525 100.00% 9,525 100.00%
Sub-Total Engineering 843,900 849,313 849,313 567,973 66.87% 491,769 59.35% 663,524 80.08%
CENTRAL GARAGE Personnel Services 1,104,700 1,104,700 1,104,700 806,912 73.04% 811,303 81.32% 1,107,508 98.79% City Sponsored Pensions 190,700 190,700 190,700 190,700 100.00% 190,755 99.99% 190,755 100.00%
Sub-Total 1,295,400 1,295,400 1,295,400 997,612 77.01% 1,002,058 84.32% 1,298,263 98.97%
Operating Expenses 311,600 311,600 311,600 253,609 81.39% 202,036 59.14% 253,142 69.92%
Capital Outlay 262,600 262,600 262,600 52,396 19.95% 399,209 75.97% 381,646 100.00%
Sub-Total Central Garage 1,869,600 1,869,600 1,869,600 1,303,617 69.73% 1,603,303 78.00% 1,933,051 94.04%
TOTAL EXPENSES $ 5,755,000 6,267,076 6,267,076 4,321,482 68.96% 4,368,236 72.43% 5,271,174 87.41%
FY 2020
The City’s general, fire and police pension fund annual contributions were paid in a lump sum contribution on October 1st which have been separated from personal services.
CITY OF PENSACOLACENTRAL SERVICES FUND
COMPARATIVE SCHEDULE OF REVENUES AND EXPENSES - BUDGETED AND ACTUALFor the Nine Months Ended June 30, 2021
(Unaudited)
FY 2021
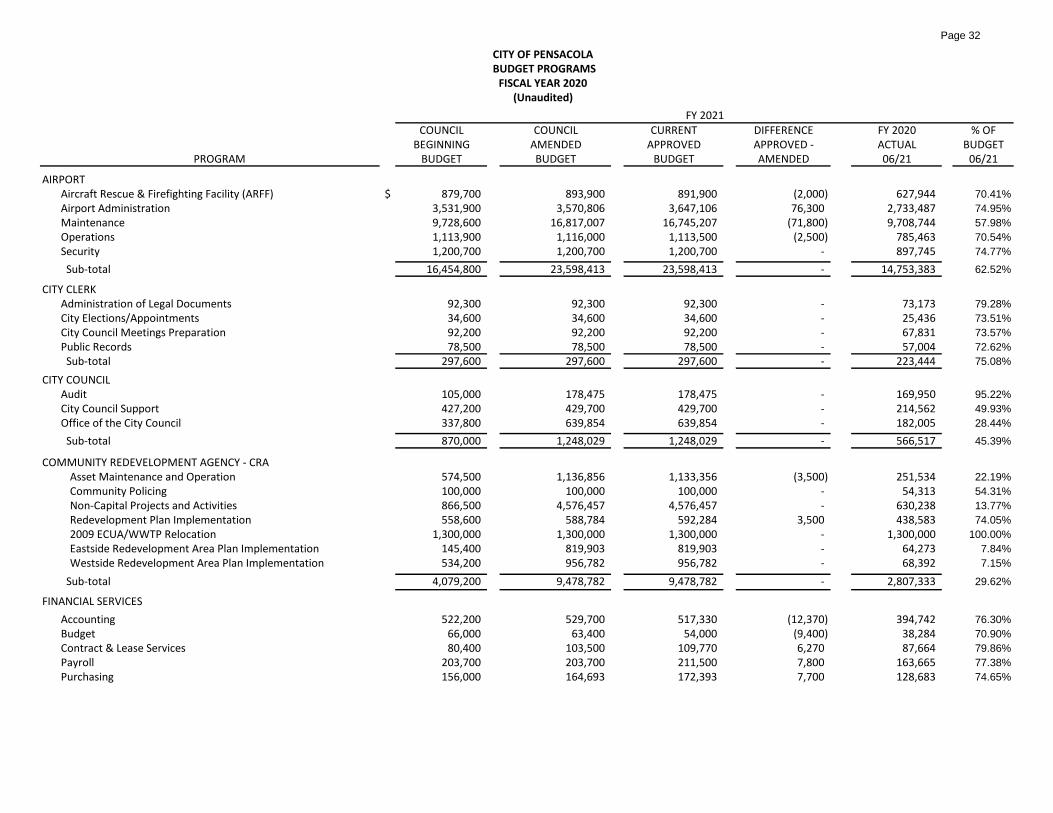
Page 32
COUNCIL COUNCIL CURRENT DIFFERENCE FY 2020 % OFBEGINNING AMENDED APPROVED APPROVED - ACTUAL BUDGET
PROGRAM BUDGET BUDGET BUDGET AMENDED 06/21 06/21
AIRPORTAircraft Rescue & Firefighting Facility (ARFF) $ 879,700 893,900 891,900 (2,000) 627,944 70.41%
Airport Administration 3,531,900 3,570,806 3,647,106 76,300 2,733,487 74.95%
Maintenance 9,728,600 16,817,007 16,745,207 (71,800) 9,708,744 57.98%
Operations 1,113,900 1,116,000 1,113,500 (2,500) 785,463 70.54%
Security 1,200,700 1,200,700 1,200,700 - 897,745 74.77%
Sub-total 16,454,800 23,598,413 23,598,413 - 14,753,383 62.52%
CITY CLERKAdministration of Legal Documents 92,300 92,300 92,300 - 73,173 79.28%
City Elections/Appointments 34,600 34,600 34,600 - 25,436 73.51%
City Council Meetings Preparation 92,200 92,200 92,200 - 67,831 73.57%
Public Records 78,500 78,500 78,500 - 57,004 72.62%
Sub-total 297,600 297,600 297,600 - 223,444 75.08%
CITY COUNCILAudit 105,000 178,475 178,475 - 169,950 95.22%
City Council Support 427,200 429,700 429,700 - 214,562 49.93%
Office of the City Council 337,800 639,854 639,854 - 182,005 28.44%
Sub-total 870,000 1,248,029 1,248,029 - 566,517 45.39%
COMMUNITY REDEVELOPMENT AGENCY - CRAAsset Maintenance and Operation 574,500 1,136,856 1,133,356 (3,500) 251,534 22.19%
Community Policing 100,000 100,000 100,000 - 54,313 54.31%
Non-Capital Projects and Activities 866,500 4,576,457 4,576,457 - 630,238 13.77%
Redevelopment Plan Implementation 558,600 588,784 592,284 3,500 438,583 74.05%
2009 ECUA/WWTP Relocation 1,300,000 1,300,000 1,300,000 - 1,300,000 100.00%
Eastside Redevelopment Area Plan Implementation 145,400 819,903 819,903 - 64,273 7.84%
Westside Redevelopment Area Plan Implementation 534,200 956,782 956,782 - 68,392 7.15%
Sub-total 4,079,200 9,478,782 9,478,782 - 2,807,333 29.62%
FINANCIAL SERVICES
Accounting 522,200 529,700 517,330 (12,370) 394,742 76.30%
Budget 66,000 63,400 54,000 (9,400) 38,284 70.90%
Contract & Lease Services 80,400 103,500 109,770 6,270 87,664 79.86%
Payroll 203,700 203,700 211,500 7,800 163,665 77.38%
Purchasing 156,000 164,693 172,393 7,700 128,683 74.65%
CITY OF PENSACOLA BUDGET PROGRAMS
FISCAL YEAR 2020(Unaudited)
FY 2021

Page 33
COUNCIL COUNCIL CURRENT DIFFERENCE FY 2020 % OFBEGINNING AMENDED APPROVED APPROVED - ACTUAL BUDGET
PROGRAM BUDGET BUDGET BUDGET AMENDED 06/21 06/21
CITY OF PENSACOLA BUDGET PROGRAMS
FISCAL YEAR 2020(Unaudited)
FY 2021
Sub-total 1,028,300 1,064,993 1,064,993 - 813,038 76.34%
FINANCIAL SERVICES - RISK MANAGEMENT SERVICESRisk Management Services 1,317,200 1,317,200 1,317,200 - 643,281 48.84%
Sub-total 1,317,200 1,317,200 1,317,200 - 643,281 48.84%
FINANCIAL SERVICES - MAIL ROOMMail Room 88,100 88,100 88,100 - 52,045 59.07%
Sub-total 88,100 88,100 88,100 - 52,045 59.07%
FIREAdministrative Support 572,900 572,900 618,350 45,450 458,106 74.09%
City Emergency Management 13,100 13,100 13,100 - 9,886 75.47%
Emergency Operations - Fire Suppression 8,165,700 8,418,080 8,395,070 (23,010) 6,592,585 78.53%
Emergency Operations - Rescue 354,100 369,800 368,620 (1,180) 228,045 61.86%
Facilities and Apparatus Management 900,200 913,891 878,441 (35,450) 588,279 66.97%
Fire Cadet 196,800 196,800 155,400 (41,400) 49,905 32.11%
Fire Code Enforcement 295,700 299,600 351,870 52,270 291,371 82.81%
Marine Operations 50,700 50,700 50,700 - 13,257 26.15%
Technical Support to City 13,100 13,100 13,100 - 9,887 75.47%
Training 132,900 132,900 136,220 3,320 109,318 80.25%# Sub-total 10,695,200 10,980,871 10,980,871 - 8,350,639 76.05%
HOUSINGHOME Program 157,600 845,860 845,860 - 95,975 11.35%
SHIP Program 25,300 26,741 26,741 - 18,835 70.43%
Sub-total 182,900 872,601 872,601 - 114,810 13.16%
HOUSING - CDBGCommunity Development Block Grant (CDBG) Program 547,900 731,407 731,407 - 118,747 16.24%
Housing Rehabilitation 589,900 772,947 772,947 - 183,685 23.76%
Sub-total 1,137,800 1,504,354 1,504,354 - 302,432 20.10%
HOUSING - SECTION 8Section 8 Housing Assistance Payments Program Fund 20,072,700 20,118,881 20,118,881 - 11,995,536 59.62%
Sub-total 20,072,700 20,118,881 20,118,881 - 11,995,536 59.62%

Page 34
COUNCIL COUNCIL CURRENT DIFFERENCE FY 2020 % OFBEGINNING AMENDED APPROVED APPROVED - ACTUAL BUDGET
PROGRAM BUDGET BUDGET BUDGET AMENDED 06/21 06/21
CITY OF PENSACOLA BUDGET PROGRAMS
FISCAL YEAR 2020(Unaudited)
FY 2021
HUMAN RESOURCESHuman Resources Administration 644,800 654,800 654,800 - 507,184 77.46%
Recruiting & Training 153,600 153,600 153,600 - 107,278 69.84%
Sub-total 798,400 808,400 808,400 - 614,462 76.01%
HUMAN RESOURCES - CLINICClinic 200,500 200,500 200,500 - 97,677 48.72%
Sub-total 200,500 200,500 200,500 - 97,677 48.72%
INNOVATION & TECHNOLOGYInnovation & Technology Adminstration 460,200 463,425 472,038 8,613 330,521 70.02%
Network/System Management 2,493,200 2,996,638 2,988,025 (8,613) 2,052,531 68.69%
Sub-total 2,953,400 3,460,063 3,460,063 - 2,383,052 68.87%
INSPECTION SERVICESInspection Services 1,687,200 1,728,872 1,728,872 - 1,409,721 81.54%
Sub-total 1,687,200 1,728,872 1,728,872 - 1,409,721 81.54%
LEGALClient Legal Advisory Services 839,600 839,600 839,600 - 627,980 74.80%
Sub-total 839,600 839,600 839,600 - 627,980 74.80%
MAYORCity Administrator/Cabinet 722,900 707,896 733,852 25,956 670,181 91.32%
Public Information Officer 147,100 147,100 132,350 (14,750) 69,025 52.15%
Neighborhood Services 178,400 180,030 196,730 16,700 132,461 67.33%
Neighborhood Challenge Grants - - 71,305 71,305 5,742 8.05%
Office of the Mayor 172,600 172,600 152,894 (19,706) 114,781 75.07%
Sub-total 1,221,000 1,207,626 1,287,131 79,505 992,190 77.09%
NON-DEPARTMENTAL FUNDINGAgency funding 4,174,300 4,651,882 4,651,882 - 3,932,432 84.53%
Sub-total 4,174,300 4,651,882 4,651,882 - 3,932,432 84.53%
PARKINGParking Fund - 1,207,904 1,207,904 - 336,788 27.88%
Sub-total - 1,207,904 1,207,904 - 336,788 27.88%

Page 35
COUNCIL COUNCIL CURRENT DIFFERENCE FY 2020 % OFBEGINNING AMENDED APPROVED APPROVED - ACTUAL BUDGET
PROGRAM BUDGET BUDGET BUDGET AMENDED 06/21 06/21
CITY OF PENSACOLA BUDGET PROGRAMS
FISCAL YEAR 2020(Unaudited)
FY 2021
PARKS & RECREATIONAquatics 237,000 287,162 287,115 (47) 246,963 86.02%
Athletic Field Maintenance 439,700 439,700 449,292 9,592 326,769 72.73%
Athletics 581,100 581,688 571,021 (10,667) 390,778 68.43%
Office of the Director (Administration) 1,003,300 1,008,061 1,022,459 14,398 813,186 79.53%
Park Administration & Maintenance 2,624,500 2,855,354 2,906,440 51,086 2,130,072 73.29%
Recreation/Resource Center Administration 916,800 916,800 949,812 33,012 754,268 79.41%
Resource Center 1,053,700 1,053,700 963,065 (90,635) 484,230 50.28%
Senior Center 233,400 233,400 226,661 (6,739) 120,683 53.24%
Volunteer & Outdoor Pursuits 62,800 62,800 62,800 - 37,955 60.44%
Sub-total 7,152,300 7,438,665 7,438,665 - 5,304,904 71.32%
PARKS & RECREATION - GOLF
Osceola Golf Course 768,700 774,725 774,725 - 399,122 51.52%
Sub-total 768,700 774,725 774,725 - 399,122 51.52%
PARKS & RECREATION - TENNISRoger Scott Tennis Center 128,700 128,700 128,700 - 37,712 29.30%
Sub-total 128,700 128,700 128,700 - 37,712 29.30%
PARKS & RECREATION - CMP
Community Maritime Park Cultural Events 1,113,800 1,512,241 1,512,241 - 495,094 32.74%
Sub-total 1,113,800 1,512,241 1,512,241 - 495,094 32.74%
PENSACOLA ENERGYCustomer Service 1,275,400 1,277,327 1,228,827 (48,500) 844,359 68.71%
Gas Construction 5,423,700 7,673,253 7,802,253 129,000 6,187,531 79.30%
Gas Cost 16,598,400 16,598,400 16,063,400 (535,000) 12,470,750 77.63%
Gas Marketing 2,396,500 2,396,500 2,881,400 484,900 2,201,009 76.39%
Gas Operations 12,350,800 12,909,359 12,862,959 (46,400) 9,502,349 73.87%
Gas Training 371,700 371,700 381,700 10,000 214,337 56.15%
Infrastructure Replacement 1,178,100 1,178,100 1,184,100 6,000 470,198 39.71%
Sub-total 39,594,600 42,404,639 42,404,639 - 31,890,533 75.21%

Page 36
COUNCIL COUNCIL CURRENT DIFFERENCE FY 2020 % OFBEGINNING AMENDED APPROVED APPROVED - ACTUAL BUDGET
PROGRAM BUDGET BUDGET BUDGET AMENDED 06/21 06/21
CITY OF PENSACOLA BUDGET PROGRAMS
FISCAL YEAR 2020(Unaudited)
FY 2021
PLANNING SERVICESBusiness Licenses 49,100 49,100 50,600 1,500 34,739 68.65%
Pensacola Neighborhood Challenge (PNC) 50,000 87,435 16,130 (71,305) 16,130 100.00%
Planning Services 944,200 945,795 936,095 (9,700) 661,319 70.65%
Sub-total 1,043,300 1,082,330 1,002,825 (79,505) 712,188 71.02%
POLICEAdministration - Chief's Office 1,605,300 1,605,300 1,669,083 63,783 1,191,235 71.37%
Cadets 381,300 381,300 285,367 (95,933) 136,110 47.70%
Central Records 447,400 447,400 447,430 30 314,455 70.28%
Communications Center 1,914,100 1,914,100 1,914,155 55 1,542,897 80.60%
Community Oriented Policing Squad 871,300 871,300 921,865 50,565 704,075 76.38%
Crime Scene Investigation 851,700 851,700 858,478 6,778 689,299 80.29%
Criminal Intelligence Unit 102,800 102,800 102,820 20 76,249 74.16%
Criminal Investigation Unit 2,580,100 2,580,100 2,574,027 (6,073) 2,010,212 78.10%
k-9 Unit 476,700 476,700 511,496 34,796 339,048 66.29%
Neighborhood Unit 993,400 993,400 817,276 (176,124) 505,239 61.82%
Property Management 366,800 366,800 413,454 46,654 331,792 80.25%
School Resource Office (SRO) 891,900 891,900 924,169 32,269 705,948 76.39%
Traffic 1,472,900 1,472,900 1,489,808 16,908 1,115,638 74.88%
Training/Personnel 868,600 868,600 875,095 6,495 654,546 74.80%
Uniform Patrol 9,149,400 9,149,840 9,086,277 (63,563) 7,594,482 83.58%
Vice & Narcotics 778,800 778,800 862,140 83,340 677,511 78.58%
Sub-total 23,752,500 23,752,940 23,752,940 - 18,588,736 78.26%
PORTAdministration 808,000 865,488 671,118 (194,370) 426,820 63.60%
Business & Trade Development 215,000 215,000 221,990 6,990 135,021 60.82%
Operations & Maintenance 991,700 996,741 1,163,501 166,760 857,909 73.74%
Seaport Security 247,200 247,200 282,508 35,308 208,958 73.97%
Waterfront Development 194,100 194,100 179,412 (14,688) 78,971 44.02%
Federal/State Matching Grant - 428,956 428,956 - 172,409 40.19%
Sub-total 2,456,000 2,947,485 2,947,485 - 1,880,088 63.79%

Page 37
COUNCIL COUNCIL CURRENT DIFFERENCE FY 2020 % OFBEGINNING AMENDED APPROVED APPROVED - ACTUAL BUDGET
PROGRAM BUDGET BUDGET BUDGET AMENDED 06/21 06/21
CITY OF PENSACOLA BUDGET PROGRAMS
FISCAL YEAR 2020(Unaudited)
FY 2021
PUBLIC WORKS & FACILITIES - GENERAL FUNDBuilding Maintenance Administration 274,400 301,668 308,154 6,486 197,431 64.07%
City Facility Maintenance & Repair 1,291,400 1,310,354 1,303,392 (6,962) 940,679 72.17%
Daily Operations 276,600 278,103 262,143 (15,960) 189,351 72.23%
Resource Center Maintenance 132,400 140,361 137,325 (3,036) 82,982 60.43%
Street Daily Operation 1,079,200 1,235,797 1,242,827 7,030 778,217 62.62%
Traffic Signals & Street Lighting 1,664,600 2,489,262 2,501,704 12,442 1,437,287 57.45%
Traffic Striping 32,200 32,200 32,200 - 21,768 67.60%
Sub-total 4,750,800 5,787,745 5,787,745 - 3,647,715 63.02%
PUBLIC WORKS & FACILITIES - STORMWATER FUNDStormwater Operation & Maintenance 2,011,200 2,020,200 2,019,723 (477) 1,461,382 72.36%
Street Sweeping FDOT Roadways 54,800 54,800 58,643 3,843 47,442 80.90%
Street Sweeping Operation & Maintenance 1,012,900 1,099,900 1,096,534 (3,366) 770,482 70.27%
Sub-total 3,078,900 3,174,900 3,174,900 - 2,279,306 71.79%
PUBLIC WORKS & FACILITIES - CENTAL SERVICES FUNDPlan Review 99,000 99,000 98,980 (20) 48,219 48.72%
Project Design 319,000 324,413 324,433 20 238,869 73.63%
Project Management 408,500 408,500 408,700 200 268,948 65.81%
Survey Operations Coordination 17,400 17,400 17,200 (200) 11,937 69.40%
Sub-total 843,900 849,313 849,313 - 567,973 66.87%
SANITATION SERVICESCode Enforcement 1,354,600 1,355,148 1,355,148 - 939,943 69.36%
Code Enforcement-Zoning/Housing 103,100 103,100 103,100 - 80,971 78.54%
Constituent Services 192,300 192,300 184,300 (8,000) 138,230 75.00%
Recycling Collection 1,078,900 1,091,970 1,102,129 10,159 966,031 87.65%
Residential Garbage Collection 4,273,600 5,382,822 5,393,512 10,690 4,490,659 83.26%
Transfer Station 785,400 1,025,400 1,012,551 (12,849) 870,988 86.02%
Yard Trash/Bulk Waste Collection 2,472,400 2,962,400 2,962,400 - 2,439,980 82.36%
Sub-total 10,260,300 12,113,140 12,113,140 - 9,926,802 81.95%
SANITATION SERVICES - GARAGECentral Garage 1,869,600 1,869,600 1,869,600 - 952,313 50.94%
Sub-total 1,869,600 1,869,600 1,869,600 - 952,313 50.94%
TOTAL $ 164,911,600 188,511,094 188,511,094 - 127,699,246 67.74%

Page 38
Invest Purchase Maturity Interest Principal Market
POOLED INVESTMENTS Type Date Date Rate Amount Value
PNC (Formally BBVA) CD 07/23/20 07/23/21 0.30% 5,106,750.87 5,106,750.87
BankUnited CD 12/16/20 0.25% 10,000,000.00 10,000,000.00
BankUnited MM 12/16/20 12/16/21 0.20% 10,000,000.00 10,000,000.00
BankUnited CD 12/16/20 12/16/21 0.20% 20,000,000.00 20,000,000.00
ServisFirst Bank CD 12/16/20 12/16/21 0.41% 5,000,000.00 5,000,000.00
Synovus CD 03/03/21 03/03/22 0.16% 20,000,000.00 20,000,000.00
ServisFirst Bank CD 03/03/21 03/03/22 0.26% 5,000,000.00 5,000,000.00
Synovus CD 04/22/21 04/26/22 0.15% 20,000,000.00 20,000,000.00
BankUnited CD 04/22/21 04/26/22 0.15% 25,000,000.00 25,000,000.00
City's- GCA (checking account)
Wells Fargo Bank
and 0.17% on excess balance 69,108,167.98 69,108,167.98
TOTAL INVESTMENTS 189,214,918.85$ 189,214,918.85$
Wells Fargo Bank is the City's primary depository.
City of Pensacola, Florida
Investment Schedule
As of June 30, 2021
(Unaudited)
ERC 0.25% up to fees

Page 39
CITY OF PENSACOLA
DEBT SERVICE SCHEDULE
June 30, 2021
(Unaudited)
ADDITION OR ESTIMATED
BALANCE (RETIREMENT) BALANCE REQUIRED FUTURE MATURITY
09/30/20 OF PRINCIPAL 06/30/21 RESERVES (a) INTEREST DATE
2008 AIRPORT TAXABLE CFC REVENUE NOTE 5,800,000.00 0.00 5,800,000.00 0.00 187,944.19 (b) 12/31/21
2011 GAS SYSTEM REVENUE NOTE 1,087,000.00 (538,000.00) 549,000.00 0.00 5,737.05 10/01/21
2015 AIRPORT REFUNDING REVENUE NOTE 8,710,000.00 (995,000.00) 7,715,000.00 1,219,797.50 708,453.75 10/01/27
2016 LOCAL OPTION GAS TAX REVENUE BOND 10,094,000.00 (1,365,000.00) 8,729,000.00 0.00 487,667.55 12/31/26
2016 GAS SYSTEM REVENUE NOTE 12,259,000.00 (1,257,000.00) 11,002,000.00 0.00 690,307.70 10/01/26
2016 EASTSIDE REDEVELOPMENT REVENUE LOAN 500,000.00 0.00 500,000.00 0.00 317,949.00 12/31/45
2017 EASTSIDE REDEVELOPMENT REVENUE BOND 1,147,000.00 (51,000.00) 1,096,000.00 0.00 335,630.70 04/01/37
2017 WESTSIDE REDEVELOPMENT REVENUE BOND 3,583,000.00 (160,000.00) 3,423,000.00 0.00 1,047,684.60 04/01/37
2017 AIRPORT REFUNDING REVENUE NOTE 5,205,000.00 (575,000.00) 4,630,000.00 0.00 422,558.50 10/01/27
2017 INFRASTRUCTURE SALES SURTAX REVENUE BOND 20,957,000.00 (2,136,000.00) 18,821,000.00 0.00 1,663,831.25 10/01/28
2017 URBAN CORE REDEVELOPMENT REVENUE BOND 7,625,000.00 (160,000.00) 7,465,000.00 0.00 1,948,042.00 04/01/40
2018 AIRPORT REFUNDING REVENUE NOTE 28,360,000.00 (1,035,000.00) 27,325,000.00 2,149,814.60 10,768,612.65 10/01/38
2019 URBAN CORE REDEV REFUNDING AND IMPROV REV BOND 58,140,000.00 (1,471,181.00) 56,668,819.00 0.00 26,826,464.56 12/31/43
TOTAL $ 163,467,000.00 (9,743,181.00) 153,723,819.00 3,369,612.10 45,410,883.50
(a) Does not include required O&M and R&R reserves.
(b ) Estimated.

Page 40
CITY OF PENSACOLA
DEBT SERVICE SCHEDULE BY ALLOCATION
June 30, 2021
ADDITION OR ESTIMATED
BALANCE (RETIREMENT) BALANCE REQUIRED FUTURE MATURITY
09/30/20 OF PRINCIPAL 06/30/21 RESERVES (a) INTEREST DATE
LOCAL OPTION GAS TAX FUND
2016 LOCAL OPTION GAS TAX REVENUE BOND 10,094,000.00 (1,365,000.00) 8,729,000.00 0.00 487,667.55 12/31/26
TOTAL LOCAL OPTION GAS TAX FUND 10,094,000.00 (1,365,000.00) 8,729,000.00 0.00 487,667.55
COMMUNITY REDEVELOPMENT AGENCY
2016 EASTSIDE REDEVELOPMENT REVENUE LOAN 500,000.00 0.00 500,000.00 0.00 317,949.00 12/31/45
2017 EASTSIDE REDEVELOPMENT REVENUE BOND 1,147,000.00 (51,000.00) 1,096,000.00 0.00 335,630.70 04/01/37
2017 WESTSIDE REDEVELOPMENT REVENUE BOND 3,583,000.00 (160,000.00) 3,423,000.00 0.00 1,047,684.60 04/01/37
2017 URBAN CORE REDEVELOPMENT REVENUE BOND 7,625,000.00 (160,000.00) 7,465,000.00 0.00 1,948,042.00 10/01/28
2019 URBAN CORE REDEV REFUNDING AND IMPROV REV BOND 58,140,000.00 (1,471,181.00) 56,668,819.00 0.00 26,826,464.56 12/31/43
TOTAL COMMUNITY REDEVELOPMENT AGENCY 70,995,000.00 (1,842,181.00) 69,152,819.00 0.00 30,475,770.86
LOCAL OPTION SALES TAX FUND
2017 INFRASTRUCTURE SALES SURTAX REVENUE BOND 20,957,000.00 (2,136,000.00) 18,821,000.00 0.00 1,663,831.25 10/01/28
TOTAL LOCAL OPTION SALES TAX FUND 20,957,000.00 (2,136,000.00) 18,821,000.00 0.00 1,663,831.25
GAS UTILITY FUND
2011 GAS SYSTEM REVENUE NOTE 1,087,000.00 (538,000.00) 549,000.00 0.00 5,737.05 10/01/21
2016 GAS SYSTEM REVENUE NOTE 12,259,000.00 (1,257,000.00) 11,002,000.00 0.00 690,307.70 10/01/26
TOTAL GAS UTILITY FUND 13,346,000.00 (1,795,000.00) 11,551,000.00 0.00 696,044.75
AIRPORT FUND
2008 AIRPORT TAXABLE CFC REVENUE NOTE 5,800,000.00 0.00 5,800,000.00 0.00 187,944.19 (b) 12/31/21
2015 AIRPORT REFUNDING REVENUE NOTE 8,710,000.00 (995,000.00) 7,715,000.00 1,219,797.50 708,453.75 10/01/27
2017 AIRPORT REFUNDING REVENUE NOTE 5,205,000.00 (575,000.00) 4,630,000.00 0.00 422,558.50 10/01/27
2018 AIRPORT REFUNDING REVENUE NOTE 28,360,000.00 (1,035,000.00) 27,325,000.00 2,149,814.60 10,768,612.65 10/01/38
TOTAL AIRPORT FUND 48,075,000.00 (2,605,000.00) 45,470,000.00 3,369,612.10 12,087,569.09
TOTAL $ 163,467,000.00 (9,743,181.00) 153,723,819.00 3,369,612.10 45,410,883.50
(a) Does not include required O&M and R&R reserves.
(b ) Estimated.
(Unaudited)

Page 41
ATTORNEY NAME OR FIRM AMOUNT PAID NATURE OF SERVICES PROVIDED
RISK MANAGEMENT:
COLLEEN CLEARY ORTIZ PA $ 21,474.43 Workers Compensation Claims
CLARK PARTINGTON HART LARRY 33,006.00 Claims and Litigation
QUINTAIROS PRIETO WOOD & BOYER PA 7,754.32 Workers Compensation and Liability Claims
RODERIC G. MAGIE, PA 24,482.51 Workers Compensation Claims
RUMBERGER KIRK & CALDWELL PA 4,515.50 Police Liability Claims
SNIFFEN & SPELLMAN PA 32,349.21 Police Liability Claims
WILSON HARRELL & FARRINGTON PA 81,627.47 Claims and Litigation
SUBTOTAL: 205,209.44
ST AEROSPACE:
BEGGS & LANE 132,223.50 Airport VT Mobile Aerospace Engineering Project
SUBTOTAL: 132,223.50
ALL OTHER LEGAL COSTS:
ALLEN NORTON & BLUE P A 39,990.58 Administrative, Collective Bargaining and Employee Matters
BEGGS & LANE 11,534.50 Contract and Real Estate Law
BRYANT MILLER OLIVE PA 22,927.50 Bond Counsel and CRA Matters
CARLTON FIELDS JORDEN BURT 37,040.00 Superfund and Other Environmental Matters
GALLOWAY, JOHNSON, TOMPKINS, BURR AND SMITH 4,666.00 Skanska Barge Matters
GRAY ROBINSON PA 55,126.00 Fee, Tax and Pension Plan Compliance
GUNSTER YOAKLEY & STEWART PA 7,507.20 Natural Gas Matters
LOCKE LORD LLP 2,500.00 Bond Disclosure Counsel
MCCARTER & ENGLISH LLP 20,627.21 Natural Gas Industry
NABORS GIBLIN & NICKERSON P A 1,416.85 Annual Stormwater Assessment Program
RAY, JR LOUIS F 30,710.00 Code Enforcement Special Magistrate
V. KEITH WELLS P.A. 3,500.00 Employee Personnel Board Attorney
SUBTOTAL: 237,545.84
REPORT TOTAL: $ 574,978.78
CITY OF PENSACOLA
SCHEDULE OF LEGAL COSTS
June 30, 2021
(Unaudited)

Page 42
Address District Amount Purpose
704 S. J Street 7 1,000.00 New Single Family Dwelling
1101 Office Woods 2 4,000.00 New Commercial
301 Clubbs 7 1,000.00 New Townhouse
804 E Wright St. 6 2,800.00 New Commercial
1017 Fairnie Ave 6 1,000.00
Tree Beside House Was Causing Foundation Issues - Have
Letter From Structual Engineer
Total 9,800.00
TREE PLANTINT TRUST FUND
FISCAL YEAR 2020
PARKS AND RECREATION
FEES COLLECTED THROUGH JUNE 30,2021

Page 43
NAME OF COMPANY NATURE OF SERVICES PROVIDED & DEPARTMENT SBE PURCHASE METHOD AMOUNT PAID BUDGETED
Big Orange Enterprise, LLC dba Escape
Landscaping2021 Landscape Maintenance Zone 4 & 5 – Parks & Recreation Yes Bid No. 21-008 $84,330.00 Yes
Executive Landscaping, Inc. 2021 Landscape Maintenance Zone 2 &3 – Parks & Recreation No Bid No. 21-007 75,610.00 Yes
Ranger Environmental Services, LLC Sediment Tank Cleaning – Public Works NoYear 2 of 3,
Bid No.# 19-020142,513.00 Yes
AeroCloud System, Inc. Gate Management & FID System Installation and Software – Port No Quotations 63,724.00 Yes
APTIM Corp dba APTIM Port Services, LLCWork Order #017: Sally EPM Engineering Services for Commendencia Ferry Dock Repairs
– Port No
Continuing Contract
RFQ 15-0395,912.00 Yes
Atkins North America, Inc. Work Order #30: Taxiway A Rehabilitation Engineering Services – Airport NoContinuing Contract
RFQ #17-022521,073.00 Yes
Blue Water Construction & Landscaping Osceola Golf Course Palm Tree Pruning – Parks and Recreation Yes Quotations 29,500.00 Yes
Consolidated Pipe & Supply Warehouse: Yellow Tracer Wire – Pensacola Energy No Quotations 30,000.00 Yes
Devtech Sales, Inc. Honeywell/American Regulators Model 1813C – Pensacola Energy No Sole Source 27,881.00 Yes
Mayer Electric Supply Co., Inc. 10 Hapco Poles and 10 Spring City Fixtures – Public Works No Quotations 34,985.00 Yes
OpenGov, Inc. Budgeting/Planning Suite Software – Finance No Single Quotation 138,000.00 Yes
Site & Utility, LLC 2021 Sidewalk Project, Phase 2 – Engineering Yes Quotations 89,806.00 Yes
CITY OF PENSACOLA
Contracts/ Expenditures
Over $25,000 Approved By Mayor
4/01/21 - 4/30/21
CONTRACT RENEWALS/ EXTENSIONS
CONTRACT RENEWALS/ EXTENSIONS
QUOTES & DIRECT NEGOTIATIONS

Page 44
NAME OF COMPANY NATURE OF SERVICES PROVIDED & DEPARTMENT SBE PURCHASE METHOD AMOUNT PAID BUDGETED
Federal Eastern International Point Blank Ballistic HiLite Carriers – Police NoNASPO Contract#
2016-18140,744.00 Yes
Southern Computer Warehouse Toughbooks with adapters – Pensacola Energy NoNational Coop. Purch.
All. 01-9732,079.00 Yes
Wesco Distribution, Inc. Replace Light Poles, Level 4 Garage - Airport NoNPP Contract
#27464738,981.00 Yes
STATE, FEDERAL OR OTHER BUYING CONTRACTS
CITY OF PENSACOLA
Contracts/ Expenditures
Over $25,000 Approved By Mayor
4/01/21 - 4/30/21

Page 45
NAME OF COMPANY NATURE OF SERVICES PROVIDED & DEPARTMENT SBE PURCHASE METHOD AMOUNT PAID BUDGETED
AllstopWaterproofing, LLC Runway 17/35 Joint Repairs – Airport Yes Bid No. 21-009 139,298.00 Yes
Axtell’s, Inc. Runway 8/26 Crack Repair Project – Airport No Bid No. 21-010 94,750.00 Yes
Accelerated Construction Services, Inc. TSA Services Space Renovations – Airport Yes Single Quotation 141,500.00 Yes
Baskerville Donovan, Inc. Service Authorization #20-006: Hurricane Sally – Community Maritime Park Plans for
Repairs – Parks & Recreation No
Continuing Contract
Srvc RFQ 19-02364,040.00 Yes
Emon Enterprises, LLC dba Jani-King of
Pensacola
Community Maritime Park and Plaza de Luna Restroom Maintenance – Parks and
Recreation No Quotations 48,240.00 Yes
Equipment Controls Co., Inc. Residential Gas Meters w/AMR Smartpoints: Sensus R275 Meters – Pensacola Energy No Sole Source 69,408.00 Yes
Highsteele Landscaping & Home Improvement
dba Highsteele Fencing, LLCChain link Fence Installation at 1621 Atwood Drive – Pensacola Energy No Single Quotation 48,207.00 Yes
Mott MacDonald Florida, LLC Service Authorization #502100054-020: Design of Post Hurricane Sally Repairs to Plaza
de Luna – Parks & Recreation No
Continuing Contract
Srvc RFQ 19-023132,690.00 Yes
Reynolds Smith & Hills, Inc. Work Order # 19: Elevated Runway Guard Lights Design & Bidding Services – Airport NoContinuing Contract
Srvc RFQ 17-02292,038.00 Yes
Vortex Lining System, LLC N. 9th Avenue Manhole #2 Rehabilitation – Engineering No Single Quotation 26,380.00 Yes
CITY OF PENSACOLA
Contracts/ Expenditures
Over $25,000 Approved By Mayor
5/01/21 - 5/31/21
FORMAL BID/RFQs
QUOTES & DIRECT NEGOTIATIONS

Page 46
NAME OF COMPANY NATURE OF SERVICES PROVIDED & DEPARTMENT SBE PURCHASE METHOD AMOUNT PAID BUDGETED
Rush Truck Center of Florida, Inc.Peterbilt Trucks: One (1) Truck Tractor and Two (2) K-Booms Yard Waste Trucks –
SanitationNo
FL Sheriffs Assn
Contract# FSA20-
VEH18.0
699,193.00 Yes
Sansom Equipment Company, Inc. Two (2) Autocar/Neway Garbage Vehicles – Sanitation No
Sourcewell Coop.
Purch.
Contract#091219-
NWY
783,264.00 Yes
STATE, FEDERAL OR OTHER BUYING
CONTRACTS
CITY OF PENSACOLA
Contracts/ Expenditures
Over $25,000 Approved By Mayor
5/01/21 - 5/31/21

Page 47
NAME OF COMPANY NATURE OF SERVICES PROVIDED & DEPARTMENT SBE PURCHASE METHOD AMOUNT PAID BUDGETED
Carpet Creations of Florida, Inc. dba Carpet
Creations Terminal Flooring Replacement – Airport YesITB 21-021 32,273.00
Yes
Olameter DPG, LLC Natural Gas System Leak Survey – Pensacola Energy NoRFP 21-006 101,068.00
Yes
Beard Equipment Company One (1) Dozer and One (1) Excavator with Thumb – Engineering No Quotations 188,882.00 Yes
Blue Water Construction & Landscaping ADA Playground Engineered Wood Fiber Installation – Parks and Recreation Yes Quotations 32,800.00 Yes
Cameron-Cole, LLC Fire Station #4: Supplemental Assessment Activity - Fire NoContinuing Contract
Srvc RFQ 20-00487,500.00 Yes
General Utility Pipe & Supply Warehouse: Curb/Valve Box & PE Valve – Pensacola Energy NoContinuing Contract
Srvc ITB 19-03145,296.00 Yes
The Hiller Companies, Inc. Remove/Refill/Replace Sinorex Agent Tanks – Technology Resources No Quotations 63,835.00 Yes
Reynolds Smith & Hills, Inc.Work Order # 20: Runway Object Free Area Roadway Realignment Construction Phase –
AirportNo
Continuing Contract
Srvc RFQ 17-022239,337.00 Yes
Site & Utility, LLC. 2021 Sidewalk Project, Phase 3 – Engineering Yes Quotations 68,605.00 Yes
Sperduto & Associates, Inc. 2021 Employee Engagement Survey – Human Resources No Direct Negotiations 32,700.00 Yes
YMCA Young Men’s Christian Assoc. of Northwest
Florida, Inc.YMCA Swim Facility Management, Year Two – Parks and Recreation No Direct Negotiations 187,086.00 Yes
CITY OF PENSACOLA
Contracts/ Expenditures
Over $25,000 Approved By Mayor
6/01/21 - 6/30/21
QUOTES & DIRECT NEGOTIATIONS
FORMAL BID/RFQs

Page 48
NAME OF COMPANY NATURE OF SERVICES PROVIDED & DEPARTMENT SBE PURCHASE METHOD AMOUNT PAID BUDGETED
Bozard Ford Company One (1) Ford Explorer – Airport No
FL Sheriffs Assn
Contract# FSA20-
VEH28.0
29,655.00 Yes
Bozard Ford Company Two (2) Unmarked Police Vehicles – Police No
FL Sheriffs Assn
Contract# FSA19-
VEL27.0
70,206.00 Yes
Bozard Ford Company Two (2) Flatbed Dump Body Trucks – Sanitation No
FL Sheriffs Assn
Contract# FSA20-
VEH18.0
96,290.00 Yes
Bozard Ford Company Three (3) F-550 CNG Powered Utility Trucks – Sanitation No
FL Sheriffs Assn
Contract# FSA20-
VEH18.0
318,963.00 Yes
Sansom Equipment Company, Inc. Pelican P Dual, Tier 4F, 55KW Sweeper – Public Works No
Sourcewell Coop.
Purch. Contract#12207-
FSC
225,157.00 Yes
Sansom Equipment Company, Inc. Broom Bear Dual Broom Sweeper – Public Works No
Sourcewell Coop.
Purch. Contract#12207-
FSC
281,252.00 Yes
Wastequip Manufacturing Co., Inc. Five (5) Roll Off Containers – Sanitation No
Sourcewell Coop.
Purch. Contract#WQ-
10195674
46,438.00 Yes
STATE, FEDERAL OR OTHER BUYING CONTRACTS
CITY OF PENSACOLA
Contracts/ Expenditures
Over $25,000 Approved By Mayor
6/01/21 - 6/30/21