Financial Report 2020 - Syngenta
104
Financial Report 2020
Transcript of Financial Report 2020 - Syngenta
Financial Report
2020 @

Financial Report 2020
Table of Contents
Key Information 1
Operating and Financial Review and Prospects 2
Consolidated Income Statement 19
Consolidated Statement of Comprehensive Income 20
Consolidated Balance Sheet 21
Consolidated Cash Flow Statement 22
Consolidated Statement of Changes in Equity 23
Notes to the Syngenta AG Group Consolidated Financial Statements 24
Report of the Statutory Auditor 85
Income Statement of Syngenta AG 88
Balance Sheet of Syngenta AG 89
Notes to the Financial Statements of Syngenta AG 90
Appropriation of Available Earnings of Syngenta AG 97
Report of the Statutory Auditor of Syngenta AG 98
Key Information Financial Report 2020
1
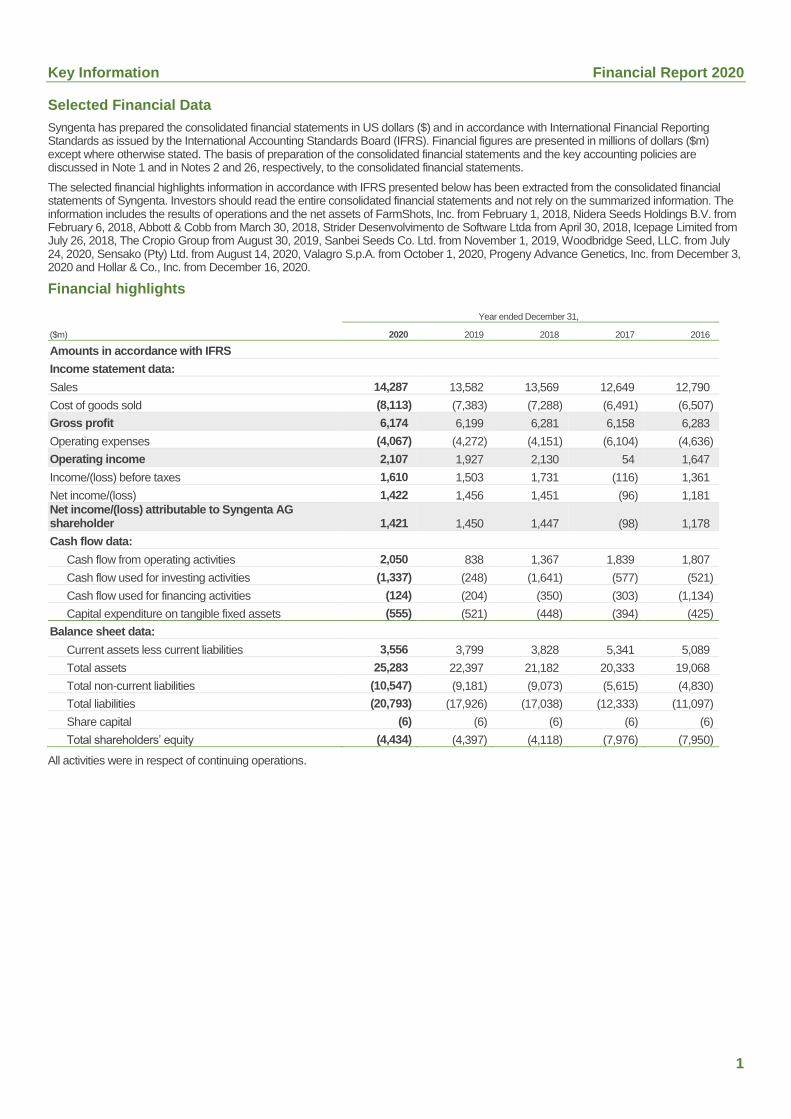
Selected Financial Data
Syngenta has prepared the consolidated financial statements in US dollars ($) and in accordance with International Financial Reporting Standards as issued by the International Accounting Standards Board (IFRS). Financial figures are presented in millions of dollars ($m) except where otherwise stated. The basis of preparation of the consolidated financial statements and the key accounting policies are discussed in Note 1 and in Notes 2 and 26, respectively, to the consolidated financial statements.
The selected financial highlights information in accordance with IFRS presented below has been extracted from the consolidated financial statements of Syngenta. Investors should read the entire consolidated financial statements and not rely on the summarized information. The information includes the results of operations and the net assets of FarmShots, Inc. from February 1, 2018, Nidera Seeds Holdings B.V. from February 6, 2018, Abbott & Cobb from March 30, 2018, Strider Desenvolvimento de Software Ltda from April 30, 2018, Icepage Limited from July 26, 2018, The Cropio Group from August 30, 2019, Sanbei Seeds Co. Ltd. from November 1, 2019, Woodbridge Seed, LLC. from July 24, 2020, Sensako (Pty) Ltd. from August 14, 2020, Valagro S.p.A. from October 1, 2020, Progeny Advance Genetics, Inc. from December 3, 2020 and Hollar & Co., Inc. from December 16, 2020.
Financial highlights
Year ended December 31,
($m) 2020 2019 2018 2017 2016
Amounts in accordance with IFRS
Income statement data:
Sales 14,287 13,582 13,569 12,649 12,790
Cost of goods sold (8,113) (7,383) (7,288) (6,491) (6,507)
Gross profit 6,174 6,199 6,281 6,158 6,283
Operating expenses (4,067) (4,272) (4,151) (6,104) (4,636)
Operating income 2,107 1,927 2,130 54 1,647
Income/(loss) before taxes 1,610 1,503 1,731 (116) 1,361
Net income/(loss) 1,422 1,456 1,451 (96) 1,181
Net income/(loss) attributable to Syngenta AG shareholder 1,421 1,450 1,447 (98) 1,178
Cash flow data:
Cash flow from operating activities 2,050 838 1,367 1,839 1,807
Cash flow used for investing activities (1,337) (248) (1,641) (577) (521)
Cash flow used for financing activities (124) (204) (350) (303) (1,134)
Capital expenditure on tangible fixed assets (555) (521) (448) (394) (425)
Balance sheet data:
Current assets less current liabilities 3,556 3,799 3,828 5,341 5,089
Total assets 25,283 22,397 21,182 20,333 19,068
Total non-current liabilities (10,547) (9,181) (9,073) (5,615) (4,830)
Total liabilities (20,793) (17,926) (17,038) (12,333) (11,097)
Share capital (6) (6) (6) (6) (6)
Total shareholders’ equity (4,434) (4,397) (4,118) (7,976) (7,950)
All activities were in respect of continuing operations.
Operating and Financial Review and Prospects Financial Report 2020
2
Introduction
The following discussion includes forward-looking statements subject to risks and uncertainty. See “Forward-looking statements” at the beginning of this document. This discussion also includes non-GAAP financial data in addition to GAAP results. See Appendix A to this section for a reconciliation of this data and explanation of the reasons for presenting such data.
Constant exchange rates
Approximately 43 percent of Syngenta’s sales and 60 percent of Syngenta’s costs in 2020 were denominated in currencies other than US dollars. Therefore, Syngenta’s results for the period covered by the review were significantly impacted by movements in exchange rates. Sales in 2020 were 5 percent higher than 2019 on a reported basis, 13 percent higher when calculated at constant rates of exchange. The Company therefore provides analysis of results calculated at constant exchange rates (“CER”) and also actual results to allow an assessment of performance before and after taking account of currency fluctuations. To present CER information, current period results for entities reporting in currencies other than US dollars are converted into US dollars at the prior period’s exchange rates, rather than the exchange rates for this year. An example of this calculation is included in Appendix A of this section.
Overview
Syngenta is a world leading agribusiness operating in the crop protection, seeds, professional solutions and flowers markets. Crop protection chemicals include herbicides, insecticides, fungicides and seed treatments to control weeds, insects and diseases in crops, and are essential inputs enabling growers around the world to improve agricultural productivity and food quality. In Seeds, Syngenta operates in the high value commercial sectors of field crops (including corn, oilseeds, and cereals) and vegetables. The Professional Solutions business provides turf and landscape and professional pest management products, and the flowers business provides flower seeds, cuttings and young plants to professional growers and consumers.
Syngenta’s results are affected, both positively and negatively, by, among other factors: general economic conditions; weather conditions, which can influence the demand for certain products over the course of a season and the quantity and cost of seeds supply; commodity crop prices; and exchange rate fluctuations. Government measures, such as subsidies or rules regulating the use of agricultural products, genetically modified seeds, or areas allowed to be planted with certain crops, also can have an impact on Syngenta’s industry. Syngenta’s results are also affected by the growing importance of biotechnology to agriculture and the use of genetically modified crops. In future years, climate change may have both positive and negative impacts on Syngenta’s results. Climate change may make growing certain crops more or less viable in different geographic areas, but is not likely to reduce overall demand for food and feed. Syngenta currently sells and is developing products to improve the water productivity of plants and increase tolerance to drought and heat. Legislation may be enacted in the future that limits carbon dioxide emissions in the manufacture of Syngenta’s products or increases the costs associated with such emissions. Syngenta works actively to make its production operations more energy efficient and to reduce the rate of carbon dioxide emissions per unit of sales revenue.
Syngenta operates globally to capitalize on its technology and marketing base. Syngenta’s largest market in 2020 was Latin America, which represented approximately 31 percent of consolidated sales (2019: 31 percent), followed by Europe, Africa and the Middle East at 28 percent (2019: 29 percent), North America at 25 percent (2019: 25 percent), and Asia Pacific at 16 percent (2019: 15 percent). Markets for agricultural products in Europe, Africa and the Middle East and North America are seasonal resulting in both sales and operating profit for Syngenta in these markets being weighted towards the first half of the calendar year, which largely reflects the northern hemisphere planting and growing cycle. Latin America has its main selling season in the second half of the year due to its location in the southern hemisphere. Asia Pacific sales and operating profit are more uniform throughout the year.
Syngenta’s most significant manufacturing and research and development sites are located in Switzerland, the United Kingdom (“UK”), the United States of America (“USA” or “US”) and China. Syngenta has major research centers focused on identifying new active ingredients in Stein, Switzerland and Jealott’s Hill, UK. Syngenta’s primary center for agricultural genomics and biotechnology research is in the USA.
References in this document to market share estimates are based where possible on global agrochemical and biotechnology industry information provided by a third party or on information published by major competitors and are supplemented by Syngenta marketing staff estimates.
The consolidated financial statements are presented in US dollars, as this is the major currency in which revenues are denominated. However, significant, but differing proportions of Syngenta’s revenues, costs, assets and liabilities are denominated in currencies other than US dollars. Approximately 13 percent of sales in 2020 were denominated in Euros, while a significant proportion of costs for research and development, administration, general overhead and manufacturing were denominated in Swiss francs and British pounds sterling (approximately 18 percent in total). Sales in Swiss francs and British pounds sterling together made up approximately 2 percent of total sales. Marketing and distribution costs are more closely linked to the currency split of the sales. As a result, operating profit in US dollars can be significantly affected by movements in exchange rates, in particular movements of the Swiss franc, British pound sterling, Euro and Brazilian real, relative to the US dollar, and the relative impact on operating profit may differ from that on sales. Sales in emerging markets are over 50 percent of Syngenta’s total sales. Where it is not commercially disadvantageous, Syngenta sets sales prices in these markets in US dollars, particularly in parts of Latin America and the CIS. However, in many emerging territories Syngenta sells in the local currency of the countries in the territory and as a result has a long exposure to multiple emerging market currencies. The effects of currency fluctuations within any one year have been reduced by risk management strategies such as hedging and the aforementioned US dollar sales pricing. For further information on these strategies please refer to Note 24 of the consolidated financial statements.
The consolidated financial statements are based upon Syngenta’s accounting policies and, where necessary, the results of management estimations. Syngenta believes that the critical accounting policies and estimations underpinning the financial statements are in the areas of (i) royalty and license income, (ii) capitalization of development costs, (iii) impairment, (iv) acquisition accounting, (v) adjustments to revenue and trade receivables, (vi) deferred tax assets, (vii) uncertain tax positions, (viii) seeds inventory valuation and allowances, (ix) environmental provisions and (x) defined benefit post-employment benefits. These policies are described in more detail in Notes 2 and 26 to the consolidated financial statements.
Operating and Financial Review and Prospects Financial Report 2020
3
Summary of results
Net income in 2020 attributable to Syngenta’s shareholder was $1,421 million, compared to $1,450 million in 2019.
Sales in 2020 were 5 percent higher than 2019, 13 percent higher at constant exchange rates, with a 10 percent increase in sales volumes and a further 3 percent increase in local currency sales prices. Currency movements reduced reported sales by 8 percent, with a lower BRL in particular, though with adverse impacts also in Europe and Asian currencies. Sales of Crop Protection products increased by 6 percent, 15 percent at constant exchange rates, with double-digit volume growth led by Latin America, but with local currency sales prices in Brazil only partially recovering the impact of the weaker BRL. Seeds sales were 4 percent higher than 2019, 8 percent at constant exchange rates, with double-digit sales volume increases in Latin America and Asia. Local currency sales prices were 3 percent higher in Crop Protection, driven by the partial sales price dollarization in Brazil and 2 percent higher in Seeds, where local currency sales prices were higher in all regions.
Operating income as a percentage of sales was 14.7 percent in 2020. Excluding restructuring costs, operating income as a percentage of sales increased by 1 percent in 2020 compared with 2019, largely due to reduced gross profit margins in Crop Protection products from the lower US dollar sales prices in Brazil, which more than offset a lower ratio of operating expenses below gross profit to sales. Including costs reported in cost of goods sold, restructuring and impairment charges were $188 million in 2020 before related taxation, compared to $337 million in 2019. Currency exchange rate impacts reduced operating income by approximately $827 million.
Excluding cash paid to settle the US AGRISURE VIPTERA® litigation of $1,110 million in 2019, cash flow from operating activities was $102 million higher in 2020 with higher net financial payments partly offset by higher inflow from change in net working capital. Change in net working capital was an inflow of $496 million compared to an outflow of $27 million in 2019 due mainly to lower growth in inventories. Cash flow used for investing activities in 2020 was $1,337 million compared to $248 million in 2019, due to net purchases of marketable securities in 2020 compared to net sales in 2019, lower proceeds from disposals of property, plant and equipment due to the sale and leaseback of buildings in Switzerland and the UK in 2019, and outflows for business acquisitions in 2020 including the acquisition of Valagro S.p.A. Cash flow used for financing activities was $80 million lower than in 2019, due to a lower dividend payment partly offset by the acquisition of non-controlling interests in a subsidiary in India.
Gross profit margin was approximately 2.4 percentage points lower in 2020, due to lower margins in Crop Protection from lower US dollar sales prices, particularly in Brazil but with adverse impacts from a stronger US dollar against a broad range of currencies including the Euro.
Marketing and distribution expenses decreased by 1 percent, but increased by 2 percent at constant exchange rates, from higher variable selling and distribution costs due to the increased volumes and the impact of salary inflation, which more than offset a lower charge for doubtful receivables. Research and development expense was 6 percent higher than 2019, 7 percent at constant exchange rates, with increases in both Crop Protection and Seeds to accelerate new product development.
General and administrative, including divestment gains and restructuring and impairment, the components of which are described under the Restructuring and impairment heading below, decreased by $227 million compared with 2019. General and administrative excluding restructuring and impairment and divestment gains was $179 million lower than 2019, including foreign exchange hedging gains of $51 million in 2020 compared with losses of $38 million 2019. Excluding all currency effects, General and administrative excluding restructuring and impairment was $84 million lower in 2020, with cost savings as a result of travel restrictions due to COVID-19 and gains on selling stocks of a high value metal catalyst used in production more than offsetting salary inflation and increased staff short term incentives.
Acquisition and divestment gains in 2020 included $107 million on acquisition of the Muttenz manufacturing facility described below. Acquisition and divestment gains in 2019 included the mandated divestment of some Crop Protection products in India required following the acquisition of Syngenta AG by ChemChina and the sale and leaseback of buildings at Syngenta’s Basel HQ. Other Restructuring and impairment expenses in 2020, including $6 million reported in cost of goods sold, were $297 million (2019: $365 million, including $1 million reported in cost of goods sold). Cash restructuring costs were $161 million (2019: $179 million) and non-cash impairments (including reversal of inventory step ups reported in cost of goods sold) were $136 million (2019: $186 million). These costs are described in more detail in Note 6 to the consolidated financial statements.
Financial expense, net was $72 million higher than 2019, largely due to higher net currency losses. The tax rate was 12 percent, compared to 3 percent in 2019 which included a $195 million one-off deferred tax revaluation gain following Swiss tax reform.
Acquisitions, divestments and other significant transactions
2020 On July 24, 2020, Syngenta acquired 100 percent equity interest of Woodbridge Seed, LLC, a California based processing tomato seed breeder. The acquisition provides an opportunity for Syngenta to enter the strategically critical global processing tomato market.
On August 14, 2020, Syngenta acquired 100 percent control over Sensako (Pty) Ltd., a South African research and development seeds company with a strong wheat market position. The acquisition will accelerate Syngenta’s entry into the South African seeds market and provide a platform to accelerate the introduction of Syngenta’s Viptera trait technology into South Africa.
On August 31, 2020, Syngenta completed the acquisition of a manufacturing facility in Muttenz, Switzerland from Novartis Pharma Schweizerhalle AG, a subsidiary of Novartis International AG, by acquiring the manufacturing assets and transferring employees. The facility will provide additional capacity to support the early launch phase of new active ingredients coming through Syngenta’s research and development pipeline.
On September 3, 2020, Syngenta purchased a privately held corn seed business from a Chinese breeder and other related third parties. The acquisition will enable Syngenta to improve its position in China’s key spring corn market.
On October 1, 2020, Syngenta acquired 100 percent of the issued shares of Valagro S.p.A., a producer of innovative Biologicals with a global presence and a strong position in biostimulants and specialty nutrients. The acquisition enables Syngenta to build a global Biologicals business, reinforcing Syngenta’s strategy to provide farmers with more complementary product and technology choices.
Operating and Financial Review and Prospects Financial Report 2020
4
On December 1, 2020, Syngenta acquired the remaining 3.7 percent shareholding in Syngenta India Ltd. which it did not already own.
On December 3, 2020, Syngenta acquired 100 percent equity interest of Progeny Advance Genetics, Inc., a California based lettuce breeding corporation. The acquisition provides an opportunity for Syngenta to increase its market share in the US lettuce segment.
On December 16, 2020, Syngenta acquired 100 percent equity interest of Hollar & Co., Inc., a Colorado based vegetable seed corporation that specializes in breeding and development of cucurbits. With this acquisition, Syngenta will enter the mid-tier vegetable seed segment.
2019 On January 3, 2019, Syngenta divested certain crop protection products in India, pursuant to commitments given to the Indian antitrust authority Competition Commission of India relating to ChemChina’s acquisition of Syngenta.
On January 3, 2019, Syngenta completed the sale and leaseback transaction for the remaining buildings and land at its Basel site which were not disposed of in 2018.
On June 6, 2019, Syngenta acquired the cyclamen flowers business of Varinova, a specialized breeding company based in the Netherlands, in order to enhance Syngenta’s portfolio and breeding pipeline.
On August 30, 2019, Syngenta acquired The Cropio Group, an agricultural technology company with a primary focus in Eastern Europe. The Cropio platform is an equipment-integrated, end-to-end software solution that provides imaging, recordkeeping, and equipment tracking. Significant opportunities for collaboration across Syngenta’s other digital agriculture platforms are expected.
On November 1, 2019, Syngenta obtained control of Sanbei Seeds Co. Ltd., China, a former associate in which Syngenta has held a 49 percent equity ownership since 2008, as a result of the transactions and agreements involving China National Agrochemical Corporation (CNAC), a ChemChina group subsidiary.
During December 2019, as part of Syngenta’s real estate portfolio monetization strategy, Syngenta completed a sale-and-leaseback transaction for two of its global research and development sites.
Restructuring programs
In February 2014, Syngenta announced the AOL restructuring program to drive further improvement in operating income margins and accelerate delivery of operational leverage. The program targeted an improvement in profitability as a percentage of sales over the period up to 2018 from a reduction in the ratios of cost of goods sold, marketing and distribution, research and development and general and administrative expenses to sales. The program included plans to further improve efficiency in customer facing operations, research and development and production and to enable an improvement in the ratio of trade working capital to sales. In 2019, specific initiatives started under the AOL restructuring program were completed and restructuring activity focused on continuing efforts to simplify the management structures and various new productivity initiatives to improve information systems and drive operating efficiencies. Cash spend to complete the AOL program in 2020 was $9 million. Restructuring costs are discussed in further detail in section 6 “Restructuring” below.
Operating and Financial Review and Prospects Financial Report 2020
5
Results of operations
2020 compared with 2019
Sales commentary
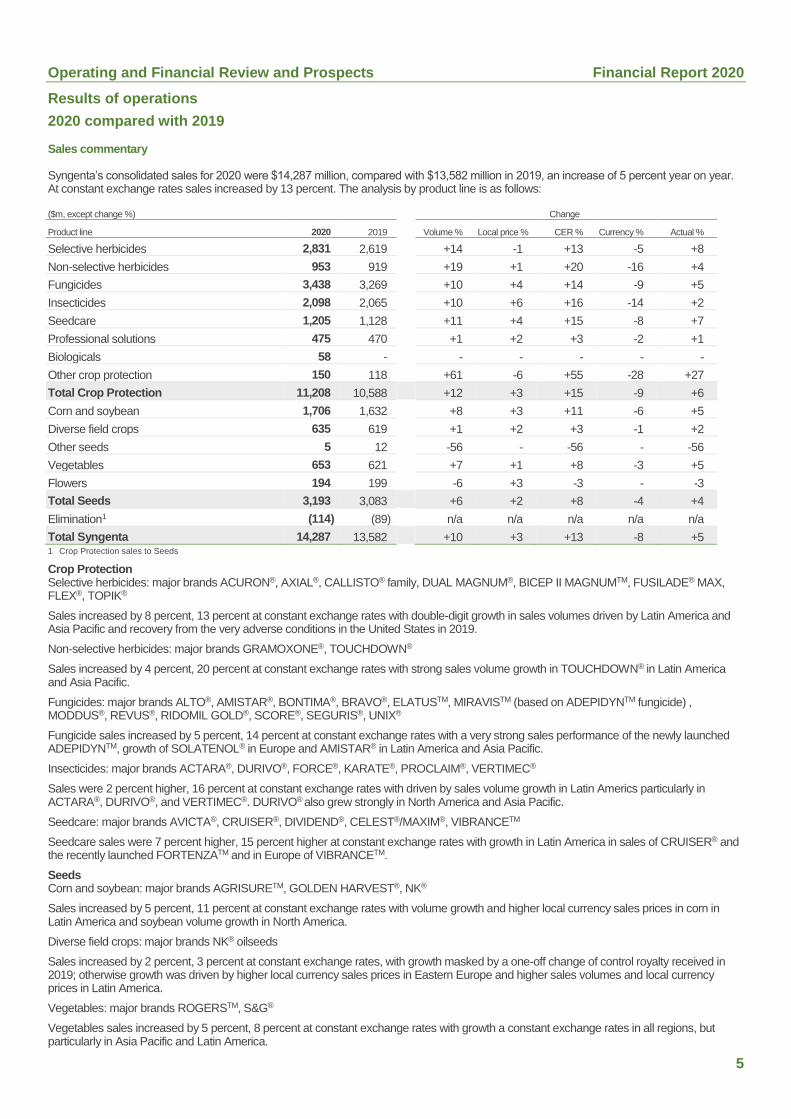
Syngenta’s consolidated sales for 2020 were $14,287 million, compared with $13,582 million in 2019, an increase of 5 percent year on year. At constant exchange rates sales increased by 13 percent. The analysis by product line is as follows:
($m, except change %) Change
Product line 2020 2019 Volume % Local price % CER % Currency % Actual %
Selective herbicides 2,831 2,619 +14 -1 +13 -5 +8
Non-selective herbicides 953 919 +19 +1 +20 -16 +4
Fungicides 3,438 3,269 +10 +4 +14 -9 +5
Insecticides 2,098 2,065 +10 +6 +16 -14 +2
Seedcare 1,205 1,128 +11 +4 +15 -8 +7
Professional solutions 475 470 +1 +2 +3 -2 +1
Biologicals 58 ‐ - - - - -
Other crop protection 150 118 +61 -6 +55 -28 +27
Total Crop Protection 11,208 10,588 +12 +3 +15 -9 +6
Corn and soybean 1,706 1,632 +8 +3 +11 -6 +5
Diverse field crops 635 619 +1 +2 +3 -1 +2
Other seeds 5 12 -56 - -56 - -56
Vegetables 653 621 +7 +1 +8 -3 +5
Flowers 194 199 -6 +3 -3 - -3
Total Seeds 3,193 3,083 +6 +2 +8 -4 +4
Elimination1 (114) (89) n/a n/a n/a n/a n/a
Total Syngenta 14,287 13,582 +10 +3 +13 -8 +5 1 Crop Protection sales to Seeds
Crop Protection Selective herbicides: major brands ACURON®, AXIAL®, CALLISTO® family, DUAL MAGNUM®, BICEP II MAGNUMTM, FUSILADE® MAX, FLEX®, TOPIK®
Sales increased by 8 percent, 13 percent at constant exchange rates with double-digit growth in sales volumes driven by Latin America and Asia Pacific and recovery from the very adverse conditions in the United States in 2019.
Non-selective herbicides: major brands GRAMOXONE®, TOUCHDOWN®
Sales increased by 4 percent, 20 percent at constant exchange rates with strong sales volume growth in TOUCHDOWN® in Latin America and Asia Pacific.
Fungicides: major brands ALTO®, AMISTAR®, BONTIMA®, BRAVO®, ELATUSTM, MIRAVISTM (based on ADEPIDYNTM fungicide) , MODDUS®, REVUS®, RIDOMIL GOLD®, SCORE®, SEGURIS®, UNIX®
Fungicide sales increased by 5 percent, 14 percent at constant exchange rates with a very strong sales performance of the newly launched ADEPIDYNTM, growth of SOLATENOL® in Europe and AMISTAR® in Latin America and Asia Pacific.
Insecticides: major brands ACTARA®, DURIVO®, FORCE®, KARATE®, PROCLAIM®, VERTIMEC®
Sales were 2 percent higher, 16 percent at constant exchange rates with driven by sales volume growth in Latin Americs particularly in ACTARA®, DURIVO®, and VERTIMEC®. DURIVO® also grew strongly in North America and Asia Pacific.
Seedcare: major brands AVICTA®, CRUISER®, DIVIDEND®, CELEST®/MAXIM®, VIBRANCETM
Seedcare sales were 7 percent higher, 15 percent higher at constant exchange rates with growth in Latin America in sales of CRUISER® and the recently launched FORTENZATM and in Europe of VIBRANCETM.
Seeds Corn and soybean: major brands AGRISURETM, GOLDEN HARVEST®, NK®
Sales increased by 5 percent, 11 percent at constant exchange rates with volume growth and higher local currency sales prices in corn in Latin America and soybean volume growth in North America.
Diverse field crops: major brands NK® oilseeds
Sales increased by 2 percent, 3 percent at constant exchange rates, with growth masked by a one-off change of control royalty received in 2019; otherwise growth was driven by higher local currency sales prices in Eastern Europe and higher sales volumes and local currency prices in Latin America.
Vegetables: major brands ROGERSTM, S&G®
Vegetables sales increased by 5 percent, 8 percent at constant exchange rates with growth a constant exchange rates in all regions, but particularly in Asia Pacific and Latin America.
Operating and Financial Review and Prospects Financial Report 2020
6
Flowers: major brands GOLDSMITH® SEEDS, YODER®, SYNGENTA® FLOWER
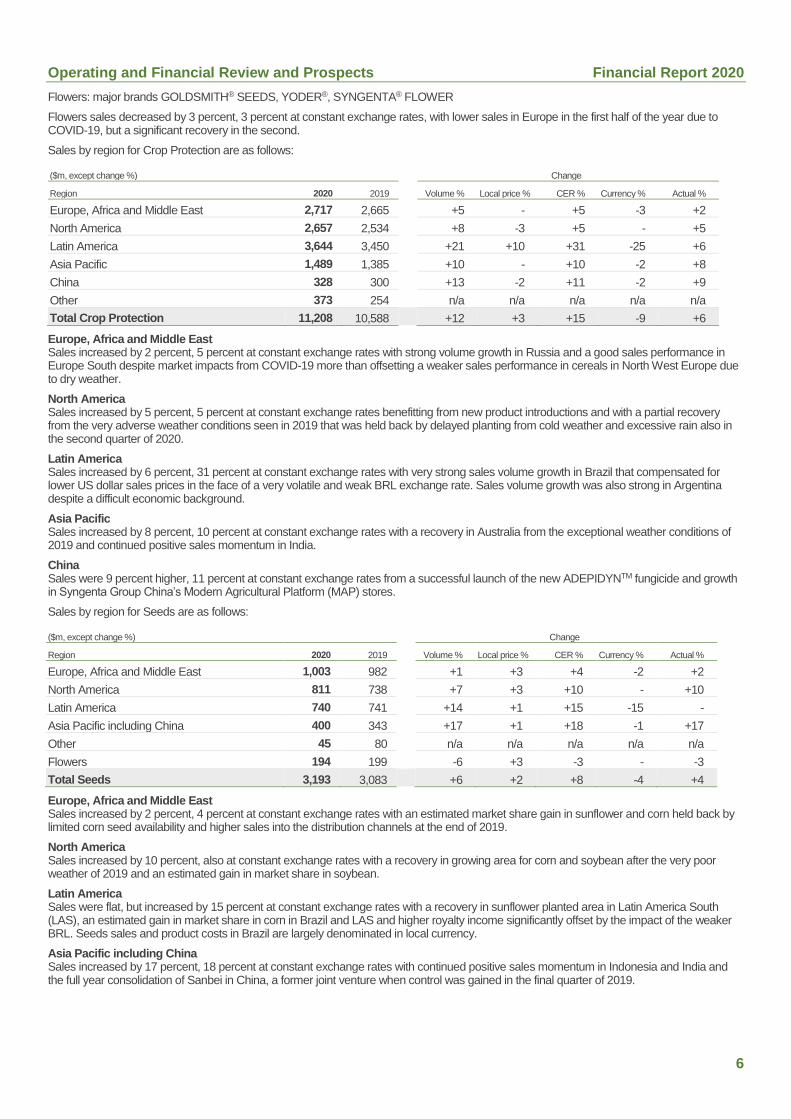
Flowers sales decreased by 3 percent, 3 percent at constant exchange rates, with lower sales in Europe in the first half of the year due to COVID-19, but a significant recovery in the second.
Sales by region for Crop Protection are as follows:
($m, except change %) Change
Region 2020 2019 Volume % Local price % CER % Currency % Actual %
Europe, Africa and Middle East 2,717 2,665 +5 - +5 -3 +2
North America 2,657 2,534 +8 -3 +5 - +5
Latin America 3,644 3,450 +21 +10 +31 -25 +6
Asia Pacific 1,489 1,385 +10 - +10 -2 +8
China 328 300 +13 -2 +11 -2 +9
Other 373 254 n/a n/a n/a n/a n/a
Total Crop Protection 11,208 10,588 +12 +3 +15 -9 +6
Europe, Africa and Middle East Sales increased by 2 percent, 5 percent at constant exchange rates with strong volume growth in Russia and a good sales performance in Europe South despite market impacts from COVID-19 more than offsetting a weaker sales performance in cereals in North West Europe due to dry weather.
North America Sales increased by 5 percent, 5 percent at constant exchange rates benefitting from new product introductions and with a partial recovery from the very adverse weather conditions seen in 2019 that was held back by delayed planting from cold weather and excessive rain also in the second quarter of 2020.
Latin America Sales increased by 6 percent, 31 percent at constant exchange rates with very strong sales volume growth in Brazil that compensated for lower US dollar sales prices in the face of a very volatile and weak BRL exchange rate. Sales volume growth was also strong in Argentina despite a difficult economic background.
Asia Pacific Sales increased by 8 percent, 10 percent at constant exchange rates with a recovery in Australia from the exceptional weather conditions of 2019 and continued positive sales momentum in India.
China Sales were 9 percent higher, 11 percent at constant exchange rates from a successful launch of the new ADEPIDYNTM fungicide and growth in Syngenta Group China’s Modern Agricultural Platform (MAP) stores.
Sales by region for Seeds are as follows:
($m, except change %) Change
Region 2020 2019 Volume % Local price % CER % Currency % Actual %
Europe, Africa and Middle East 1,003 982 +1 +3 +4 -2 +2
North America 811 738 +7 +3 +10 - +10
Latin America 740 741 +14 +1 +15 -15 -
Asia Pacific including China 400 343 +17 +1 +18 -1 +17
Other 45 80 n/a n/a n/a n/a n/a
Flowers 194 199 -6 +3 -3 - -3
Total Seeds 3,193 3,083 +6 +2 +8 -4 +4
Europe, Africa and Middle East Sales increased by 2 percent, 4 percent at constant exchange rates with an estimated market share gain in sunflower and corn held back by limited corn seed availability and higher sales into the distribution channels at the end of 2019.
North America Sales increased by 10 percent, also at constant exchange rates with a recovery in growing area for corn and soybean after the very poor weather of 2019 and an estimated gain in market share in soybean.
Latin America Sales were flat, but increased by 15 percent at constant exchange rates with a recovery in sunflower planted area in Latin America South (LAS), an estimated gain in market share in corn in Brazil and LAS and higher royalty income significantly offset by the impact of the weaker BRL. Seeds sales and product costs in Brazil are largely denominated in local currency.
Asia Pacific including China Sales increased by 17 percent, 18 percent at constant exchange rates with continued positive sales momentum in Indonesia and India and the full year consolidation of Sanbei in China, a former joint venture when control was gained in the final quarter of 2019.
Operating and Financial Review and Prospects Financial Report 2020
7
Operating income
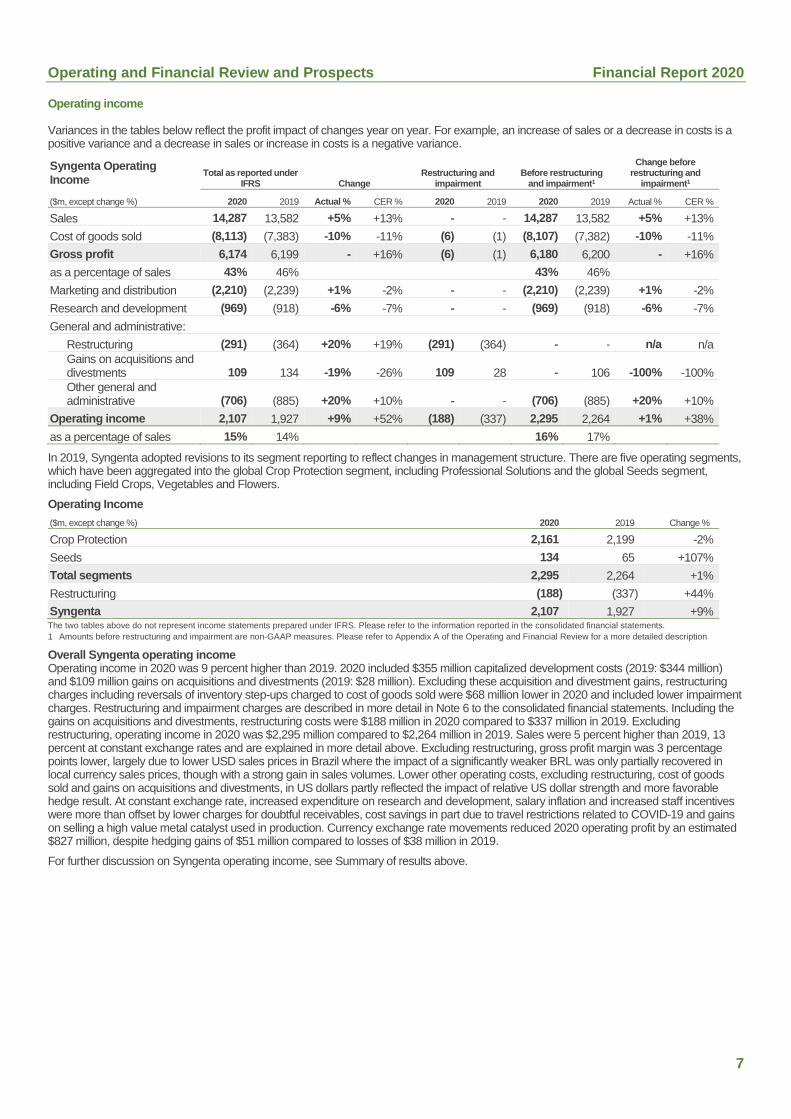
Variances in the tables below reflect the profit impact of changes year on year. For example, an increase of sales or a decrease in costs is a positive variance and a decrease in sales or increase in costs is a negative variance.
Syngenta Operating Income
Total as reported under IFRS Change
Restructuring and impairment
Before restructuring and impairment1
Change before restructuring and
impairment1
($m, except change %) 2020 2019 Actual % CER % 2020 2019 2020 2019 Actual % CER %
Sales 14,287 13,582 +5% +13% ‐ ‐ 14,287 13,582 +5% +13%
Cost of goods sold (8,113) (7,383) -10% -11% (6) (1) (8,107) (7,382) -10% -11%
Gross profit 6,174 6,199 - +16% (6) (1) 6,180 6,200 - +16%
as a percentage of sales 43% 46% 43% 46%
Marketing and distribution (2,210) (2,239) +1% -2% ‐ ‐ (2,210) (2,239) +1% -2%
Research and development (969) (918) -6% -7% ‐ ‐ (969) (918) -6% -7%
General and administrative:
Restructuring (291) (364) +20% +19% (291) (364) ‐ ‐ n/a n/a
Gains on acquisitions and divestments 109 134 -19% -26% 109 28 ‐ 106 -100% -100%
Other general and administrative (706) (885) +20% +10% ‐ ‐ (706) (885) +20% +10%
Operating income 2,107 1,927 +9% +52% (188) (337) 2,295 2,264 +1% +38%
as a percentage of sales 15% 14% 16% 17%
In 2019, Syngenta adopted revisions to its segment reporting to reflect changes in management structure. There are five operating segments, which have been aggregated into the global Crop Protection segment, including Professional Solutions and the global Seeds segment, including Field Crops, Vegetables and Flowers.
Operating Income
($m, except change %) 2020 2019 Change %
Crop Protection 2,161 2,199 -2%
Seeds 134 65 +107%
Total segments 2,295 2,264 +1%
Restructuring (188) (337) +44%
Syngenta 2,107 1,927 +9% The two tables above do not represent income statements prepared under IFRS. Please refer to the information reported in the consolidated financial statements.
1 Amounts before restructuring and impairment are non-GAAP measures. Please refer to Appendix A of the Operating and Financial Review for a more detailed description
Overall Syngenta operating income Operating income in 2020 was 9 percent higher than 2019. 2020 included $355 million capitalized development costs (2019: $344 million) and $109 million gains on acquisitions and divestments (2019: $28 million). Excluding these acquisition and divestment gains, restructuring charges including reversals of inventory step-ups charged to cost of goods sold were $68 million lower in 2020 and included lower impairment charges. Restructuring and impairment charges are described in more detail in Note 6 to the consolidated financial statements. Including the gains on acquisitions and divestments, restructuring costs were $188 million in 2020 compared to $337 million in 2019. Excluding restructuring, operating income in 2020 was $2,295 million compared to $2,264 million in 2019. Sales were 5 percent higher than 2019, 13 percent at constant exchange rates and are explained in more detail above. Excluding restructuring, gross profit margin was 3 percentage points lower, largely due to lower USD sales prices in Brazil where the impact of a significantly weaker BRL was only partially recovered in local currency sales prices, though with a strong gain in sales volumes. Lower other operating costs, excluding restructuring, cost of goods sold and gains on acquisitions and divestments, in US dollars partly reflected the impact of relative US dollar strength and more favorable hedge result. At constant exchange rate, increased expenditure on research and development, salary inflation and increased staff incentives were more than offset by lower charges for doubtful receivables, cost savings in part due to travel restrictions related to COVID-19 and gains on selling a high value metal catalyst used in production. Currency exchange rate movements reduced 2020 operating profit by an estimated $827 million, despite hedging gains of $51 million compared to losses of $38 million in 2019.
For further discussion on Syngenta operating income, see Summary of results above.
Operating and Financial Review and Prospects Financial Report 2020
8
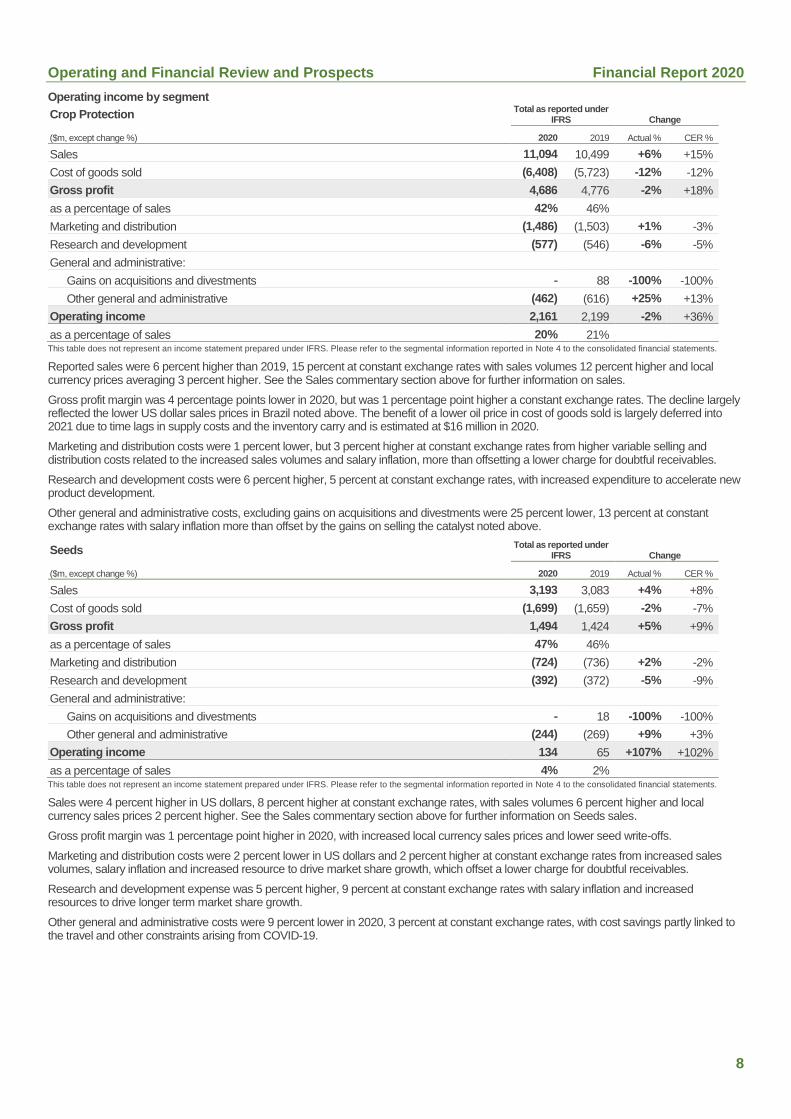
Operating income by segment
Crop Protection Total as reported under
IFRS Change
($m, except change %) 2020 2019 Actual % CER %
Sales 11,094 10,499 +6% +15%
Cost of goods sold (6,408) (5,723) -12% -12%
Gross profit 4,686 4,776 -2% +18%
as a percentage of sales 42% 46%
Marketing and distribution (1,486) (1,503) +1% -3%
Research and development (577) (546) -6% -5%
General and administrative:
Gains on acquisitions and divestments ‐ 88 -100% -100%
Other general and administrative (462) (616) +25% +13%
Operating income 2,161 2,199 -2% +36%
as a percentage of sales 20% 21% This table does not represent an income statement prepared under IFRS. Please refer to the segmental information reported in Note 4 to the consolidated financial statements.
Reported sales were 6 percent higher than 2019, 15 percent at constant exchange rates with sales volumes 12 percent higher and local currency prices averaging 3 percent higher. See the Sales commentary section above for further information on sales.
Gross profit margin was 4 percentage points lower in 2020, but was 1 percentage point higher a constant exchange rates. The decline largely reflected the lower US dollar sales prices in Brazil noted above. The benefit of a lower oil price in cost of goods sold is largely deferred into 2021 due to time lags in supply costs and the inventory carry and is estimated at $16 million in 2020.
Marketing and distribution costs were 1 percent lower, but 3 percent higher at constant exchange rates from higher variable selling and distribution costs related to the increased sales volumes and salary inflation, more than offsetting a lower charge for doubtful receivables.
Research and development costs were 6 percent higher, 5 percent at constant exchange rates, with increased expenditure to accelerate new product development.
Other general and administrative costs, excluding gains on acquisitions and divestments were 25 percent lower, 13 percent at constant exchange rates with salary inflation more than offset by the gains on selling the catalyst noted above.
Seeds Total as reported under
IFRS Change
($m, except change %) 2020 2019 Actual % CER %
Sales 3,193 3,083 +4% +8%
Cost of goods sold (1,699) (1,659) -2% -7%
Gross profit 1,494 1,424 +5% +9%
as a percentage of sales 47% 46%
Marketing and distribution (724) (736) +2% -2%
Research and development (392) (372) -5% -9%
General and administrative:
Gains on acquisitions and divestments ‐ 18 -100% -100%
Other general and administrative (244) (269) +9% +3%
Operating income 134 65 +107% +102%
as a percentage of sales 4% 2% This table does not represent an income statement prepared under IFRS. Please refer to the segmental information reported in Note 4 to the consolidated financial statements.
Sales were 4 percent higher in US dollars, 8 percent higher at constant exchange rates, with sales volumes 6 percent higher and local currency sales prices 2 percent higher. See the Sales commentary section above for further information on Seeds sales.
Gross profit margin was 1 percentage point higher in 2020, with increased local currency sales prices and lower seed write-offs.
Marketing and distribution costs were 2 percent lower in US dollars and 2 percent higher at constant exchange rates from increased sales volumes, salary inflation and increased resource to drive market share growth, which offset a lower charge for doubtful receivables.
Research and development expense was 5 percent higher, 9 percent at constant exchange rates with salary inflation and increased resources to drive longer term market share growth.
Other general and administrative costs were 9 percent lower in 2020, 3 percent at constant exchange rates, with cost savings partly linked to the travel and other constraints arising from COVID-19.

Operating and Financial Review and Prospects Financial Report 2020
9
Defined Benefit Pensions
Defined benefit pension expense was $95 million in 2020 compared with $97 million in 2019.
Syngenta contributions to defined benefit pension plans were $174 million in 2020 compared with $128 million in 2019. In 2021, Syngenta expects contributions to defined benefit pension plans, excluding early retirement contributions associated with restructuring actions, to decrease to approximately $130 million due to an additional $40 million deficit reduction payment made to the UK Pension Plan in 2020.
Restructuring and impairment
Restructuring and impairment charges for the years ended December 31, 2020 and 2019, broken down into the main restructuring initiatives, consist of the following:
($m) 2020 2019
Accelerating operational leverage and other productivity programs:
Cash costs 55 61
Non-cash costs ‐ ‐
Acquisition, divestment and related costs:
Other acquisition and related integration costs 55 45
Non-cash items 6 9
Other restructuring and impairment:
Cash costs 51 73
Non-cash costs and other non-current asset impairments 130 177
Total 297 365
In 2020, $6 million for the reversal of inventory step ups reported on acquisitions is presented within Cost of goods sold in the consolidated income statement (2019: $1 million). The other costs above for the years ended December 31, 2020 and 2019 are presented within Restructuring in the consolidated income statement.
In addition to the above, $109 million (2019: $28 million) of acquisition and divestment gains were recognized as described in Note 3 to the consolidated financial statements.
Analysis of restructuring costs
2020 Accelerating operational leverage and other productivity programs Cash costs of $55 million, including $29 million of severance charges, were incurred for productivity initiatives consisting of $26 million incurred to better align the organization in EAME with the business strategies, $10 million for system projects, including digital tools and automation initiatives and an upgraded financial reporting and analytics platform and $19 million across a number of individually small initiatives driving operational efficiencies.
Acquisition, divestment and related costs Cash costs include $24 million incurred for merger and acquisition projects and other transaction costs, $17 million incurred for integration projects and $14 million of costs related to the formation of the Syngenta Group, described in Note 14, consisting of communications, consultancy and project management office expenses. Non-cash costs are the reversal of inventory step-ups reported on acquisitions.
Other restructuring Other cash costs consist of $21 million related to the closure of a manufacturing site in the USA announced in June 2019, $10 million related to transitioning the acquired manufacturing facility described in Note 3 to optimal capacity and $9 million to provide for a Seeds development contract where forecasted demand is less than minimum future commitments. Further costs of $11 million were incurred for strategic alignment, mainly in the Seeds business.
Other non-current asset impairments consist of $26 million for capitalized development costs, $23 million to write off the value of a collaboration agreement where the value of the development project has proven too costly to pursue, $19 million to write down unusable inventories acquired in previous acquisition transactions, $46 million of tangible, intangible and right-of-use asset impairments related to assets disposed or transferred to held-for-sale, and $16 million for other smaller impairments where asset values are not supported by future business plans.
2019 Accelerating operational leverage and other productivity programs Cash costs of $61 million, including $36 million of severance and pension charges, $12 million of consultancy and external services costs and $4 million for information systems projects, were incurred for the completion of projects started under the Accelerating Operational Leverage program and further productivity initiatives to simplify the layers of management, including at the global headquarters.
Acquisition, divestment and related costs Cash costs for acquisition and related integration costs include $20 million for merger and acquisition projects and other transaction costs and $25 million for integration projects, particularly related to the Nidera acquisition completed in 2018. Non-cash costs include $8 million for the loss incurred to acquire control of Sanbei Seeds, previously an Associate, and $1 million for the reversal of inventory step ups reported on acquisitions.
Operating and Financial Review and Prospects Financial Report 2020
10
Other restructuring Cash costs consist of $39 million related to the closure of a manufacturing site in the USA announced in June 2019, including charges to provide for environmental remediation and severance, $24 million to provide for a seeds processing contract where forecast demand is less than minimum future commitments and $10 million of costs incurred to relocate the Seeds operations in the USA.
Other non-current asset impairments consist of $92 million for property, plant and equipment and $15 million for maintenance spares and other unusable inventories at the closing manufacturing site; $41 million for capitalized agreements related to a seed technology where future value is expected to be lower than previous projections due to increasing competition and a reduced market; $17 million for sites that are expected to be sold during 2020; $10 million for a licensing agreement that has been terminated, and $2 million of other small impairments.
Financial expense, net
Financial expense, net increased by $72 million in 2020 to $497 million. Net interest expense at $378 million was $9 million higher than 2019 due mainly to an increased average level of factoring. Currency-related financial expenses in 2020 of $91 million were $65 million higher than 2019 due to lower hedge income in Syngenta’s Swiss franc exposure from the lower gap between US dollar and Swiss franc short term interest rates and to increased hedging costs in Argentina.
Taxes
In 2020, Syngenta recorded net tax expense of $188 million on a profit before taxes of $1,610 million, an effective tax rate of 12 percent. The 2020 effective rate reflects the effects of the US CARES Act, closure of tax audits where the outcome differed significantly from the position previously expected and the effect of recognition and derecognition of deferred tax assets. Syngenta’s Swiss domestic applicable statutory tax rates have changed due to the Swiss tax reform for some cantons in 2019 and for others in 2020. The Swiss tax rates range from 13 to 19 percent.
In Basel-Stadt, the canton where Syngenta has its headquarters, the ordinary effective tax rate is 13 percent in 2020 (2019: 13 percent). Certain intellectual property income is subject to tax at a reduced rate.
In 2019, Syngenta recorded net tax expense of $47 million on a profit before taxes of $1,503 million, an effective tax rate of 3 percent. A 12 percent rate change impact was seen in 2019 due to the $195 million favorable one-time impact caused by the Swiss tax reform.
Income taxed at different rates increased the effective tax rate by 3 percent in 2020. This item includes rate differences from the domestic Swiss tax rate attributable to income generated from in-market distributor companies that are taxable at higher rates. A 3 percent decrease in 2020 has been caused by income not subject to tax and other non-tax deductible expenditures.
A write-down of investments for local tax purposes decreased the effective tax rate by 1 percent whereas changes in statutory tax rates in various countries increased it by 1 percent. Recognition of deferred tax assets on temporary differences in the US and tax losses in Brazil decreased the effective tax rate by 2 percent each.
Changes to prior year income tax estimates and other tax items increased the tax rate by 2 percent in 2020. This includes the CARES Act impact, a law intended to address the economic fallout of the COVID-19 pandemic in the US, which came into effect on March 27, 2020. Among many other provisions, the CARES Act increases the tax deduction for net operating losses from 80 percent to 100 percent, for 2018, 2019, and 2020 and allows net operating losses from 2018, 2019, and 2020 to be carried back to up to five years, resulting in retroactive tax refunds, decreasing the tax rate by 2 percent in 2020. Non-recognition of deferred taxes in Brazil, Zambia and Philippines increased the tax rate by 1 percent.
The tax rate on restructuring and impairment was 25 percent in 2020 compared with a tax rate of 21 percent in 2019. Most charges are tax deductible and are mainly caused by expenses in Switzerland, the US, Brazil, France and China. Future rates applicable to restructuring and impairment will be dependent on the nature and size of the charges and may vary from year to year.
Net income for the period and other supplementary income data
Net income attributable to Syngenta’s shareholder in 2020 was $1,421 million, compared to $1,450 million in 2019.
Sales in 2020 were 5 percent higher than 2019 and operating income margin was 0.5 percentage points higher in 2020 than 2019 as noted above. After the higher financial expense, income before taxes was 7 percent higher in 2020. The 2020 tax rate was 12 percent, compared to 3 percent in 2019 as described above. After this higher tax rate, net income in 2020 was 2 percent lower than 2019.
After related taxation, restructuring and impairment expense was $127 million lower at $140 million in 2020 compared with $267 million in 2019, which reflected lower restructuring charges, including a reduced level of non-cash costs and other non-current asset impairments and acquisition and divestment gains described in Note 3 to the consolidated financial statements.
Foreign operations and foreign currency transactions
Syngenta’s subsidiaries use their local currency as their functional currency for accounting purposes except where the use of a different currency more fairly reflects their actual circumstances.
Syngenta operates worldwide and its business has grown significantly in emerging markets over the last years, with a broadening of the currency effects that need to be closely monitored. Syngenta regularly analyzes how currency fluctuations will impact its operating results and manages the impact with a combination of commercial actions, such as product pricing, and financial risk management strategies, such as hedging. Next to the Euro, the Swiss franc and the British pound, the Brazilian real gives rise to a major currency exposure due to the large size of Syngenta’s business activities in Brazil. Sales prices to customers in Brazil largely are linked to the US dollar, which limits the impact of fluctuations in the US dollar/Brazilian real exchange rate. Similarly, Syngenta manages its currency exposure in Argentina and parts of the CIS, mainly Russia and particularly the Ukraine, by linking local currency sales prices to the US dollar to compensate for the fluctuations in sales value from the currency devaluation. During 2020, the Argentine peso devalued by 41 percent against the US dollar, the Russian ruble by 20 percent and the Ukrainian hryvnia by 19 percent.
Operating and Financial Review and Prospects Financial Report 2020
11
Syngenta regularly monitors receivables exposure in all countries in which it operates. In the Eurozone, Greece, Italy, Portugal and Spain have experienced weak macro-economic conditions. In recent years, Syngenta has increased sales significantly in East Europe where exchange rate volatility and other macroeconomic factors cause overall credit risk to be higher. In Latin America, Argentina and Brazil have also been experiencing economic and financial difficulties and this has led to constraints in the availability of credit. In Argentina the economy has been hyperinflationary since the middle of 2018 putting pressure on liquidity. In Venezuela, exchanging local currency into US dollars to pay for imported goods continues to be difficult. Although the COVID-19 pandemic has created economic uncertainty impacting global markets, including currency values and commodity prices, agriculture has continued to operate as an essential activity in most countries.
The decrease in gross trade receivables is mainly attributable to Argentina, where a very strong collection performance was experienced in 2020, compared to a declining collection performance in 2019, and to Russia, where collection times also improved significantly from 2019. Receivables exposure from customers in Russia and the Ukraine decreased during 2020, with 60 percent of 2020 sales in those countries having been collected as of December 31, 2020 compared with 50 percent of 2019 sales. Trade receivables past due for more than 180 days increased in the Ukraine, but decreased in all the other above named countries. The provision for doubtful trade receivables declined significantly in Argentina and Brazil.
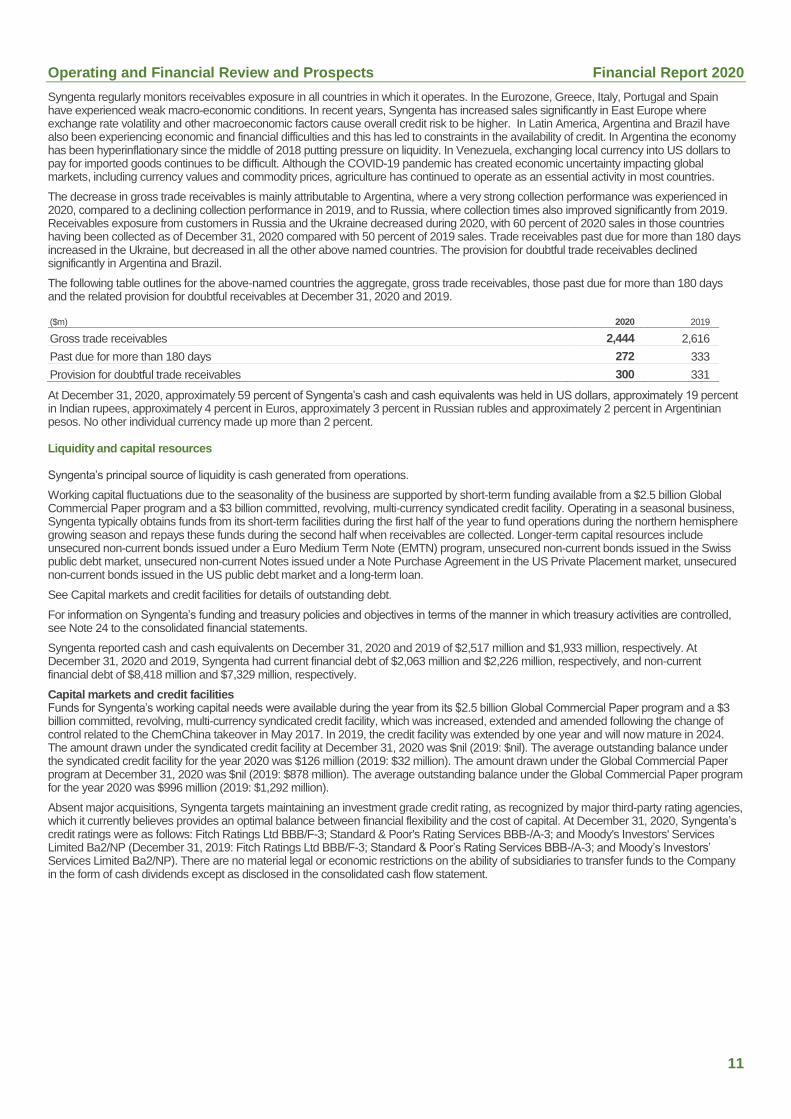
The following table outlines for the above-named countries the aggregate, gross trade receivables, those past due for more than 180 days and the related provision for doubtful receivables at December 31, 2020 and 2019.
($m) 2020 2019
Gross trade receivables 2,444 2,616
Past due for more than 180 days 272 333
Provision for doubtful trade receivables 300 331
At December 31, 2020, approximately 59 percent of Syngenta’s cash and cash equivalents was held in US dollars, approximately 19 percent in Indian rupees, approximately 4 percent in Euros, approximately 3 percent in Russian rubles and approximately 2 percent in Argentinian pesos. No other individual currency made up more than 2 percent.
Liquidity and capital resources
Syngenta’s principal source of liquidity is cash generated from operations.
Working capital fluctuations due to the seasonality of the business are supported by short-term funding available from a $2.5 billion Global Commercial Paper program and a $3 billion committed, revolving, multi-currency syndicated credit facility. Operating in a seasonal business, Syngenta typically obtains funds from its short-term facilities during the first half of the year to fund operations during the northern hemisphere growing season and repays these funds during the second half when receivables are collected. Longer-term capital resources include unsecured non-current bonds issued under a Euro Medium Term Note (EMTN) program, unsecured non-current bonds issued in the Swiss public debt market, unsecured non-current Notes issued under a Note Purchase Agreement in the US Private Placement market, unsecured non-current bonds issued in the US public debt market and a long-term loan.
See Capital markets and credit facilities for details of outstanding debt.
For information on Syngenta’s funding and treasury policies and objectives in terms of the manner in which treasury activities are controlled, see Note 24 to the consolidated financial statements.
Syngenta reported cash and cash equivalents on December 31, 2020 and 2019 of $2,517 million and $1,933 million, respectively. At December 31, 2020 and 2019, Syngenta had current financial debt of $2,063 million and $2,226 million, respectively, and non-current financial debt of $8,418 million and $7,329 million, respectively.
Capital markets and credit facilities Funds for Syngenta’s working capital needs were available during the year from its $2.5 billion Global Commercial Paper program and a $3 billion committed, revolving, multi-currency syndicated credit facility, which was increased, extended and amended following the change of control related to the ChemChina takeover in May 2017. In 2019, the credit facility was extended by one year and will now mature in 2024. The amount drawn under the syndicated credit facility at December 31, 2020 was $nil (2019: $nil). The average outstanding balance under the syndicated credit facility for the year 2020 was $126 million (2019: $32 million). The amount drawn under the Global Commercial Paper program at December 31, 2020 was $nil (2019: $878 million). The average outstanding balance under the Global Commercial Paper program for the year 2020 was $996 million (2019: $1,292 million).
Absent major acquisitions, Syngenta targets maintaining an investment grade credit rating, as recognized by major third-party rating agencies, which it currently believes provides an optimal balance between financial flexibility and the cost of capital. At December 31, 2020, Syngenta’s credit ratings were as follows: Fitch Ratings Ltd BBB/F-3; Standard & Poor's Rating Services BBB-/A-3; and Moody's Investors' Services Limited Ba2/NP (December 31, 2019: Fitch Ratings Ltd BBB/F-3; Standard & Poor’s Rating Services BBB-/A-3; and Moody’s Investors’ Services Limited Ba2/NP). There are no material legal or economic restrictions on the ability of subsidiaries to transfer funds to the Company in the form of cash dividends except as disclosed in the consolidated cash flow statement.

Operating and Financial Review and Prospects Financial Report 2020
12
The table below summarizes Syngenta’s unsecured notes in issuance at December 31, 2020:
($m) Issuance date Carrying amount Value at issue
1.875% Eurobond 2021 March 2014 614 689
3.933% US dollar bond 2021 April 2018 750 750
3.125% US dollar bond 2022 March 2012 514 500
0.125% CHF bond 2022 February 2020 227 207
4.441% USD bond 2023 April 2018 997 1,000
1.250% CHF bond 2023 September 2020 301 287
1.625% CHF bond 2024 March 2014 283 283
4.892% USD bond 2025 April 2018 747 750
5.350% US dollar private placement 2025 December 2005 55 55
3.375% Eurobond 2026 March 2020 1,125 1,008
0.700% CHF bond 2026 February 2020 159 145
1.250% Eurobond 2027 March 2015 610 559
5.182% USD bond 2028 April 2018 996 1,000
2.125% CHF bond 2029 March 2014 170 170
5.590% US dollar private placement 2035 December 2005 11 11
4.375% US dollar bond 2042 March 2012 248 250
5.676% USD bond 2048 April 2018 498 500
Total 8,305 8,164
In addition, Syngenta has a long-term loan with a floating interest rate which matures in 2024. The balance at December 31, 2020 was $1,000 million (2019: $500 million).
Other than refinancing future maturing bonds over the short to medium term, management is of the opinion that, absent a major business acquisition or a very significant deterioration in working capital or the rate of receivables collections from that currently expected, the funding available from the sources described above will be sufficient to satisfy Syngenta’s working capital, capital expenditures and debt service requirements for the foreseeable future, including cash expenditures relating to restructuring programs. In the event of a major business acquisition, Syngenta would seek additional funding from capital markets or other sources. Syngenta regards as sufficiently remote the likelihood that a very significant deterioration in working capital or unexpected decline in the rate of receivables collections will occur as not to require the development of a detailed contingency funding plan.
Cash flow The following table sets out certain information about cash flow for each of the periods indicated:
Year ended December 31,
($m) 2020 2019
Cash flow from operating activities 2,050 838
Cash flow used for investing activities (1,337) (248)
Cash flow used for financing activities (124) (204)
Cash flow from operating activities 2020 compared with 2019 Cash flow from operating activities increased by $1,212 million to $2,050 million in 2020. 2019 included the payment of $1,110 million related to the settlement of the US AGRISURE VIPTERA® litigation. Income before taxes after the reversal of non-cash and other reconciling items was $2,860 million in 2020 compared to $2,805 million in 2019. Cash paid in respect of other provisions, which included the above litigation amounts, was $1,105 million lower than 2019. Other financial receipts were $63 million lower in 2020 due to settlement of derivative contracts, and Other financial payments were $349 million higher in 2020 due to higher derivative settlements and realized currency losses. Change in net working capital was an inflow of $496 million in 2020 compared to $27 million in 2019. Change in inventories was an outflow of $277 million in 2020 compared to $701 million in 2019, with an inventory build in Crop Protection in 2019 in anticipation of sales volume growth in 2020 more than a further build in 2020 from accelerated purchases to reduce risk of supply shortages from COVID-19. Change in trade and other working capital assets was an outflow of $148 million in 2020 compared to an inflow of $125 million in 2019; trade receivables were an outflow in 2020 despite being lower as a percentage of sales than 2019, with overdues also reduced and other working capital assets increased from higher VAT recoverable and third party advances. The level of factoring was broadly flat with the level at the end of 2019. Change in trade and other working capital liabilities was an inflow of $921 million in 2020 compared to $603 million in 2019, with a further increase in trade payables as a percentage of sales, including an increase in supplier financing programs with key suppliers and higher accruals for staff incentives.
Cash flow used for investing activities 2020 compared with 2019 Cash flow used for investing activities was $1,337 million in 2020, $1,089 million higher than in 2019. Additions to property, plant and equipment were $34 million higher. Purchases of intangible assets were $46 million higher, with an increase in purchases of product rights. Purchases of investments in associates and other financial assets were $38 million higher mainly due to net purchases of marketable securities in 2020, compared to net sales in 2019. Proceeds from disposals of property, plant and equipment were $489 million lower due to the sale and leaseback of buildings in Switzerland and the UK in 2019, while proceeds from disposals of intangible and financial assets decreased by $150 million due mainly to the net sales of marketable securities in 2019. Cash for business acquisitions was an outflow of
Operating and Financial Review and Prospects Financial Report 2020
13
$324 million in 2020 including the acquisition of Valagro S.p.A., compared to an inflow of $8 million in 2019 due to cash acquired with Sanbei Seeds.
Cash flow used for financing activities 2020 compared with 2019 Cash flow used for financing activities of $124 million was $80 million lower than in 2019. Net cash received from interest-bearing debt decreased by $80 million. In 2020 Syngenta issued $1.8 billion of new bonds, raised a $500 million term loan, repaid a $750 million bond at maturity and had no commercial paper outstanding at the end of the year; in 2019 Syngenta issued $828 million of commercial paper, raised a term loan of $500 million and repaid a CHF350 million bond maturity. Syngenta paid $39 million in 2020 to acquire the remaining non-controlling interest in one of its subsidiaries, Syngenta India Ltd. The dividend paid to shareholders in 2020 was $700 million, compared to $900 million in 2019.
Research and development (“R&D”)
Syngenta’s Research and Development organization is dedicated to developing quality crop protection and seeds products, as well as crop-focused solutions which integrate multiple technologies. R&D focuses on taking a holistic approach to help customers grow their specific crop using the best technology to address their needs, be it a single technology, a combination of technologies, or technologies and services.
Syngenta is committed to improving crop yield and quality in a sustainable way and, through its global product safety group and global regulatory team, is committed to developing and registering products that are safe and effective. Syngenta maximizes its innovation potential by leveraging its industry expertise and partnering with other technology leaders across the globe.
The total spent on research and development was $1,324 million in 2020 and $1,262 million in 2019. This included $355 million (2019: $344 million) of internal product development costs that were capitalized. For the attribution of research and development costs to reported operating segments, see Note 4 to the consolidated financial statements.
There are no off-balance sheet financing transactions associated with research and development activity.
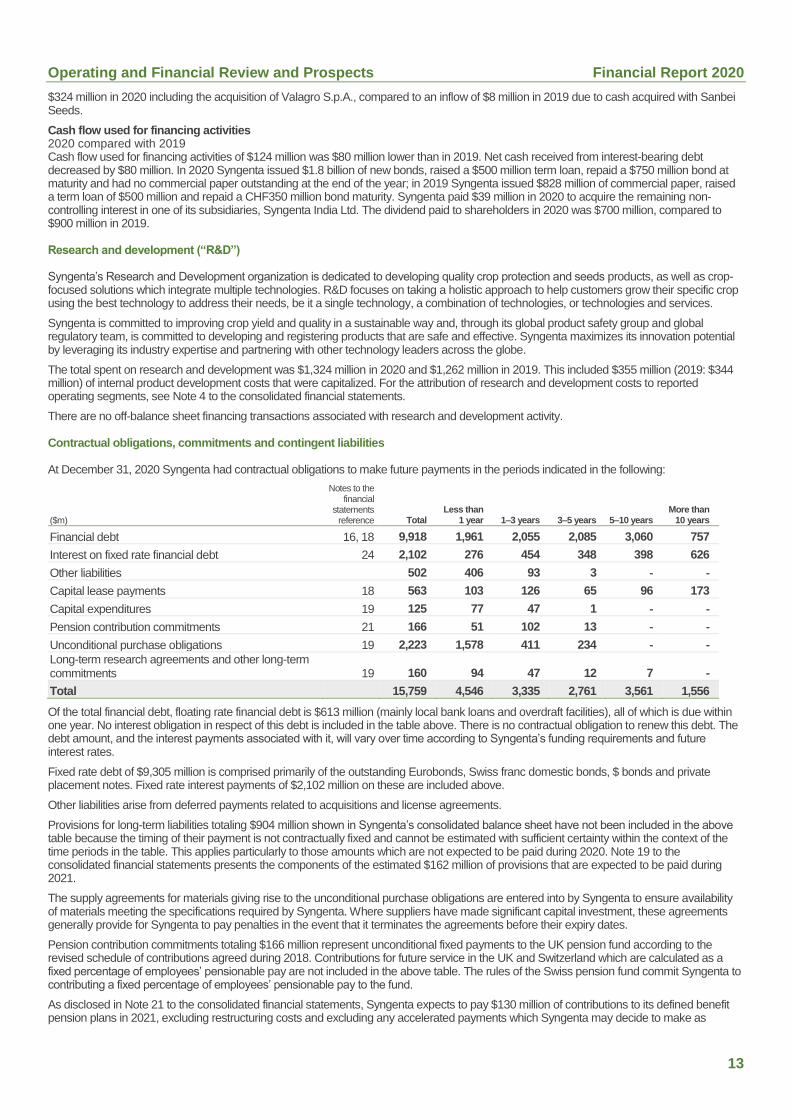
Contractual obligations, commitments and contingent liabilities
At December 31, 2020 Syngenta had contractual obligations to make future payments in the periods indicated in the following:
($m)
Notes to the financial
statements reference Total
Less than 1 year 1–3 years 3–5 years 5–10 years
More than 10 years
Financial debt 16, 18 9,918 1,961 2,055 2,085 3,060 757
Interest on fixed rate financial debt 24 2,102 276 454 348 398 626
Other liabilities 502 406 93 3 ‐ ‐
Capital lease payments 18 563 103 126 65 96 173
Capital expenditures 19 125 77 47 1 ‐ ‐
Pension contribution commitments 21 166 51 102 13 ‐ ‐
Unconditional purchase obligations 19 2,223 1,578 411 234 ‐ ‐ Long-term research agreements and other long-term commitments 19 160 94 47 12 7 ‐
Total 15,759 4,546 3,335 2,761 3,561 1,556
Of the total financial debt, floating rate financial debt is $613 million (mainly local bank loans and overdraft facilities), all of which is due within one year. No interest obligation in respect of this debt is included in the table above. There is no contractual obligation to renew this debt. The debt amount, and the interest payments associated with it, will vary over time according to Syngenta’s funding requirements and future interest rates.
Fixed rate debt of $9,305 million is comprised primarily of the outstanding Eurobonds, Swiss franc domestic bonds, $ bonds and private placement notes. Fixed rate interest payments of $2,102 million on these are included above.
Other liabilities arise from deferred payments related to acquisitions and license agreements.
Provisions for long-term liabilities totaling $904 million shown in Syngenta’s consolidated balance sheet have not been included in the above table because the timing of their payment is not contractually fixed and cannot be estimated with sufficient certainty within the context of the time periods in the table. This applies particularly to those amounts which are not expected to be paid during 2020. Note 19 to the consolidated financial statements presents the components of the estimated $162 million of provisions that are expected to be paid during 2021.
The supply agreements for materials giving rise to the unconditional purchase obligations are entered into by Syngenta to ensure availability of materials meeting the specifications required by Syngenta. Where suppliers have made significant capital investment, these agreements generally provide for Syngenta to pay penalties in the event that it terminates the agreements before their expiry dates.
Pension contribution commitments totaling $166 million represent unconditional fixed payments to the UK pension fund according to the revised schedule of contributions agreed during 2018. Contributions for future service in the UK and Switzerland which are calculated as a fixed percentage of employees’ pensionable pay are not included in the above table. The rules of the Swiss pension fund commit Syngenta to contributing a fixed percentage of employees’ pensionable pay to the fund.
As disclosed in Note 21 to the consolidated financial statements, Syngenta expects to pay $130 million of contributions to its defined benefit pension plans in 2021, excluding restructuring costs and excluding any accelerated payments which Syngenta may decide to make as
Operating and Financial Review and Prospects Financial Report 2020
14
business and financial market conditions develop during 2020. $51 million of those contributions are included as commitments in the table above. The remaining $79 million represents 2021 service contributions, which are not included as commitments in the table above.
The above table excludes income tax liabilities of $491 million in respect of uncertain tax positions. These are presented within current income tax liabilities in the consolidated balance sheet because it is not possible to make a reasonably reliable estimate of the actual period of cash settlement with the respective taxing authorities.
Off-balance sheet arrangements
Syngenta had no off-balance sheet arrangements as at December 31, 2020, other than the above contractual obligations, commitments and contingent liabilities. Syngenta has no unconsolidated special purpose entities that are likely to create material contingent obligations.
Critical accounting estimates
Critical accounting estimates and new accounting pronouncements are discussed in Notes 2 and 26 to the consolidated financial statements.
Recent developments
Note 27 to the consolidated financial statements provides details of events which occurred between the balance sheet date and February 3, 2021 that would require adjustment to or disclosure in the consolidated financial statements.
Operating and Financial Review and Prospects Financial Report 2020
15
Trend and Outlook
Sales in 2020 were 5 percent higher than in 2019, 6 percent excluding royalties received related to change of control, including estimated market share growth, particularly in the Seeds business, but also in several of the main Crop Protection markets. Underlying sales revenue is currently expected overall to grow at a similar mid-single digits level in 2021 in crop protection and seeds markets that are both expected to continue to show low single-digit growth.
Based on exchange rates prevailing at the date of publication, currency movements are expected to have a low single digit favorable impact on 2021 sales relative to 2020. The impact of exchange rate movements on operating income is discussed below.
Syngenta will continue to focus on and drive productivity savings in 2021. Research and development expenditure was approximately 9.2 percent of sales excluding the capitalization of certain development costs; overall, before capitalizing development costs, expenditure as a percentage of sales is expected to be at a broadly similar level in 2021 at constant exchange rates. Capitalized costs are currently expected at a similar level as 2020. Marketing and distribution costs currently are expected broadly to grow in line with sales, with productivity savings reinvested to support market share growth, particularly in Seeds, further growth in mid-tier markets in Crop Protection in Latin America and China and with a full year of Valagro, acquired in 2020. General and administrative costs (excluding restructuring) in 2020 included gains on the sale of high value metal catalysts; similar gains are not currently expected to recur in 2021 and General and administrative costs accordingly currently are expected to show reported growth above the level of sales growth.
In 2020, Syngenta recorded a pre-tax gain on acquisitions and divestments of $109 million as noted above; no similar gain is expected to be recorded in 2021. Restructuring charges in 2020 included non-cash costs and other non-current asset impairments of $130 million within Other restructuring and impairment; it is generally not possible to forecast future non-cash impairments. Cash restructuring costs in 2020 totaled $161 million. Further productivity and other restructuring programs will continue in 2020 and charges currently are foreseen at a broadly similar level. However, in general, the timing of the recognition of charges for particular restructuring events, which is dependent on when irreversible commitments to the events occur, makes it difficult to predict such costs with certainty.
In 2019, oil prices (Brent) traded in a range between $50 and $75 per barrel, with the peak in April. In 2020, prices were very volatile and traded in a range from approximately $70 per barrel at the start of the year to below $10 in April, recovering to approximately $50 by the end of the year. The average of monthly prices in 2020 was approximately $47 per barrel, compared to approximately $62 in 2019 and approximately $68 per barrel in 2018. With its current product mix and at these relatively low oil prices, Syngenta estimates that each $10 movement in the price of a barrel of oil impacts its Cost of goods sold by approximately $22 million to $24 million. However, due to supplier production chains and Syngenta’s own inventory, it can take from nine to 12 months for movements in the oil price to feed through into Cost of goods sold, so that the impact of oil prices on Cost of goods sold in 2021 is largely driven by changes between 2019 and 2020. Subsequent price movements take time to pass through to Syngenta’s cost of goods but increases ultimately may have an adverse impact if Syngenta is not able to pass on the increase through increased sales prices. In 2020, Syngenta estimates that disruption to logistics due to the COVID-19 virus increased costs by approximately $17 million. It is not possible to predict the extent to which further disruption will impact on costs in 2021; in particular, a current shortage in shipping containers may have an adverse impact on supply costs.
In 2020, 57 percent of Syngenta’s sales were in emerging markets. Emerging markets continue to have higher long-term growth potential because significant crop yield gaps exist versus developed markets; this growth potential is further supported by ongoing technology adoption. Managing volatility in such markets, in particular credit and currency exposures, is integral to Syngenta’s business model.
Overall, Syngenta has significant currency exposures, which at a high level can be summarized as:
a short position against the US dollar in Swiss francs and British pounds;
a net long position in Euros over the course of a full year, relatively minor compared with sales in Euros, but with a long position in the first half selling season and a short position in the second half from more evenly spread Euro-based operating costs including raw material costs;
a long position in Japanese yen, Australian and Canadian dollars and many emerging market currencies.
In Brazil and Argentina, a significant portion of sales are effectively priced in US dollars, resulting in a net short local currency exposure, though the linkage has weakened in Brazil, particularly in 2020, and there can be a time lag before local currency prices are adjusted. Syngenta has also acted to link local currency pricing of sales in Russia and particularly the Ukraine (both of which export grain to the global market) to US dollars to reduce the long exposure to these currencies.
Forecast transaction exposures in the major currencies are hedged under a rolling 12-month program, largely through forward contracts. In 2020, Syngenta estimates the net impact on underlying sales and operating costs of exchange rate movements to have been approximately $918 million adverse to 2019, which together with a net hedging gain of $51 million compared with a cost of $38 million in 2019, resulted in an adverse year-on-year impact on operating income from exchange rate movements of approximately $829 million when compared with 2019. The largest driver of the adverse underlying net impact was a weaker Brazilian real; accordingly, the negative exchange movement impact was partly offset by local currency sales price increases as noted above. At rates prevailing in January 2021, Syngenta expects only positive impact on sales but a low to mid-single digit adverse impact on operating income from the currency movements relative to 2020, including the impact of a stronger Swiss franc, Chinese renminbi and British pound on operating costs. A significant portion of emerging market currency exposures in particular are unhedged, so the actual impact may differ positively or negatively from the above estimate. The net hedging result is reported within General and administrative in the consolidated income statement.
Operating and Financial Review and Prospects Financial Report 2020
16
Appendix A
Reconciliation of non-GAAP measures to equivalent GAAP measures A non-GAAP measure is a numerical measure of financial performance, financial position or cash flows that either:
includes, or is subject to adjustments that have the effect of including, amounts that are excluded in the most directly comparable measure calculated and presented under IFRS; or
excludes, or is subject to adjustments that have the effect of excluding, amounts that are included in the most directly comparable measure calculated and presented under IFRS.
Syngenta uses non-GAAP measures in this report where they are regarded by management as important for the investor to fully understand Syngenta’s performance. The non-GAAP measures presented in this report are measures adjusted for exchange rate movements and to exclude restructuring gains and losses, impairment losses and divestment gains and losses. The Company presents these measures because:
movements in exchange rates historically have had, and in the future are expected to have, a significant impact on sales and operating income from period to period; and
restructuring and impairment charges historically have fluctuated, and in the future are expected to fluctuate, significantly from period to period and thereby have a volatile impact on results.
Syngenta has been engaged in significant restructuring activities since the formation of the Company in 2000, including programs to integrate and extract synergies from the combined operations of the Zeneca agrochemicals business and the Novartis agribusiness, the integration of business combinations, the Operational Efficiency programs, the implementation of the integrated crop strategy and, beginning in 2014, the AOL program. The incidence of restructuring charges is periodic and volatile, reflecting the timing of irrevocable commitments related to specific sites and operations. Therefore, the impact on reported performance varies from period to period and there is limited continuity in the specific composition or size of such charges. Internal financial reporting and management and employee incentive plans are substantially based on financial measures excluding the charges for restructuring and impairment so that management is incentivized to deliver the benefits of the associated restructuring and not to achieve short-term financial targets by deferring implementation of restructuring plans. Restructuring programs typically deliver benefits with a payback over several years, similar to capital investments, and control over restructuring expenditures is performed on a similar project basis to that applied with capital investments.
Syngenta presents non-GAAP measures on operating income before restructuring and impairment at both the segmental and Syngenta AG group levels. Restructuring and impairment charges have had a material effect on operating income in the period covered by the review. In the opinion of management, reporting operating performance excluding restructuring and impairment in addition to the GAAP measures provides a more thorough understanding of business performance. Together with disclosure of the material elements within restructuring and impairment and of the overall anticipated size and timeframe of restructuring programs, these measures may assist investors in forecasting future operating performance.
Syngenta presents non-GAAP information on income before taxes excluding restructuring and impairment together with income tax expense before restructuring and impairment to assist investors to calculate the Syngenta tax rate both including and excluding the impact of restructuring and impairment charges. The tax rate on restructuring and impairment charges has been volatile and different from the tax rate on income before taxes excluding restructuring and impairment, due in part to many categories of restructuring or impairment charges not being deductible for tax purposes.
In addition to GAAP measures, Syngenta uses these measures excluding restructuring and impairment in internal reporting to management and the Board of Directors, and these measures are used in the incentive plans for Syngenta management and other employees. Restructuring and impairment charges have been incurred in all the periods covered by the review and are expected to continue to arise and have a material effect on operating performance in future periods. Consequently, non-GAAP measures of operating income before restructuring and impairment do not present a complete picture of operating performance and these measures should be seen only as supplementary to the GAAP measures.
For improved clarity, the definitions of these non-GAAP measures and reconciliations of non-GAAP measures to the appropriate GAAP measure are provided below. The tables below are included to show the reconciliation of the GAAP measures to the non-GAAP measures used in the report and do not represent income statements prepared under IFRS.
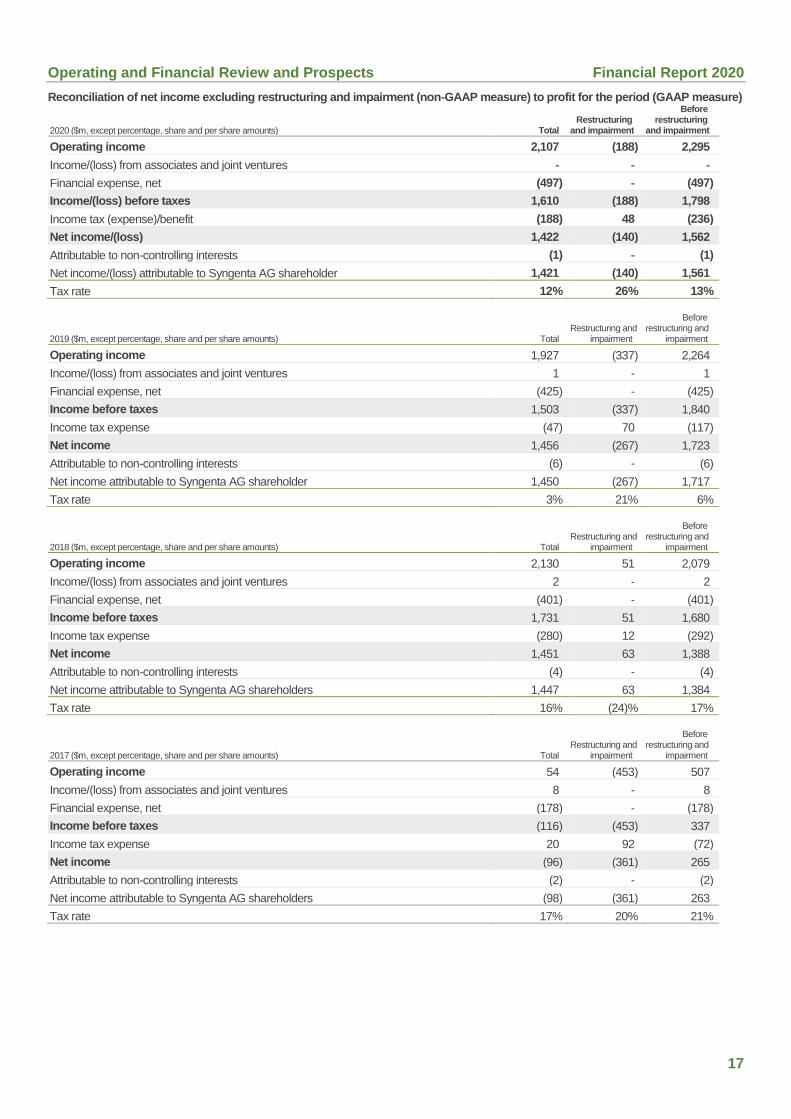
Operating and Financial Review and Prospects Financial Report 2020
17
Reconciliation of net income excluding restructuring and impairment (non-GAAP measure) to profit for the period (GAAP measure)
2020 ($m, except percentage, share and per share amounts) Total Restructuring
and impairment
Before restructuring
and impairment
Operating income 2,107 (188) 2,295
Income/(loss) from associates and joint ventures ‐ ‐ ‐
Financial expense, net (497) ‐ (497)
Income/(loss) before taxes 1,610 (188) 1,798
Income tax (expense)/benefit (188) 48 (236)
Net income/(loss) 1,422 (140) 1,562
Attributable to non-controlling interests (1) ‐ (1)
Net income/(loss) attributable to Syngenta AG shareholder 1,421 (140) 1,561
Tax rate 12% 26% 13%
2019 ($m, except percentage, share and per share amounts) Total Restructuring and
impairment
Before restructuring and
impairment
Operating income 1,927 (337) 2,264
Income/(loss) from associates and joint ventures 1 ‐ 1
Financial expense, net (425) ‐ (425)
Income before taxes 1,503 (337) 1,840
Income tax expense (47) 70 (117)
Net income 1,456 (267) 1,723
Attributable to non-controlling interests (6) ‐ (6)
Net income attributable to Syngenta AG shareholder 1,450 (267) 1,717
Tax rate 3% 21% 6%
2018 ($m, except percentage, share and per share amounts) Total Restructuring and
impairment
Before restructuring and
impairment
Operating income 2,130 51 2,079
Income/(loss) from associates and joint ventures 2 ‐ 2
Financial expense, net (401) ‐ (401)
Income before taxes 1,731 51 1,680
Income tax expense (280) 12 (292)
Net income 1,451 63 1,388
Attributable to non-controlling interests (4) ‐ (4)
Net income attributable to Syngenta AG shareholders 1,447 63 1,384
Tax rate 16% (24)% 17%
2017 ($m, except percentage, share and per share amounts) Total Restructuring and
impairment
Before restructuring and
impairment
Operating income 54 (453) 507
Income/(loss) from associates and joint ventures 8 ‐ 8
Financial expense, net (178) ‐ (178)
Income before taxes (116) (453) 337
Income tax expense 20 92 (72)
Net income (96) (361) 265
Attributable to non-controlling interests (2) ‐ (2)
Net income attributable to Syngenta AG shareholders (98) (361) 263
Tax rate 17% 20% 21%
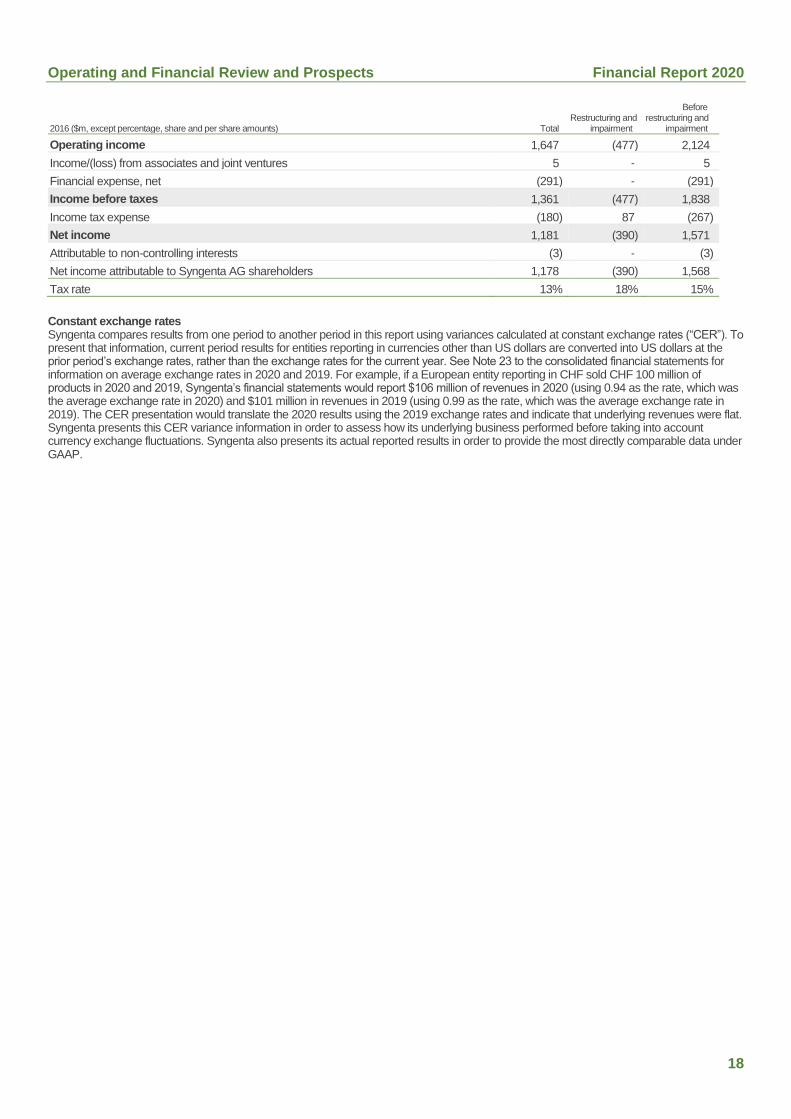
Operating and Financial Review and Prospects Financial Report 2020
18
2016 ($m, except percentage, share and per share amounts) Total Restructuring and
impairment
Before restructuring and
impairment
Operating income 1,647 (477) 2,124
Income/(loss) from associates and joint ventures 5 ‐ 5
Financial expense, net (291) ‐ (291)
Income before taxes 1,361 (477) 1,838
Income tax expense (180) 87 (267)
Net income 1,181 (390) 1,571
Attributable to non-controlling interests (3) ‐ (3)
Net income attributable to Syngenta AG shareholders 1,178 (390) 1,568
Tax rate 13% 18% 15%
Constant exchange rates Syngenta compares results from one period to another period in this report using variances calculated at constant exchange rates (“CER”). To present that information, current period results for entities reporting in currencies other than US dollars are converted into US dollars at the prior period’s exchange rates, rather than the exchange rates for the current year. See Note 23 to the consolidated financial statements for information on average exchange rates in 2020 and 2019. For example, if a European entity reporting in CHF sold CHF 100 million of products in 2020 and 2019, Syngenta’s financial statements would report $106 million of revenues in 2020 (using 0.94 as the rate, which was the average exchange rate in 2020) and $101 million in revenues in 2019 (using 0.99 as the rate, which was the average exchange rate in 2019). The CER presentation would translate the 2020 results using the 2019 exchange rates and indicate that underlying revenues were flat. Syngenta presents this CER variance information in order to assess how its underlying business performed before taking into account currency exchange fluctuations. Syngenta also presents its actual reported results in order to provide the most directly comparable data under GAAP.
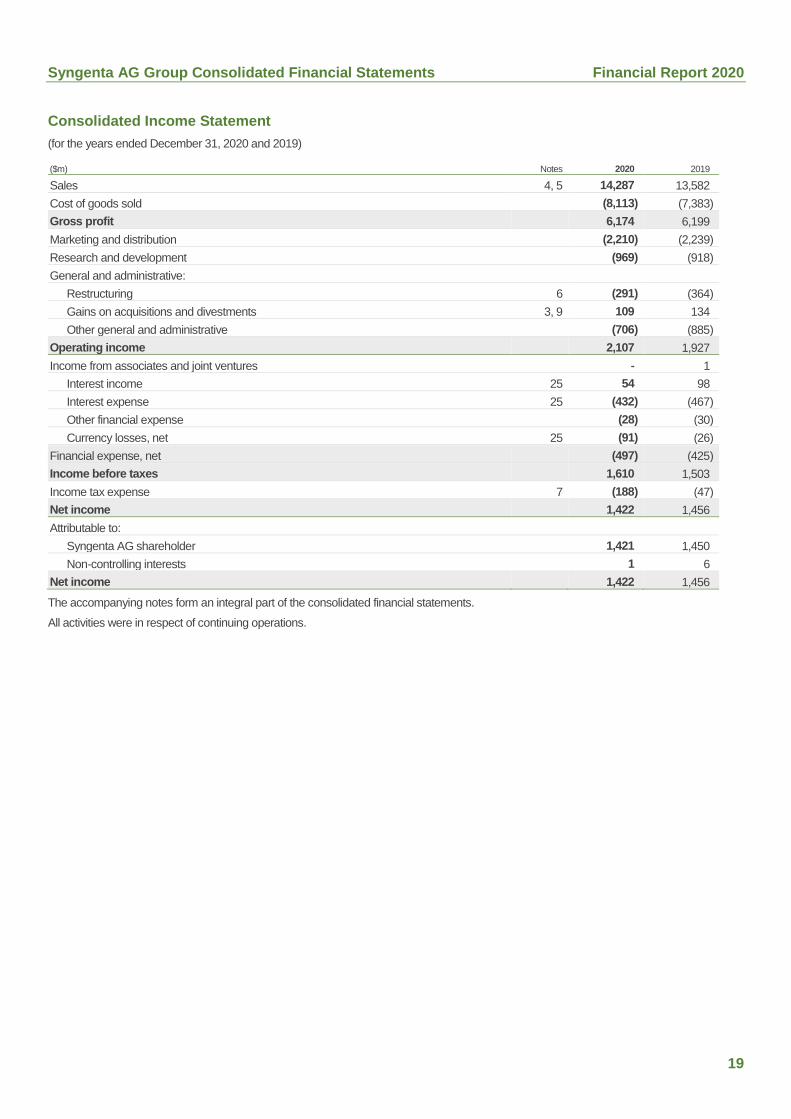
Syngenta AG Group Consolidated Financial Statements Financial Report 2020
19
Consolidated Income Statement
(for the years ended December 31, 2020 and 2019)
($m) Notes 2020 2019
Sales 4, 5 14,287 13,582
Cost of goods sold (8,113) (7,383)
Gross profit 6,174 6,199
Marketing and distribution (2,210) (2,239)
Research and development (969) (918)
General and administrative:
Restructuring 6 (291) (364)
Gains on acquisitions and divestments 3, 9 109 134
Other general and administrative (706) (885)
Operating income 2,107 1,927
Income from associates and joint ventures ‐ 1
Interest income 25 54 98
Interest expense 25 (432) (467)
Other financial expense (28) (30)
Currency losses, net 25 (91) (26)
Financial expense, net (497) (425)
Income before taxes 1,610 1,503
Income tax expense 7 (188) (47)
Net income 1,422 1,456
Attributable to:
Syngenta AG shareholder 1,421 1,450
Non-controlling interests 1 6
Net income 1,422 1,456
The accompanying notes form an integral part of the consolidated financial statements.
All activities were in respect of continuing operations.
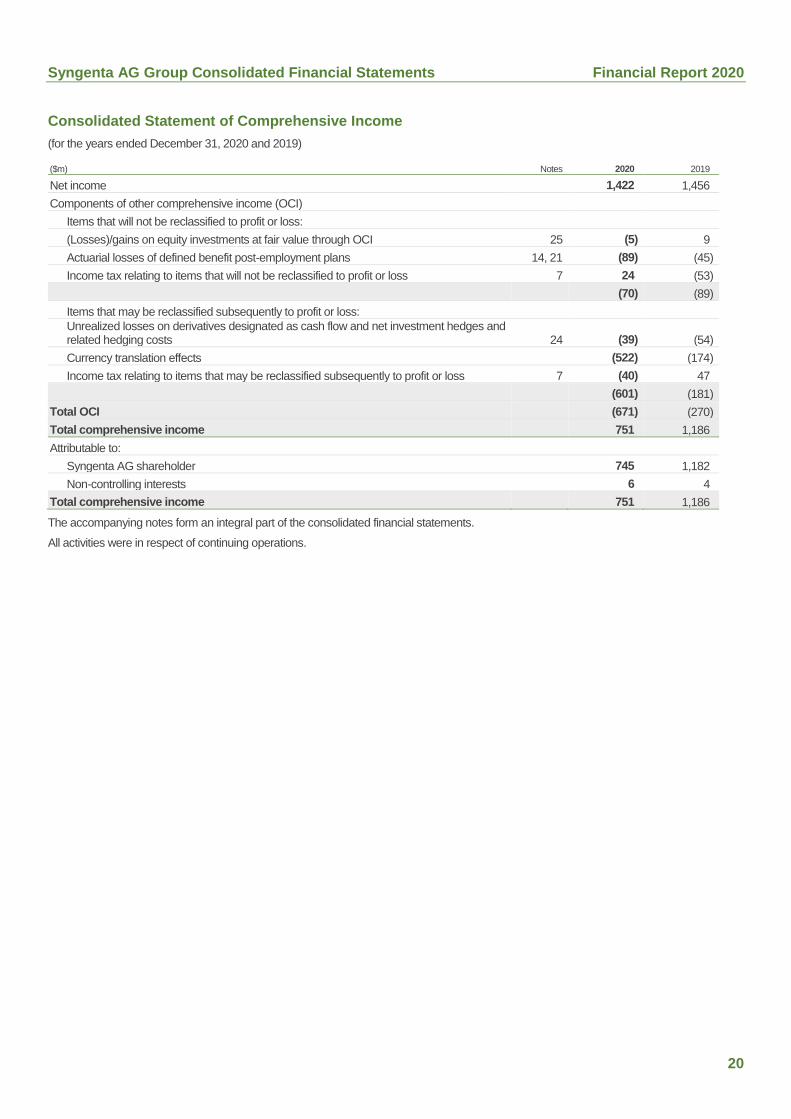
Syngenta AG Group Consolidated Financial Statements Financial Report 2020
20
Consolidated Statement of Comprehensive Income
(for the years ended December 31, 2020 and 2019)
($m) Notes 2020 2019
Net income 1,422 1,456
Components of other comprehensive income (OCI)
Items that will not be reclassified to profit or loss:
(Losses)/gains on equity investments at fair value through OCI 25 (5) 9
Actuarial losses of defined benefit post-employment plans 14, 21 (89) (45)
Income tax relating to items that will not be reclassified to profit or loss 7 24 (53)
(70) (89)
Items that may be reclassified subsequently to profit or loss:
Unrealized losses on derivatives designated as cash flow and net investment hedges and related hedging costs 24 (39) (54)
Currency translation effects (522) (174)
Income tax relating to items that may be reclassified subsequently to profit or loss 7 (40) 47
(601) (181)
Total OCI (671) (270)
Total comprehensive income 751 1,186
Attributable to:
Syngenta AG shareholder 745 1,182
Non-controlling interests 6 4
Total comprehensive income 751 1,186
The accompanying notes form an integral part of the consolidated financial statements.
All activities were in respect of continuing operations.
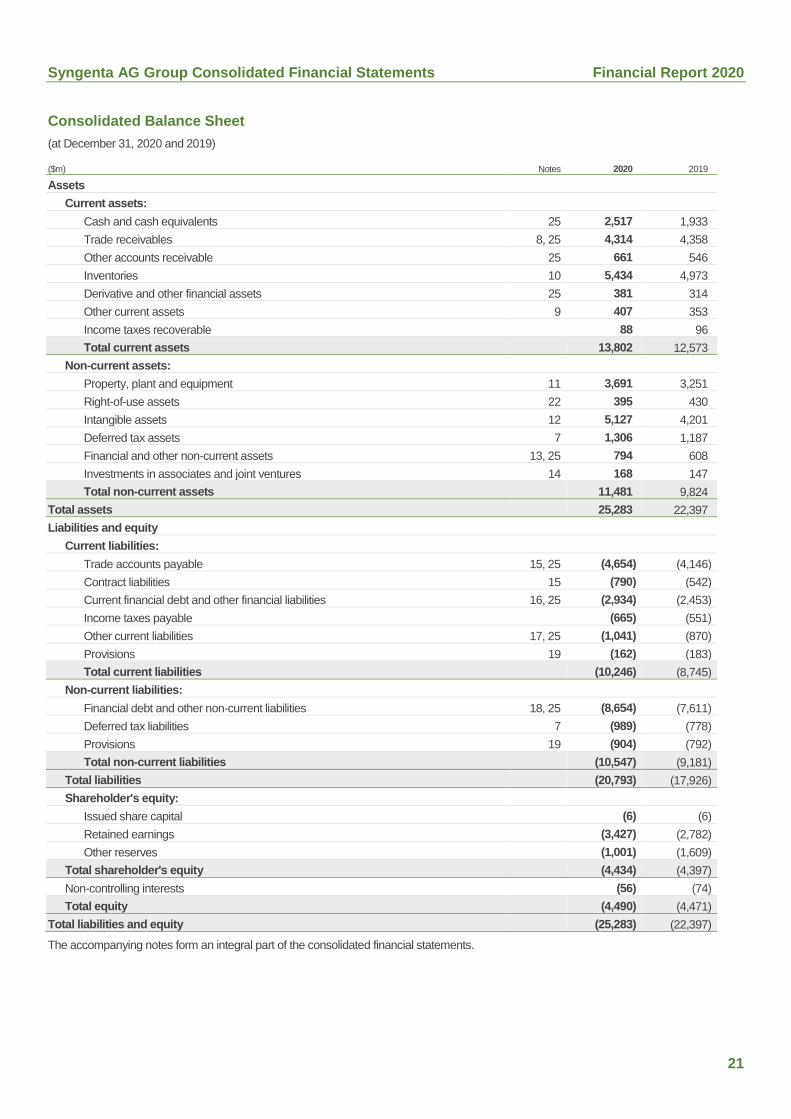
Syngenta AG Group Consolidated Financial Statements Financial Report 2020
21
Consolidated Balance Sheet
(at December 31, 2020 and 2019)
($m) Notes 2020 2019
Assets
Current assets:
Cash and cash equivalents 25 2,517 1,933
Trade receivables 8, 25 4,314 4,358
Other accounts receivable 25 661 546
Inventories 10 5,434 4,973
Derivative and other financial assets 25 381 314
Other current assets 9 407 353
Income taxes recoverable 88 96
Total current assets 13,802 12,573
Non-current assets:
Property, plant and equipment 11 3,691 3,251
Right-of-use assets 22 395 430
Intangible assets 12 5,127 4,201
Deferred tax assets 7 1,306 1,187
Financial and other non-current assets 13, 25 794 608
Investments in associates and joint ventures 14 168 147
Total non-current assets 11,481 9,824
Total assets 25,283 22,397
Liabilities and equity
Current liabilities:
Trade accounts payable 15, 25 (4,654) (4,146)
Contract liabilities 15 (790) (542)
Current financial debt and other financial liabilities 16, 25 (2,934) (2,453)
Income taxes payable (665) (551)
Other current liabilities 17, 25 (1,041) (870)
Provisions 19 (162) (183)
Total current liabilities (10,246) (8,745)
Non-current liabilities:
Financial debt and other non-current liabilities 18, 25 (8,654) (7,611)
Deferred tax liabilities 7 (989) (778)
Provisions 19 (904) (792)
Total non-current liabilities (10,547) (9,181)
Total liabilities (20,793) (17,926)
Shareholder's equity:
Issued share capital (6) (6)
Retained earnings (3,427) (2,782)
Other reserves (1,001) (1,609)
Total shareholder's equity (4,434) (4,397)
Non-controlling interests (56) (74)
Total equity (4,490) (4,471)
Total liabilities and equity (25,283) (22,397)
The accompanying notes form an integral part of the consolidated financial statements.
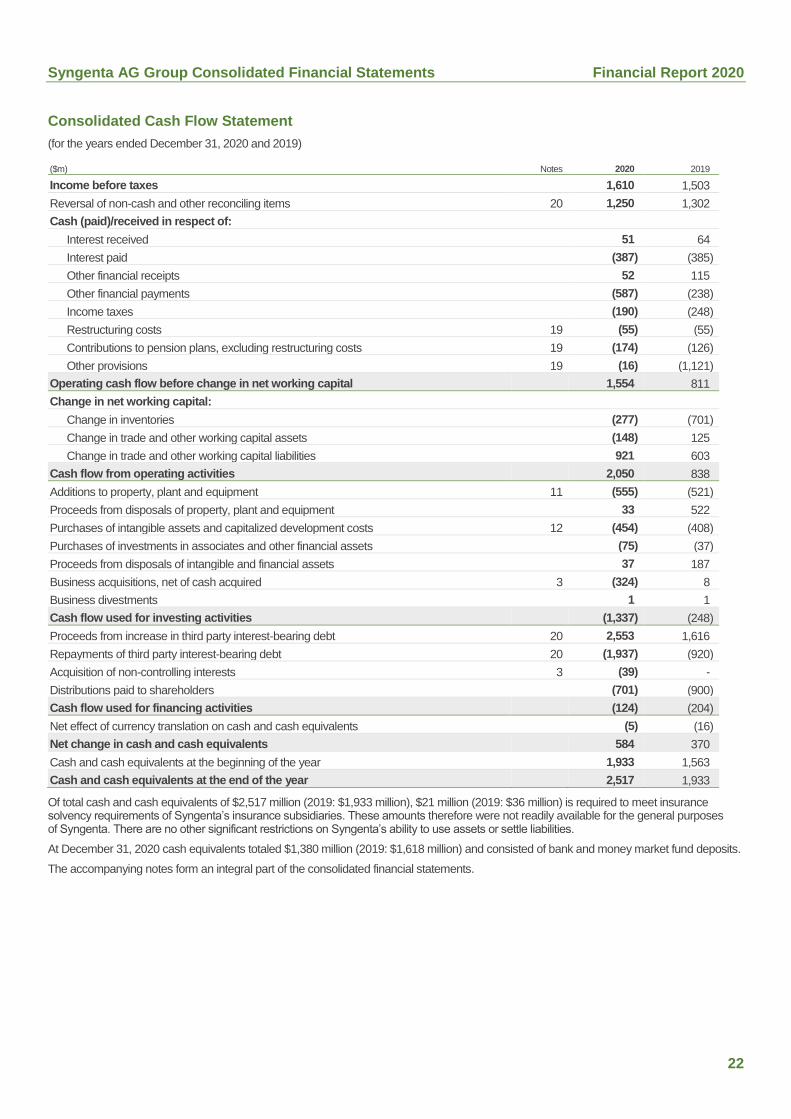
Syngenta AG Group Consolidated Financial Statements Financial Report 2020
22
Consolidated Cash Flow Statement
(for the years ended December 31, 2020 and 2019)
($m) Notes 2020 2019
Income before taxes 1,610 1,503
Reversal of non-cash and other reconciling items 20 1,250 1,302
Cash (paid)/received in respect of:
Interest received 51 64
Interest paid (387) (385)
Other financial receipts 52 115
Other financial payments (587) (238)
Income taxes (190) (248)
Restructuring costs 19 (55) (55)
Contributions to pension plans, excluding restructuring costs 19 (174) (126)
Other provisions 19 (16) (1,121)
Operating cash flow before change in net working capital 1,554 811
Change in net working capital:
Change in inventories (277) (701)
Change in trade and other working capital assets (148) 125
Change in trade and other working capital liabilities 921 603
Cash flow from operating activities 2,050 838
Additions to property, plant and equipment 11 (555) (521)
Proceeds from disposals of property, plant and equipment 33 522
Purchases of intangible assets and capitalized development costs 12 (454) (408)
Purchases of investments in associates and other financial assets (75) (37)
Proceeds from disposals of intangible and financial assets 37 187
Business acquisitions, net of cash acquired 3 (324) 8
Business divestments 1 1
Cash flow used for investing activities (1,337) (248)
Proceeds from increase in third party interest-bearing debt 20 2,553 1,616
Repayments of third party interest-bearing debt 20 (1,937) (920)
Acquisition of non-controlling interests 3 (39) ‐
Distributions paid to shareholders (701) (900)
Cash flow used for financing activities (124) (204)
Net effect of currency translation on cash and cash equivalents (5) (16)
Net change in cash and cash equivalents 584 370
Cash and cash equivalents at the beginning of the year 1,933 1,563
Cash and cash equivalents at the end of the year 2,517 1,933
Of total cash and cash equivalents of $2,517 million (2019: $1,933 million), $21 million (2019: $36 million) is required to meet insurance solvency requirements of Syngenta’s insurance subsidiaries. These amounts therefore were not readily available for the general purposes of Syngenta. There are no other significant restrictions on Syngenta’s ability to use assets or settle liabilities.
At December 31, 2020 cash equivalents totaled $1,380 million (2019: $1,618 million) and consisted of bank and money market fund deposits.
The accompanying notes form an integral part of the consolidated financial statements.

Syngenta AG Group Consolidated Financial Statements Financial Report 2020
23
Consolidated Statement of Changes in Equity
(for the years ended December 31, 2020 and 2019)
Attributable to Syngenta AG shareholder
($m)
Par value of ordinary shares
Additional paid-in capital
Treasury shares, at
cost Fair value reserves
Cumulative translation
adjustment Retained earnings
Total share-holder's
equity
Non-controlling
interests Total equity
January 1, 2019 6 3,416 (67) (25) (1,610) 2,398 4,118 26 4,144
Net income ‐ ‐ ‐ ‐ ‐ 1,450 1,450 6 1,456
OCI ‐ ‐ ‐ 14 (186) (96) (268) (2) (270)
Total comprehensive income ‐ ‐ ‐ 14 (186) 1,354 1,182 4 1,186
Transactions with owner:
Distributions paid to shareholder ‐ ‐ ‐ ‐ ‐ (900) (900) ‐ (900)
Distribution in kind: Treasury shares ‐ ‐ 67 ‐ ‐ (67) ‐ ‐ ‐ Non-controlling interest in Sanbei Seeds Co. Ltd. on acquisition ‐ ‐ ‐ ‐ ‐ ‐ ‐ 44 44
Other ‐ ‐ ‐ ‐ ‐ (3) (3) ‐ (3)
December 31, 2019 6 3,416 ‐ (11) (1,796) 2,782 4,397 74 4,471
Net income ‐ ‐ ‐ ‐ ‐ 1,421 1,421 1 1,422
OCI ‐ ‐ ‐ (85) (527) (64) (676) 5 (671)
Total comprehensive income ‐ ‐ ‐ (85) (527) 1,357 745 6 751
Transactions with owner:
Distributions paid to shareholders ‐ ‐ ‐ ‐ ‐ (700) (700) (1) (701)
Acquisition of non-controlling interest ‐ ‐ ‐ ‐ (3) (13) (16) (23) (39)
Other ‐ ‐ ‐ 7 ‐ 1 8 ‐ 8
December 31, 2020 6 3,416 ‐ (89) (2,326) 3,427 4,434 56 4,490
The accompanying notes form an integral part of the consolidated financial statements.
The amount available for dividend distribution is based on Syngenta AG’s shareholder’s equity determined in accordance with the legal provisions of the Swiss Code of Obligations. On October 13, 2020, a dividend of $700 million ($7.56 per share) was declared. This was paid to Syngenta’s parent company, CNAC Saturn (NL) B.V. on December 11, 2020. On April 12, 2019, a dividend of $900 million ($9.74 per share) was declared. On April 24, 2019, $450 million was paid to CNAC Saturn (NL) B.V. and the remaining $450 million was paid on November 15, 2019.
There were 92,578,149 ordinary shares of par value CHF 0.10 that were authorized, issued, fully paid and outstanding at December 31, 2020 and 2019. Each ordinary share carries one vote at the shareholder’s meetings of Syngenta AG. In June 2019, Syngenta distributed the remaining 195,676 Treasury shares as an in-kind dividend to its parent company, CNAC Saturn (NL) B.V.
Included within the fair value reserves are (i) cash flow hedge reserves, which comprise the effective portion of the cumulative net change in the fair value of cash flow hedging instruments related to hedged items that have not yet been recognized in profit or loss, and (ii) fair value reserves, which comprise the cumulative net change in the fair value of equity investments at fair value through OCI. Movements in the cash flow hedge reserves are shown in Note 24. Movements in the fair value reserves for equity investments are shown in Note 25. Amounts within OCI related to actuarial gains and losses of defined benefit post-employment plans are presented within retained earnings.
The cumulative translation adjustment comprises all foreign currency differences arising from the translation of the financial statements of foreign operations, as well as from the translation of long-term monetary items that are part of net investments in foreign subsidiaries.
During 2020, Syngenta acquired the remaining non-controlling interest in Syngenta India Ltd. During 2019, Syngenta acquired control of Sanbei Seeds Co. Ltd. Further details of these transactions are given in Note 3.
Notes to the Syngenta AG Group Consolidated Financial Statements Financial Report 2020
24
1. Basis of preparation of the consolidated financial statements
These consolidated financial statements have been prepared in accordance with International Financial Reporting Standards (IFRS or IFRSs) as issued by the International Accounting Standards Board (IASB). The consolidated financial statements have been prepared on a historical cost basis, except for items that are required by IFRSs to be measured at fair value, principally certain financial instruments and biological assets, which are valued at fair value less costs to sell.
The consolidated financial statements incorporate the financial statements of Syngenta AG, a company domiciled and incorporated in Switzerland, and all of its more than 150 subsidiaries globally (together referred to as “the Syngenta AG group”) and the Syngenta AG group’s interests in associates and joint ventures. Approximately 40 subsidiaries are considered to be significant legal entities. There are no material non-controlling interests, except for Sanbei Seeds Co. Ltd. as disclosed in Note 3, and no material structured entities. The Syngenta AG group’s main research and development facilities are located in Switzerland, UK and USA and its main production sites are in Switzerland, UK, USA, France, China and Brazil. Syngenta AG’s principal executive offices are at Rosentalstrasse 67, 4002 Basel, Switzerland.
The parent of Syngenta AG is CNAC Saturn (NL) B.V., a private company incorporated in the Netherlands. The ultimate parent of Syngenta AG is China National Chemical Corporation (ChemChina), a state-owned enterprise of the People’s Republic of China.
The consolidated financial statements are presented in United States dollars (“$”) as this is the major currency in which revenues are denominated. “$m” refers to millions of United States dollars. With effect from January 1, 2019 the functional currency of Syngenta AG changed from the Swiss franc to the $, which is now the main currency in which its funding, receipts and payments are denominated.
The Syngenta AG group is a world leading agribusiness operating in the crop protection, seeds, professional solutions and flowers markets. Crop protection chemicals include herbicides, insecticides, fungicides and seed treatments to control weeds, insects and diseases in crops, and are essential inputs enabling growers around the world to improve agricultural productivity and food quality. In Seeds, the Syngenta AG group operates in the high value commercial sectors of field crops (including corn, oilseeds and cereals) and vegetables. The Professional Solutions business provides turf and landscape and professional pest management products, and the Flowers business provides flower seeds, cuttings and young plants, to professional growers and consumers.
The preparation of financial statements requires management to exercise judgment when applying accounting policies and to make estimates and assumptions that affect the reported amounts of assets and liabilities, the disclosure of contingent assets and liabilities at the date of the financial statements and the reported amounts of revenues and expenses during the reporting period. Actual results could differ from those estimated. Note 2 below includes further discussion of certain critical accounting estimates.
Significant changes in the current reporting period On March 11, 2020, the World Health Organization declared the coronavirus disease (“COVID-19”) a pandemic and governments around the world implemented stringent restrictions to limit business operations and movement of people. Most governments, however, have declared agriculture as an “essential activity” allowing Syngenta to continue operating to the fullest extent possible. Syngenta is managing the impacts of COVID-19 through emergency management teams at global, regional, country and site levels. To date, there have not been significant disruptions to supply and mitigation plans are in place to manage potential risks to supply chains. During March 2020, remote working was implemented where possible and remains in place according to local guidance. Non-critical business travel has been restricted since the beginning of the pandemic. These measures have not significantly affected Syngenta’s ability to maintain business operations. Syngenta regularly monitors the economic uncertainty impacting global markets, including currency values and commodity prices; COVID-19 has not resulted in significant adjustments to carrying amounts of assets and liabilities or revisions to critical accounting estimates.
2. Significant accounting policy changes, judgments and estimates
This note describes the impact on Syngenta’s consolidated financial statements of significant accounting judgments made when applying IFRSs and critical assumptions and accounting estimates.
Application of critical accounting policies
Royalty and license income Individual agreements licensing to third parties the right to use Syngenta technology can and do have unique terms and, consequently, the accounting judgments required to apply IFRS 15 to each such agreement can differ significantly. Syngenta recognizes revenue for non-refundable lump sum and guaranteed minimum license income at the start of a license only when the license is distinct from any related Syngenta obligations to supply licensed products during the license term and Syngenta has performed any obligations related to the license grant. For licenses of seed germplasm and trait technology, Syngenta considers that these criteria are met when the license has become effective, the licensee either has control of biological material from which it can independently breed, produce and sell seeds containing the technology Syngenta has licensed to it under the agreement or can obtain any seed purchase requirements in the market from producers other than Syngenta. For licenses of crop protection technology, Syngenta considers that these criteria are met when the license grants the right to manufacture and sell chemical products containing the licensed technology, the right to obtain related manufacturing and formulation know-how and the right to use existing regulatory data necessary for the licensee to establish its own independent registration to sell the licensed products.
Research and development expense Research costs are expensed as incurred. Costs arising from internal product development projects are recognized as intangible assets if, and only if, Syngenta is able to, has sufficient resources to and intends to complete and use or sell the technology or product being developed, and such completion and use or sale is technically feasible and commercially viable. Government grants, including tax credits accounted for as government grants, that are directly related to development projects are accounted for in the same way as the project costs to which they relate. During 2019 Syngenta introduced enhanced project planning and reporting processes that have enabled it to measure reliably, and hence to capitalize, the costs of intangible assets arising from development undertaken after January 1, 2019. The amount of development costs capitalized is disclosed in Note 12 and is determined by reconciling project cost analyses in development planning systems to actual costs incurred that are recorded in the related accounting cost centers in the period.
Costs of projects to develop new crop protection chemical active ingredients that have not yet obtained regulatory approval are expensed as incurred because their technical feasibility and commercial viability cannot be demonstrated until such approval has been obtained. Costs of
Notes to the Syngenta AG Group Consolidated Financial Statements Financial Report 2020
25
projects to develop new formulations or extend the use of existing formulations of active ingredients that have regulatory approval, or widen product label indications of existing products already on the market to include additional uses of such products, are capitalized as intangible assets throughout the duration of the projects, which is approximately 4 to 5 years, and are amortized over the useful economic lives of the related new products, starting from the date they are ready for use or sale. Useful economic lives are disclosed under ‘Intangible Assets’ in Note 26. Costs capitalized for a project are immediately and fully impaired if the project is discontinued before completion. Costs of projects to re-register active ingredients with existing approvals are expensed as incurred because such projects are considered to maintain existing intangible assets rather than generate new intangible assets.
Costs of seed breeding programs that include genetically modified traits that require regulatory approval are expensed as incurred because their technical feasibility and commercial viability cannot be demonstrated until such approval has been obtained. Costs of other seed breeding programs are capitalized starting from the breeding stage in which new seed hybrids or varieties are identified as potential candidates for commercialization until the launch of the output of the related breeding program, which is approximately 6 to 7 years. Qualifying breeding programs are monitored and measured by crop and region to align the amortization period with the life of the program. Breeding program costs taken into account for capitalization include costs of all functions within Research and development that are directly attributable to the breeding activity. Capitalized costs are impaired before completion of breeding if product launches are no longer expected as a result of major changes to Syngenta’s seed crop portfolio. Costs capitalized for a breeding year are amortized over the average commercial life of a new seed product, as disclosed in Note 26, starting from launch.
Impairment For purposes of testing goodwill for impairment, goodwill is allocated to cash generating units (CGUs). Syngenta generally defines each crop protection product active ingredient and each seed crop as a CGU. However, where one active ingredient is sold in mixture with other active ingredients to a significant extent, the active ingredients concerned are grouped together into a single CGU because independent cash inflows only exist at this higher level. Each CGU is generally defined on a global basis, reflecting the international nature of the business, and contains tangible assets such as property, plant and equipment (PP&E) as well as intangible assets such as product and patent rights.
North America corn and soybean seeds are defined as a single CGU because of common intellectual property and other interdependencies between these two crops, which do not apply to other crops. Goodwill on certain major acquisitions, principally Zeneca agrochemicals business goodwill of $548 million, was allocated to each Syngenta operating segment in proportion to each such segment’s relative value at the time Syngenta established its current basis of segmentation, and is tested for impairment at those levels by relating the allocated amount for each segment to the total cash flows of the respective segment. The goodwill amounts allocated to segments and significant other CGUs are disclosed in Note 12.
For CGUs to which no goodwill is allocated, a reduction in forecast sales within management’s five-year forecast horizon compared with the previous year’s five-year forecast cycle, combined with a reduction in latest forecasts of current year sales compared with the current year budget, is generally considered an indicator of market related impairment and results in the performance of detailed impairment tests. Syngenta also performs detailed impairment tests when there are asset specific indicators of impairment such as withdrawal of or restrictions placed upon product registrations, plans to divest products or, for property, plant and equipment, plans to restructure or close a site. Higher discount rates are used to test property, plant and equipment for impairment in the case of restructuring because of the higher risk associated with remaining cash flows when operations are being physically relocated. The value in use calculation takes account of cash flows from the remaining period of operations and includes decommissioning costs.
If a CGU becomes impaired, the impairment loss is allocated first to any goodwill in the CGU, and then to reduce the CGU’s other assets pro rata.
Critical accounting estimates
Acquisition accounting Applying the acquisition method of accounting requires significant management judgment to estimate the fair values and useful lives of the acquired assets, in particular intangible assets such as intellectual property (IP) related to currently marketed products and in-process research and development (IPR&D). In 2020, Syngenta recognized new intangible assets, excluding goodwill, of $430 million (2019: $44 million) resulting from acquisitions, principally Valagro SpA. These acquisitions and the fair values recognized for the acquired intangible assets are set out in Note 3. Key valuation assumptions include market size and share, sales pricing trends and competitors’ reaction, cost and efficiency of the production process for the products, and the period over which the products are likely to generate economic benefits. Forecast cash flows for each asset are discounted using a rate developed from the estimated Weighted Average Cost of Capital (WACC) of the acquired company. Where Syngenta considers the risks applicable to an asset are not fully reflected in the forecast data available, it incorporates a risk premium into the discount rate. If actual cash flows are materially different from those used in calculating fair values, this may lead to changes in amortization expense or asset specific impairment losses in future periods.
Adjustments to revenue and trade receivables Syngenta’s products are consumed mainly by growers, but Syngenta invoices the majority of its sales to distributors. The timing and amount of cash inflows received by growers is impacted by a broad range of economic and political risks, including crop yields and prices, the availability of credit, and the cost of agricultural inputs such as the products sold by Syngenta and its competitors. The cash flows of distributors that supply Syngenta’s products to growers and represent the majority of Syngenta’s customers are also impacted by these factors. These distributors vary in size and nature from large publicly owned entities to small or medium sized owner-managed businesses. Syngenta’s customer base reflects the geographical diversity of its operations, which encompass more than 90 countries and all significant agriculture areas. Considerable management effort and judgment is applied to actively manage and mitigate the risks to Syngenta from these factors and to determine the accounting estimates associated with them, which are set out below:
the estimated cost of incentive programs that provide rebates and discounts is dependent upon achievement of sales targets, as well as cash discounts for punctual payment of accounts receivable. Syngenta records the estimated cost of these programs when the related sales are made, based on the programs’ terms, market conditions and historical experience. At December 31, 2020, trade accounts payable include $1,697 million (2019: $1,542 million) of accruals for customer rebates and incentive programs.
commercial terms in certain markets also provide a right of return, subject to eligibility restrictions by product and either an annual cap equal to a percentage of sales in the immediately prior year, or a return period typically extending up to the end of the agricultural season in which the product was originally sold, which can be 9 months. Accruals for estimated product returns are based on contractual sales
Notes to the Syngenta AG Group Consolidated Financial Statements Financial Report 2020
26
terms and on historical experience of actual returns where Syngenta considers these to be reliable estimates of future returns. At December 31, 2020, trade accounts payable includes $326 million (2019: $305 million) of accruals for sales returns. Actual returns can vary significantly from estimates in market segments where the distribution channel holds several months’ sales of Syngenta products at the reporting date; forecast consumption of those products by growers could be materially affected if market or weather conditions after the reporting date were significantly different from those expected and the volume of products returned by distributors varies with changes in grower consumption. This is especially relevant to Brazil and certain other markets in the southern hemisphere given Syngenta’s financial reporting year-end falls in the middle of the peak demand season for Syngenta’s crop protection products. Actual sales returns in 2019 in Brazil of crop protection products Syngenta sold during 2018 were $82 million, representing 5 percent of relevant sales. This was less than the $113 million provided at December 31, 2018. Actual sales returns in 2020 in Brazil of crop protection products Syngenta sold during 2019 were $42 million, representing 2 percent of relevant sales. This is less than the $130 million provided at December 31, 2019. The main reason for the lower returns in 2020 is that the market in Brazil had a strong season, driven by reasonable in-channel inventory levels and growers’ profitability gains coming from high commodity prices. In accordance with IFRS 15, sales subject to returns are recognized only to the extent that it is highly probable that a significant reversal in the amount of revenue recognized will not occur when the uncertainty associated with the amount of returns is subsequently resolved. At December 31, 2020, Syngenta has recorded a $72 million allowance for sales returns of crop protection products in Brazil, representing 4 percent of relevant sales in 2020.
allowances for doubtful receivables, which are estimated by critically analyzing individual receivable account balances, taking into account historical levels of recovery and the value of any security held or agreed barter programs which mitigate credit exposure, the economic condition of individual customers, and the overall economic and political environment in relevant countries. As shown in Note 8, the provision for doubtful receivables at December 31, 2020 amounted to $468 million, or 10 percent (2019: $465 million or 10 percent) of total trade receivables, of which $88 million, $60 million and $77 million (2019: $113 million, $60 million and $86 million) related respectively to sales made to the Brazilian, Venezuelan and Argentine markets. In 2020, Syngenta reported $62 million bad debt expense (2019: $106 million). The decrease is mainly related to improved collection performance in Argentina and Ukraine.
Syngenta records these estimates as separate allowances, but its estimation process recognizes their interdependency, as the level of credits to accounts receivable for discounts and product returns may affect the probability of receiving full payment of the net receivable balances.
Income Taxes Deferred tax assets At December 31, 2020, Syngenta’s deferred tax assets are $1,306 million (2019: $1,187 million), as further analyzed in Note 7. Included in this balance are deferred tax assets for unused tax losses and tax credits of $73 million (2019: $89 million), of which $33 million (2019: $75 million) relates to tax losses. The ultimate realization of deferred tax assets is dependent upon the generation of future taxable income during the periods in which those temporary differences become deductible or in which tax losses can be utilized. The tax effect of unused tax losses is recognized as a deferred tax asset when it becomes probable that the tax losses will be utilized. In making assessments regarding deferred tax assets, management considers the scheduled reversal of deferred tax liabilities, projected future taxable income and tax planning strategies.
At December 31, 2020, based upon the level of historical taxable income and projections for future taxable income over the periods in which deferred tax assets are deductible, management believes that it is more likely than not that Syngenta will realize the benefits of these deductible differences. The amount of deferred tax assets considered realizable could however be reduced in subsequent years if estimates of future taxable income during their carry forward periods are reduced, or rulings by the tax authorities are unfavorable. Estimates are therefore subject to change due to both market-related and government-related uncertainties, as well as Syngenta’s own future decisions on restructuring and other matters. Syngenta is unable to accurately quantify the future adjustments to deferred income tax expense that may occur as a result of these uncertainties.
The principal jurisdictions where deferred tax assets have not been recognized at December 31, 2020 are Brazil and the USA (2019: Brazil and the USA). At December 31, 2020, Syngenta has recognized $117 million (2019: $83 million) of net deferred tax assets in Brazil and has not recognized $16 million (2019: $46 million) of deferred tax assets. The improved 2020 business performance in Brazil as well as the overall lower level of net deferred tax assets resulted in a lower restriction of the amount recognized, decreasing 2020 deferred income tax expense by $22 million (2019: $32 million). Syngenta has assumed local profitability in 2021 and future years similar to the historical average. In making this assessment, the forecast horizon used for taxable profits is 5 years. Taxable profits that may arise beyond the 5-year horizon are subject to greater uncertainty and have not been considered.
At December 31, 2020, Syngenta has recognized $235 million (2019: $228 million) of net deferred tax assets in the USA, and has not recognized $63 million (2019: $92 million) of deferred tax assets relating to a temporary difference for interest carryforwards. Syngenta has performed an analysis in order to determine the amount of deferred tax asset it should recognize, taking into account the current plans of debt financing Syngenta’s US subsidiaries.
The Coronavirus Aid, Relief, and Economic Security Act (“CARES Act”) The CARES Act, a law intended to address the economic fallout of the COVID-19 pandemic in the United States, came into effect on March 27, 2020. Among many other provisions, the CARES Act increases the tax deduction for net operating losses from 80 percent to 100 percent, for 2018, 2019, and 2020 and allows net operating losses from 2018, 2019, and 2020 to be carried back to up to five years, resulting in retroactive tax refunds. As a result, Syngenta recorded an estimated $27 million favorable one-time impact (tax credit) within income tax expense during 2020.
Swiss Corporate Income Tax Reform The Swiss public voted on May 19, 2019 to adopt the Federal Act on Tax Reform and AHV Financing (“TRAF”) which reforms corporate taxation in Switzerland. The tax reform has several consequences including a change of the Swiss Cantonal and Communal Income Tax Harmonization Act (“CCITHA”) which provides guidance on provisions in the cantonal tax laws for income and capital taxes. The changed CCITHA entered into force at federal level on January 1, 2020. To the extent that the tax reform measures relate to cantonal and communal income tax law changes, the measures will effectively be implemented through modification of the cantonal tax law.
As a result of the changes, described in detail in Note 2 to Syngenta’s 2019 annual consolidated financial statements, Syngenta revalued its Swiss deferred tax positions that will be settled or realized in tax year 2020 onwards, recording an estimated $195 million favorable one-time
Notes to the Syngenta AG Group Consolidated Financial Statements Financial Report 2020
27
impact (tax credit) within income tax expense for the six months ended June 30, 2019, and a $70 million unfavorable one-time impact (tax charge) within OCI for deferred tax positions related to pension actuarial losses charged to OCI.
Uncertain tax positions Syngenta estimates and accrues taxes that will ultimately be payable when reviews or audits by tax authorities of tax returns are completed. These estimates include significant management judgments about the eventual outcome of the reviews and audits of all open years based on the latest information available about the positions expected to be taken by each tax authority. Actual outcomes and settlements may differ significantly from the estimates recorded in these consolidated financial statements. This may affect income tax expense reported in future years’ consolidated income statements.
Syngenta has a global supply chain, and intellectual property rights owned by Syngenta are used internationally within the Syngenta AG group. Transfer prices for the delivery of goods and charges for the provision of services, which include contract research and development, contract manufacturing and internal financing arrangements, by one Syngenta subsidiary to another may be subject to challenge by the national tax authorities in any of the jurisdictions in which Syngenta operates. Syngenta has a global transfer pricing policy in place and applies, to the maximum extent possible, a consistent methodology on a global basis. Transfer pricing determination in general, and the benchmarking process in particular, involve significant judgment and therefore a certain level of uncertainty remains as to whether tax authorities will challenge the pricing applied in the light of the new, complex transfer pricing guidelines in connection with the Base Erosion and Profit Shifting (BEPS) initiative.
At December 31, 2020, Syngenta’s balance sheet includes assets of $88 million (2019: $96 million), and liabilities of $665 million (2019: $551 million), for current income taxes. These liabilities include $491 million in respect of the uncertain tax positions described above (2019: $458 million).
Releases of uncertain tax liabilities during 2020 and 2019 related to changes in tax legislation, closure of previously open tax computations through expiry and settlement of tax audits. The liability for uncertain income tax positions that Syngenta expects will be resolved in 2021 is approximately 8% percent of total recognized current income tax liabilities.
Significant management judgment has been required to estimate the income tax benefits associated with the $1,500 million Viptera litigation settlement payments described in Note 19 because the Syngenta entities named as parties to the litigation are incorporated in different tax jurisdictions. Syngenta’s estimates at December 31, 2020 and 2019 assume that all of the Viptera settlement costs will be deductible for income taxes but that deductions will be claimed in more than one jurisdiction. Syngenta estimated the benefit using an average of the tax rates of the relevant jurisdictions and the amounts it has recognized in 2020 and 2019 for both current and deferred income taxes reflect this estimate. The ultimate benefit realized may be different from this estimate and this difference may have a material effect on Syngenta’s income tax expense for 2021 and/or future periods.
In Brazil, Syngenta received adverse rulings at administrative court level in transfer pricing disputes for fiscal years 2003 and 2011 and has filed appeals at civil court level. Additionally, Syngenta has appealed at administrative level against transfer pricing assessments for fiscal years 2013 to 2015 and won in first degree of administrative level cancelling those assessments. Syngenta believes it will succeed and has recognized no liability for the estimated aggregate $130 million (2019: $170 million) contingent liabilities in these disputes.
Seeds inventory valuation and allowances Inventories of $5,434 million (2019: $4,973 million) reported in Note 10 include $1,237 million (2019: $1,229 million) of seeds, which are subject to the risk of loss through physical deterioration at all stages of the operating cycle. Syngenta accounts for normal losses that occur during production, both in the pre-harvest growing and the post-harvest processing stages, as part of the cost of inventories of in-process and finished seeds. Normal losses in production, which include the cost of seeds discarded before processing because they do not meet Syngenta’s quality standards, are therefore expensed when the related finished seed is sold to customers. Losses of finished seeds are expensed as incurred. Syngenta records allowances against the cost of seeds inventories for both quality and obsolescence. Syngenta records allowances for quality for finished seed which is currently of defective quality and for finished seed which is expected to deteriorate physically before sale, based on past experience. Syngenta records allowances for obsolescence for excess seed for which there is insufficient forecast customer demand over the expected remaining commercial life of each seed variety. For excess seeds that Syngenta is likely to be able to sell in the commodity market, the allowance is the cost of the seed minus its net realizable value, which is estimated as the expected net proceeds of commodity sale. If commodity sale is not probable, the allowance is the full cost of the excess seed inventories.
To determine the allowances required, management effort and judgment is applied to analyze at crop, variety and batch level seed inventory quantity, quality and forecast sales data, developing commercial practices, available markets and the speed of expected product portfolio changes. The rapidly evolving combination of corn seed genetics and trait stacks in North America and Latin America result in shorter commercial lives of a typical hybrid seed variety than in other crops and regions, with variation between actual and previously forecast sales and consequent greater risk of excess seed at individual hybrid level. Excess seed quantities are also affected by harvest yield, which is influenced by unpredictable weather and growing conditions. Seeds inventory allowance expense for 2020 was $149 million (2019: $196 million), with decreased provision expense driven largely by improved volume planning processes in Latin America and the allowance balance at December 31, 2020 was $261 million (2019: $242 million), with higher seeds inventory provisions required for flowers where the business experienced significant sales reductions due to the global pandemic.
Impairment review At December 31, 2020, Syngenta has reported intangible assets of $2,500 million (2019: $2,199 million) for goodwill and $2,627 million (2019: $2,002 million) for intangible assets other than goodwill, as reported in Note 12. The recoverable amount for goodwill has been determined based on value in use of the relevant operating segment, CGU or group of CGUs to which the goodwill is allocated. The recoverable amounts of all material intangible assets and property, plant and equipment (PP&E) have also been based on their value in use.
The main assumptions used in determining the recoverable amounts for operating segments and other CGUs include market size and Syngenta’s market share, future sales prices and volumes, future development expenditures required to maintain products’ marketability and registration in the relevant jurisdictions, and products’ lives. At operating segment level, the key assumptions related to sales volume and value are expressed separately for each product line, market segment and crop. At CGU level, assumptions are expressed by product. The assumptions are reviewed annually as part of management’s budgeting and strategic planning cycles. These assumptions can be subject to significant adjustment from such factors as changes in crop growing patterns in major markets (for example, as a result of movements in crop prices), changes in product registration, or pressure from competitor products. Prior to 2020, estimated cash flows for operating segments and other CGUs were based on Syngenta management forecasts, generally covering a five-year horizon, except where a longer horizon was
Notes to the Syngenta AG Group Consolidated Financial Statements Financial Report 2020
28
required to reflect cash flows from the development and introduction of new products due to the length of the product development cycle, and included a terminal value which assumed a 2.0 percent long-term growth rate. In 2020, for substantially all CGUs relating to Syngenta’s seeds business, a ten-year forecast horizon was used and terminal values assumed long-term growth rates of between -1.0 and 4.0 percent. The longer forecast horizon and higher long-term growth rates were introduced to better reflect these higher-growth business streams and the length of the product development cycle for the development and introduction of new products in these business streams.
Management believes, based on recent and expected future growth in agricultural markets, that there are long-term prospects for continued growth in Syngenta’s business.
The key inputs used to calculate the pre-tax discount rates used to discount the estimated future cash flows included in the value in use calculations are as follows:
post-tax weighted average cost of capital: 7.6 percent (2019: 6.1 percent);
risk-free rate: 1.5 percent (2019: 2.1 percent) equal to market yields on 30-year government bonds at the date of performing the annual impairment test;
equity risk premium: 7.0 percent (2019: 5.0 percent).
The discount rate is considered to include market estimates of an industry sector risk premium. Syngenta’s CGUs generally reflect the global nature of its Crop Protection and Seeds product sales, and a country risk premium is applied only to those CGUs where the geographical scope of operations and cash flows is limited. The equity risk premium was increased to 7.0 percent in the year as a result of the significant uncertainty in the macro-economic outlook due to the impact of the COVID-19 pandemic. This has led to lower market stock prices in most sectors, resulting in higher long-term growth expectations. The pre-tax discount rates used for all segments, CGUs and groups of CGUs ranged from 7.9 percent to 9.2 percent (2019: 6.8 percent to 7.6 percent), with the increase primarily being driven by the change in the equity risk premium.
Management believes that any reasonably possible change in any of the key assumptions described above would not cause the aggregate carrying amount of the CGUs to exceed their recoverable amounts.
At December 31, 2020, the largest amounts of goodwill were allocated to the Crop Core operating segment ($1,276 million), the North America corn and soybean CGU ($316 million) and the Rest of World (excluding North America) corn and soybean CGU ($457 million) and the pre-tax discount rates used were 9.1 percent for Crop Core, 8.8 percent for the North America corn and soybean CGU and 7.9 percent for the Rest of World corn and soybean CGU. At December 31, 2019, the largest amounts of goodwill were allocated to the Crop Core operating segment ($943 million), the North America corn and soybean CGU ($316 million) and the Rest of World (excluding North America) corn and soybean CGU ($502 million) and the pre-tax discount rates used were 7.2 percent for Crop Core, 7.2 percent for the North America corn and soybean CGU and 7.1 percent for the Rest of World corn and soybean CGU. The forecast terminal growth rates used were 2.0 percent for Crop Core, 2.6 percent for the North America corn and soybean CGU and 2.9 percent for the Rest of World corn and soybean CGU. For December 31, 2019 forecast terminal growth rates of 2.0 percent were used for all the above CGUs.
For the year ended December 31, 2020, impairment losses for intangible assets were $82 million, of which $17 million relates to a seeds crop CGU where further development of certain technologies held by Syngenta is not considered cost effective and activities have been reduced. At December 31, 2020, the recoverable amount of this CGU was $24 million and its carrying amount included non-current assets of $41 million. For the year ended December 31, 2019, impairment losses for intangible assets were $52 million, of which $41 million relates to a seeds crop CGU where further development of certain technologies held by Syngenta is not considered cost effective and activities have been reduced. At December 31, 2019, the recoverable amount of this CGU was $2,519 million and its carrying amount included non-current assets of $745 million.
For the year ended December 31, 2020, impairment losses for property, plant and equipment were $23 million (2019: $110 million) relating mainly to the withdrawal from a specific seeds-based technology.
Environmental provisions At December 31, 2020, Syngenta reported in Note 19 provisions for environmental remediation of $179 million (2019: $180 million), some of which are included within restructuring provisions. Remediation of environmental damage at sites with which Syngenta is associated typically takes a long time to complete due to the substantial amount of planning and regulatory approvals normally required before remediation activities can begin. The assumptions used by Syngenta to estimate its environmental provisions may change significantly before or during the remediation period due to changes in the extent of remediation required or the method used to remediate the damage. In addition, increases in or releases of environmental provisions may be necessary whenever new developments occur or additional information becomes available. The major uncertainties that impact the outcome of remediation are:
the extent of the contaminated land area, which is not always limited to land occupied by the Syngenta site. Ongoing monitoring or remediation work may identify changes in the area believed to be contaminated;
the nature of the work Syngenta will be obliged to perform or pay for. This depends upon the current or proposed use of contaminated land, substantively enacted legislation, and land zoning by and negotiation with the relevant regulatory authorities. In Switzerland, proposed remediation plans at certain sites may be subject to public referenda;
sharing of costs with other past and present occupiers of Syngenta’s sites. At certain shared sites, Syngenta is responsible for an agreed proportion of remediation costs, which may change following discussions with authorities and the affected third parties. At other sites, third parties have agreed to reimburse Syngenta for some or all of the costs it incurs.
Consequently, environmental provisions can change significantly. Because of the inherent uncertainties in estimating such long-term future obligations, Syngenta periodically supplements its internal expertise with external expertise when determining environmental provisions.
In 2020, $9 million of environmental provisions were recognized due to updated estimates of costs for remediation activity. In 2019, $13 million of environmental provisions were recognized related to remediation triggered by the announced closure of a US manufacturing site. In 2020, $5 million (2019: $8 million) of provisions were released due to regulatory and other indications that remediation requirements at various sites were substantially complete. Otherwise, in 2020 and 2019, except for $14 million (2019: $9 million) of cash outflows reflecting remediation activity, there were no significant changes to environmental provisions.
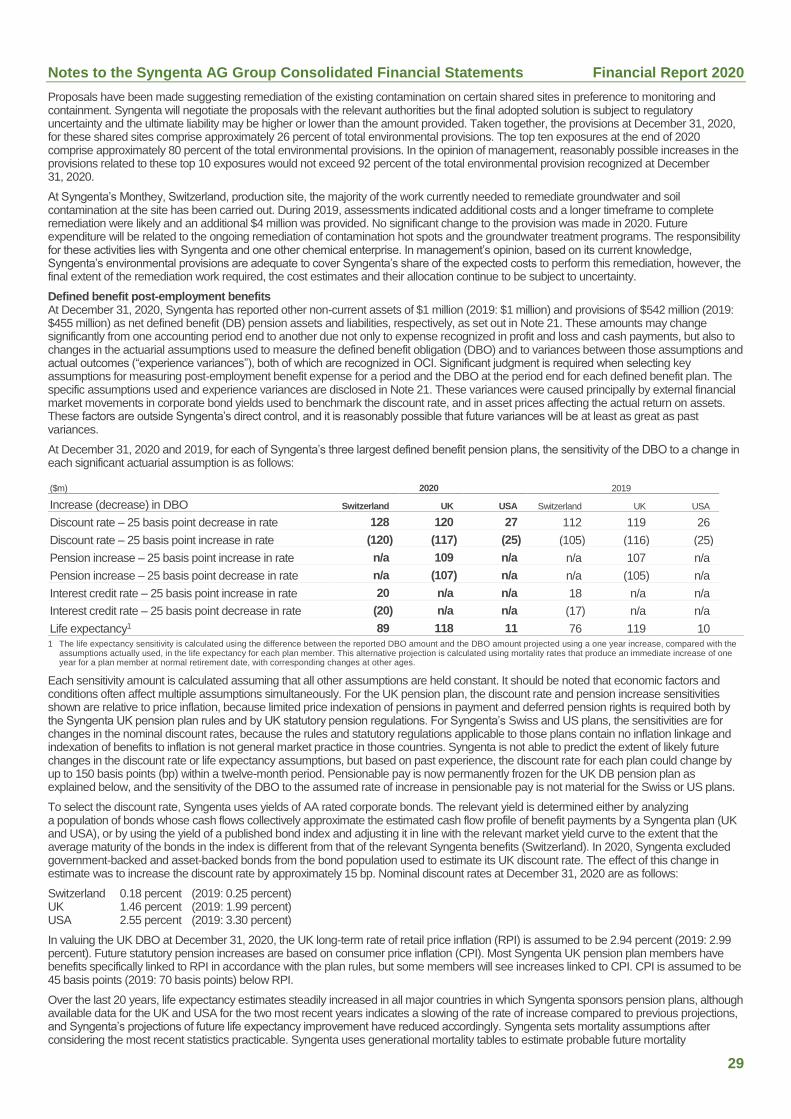
Notes to the Syngenta AG Group Consolidated Financial Statements Financial Report 2020
29
Proposals have been made suggesting remediation of the existing contamination on certain shared sites in preference to monitoring and containment. Syngenta will negotiate the proposals with the relevant authorities but the final adopted solution is subject to regulatory uncertainty and the ultimate liability may be higher or lower than the amount provided. Taken together, the provisions at December 31, 2020, for these shared sites comprise approximately 26 percent of total environmental provisions. The top ten exposures at the end of 2020 comprise approximately 80 percent of the total environmental provisions. In the opinion of management, reasonably possible increases in the provisions related to these top 10 exposures would not exceed 92 percent of the total environmental provision recognized at December 31, 2020.
At Syngenta’s Monthey, Switzerland, production site, the majority of the work currently needed to remediate groundwater and soil contamination at the site has been carried out. During 2019, assessments indicated additional costs and a longer timeframe to complete remediation were likely and an additional $4 million was provided. No significant change to the provision was made in 2020. Future expenditure will be related to the ongoing remediation of contamination hot spots and the groundwater treatment programs. The responsibility for these activities lies with Syngenta and one other chemical enterprise. In management’s opinion, based on its current knowledge, Syngenta’s environmental provisions are adequate to cover Syngenta’s share of the expected costs to perform this remediation, however, the final extent of the remediation work required, the cost estimates and their allocation continue to be subject to uncertainty.
Defined benefit post-employment benefits At December 31, 2020, Syngenta has reported other non-current assets of $1 million (2019: $1 million) and provisions of $542 million (2019: $455 million) as net defined benefit (DB) pension assets and liabilities, respectively, as set out in Note 21. These amounts may change significantly from one accounting period end to another due not only to expense recognized in profit and loss and cash payments, but also to changes in the actuarial assumptions used to measure the defined benefit obligation (DBO) and to variances between those assumptions and actual outcomes (“experience variances”), both of which are recognized in OCI. Significant judgment is required when selecting key assumptions for measuring post-employment benefit expense for a period and the DBO at the period end for each defined benefit plan. The specific assumptions used and experience variances are disclosed in Note 21. These variances were caused principally by external financial market movements in corporate bond yields used to benchmark the discount rate, and in asset prices affecting the actual return on assets. These factors are outside Syngenta’s direct control, and it is reasonably possible that future variances will be at least as great as past variances.
At December 31, 2020 and 2019, for each of Syngenta’s three largest defined benefit pension plans, the sensitivity of the DBO to a change in each significant actuarial assumption is as follows:
($m) 2020 2019
Increase (decrease) in DBO Switzerland UK USA Switzerland UK USA
Discount rate – 25 basis point decrease in rate 128 120 27 112 119 26
Discount rate – 25 basis point increase in rate (120) (117) (25) (105) (116) (25)
Pension increase – 25 basis point increase in rate n/a 109 n/a n/a 107 n/a
Pension increase – 25 basis point decrease in rate n/a (107) n/a n/a (105) n/a
Interest credit rate – 25 basis point increase in rate 20 n/a n/a 18 n/a n/a
Interest credit rate – 25 basis point decrease in rate (20) n/a n/a (17) n/a n/a
Life expectancy1 89 118 11 76 119 10
1 The life expectancy sensitivity is calculated using the difference between the reported DBO amount and the DBO amount projected using a one year increase, compared with the assumptions actually used, in the life expectancy for each plan member. This alternative projection is calculated using mortality rates that produce an immediate increase of one year for a plan member at normal retirement date, with corresponding changes at other ages.
Each sensitivity amount is calculated assuming that all other assumptions are held constant. It should be noted that economic factors and conditions often affect multiple assumptions simultaneously. For the UK pension plan, the discount rate and pension increase sensitivities shown are relative to price inflation, because limited price indexation of pensions in payment and deferred pension rights is required both by the Syngenta UK pension plan rules and by UK statutory pension regulations. For Syngenta’s Swiss and US plans, the sensitivities are for changes in the nominal discount rates, because the rules and statutory regulations applicable to those plans contain no inflation linkage and indexation of benefits to inflation is not general market practice in those countries. Syngenta is not able to predict the extent of likely future changes in the discount rate or life expectancy assumptions, but based on past experience, the discount rate for each plan could change by up to 150 basis points (bp) within a twelve-month period. Pensionable pay is now permanently frozen for the UK DB pension plan as explained below, and the sensitivity of the DBO to the assumed rate of increase in pensionable pay is not material for the Swiss or US plans.
To select the discount rate, Syngenta uses yields of AA rated corporate bonds. The relevant yield is determined either by analyzing a population of bonds whose cash flows collectively approximate the estimated cash flow profile of benefit payments by a Syngenta plan (UK and USA), or by using the yield of a published bond index and adjusting it in line with the relevant market yield curve to the extent that the average maturity of the bonds in the index is different from that of the relevant Syngenta benefits (Switzerland). In 2020, Syngenta excluded government-backed and asset-backed bonds from the bond population used to estimate its UK discount rate. The effect of this change in estimate was to increase the discount rate by approximately 15 bp. Nominal discount rates at December 31, 2020 are as follows:
Switzerland 0.18 percent (2019: 0.25 percent) UK 1.46 percent (2019: 1.99 percent) USA 2.55 percent (2019: 3.30 percent)
In valuing the UK DBO at December 31, 2020, the UK long-term rate of retail price inflation (RPI) is assumed to be 2.94 percent (2019: 2.99 percent). Future statutory pension increases are based on consumer price inflation (CPI). Most Syngenta UK pension plan members have benefits specifically linked to RPI in accordance with the plan rules, but some members will see increases linked to CPI. CPI is assumed to be 45 basis points (2019: 70 basis points) below RPI.
Over the last 20 years, life expectancy estimates steadily increased in all major countries in which Syngenta sponsors pension plans, although available data for the UK and USA for the two most recent years indicates a slowing of the rate of increase compared to previous projections, and Syngenta’s projections of future life expectancy improvement have reduced accordingly. Syngenta sets mortality assumptions after considering the most recent statistics practicable. Syngenta uses generational mortality tables to estimate probable future mortality
Notes to the Syngenta AG Group Consolidated Financial Statements Financial Report 2020
30
improvements. These tables assume that the trend of increasing life expectancy will continue, resulting in pension benefit payments to younger members being likely to be paid for longer time periods than older members’ pensions, given that assumed retirement ages are those defined in the rules of each plan. At December 31, 2020, the UK DBO was estimated using mortality rates based on the UK Institute and Faculty of Actuaries’ CMI SAPS Pensioner Amounts Light Tables with 1.75 percent per annum long-term trend from 2002-2018 (2019: CMI SAPS Pensioner Amounts Light tables with 1.75 percent per annum long term trend from 2002-2018), with assumed future improvement of 1.25 percent (2019: 1.25 percent) per annum in line with the CMI Core Projections model 2019 (2019: CMI Core Projections model 2018). The default smoothing parameter which determines how much importance should be given to evidence of more recent mortality improvement data as opposed to longer-term historical data changed in the CMI 2018 model from 7.5 in CMI 2017 to 7.0. Syngenta adopted the default value of 7.0 as mortality experience suggests more weight should be placed on recent data. This reduced the DBO by $31 million in 2019. Mortality assumptions were updated in 2018 following the most recent triennial valuation for UK statutory purposes at March 31, 2018, reducing the DBO by $54 million (2.2 percent). The next statutory valuation of the plan will be performed at the latest at March 31, 2021.
At December 31, 2020 and 2019 Syngenta valued the benefit obligation for its Swiss pension plan using mortality, disability and employee turnover assumptions from the BVG 2015 generational table. When Syngenta began to apply that table in 2016, the Swiss DBO increased by $75 million (3.4 percent). At December 31, 2020, Syngenta valued the benefit obligation for its US pension plan using mortality assumptions from the PRI-2012 generational mortality table together with Scale MP-2019 mortality improvements starting with base year 2012 (2019: base year 2012). This resulted in no material change in the benefit obligation compared to the assumptions previously used.
Syngenta’s major pension plans give members lump sum or annuity benefit payment options. Syngenta values its pension liabilities on the assumption that the choices made by members who will retire in the future will be consistent with choices made by members who have retired recently.
For calculating benefits of UK plan members, pensionable pay will remain frozen at January 1, 2016 levels. The plan remains open to benefit accrual for existing members, and pay increases awarded after January 1, 2016, which are not part of defined benefit pensionable pay, are pensionable under the Syngenta Group Personal Pension (GPP), a separate defined contribution plan, for those who choose to join. Employees who choose to leave the defined benefit section of the UK pension plan are able to join the GPP. Recent regulatory changes allow members aged at least 55 to transfer their benefits out of the plan into arrangements which allow flexible cash withdrawals, in contrast to the previous requirement that members take at least 75 percent of their benefit in annuity form. Market conditions in recent years have resulted in transfer values favorable to members. These factors resulted in $44 million (2019: $46 million) of benefit payments out of the UK plan as certain members withdrew all their benefits. Syngenta has not made any allowance for future transfers out in connection with the regulatory changes. Available data indicates that if transfers were to continue at the current rate until the next statutory valuation, this would not cause Syngenta to recognize a material actuarial gain or loss in its consolidated financial statements.
Certain UK pension plans, including the Syngenta UK plan, were required by legislation in force between 1978 and 1997 to accrue part of their members’ pension (“GMP”) in a way that gave rise to inequalities between men and women, but also had a formula independent of GMP for the total pension, resulting in the non-GMP part of total pension also being unequal. The European Court of Justice in Barber v Guardian Royal Exchange Assurance Group [1991] ruled that pensions earned from that point onwards must treat men and women equally. However, given GMP benefits were unequal but were prescribed in legislation, it was unclear what would need to be equalized or how. This remained the case until the October 2018 UK High Court decision in Lloyds Trustees vs Lloyds Bank PLC and Others (the Lloyds case), which confirmed that pension plans are required to equalize the non-GMP part of members’ benefits earned between 1990 and 1997, when legislation changed so that GMPs ceased to accrue. The Lloyds case decision also indicated that the employers could require the plan trustees to choose a particular approach to equalization, “Method C2”, which requires comparison of the pension payable to each member with the pension that would be payable to a notional member identical to the member in all respects except gender, and retrospective payment of accumulated pension equal to the higher of the unequalized male or female benefit, together with interest on the underpaid amount. Syngenta has increased the UK DBO in 2018 by $22 million to reflect the effect of applying Method C2 as set out in the Lloyds case decision using estimates based on current aggregate member data, accounting for this as an actuarial loss. This estimate is subject to significant uncertainty because certain points remain to be clarified following the court judgment, detailed calculations by member are not yet available and the actual effect of equalizing benefits may differ. On November 20, 2020, a further court judgement on the Lloyds case clarified that historical transfers out also require allowance for GMP equalization. As a result, Syngenta has increased the DBO by $4 million to reflect the effect of this judgement.
IFRSs require Syngenta to estimate the economic benefit it can obtain from the amount by which the fair value of assets held in a DB plan exceeds the DBO measured in accordance with IAS 19 (“surplus”), and recognize a reduction in the net DB asset to the extent that the future economic benefit is lower than the actual surplus at the reporting date, or an increase in the net DB liability if the future economic benefit is lower than the projected future surplus that would arise when Syngenta meets an existing minimum funding obligation. Accounting recognition of a surplus in Syngenta’s UK defined benefit pension plan is supported by the economic benefit of future contribution savings and, when that benefit is less than the surplus, also by the future refund, net of applicable taxes, which will be unconditionally available to Syngenta when all liabilities have been settled. At December 31, 2020, Syngenta recognized $nil (2019: $28 million) additional liability, mainly because the projected surplus decreased due to lower discount rate assumptions (2019: mainly because the projected surplus decreased due to lower discount rate assumptions). This additional liability represents taxes Syngenta would suffer on the portion of the projected surplus supported by Syngenta’s refund rights. Benefit accrual for existing members of Syngenta’s main US pension plan was frozen as from December 31, 2018, as further described in Note 21 below. At December 31, 2020, Syngenta has recognized $nil (2019: $nil) of the $20 million (2019: $2 million) surplus as an asset, because without future service cost there is no economic benefit from future contribution savings, and US pension regulations do not permit a refund. At December 31, 2020 and 2019, there was no surplus in Syngenta’s Swiss pension plan.
Litigation provisions Syngenta’s accounting estimates related to provisions for litigation are disclosed in Note 19.
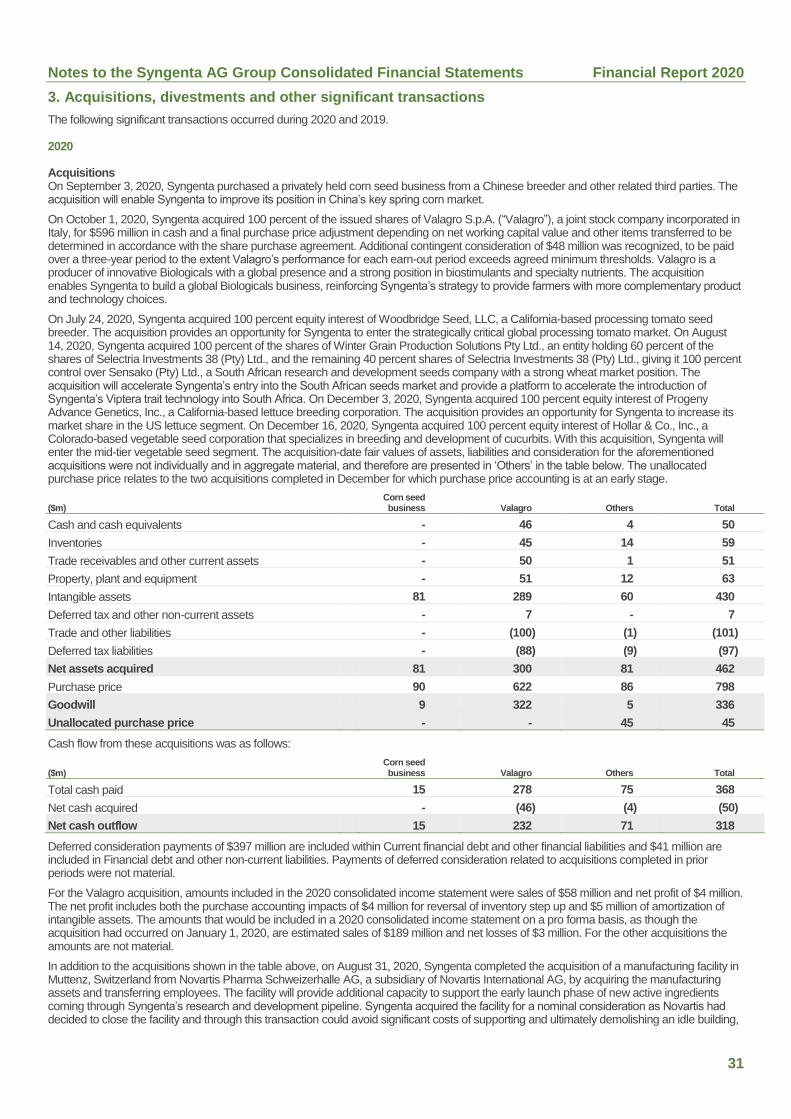
Notes to the Syngenta AG Group Consolidated Financial Statements Financial Report 2020
31
3. Acquisitions, divestments and other significant transactions
The following significant transactions occurred during 2020 and 2019.
2020
Acquisitions On September 3, 2020, Syngenta purchased a privately held corn seed business from a Chinese breeder and other related third parties. The acquisition will enable Syngenta to improve its position in China’s key spring corn market.
On October 1, 2020, Syngenta acquired 100 percent of the issued shares of Valagro S.p.A. (“Valagro”), a joint stock company incorporated in Italy, for $596 million in cash and a final purchase price adjustment depending on net working capital value and other items transferred to be determined in accordance with the share purchase agreement. Additional contingent consideration of $48 million was recognized, to be paid over a three-year period to the extent Valagro’s performance for each earn-out period exceeds agreed minimum thresholds. Valagro is a producer of innovative Biologicals with a global presence and a strong position in biostimulants and specialty nutrients. The acquisition enables Syngenta to build a global Biologicals business, reinforcing Syngenta’s strategy to provide farmers with more complementary product and technology choices.
On July 24, 2020, Syngenta acquired 100 percent equity interest of Woodbridge Seed, LLC, a California-based processing tomato seed breeder. The acquisition provides an opportunity for Syngenta to enter the strategically critical global processing tomato market. On August 14, 2020, Syngenta acquired 100 percent of the shares of Winter Grain Production Solutions Pty Ltd., an entity holding 60 percent of the shares of Selectria Investments 38 (Pty) Ltd., and the remaining 40 percent shares of Selectria Investments 38 (Pty) Ltd., giving it 100 percent control over Sensako (Pty) Ltd., a South African research and development seeds company with a strong wheat market position. The acquisition will accelerate Syngenta’s entry into the South African seeds market and provide a platform to accelerate the introduction of Syngenta’s Viptera trait technology into South Africa. On December 3, 2020, Syngenta acquired 100 percent equity interest of Progeny Advance Genetics, Inc., a California-based lettuce breeding corporation. The acquisition provides an opportunity for Syngenta to increase its market share in the US lettuce segment. On December 16, 2020, Syngenta acquired 100 percent equity interest of Hollar & Co., Inc., a Colorado-based vegetable seed corporation that specializes in breeding and development of cucurbits. With this acquisition, Syngenta will enter the mid-tier vegetable seed segment. The acquisition-date fair values of assets, liabilities and consideration for the aforementioned acquisitions were not individually and in aggregate material, and therefore are presented in ‘Others’ in the table below. The unallocated purchase price relates to the two acquisitions completed in December for which purchase price accounting is at an early stage.
($m) Corn seed business Valagro Others Total
Cash and cash equivalents - 46 4 50
Inventories - 45 14 59
Trade receivables and other current assets - 50 1 51
Property, plant and equipment - 51 12 63
Intangible assets 81 289 60 430
Deferred tax and other non-current assets - 7 - 7
Trade and other liabilities - (100) (1) (101)
Deferred tax liabilities - (88) (9) (97)
Net assets acquired 81 300 81 462
Purchase price 90 622 86 798
Goodwill 9 322 5 336
Unallocated purchase price - - 45 45
Cash flow from these acquisitions was as follows:
($m) Corn seed business Valagro Others Total
Total cash paid 15 278 75 368
Net cash acquired - (46) (4) (50)
Net cash outflow 15 232 71 318
Deferred consideration payments of $397 million are included within Current financial debt and other financial liabilities and $41 million are included in Financial debt and other non-current liabilities. Payments of deferred consideration related to acquisitions completed in prior periods were not material.
For the Valagro acquisition, amounts included in the 2020 consolidated income statement were sales of $58 million and net profit of $4 million. The net profit includes both the purchase accounting impacts of $4 million for reversal of inventory step up and $5 million of amortization of intangible assets. The amounts that would be included in a 2020 consolidated income statement on a pro forma basis, as though the acquisition had occurred on January 1, 2020, are estimated sales of $189 million and net losses of $3 million. For the other acquisitions the amounts are not material.
In addition to the acquisitions shown in the table above, on August 31, 2020, Syngenta completed the acquisition of a manufacturing facility in Muttenz, Switzerland from Novartis Pharma Schweizerhalle AG, a subsidiary of Novartis International AG, by acquiring the manufacturing assets and transferring employees. The facility will provide additional capacity to support the early launch phase of new active ingredients coming through Syngenta’s research and development pipeline. Syngenta acquired the facility for a nominal consideration as Novartis had decided to close the facility and through this transaction could avoid significant costs of supporting and ultimately demolishing an idle building,
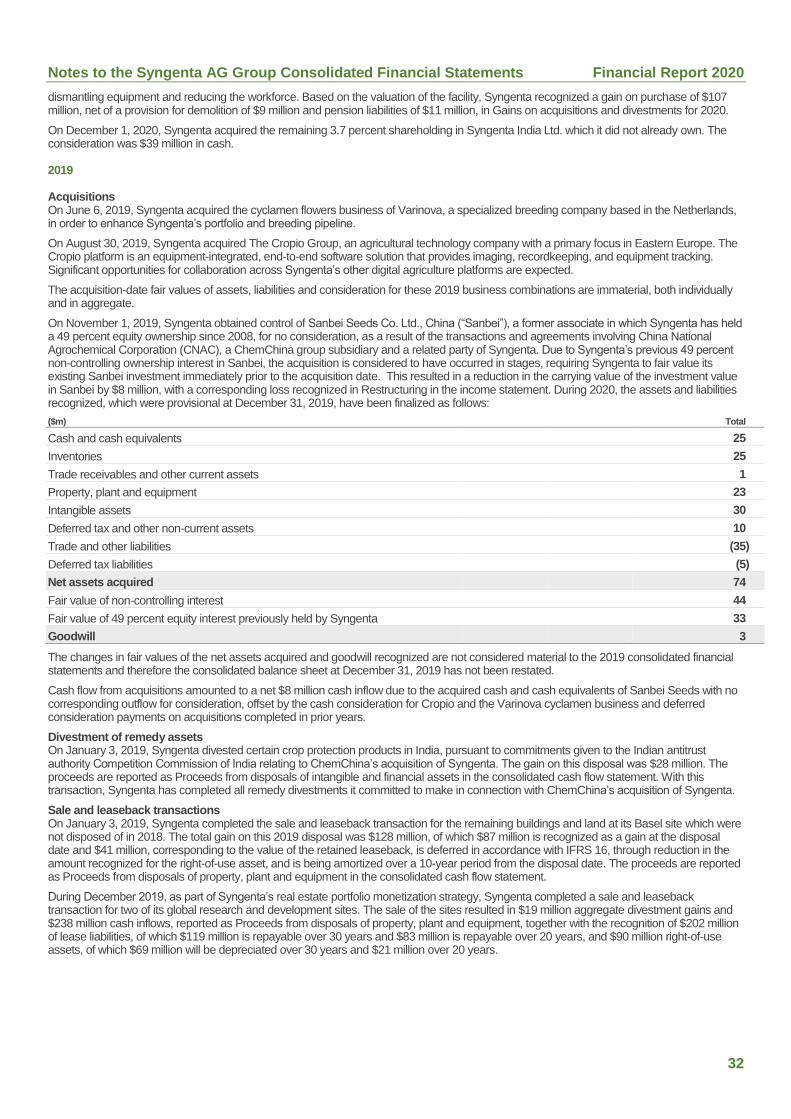
Notes to the Syngenta AG Group Consolidated Financial Statements Financial Report 2020
32
dismantling equipment and reducing the workforce. Based on the valuation of the facility, Syngenta recognized a gain on purchase of $107 million, net of a provision for demolition of $9 million and pension liabilities of $11 million, in Gains on acquisitions and divestments for 2020.
On December 1, 2020, Syngenta acquired the remaining 3.7 percent shareholding in Syngenta India Ltd. which it did not already own. The consideration was $39 million in cash.
2019
Acquisitions On June 6, 2019, Syngenta acquired the cyclamen flowers business of Varinova, a specialized breeding company based in the Netherlands, in order to enhance Syngenta’s portfolio and breeding pipeline.
On August 30, 2019, Syngenta acquired The Cropio Group, an agricultural technology company with a primary focus in Eastern Europe. The Cropio platform is an equipment-integrated, end-to-end software solution that provides imaging, recordkeeping, and equipment tracking. Significant opportunities for collaboration across Syngenta’s other digital agriculture platforms are expected.
The acquisition-date fair values of assets, liabilities and consideration for these 2019 business combinations are immaterial, both individually and in aggregate.
On November 1, 2019, Syngenta obtained control of Sanbei Seeds Co. Ltd., China (“Sanbei”), a former associate in which Syngenta has held a 49 percent equity ownership since 2008, for no consideration, as a result of the transactions and agreements involving China National Agrochemical Corporation (CNAC), a ChemChina group subsidiary and a related party of Syngenta. Due to Syngenta’s previous 49 percent non-controlling ownership interest in Sanbei, the acquisition is considered to have occurred in stages, requiring Syngenta to fair value its existing Sanbei investment immediately prior to the acquisition date. This resulted in a reduction in the carrying value of the investment value in Sanbei by $8 million, with a corresponding loss recognized in Restructuring in the income statement. During 2020, the assets and liabilities recognized, which were provisional at December 31, 2019, have been finalized as follows:
($m) Total
Cash and cash equivalents 25
Inventories 25
Trade receivables and other current assets 1
Property, plant and equipment 23
Intangible assets 30
Deferred tax and other non-current assets 10
Trade and other liabilities (35)
Deferred tax liabilities (5)
Net assets acquired 74
Fair value of non-controlling interest 44
Fair value of 49 percent equity interest previously held by Syngenta 33
Goodwill 3
The changes in fair values of the net assets acquired and goodwill recognized are not considered material to the 2019 consolidated financial statements and therefore the consolidated balance sheet at December 31, 2019 has not been restated.
Cash flow from acquisitions amounted to a net $8 million cash inflow due to the acquired cash and cash equivalents of Sanbei Seeds with no corresponding outflow for consideration, offset by the cash consideration for Cropio and the Varinova cyclamen business and deferred consideration payments on acquisitions completed in prior years.
Divestment of remedy assets On January 3, 2019, Syngenta divested certain crop protection products in India, pursuant to commitments given to the Indian antitrust authority Competition Commission of India relating to ChemChina’s acquisition of Syngenta. The gain on this disposal was $28 million. The proceeds are reported as Proceeds from disposals of intangible and financial assets in the consolidated cash flow statement. With this transaction, Syngenta has completed all remedy divestments it committed to make in connection with ChemChina’s acquisition of Syngenta.
Sale and leaseback transactions On January 3, 2019, Syngenta completed the sale and leaseback transaction for the remaining buildings and land at its Basel site which were not disposed of in 2018. The total gain on this 2019 disposal was $128 million, of which $87 million is recognized as a gain at the disposal date and $41 million, corresponding to the value of the retained leaseback, is deferred in accordance with IFRS 16, through reduction in the amount recognized for the right-of-use asset, and is being amortized over a 10-year period from the disposal date. The proceeds are reported as Proceeds from disposals of property, plant and equipment in the consolidated cash flow statement.
During December 2019, as part of Syngenta’s real estate portfolio monetization strategy, Syngenta completed a sale and leaseback transaction for two of its global research and development sites. The sale of the sites resulted in $19 million aggregate divestment gains and $238 million cash inflows, reported as Proceeds from disposals of property, plant and equipment, together with the recognition of $202 million of lease liabilities, of which $119 million is repayable over 30 years and $83 million is repayable over 20 years, and $90 million right-of-use assets, of which $69 million will be depreciated over 30 years and $21 million over 20 years.

Notes to the Syngenta AG Group Consolidated Financial Statements Financial Report 2020
33
4. Segmental breakdown of key figures for the years ended December 31, 2020 and 2019
Syngenta has five operating segments consisting of the Crop Core, Professional Solutions, Field Crops, Vegetables and Flowers businesses. These have been aggregated into the global Crop Protection reporting segment, consisting of Crop Core and Professional Solutions, and the global Seeds reporting segment, consisting of Field Crops, Vegetables and Flowers. Aggregation is based on internal management structures and underlying economic similarity. Crop Core and Professional Solutions have been aggregated because the similarities in their products, production processes, distribution methods and regulatory environments are much more significant than the differences in the market segments to which their respective customer bases sell, and they each have similar economic performance. Field Crops, Vegetables and Flowers have been aggregated because the extensive similarities which each of these businesses has with the others in their products and customers, their production and distribution processes and the regulatory environment for their products are much more significant than their respective differences, which relate to regulatory processes for GM traits used in certain Field Crops products and to the differences in a proportion of their respective customer bases. Also, the economic performance of these businesses is expected to be similar. Segment performance is managed based on segment operating income before restructuring costs and divestments, which is the measure of segment profit or loss presented, and is based on the same accounting policies as consolidated operating income.
Transactions between segments are generally priced based on the third party selling prices achieved by the purchasing segment less an allowance for selling and distribution profit margins for the purchasing segment.
2020 ($m) Crop Protection Seeds Total segments Restructuring Syngenta
Product sales - to third parties 11,069 2,923 13,992 ‐ 13,992
Royalty and license income - from third parties 25 270 295 ‐ 295
Total segment sales 11,094 3,193 14,287 ‐ 14,287
Cost of goods sold (6,408) (1,699) (8,107) (6) (8,113)
Gross profit 4,686 1,494 6,180 (6) 6,174
Marketing and distribution (1,486) (724) (2,210) ‐ (2,210)
Research and development (577) (392) (969) ‐ (969)
General and administrative:
Restructuring ‐ ‐ ‐ (291) (291)
Gains on acquisitions and divestments ‐ ‐ ‐ 109 109
Other general and administrative (462) (244) (706) ‐ (706)
Operating income 2,161 134 2,295 (188) 2,107
Included in the above operating income are:
Personnel costs (2,081) (983) (3,064) (50) (3,114)
Depreciation of property, plant and equipment and right-of-use assets (308) (131) (439) - (439)
Amortization of intangible assets (130) (124) (254) - (254)
Impairment of property, plant and equipment, right-of-use, intangible and financial assets - - - (112) (112)
Other non-cash items including charges in respect of provisions (90) 4 (86) 63 (23)
Gains on hedges reported in operating income 69 6 75 - 75
Operating income reconciles to consolidated income before taxes as follows:
2020 ($m)
Operating income 2,107
Financial expense, net (497)
Income before taxes 1,610
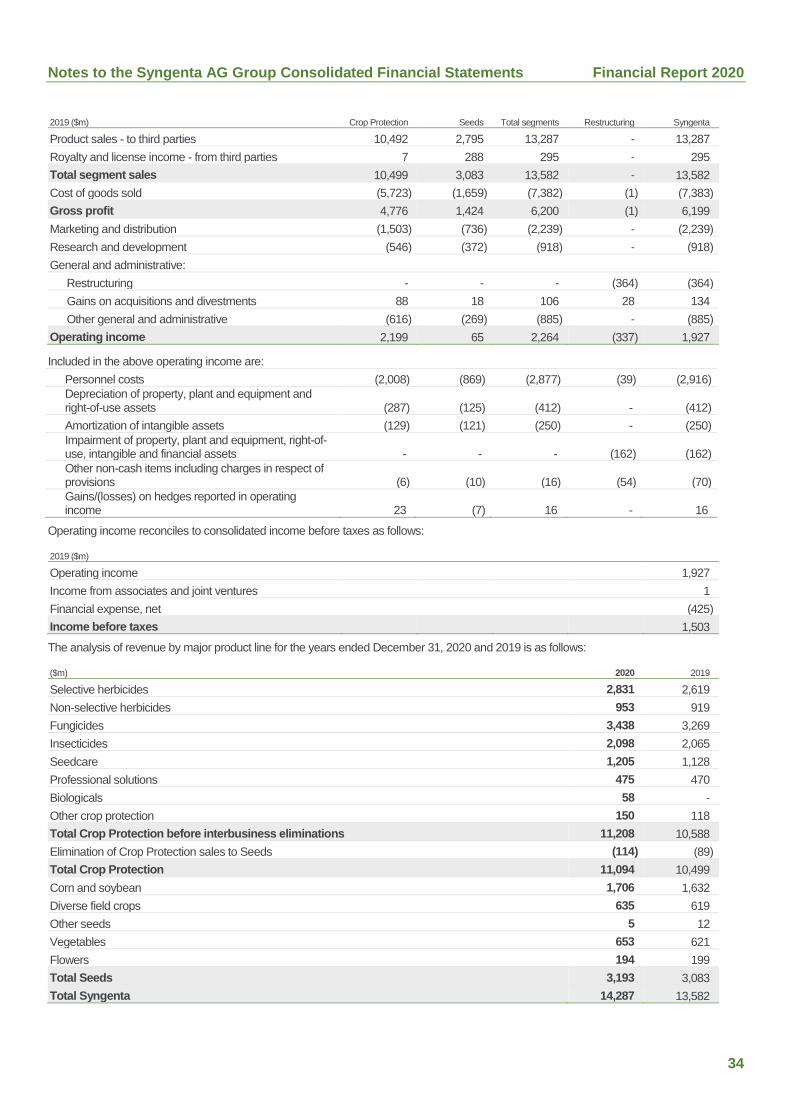
Notes to the Syngenta AG Group Consolidated Financial Statements Financial Report 2020
34
2019 ($m) Crop Protection Seeds Total segments Restructuring Syngenta
Product sales - to third parties 10,492 2,795 13,287 ‐ 13,287
Royalty and license income - from third parties 7 288 295 ‐ 295
Total segment sales 10,499 3,083 13,582 ‐ 13,582
Cost of goods sold (5,723) (1,659) (7,382) (1) (7,383)
Gross profit 4,776 1,424 6,200 (1) 6,199
Marketing and distribution (1,503) (736) (2,239) ‐ (2,239)
Research and development (546) (372) (918) ‐ (918)
General and administrative:
Restructuring ‐ ‐ ‐ (364) (364)
Gains on acquisitions and divestments 88 18 106 28 134
Other general and administrative (616) (269) (885) ‐ (885)
Operating income 2,199 65 2,264 (337) 1,927
Included in the above operating income are:
Personnel costs (2,008) (869) (2,877) (39) (2,916)
Depreciation of property, plant and equipment and right-of-use assets (287) (125) (412) - (412)
Amortization of intangible assets (129) (121) (250) - (250)
Impairment of property, plant and equipment, right-of-use, intangible and financial assets - - - (162) (162)
Other non-cash items including charges in respect of provisions (6) (10) (16) (54) (70)
Gains/(losses) on hedges reported in operating income 23 (7) 16 - 16
Operating income reconciles to consolidated income before taxes as follows:
2019 ($m)
Operating income 1,927
Income from associates and joint ventures 1
Financial expense, net (425)
Income before taxes 1,503
The analysis of revenue by major product line for the years ended December 31, 2020 and 2019 is as follows:
($m) 2020 2019
Selective herbicides 2,831 2,619
Non-selective herbicides 953 919
Fungicides 3,438 3,269
Insecticides 2,098 2,065
Seedcare 1,205 1,128
Professional solutions 475 470
Biologicals 58 ‐
Other crop protection 150 118
Total Crop Protection before interbusiness eliminations 11,208 10,588
Elimination of Crop Protection sales to Seeds (114) (89)
Total Crop Protection 11,094 10,499
Corn and soybean 1,706 1,632
Diverse field crops 635 619
Other seeds 5 12
Vegetables 653 621
Flowers 194 199
Total Seeds 3,193 3,083
Total Syngenta 14,287 13,582
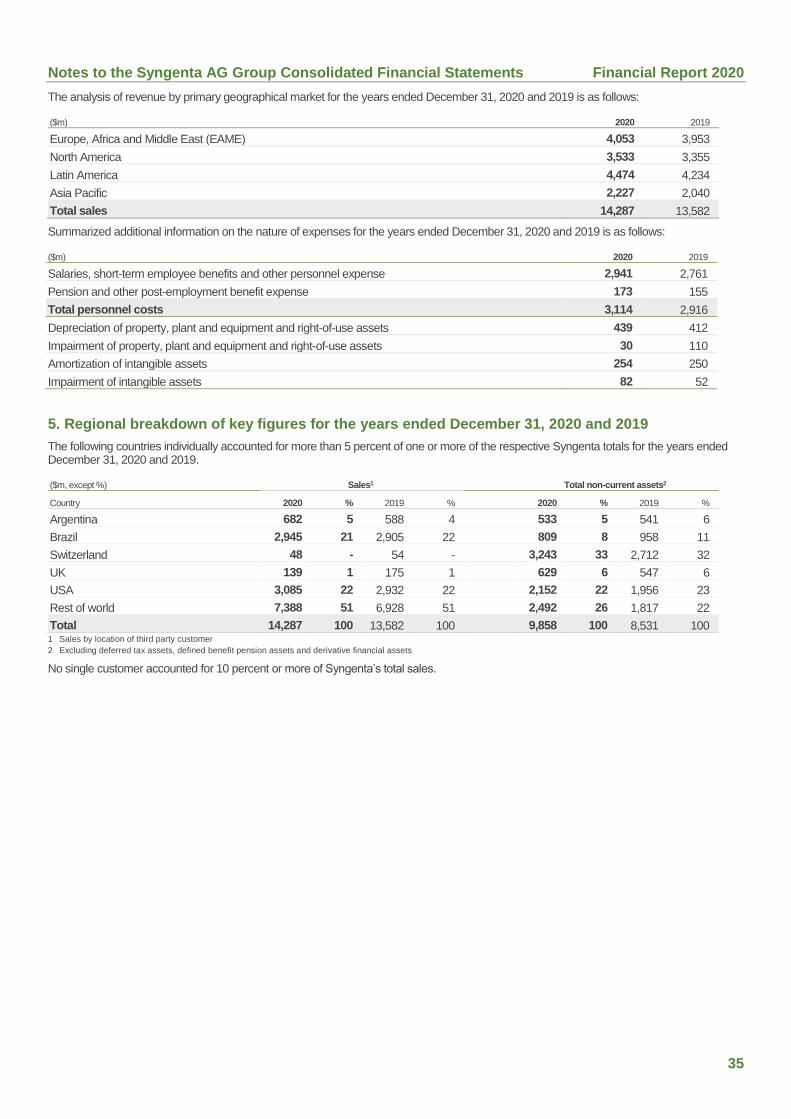
Notes to the Syngenta AG Group Consolidated Financial Statements Financial Report 2020
35
The analysis of revenue by primary geographical market for the years ended December 31, 2020 and 2019 is as follows:
($m) 2020 2019
Europe, Africa and Middle East (EAME) 4,053 3,953
North America 3,533 3,355
Latin America 4,474 4,234
Asia Pacific 2,227 2,040
Total sales 14,287 13,582
Summarized additional information on the nature of expenses for the years ended December 31, 2020 and 2019 is as follows:
($m) 2020 2019
Salaries, short-term employee benefits and other personnel expense 2,941 2,761
Pension and other post-employment benefit expense 173 155
Total personnel costs 3,114 2,916
Depreciation of property, plant and equipment and right-of-use assets 439 412
Impairment of property, plant and equipment and right-of-use assets 30 110
Amortization of intangible assets 254 250
Impairment of intangible assets 82 52
5. Regional breakdown of key figures for the years ended December 31, 2020 and 2019
The following countries individually accounted for more than 5 percent of one or more of the respective Syngenta totals for the years ended December 31, 2020 and 2019.
($m, except %) Sales1 Total non-current assets2
Country 2020 % 2019 % 2020 % 2019 %
Argentina 682 5 588 4 533 5 541 6
Brazil 2,945 21 2,905 22 809 8 958 11
Switzerland 48 - 54 - 3,243 33 2,712 32
UK 139 1 175 1 629 6 547 6
USA 3,085 22 2,932 22 2,152 22 1,956 23
Rest of world 7,388 51 6,928 51 2,492 26 1,817 22
Total 14,287 100 13,582 100 9,858 100 8,531 100 1 Sales by location of third party customer
2 Excluding deferred tax assets, defined benefit pension assets and derivative financial assets
No single customer accounted for 10 percent or more of Syngenta’s total sales.
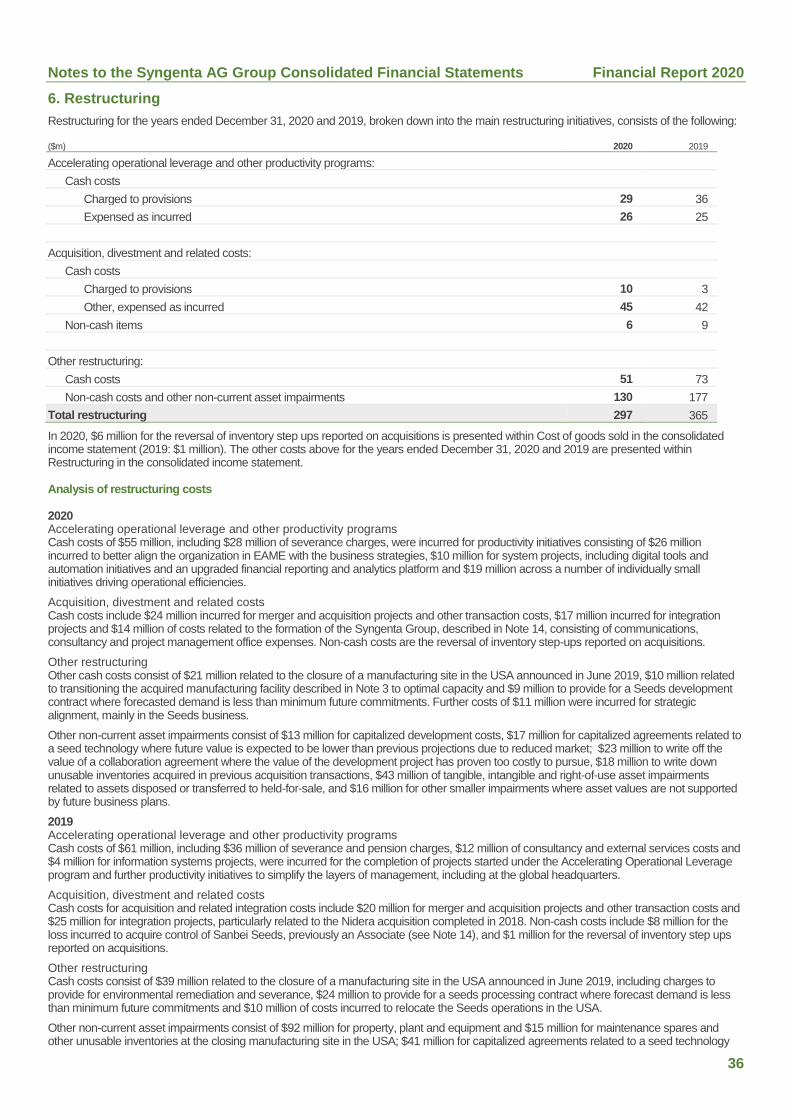
Notes to the Syngenta AG Group Consolidated Financial Statements Financial Report 2020
36
6. Restructuring
Restructuring for the years ended December 31, 2020 and 2019, broken down into the main restructuring initiatives, consists of the following:
($m) 2020 2019
Accelerating operational leverage and other productivity programs:
Cash costs
Charged to provisions 29 36
Expensed as incurred 26 25
Acquisition, divestment and related costs:
Cash costs
Charged to provisions 10 3
Other, expensed as incurred 45 42
Non-cash items 6 9
Other restructuring:
Cash costs 51 73
Non-cash costs and other non-current asset impairments 130 177
Total restructuring 297 365
In 2020, $6 million for the reversal of inventory step ups reported on acquisitions is presented within Cost of goods sold in the consolidated income statement (2019: $1 million). The other costs above for the years ended December 31, 2020 and 2019 are presented within Restructuring in the consolidated income statement.
Analysis of restructuring costs
2020 Accelerating operational leverage and other productivity programs Cash costs of $55 million, including $28 million of severance charges, were incurred for productivity initiatives consisting of $26 million incurred to better align the organization in EAME with the business strategies, $10 million for system projects, including digital tools and automation initiatives and an upgraded financial reporting and analytics platform and $19 million across a number of individually small initiatives driving operational efficiencies.
Acquisition, divestment and related costs Cash costs include $24 million incurred for merger and acquisition projects and other transaction costs, $17 million incurred for integration projects and $14 million of costs related to the formation of the Syngenta Group, described in Note 14, consisting of communications, consultancy and project management office expenses. Non-cash costs are the reversal of inventory step-ups reported on acquisitions.
Other restructuring Other cash costs consist of $21 million related to the closure of a manufacturing site in the USA announced in June 2019, $10 million related to transitioning the acquired manufacturing facility described in Note 3 to optimal capacity and $9 million to provide for a Seeds development contract where forecasted demand is less than minimum future commitments. Further costs of $11 million were incurred for strategic alignment, mainly in the Seeds business.
Other non-current asset impairments consist of $13 million for capitalized development costs, $17 million for capitalized agreements related to a seed technology where future value is expected to be lower than previous projections due to reduced market; $23 million to write off the value of a collaboration agreement where the value of the development project has proven too costly to pursue, $18 million to write down unusable inventories acquired in previous acquisition transactions, $43 million of tangible, intangible and right-of-use asset impairments related to assets disposed or transferred to held-for-sale, and $16 million for other smaller impairments where asset values are not supported by future business plans.
2019 Accelerating operational leverage and other productivity programs Cash costs of $61 million, including $36 million of severance and pension charges, $12 million of consultancy and external services costs and $4 million for information systems projects, were incurred for the completion of projects started under the Accelerating Operational Leverage program and further productivity initiatives to simplify the layers of management, including at the global headquarters.
Acquisition, divestment and related costs Cash costs for acquisition and related integration costs include $20 million for merger and acquisition projects and other transaction costs and $25 million for integration projects, particularly related to the Nidera acquisition completed in 2018. Non-cash costs include $8 million for the loss incurred to acquire control of Sanbei Seeds, previously an Associate (see Note 14), and $1 million for the reversal of inventory step ups reported on acquisitions.
Other restructuring Cash costs consist of $39 million related to the closure of a manufacturing site in the USA announced in June 2019, including charges to provide for environmental remediation and severance, $24 million to provide for a seeds processing contract where forecast demand is less than minimum future commitments and $10 million of costs incurred to relocate the Seeds operations in the USA.
Other non-current asset impairments consist of $92 million for property, plant and equipment and $15 million for maintenance spares and other unusable inventories at the closing manufacturing site in the USA; $41 million for capitalized agreements related to a seed technology
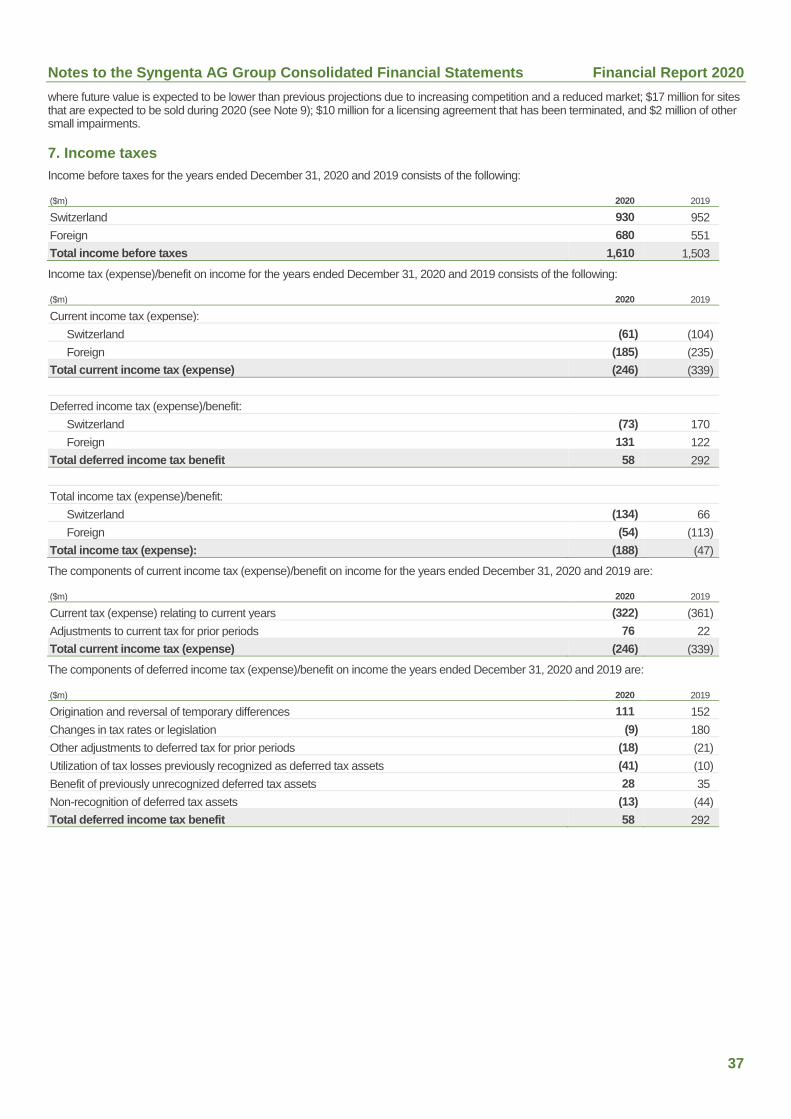
Notes to the Syngenta AG Group Consolidated Financial Statements Financial Report 2020
37
where future value is expected to be lower than previous projections due to increasing competition and a reduced market; $17 million for sites that are expected to be sold during 2020 (see Note 9); $10 million for a licensing agreement that has been terminated, and $2 million of other small impairments.
7. Income taxes
Income before taxes for the years ended December 31, 2020 and 2019 consists of the following:
($m) 2020 2019
Switzerland 930 952
Foreign 680 551
Total income before taxes 1,610 1,503
Income tax (expense)/benefit on income for the years ended December 31, 2020 and 2019 consists of the following:
($m) 2020 2019
Current income tax (expense):
Switzerland (61) (104)
Foreign (185) (235)
Total current income tax (expense) (246) (339)
Deferred income tax (expense)/benefit:
Switzerland (73) 170
Foreign 131 122
Total deferred income tax benefit 58 292
Total income tax (expense)/benefit:
Switzerland (134) 66
Foreign (54) (113)
Total income tax (expense): (188) (47)
The components of current income tax (expense)/benefit on income for the years ended December 31, 2020 and 2019 are:
($m) 2020 2019
Current tax (expense) relating to current years (322) (361)
Adjustments to current tax for prior periods 76 22
Total current income tax (expense) (246) (339)
The components of deferred income tax (expense)/benefit on income the years ended December 31, 2020 and 2019 are:
($m) 2020 2019
Origination and reversal of temporary differences 111 152
Changes in tax rates or legislation (9) 180
Other adjustments to deferred tax for prior periods (18) (21)
Utilization of tax losses previously recognized as deferred tax assets (41) (10)
Benefit of previously unrecognized deferred tax assets 28 35
Non-recognition of deferred tax assets (13) (44)
Total deferred income tax benefit 58 292
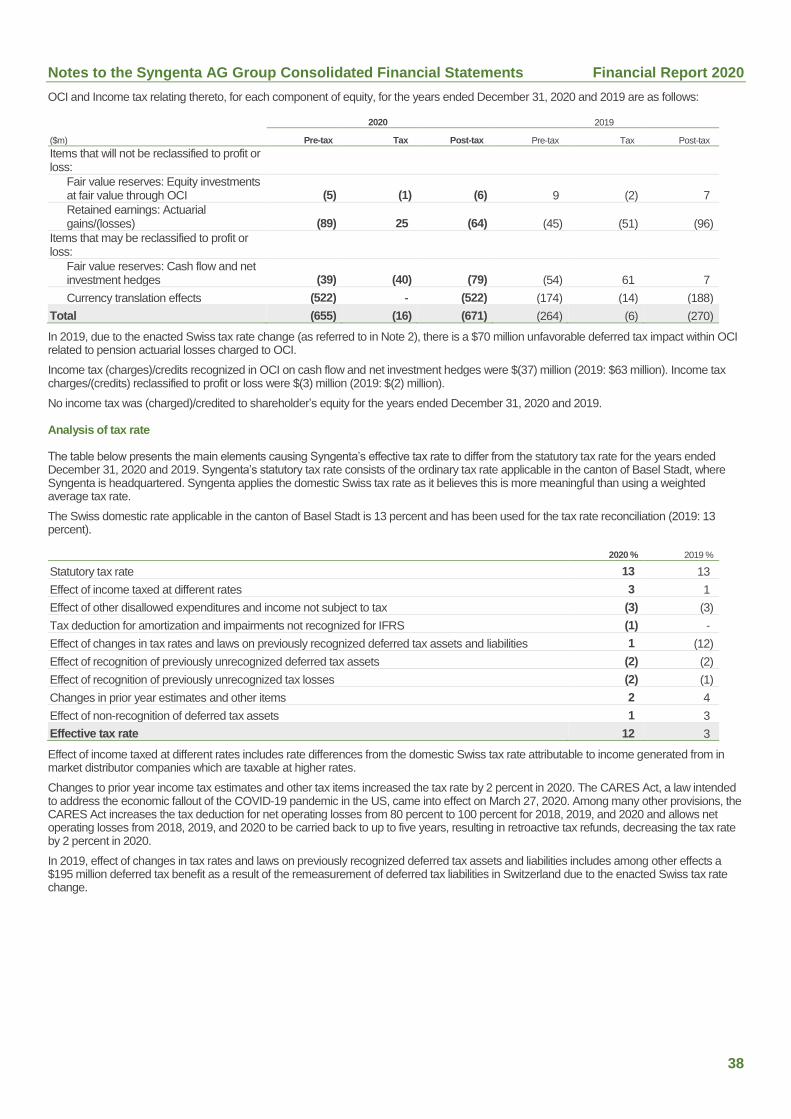
Notes to the Syngenta AG Group Consolidated Financial Statements Financial Report 2020
38
OCI and Income tax relating thereto, for each component of equity, for the years ended December 31, 2020 and 2019 are as follows:
2020 2019
($m) Pre-tax Tax Post-tax Pre-tax Tax Post-tax
Items that will not be reclassified to profit or loss:
Fair value reserves: Equity investments at fair value through OCI (5) (1) (6) 9 (2) 7
Retained earnings: Actuarial gains/(losses) (89) 25 (64) (45) (51) (96)
Items that may be reclassified to profit or loss:
Fair value reserves: Cash flow and net investment hedges (39) (40) (79) (54) 61 7
Currency translation effects (522) ‐ (522) (174) (14) (188)
Total (655) (16) (671) (264) (6) (270)
In 2019, due to the enacted Swiss tax rate change (as referred to in Note 2), there is a $70 million unfavorable deferred tax impact within OCI related to pension actuarial losses charged to OCI.
Income tax (charges)/credits recognized in OCI on cash flow and net investment hedges were $(37) million (2019: $63 million). Income tax charges/(credits) reclassified to profit or loss were $(3) million (2019: $(2) million).
No income tax was (charged)/credited to shareholder’s equity for the years ended December 31, 2020 and 2019.
Analysis of tax rate
The table below presents the main elements causing Syngenta’s effective tax rate to differ from the statutory tax rate for the years ended December 31, 2020 and 2019. Syngenta’s statutory tax rate consists of the ordinary tax rate applicable in the canton of Basel Stadt, where Syngenta is headquartered. Syngenta applies the domestic Swiss tax rate as it believes this is more meaningful than using a weighted average tax rate.
The Swiss domestic rate applicable in the canton of Basel Stadt is 13 percent and has been used for the tax rate reconciliation (2019: 13 percent).
2020 % 2019 %
Statutory tax rate 13 13
Effect of income taxed at different rates 3 1
Effect of other disallowed expenditures and income not subject to tax (3) (3)
Tax deduction for amortization and impairments not recognized for IFRS (1) ‐
Effect of changes in tax rates and laws on previously recognized deferred tax assets and liabilities 1 (12)
Effect of recognition of previously unrecognized deferred tax assets (2) (2)
Effect of recognition of previously unrecognized tax losses (2) (1)
Changes in prior year estimates and other items 2 4
Effect of non-recognition of deferred tax assets 1 3
Effective tax rate 12 3
Effect of income taxed at different rates includes rate differences from the domestic Swiss tax rate attributable to income generated from in market distributor companies which are taxable at higher rates.
Changes to prior year income tax estimates and other tax items increased the tax rate by 2 percent in 2020. The CARES Act, a law intended to address the economic fallout of the COVID-19 pandemic in the US, came into effect on March 27, 2020. Among many other provisions, the CARES Act increases the tax deduction for net operating losses from 80 percent to 100 percent for 2018, 2019, and 2020 and allows net operating losses from 2018, 2019, and 2020 to be carried back to up to five years, resulting in retroactive tax refunds, decreasing the tax rate by 2 percent in 2020.
In 2019, effect of changes in tax rates and laws on previously recognized deferred tax assets and liabilities includes among other effects a $195 million deferred tax benefit as a result of the remeasurement of deferred tax liabilities in Switzerland due to the enacted Swiss tax rate change.
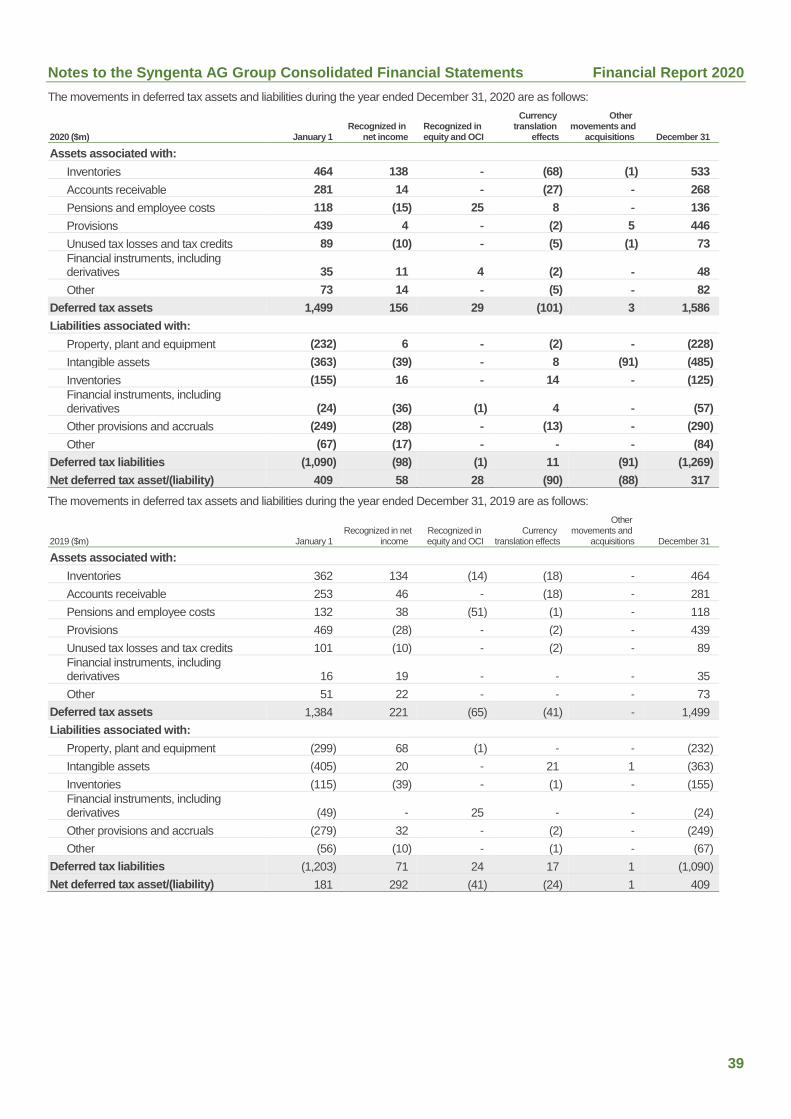
Notes to the Syngenta AG Group Consolidated Financial Statements Financial Report 2020
39
The movements in deferred tax assets and liabilities during the year ended December 31, 2020 are as follows:
2020 ($m) January 1 Recognized in
net income Recognized in equity and OCI
Currency translation
effects
Other movements and
acquisitions December 31
Assets associated with:
Inventories 464 138 ‐ (68) (1) 533
Accounts receivable 281 14 ‐ (27) ‐ 268
Pensions and employee costs 118 (15) 25 8 ‐ 136
Provisions 439 4 ‐ (2) 5 446
Unused tax losses and tax credits 89 (10) ‐ (5) (1) 73
Financial instruments, including derivatives 35 11 4 (2) ‐ 48
Other 73 14 ‐ (5) ‐ 82
Deferred tax assets 1,499 156 29 (101) 3 1,586
Liabilities associated with:
Property, plant and equipment (232) 6 ‐ (2) ‐ (228)
Intangible assets (363) (39) ‐ 8 (91) (485)
Inventories (155) 16 ‐ 14 ‐ (125)
Financial instruments, including derivatives (24) (36) (1) 4 ‐ (57)
Other provisions and accruals (249) (28) ‐ (13) ‐ (290)
Other (67) (17) ‐ ‐ ‐ (84)
Deferred tax liabilities (1,090) (98) (1) 11 (91) (1,269)
Net deferred tax asset/(liability) 409 58 28 (90) (88) 317
The movements in deferred tax assets and liabilities during the year ended December 31, 2019 are as follows:
2019 ($m) January 1 Recognized in net
income Recognized in equity and OCI
Currency translation effects
Other movements and
acquisitions December 31
Assets associated with:
Inventories 362 134 (14) (18) ‐ 464
Accounts receivable 253 46 ‐ (18) ‐ 281
Pensions and employee costs 132 38 (51) (1) ‐ 118
Provisions 469 (28) ‐ (2) ‐ 439
Unused tax losses and tax credits 101 (10) ‐ (2) ‐ 89
Financial instruments, including derivatives 16 19 ‐ ‐ ‐ 35
Other 51 22 ‐ ‐ ‐ 73
Deferred tax assets 1,384 221 (65) (41) ‐ 1,499
Liabilities associated with:
Property, plant and equipment (299) 68 (1) ‐ ‐ (232)
Intangible assets (405) 20 ‐ 21 1 (363)
Inventories (115) (39) ‐ (1) ‐ (155)
Financial instruments, including derivatives (49) ‐ 25 ‐ ‐ (24)
Other provisions and accruals (279) 32 ‐ (2) ‐ (249)
Other (56) (10) ‐ (1) ‐ (67)
Deferred tax liabilities (1,203) 71 24 17 1 (1,090)
Net deferred tax asset/(liability) 181 292 (41) (24) 1 409
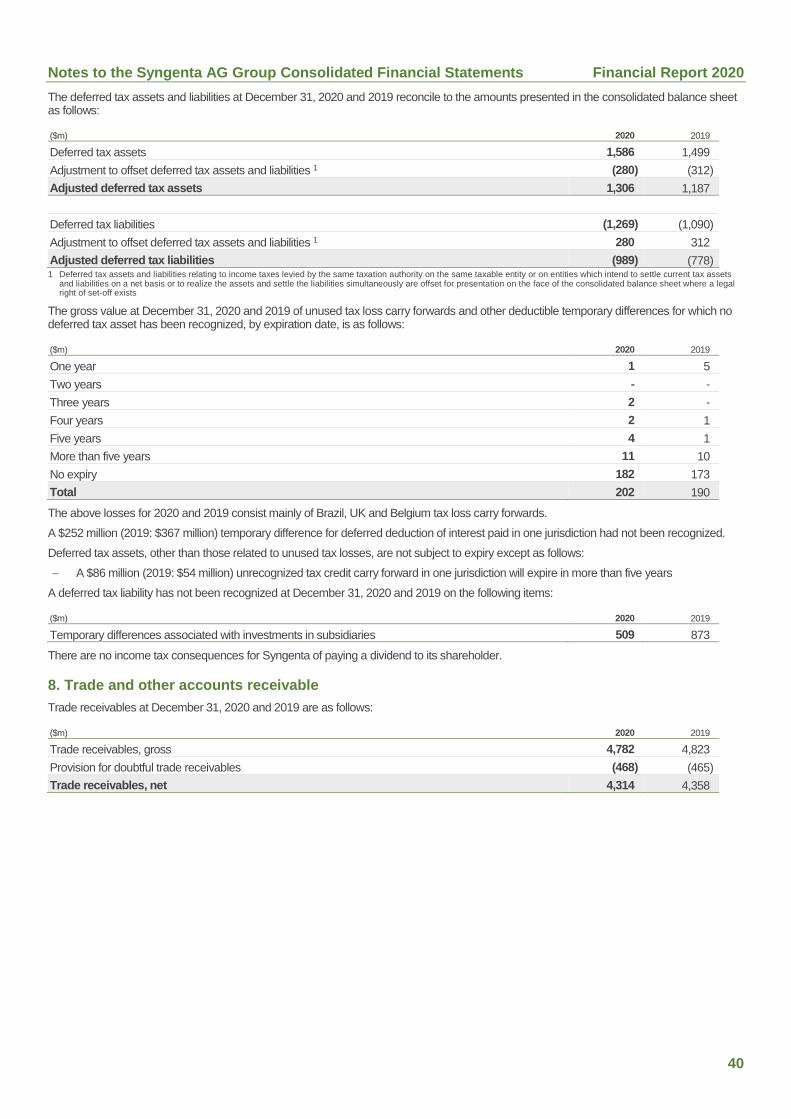
Notes to the Syngenta AG Group Consolidated Financial Statements Financial Report 2020
40
The deferred tax assets and liabilities at December 31, 2020 and 2019 reconcile to the amounts presented in the consolidated balance sheet as follows:
($m) 2020 2019
Deferred tax assets 1,586 1,499
Adjustment to offset deferred tax assets and liabilities 1 (280) (312)
Adjusted deferred tax assets 1,306 1,187
Deferred tax liabilities (1,269) (1,090)
Adjustment to offset deferred tax assets and liabilities 1 280 312
Adjusted deferred tax liabilities (989) (778) 1 Deferred tax assets and liabilities relating to income taxes levied by the same taxation authority on the same taxable entity or on entities which intend to settle current tax assets
and liabilities on a net basis or to realize the assets and settle the liabilities simultaneously are offset for presentation on the face of the consolidated balance sheet where a legal right of set-off exists
The gross value at December 31, 2020 and 2019 of unused tax loss carry forwards and other deductible temporary differences for which no deferred tax asset has been recognized, by expiration date, is as follows:
($m) 2020 2019
One year 1 5
Two years ‐ ‐
Three years 2 ‐
Four years 2 1
Five years 4 1
More than five years 11 10
No expiry 182 173
Total 202 190
The above losses for 2020 and 2019 consist mainly of Brazil, UK and Belgium tax loss carry forwards.
A $252 million (2019: $367 million) temporary difference for deferred deduction of interest paid in one jurisdiction had not been recognized.
Deferred tax assets, other than those related to unused tax losses, are not subject to expiry except as follows:
A $86 million (2019: $54 million) unrecognized tax credit carry forward in one jurisdiction will expire in more than five years
A deferred tax liability has not been recognized at December 31, 2020 and 2019 on the following items:
($m) 2020 2019
Temporary differences associated with investments in subsidiaries 509 873
There are no income tax consequences for Syngenta of paying a dividend to its shareholder.
8. Trade and other accounts receivable
Trade receivables at December 31, 2020 and 2019 are as follows:
($m) 2020 2019
Trade receivables, gross 4,782 4,823
Provision for doubtful trade receivables (468) (465)
Trade receivables, net 4,314 4,358
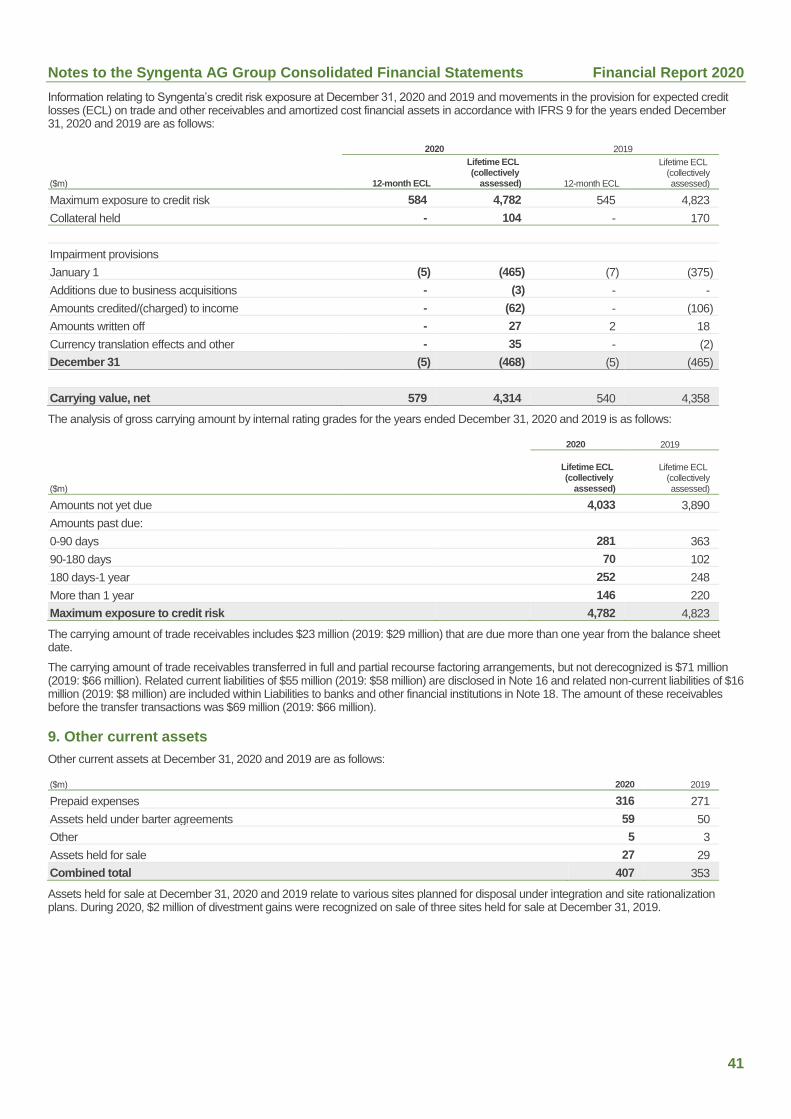
Notes to the Syngenta AG Group Consolidated Financial Statements Financial Report 2020
41
Information relating to Syngenta’s credit risk exposure at December 31, 2020 and 2019 and movements in the provision for expected credit losses (ECL) on trade and other receivables and amortized cost financial assets in accordance with IFRS 9 for the years ended December 31, 2020 and 2019 are as follows:
2020 2019
($m) 12-month ECL
Lifetime ECL (collectively
assessed) 12-month ECL
Lifetime ECL (collectively assessed)
Maximum exposure to credit risk 584 4,782 545 4,823
Collateral held - 104 - 170
Impairment provisions
January 1 (5) (465) (7) (375)
Additions due to business acquisitions - (3) - -
Amounts credited/(charged) to income - (62) - (106)
Amounts written off - 27 2 18
Currency translation effects and other - 35 - (2)
December 31 (5) (468) (5) (465)
Carrying value, net 579 4,314 540 4,358
The analysis of gross carrying amount by internal rating grades for the years ended December 31, 2020 and 2019 is as follows:
2020 2019
($m)
Lifetime ECL (collectively
assessed)
Lifetime ECL (collectively assessed)
Amounts not yet due 4,033 3,890
Amounts past due:
0-90 days 281 363
90-180 days 70 102
180 days-1 year 252 248
More than 1 year 146 220
Maximum exposure to credit risk 4,782 4,823
The carrying amount of trade receivables includes $23 million (2019: $29 million) that are due more than one year from the balance sheet date.
The carrying amount of trade receivables transferred in full and partial recourse factoring arrangements, but not derecognized is $71 million (2019: $66 million). Related current liabilities of $55 million (2019: $58 million) are disclosed in Note 16 and related non-current liabilities of $16 million (2019: $8 million) are included within Liabilities to banks and other financial institutions in Note 18. The amount of these receivables before the transfer transactions was $69 million (2019: $66 million).
9. Other current assets
Other current assets at December 31, 2020 and 2019 are as follows:
($m) 2020 2019
Prepaid expenses 316 271
Assets held under barter agreements 59 50
Other 5 3
Assets held for sale 27 29
Combined total 407 353
Assets held for sale at December 31, 2020 and 2019 relate to various sites planned for disposal under integration and site rationalization plans. During 2020, $2 million of divestment gains were recognized on sale of three sites held for sale at December 31, 2019.

Notes to the Syngenta AG Group Consolidated Financial Statements Financial Report 2020
42
10. Inventories
Inventories at December 31, 2020 and 2019 are as follows:
($m) 2020 2019
Raw materials and consumables 526 598
Biological assets 39 39
Work in progress 2,258 1,972
Finished products 2,611 2,364
Total 5,434 4,973
Finished products include $175 million (2019: $150 million) of inventory held by customers under a sale with a right of return.
Movements in inventory write-downs for the years ended December 31, 2020 and 2019 are as follows:
($m) 2020 2019
January 1 (352) (308)
Additions charged to income (247) (262)
Reversals of inventory write-downs 45 22
Amounts utilized on disposal of related inventories 175 178
Currency translation effects and other 31 18
December 31 (348) (352)
Reversals of inventory write-downs arise in the normal course of business when actual outcomes are more favorable than assumptions made in prior periods about Syngenta’s future ability to sell inventories that are subject to risks of degradation and obsolescence, such as germination of seeds.
Movements in biological assets for the years ended December 31, 2020 and 2019 are as follows.
($m) 2020 2019
January 1 39 37
Changes in fair value 130 132
Additions to cost 6 9
Sales and harvest (138) (138)
Currency translation effects and other 2 (1)
December 31 39 39
Of which: carried at fair value less costs to sell 39 37
Syngenta’s inputs for measuring the fair value of those assets that are carried at fair value less costs to sell include both market data from actual sales and inputs based on the stage of growth of immature assets, which is not observable in the market. The fair values therefore represent a level 3 measurement in the fair value hierarchy as defined by IFRS 13. Their sensitivity to changes in the unobservable inputs is not material to the consolidated financial statements.
Quantities of biological assets in inventories at December 31, 2020 and 2019 are:
2020 2019
(Millions of plants)
Plants 61 68
Cuttings 588 559
(Thousands of hectares cultivated)
Growing crops 1 1

Notes to the Syngenta AG Group Consolidated Financial Statements Financial Report 2020
43
11. Property, plant and equipment
Movements in property, plant and equipment for the year ended December 31, 2020 are as follows:
2020 ($m) Land Buildings Machinery and
equipment Assets under construction Total
Cost
January 1 122 1,963 5,248 412 7,745
Additions ‐ 32 188 337 557
Additions due to acquisitions 2 66 112 10 190
Disposals (3) (27) (94) (9) (133)
Transfers between categories ‐ 63 178 (241) ‐
Currency translation effects and other ‐ 48 217 5 270
December 31 121 2,145 5,849 514 8,629
Accumulated depreciation and impairment losses
January 1 ‐ (1,019) (3,449) (26) (4,494)
Depreciation charge ‐ (66) (262) ‐ (328)
Impairment losses ‐ (9) (7) (7) (23)
Depreciation on disposals ‐ 22 85 4 111
Currency translation effects and other ‐ (57) (147) ‐ (204)
December 31 ‐ (1,129) (3,780) (29) (4,938)
Net book value – December 31 121 1,016 2,069 485 3,691
Additions to property, plant and equipment of $557 million (2019: $523 million) comprise $555 million (2019: $521 million) of cash purchases and $2 million (2019: $2 million) of capitalized borrowing costs.
Movements in property, plant and equipment for the year ended December 31, 2019 were as follows:
2019 ($m) Land Buildings Machinery and
equipment Assets under
construction Total
Cost
January 1 156 2,065 5,154 386 7,761
Reclassified on implementation of IFRS 16 ‐ (9) (116) ‐ (125)
Additions ‐ 49 185 289 523
Additions due to acquisitions 1 6 6 ‐ 13
Disposals (4) (232) (155) (1) (392)
Classified as held-for-sale (23) (20) (11) ‐ (54)
Transfers between categories ‐ 106 142 (248) ‐
Currency translation effects and other (8) (2) 43 (14) 19
December 31 122 1,963 5,248 412 7,745
Accumulated depreciation and impairment losses
January 1 ‐ (1,088) (3,311) ‐ (4,399)
Reclassified on implementation of IFRS 16 ‐ 1 61 ‐ 62
Depreciation charge ‐ (69) (246) ‐ (315)
Impairment losses ‐ (25) (59) (26) (110)
Depreciation on disposals ‐ 140 122 ‐ 262
Classified as held-for-sale ‐ 19 8 ‐ 27
Currency translation effects and other ‐ 3 (24) ‐ (21)
December 31 ‐ (1,019) (3,449) (26) (4,494)
Net book value – December 31 122 944 1,799 386 3,251
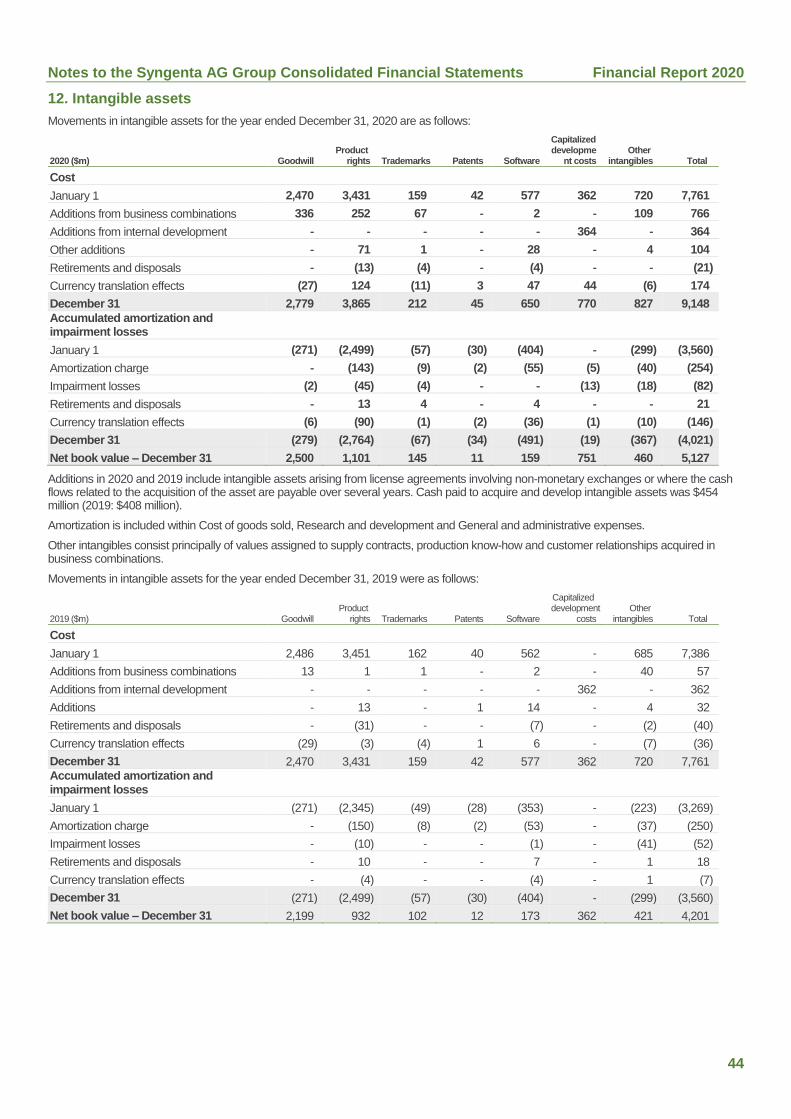
Notes to the Syngenta AG Group Consolidated Financial Statements Financial Report 2020
44
12. Intangible assets
Movements in intangible assets for the year ended December 31, 2020 are as follows:
2020 ($m) Goodwill Product
rights Trademarks Patents Software
Capitalized developme
nt costs Other
intangibles Total
Cost
January 1 2,470 3,431 159 42 577 362 720 7,761
Additions from business combinations 336 252 67 ‐ 2 ‐ 109 766
Additions from internal development ‐ ‐ ‐ ‐ ‐ 364 ‐ 364
Other additions ‐ 71 1 ‐ 28 ‐ 4 104
Retirements and disposals ‐ (13) (4) ‐ (4) ‐ ‐ (21)
Currency translation effects (27) 124 (11) 3 47 44 (6) 174
December 31 2,779 3,865 212 45 650 770 827 9,148
Accumulated amortization and impairment losses
January 1 (271) (2,499) (57) (30) (404) ‐ (299) (3,560)
Amortization charge ‐ (143) (9) (2) (55) (5) (40) (254)
Impairment losses (2) (45) (4) ‐ ‐ (13) (18) (82)
Retirements and disposals ‐ 13 4 ‐ 4 ‐ ‐ 21
Currency translation effects (6) (90) (1) (2) (36) (1) (10) (146)
December 31 (279) (2,764) (67) (34) (491) (19) (367) (4,021)
Net book value – December 31 2,500 1,101 145 11 159 751 460 5,127
Additions in 2020 and 2019 include intangible assets arising from license agreements involving non-monetary exchanges or where the cash flows related to the acquisition of the asset are payable over several years. Cash paid to acquire and develop intangible assets was $454 million (2019: $408 million).
Amortization is included within Cost of goods sold, Research and development and General and administrative expenses.
Other intangibles consist principally of values assigned to supply contracts, production know-how and customer relationships acquired in business combinations.
Movements in intangible assets for the year ended December 31, 2019 were as follows:
2019 ($m) Goodwill Product
rights Trademarks Patents Software
Capitalized development
costs Other
intangibles Total
Cost
January 1 2,486 3,451 162 40 562 ‐ 685 7,386
Additions from business combinations 13 1 1 ‐ 2 ‐ 40 57
Additions from internal development ‐ ‐ ‐ ‐ ‐ 362 ‐ 362
Additions ‐ 13 ‐ 1 14 ‐ 4 32
Retirements and disposals ‐ (31) ‐ ‐ (7) ‐ (2) (40)
Currency translation effects (29) (3) (4) 1 6 ‐ (7) (36)
December 31 2,470 3,431 159 42 577 362 720 7,761
Accumulated amortization and impairment losses
January 1 (271) (2,345) (49) (28) (353) ‐ (223) (3,269)
Amortization charge ‐ (150) (8) (2) (53) ‐ (37) (250)
Impairment losses ‐ (10) ‐ ‐ (1) ‐ (41) (52)
Retirements and disposals ‐ 10 ‐ ‐ 7 ‐ 1 18
Currency translation effects ‐ (4) ‐ ‐ (4) ‐ 1 (7)
December 31 (271) (2,499) (57) (30) (404) ‐ (299) (3,560)
Net book value – December 31 2,199 932 102 12 173 362 421 4,201
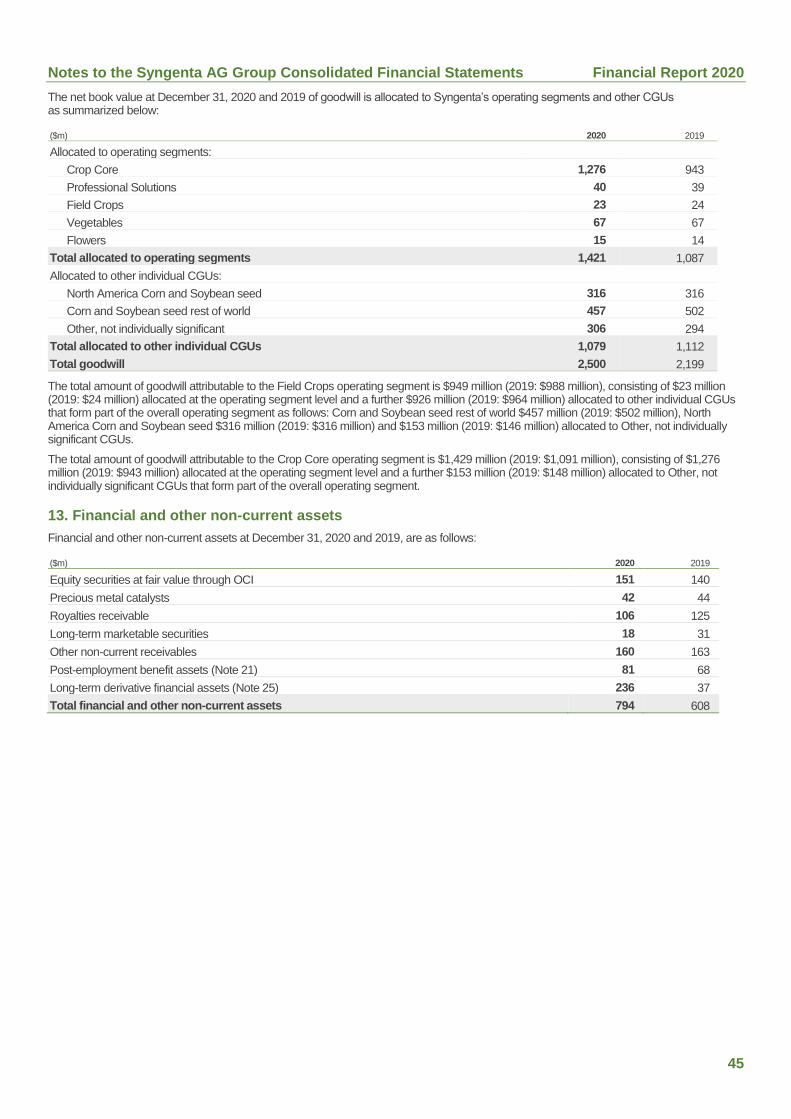
Notes to the Syngenta AG Group Consolidated Financial Statements Financial Report 2020
45
The net book value at December 31, 2020 and 2019 of goodwill is allocated to Syngenta’s operating segments and other CGUs as summarized below:
($m) 2020 2019
Allocated to operating segments:
Crop Core 1,276 943
Professional Solutions 40 39
Field Crops 23 24
Vegetables 67 67
Flowers 15 14
Total allocated to operating segments 1,421 1,087
Allocated to other individual CGUs:
North America Corn and Soybean seed 316 316
Corn and Soybean seed rest of world 457 502
Other, not individually significant 306 294
Total allocated to other individual CGUs 1,079 1,112
Total goodwill 2,500 2,199
The total amount of goodwill attributable to the Field Crops operating segment is $949 million (2019: $988 million), consisting of $23 million (2019: $24 million) allocated at the operating segment level and a further $926 million (2019: $964 million) allocated to other individual CGUs that form part of the overall operating segment as follows: Corn and Soybean seed rest of world $457 million (2019: $502 million), North America Corn and Soybean seed $316 million (2019: $316 million) and $153 million (2019: $146 million) allocated to Other, not individually significant CGUs.
The total amount of goodwill attributable to the Crop Core operating segment is $1,429 million (2019: $1,091 million), consisting of $1,276 million (2019: $943 million) allocated at the operating segment level and a further $153 million (2019: $148 million) allocated to Other, not individually significant CGUs that form part of the overall operating segment.
13. Financial and other non-current assets
Financial and other non-current assets at December 31, 2020 and 2019, are as follows:
($m) 2020 2019
Equity securities at fair value through OCI 151 140
Precious metal catalysts 42 44
Royalties receivable 106 125
Long-term marketable securities 18 31
Other non-current receivables 160 163
Post-employment benefit assets (Note 21) 81 68
Long-term derivative financial assets (Note 25) 236 37
Total financial and other non-current assets 794 608
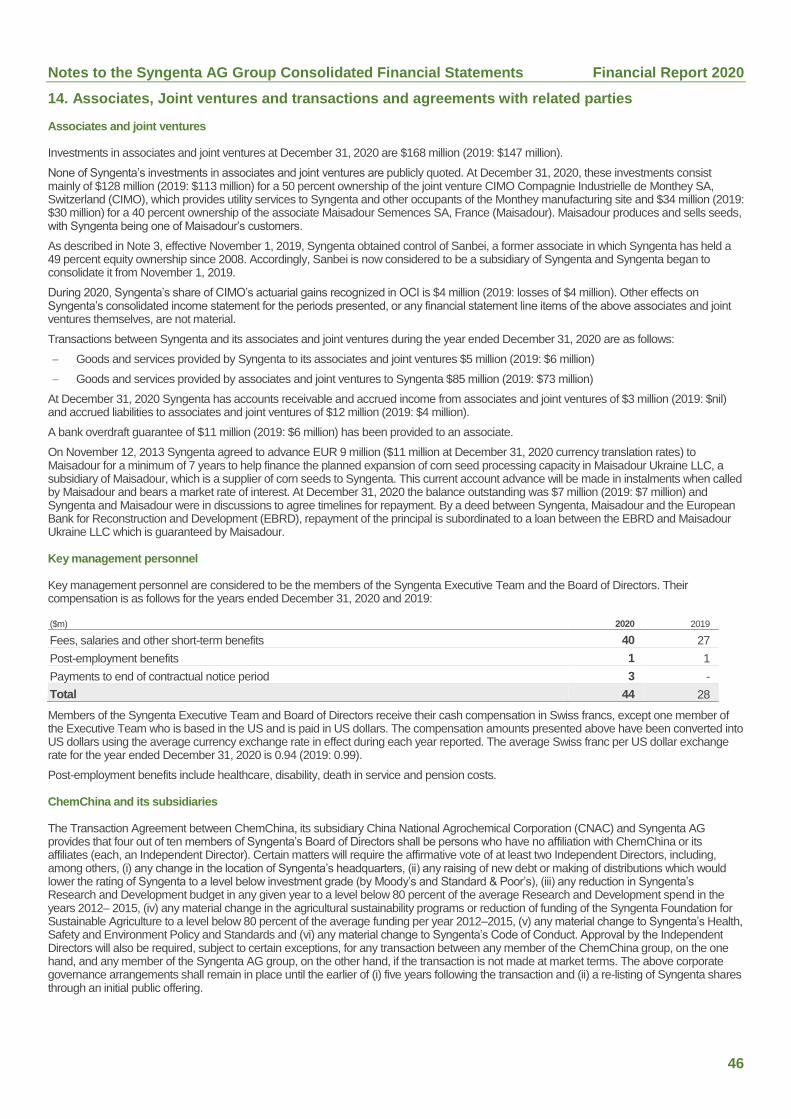
Notes to the Syngenta AG Group Consolidated Financial Statements Financial Report 2020
46
14. Associates, Joint ventures and transactions and agreements with related parties
Associates and joint ventures
Investments in associates and joint ventures at December 31, 2020 are $168 million (2019: $147 million).
None of Syngenta’s investments in associates and joint ventures are publicly quoted. At December 31, 2020, these investments consist mainly of $128 million (2019: $113 million) for a 50 percent ownership of the joint venture CIMO Compagnie Industrielle de Monthey SA, Switzerland (CIMO), which provides utility services to Syngenta and other occupants of the Monthey manufacturing site and $34 million (2019: $30 million) for a 40 percent ownership of the associate Maisadour Semences SA, France (Maisadour). Maisadour produces and sells seeds, with Syngenta being one of Maisadour’s customers.
As described in Note 3, effective November 1, 2019, Syngenta obtained control of Sanbei, a former associate in which Syngenta has held a 49 percent equity ownership since 2008. Accordingly, Sanbei is now considered to be a subsidiary of Syngenta and Syngenta began to consolidate it from November 1, 2019.
During 2020, Syngenta’s share of CIMO’s actuarial gains recognized in OCI is $4 million (2019: losses of $4 million). Other effects on Syngenta’s consolidated income statement for the periods presented, or any financial statement line items of the above associates and joint ventures themselves, are not material.
Transactions between Syngenta and its associates and joint ventures during the year ended December 31, 2020 are as follows:
Goods and services provided by Syngenta to its associates and joint ventures $5 million (2019: $6 million)
Goods and services provided by associates and joint ventures to Syngenta $85 million (2019: $73 million)
At December 31, 2020 Syngenta has accounts receivable and accrued income from associates and joint ventures of $3 million (2019: $nil) and accrued liabilities to associates and joint ventures of $12 million (2019: $4 million).
A bank overdraft guarantee of $11 million (2019: $6 million) has been provided to an associate.
On November 12, 2013 Syngenta agreed to advance EUR 9 million ($11 million at December 31, 2020 currency translation rates) to Maisadour for a minimum of 7 years to help finance the planned expansion of corn seed processing capacity in Maisadour Ukraine LLC, a subsidiary of Maisadour, which is a supplier of corn seeds to Syngenta. This current account advance will be made in instalments when called by Maisadour and bears a market rate of interest. At December 31, 2020 the balance outstanding was $7 million (2019: $7 million) and Syngenta and Maisadour were in discussions to agree timelines for repayment. By a deed between Syngenta, Maisadour and the European Bank for Reconstruction and Development (EBRD), repayment of the principal is subordinated to a loan between the EBRD and Maisadour Ukraine LLC which is guaranteed by Maisadour.
Key management personnel
Key management personnel are considered to be the members of the Syngenta Executive Team and the Board of Directors. Their compensation is as follows for the years ended December 31, 2020 and 2019:
($m) 2020 2019
Fees, salaries and other short-term benefits 40 27
Post-employment benefits 1 1
Payments to end of contractual notice period 3 -
Total 44 28
Members of the Syngenta Executive Team and Board of Directors receive their cash compensation in Swiss francs, except one member of the Executive Team who is based in the US and is paid in US dollars. The compensation amounts presented above have been converted into US dollars using the average currency exchange rate in effect during each year reported. The average Swiss franc per US dollar exchange rate for the year ended December 31, 2020 is 0.94 (2019: 0.99).
Post-employment benefits include healthcare, disability, death in service and pension costs.
ChemChina and its subsidiaries
The Transaction Agreement between ChemChina, its subsidiary China National Agrochemical Corporation (CNAC) and Syngenta AG provides that four out of ten members of Syngenta’s Board of Directors shall be persons who have no affiliation with ChemChina or its affiliates (each, an Independent Director). Certain matters will require the affirmative vote of at least two Independent Directors, including, among others, (i) any change in the location of Syngenta’s headquarters, (ii) any raising of new debt or making of distributions which would lower the rating of Syngenta to a level below investment grade (by Moody’s and Standard & Poor’s), (iii) any reduction in Syngenta’s Research and Development budget in any given year to a level below 80 percent of the average Research and Development spend in the years 2012– 2015, (iv) any material change in the agricultural sustainability programs or reduction of funding of the Syngenta Foundation for Sustainable Agriculture to a level below 80 percent of the average funding per year 2012–2015, (v) any material change to Syngenta’s Health, Safety and Environment Policy and Standards and (vi) any material change to Syngenta’s Code of Conduct. Approval by the Independent Directors will also be required, subject to certain exceptions, for any transaction between any member of the ChemChina group, on the one hand, and any member of the Syngenta AG group, on the other hand, if the transaction is not made at market terms. The above corporate governance arrangements shall remain in place until the earlier of (i) five years following the transaction and (ii) a re-listing of Syngenta shares through an initial public offering.
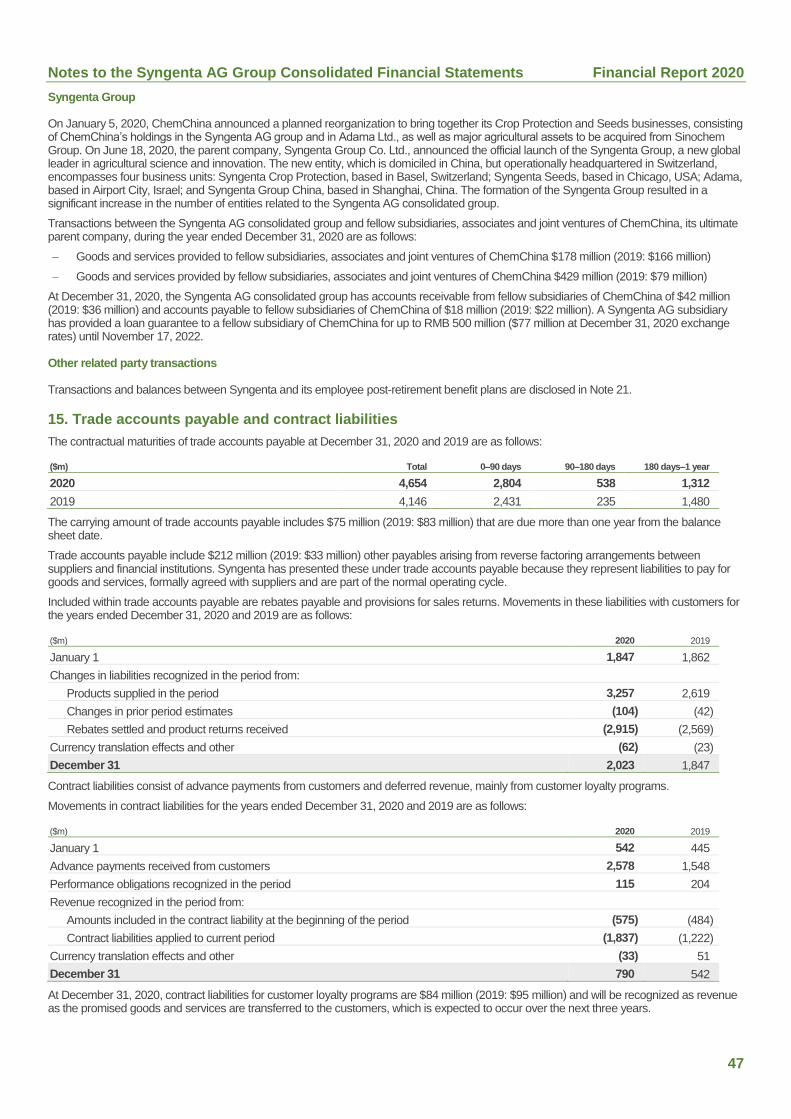
Notes to the Syngenta AG Group Consolidated Financial Statements Financial Report 2020
47
Syngenta Group
On January 5, 2020, ChemChina announced a planned reorganization to bring together its Crop Protection and Seeds businesses, consisting of ChemChina’s holdings in the Syngenta AG group and in Adama Ltd., as well as major agricultural assets to be acquired from Sinochem Group. On June 18, 2020, the parent company, Syngenta Group Co. Ltd., announced the official launch of the Syngenta Group, a new global leader in agricultural science and innovation. The new entity, which is domiciled in China, but operationally headquartered in Switzerland, encompasses four business units: Syngenta Crop Protection, based in Basel, Switzerland; Syngenta Seeds, based in Chicago, USA; Adama, based in Airport City, Israel; and Syngenta Group China, based in Shanghai, China. The formation of the Syngenta Group resulted in a significant increase in the number of entities related to the Syngenta AG consolidated group.
Transactions between the Syngenta AG consolidated group and fellow subsidiaries, associates and joint ventures of ChemChina, its ultimate parent company, during the year ended December 31, 2020 are as follows:
Goods and services provided to fellow subsidiaries, associates and joint ventures of ChemChina $178 million (2019: $166 million)
Goods and services provided by fellow subsidiaries, associates and joint ventures of ChemChina $429 million (2019: $79 million)
At December 31, 2020, the Syngenta AG consolidated group has accounts receivable from fellow subsidiaries of ChemChina of $42 million (2019: $36 million) and accounts payable to fellow subsidiaries of ChemChina of $18 million (2019: $22 million). A Syngenta AG subsidiary has provided a loan guarantee to a fellow subsidiary of ChemChina for up to RMB 500 million ($77 million at December 31, 2020 exchange rates) until November 17, 2022.
Other related party transactions
Transactions and balances between Syngenta and its employee post-retirement benefit plans are disclosed in Note 21.
15. Trade accounts payable and contract liabilities
The contractual maturities of trade accounts payable at December 31, 2020 and 2019 are as follows:
($m) Total 0–90 days 90–180 days 180 days–1 year
2020 4,654 2,804 538 1,312
2019 4,146 2,431 235 1,480
The carrying amount of trade accounts payable includes $75 million (2019: $83 million) that are due more than one year from the balance sheet date.
Trade accounts payable include $212 million (2019: $33 million) other payables arising from reverse factoring arrangements between suppliers and financial institutions. Syngenta has presented these under trade accounts payable because they represent liabilities to pay for goods and services, formally agreed with suppliers and are part of the normal operating cycle.
Included within trade accounts payable are rebates payable and provisions for sales returns. Movements in these liabilities with customers for the years ended December 31, 2020 and 2019 are as follows:
($m) 2020 2019
January 1 1,847 1,862
Changes in liabilities recognized in the period from:
Products supplied in the period 3,257 2,619
Changes in prior period estimates (104) (42)
Rebates settled and product returns received (2,915) (2,569)
Currency translation effects and other (62) (23)
December 31 2,023 1,847
Contract liabilities consist of advance payments from customers and deferred revenue, mainly from customer loyalty programs.
Movements in contract liabilities for the years ended December 31, 2020 and 2019 are as follows:
($m) 2020 2019
January 1 542 445
Advance payments received from customers 2,578 1,548
Performance obligations recognized in the period 115 204
Revenue recognized in the period from:
Amounts included in the contract liability at the beginning of the period (575) (484)
Contract liabilities applied to current period (1,837) (1,222)
Currency translation effects and other (33) 51
December 31 790 542
At December 31, 2020, contract liabilities for customer loyalty programs are $84 million (2019: $95 million) and will be recognized as revenue as the promised goods and services are transferred to the customers, which is expected to occur over the next three years.

Notes to the Syngenta AG Group Consolidated Financial Statements Financial Report 2020
48
16. Current financial debt and other financial liabilities
Current financial debt and other financial liabilities at December 31, 2020 and 2019 are as follows:
($m) 2020 2019
Short-term financial debt:
Bank and other financial debt 534 1,273
Receivables factored with recourse 55 58
Total short-term financial debt 589 1,331
Current portion of long-term financial debt:
Unsecured bonds 1,363 788
Liabilities to banks and other financial institutions 8 4
Lease liabilities 103 103
Total current portion of long-term financial debt (Note 18) 1,474 895
Total current financial debt 2,063 2,226
Short-term derivative and other financial liabilities 871 227
Total 2,934 2,453
The contractual maturities of current financial debt at December 31, 2020 and 2019 are as follows:
($m) Total 0–90 days 90–180 days 180 days–1 year
2020 2,063 407 853 803
2019 2,226 1,208 873 145
The maturities of short-term derivatives are presented in Note 24. The maturities of other financial liabilities are as follows: $459 million 0-90 days; $58 million 90-180 days and $17 million 180 days-1 year (2019: $33 million 0-90 days; $42 million 90-180 days and $5 million 180 days-1 year).
Information about fair values of financial liabilities is presented in Note 25.
17. Other current liabilities
Other current liabilities at December 31, 2020 and 2019 consist of the following:
($m) 2020 2019
Accrued short-term employee benefits 533 447
Taxes other than income taxes 158 121
Accrued utility costs 75 59
Social security and pension contributions 52 52
Other payables 75 67
Other accrued expenses 148 124
Total 1,041 870
The maturities of other current liabilities are as follows. For liabilities without a contractual maturity date, the analysis represents the estimated timing of cash outflows.
($m) Total 0–90 days 90–180 days 180 days-1 year
2020 1,041 792 168 81
2019 870 542 87 241
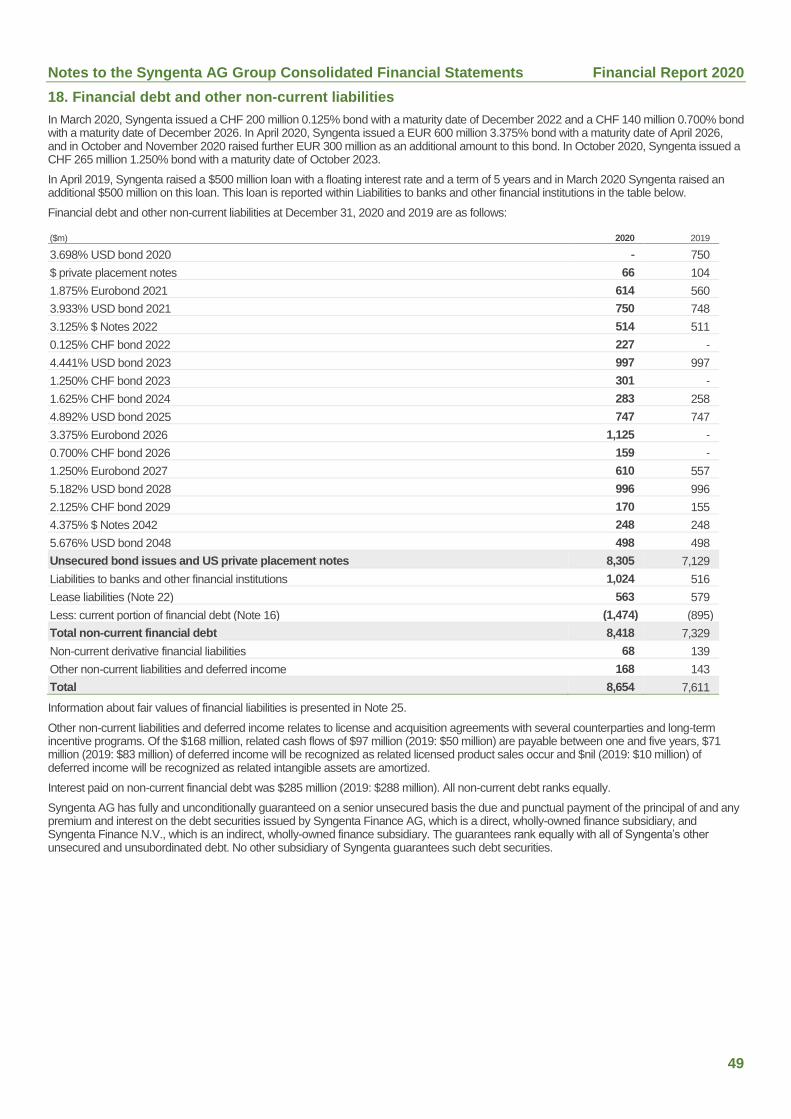
Notes to the Syngenta AG Group Consolidated Financial Statements Financial Report 2020
49
18. Financial debt and other non-current liabilities
In March 2020, Syngenta issued a CHF 200 million 0.125% bond with a maturity date of December 2022 and a CHF 140 million 0.700% bond with a maturity date of December 2026. In April 2020, Syngenta issued a EUR 600 million 3.375% bond with a maturity date of April 2026, and in October and November 2020 raised further EUR 300 million as an additional amount to this bond. In October 2020, Syngenta issued a CHF 265 million 1.250% bond with a maturity date of October 2023.
In April 2019, Syngenta raised a $500 million loan with a floating interest rate and a term of 5 years and in March 2020 Syngenta raised an additional $500 million on this loan. This loan is reported within Liabilities to banks and other financial institutions in the table below.
Financial debt and other non-current liabilities at December 31, 2020 and 2019 are as follows:
($m) 2020 2019
3.698% USD bond 2020 ‐ 750
$ private placement notes 66 104
1.875% Eurobond 2021 614 560
3.933% USD bond 2021 750 748
3.125% $ Notes 2022 514 511
0.125% CHF bond 2022 227 ‐
4.441% USD bond 2023 997 997
1.250% CHF bond 2023 301 ‐
1.625% CHF bond 2024 283 258
4.892% USD bond 2025 747 747
3.375% Eurobond 2026 1,125 ‐
0.700% CHF bond 2026 159 ‐
1.250% Eurobond 2027 610 557
5.182% USD bond 2028 996 996
2.125% CHF bond 2029 170 155
4.375% $ Notes 2042 248 248
5.676% USD bond 2048 498 498
Unsecured bond issues and US private placement notes 8,305 7,129
Liabilities to banks and other financial institutions 1,024 516
Lease liabilities (Note 22) 563 579
Less: current portion of financial debt (Note 16) (1,474) (895)
Total non-current financial debt 8,418 7,329
Non-current derivative financial liabilities 68 139
Other non-current liabilities and deferred income 168 143
Total 8,654 7,611
Information about fair values of financial liabilities is presented in Note 25.
Other non-current liabilities and deferred income relates to license and acquisition agreements with several counterparties and long-term incentive programs. Of the $168 million, related cash flows of $97 million (2019: $50 million) are payable between one and five years, $71 million (2019: $83 million) of deferred income will be recognized as related licensed product sales occur and $nil (2019: $10 million) of deferred income will be recognized as related intangible assets are amortized.
Interest paid on non-current financial debt was $285 million (2019: $288 million). All non-current debt ranks equally.
Syngenta AG has fully and unconditionally guaranteed on a senior unsecured basis the due and punctual payment of the principal of and any premium and interest on the debt securities issued by Syngenta Finance AG, which is a direct, wholly-owned finance subsidiary, and Syngenta Finance N.V., which is an indirect, wholly-owned finance subsidiary. The guarantees rank equally with all of Syngenta’s other unsecured and unsubordinated debt. No other subsidiary of Syngenta guarantees such debt securities.
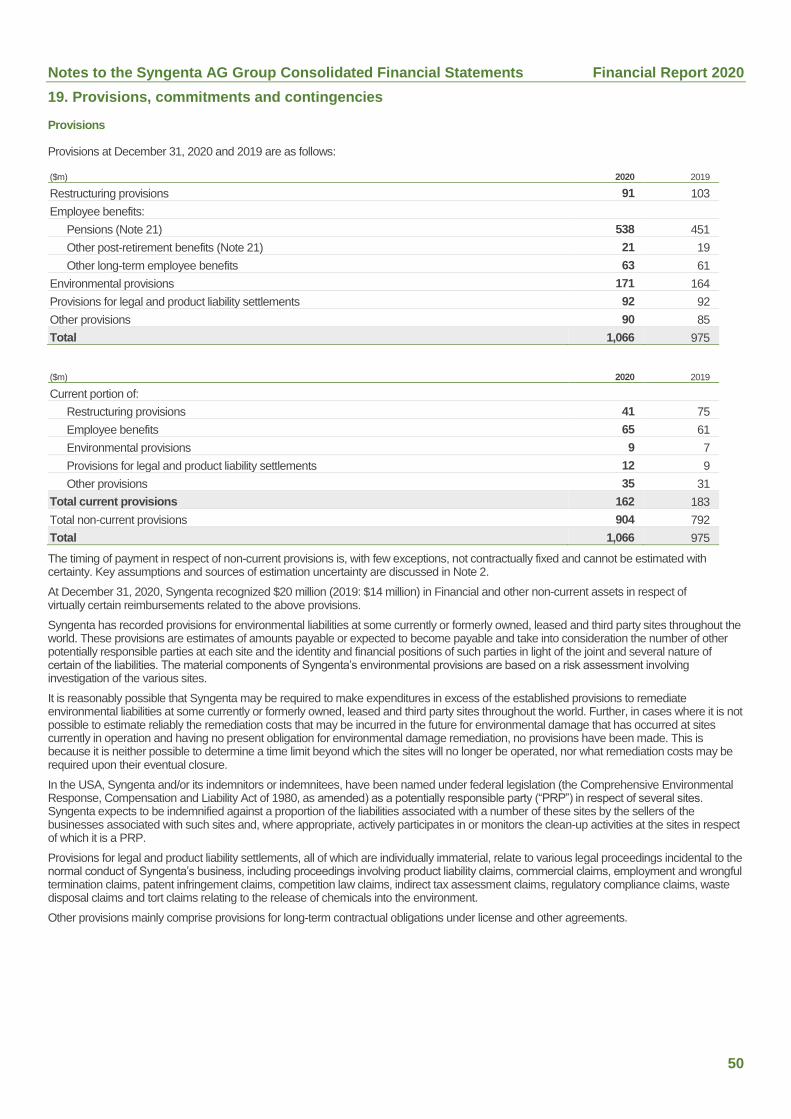
Notes to the Syngenta AG Group Consolidated Financial Statements Financial Report 2020
50
19. Provisions, commitments and contingencies
Provisions
Provisions at December 31, 2020 and 2019 are as follows:
($m) 2020 2019
Restructuring provisions 91 103
Employee benefits:
Pensions (Note 21) 538 451
Other post-retirement benefits (Note 21) 21 19
Other long-term employee benefits 63 61
Environmental provisions 171 164
Provisions for legal and product liability settlements 92 92
Other provisions 90 85
Total 1,066 975
($m) 2020 2019
Current portion of:
Restructuring provisions 41 75
Employee benefits 65 61
Environmental provisions 9 7
Provisions for legal and product liability settlements 12 9
Other provisions 35 31
Total current provisions 162 183
Total non-current provisions 904 792
Total 1,066 975
The timing of payment in respect of non-current provisions is, with few exceptions, not contractually fixed and cannot be estimated with certainty. Key assumptions and sources of estimation uncertainty are discussed in Note 2.
At December 31, 2020, Syngenta recognized $20 million (2019: $14 million) in Financial and other non-current assets in respect of virtually certain reimbursements related to the above provisions.
Syngenta has recorded provisions for environmental liabilities at some currently or formerly owned, leased and third party sites throughout the world. These provisions are estimates of amounts payable or expected to become payable and take into consideration the number of other potentially responsible parties at each site and the identity and financial positions of such parties in light of the joint and several nature of certain of the liabilities. The material components of Syngenta’s environmental provisions are based on a risk assessment involving investigation of the various sites.
It is reasonably possible that Syngenta may be required to make expenditures in excess of the established provisions to remediate environmental liabilities at some currently or formerly owned, leased and third party sites throughout the world. Further, in cases where it is not possible to estimate reliably the remediation costs that may be incurred in the future for environmental damage that has occurred at sites currently in operation and having no present obligation for environmental damage remediation, no provisions have been made. This is because it is neither possible to determine a time limit beyond which the sites will no longer be operated, nor what remediation costs may be required upon their eventual closure.
In the USA, Syngenta and/or its indemnitors or indemnitees, have been named under federal legislation (the Comprehensive Environmental Response, Compensation and Liability Act of 1980, as amended) as a potentially responsible party (“PRP”) in respect of several sites. Syngenta expects to be indemnified against a proportion of the liabilities associated with a number of these sites by the sellers of the businesses associated with such sites and, where appropriate, actively participates in or monitors the clean-up activities at the sites in respect of which it is a PRP.
Provisions for legal and product liability settlements, all of which are individually immaterial, relate to various legal proceedings incidental to the normal conduct of Syngenta’s business, including proceedings involving product liability claims, commercial claims, employment and wrongful termination claims, patent infringement claims, competition law claims, indirect tax assessment claims, regulatory compliance claims, waste disposal claims and tort claims relating to the release of chemicals into the environment.
Other provisions mainly comprise provisions for long-term contractual obligations under license and other agreements.
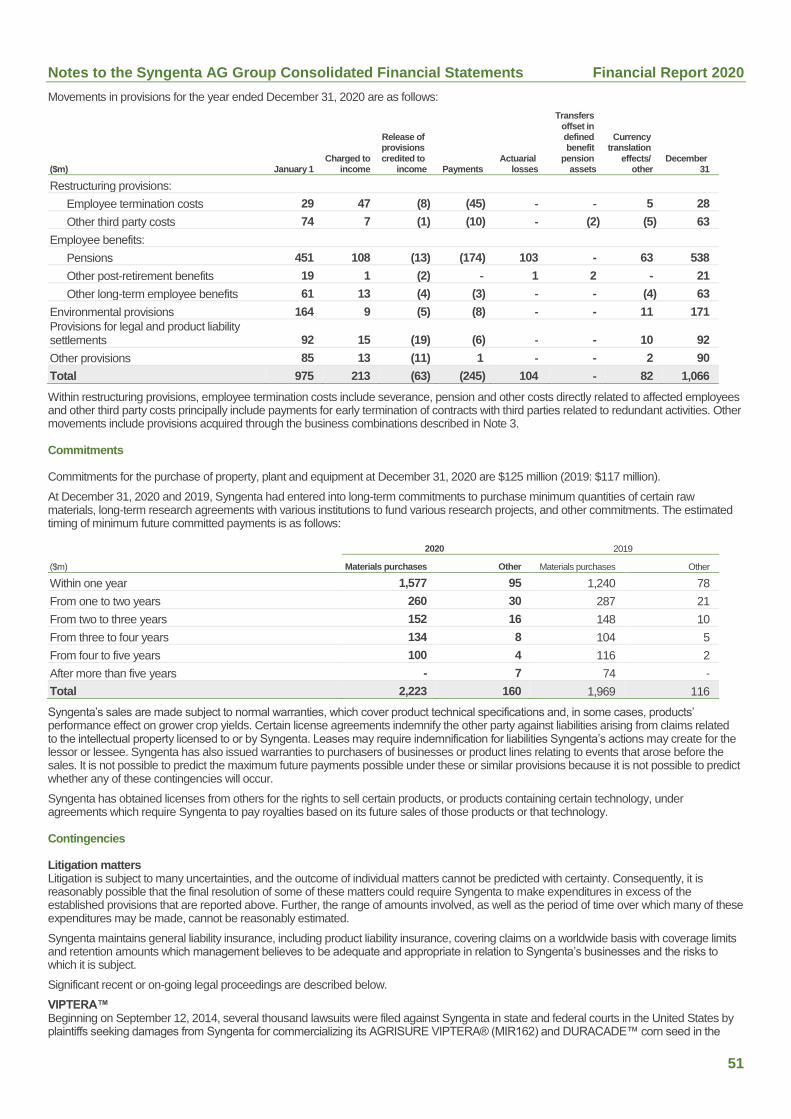
Notes to the Syngenta AG Group Consolidated Financial Statements Financial Report 2020
51
Movements in provisions for the year ended December 31, 2020 are as follows:
($m) January 1 Charged to
income
Release of provisions credited to
income Payments Actuarial
losses
Transfers offset in defined benefit
pension assets
Currency translation
effects/ other
December 31
Restructuring provisions:
Employee termination costs 29 47 (8) (45) ‐ ‐ 5 28
Other third party costs 74 7 (1) (10) ‐ (2) (5) 63
Employee benefits:
Pensions 451 108 (13) (174) 103 - 63 538
Other post-retirement benefits 19 1 (2) ‐ 1 2 - 21
Other long-term employee benefits 61 13 (4) (3) ‐ - (4) 63
Environmental provisions 164 9 (5) (8) ‐ - 11 171
Provisions for legal and product liability settlements 92 15 (19) (6) ‐ - 10 92
Other provisions 85 13 (11) 1 ‐ - 2 90
Total 975 213 (63) (245) 104 ‐ 82 1,066
Within restructuring provisions, employee termination costs include severance, pension and other costs directly related to affected employees and other third party costs principally include payments for early termination of contracts with third parties related to redundant activities. Other movements include provisions acquired through the business combinations described in Note 3.
Commitments
Commitments for the purchase of property, plant and equipment at December 31, 2020 are $125 million (2019: $117 million).
At December 31, 2020 and 2019, Syngenta had entered into long-term commitments to purchase minimum quantities of certain raw materials, long-term research agreements with various institutions to fund various research projects, and other commitments. The estimated timing of minimum future committed payments is as follows:
2020 2019
($m) Materials purchases Other Materials purchases Other
Within one year 1,577 95 1,240 78
From one to two years 260 30 287 21
From two to three years 152 16 148 10
From three to four years 134 8 104 5
From four to five years 100 4 116 2
After more than five years - 7 74 ‐
Total 2,223 160 1,969 116
Syngenta’s sales are made subject to normal warranties, which cover product technical specifications and, in some cases, products’ performance effect on grower crop yields. Certain license agreements indemnify the other party against liabilities arising from claims related to the intellectual property licensed to or by Syngenta. Leases may require indemnification for liabilities Syngenta’s actions may create for the lessor or lessee. Syngenta has also issued warranties to purchasers of businesses or product lines relating to events that arose before the sales. It is not possible to predict the maximum future payments possible under these or similar provisions because it is not possible to predict whether any of these contingencies will occur.
Syngenta has obtained licenses from others for the rights to sell certain products, or products containing certain technology, under agreements which require Syngenta to pay royalties based on its future sales of those products or that technology.
Contingencies
Litigation matters Litigation is subject to many uncertainties, and the outcome of individual matters cannot be predicted with certainty. Consequently, it is reasonably possible that the final resolution of some of these matters could require Syngenta to make expenditures in excess of the established provisions that are reported above. Further, the range of amounts involved, as well as the period of time over which many of these expenditures may be made, cannot be reasonably estimated.
Syngenta maintains general liability insurance, including product liability insurance, covering claims on a worldwide basis with coverage limits and retention amounts which management believes to be adequate and appropriate in relation to Syngenta’s businesses and the risks to which it is subject.
Significant recent or on-going legal proceedings are described below.
VIPTERA™ Beginning on September 12, 2014, several thousand lawsuits were filed against Syngenta in state and federal courts in the United States by plaintiffs seeking damages from Syngenta for commercializing its AGRISURE VIPTERA® (MIR162) and DURACADE™ corn seed in the

Notes to the Syngenta AG Group Consolidated Financial Statements Financial Report 2020
52
United States without having obtained import approval from China for those products. Many of these lawsuits were filed by individual plaintiffs (including growers, grain elevators and exporters such as Cargill, Archer Daniels Midland (“ADM”) and Louis Dreyfus), and approximately 107 by putative classes of growers and others allegedly affected, including ethanol plants, on the theory that China’s 2013 rejection of U.S. corn based on the alleged presence of MIR162 caused increased costs and U.S. commodity prices to drop. The cases were pending in multiple jurisdictions, including (1) cases that were initially filed in federal court that were consolidated for pre-trial proceedings in a federal multi-district litigation (“MDL”) action in the District of Kansas; (2) a consolidated state court proceeding in Hennepin County, Minnesota; (3) federal court in the Southern District of Illinois; and (4) various state courts in Illinois, Indiana, Iowa, Louisiana, Nebraska, Michigan, and Ohio. In September 2016, the federal MDL court certified a nationwide class of corn growers alleging violations of the Lanham Act and eight statewide classes of corn growers, and in November 2016, the court presiding over the Minnesota state court consolidated proceedings certified a class of Minnesota corn growers. In April 2017, the federal MDL court granted significant portions of Syngenta’s motion for summary judgment, including by dismissing plaintiffs’ Lanham Act claim and thereby eliminating the sole basis for a nationwide class, while allowing plaintiffs’ state-law negligence claims to proceed. In September 2017 plaintiffs and Syngenta reached a pending settlement to resolve all claims on behalf of all U.S. non-Viptera and Viptera producers as well as grain elevators and ethanol plants. On April 10, 2018, preliminary court approval was granted in respect of the pending settlement, and the establishment of a Qualified Settlement Fund of $1.51 billion was granted for the submission of claims by eligible claimants who contracted to price corn or DDGs (distillers dried grains with solubles) after September 2013. Syngenta was directed to make the first and second installments of $200 million each into an escrow account. Final approval of the settlement was provided by court order dated December 7, 2018, dismissing the claims of producers, grain elevators, and ethanol plants on a class wide basis except for sixteen individual producers and one ethanol plant that timely and validly opted out of the settlement. Syngenta made its final payment of $1.1 billion to the settlement fund on March 29, 2019. Objectors to the settlement appealed the court’s final approval order. That appeal has now been resolved (by the MDL plaintiffs and the objectors) and the settlement is now final.
The settlement of the producer cases does not cover claims of the exporter plaintiffs such as Cargill, ADM, Louis Dreyfus, Trans Coastal Supply Company, Inc. (“Transcoastal”), The DeLong Company (“DeLong”), and Agribase International, Inc. ADM and Syngenta reached in December 2017 a settlement of the Viptera litigation that ADM had brought against Syngenta in Louisiana Court. Louis Dreyfus and Syngenta reached a settlement in May 2019. Agribase and Syngenta reached a settlement in February 2020. Trans Coastal and Syngenta reached a settlement in October 2020. These settlements do not resolve the lawsuits brought by other grain exporters such as Cargill (trial date not currently scheduled), and DeLong (trial date April 2021), which will continue. The ethanol plant that opted out of the settlement, Heartland Corn Products (“Heartland”), filed suit against Syngenta in November 2019; the court has granted Syngenta’s motion to dismiss the Viptera claims. The case continues as to the Duracade claims. Cargill claims to have suffered damages relating to delayed, rejected and re-routed shipments of U.S. corn to China of over $90 million and additional lost profits. DeLong’s claimed damages are significantly smaller than those sought by Cargill. Heartland has not yet provided information regarding its claimed damages. Syngenta strongly believes that the claims in these cases are without merit and will vigorously defend the lawsuits.
In December 2015, a claim was filed in Ontario, Canada by a proposed representative plaintiff on behalf of a putative class comprising all farmers in Canada against Syngenta Canada Inc. and Syngenta AG seeking damages from Syngenta for commercializing its AGRISURE VIPTERA® (MIR162) and DURACADE™ corn seed in the North American corn market without having obtained import approval from China for those products. The causes of action referred to in the lawsuit include negligence and negligent misrepresentations. The allegations include claims that Syngenta actively misled farmers about the importance of the Chinese market, the timing and substance of the application for approval in China, its ability to channel VIPTERA™ corn into non-Chinese markets and its ability to contain the infiltration of VIPTERA™ corn to the North American corn supply. The proposed representative plaintiff is seeking on behalf of the putative class general and special damages of 300 million Canadian dollars ($235 million at December 31, 2020 exchange rates), punitive and aggravated damages of 100 million Canadian dollars ($78 million at December 31, 2020 exchange rates), the costs of distributing all monies awarded to class members, pre-judgment interest, and costs on a substantial indemnity basis. Syngenta’s motion to strike this action was argued in April 2018, and on November 28, 2018, the judge dismissed the plaintiff’s action in its entirety. The plaintiff has appealed this decision. The appeal was heard in June 2019 and while the Court of Appeal denied plaintiff’s appeal of the lower court’s decision dismissing the claim as to the negligent misrepresentation and Competition Act claims, it granted the appeal as to the premature commercialization claim which would allow the lawsuit to continue as to that claim alone. Syngenta has filed the documents necessary to seek leave to appeal the Court of Appeal’s decision to the Supreme Court of Canada. On December 10, 2020, Syngenta’s application for leave to appeal to the Supreme Court of Canada was denied. Syngenta believes that this lawsuit is without merit and will continue to vigorously defend it.
On February 14, 2017, a similar action was filed in Quebec against Syngenta Canada Inc. and Syngenta AG. The Petitioners are seeking essentially the same relief as in the Ontario action on behalf of all corn producers conducting business in Quebec who sold corn for commercial purposes after November 18, 2013. They allege that Syngenta was negligent and engaged in illegal commercial practices, contrary to the Competition Act and the Civil Code of Quebec, and that damages (amount unspecified) will continue to accrue until the corn business between North America and China is re-established at the levels that existed before Syngenta’s negligence occurred. Punitive damages, pre-judgment interest and costs are also claimed. Syngenta has entered an appearance in the action. No other steps have been taken. Syngenta is continuing to vigorously defend against the Canadian actions and strongly believes that they are without merit.
Canada beekeeper lawsuits In September 2014, a claim was filed in Ontario, Canada by two proposed representative members on behalf of a putative class comprising all beekeepers who have owned or continue to own and operate honey producing, pollinating, and/or queen bee rearing businesses in Canada since January 1, 2006, against a number of Syngenta legal entities together with certain entities of a second manufacturer of neonicotinoid insecticides. Plaintiffs allege negligence through the sale by that manufacturer and by Syngenta of products containing such insecticides in the knowledge that they would be injurious to bees and by virtue of misrepresentations and concealment relating thereto. Plaintiffs claim 400 million Canadian dollars ($314 million at December 31, 2020 exchange rates) general and 50 million Canadian dollars ($39 million at December 31, 2020 exchange rates) punitive damages. The pleadings in the Ontario proceedings were subsequently amended by plaintiffs’ counsel to add waiver of tort and unlawful conspiracy to the single cause of action, negligence, which was previously pleaded. Both of the additional causes of action are ancillary to and largely dependent on the negligence claim. The class has not yet been authorized.
In October 2014, a Motion for Authorization was filed by the same firm of plaintiffs’ counsel in Montréal, Quebec seeking permission to bring a similar class proceeding in that province. The proposed representative plaintiff operates a family business specialized in the breeding of queen bees. The Quebec litigation closely resembles the original Ontario lawsuit claiming negligence except that, rather than a nationwide class, it alleges a class limited to Quebec. At this early stage damages are unspecified. The Motion for Authorization was argued in November 2017.

Notes to the Syngenta AG Group Consolidated Financial Statements Financial Report 2020
53
The Quebec class has been authorized on August 20, 2018, and notices have been sent to potential class members. Plaintiffs’ motion to add Syngenta AG as a defendant has been granted.
Syngenta will defend these lawsuits, the claims in which are without foundation.
Atrazine related litigation In August 2013, a personal injury complaint relating to atrazine was filed under seal in St. Clair County, Illinois state court, on behalf of a minor and his parents against Syngenta Crop Protection LLC, Syngenta AG, a third party distributor, and three local dealers. The Court granted the minor permission to proceed in the public record under the fictitious name “James Doe” - and for his parents to use the names “Jane Doe” and “John Doe”. The lawsuit alleges that James Doe’s congenital birth defect, hypospadias, was caused by his mother consuming atrazine-contaminated drinking water while she was pregnant. The Complaint alleges public nuisance, strict liability and negligence, and seeks unspecified damages together with the costs of suit. Answers and Affirmative Defenses were filed on behalf of the defendants in January and February 2014. Fact discovery in the litigation started in early 2014 and is continuing. No trial date has been fixed to date. No further claims have been filed. Syngenta strongly believes that the claims are without merit and is vigorously defending against the action.
Paraquat Parkinson’s disease litigation In September 2017, a complaint was filed in St. Clair County, Illinois state court on behalf of plaintiffs Thomas Hoffmann and Diana Hoffmann against Syngenta Crop Protection, LLC, Syngenta AG, and Growmark, Inc. The complaint alleges that Mr. Hoffmann suffers from Parkinson’s disease caused by chronic exposure to the herbicide paraquat while working as a farmer in Illinois.
On October 6, 2017 an amended complaint was filed in the same court on behalf of 12 plaintiffs (seven men who are said to have been diagnosed with Parkinson’s disease and five of their wives), including Mr. and Mrs. Hoffmann who were named in the initial complaint, against Syngenta Crop Protection, LLC, Syngenta AG, Chevron Phillips Chemical Company, and Growmark, Inc. The amended complaint alleges the following counts: (1) Strict Liability - Design Defect; (2) Strict Liability - Failure to Warn; (3) Negligence; (4) Public Nuisance; (5) Consumer Fraud & Deceptive Business Practices Act; and (6) Breach of Implied Warranty of Merchantability. Syngenta’s Motion to Dismiss was denied in July 2018. Syngenta filed its answer to the amended complaint in October 2018. In that case, the parties are now engaged in discovery with trial scheduled to begin in April 2021.
On December 13, 2018, the same counsel filed a further complaint in St. Clair County, Illinois state court on behalf of plaintiffs Marvin Wendler and his wife against Syngenta Crop Protection, LLC, Syngenta AG, and various third parties. The complaint asserts the same claims as the Hoffmann complaint. An additional complaint was filed by the same counsel in St. Clair County, Illinois state court on December 21, 2018, on behalf of plaintiffs Lloyd Pulcher and his wife against Syngenta AG and Growmark, Inc. This new complaint asserts the same claims as the Hoffmann complaint. Syngenta Crop Protection, LLC filed its answer to the Wendler complaint in February 2019, and Syngenta AG filed its answers to the two complaints, Wendler and Pulcher, in March 2019.
In April 2019, the same plaintiffs’ counsel filed ten complaints in California state court (five in San Francisco County and five in Contra Costa County) on behalf of 16 plaintiffs (including ten men who are said to have been diagnosed with Parkinson’s disease and six of their wives). The complaints name Syngenta AG and Syngenta Crop Protection LLC, and various distributors as additional defendants. The ten California complaints allege the following counts: (1) Strict Products Liability; (2) Negligence; (3) Public Nuisance; (4) California Consumer Legal Remedies Act; and (5) Breach of Implied Warranty of Merchantability. The California cases have been consolidated for pretrial purposes. On December 23, 2019, the court denied in part and granted in part defendants’ motion to dismiss such that the California Consumer Legal Remedies Act claim has been dismissed and the remaining claims may proceed. No case schedule has been set and the California cases remain at an early stage. In late 2020, two of the complaints were dismissed because the plaintiffs passed away.
On July 16, 2020, the state court presiding over the St. Clair County, Illinois cases dismissed without prejudice the claims brought by Diana Hoffmann, individually and as administrator of the Estate of Thomas Hoffmann, and three other plaintiffs pursuant to a motion for withdrawal filed by those plaintiffs.
On July 22, 2020, a complaint was filed in Scott County, Missouri on behalf of two plaintiffs (a married couple). The complaint names Syngenta AG, Syngenta Corporation, Syngenta Crop Protection LLC, and Chevron USA, Inc. The plaintiffs allege the following counts: (1) strict liability in tort - design defect; (2) strict liability in tort - failure to warn; (3) negligence; (4) breach of implied warranty; and (5) loss of consortium. The case was removed to the Eastern District of Missouri on July 29, 2020, and Syngenta filed a motion to dismiss on September 9, 2020. The motion to dismiss is still pending, and no case schedule has been set.
On December 16–17, 2020, six additional complaints were filed in California state court on behalf of nine plaintiffs (including six men who are said to have been diagnosed with Parkinson’s disease and three of their wives). The complaints name Syngenta AG and Syngenta Crop Protection LLC and variously name Chevron USA, Inc. and/or Wilbur-Ellis Company, LLC as additional defendants. These complaints do not include a California Consumer Legal Remedies Act claim, but they otherwise allege the same counts as the April 2019 California complaints.
On December 22, 2020, a complaint was filed in St. Clair County, Illinois state court on behalf of plaintiffs Michael Kearns and Jean Kearns against Syngenta Crop Protection, LLC; Syngenta AG; and Growmark, Inc. The complaint alleges the following counts: (1) strict liability - design defect; (2) strict liability - failure to warn; (3) negligence; (4) public nuisance; (5) Consumer Fraud and Deceptive Business Practices Act; and (6) breach of implied warranty of merchantability.
Syngenta believes that all of these claims are without merit and will defend the lawsuits.
Tax matters Significant management judgment is required to estimate the tax liabilities related to the eventual outcome of reviews and audits by tax authorities of tax returns filed by Syngenta’s subsidiaries. Tax returns filed by many of Syngenta’s subsidiaries during the past several years are either currently under examination by tax authorities or are open for future examination until expiry under statutes of limitation. In Syngenta’s opinion, the likelihood is remote that a material amount in excess of recorded provisions will result from the resolution of any such examination or case. Syngenta is also subject to certain tax claims pending before the judiciary. See Note 2 “Uncertain tax positions” for detail regarding two on-going transfer pricing disputes in Brazil. Syngenta believes it will successfully defend its position in these disputes. However, it is reasonably possible that actual outcomes and settlements may differ significantly from the estimated liabilities shown in the consolidated balance sheet for income taxes and in Note 17 for other taxes.

Notes to the Syngenta AG Group Consolidated Financial Statements Financial Report 2020
54
Contingencies summary Given the inherent difficulties in estimating liabilities relating to litigation, tax, environmental and certain other matters due to uncertainty concerning both the amount and timing of future expenditures, it is reasonably possible that additional costs may be incurred materially in excess of provisions recorded for such liabilities. Such expenditures, in excess of established provisions, could have a material effect on Syngenta’s consolidated operating results and cash flows for a particular reporting period, but management does not believe they will have a materially adverse effect on Syngenta’s consolidated financial position or liquidity, although there can be no assurances in this regard.
20. Notes to the consolidated cash flow statement
Non-cash and other reconciling items included in income before taxes
The following table analyzes non-cash and other reconciling items included in income before taxes for the years ended December 31, 2020 and 2019:
($m) 2020 2019
Depreciation, amortization and impairment of:
Property, plant and equipment (Note 11) 351 425
Right-of-use assets (Note 22) 118 97
Intangible assets (Note 12) 336 302
Deferred revenue and other gains and losses (100) 10
Gains on disposal of non-current assets (27) (133)
Charges in respect of pension provisions (Note 19) 95 97
Charges in respect of other provisions (Note 19) 55 96
Financial expense, net 497 425
Gains on hedges reported in operating income (75) (16)
Income from associates and joint ventures ‐ (1)
Total 1,250 1,302
Change in liabilities arising from financing activities
Movements in assets and liabilities arising from financing activities for the year ended December 31, 2020 are as follows:
2020 ($m) January 1
Cash flows from financing activities
Changes in fair value Other
Currency translation
effects December 31
Bonds and US private placement notes (Note 18) 7,129 879 2 5 290 8,305
Lease liabilities (Note 18) 579 (119) ‐ 76 27 563
Other long-term debt (Note 18) 516 465 ‐ 43 ‐ 1,024
Short-term debt (Note 16) 1,331 (693) ‐ (13) (36) 589
Total financial debt 9,555 532 2 111 281 10,481
Bond hedges net liability/(asset) 120 ‐ (168) (58) 84 (22)
Margin deposit liability 17 37 ‐ ‐ ‐ 54
Margin deposit asset (206) 47 ‐ ‐ ‐ (159)
Net liabilities arising from financing activities 9,486 616 (166) 53 365 10,354
Other movements include $68 million of new leases in the year, $5 million of lease liabilities and $32 million of other long-term debt acquired as part of the Valagro acquisition, and $58 million of cash outflows on bond hedges, which are reported as operating cash flows.
Movements in assets and liabilities arising from financing activities for the year ended December 31, 2019 are as follows:
2019 ($m) January 1 Cash flows from financing activities
Changes in fair value Other
Currency translation effects December 31
Bonds and US private placement notes (Note 18) 7,485 (354) 9 6 (17) 7,129
Lease liabilities (Note 18) 61 (105) ‐ 613 10 579
Other long-term debt (Note 18) 4 513 ‐ ‐ (1) 516
Short-term debt (Note 16) 553 806 ‐ ‐ (28) 1,331
Total financial debt 8,103 860 9 619 (36) 9,555
Bond hedges net liability/(asset) 95 (42) 91 (37) 13 120
Margin deposit liability 44 (27) ‐ ‐ ‐ 17
Margin deposit asset (111) (95) ‐ ‐ ‐ (206)
Net liabilities arising from financing activities 8,131 696 100 582 (23) 9,486
Notes to the Syngenta AG Group Consolidated Financial Statements Financial Report 2020
55
Other movements include $200 million lease liabilities recognized on implementation of IFRS 16, $412 million new leases in the year and $37 million cash outflows on bond hedges which are reported as operating cash flows.
See Note 24 for a description of bond hedges and margin deposits. Bond hedges are presented in the consolidated balance sheet as follows: non-current assets of $145 million (2019: $19 million) are included within “Financial and other non-current assets”, current liabilities of $58 million (2019: $nil) are included within “Current financial debt and other financial liabilities” and non-current liabilities of $65 million (2019: $139 million) are included within “Financial debt and other non-current liabilities”.
Margin deposit liabilities are included within “Current financial debt and other financial liabilities”, and margin deposit assets are included within “Derivative and other financial assets”.
Cash flows are presented in the consolidated cash flow statement as follows:
($m) 2020 2019
Proceeds from increase in third party interest-bearing debt 2,553 1,616
Repayments of third party interest-bearing debt (1,937) (920)
Net 616 696
21. Post-employment benefits
Syngenta has, apart from legally required social security arrangements, numerous independent pension plans, which are either “defined contribution” plans where company contributions and resulting benefit costs are a set percentage of employees’ pay or “defined benefit” plans where benefits are generally based on employees’ length of service and pensionable pay. Syngenta’s contributions to defined contribution plans were $74 million for the year ended December 31, 2020 (2019: $58 million). Approximately 30 percent of Syngenta’s employees are members of defined benefit plans and a significant proportion of these are members of both defined benefit and defined contribution plans. All of Syngenta’s major defined benefit plans are funded through legally separate trustee administered funds. The cash funding of these plans, which may from time to time involve special payments, is designed to ensure that present and future contributions should be sufficient to meet future liabilities. Syngenta’s main defined benefit pension plans are in the UK, Switzerland and the USA.
UK
In accordance with its rules, Syngenta’s UK Pension Fund (the UK Fund) is governed by a company (the Trustee) that is controlled by a publicly listed independent professional trustee corporation. That corporation appoints the Trustee’s directors, including its own representative, Syngenta nominated and member nominated directors. The Trustee manages the UK Fund and appoints professional advisers independently to assist it in doing so. The UK Fund is subject to UK pensions legislation, is regulated by the UK Pensions Regulator and is exempt from most UK taxation through its registered status. The defined benefit section of the UK Fund has been closed to new members since 2002. New employees since 2002 instead joined a defined contribution pension plan also within the UK Fund. This was open to new members until August 31, 2013. After that date, new employees join a separate defined contribution plan. The defined benefit section of the UK Fund is open to future accrual for employees who were members before 2002; however, effective January 1, 2016, pensionable pay for these employees has been frozen, as described in Note 2. At retirement date, defined benefit members have the right to take up to 25 percent of the value of their benefits as a lump sum, with the balance being paid as an annuity. Alternatively, after taking appropriate advice, members may transfer their defined benefits to a different authorized pension arrangement.
The Trustee is required by the UK Fund’s rules to increase pensions in payment and accrued deferred pension rights each year by the lower of 5 percent and price inflation, as measured by the UK Retail Price Index (RPI) or Consumer Price Index (CPI), as applicable. An independent actuary is required to value the UK Fund’s liabilities in accordance with UK pension regulations and certify the required contributions, both for future service and elimination of any deficit, at least every three years. Following each such valuation, employer contribution amounts must be formally agreed between Syngenta and the Trustee, subject to review by the Pensions Regulator, and remain binding until re-assessed in the following valuation. The solvency of the UK Fund, defined as its ability to pay benefits as they fall due, is guaranteed by the sponsoring subsidiary, Syngenta Ltd., and by Syngenta AG. In addition, certain benefits under the UK Fund are guaranteed by the UK Pension Protection Fund.
The Trustee agrees the investment strategy for the UK Fund’s assets and implements it through an investment sub-committee (the UK Investment Committee) it appoints from among the Trustee directors. The investment objectives are to ensure the assets are appropriately diversified and liquid to generate sufficient returns to meet the benefit liability and control the long-term costs of the UK Fund. These objectives are achieved through appointing and monitoring a number of third party investment managers, each with specific investment mandates that collectively cover a wide range of investment classes and geographical markets and utilize both asset liability matching and return seeking strategies. Asset liability matching is achieved both through underlying investment class selection (e.g. fixed interest) and through using derivatives to limit the potential impact of changes in interest rates, price inflation and foreign currency exchange rates on the benefits payable by and assets of the UK Fund. The Trustee continues to reshape the investment portfolio reducing the overall investment risk and hence expected return. This is in line with the funding agreement between the Trustee and Syngenta Limited. As a result, the Trustee has invested certain of the plan’s assets to purchase insurance policies with UK local insurers to cover around 13 percent of the pension liabilities. The insurers pay the Trustee an income flow to match a defined set of benefit payments.
Switzerland
The Swiss federal law on occupational old age, disability and survivors’ pensions (“BVG”) sets minimum standards for occupational pension plans, which Syngenta’s Swiss pension fund (the Swiss Fund) exceeds. All employees having had an employment contract for more than three months with any of Syngenta’s Swiss subsidiaries or with its CIMO joint venture entity (see Note 14) and whose age and income exceed the minimum stipulated by BVG are automatically insured in the Swiss Fund. The benefits payable on retirement are calculated according to the capital sums that each member accumulates through transfer of benefits from previous employments, employer and employee contributions during service with Syngenta or with CIMO, interest and member voluntary contributions. Disability and survivors’ death in service benefits are defined on the basis of the member’s insured remuneration. Leavers before retirement are required to transfer their
Notes to the Syngenta AG Group Consolidated Financial Statements Financial Report 2020
56
accumulated retirement and capital savings to the occupational pension plan of their new employment. The Swiss Fund is governed by a twelve member Board of Trustees. Six members, including the President, are nominated by Syngenta (five members) and CIMO (one member), and six are elected by insured plan members from among the employees. Its decisions regarding certain items, including rates of retirement credits for service and interest credits, conversion rates on retirement and plan asset investment strategy require a two-thirds majority vote. Legal conformity of the Swiss Fund’s regulations is verified by the Swiss Pension Inspectorate. Syngenta’s legal obligations, including required employer contributions, are defined in the pension fund rules which are agreed by the Board of Trustees.
Employer and employee contributions are payable according to an age related scale of percentages of pay. Under BVG, the Swiss Fund guarantees the vested benefit amount as confirmed annually to members. Interest may be added to member balances at the discretion of the Board of Trustees. Members have the right to take their retirement benefit as a lump sum, an annuity or part as a lump sum with the balance converted to a fixed annuity at the rates defined in the Fund’s rules. The Board of Trustees may increase the annuity at their discretion subject to the Swiss Fund’s funded status including sufficient free funds as determined according to Swiss statutory valuation rules. Syngenta accounts for the Swiss Fund as a defined benefit pension plan.
An actuarial balance sheet is usually drawn up annually by the Swiss Fund’s actuary. If the balance sheet reveals a deficit, the Board of Trustees defines appropriate measures to eliminate the deficit. If necessary, and after consultation with the actuary, the contributions payable by employees and by Syngenta may be increased or the benefits, may be adjusted to the funds available. The Board of Trustees manages the Swiss Fund’s assets in conformity with the investment policy rules laid down by Swiss law, with the objectives of achieving investment that is secure, produces an appropriate yield and meets the liquidity needs of the Swiss Fund. This is implemented through an investment sub-committee similar to the UK Investment Committee mentioned above.
USA
Syngenta’s main US defined benefit pension plan (the US Plan) is a non-contributory defined benefit pension plan subject to the provisions of the Employee Retirement Income Security Act of 1974, as amended (ERISA) and the US Internal Revenue Code of 1986, as amended (Code). In addition, certain benefits under the US Plan are guaranteed by the US Pension Benefit Guaranty Corporation. The US Plan was closed to new members effective January 1, 2009. Employees joining Syngenta after that date participate in a defined contribution pension plan. The defined benefits of existing members of the US Plan were not affected by this change. The US Plan offers members the choice of taking their retirement benefits, which are generally based on their age, pay and years of service, as a full lump sum at retirement date or as a fixed annuity. In these consolidated financial statements, the benefit obligation has been valued assuming that 80 percent of current eligible members will take the lump sum option at normal retirement or other permissible commencement dates. This assumption is consistent with historical and expected future member choices.
US plan assets are held in a separate trust with State Street Bank and Trust Company as trustee and custodian. The assets must generally remain in the trust until all pension benefits are paid. An Investment Committee of Syngenta employees (the US Investment Committee), appointed by the Board of Directors of Syngenta Corporation, a wholly owned subsidiary of Syngenta AG, oversees the investment of the plan assets, either directly or through the appointment of investment managers. The US Investment Committee develops and implements an investment strategy that takes into account the liability profile of the US Plan. Asset classes are selected that include equities, fixed income and alternative assets. Interest rate derivatives may be used to hedge the interest rate risk of the US Plan. The Plan’s key risks include interest rate risk that impacts the value of the liability and the fixed income assets of the US Plan, investment performance volatility, and to a lesser degree inflation and longevity risk. An actuarial valuation is required each year and is used to determine the valuation and characteristics of the liability of the US Plan.
Syngenta Corporation’s funding policy is to contribute to the US Plan amounts necessary on an actuarial basis to at least satisfy the minimum funding requirements of the Code. Additional discretionary contributions above the minimum funding requirements can be made and are generally based on the annual administrative expense of the plan, along with an adjustment for any over/under funding.
Benefits under the plan were frozen effective December 31, 2018, and no participants shall accrue additional benefits after that date. Syngenta has accounted for this change as a plan amendment.
In 2020, the US Plan made a one-time lump sum offer to active employees aged 59 and a half-year or older through the administration of a lump sum window made possible by the Setting Every Community Up for Retirement Enhancement (“SECRUE”) Act, and made $41 million in lump sum payments as a result. Syngenta accounted for this as a settlement of these participants’ defined benefit obligations which were $46 million at the 2.65% discount rate at the settlement date. As a result, Syngenta recognized a settlement gain of $5 million in Other general and administrative in 2020.
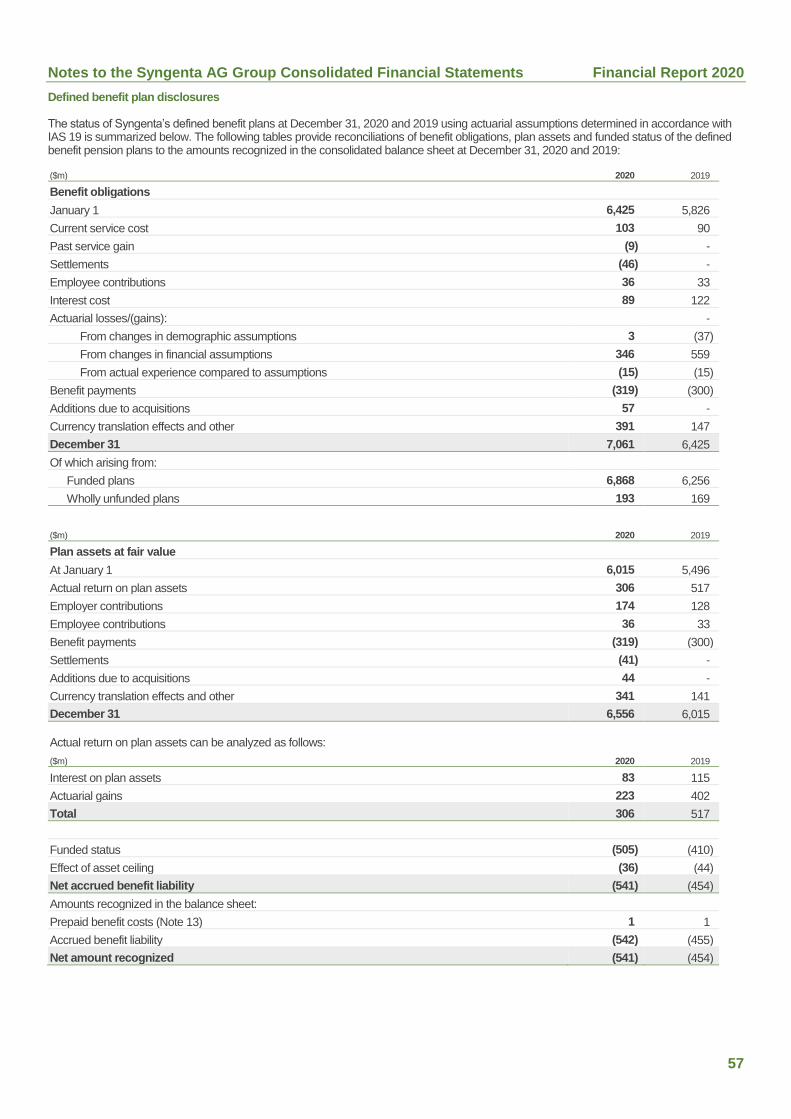
Notes to the Syngenta AG Group Consolidated Financial Statements Financial Report 2020
57
Defined benefit plan disclosures
The status of Syngenta’s defined benefit plans at December 31, 2020 and 2019 using actuarial assumptions determined in accordance with IAS 19 is summarized below. The following tables provide reconciliations of benefit obligations, plan assets and funded status of the defined benefit pension plans to the amounts recognized in the consolidated balance sheet at December 31, 2020 and 2019:
($m) 2020 2019
Benefit obligations
January 1 6,425 5,826
Current service cost 103 90
Past service gain (9) ‐
Settlements (46) ‐
Employee contributions 36 33
Interest cost 89 122
Actuarial losses/(gains): ‐
From changes in demographic assumptions 3 (37)
From changes in financial assumptions 346 559
From actual experience compared to assumptions (15) (15)
Benefit payments (319) (300)
Additions due to acquisitions 57 ‐
Currency translation effects and other 391 147
December 31 7,061 6,425
Of which arising from:
Funded plans 6,868 6,256
Wholly unfunded plans 193 169
($m) 2020 2019
Plan assets at fair value
At January 1 6,015 5,496
Actual return on plan assets 306 517
Employer contributions 174 128
Employee contributions 36 33
Benefit payments (319) (300)
Settlements (41) ‐
Additions due to acquisitions 44 ‐
Currency translation effects and other 341 141
December 31 6,556 6,015
Actual return on plan assets can be analyzed as follows:
($m) 2020 2019
Interest on plan assets 83 115
Actuarial gains 223 402
Total 306 517
Funded status (505) (410)
Effect of asset ceiling (36) (44)
Net accrued benefit liability (541) (454)
Amounts recognized in the balance sheet:
Prepaid benefit costs (Note 13) 1 1
Accrued benefit liability (542) (455)
Net amount recognized (541) (454)
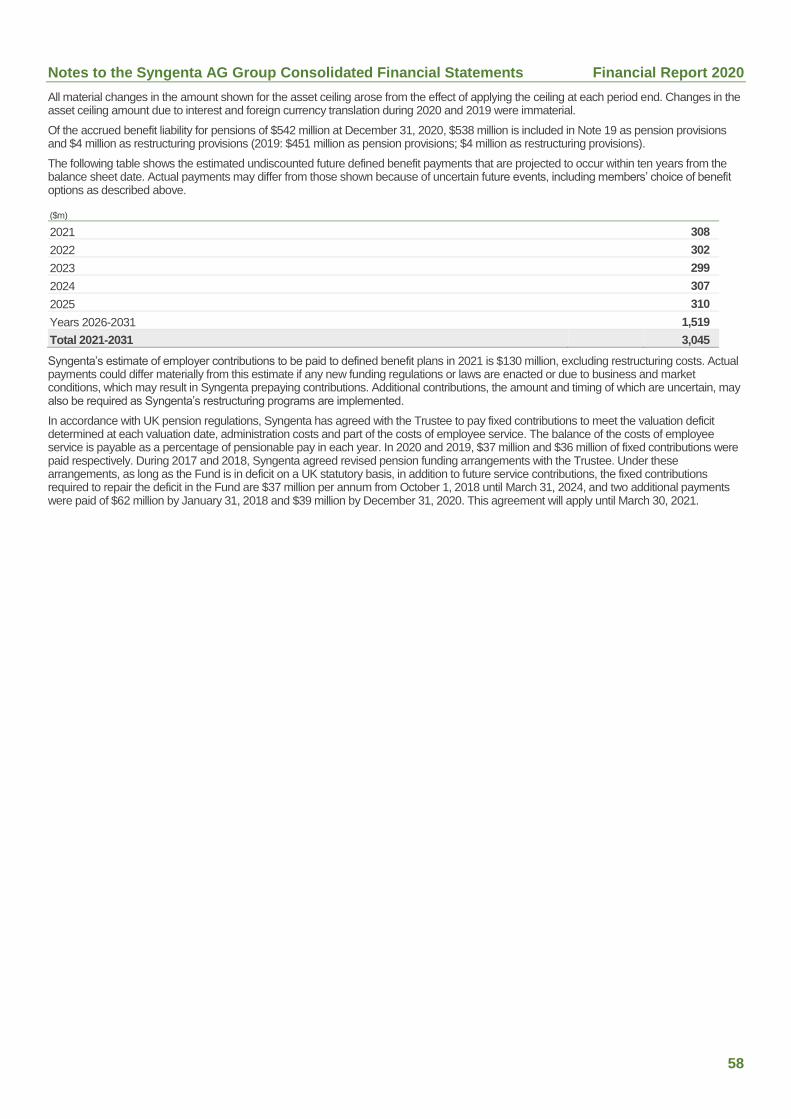
Notes to the Syngenta AG Group Consolidated Financial Statements Financial Report 2020
58
All material changes in the amount shown for the asset ceiling arose from the effect of applying the ceiling at each period end. Changes in the asset ceiling amount due to interest and foreign currency translation during 2020 and 2019 were immaterial.
Of the accrued benefit liability for pensions of $542 million at December 31, 2020, $538 million is included in Note 19 as pension provisions and $4 million as restructuring provisions (2019: $451 million as pension provisions; $4 million as restructuring provisions).
The following table shows the estimated undiscounted future defined benefit payments that are projected to occur within ten years from the balance sheet date. Actual payments may differ from those shown because of uncertain future events, including members’ choice of benefit options as described above.
($m)
2021 308
2022 302
2023 299
2024 307
2025 310
Years 2026-2031 1,519
Total 2021-2031 3,045
Syngenta’s estimate of employer contributions to be paid to defined benefit plans in 2021 is $130 million, excluding restructuring costs. Actual payments could differ materially from this estimate if any new funding regulations or laws are enacted or due to business and market conditions, which may result in Syngenta prepaying contributions. Additional contributions, the amount and timing of which are uncertain, may also be required as Syngenta’s restructuring programs are implemented.
In accordance with UK pension regulations, Syngenta has agreed with the Trustee to pay fixed contributions to meet the valuation deficit determined at each valuation date, administration costs and part of the costs of employee service. The balance of the costs of employee service is payable as a percentage of pensionable pay in each year. In 2020 and 2019, $37 million and $36 million of fixed contributions were paid respectively. During 2017 and 2018, Syngenta agreed revised pension funding arrangements with the Trustee. Under these arrangements, as long as the Fund is in deficit on a UK statutory basis, in addition to future service contributions, the fixed contributions required to repair the deficit in the Fund are $37 million per annum from October 1, 2018 until March 31, 2024, and two additional payments were paid of $62 million by January 31, 2018 and $39 million by December 31, 2020. This agreement will apply until March 30, 2021.
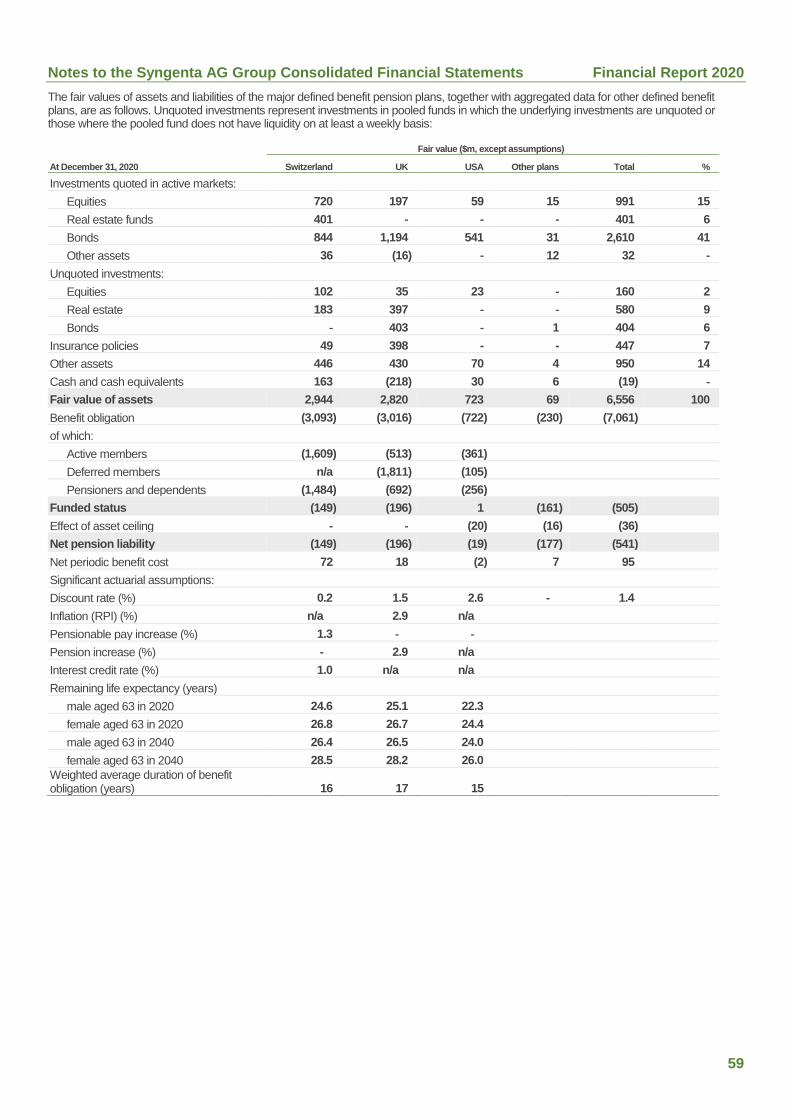
Notes to the Syngenta AG Group Consolidated Financial Statements Financial Report 2020
59
The fair values of assets and liabilities of the major defined benefit pension plans, together with aggregated data for other defined benefit plans, are as follows. Unquoted investments represent investments in pooled funds in which the underlying investments are unquoted or those where the pooled fund does not have liquidity on at least a weekly basis:
Fair value ($m, except assumptions)
At December 31, 2020 Switzerland UK USA Other plans Total %
Investments quoted in active markets:
Equities 720 197 59 15 991 15
Real estate funds 401 ‐ ‐ ‐ 401 6
Bonds 844 1,194 541 31 2,610 41
Other assets 36 (16) ‐ 12 32 ‐
Unquoted investments:
Equities 102 35 23 ‐ 160 2
Real estate 183 397 ‐ ‐ 580 9
Bonds ‐ 403 ‐ 1 404 6
Insurance policies 49 398 - - 447 7
Other assets 446 430 70 4 950 14
Cash and cash equivalents 163 (218) 30 6 (19) ‐
Fair value of assets 2,944 2,820 723 69 6,556 100
Benefit obligation (3,093) (3,016) (722) (230) (7,061)
of which:
Active members (1,609) (513) (361)
Deferred members n/a (1,811) (105)
Pensioners and dependents (1,484) (692) (256)
Funded status (149) (196) 1 (161) (505)
Effect of asset ceiling ‐ ‐ (20) (16) (36)
Net pension liability (149) (196) (19) (177) (541)
Net periodic benefit cost 72 18 (2) 7 95
Significant actuarial assumptions:
Discount rate (%) 0.2 1.5 2.6 - 1.4
Inflation (RPI) (%) n/a 2.9 n/a
Pensionable pay increase (%) 1.3 ‐ ‐
Pension increase (%) - 2.9 n/a
Interest credit rate (%) 1.0 n/a n/a
Remaining life expectancy (years)
male aged 63 in 2020 24.6 25.1 22.3
female aged 63 in 2020 26.8 26.7 24.4
male aged 63 in 2040 26.4 26.5 24.0
female aged 63 in 2040 28.5 28.2 26.0
Weighted average duration of benefit obligation (years) 16 17 15
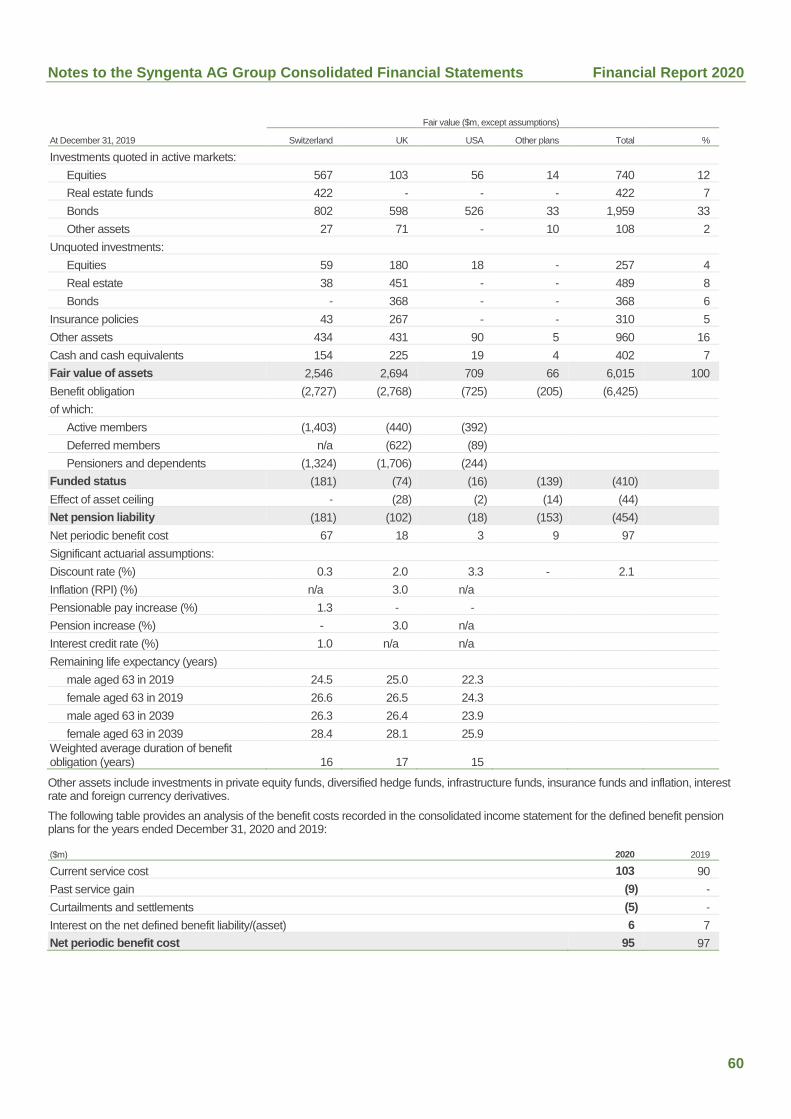
Notes to the Syngenta AG Group Consolidated Financial Statements Financial Report 2020
60
Fair value ($m, except assumptions)
At December 31, 2019 Switzerland UK USA Other plans Total %
Investments quoted in active markets:
Equities 567 103 56 14 740 12
Real estate funds 422 ‐ ‐ ‐ 422 7
Bonds 802 598 526 33 1,959 33
Other assets 27 71 ‐ 10 108 2
Unquoted investments:
Equities 59 180 18 ‐ 257 4
Real estate 38 451 ‐ ‐ 489 8
Bonds ‐ 368 ‐ ‐ 368 6
Insurance policies 43 267 - - 310 5
Other assets 434 431 90 5 960 16
Cash and cash equivalents 154 225 19 4 402 7
Fair value of assets 2,546 2,694 709 66 6,015 100
Benefit obligation (2,727) (2,768) (725) (205) (6,425)
of which:
Active members (1,403) (440) (392)
Deferred members n/a (622) (89)
Pensioners and dependents (1,324) (1,706) (244)
Funded status (181) (74) (16) (139) (410)
Effect of asset ceiling ‐ (28) (2) (14) (44)
Net pension liability (181) (102) (18) (153) (454)
Net periodic benefit cost 67 18 3 9 97
Significant actuarial assumptions:
Discount rate (%) 0.3 2.0 3.3 - 2.1
Inflation (RPI) (%) n/a 3.0 n/a
Pensionable pay increase (%) 1.3 ‐ ‐
Pension increase (%) - 3.0 n/a
Interest credit rate (%) 1.0 n/a n/a
Remaining life expectancy (years)
male aged 63 in 2019 24.5 25.0 22.3
female aged 63 in 2019 26.6 26.5 24.3
male aged 63 in 2039 26.3 26.4 23.9
female aged 63 in 2039 28.4 28.1 25.9
Weighted average duration of benefit obligation (years) 16 17 15
Other assets include investments in private equity funds, diversified hedge funds, infrastructure funds, insurance funds and inflation, interest rate and foreign currency derivatives.
The following table provides an analysis of the benefit costs recorded in the consolidated income statement for the defined benefit pension plans for the years ended December 31, 2020 and 2019:
($m) 2020 2019
Current service cost 103 90
Past service gain (9) ‐
Curtailments and settlements (5) ‐
Interest on the net defined benefit liability/(asset) 6 7
Net periodic benefit cost 95 97
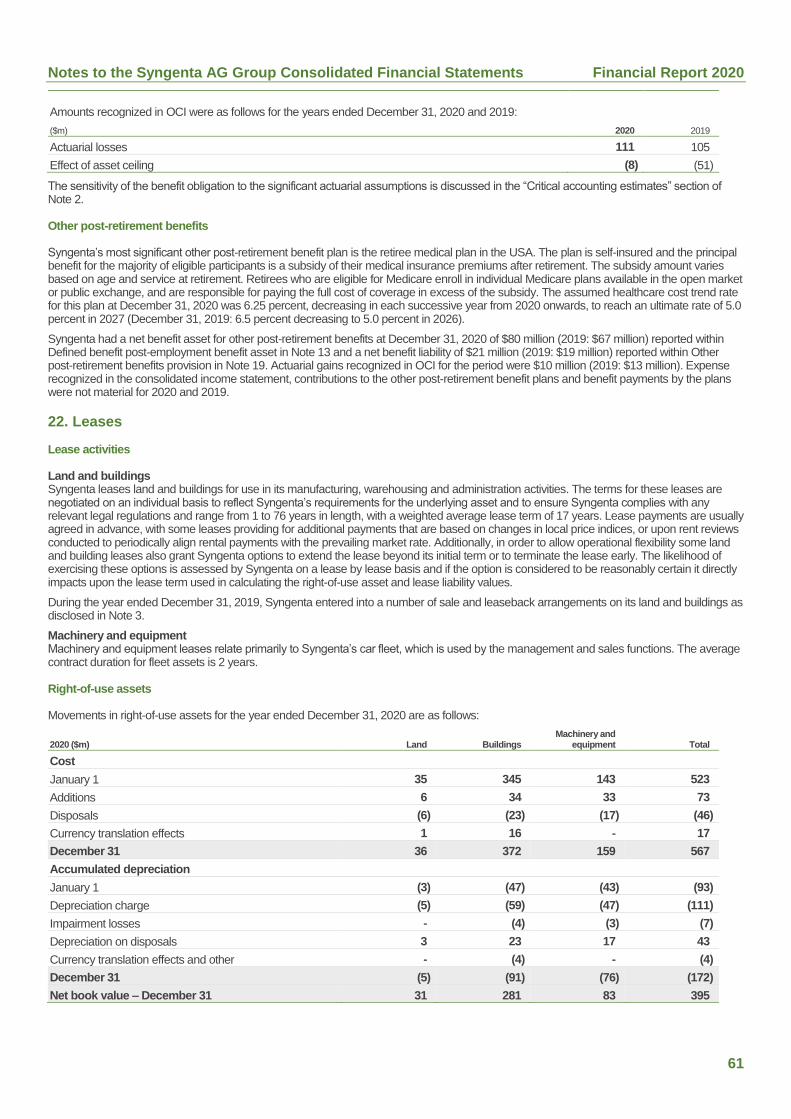
Notes to the Syngenta AG Group Consolidated Financial Statements Financial Report 2020
61
Amounts recognized in OCI were as follows for the years ended December 31, 2020 and 2019:
($m) 2020 2019
Actuarial losses 111 105
Effect of asset ceiling (8) (51)
The sensitivity of the benefit obligation to the significant actuarial assumptions is discussed in the “Critical accounting estimates” section of Note 2.
Other post-retirement benefits
Syngenta’s most significant other post-retirement benefit plan is the retiree medical plan in the USA. The plan is self-insured and the principal benefit for the majority of eligible participants is a subsidy of their medical insurance premiums after retirement. The subsidy amount varies based on age and service at retirement. Retirees who are eligible for Medicare enroll in individual Medicare plans available in the open market or public exchange, and are responsible for paying the full cost of coverage in excess of the subsidy. The assumed healthcare cost trend rate for this plan at December 31, 2020 was 6.25 percent, decreasing in each successive year from 2020 onwards, to reach an ultimate rate of 5.0 percent in 2027 (December 31, 2019: 6.5 percent decreasing to 5.0 percent in 2026).
Syngenta had a net benefit asset for other post-retirement benefits at December 31, 2020 of $80 million (2019: $67 million) reported within Defined benefit post-employment benefit asset in Note 13 and a net benefit liability of $21 million (2019: $19 million) reported within Other post-retirement benefits provision in Note 19. Actuarial gains recognized in OCI for the period were $10 million (2019: $13 million). Expense recognized in the consolidated income statement, contributions to the other post-retirement benefit plans and benefit payments by the plans were not material for 2020 and 2019.
22. Leases
Lease activities
Land and buildings Syngenta leases land and buildings for use in its manufacturing, warehousing and administration activities. The terms for these leases are negotiated on an individual basis to reflect Syngenta’s requirements for the underlying asset and to ensure Syngenta complies with any relevant legal regulations and range from 1 to 76 years in length, with a weighted average lease term of 17 years. Lease payments are usually agreed in advance, with some leases providing for additional payments that are based on changes in local price indices, or upon rent reviews conducted to periodically align rental payments with the prevailing market rate. Additionally, in order to allow operational flexibility some land and building leases also grant Syngenta options to extend the lease beyond its initial term or to terminate the lease early. The likelihood of exercising these options is assessed by Syngenta on a lease by lease basis and if the option is considered to be reasonably certain it directly impacts upon the lease term used in calculating the right-of-use asset and lease liability values.
During the year ended December 31, 2019, Syngenta entered into a number of sale and leaseback arrangements on its land and buildings as disclosed in Note 3.
Machinery and equipment Machinery and equipment leases relate primarily to Syngenta’s car fleet, which is used by the management and sales functions. The average contract duration for fleet assets is 2 years.
Right-of-use assets
Movements in right-of-use assets for the year ended December 31, 2020 are as follows:
2020 ($m) Land Buildings Machinery and
equipment Total
Cost
January 1 35 345 143 523
Additions 6 34 33 73
Disposals (6) (23) (17) (46)
Currency translation effects 1 16 ‐ 17
December 31 36 372 159 567
Accumulated depreciation
January 1 (3) (47) (43) (93)
Depreciation charge (5) (59) (47) (111)
Impairment losses ‐ (4) (3) (7)
Depreciation on disposals 3 23 17 43
Currency translation effects and other ‐ (4) ‐ (4)
December 31 (5) (91) (76) (172)
Net book value – December 31 31 281 83 395
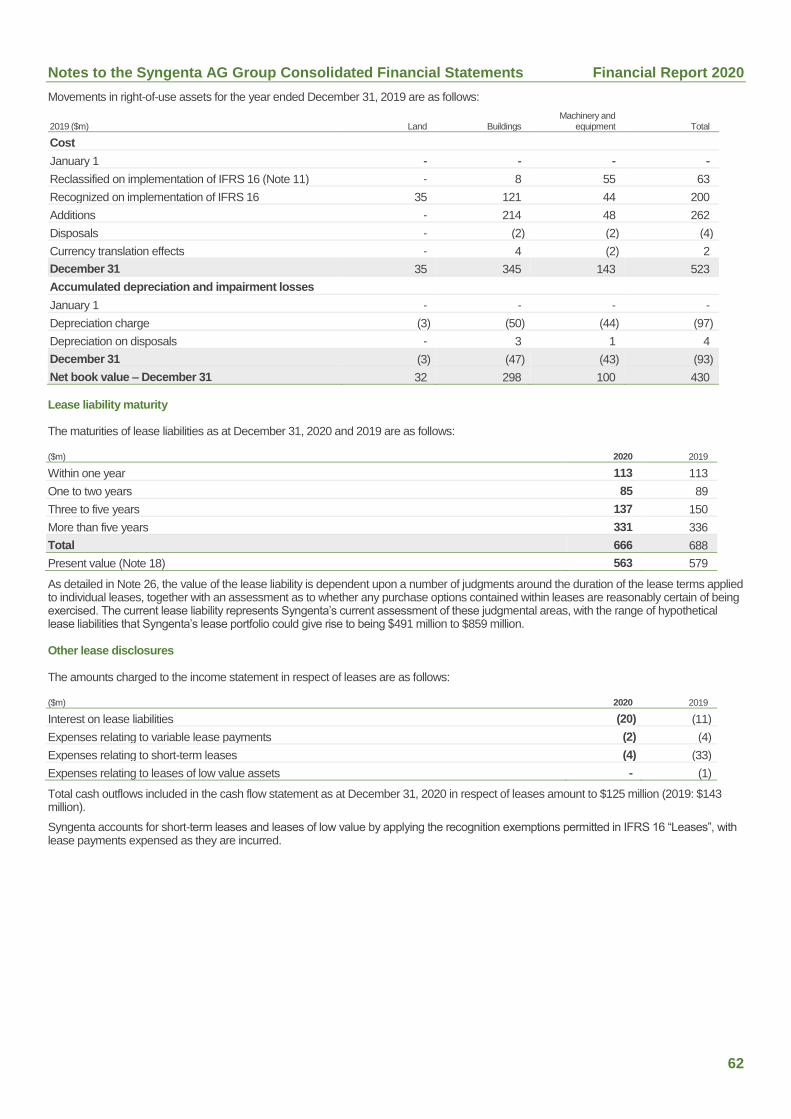
Notes to the Syngenta AG Group Consolidated Financial Statements Financial Report 2020
62
Movements in right-of-use assets for the year ended December 31, 2019 are as follows:
2019 ($m) Land Buildings Machinery and
equipment Total
Cost
January 1 ‐ ‐ ‐ ‐
Reclassified on implementation of IFRS 16 (Note 11) ‐ 8 55 63
Recognized on implementation of IFRS 16 35 121 44 200
Additions ‐ 214 48 262
Disposals ‐ (2) (2) (4)
Currency translation effects ‐ 4 (2) 2
December 31 35 345 143 523
Accumulated depreciation and impairment losses
January 1 ‐ ‐ ‐ ‐
Depreciation charge (3) (50) (44) (97)
Depreciation on disposals ‐ 3 1 4
December 31 (3) (47) (43) (93)
Net book value – December 31 32 298 100 430
Lease liability maturity
The maturities of lease liabilities as at December 31, 2020 and 2019 are as follows:
($m) 2020 2019
Within one year 113 113
One to two years 85 89
Three to five years 137 150
More than five years 331 336
Total 666 688
Present value (Note 18) 563 579
As detailed in Note 26, the value of the lease liability is dependent upon a number of judgments around the duration of the lease terms applied to individual leases, together with an assessment as to whether any purchase options contained within leases are reasonably certain of being exercised. The current lease liability represents Syngenta’s current assessment of these judgmental areas, with the range of hypothetical lease liabilities that Syngenta’s lease portfolio could give rise to being $491 million to $859 million.
Other lease disclosures
The amounts charged to the income statement in respect of leases are as follows:
($m) 2020 2019
Interest on lease liabilities (20) (11)
Expenses relating to variable lease payments (2) (4)
Expenses relating to short-term leases (4) (33)
Expenses relating to leases of low value assets - (1)
Total cash outflows included in the cash flow statement as at December 31, 2020 in respect of leases amount to $125 million (2019: $143 million).
Syngenta accounts for short-term leases and leases of low value by applying the recognition exemptions permitted in IFRS 16 “Leases”, with lease payments expensed as they are incurred.
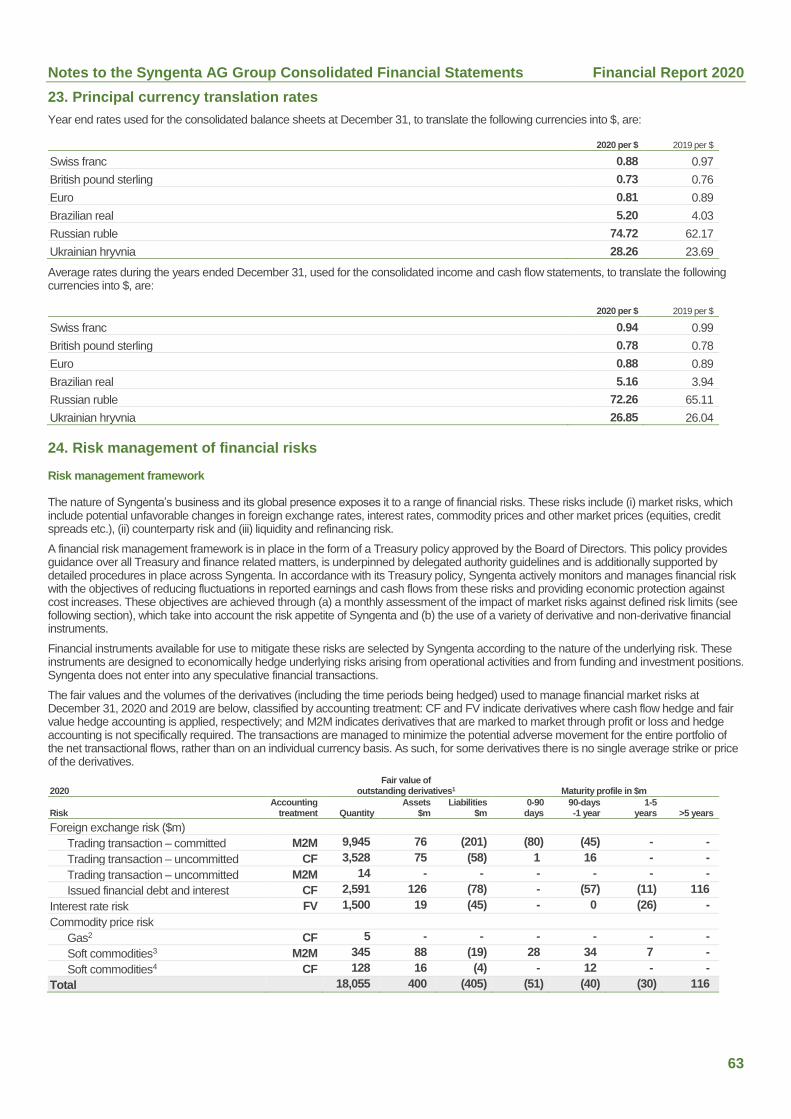
Notes to the Syngenta AG Group Consolidated Financial Statements Financial Report 2020
63
23. Principal currency translation rates
Year end rates used for the consolidated balance sheets at December 31, to translate the following currencies into $, are:
2020 per $ 2019 per $
Swiss franc 0.88 0.97
British pound sterling 0.73 0.76
Euro 0.81 0.89
Brazilian real 5.20 4.03
Russian ruble 74.72 62.17
Ukrainian hryvnia 28.26 23.69
Average rates during the years ended December 31, used for the consolidated income and cash flow statements, to translate the following currencies into $, are:
2020 per $ 2019 per $
Swiss franc 0.94 0.99
British pound sterling 0.78 0.78
Euro 0.88 0.89
Brazilian real 5.16 3.94
Russian ruble 72.26 65.11
Ukrainian hryvnia 26.85 26.04
24. Risk management of financial risks
Risk management framework
The nature of Syngenta’s business and its global presence exposes it to a range of financial risks. These risks include (i) market risks, which include potential unfavorable changes in foreign exchange rates, interest rates, commodity prices and other market prices (equities, credit spreads etc.), (ii) counterparty risk and (iii) liquidity and refinancing risk.
A financial risk management framework is in place in the form of a Treasury policy approved by the Board of Directors. This policy provides guidance over all Treasury and finance related matters, is underpinned by delegated authority guidelines and is additionally supported by detailed procedures in place across Syngenta. In accordance with its Treasury policy, Syngenta actively monitors and manages financial risk with the objectives of reducing fluctuations in reported earnings and cash flows from these risks and providing economic protection against cost increases. These objectives are achieved through (a) a monthly assessment of the impact of market risks against defined risk limits (see following section), which take into account the risk appetite of Syngenta and (b) the use of a variety of derivative and non-derivative financial instruments.
Financial instruments available for use to mitigate these risks are selected by Syngenta according to the nature of the underlying risk. These instruments are designed to economically hedge underlying risks arising from operational activities and from funding and investment positions. Syngenta does not enter into any speculative financial transactions.
The fair values and the volumes of the derivatives (including the time periods being hedged) used to manage financial market risks at December 31, 2020 and 2019 are below, classified by accounting treatment: CF and FV indicate derivatives where cash flow hedge and fair value hedge accounting is applied, respectively; and M2M indicates derivatives that are marked to market through profit or loss and hedge accounting is not specifically required. The transactions are managed to minimize the potential adverse movement for the entire portfolio of the net transactional flows, rather than on an individual currency basis. As such, for some derivatives there is no single average strike or price of the derivatives.
2020 Fair value of
outstanding derivatives1 Maturity profile in $m
Risk Accounting
treatment
Quantity Assets
$m Liabilities
$m 0-90
days 90-days -1 year
1-5 years >5 years
Foreign exchange risk ($m)
Trading transaction – committed M2M 9,945 76 (201) (80) (45) - -
Trading transaction – uncommitted CF 3,528 75 (58) 1 16 - -
Trading transaction – uncommitted M2M 14 - - - - - -
Issued financial debt and interest CF 2,591 126 (78) - (57) (11) 116
Interest rate risk FV 1,500 19 (45) - 0 (26) -
Commodity price risk
Gas2 CF 5 - - - - - -
Soft commodities3 M2M 345 88 (19) 28 34 7 -
Soft commodities4 CF 128 16 (4) - 12 - -
Total 18,055 400 (405) (51) (40) (30) 116
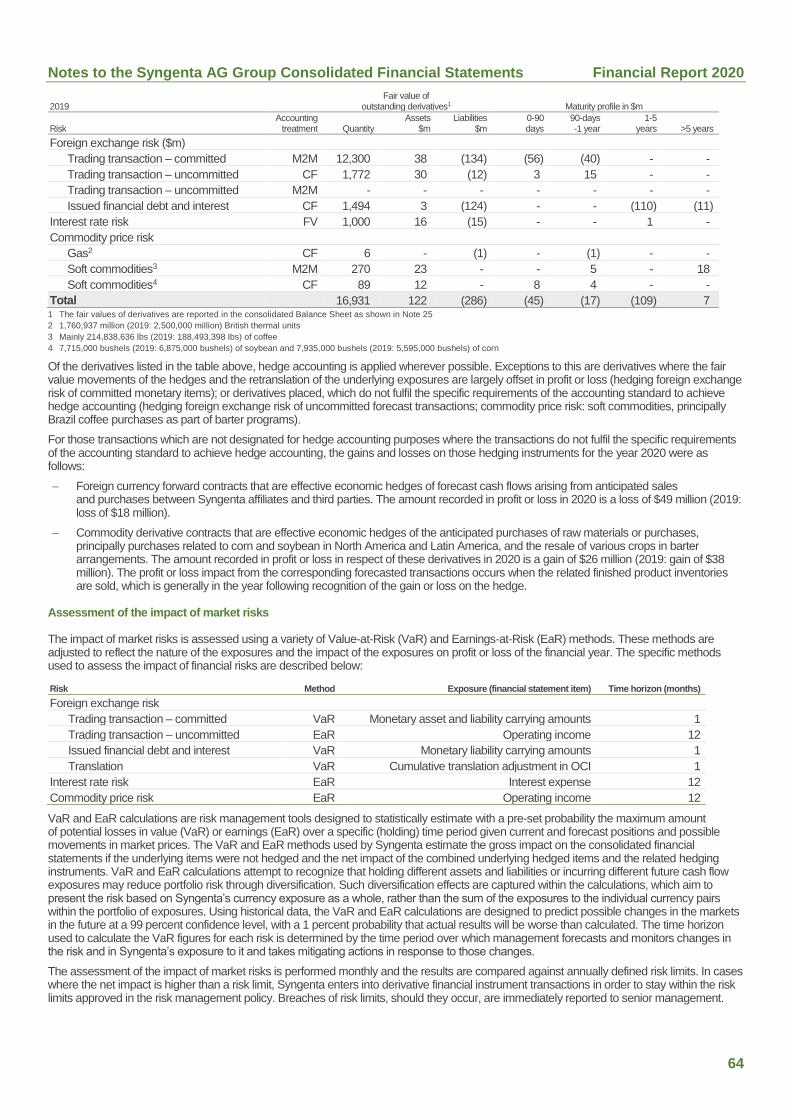
Notes to the Syngenta AG Group Consolidated Financial Statements Financial Report 2020
64
2019 Fair value of
outstanding derivatives1 Maturity profile in $m
Risk Accounting
treatment
Quantity Assets
$m Liabilities
$m 0-90 days
90-days -1 year
1-5 years >5 years
Foreign exchange risk ($m)
Trading transaction – committed M2M 12,300 38 (134) (56) (40) - -
Trading transaction – uncommitted CF 1,772 30 (12) 3 15 - -
Trading transaction – uncommitted M2M - - - - - - -
Issued financial debt and interest CF 1,494 3 (124) - - (110) (11)
Interest rate risk FV 1,000 16 (15) - - 1 -
Commodity price risk
Gas2 CF 6 - (1) - (1) - -
Soft commodities3 M2M 270 23 - - 5 - 18
Soft commodities4 CF 89 12 - 8 4 - -
Total 16,931 122 (286) (45) (17) (109) 7 1 The fair values of derivatives are reported in the consolidated Balance Sheet as shown in Note 25
2 1,760,937 million (2019: 2,500,000 million) British thermal units
3 Mainly 214,838,636 lbs (2019: 188,493,398 lbs) of coffee
4 7,715,000 bushels (2019: 6,875,000 bushels) of soybean and 7,935,000 bushels (2019: 5,595,000 bushels) of corn
Of the derivatives listed in the table above, hedge accounting is applied wherever possible. Exceptions to this are derivatives where the fair value movements of the hedges and the retranslation of the underlying exposures are largely offset in profit or loss (hedging foreign exchange risk of committed monetary items); or derivatives placed, which do not fulfil the specific requirements of the accounting standard to achieve hedge accounting (hedging foreign exchange risk of uncommitted forecast transactions; commodity price risk: soft commodities, principally Brazil coffee purchases as part of barter programs).
For those transactions which are not designated for hedge accounting purposes where the transactions do not fulfil the specific requirements of the accounting standard to achieve hedge accounting, the gains and losses on those hedging instruments for the year 2020 were as follows:
Foreign currency forward contracts that are effective economic hedges of forecast cash flows arising from anticipated sales and purchases between Syngenta affiliates and third parties. The amount recorded in profit or loss in 2020 is a loss of $49 million (2019: loss of $18 million).
Commodity derivative contracts that are effective economic hedges of the anticipated purchases of raw materials or purchases, principally purchases related to corn and soybean in North America and Latin America, and the resale of various crops in barter arrangements. The amount recorded in profit or loss in respect of these derivatives in 2020 is a gain of $26 million (2019: gain of $38 million). The profit or loss impact from the corresponding forecasted transactions occurs when the related finished product inventories are sold, which is generally in the year following recognition of the gain or loss on the hedge.
Assessment of the impact of market risks
The impact of market risks is assessed using a variety of Value-at-Risk (VaR) and Earnings-at-Risk (EaR) methods. These methods are adjusted to reflect the nature of the exposures and the impact of the exposures on profit or loss of the financial year. The specific methods used to assess the impact of financial risks are described below:
Risk Method Exposure (financial statement item) Time horizon (months)
Foreign exchange risk
Trading transaction – committed VaR Monetary asset and liability carrying amounts 1
Trading transaction – uncommitted EaR Operating income 12
Issued financial debt and interest VaR Monetary liability carrying amounts 1
Translation VaR Cumulative translation adjustment in OCI 1
Interest rate risk EaR Interest expense 12
Commodity price risk EaR Operating income 12
VaR and EaR calculations are risk management tools designed to statistically estimate with a pre-set probability the maximum amount of potential losses in value (VaR) or earnings (EaR) over a specific (holding) time period given current and forecast positions and possible movements in market prices. The VaR and EaR methods used by Syngenta estimate the gross impact on the consolidated financial statements if the underlying items were not hedged and the net impact of the combined underlying hedged items and the related hedging instruments. VaR and EaR calculations attempt to recognize that holding different assets and liabilities or incurring different future cash flow exposures may reduce portfolio risk through diversification. Such diversification effects are captured within the calculations, which aim to present the risk based on Syngenta’s currency exposure as a whole, rather than the sum of the exposures to the individual currency pairs within the portfolio of exposures. Using historical data, the VaR and EaR calculations are designed to predict possible changes in the markets in the future at a 99 percent confidence level, with a 1 percent probability that actual results will be worse than calculated. The time horizon used to calculate the VaR figures for each risk is determined by the time period over which management forecasts and monitors changes in the risk and in Syngenta’s exposure to it and takes mitigating actions in response to those changes.
The assessment of the impact of market risks is performed monthly and the results are compared against annually defined risk limits. In cases where the net impact is higher than a risk limit, Syngenta enters into derivative financial instrument transactions in order to stay within the risk limits approved in the risk management policy. Breaches of risk limits, should they occur, are immediately reported to senior management.
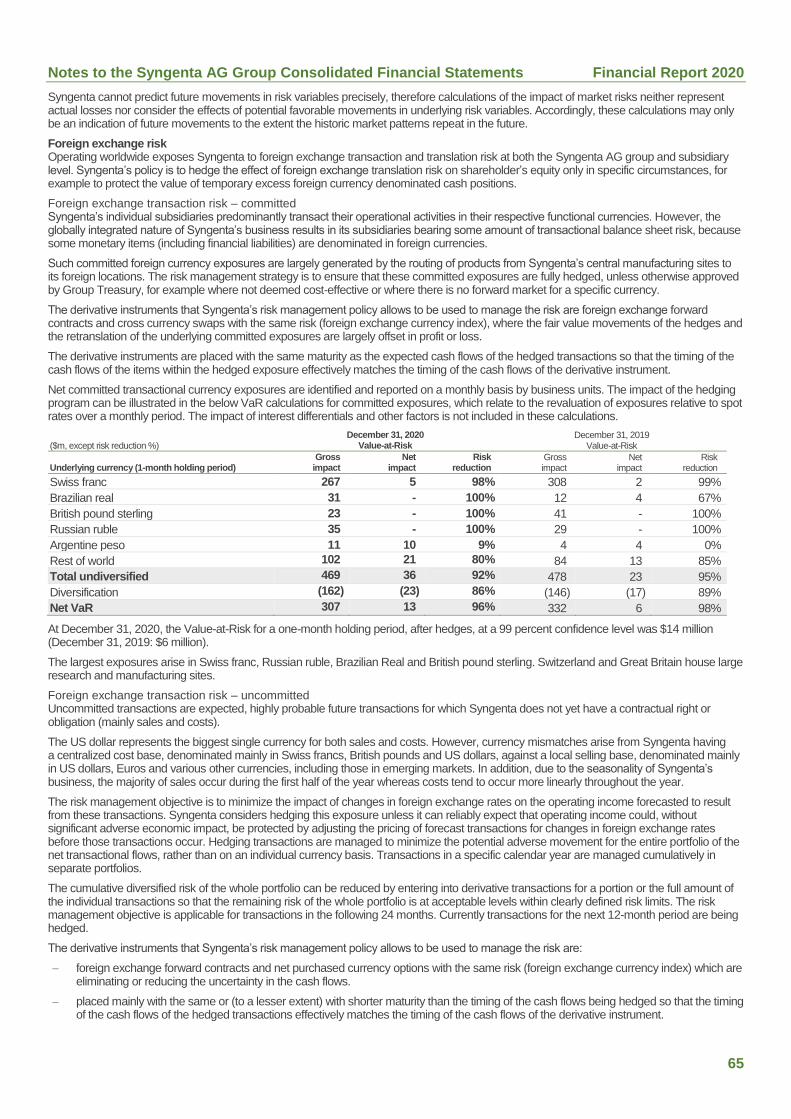
Notes to the Syngenta AG Group Consolidated Financial Statements Financial Report 2020
65
Syngenta cannot predict future movements in risk variables precisely, therefore calculations of the impact of market risks neither represent actual losses nor consider the effects of potential favorable movements in underlying risk variables. Accordingly, these calculations may only be an indication of future movements to the extent the historic market patterns repeat in the future.
Foreign exchange risk Operating worldwide exposes Syngenta to foreign exchange transaction and translation risk at both the Syngenta AG group and subsidiary level. Syngenta’s policy is to hedge the effect of foreign exchange translation risk on shareholder’s equity only in specific circumstances, for example to protect the value of temporary excess foreign currency denominated cash positions.
Foreign exchange transaction risk – committed Syngenta’s individual subsidiaries predominantly transact their operational activities in their respective functional currencies. However, the globally integrated nature of Syngenta’s business results in its subsidiaries bearing some amount of transactional balance sheet risk, because some monetary items (including financial liabilities) are denominated in foreign currencies.
Such committed foreign currency exposures are largely generated by the routing of products from Syngenta’s central manufacturing sites to its foreign locations. The risk management strategy is to ensure that these committed exposures are fully hedged, unless otherwise approved by Group Treasury, for example where not deemed cost-effective or where there is no forward market for a specific currency.
The derivative instruments that Syngenta’s risk management policy allows to be used to manage the risk are foreign exchange forward contracts and cross currency swaps with the same risk (foreign exchange currency index), where the fair value movements of the hedges and the retranslation of the underlying committed exposures are largely offset in profit or loss.
The derivative instruments are placed with the same maturity as the expected cash flows of the hedged transactions so that the timing of the cash flows of the items within the hedged exposure effectively matches the timing of the cash flows of the derivative instrument.
Net committed transactional currency exposures are identified and reported on a monthly basis by business units. The impact of the hedging program can be illustrated in the below VaR calculations for committed exposures, which relate to the revaluation of exposures relative to spot rates over a monthly period. The impact of interest differentials and other factors is not included in these calculations.
($m, except risk reduction %) December 31, 2020
Value-at-Risk December 31, 2019
Value-at-Risk
Underlying currency (1-month holding period) Gross
impact Net
impact Risk
reduction Gross impact
Net impact
Risk reduction
Swiss franc 267 5 98% 308 2 99%
Brazilian real 31 - 100% 12 4 67%
British pound sterling 23 - 100% 41 - 100%
Russian ruble 35 - 100% 29 - 100%
Argentine peso 11 10 9% 4 4 0%
Rest of world 102 21 80% 84 13 85%
Total undiversified 469 36 92% 478 23 95%
Diversification (162) (23) 86% (146) (17) 89%
Net VaR 307 13 96% 332 6 98%
At December 31, 2020, the Value-at-Risk for a one-month holding period, after hedges, at a 99 percent confidence level was $14 million (December 31, 2019: $6 million).
The largest exposures arise in Swiss franc, Russian ruble, Brazilian Real and British pound sterling. Switzerland and Great Britain house large research and manufacturing sites.
Foreign exchange transaction risk – uncommitted Uncommitted transactions are expected, highly probable future transactions for which Syngenta does not yet have a contractual right or obligation (mainly sales and costs).
The US dollar represents the biggest single currency for both sales and costs. However, currency mismatches arise from Syngenta having a centralized cost base, denominated mainly in Swiss francs, British pounds and US dollars, against a local selling base, denominated mainly in US dollars, Euros and various other currencies, including those in emerging markets. In addition, due to the seasonality of Syngenta’s business, the majority of sales occur during the first half of the year whereas costs tend to occur more linearly throughout the year.
The risk management objective is to minimize the impact of changes in foreign exchange rates on the operating income forecasted to result from these transactions. Syngenta considers hedging this exposure unless it can reliably expect that operating income could, without significant adverse economic impact, be protected by adjusting the pricing of forecast transactions for changes in foreign exchange rates before those transactions occur. Hedging transactions are managed to minimize the potential adverse movement for the entire portfolio of the net transactional flows, rather than on an individual currency basis. Transactions in a specific calendar year are managed cumulatively in separate portfolios.
The cumulative diversified risk of the whole portfolio can be reduced by entering into derivative transactions for a portion or the full amount of the individual transactions so that the remaining risk of the whole portfolio is at acceptable levels within clearly defined risk limits. The risk management objective is applicable for transactions in the following 24 months. Currently transactions for the next 12-month period are being hedged.
The derivative instruments that Syngenta’s risk management policy allows to be used to manage the risk are:
foreign exchange forward contracts and net purchased currency options with the same risk (foreign exchange currency index) which are eliminating or reducing the uncertainty in the cash flows.
placed mainly with the same or (to a lesser extent) with shorter maturity than the timing of the cash flows being hedged so that the timing of the cash flows of the hedged transactions effectively matches the timing of the cash flows of the derivative instrument.
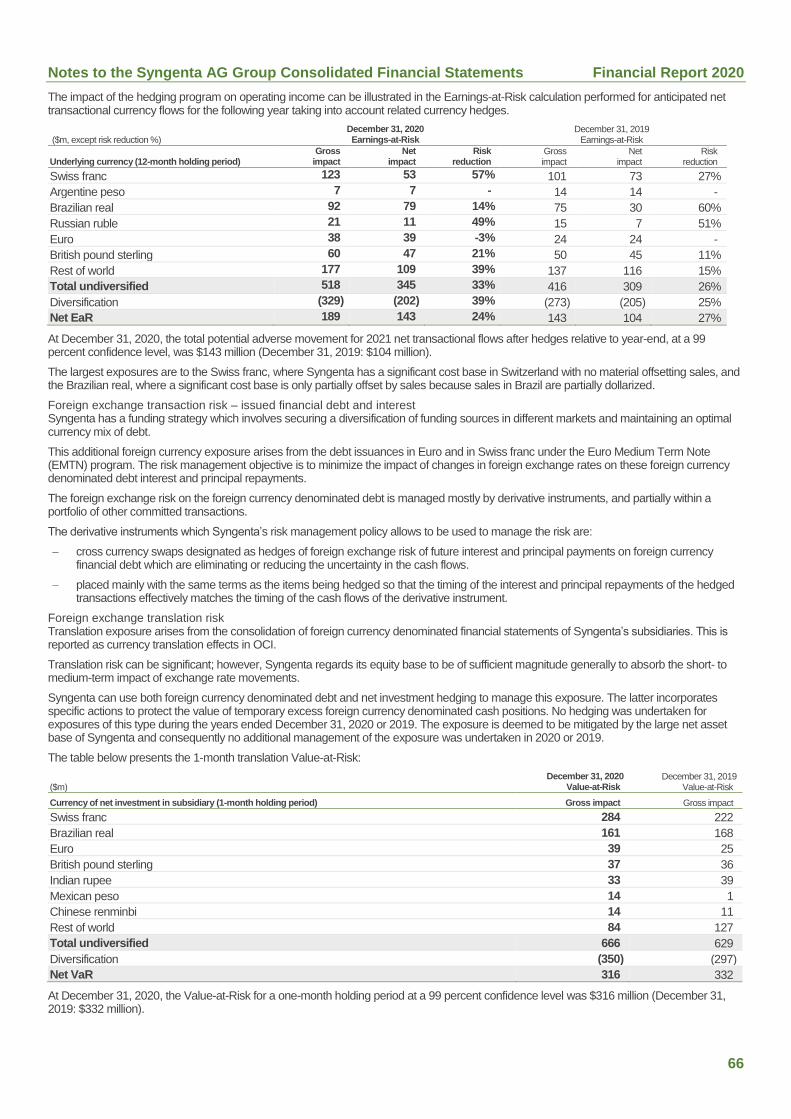
Notes to the Syngenta AG Group Consolidated Financial Statements Financial Report 2020
66
The impact of the hedging program on operating income can be illustrated in the Earnings-at-Risk calculation performed for anticipated net transactional currency flows for the following year taking into account related currency hedges.
($m, except risk reduction %) December 31, 2020 Earnings-at-Risk
December 31, 2019 Earnings-at-Risk
Underlying currency (12-month holding period) Gross
impact Net
impact Risk
reduction Gross impact
Net impact
Risk reduction
Swiss franc 123 53 57% 101 73 27%
Argentine peso 7 7 - 14 14 -
Brazilian real 92 79 14% 75 30 60%
Russian ruble 21 11 49% 15 7 51%
Euro 38 39 -3% 24 24 -
British pound sterling 60 47 21% 50 45 11%
Rest of world 177 109 39% 137 116 15%
Total undiversified 518 345 33% 416 309 26%
Diversification (329) (202) 39% (273) (205) 25%
Net EaR 189 143 24% 143 104 27%
At December 31, 2020, the total potential adverse movement for 2021 net transactional flows after hedges relative to year-end, at a 99 percent confidence level, was $143 million (December 31, 2019: $104 million).
The largest exposures are to the Swiss franc, where Syngenta has a significant cost base in Switzerland with no material offsetting sales, and the Brazilian real, where a significant cost base is only partially offset by sales because sales in Brazil are partially dollarized.
Foreign exchange transaction risk – issued financial debt and interest Syngenta has a funding strategy which involves securing a diversification of funding sources in different markets and maintaining an optimal currency mix of debt.
This additional foreign currency exposure arises from the debt issuances in Euro and in Swiss franc under the Euro Medium Term Note (EMTN) program. The risk management objective is to minimize the impact of changes in foreign exchange rates on these foreign currency denominated debt interest and principal repayments.
The foreign exchange risk on the foreign currency denominated debt is managed mostly by derivative instruments, and partially within a portfolio of other committed transactions.
The derivative instruments which Syngenta’s risk management policy allows to be used to manage the risk are:
cross currency swaps designated as hedges of foreign exchange risk of future interest and principal payments on foreign currency financial debt which are eliminating or reducing the uncertainty in the cash flows.
placed mainly with the same terms as the items being hedged so that the timing of the interest and principal repayments of the hedged transactions effectively matches the timing of the cash flows of the derivative instrument.
Foreign exchange translation risk Translation exposure arises from the consolidation of foreign currency denominated financial statements of Syngenta’s subsidiaries. This is reported as currency translation effects in OCI.
Translation risk can be significant; however, Syngenta regards its equity base to be of sufficient magnitude generally to absorb the short- to medium-term impact of exchange rate movements.
Syngenta can use both foreign currency denominated debt and net investment hedging to manage this exposure. The latter incorporates specific actions to protect the value of temporary excess foreign currency denominated cash positions. No hedging was undertaken for exposures of this type during the years ended December 31, 2020 or 2019. The exposure is deemed to be mitigated by the large net asset base of Syngenta and consequently no additional management of the exposure was undertaken in 2020 or 2019.
The table below presents the 1-month translation Value-at-Risk:
($m) December 31, 2020
Value-at-Risk December 31, 2019
Value-at-Risk
Currency of net investment in subsidiary (1-month holding period) Gross impact Gross impact
Swiss franc 284 222
Brazilian real 161 168
Euro 39 25
British pound sterling 37 36
Indian rupee 33 39
Mexican peso 14 1
Chinese renminbi 14 11
Rest of world 84 127
Total undiversified 666 629
Diversification (350) (297)
Net VaR 316 332
At December 31, 2020, the Value-at-Risk for a one-month holding period at a 99 percent confidence level was $316 million (December 31, 2019: $332 million).
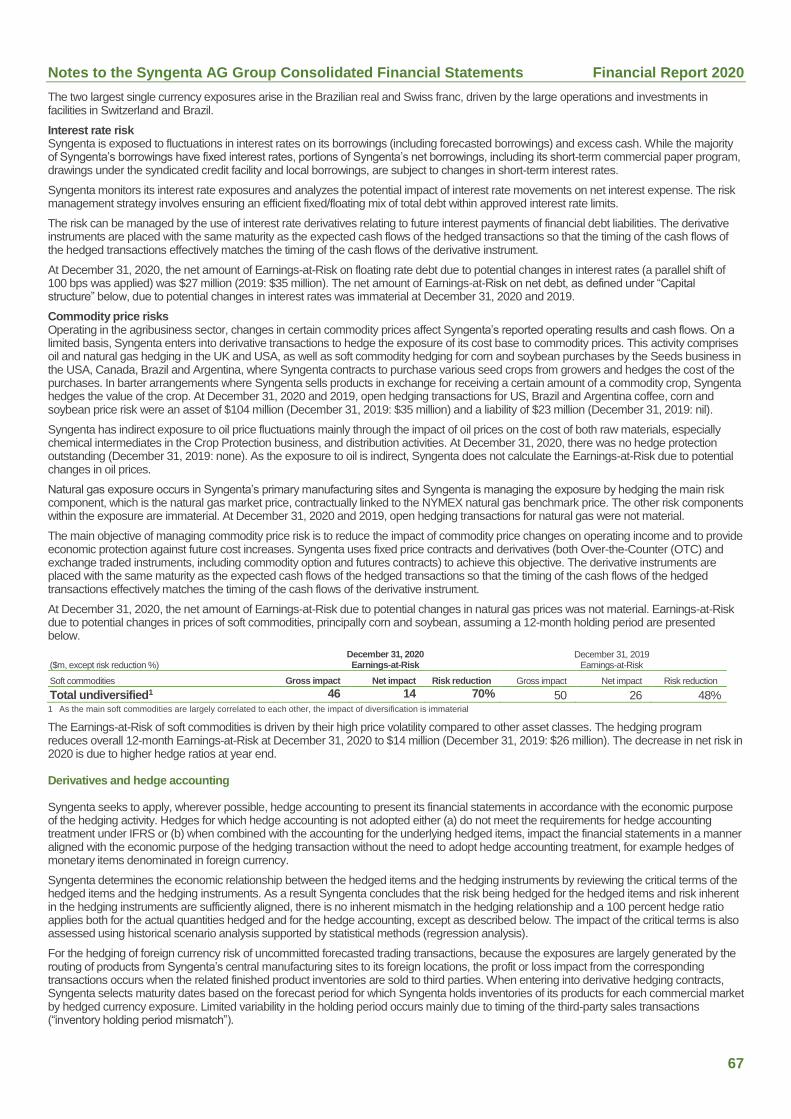
Notes to the Syngenta AG Group Consolidated Financial Statements Financial Report 2020
67
The two largest single currency exposures arise in the Brazilian real and Swiss franc, driven by the large operations and investments in facilities in Switzerland and Brazil.
Interest rate risk Syngenta is exposed to fluctuations in interest rates on its borrowings (including forecasted borrowings) and excess cash. While the majority of Syngenta’s borrowings have fixed interest rates, portions of Syngenta’s net borrowings, including its short-term commercial paper program, drawings under the syndicated credit facility and local borrowings, are subject to changes in short-term interest rates.
Syngenta monitors its interest rate exposures and analyzes the potential impact of interest rate movements on net interest expense. The risk management strategy involves ensuring an efficient fixed/floating mix of total debt within approved interest rate limits.
The risk can be managed by the use of interest rate derivatives relating to future interest payments of financial debt liabilities. The derivative instruments are placed with the same maturity as the expected cash flows of the hedged transactions so that the timing of the cash flows of the hedged transactions effectively matches the timing of the cash flows of the derivative instrument.
At December 31, 2020, the net amount of Earnings-at-Risk on floating rate debt due to potential changes in interest rates (a parallel shift of 100 bps was applied) was $27 million (2019: $35 million). The net amount of Earnings-at-Risk on net debt, as defined under “Capital structure” below, due to potential changes in interest rates was immaterial at December 31, 2020 and 2019.
Commodity price risks Operating in the agribusiness sector, changes in certain commodity prices affect Syngenta’s reported operating results and cash flows. On a limited basis, Syngenta enters into derivative transactions to hedge the exposure of its cost base to commodity prices. This activity comprises oil and natural gas hedging in the UK and USA, as well as soft commodity hedging for corn and soybean purchases by the Seeds business in the USA, Canada, Brazil and Argentina, where Syngenta contracts to purchase various seed crops from growers and hedges the cost of the purchases. In barter arrangements where Syngenta sells products in exchange for receiving a certain amount of a commodity crop, Syngenta hedges the value of the crop. At December 31, 2020 and 2019, open hedging transactions for US, Brazil and Argentina coffee, corn and soybean price risk were an asset of $104 million (December 31, 2019: $35 million) and a liability of $23 million (December 31, 2019: nil).
Syngenta has indirect exposure to oil price fluctuations mainly through the impact of oil prices on the cost of both raw materials, especially chemical intermediates in the Crop Protection business, and distribution activities. At December 31, 2020, there was no hedge protection outstanding (December 31, 2019: none). As the exposure to oil is indirect, Syngenta does not calculate the Earnings-at-Risk due to potential changes in oil prices.
Natural gas exposure occurs in Syngenta’s primary manufacturing sites and Syngenta is managing the exposure by hedging the main risk component, which is the natural gas market price, contractually linked to the NYMEX natural gas benchmark price. The other risk components within the exposure are immaterial. At December 31, 2020 and 2019, open hedging transactions for natural gas were not material.
The main objective of managing commodity price risk is to reduce the impact of commodity price changes on operating income and to provide economic protection against future cost increases. Syngenta uses fixed price contracts and derivatives (both Over-the-Counter (OTC) and exchange traded instruments, including commodity option and futures contracts) to achieve this objective. The derivative instruments are placed with the same maturity as the expected cash flows of the hedged transactions so that the timing of the cash flows of the hedged transactions effectively matches the timing of the cash flows of the derivative instrument.
At December 31, 2020, the net amount of Earnings-at-Risk due to potential changes in natural gas prices was not material. Earnings-at-Risk due to potential changes in prices of soft commodities, principally corn and soybean, assuming a 12-month holding period are presented below.
($m, except risk reduction %) December 31, 2020 Earnings-at-Risk
December 31, 2019 Earnings-at-Risk
Soft commodities Gross impact Net impact Risk reduction Gross impact Net impact Risk reduction
Total undiversified1 46 14 70% 50 26 48% 1 As the main soft commodities are largely correlated to each other, the impact of diversification is immaterial
The Earnings-at-Risk of soft commodities is driven by their high price volatility compared to other asset classes. The hedging program reduces overall 12-month Earnings-at-Risk at December 31, 2020 to $14 million (December 31, 2019: $26 million). The decrease in net risk in 2020 is due to higher hedge ratios at year end.
Derivatives and hedge accounting
Syngenta seeks to apply, wherever possible, hedge accounting to present its financial statements in accordance with the economic purpose of the hedging activity. Hedges for which hedge accounting is not adopted either (a) do not meet the requirements for hedge accounting treatment under IFRS or (b) when combined with the accounting for the underlying hedged items, impact the financial statements in a manner aligned with the economic purpose of the hedging transaction without the need to adopt hedge accounting treatment, for example hedges of monetary items denominated in foreign currency.
Syngenta determines the economic relationship between the hedged items and the hedging instruments by reviewing the critical terms of the hedged items and the hedging instruments. As a result Syngenta concludes that the risk being hedged for the hedged items and risk inherent in the hedging instruments are sufficiently aligned, there is no inherent mismatch in the hedging relationship and a 100 percent hedge ratio applies both for the actual quantities hedged and for the hedge accounting, except as described below. The impact of the critical terms is also assessed using historical scenario analysis supported by statistical methods (regression analysis).
For the hedging of foreign currency risk of uncommitted forecasted trading transactions, because the exposures are largely generated by the routing of products from Syngenta’s central manufacturing sites to its foreign locations, the profit or loss impact from the corresponding transactions occurs when the related finished product inventories are sold to third parties. When entering into derivative hedging contracts, Syngenta selects maturity dates based on the forecast period for which Syngenta holds inventories of its products for each commercial market by hedged currency exposure. Limited variability in the holding period occurs mainly due to timing of the third-party sales transactions (“inventory holding period mismatch”).
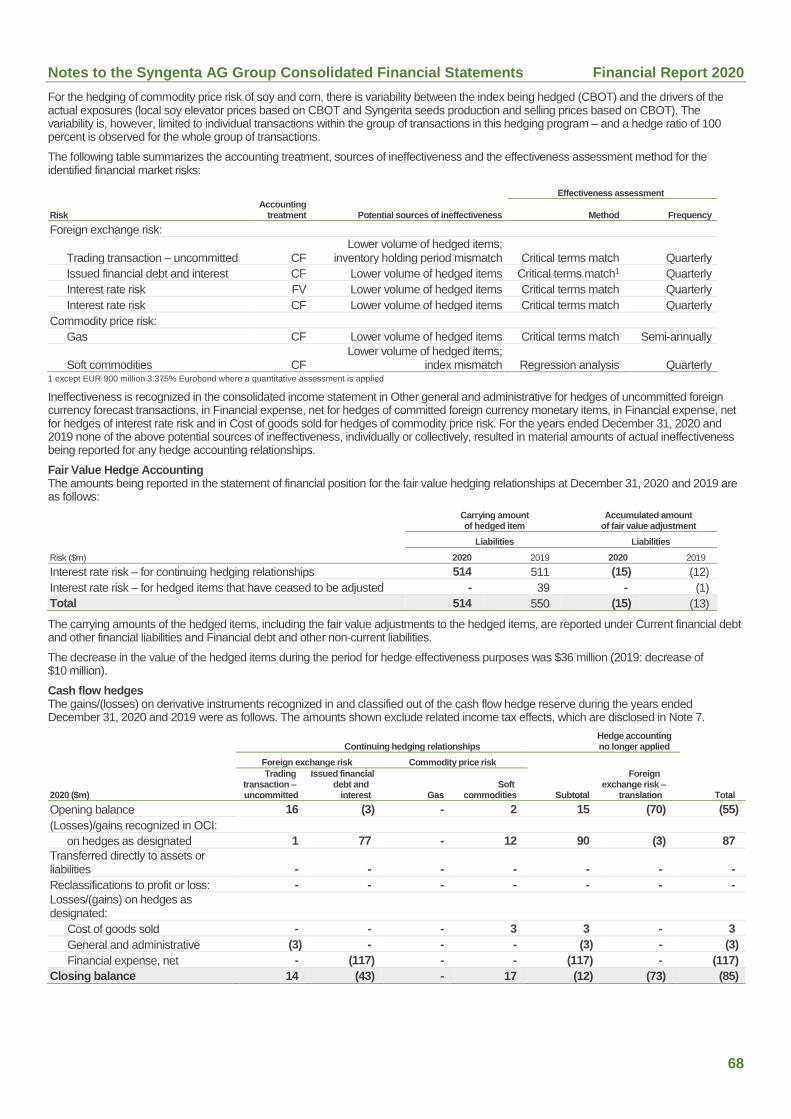
Notes to the Syngenta AG Group Consolidated Financial Statements Financial Report 2020
68
For the hedging of commodity price risk of soy and corn, there is variability between the index being hedged (CBOT) and the drivers of the actual exposures (local soy elevator prices based on CBOT and Syngenta seeds production and selling prices based on CBOT). The variability is, however, limited to individual transactions within the group of transactions in this hedging program – and a hedge ratio of 100 percent is observed for the whole group of transactions.
The following table summarizes the accounting treatment, sources of ineffectiveness and the effectiveness assessment method for the identified financial market risks:
Effectiveness assessment
Risk Accounting
treatment Potential sources of ineffectiveness Method Frequency
Foreign exchange risk:
Trading transaction – uncommitted CF Lower volume of hedged items;
inventory holding period mismatch Critical terms match Quarterly
Issued financial debt and interest CF Lower volume of hedged items Critical terms match1 Quarterly
Interest rate risk FV Lower volume of hedged items Critical terms match Quarterly
Interest rate risk CF Lower volume of hedged items Critical terms match Quarterly
Commodity price risk:
Gas CF Lower volume of hedged items Critical terms match Semi-annually
Soft commodities CF Lower volume of hedged items;
index mismatch Regression analysis Quarterly 1 except EUR 900 million 3.375% Eurobond where a quantitative assessment is applied
Ineffectiveness is recognized in the consolidated income statement in Other general and administrative for hedges of uncommitted foreign currency forecast transactions, in Financial expense, net for hedges of committed foreign currency monetary items, in Financial expense, net for hedges of interest rate risk and in Cost of goods sold for hedges of commodity price risk. For the years ended December 31, 2020 and 2019 none of the above potential sources of ineffectiveness, individually or collectively, resulted in material amounts of actual ineffectiveness being reported for any hedge accounting relationships.
Fair Value Hedge Accounting The amounts being reported in the statement of financial position for the fair value hedging relationships at December 31, 2020 and 2019 are as follows:
Carrying amount of hedged item
Accumulated amount of fair value adjustment
Liabilities Liabilities
Risk ($m) 2020 2019 2020 2019
Interest rate risk – for continuing hedging relationships 514 511 (15) (12)
Interest rate risk – for hedged items that have ceased to be adjusted - 39 - (1)
Total 514 550 (15) (13)
The carrying amounts of the hedged items, including the fair value adjustments to the hedged items, are reported under Current financial debt and other financial liabilities and Financial debt and other non-current liabilities.
The decrease in the value of the hedged items during the period for hedge effectiveness purposes was $36 million (2019: decrease of $10 million).
Cash flow hedges The gains/(losses) on derivative instruments recognized in and classified out of the cash flow hedge reserve during the years ended December 31, 2020 and 2019 were as follows. The amounts shown exclude related income tax effects, which are disclosed in Note 7.
Continuing hedging relationships Hedge accounting no longer applied
Foreign exchange risk Commodity price risk
2020 ($m)
Trading transaction – uncommitted
Issued financial debt and
interest Gas Soft
commodities Subtotal
Foreign exchange risk –
translation Total
Opening balance 16 (3) - 2 15 (70) (55)
(Losses)/gains recognized in OCI:
on hedges as designated 1 77 - 12 90 (3) 87
Transferred directly to assets or liabilities - - - - - - -
Reclassifications to profit or loss: - - - - - - -
Losses/(gains) on hedges as designated:
Cost of goods sold - - - 3 3 - 3
General and administrative (3) - - - (3) - (3)
Financial expense, net - (117) - - (117) - (117)
Closing balance 14 (43) - 17 (12) (73) (85)
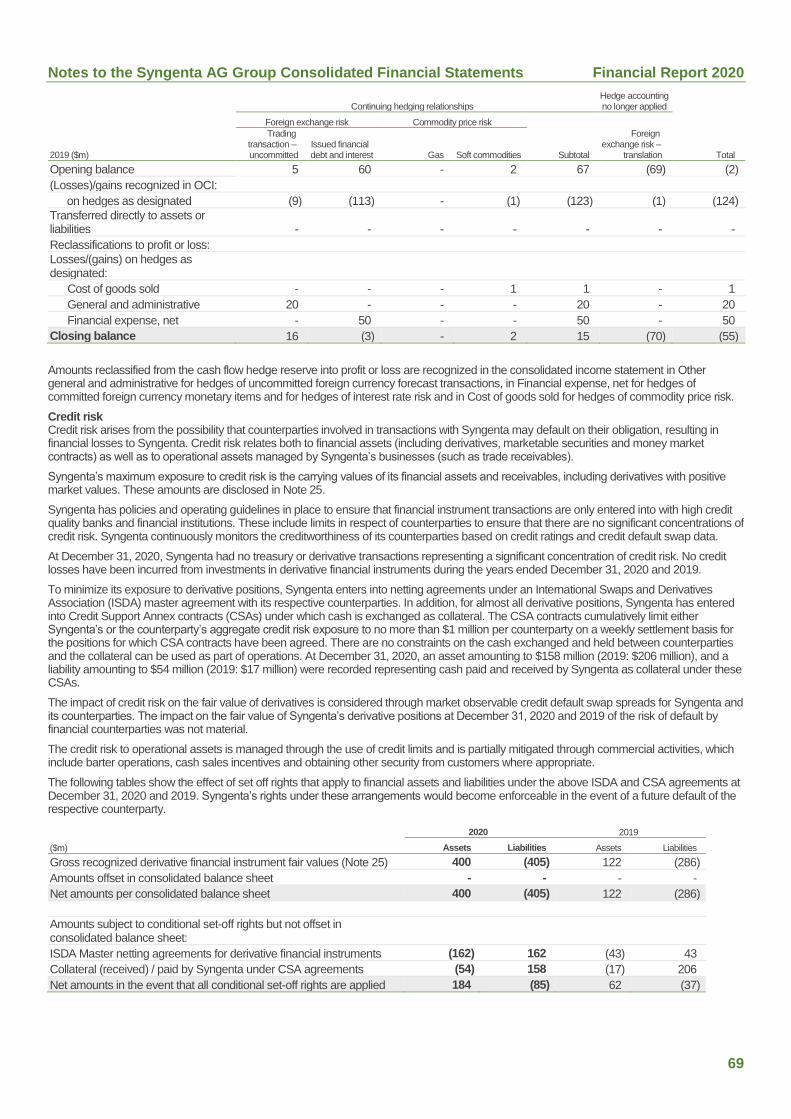
Notes to the Syngenta AG Group Consolidated Financial Statements Financial Report 2020
69
Continuing hedging relationships Hedge accounting no longer applied
Foreign exchange risk Commodity price risk
2019 ($m)
Trading transaction – uncommitted
Issued financial debt and interest Gas Soft commodities Subtotal
Foreign exchange risk –
translation Total
Opening balance 5 60 - 2 67 (69) (2)
(Losses)/gains recognized in OCI:
on hedges as designated (9) (113) - (1) (123) (1) (124)
Transferred directly to assets or liabilities - - - - - - -
Reclassifications to profit or loss:
Losses/(gains) on hedges as designated:
Cost of goods sold - - - 1 1 - 1
General and administrative 20 - - - 20 - 20
Financial expense, net - 50 - - 50 - 50
Closing balance 16 (3) - 2 15 (70) (55)
Amounts reclassified from the cash flow hedge reserve into profit or loss are recognized in the consolidated income statement in Other general and administrative for hedges of uncommitted foreign currency forecast transactions, in Financial expense, net for hedges of committed foreign currency monetary items and for hedges of interest rate risk and in Cost of goods sold for hedges of commodity price risk.
Credit risk Credit risk arises from the possibility that counterparties involved in transactions with Syngenta may default on their obligation, resulting in financial losses to Syngenta. Credit risk relates both to financial assets (including derivatives, marketable securities and money market contracts) as well as to operational assets managed by Syngenta’s businesses (such as trade receivables).
Syngenta’s maximum exposure to credit risk is the carrying values of its financial assets and receivables, including derivatives with positive market values. These amounts are disclosed in Note 25.
Syngenta has policies and operating guidelines in place to ensure that financial instrument transactions are only entered into with high credit quality banks and financial institutions. These include limits in respect of counterparties to ensure that there are no significant concentrations of credit risk. Syngenta continuously monitors the creditworthiness of its counterparties based on credit ratings and credit default swap data.
At December 31, 2020, Syngenta had no treasury or derivative transactions representing a significant concentration of credit risk. No credit losses have been incurred from investments in derivative financial instruments during the years ended December 31, 2020 and 2019.
To minimize its exposure to derivative positions, Syngenta enters into netting agreements under an International Swaps and Derivatives Association (ISDA) master agreement with its respective counterparties. In addition, for almost all derivative positions, Syngenta has entered into Credit Support Annex contracts (CSAs) under which cash is exchanged as collateral. The CSA contracts cumulatively limit either Syngenta’s or the counterparty’s aggregate credit risk exposure to no more than $1 million per counterparty on a weekly settlement basis for the positions for which CSA contracts have been agreed. There are no constraints on the cash exchanged and held between counterparties and the collateral can be used as part of operations. At December 31, 2020, an asset amounting to $158 million (2019: $206 million), and a liability amounting to $54 million (2019: $17 million) were recorded representing cash paid and received by Syngenta as collateral under these CSAs.
The impact of credit risk on the fair value of derivatives is considered through market observable credit default swap spreads for Syngenta and its counterparties. The impact on the fair value of Syngenta’s derivative positions at December 31, 2020 and 2019 of the risk of default by financial counterparties was not material.
The credit risk to operational assets is managed through the use of credit limits and is partially mitigated through commercial activities, which include barter operations, cash sales incentives and obtaining other security from customers where appropriate.
The following tables show the effect of set off rights that apply to financial assets and liabilities under the above ISDA and CSA agreements at December 31, 2020 and 2019. Syngenta’s rights under these arrangements would become enforceable in the event of a future default of the respective counterparty.
2020 2019
($m) Assets Liabilities Assets Liabilities
Gross recognized derivative financial instrument fair values (Note 25) 400 (405) 122 (286)
Amounts offset in consolidated balance sheet - - - -
Net amounts per consolidated balance sheet 400 (405) 122 (286)
Amounts subject to conditional set-off rights but not offset in consolidated balance sheet:
ISDA Master netting agreements for derivative financial instruments (162) 162 (43) 43
Collateral (received) / paid by Syngenta under CSA agreements (54) 158 (17) 206
Net amounts in the event that all conditional set-off rights are applied 184 (85) 62 (37)

Notes to the Syngenta AG Group Consolidated Financial Statements Financial Report 2020
70
Liquidity risk and refinancing risk Within Syngenta’s risk management framework, liquidity risk is defined as the risk of being unable to raise funds to meet payment obligations when they fall due.
Refinancing or funding risk is defined as the risk of being unable, on an ongoing basis, to borrow in the market to fund actual or proposed commitments. Syngenta mitigates its liquidity and refinancing risk by: maintaining a committed unsecured funding facility; ongoing discussions with its core banks to best monitor its funding capacity; simulations; and diversification of its debt portfolio.
Syngenta’s liquidity risk policy is to maintain at all times sufficient liquidity reserves both at the Syngenta AG Group and subsidiary level in order to meet payment obligations as they become due and also to maintain an adequate liquidity margin. The planning and supervision of liquidity is the responsibility of the subsidiaries and Group Treasury. Liquidity requirements are forecasted on a weekly basis. Syngenta operates regional or country cash pools to allow efficient use of its liquidity reserves.
Short-term liquidity Two of Syngenta’s largest markets are Europe, Africa and the Middle East and North America. Both sales and operating profit in these two regions are seasonal and are weighted towards the first half of the calendar year, reflecting the northern hemisphere planting and growing cycle. Latin America is another large market for Syngenta and sales and operating profit there are weighted towards the second half of the calendar year, reflecting the southern hemisphere planting and growing cycle. This seasonal operating activity results in seasonal working capital requirements.
Syngenta’s principal source of liquidity consists of cash generated from operations. Working capital fluctuations due to the seasonality of the business are supported by short-term funding available from a $2.5 billion Global Commercial Paper program and a $3 billion committed, revolving, multi-currency syndicated credit facility. In 2019, the credit facility was extended by one year and will now mature in 2024. The amount drawn under the syndicated credit facility at December 31, 2020 was $nil (2019: $nil). The average outstanding balance under the syndicated credit facility for the year 2020 was $126 million (2019: $32 million).The amount drawn under the Global Commercial Paper program at December 31, 2020 was $nil (2019: $878 million). The average outstanding balance under the Global Commercial Paper program for the year 2020 was $996 million (2019: $1,292 million).
The maturity analyses for Syngenta’s current financial liabilities other than short-term derivative liabilities are presented in Notes 16 and 17.
The maturities of short-term derivative liabilities are as follows:
($m) Total 0–90
days 90–180 days
180 days– 1 year
2020 337 166 78 93
2019 147 81 47 19
Long-term financing Long-term capital employed is currently financed through fifteen unsecured bonds and two unsecured notes issued under the Note Purchase Agreement in the US Private Placement market. Movements in long-term capital are described in Note 18, Financial debt and other non-current liabilities.
The following table shows Syngenta’s contractually agreed (undiscounted) interest and principal repayments on long-term financing-related non-derivative financial liabilities and the related derivatives held at December 31, 2020 and 2019. Non-derivative financial liabilities are recorded at amortized cost (less related issuance costs) unless subject to fair value hedge accounting, in which case the liability is adjusted for the change in fair value of the hedged risk to the extent the hedge relationship is effective. Derivative financial liabilities are recorded at fair value. The table therefore shows the total carrying amount of Syngenta’s financial debt adjusted for the effect, if any, of applying fair value hedge accounting.
Non-derivative financial liabilities
(Unsecured bonds and notes) Derivative financial liabilities
(Interest rate and cross-currency swaps)
2020 ($m) Fixed rate
interest Variable rate
interest Principal
repayment Total Fixed rate
interest Variable rate
interest Repayment1 Total
Less than 1 year 276 15 1,364 1,655 (18) (12) (52) (82)
1-3 years 454 30 2,028 2,512 (22) (23) - (45)
3-5 years 348 7 2,089 2,444 (14) (6) 1 (19)
5-10 years 398 - 3,048 3,446 (15) - - (15)
More than 10 years 626 - 761 1,387 - - - -
Total payments 2,102 52 9,290 11,444 (69) (41) (51) (161)
Net carrying amount 9,305 123
Non-derivative financial liabilities (Unsecured bonds and notes)
Derivative financial liabilities (Interest rate and cross-currency swaps)
2019 ($m) Fixed rate
interest Variable rate
interest Principal
repayment Total Fixed rate
interest Variable rate
interest Repayment1 Total
Less than 1 year 262 17 788 1,067 (20) - - (20)
1-3 years 429 33 1,811 2,273 (33) - (90) (123)
3-5 years 314 24 1,759 2,097 (24) - (24) (48)
5-10 years 440 - 2,521 2,961 (21) - (15) (36)
More than 10 years 666 - 761 1,427 - - - -
Total payments 2,111 74 7,640 9,825 (98) - (129) (227)
Net carrying amount 7,129 139 1 The repayments above (and the net carrying amount of the derivative financial liabilities) do not include the amounts paid as collateral
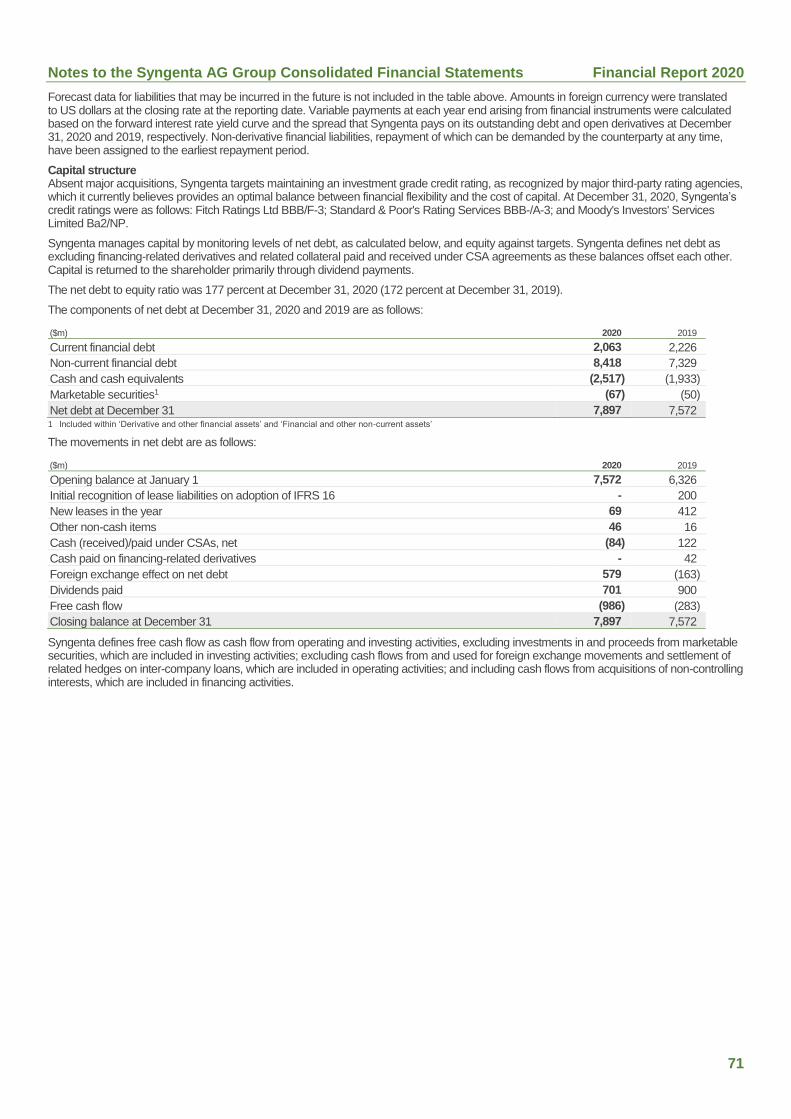
Notes to the Syngenta AG Group Consolidated Financial Statements Financial Report 2020
71
Forecast data for liabilities that may be incurred in the future is not included in the table above. Amounts in foreign currency were translated to US dollars at the closing rate at the reporting date. Variable payments at each year end arising from financial instruments were calculated based on the forward interest rate yield curve and the spread that Syngenta pays on its outstanding debt and open derivatives at December 31, 2020 and 2019, respectively. Non-derivative financial liabilities, repayment of which can be demanded by the counterparty at any time, have been assigned to the earliest repayment period.
Capital structure Absent major acquisitions, Syngenta targets maintaining an investment grade credit rating, as recognized by major third-party rating agencies, which it currently believes provides an optimal balance between financial flexibility and the cost of capital. At December 31, 2020, Syngenta’s credit ratings were as follows: Fitch Ratings Ltd BBB/F-3; Standard & Poor's Rating Services BBB-/A-3; and Moody's Investors' Services Limited Ba2/NP.
Syngenta manages capital by monitoring levels of net debt, as calculated below, and equity against targets. Syngenta defines net debt as excluding financing-related derivatives and related collateral paid and received under CSA agreements as these balances offset each other. Capital is returned to the shareholder primarily through dividend payments.
The net debt to equity ratio was 177 percent at December 31, 2020 (172 percent at December 31, 2019).
The components of net debt at December 31, 2020 and 2019 are as follows:
($m) 2020 2019
Current financial debt 2,063 2,226
Non-current financial debt 8,418 7,329
Cash and cash equivalents (2,517) (1,933)
Marketable securities1 (67) (50)
Net debt at December 31 7,897 7,572 1 Included within ‘Derivative and other financial assets’ and ‘Financial and other non-current assets’
The movements in net debt are as follows:
($m) 2020 2019
Opening balance at January 1 7,572 6,326
Initial recognition of lease liabilities on adoption of IFRS 16 - 200
New leases in the year 69 412
Other non-cash items 46 16
Cash (received)/paid under CSAs, net (84) 122
Cash paid on financing-related derivatives - 42
Foreign exchange effect on net debt 579 (163)
Dividends paid 701 900
Free cash flow (986) (283)
Closing balance at December 31 7,897 7,572
Syngenta defines free cash flow as cash flow from operating and investing activities, excluding investments in and proceeds from marketable securities, which are included in investing activities; excluding cash flows from and used for foreign exchange movements and settlement of related hedges on inter-company loans, which are included in operating activities; and including cash flows from acquisitions of non-controlling interests, which are included in financing activities.
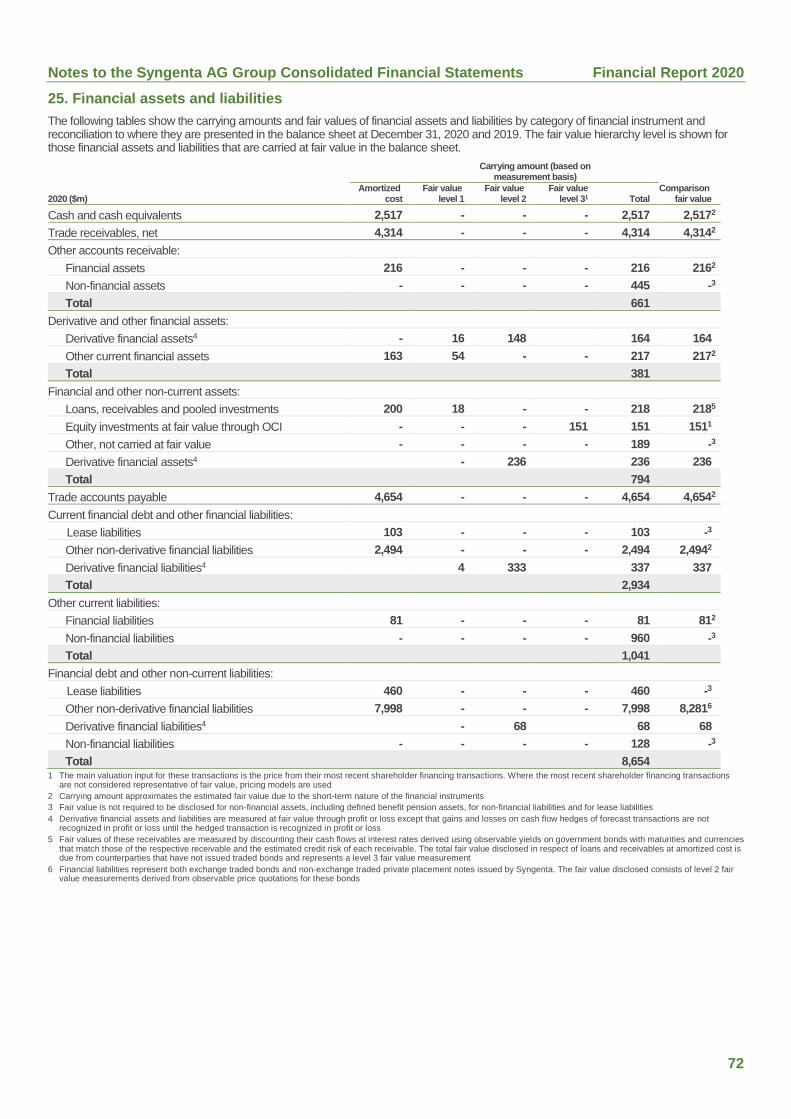
Notes to the Syngenta AG Group Consolidated Financial Statements Financial Report 2020
72
25. Financial assets and liabilities
The following tables show the carrying amounts and fair values of financial assets and liabilities by category of financial instrument and reconciliation to where they are presented in the balance sheet at December 31, 2020 and 2019. The fair value hierarchy level is shown for those financial assets and liabilities that are carried at fair value in the balance sheet.
Carrying amount (based on
measurement basis)
2020 ($m) Amortized
cost Fair value
level 1 Fair value
level 2 Fair value
level 31 Total Comparison
fair value
Cash and cash equivalents 2,517 - - - 2,517 2,5172
Trade receivables, net 4,314 - - - 4,314 4,3142
Other accounts receivable:
Financial assets 216 - - - 216 2162
Non-financial assets - - - - 445 -3
Total 661
Derivative and other financial assets:
Derivative financial assets4 - 16 148 164 164
Other current financial assets 163 54 - - 217 2172
Total 381
Financial and other non-current assets:
Loans, receivables and pooled investments 200 18 - - 218 2185
Equity investments at fair value through OCI - - - 151 151 1511
Other, not carried at fair value - - - - 189 -3
Derivative financial assets4 - 236 236 236
Total 794
Trade accounts payable 4,654 - - - 4,654 4,6542
Current financial debt and other financial liabilities:
Lease liabilities 103 - - - 103 -3
Other non-derivative financial liabilities 2,494 - - - 2,494 2,4942
Derivative financial liabilities4 4 333 337 337
Total 2,934
Other current liabilities:
Financial liabilities 81 - - - 81 812
Non-financial liabilities - - - - 960 -3
Total 1,041
Financial debt and other non-current liabilities:
Lease liabilities 460 - - - 460 -3
Other non-derivative financial liabilities 7,998 - - - 7,998 8,2816
Derivative financial liabilities4 - 68 68 68
Non-financial liabilities - - - - 128 -3
Total 8,654 1 The main valuation input for these transactions is the price from their most recent shareholder financing transactions. Where the most recent shareholder financing transactions
are not considered representative of fair value, pricing models are used
2 Carrying amount approximates the estimated fair value due to the short-term nature of the financial instruments
3 Fair value is not required to be disclosed for non-financial assets, including defined benefit pension assets, for non-financial liabilities and for lease liabilities
4 Derivative financial assets and liabilities are measured at fair value through profit or loss except that gains and losses on cash flow hedges of forecast transactions are not recognized in profit or loss until the hedged transaction is recognized in profit or loss
5 Fair values of these receivables are measured by discounting their cash flows at interest rates derived using observable yields on government bonds with maturities and currencies that match those of the respective receivable and the estimated credit risk of each receivable. The total fair value disclosed in respect of loans and receivables at amortized cost is due from counterparties that have not issued traded bonds and represents a level 3 fair value measurement
6 Financial liabilities represent both exchange traded bonds and non-exchange traded private placement notes issued by Syngenta. The fair value disclosed consists of level 2 fair value measurements derived from observable price quotations for these bonds
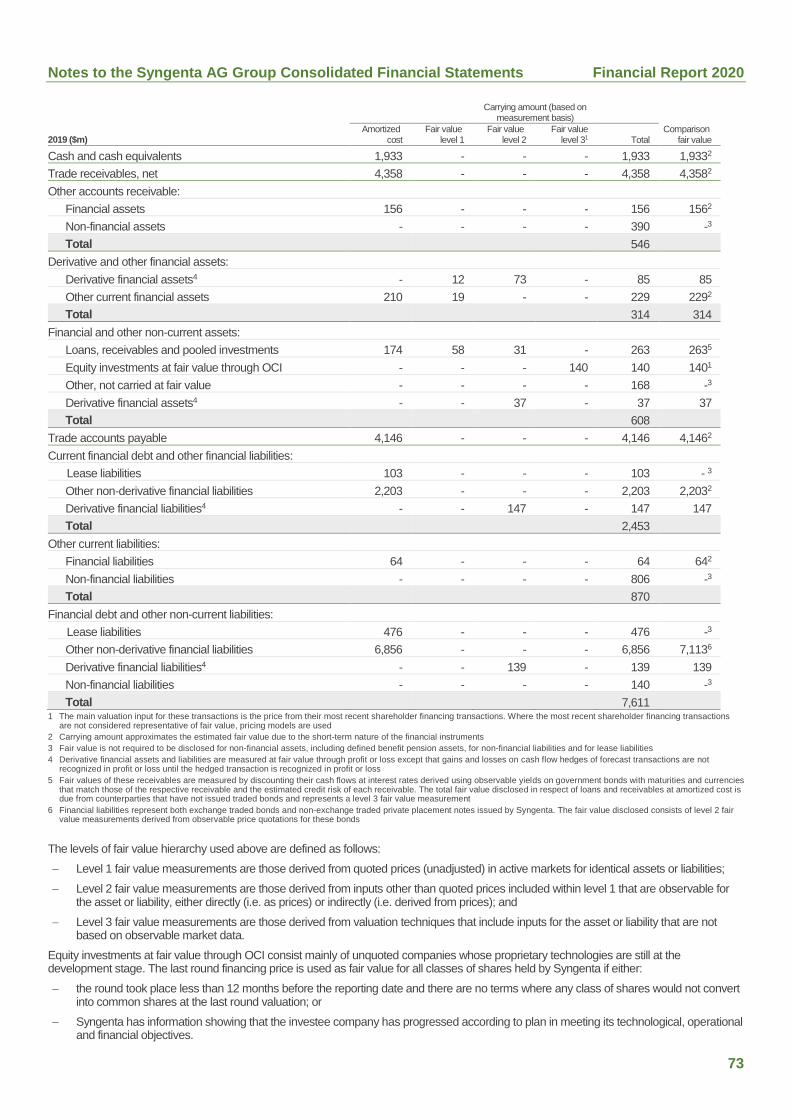
Notes to the Syngenta AG Group Consolidated Financial Statements Financial Report 2020
73
Carrying amount (based on
measurement basis)
2019 ($m) Amortized
cost Fair value
level 1 Fair value
level 2 Fair value
level 31 Total Comparison
fair value
Cash and cash equivalents 1,933 - - - 1,933 1,9332
Trade receivables, net 4,358 - - - 4,358 4,3582
Other accounts receivable:
Financial assets 156 - - - 156 1562
Non-financial assets - - - - 390 -3
Total 546
Derivative and other financial assets:
Derivative financial assets4 - 12 73 - 85 85
Other current financial assets 210 19 - - 229 2292
Total 314 314
Financial and other non-current assets:
Loans, receivables and pooled investments 174 58 31 - 263 2635
Equity investments at fair value through OCI - - - 140 140 1401
Other, not carried at fair value - - - - 168 -3
Derivative financial assets4 - - 37 - 37 37
Total 608
Trade accounts payable 4,146 - - - 4,146 4,1462
Current financial debt and other financial liabilities:
Lease liabilities 103 - - - 103 - 3
Other non-derivative financial liabilities 2,203 - - - 2,203 2,2032
Derivative financial liabilities4 - - 147 - 147 147
Total 2,453
Other current liabilities:
Financial liabilities 64 - - - 64 642
Non-financial liabilities - - - - 806 -3
Total 870
Financial debt and other non-current liabilities:
Lease liabilities 476 - - - 476 -3
Other non-derivative financial liabilities 6,856 - - - 6,856 7,1136
Derivative financial liabilities4 - - 139 - 139 139
Non-financial liabilities - - - - 140 -3
Total 7,611 1 The main valuation input for these transactions is the price from their most recent shareholder financing transactions. Where the most recent shareholder financing transactions
are not considered representative of fair value, pricing models are used
2 Carrying amount approximates the estimated fair value due to the short-term nature of the financial instruments
3 Fair value is not required to be disclosed for non-financial assets, including defined benefit pension assets, for non-financial liabilities and for lease liabilities
4 Derivative financial assets and liabilities are measured at fair value through profit or loss except that gains and losses on cash flow hedges of forecast transactions are not recognized in profit or loss until the hedged transaction is recognized in profit or loss
5 Fair values of these receivables are measured by discounting their cash flows at interest rates derived using observable yields on government bonds with maturities and currencies that match those of the respective receivable and the estimated credit risk of each receivable. The total fair value disclosed in respect of loans and receivables at amortized cost is due from counterparties that have not issued traded bonds and represents a level 3 fair value measurement
6 Financial liabilities represent both exchange traded bonds and non-exchange traded private placement notes issued by Syngenta. The fair value disclosed consists of level 2 fair value measurements derived from observable price quotations for these bonds
The levels of fair value hierarchy used above are defined as follows:
Level 1 fair value measurements are those derived from quoted prices (unadjusted) in active markets for identical assets or liabilities;
Level 2 fair value measurements are those derived from inputs other than quoted prices included within level 1 that are observable for the asset or liability, either directly (i.e. as prices) or indirectly (i.e. derived from prices); and
Level 3 fair value measurements are those derived from valuation techniques that include inputs for the asset or liability that are not based on observable market data.
Equity investments at fair value through OCI consist mainly of unquoted companies whose proprietary technologies are still at the development stage. The last round financing price is used as fair value for all classes of shares held by Syngenta if either:
the round took place less than 12 months before the reporting date and there are no terms where any class of shares would not convert into common shares at the last round valuation; or
Syngenta has information showing that the investee company has progressed according to plan in meeting its technological, operational and financial objectives.
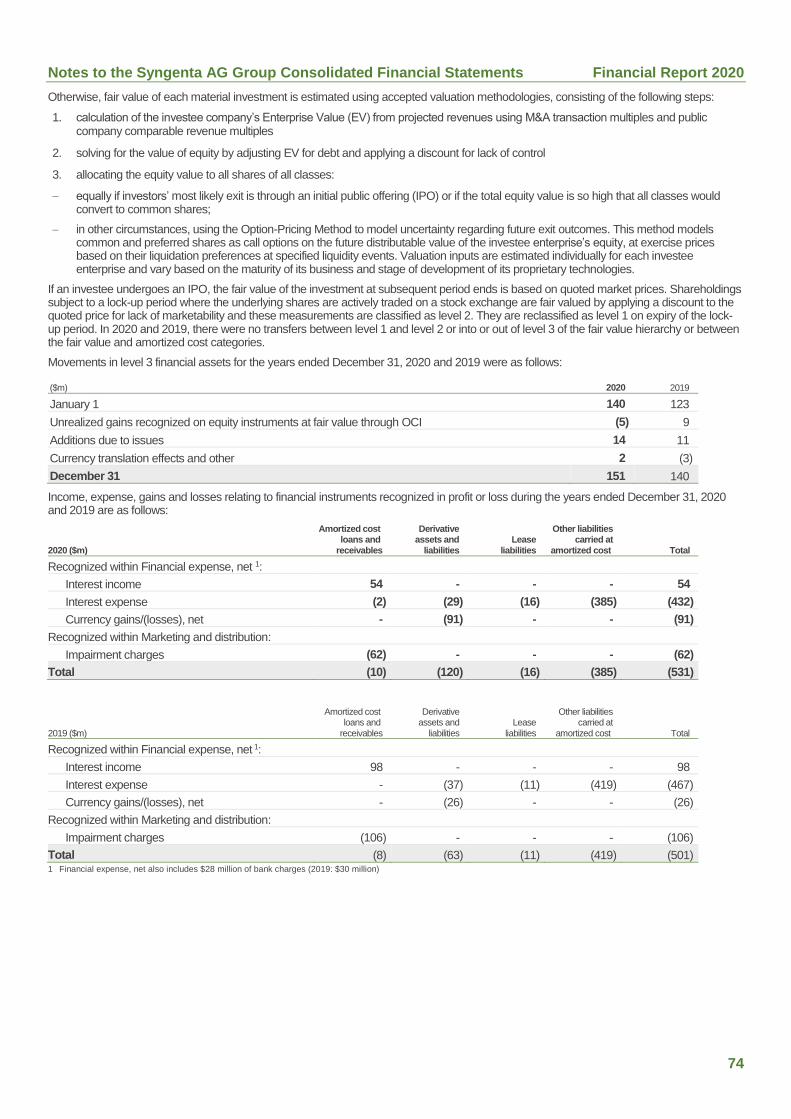
Notes to the Syngenta AG Group Consolidated Financial Statements Financial Report 2020
74
Otherwise, fair value of each material investment is estimated using accepted valuation methodologies, consisting of the following steps:
1. calculation of the investee company’s Enterprise Value (EV) from projected revenues using M&A transaction multiples and public company comparable revenue multiples
2. solving for the value of equity by adjusting EV for debt and applying a discount for lack of control
3. allocating the equity value to all shares of all classes:
equally if investors’ most likely exit is through an initial public offering (IPO) or if the total equity value is so high that all classes would convert to common shares;
in other circumstances, using the Option-Pricing Method to model uncertainty regarding future exit outcomes. This method models common and preferred shares as call options on the future distributable value of the investee enterprise’s equity, at exercise prices based on their liquidation preferences at specified liquidity events. Valuation inputs are estimated individually for each investee enterprise and vary based on the maturity of its business and stage of development of its proprietary technologies.
If an investee undergoes an IPO, the fair value of the investment at subsequent period ends is based on quoted market prices. Shareholdings subject to a lock-up period where the underlying shares are actively traded on a stock exchange are fair valued by applying a discount to the quoted price for lack of marketability and these measurements are classified as level 2. They are reclassified as level 1 on expiry of the lock-up period. In 2020 and 2019, there were no transfers between level 1 and level 2 or into or out of level 3 of the fair value hierarchy or between the fair value and amortized cost categories.
Movements in level 3 financial assets for the years ended December 31, 2020 and 2019 were as follows:
($m) 2020 2019
January 1 140 123
Unrealized gains recognized on equity instruments at fair value through OCI (5) 9
Additions due to issues 14 11
Currency translation effects and other 2 (3)
December 31 151 140
Income, expense, gains and losses relating to financial instruments recognized in profit or loss during the years ended December 31, 2020 and 2019 are as follows:
2020 ($m)
Amortized cost loans and
receivables
Derivative assets and
liabilities Lease
liabilities
Other liabilities carried at
amortized cost Total
Recognized within Financial expense, net 1:
Interest income 54 - - - 54
Interest expense (2) (29) (16) (385) (432)
Currency gains/(losses), net - (91) - - (91)
Recognized within Marketing and distribution:
Impairment charges (62) - - - (62)
Total (10) (120) (16) (385) (531)
2019 ($m)
Amortized cost loans and
receivables
Derivative assets and
liabilities Lease
liabilities
Other liabilities carried at
amortized cost Total
Recognized within Financial expense, net 1:
Interest income 98 - - - 98
Interest expense - (37) (11) (419) (467)
Currency gains/(losses), net - (26) - - (26)
Recognized within Marketing and distribution:
Impairment charges (106) - - - (106)
Total (8) (63) (11) (419) (501) 1 Financial expense, net also includes $28 million of bank charges (2019: $30 million)
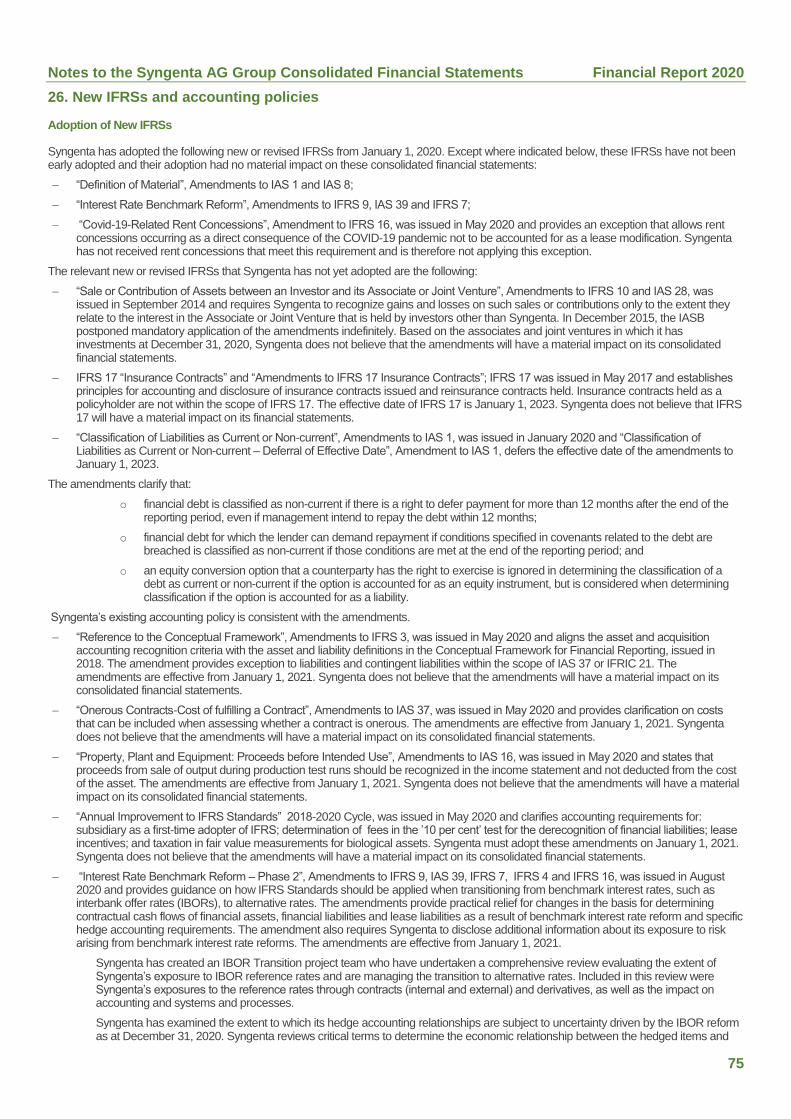
Notes to the Syngenta AG Group Consolidated Financial Statements Financial Report 2020
75
26. New IFRSs and accounting policies
Adoption of New IFRSs
Syngenta has adopted the following new or revised IFRSs from January 1, 2020. Except where indicated below, these IFRSs have not been early adopted and their adoption had no material impact on these consolidated financial statements:
“Definition of Material”, Amendments to IAS 1 and IAS 8;
“Interest Rate Benchmark Reform”, Amendments to IFRS 9, IAS 39 and IFRS 7;
“Covid-19-Related Rent Concessions”, Amendment to IFRS 16, was issued in May 2020 and provides an exception that allows rent concessions occurring as a direct consequence of the COVID-19 pandemic not to be accounted for as a lease modification. Syngenta has not received rent concessions that meet this requirement and is therefore not applying this exception.
The relevant new or revised IFRSs that Syngenta has not yet adopted are the following:
“Sale or Contribution of Assets between an Investor and its Associate or Joint Venture”, Amendments to IFRS 10 and IAS 28, was issued in September 2014 and requires Syngenta to recognize gains and losses on such sales or contributions only to the extent they relate to the interest in the Associate or Joint Venture that is held by investors other than Syngenta. In December 2015, the IASB postponed mandatory application of the amendments indefinitely. Based on the associates and joint ventures in which it has investments at December 31, 2020, Syngenta does not believe that the amendments will have a material impact on its consolidated financial statements.
IFRS 17 “Insurance Contracts” and “Amendments to IFRS 17 Insurance Contracts”; IFRS 17 was issued in May 2017 and establishes principles for accounting and disclosure of insurance contracts issued and reinsurance contracts held. Insurance contracts held as a policyholder are not within the scope of IFRS 17. The effective date of IFRS 17 is January 1, 2023. Syngenta does not believe that IFRS 17 will have a material impact on its financial statements.
“Classification of Liabilities as Current or Non-current”, Amendments to IAS 1, was issued in January 2020 and “Classification of Liabilities as Current or Non-current – Deferral of Effective Date”, Amendment to IAS 1, defers the effective date of the amendments to January 1, 2023.
The amendments clarify that:
o financial debt is classified as non-current if there is a right to defer payment for more than 12 months after the end of the reporting period, even if management intend to repay the debt within 12 months;
o financial debt for which the lender can demand repayment if conditions specified in covenants related to the debt are breached is classified as non-current if those conditions are met at the end of the reporting period; and
o an equity conversion option that a counterparty has the right to exercise is ignored in determining the classification of a debt as current or non-current if the option is accounted for as an equity instrument, but is considered when determining classification if the option is accounted for as a liability.
Syngenta’s existing accounting policy is consistent with the amendments.
“Reference to the Conceptual Framework”, Amendments to IFRS 3, was issued in May 2020 and aligns the asset and acquisition accounting recognition criteria with the asset and liability definitions in the Conceptual Framework for Financial Reporting, issued in 2018. The amendment provides exception to liabilities and contingent liabilities within the scope of IAS 37 or IFRIC 21. The amendments are effective from January 1, 2021. Syngenta does not believe that the amendments will have a material impact on its consolidated financial statements.
“Onerous Contracts-Cost of fulfilling a Contract”, Amendments to IAS 37, was issued in May 2020 and provides clarification on costs that can be included when assessing whether a contract is onerous. The amendments are effective from January 1, 2021. Syngenta does not believe that the amendments will have a material impact on its consolidated financial statements.
“Property, Plant and Equipment: Proceeds before Intended Use”, Amendments to IAS 16, was issued in May 2020 and states that proceeds from sale of output during production test runs should be recognized in the income statement and not deducted from the cost of the asset. The amendments are effective from January 1, 2021. Syngenta does not believe that the amendments will have a material impact on its consolidated financial statements.
“Annual Improvement to IFRS Standards” 2018-2020 Cycle, was issued in May 2020 and clarifies accounting requirements for: subsidiary as a first-time adopter of IFRS; determination of fees in the ’10 per cent’ test for the derecognition of financial liabilities; lease incentives; and taxation in fair value measurements for biological assets. Syngenta must adopt these amendments on January 1, 2021. Syngenta does not believe that the amendments will have a material impact on its consolidated financial statements.
“Interest Rate Benchmark Reform – Phase 2”, Amendments to IFRS 9, IAS 39, IFRS 7, IFRS 4 and IFRS 16, was issued in August 2020 and provides guidance on how IFRS Standards should be applied when transitioning from benchmark interest rates, such as interbank offer rates (IBORs), to alternative rates. The amendments provide practical relief for changes in the basis for determining contractual cash flows of financial assets, financial liabilities and lease liabilities as a result of benchmark interest rate reform and specific hedge accounting requirements. The amendment also requires Syngenta to disclose additional information about its exposure to risk arising from benchmark interest rate reforms. The amendments are effective from January 1, 2021.
Syngenta has created an IBOR Transition project team who have undertaken a comprehensive review evaluating the extent of Syngenta’s exposure to IBOR reference rates and are managing the transition to alternative rates. Included in this review were Syngenta’s exposures to the reference rates through contracts (internal and external) and derivatives, as well as the impact on accounting and systems and processes.
Syngenta has examined the extent to which its hedge accounting relationships are subject to uncertainty driven by the IBOR reform as at December 31, 2020. Syngenta reviews critical terms to determine the economic relationship between the hedged items and
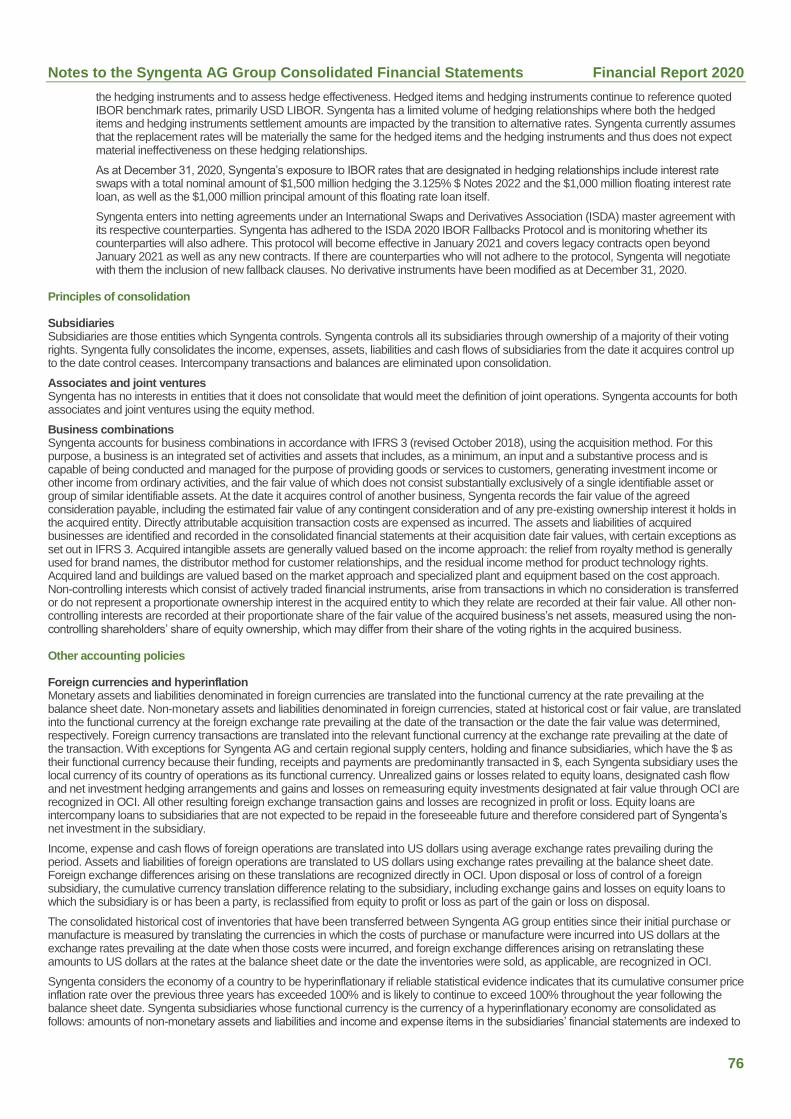
Notes to the Syngenta AG Group Consolidated Financial Statements Financial Report 2020
76
the hedging instruments and to assess hedge effectiveness. Hedged items and hedging instruments continue to reference quoted IBOR benchmark rates, primarily USD LIBOR. Syngenta has a limited volume of hedging relationships where both the hedged items and hedging instruments settlement amounts are impacted by the transition to alternative rates. Syngenta currently assumes that the replacement rates will be materially the same for the hedged items and the hedging instruments and thus does not expect material ineffectiveness on these hedging relationships.
As at December 31, 2020, Syngenta’s exposure to IBOR rates that are designated in hedging relationships include interest rate swaps with a total nominal amount of $1,500 million hedging the 3.125% $ Notes 2022 and the $1,000 million floating interest rate loan, as well as the $1,000 million principal amount of this floating rate loan itself.
Syngenta enters into netting agreements under an International Swaps and Derivatives Association (ISDA) master agreement with its respective counterparties. Syngenta has adhered to the ISDA 2020 IBOR Fallbacks Protocol and is monitoring whether its counterparties will also adhere. This protocol will become effective in January 2021 and covers legacy contracts open beyond January 2021 as well as any new contracts. If there are counterparties who will not adhere to the protocol, Syngenta will negotiate with them the inclusion of new fallback clauses. No derivative instruments have been modified as at December 31, 2020.
Principles of consolidation
Subsidiaries Subsidiaries are those entities which Syngenta controls. Syngenta controls all its subsidiaries through ownership of a majority of their voting rights. Syngenta fully consolidates the income, expenses, assets, liabilities and cash flows of subsidiaries from the date it acquires control up to the date control ceases. Intercompany transactions and balances are eliminated upon consolidation.
Associates and joint ventures Syngenta has no interests in entities that it does not consolidate that would meet the definition of joint operations. Syngenta accounts for both associates and joint ventures using the equity method.
Business combinations Syngenta accounts for business combinations in accordance with IFRS 3 (revised October 2018), using the acquisition method. For this purpose, a business is an integrated set of activities and assets that includes, as a minimum, an input and a substantive process and is capable of being conducted and managed for the purpose of providing goods or services to customers, generating investment income or other income from ordinary activities, and the fair value of which does not consist substantially exclusively of a single identifiable asset or group of similar identifiable assets. At the date it acquires control of another business, Syngenta records the fair value of the agreed consideration payable, including the estimated fair value of any contingent consideration and of any pre-existing ownership interest it holds in the acquired entity. Directly attributable acquisition transaction costs are expensed as incurred. The assets and liabilities of acquired businesses are identified and recorded in the consolidated financial statements at their acquisition date fair values, with certain exceptions as set out in IFRS 3. Acquired intangible assets are generally valued based on the income approach: the relief from royalty method is generally used for brand names, the distributor method for customer relationships, and the residual income method for product technology rights. Acquired land and buildings are valued based on the market approach and specialized plant and equipment based on the cost approach. Non-controlling interests which consist of actively traded financial instruments, arise from transactions in which no consideration is transferred or do not represent a proportionate ownership interest in the acquired entity to which they relate are recorded at their fair value. All other non-controlling interests are recorded at their proportionate share of the fair value of the acquired business’s net assets, measured using the non-controlling shareholders’ share of equity ownership, which may differ from their share of the voting rights in the acquired business.
Other accounting policies
Foreign currencies and hyperinflation Monetary assets and liabilities denominated in foreign currencies are translated into the functional currency at the rate prevailing at the balance sheet date. Non-monetary assets and liabilities denominated in foreign currencies, stated at historical cost or fair value, are translated into the functional currency at the foreign exchange rate prevailing at the date of the transaction or the date the fair value was determined, respectively. Foreign currency transactions are translated into the relevant functional currency at the exchange rate prevailing at the date of the transaction. With exceptions for Syngenta AG and certain regional supply centers, holding and finance subsidiaries, which have the $ as their functional currency because their funding, receipts and payments are predominantly transacted in $, each Syngenta subsidiary uses the local currency of its country of operations as its functional currency. Unrealized gains or losses related to equity loans, designated cash flow and net investment hedging arrangements and gains and losses on remeasuring equity investments designated at fair value through OCI are recognized in OCI. All other resulting foreign exchange transaction gains and losses are recognized in profit or loss. Equity loans are intercompany loans to subsidiaries that are not expected to be repaid in the foreseeable future and therefore considered part of Syngenta’s net investment in the subsidiary.
Income, expense and cash flows of foreign operations are translated into US dollars using average exchange rates prevailing during the period. Assets and liabilities of foreign operations are translated to US dollars using exchange rates prevailing at the balance sheet date. Foreign exchange differences arising on these translations are recognized directly in OCI. Upon disposal or loss of control of a foreign subsidiary, the cumulative currency translation difference relating to the subsidiary, including exchange gains and losses on equity loans to which the subsidiary is or has been a party, is reclassified from equity to profit or loss as part of the gain or loss on disposal.
The consolidated historical cost of inventories that have been transferred between Syngenta AG group entities since their initial purchase or manufacture is measured by translating the currencies in which the costs of purchase or manufacture were incurred into US dollars at the exchange rates prevailing at the date when those costs were incurred, and foreign exchange differences arising on retranslating these amounts to US dollars at the rates at the balance sheet date or the date the inventories were sold, as applicable, are recognized in OCI.
Syngenta considers the economy of a country to be hyperinflationary if reliable statistical evidence indicates that its cumulative consumer price inflation rate over the previous three years has exceeded 100% and is likely to continue to exceed 100% throughout the year following the balance sheet date. Syngenta subsidiaries whose functional currency is the currency of a hyperinflationary economy are consolidated as follows: amounts of non-monetary assets and liabilities and income and expense items in the subsidiaries’ financial statements are indexed to
Notes to the Syngenta AG Group Consolidated Financial Statements Financial Report 2020
77
current price levels at the balance sheet date using a recognized general consumer price index. The resulting financial statements, including income statement and cash flows, are translated into US dollars at the rate prevailing at the balance sheet date.
Revenue Syngenta’s main source of revenue is product sales. Control of products passes to Syngenta’s customers, and revenue for product sales is recognized, at a point in time which is usually upon delivery, subject to reasonable assurance of collectability. Delivery is defined based on the terms of the sale contract. Syngenta also derives revenue from licensing the right to use its intellectual property (IP), principally its seeds germplasm and traits. Each licensing contract Syngenta enters into has unique terms and certain licensing contracts may involve significant upfront or milestone payments in addition to sales-based royalties.
Revenue is measured at the amount of consideration to which Syngenta expects to be entitled in exchange for the products or license rights it transfers to customers. If the consideration is receivable more than 12 months after the transaction date and the effect of discounting is material, the revenue amount recognized is discounted to its present value at the transaction date, using a discount rate which reflects customer risk, and the unwinding of this discount is recognized as financial income over the period until the date the consideration is due. Revenue in contracts with non-cash consideration is measured at the fair value of the consideration at contract inception.
The main forms of variable revenue for Syngenta are as follows and the judgments associated with estimating their amount are discussed in Note 2:
cash incentive programs that provide rebates and discounts dependent on achievement of targets for purchase of Syngenta products, and cash discounts for punctual or early payment of invoices. Syngenta recognizes sales minus an allowance for rebates, and a refund liability presented within Trade accounts payable in the consolidated balance sheet. The allowance and liability are measured at the amount expected to be refunded or credited to customers, estimated based on the programs’ terms, market conditions and historical experience.
sales returns, which arise both in markets where the customer has a legal or contractual right of return and in markets where customers do not have such rights but Syngenta’s commercial practice is to accept returns. In either case, Syngenta recognizes sales minus an allowance for expected returns, an estimated refund liability, and an asset for the right to recover its products corresponding to the expected returns. The refund liability and the asset are presented within Trade accounts payable and Inventories respectively in the consolidated balance sheet. The allowance and liability are measured at the amount expected to be refunded or credited to customers and the asset is measured at the standard purchase or production cost of the underlying Syngenta products, minus allowances for transportation and obsolescence where relevant.
in certain markets, sales terms allow customers to exchange purchased products at a later date for other Syngenta products of their choice, to the same value. For these sales, Syngenta recognizes revenue upon delivery of the original products, minus a provision for products expected to be exchanged. This provision is released, and the corresponding revenue is recorded, when the substitute products are delivered or the customer’s right to exchange the products expires, whichever is earlier.
In licenses which grant the right to use Syngenta’s IP as it exists when the license is granted, and in which Syngenta receives revenue for non-refundable lump sums and minimum guaranteed income amounts which can be reliably estimated and for which there are no related future Syngenta performance obligations or contingencies other than the passage of time, Syngenta recognizes that revenue on signature of or on the effective date of the license, whichever is later. Revenue for lump sum milestone payments which are contingent on product regulatory approvals is recognized only when the competent regulatory authorities have granted the relevant approvals. Sales-based royalty income is recognized in the period that the licensees make sales in respect of which the royalties are payable.
In certain markets, sales terms allow customers the option of a one-time, non-repeatable extension of credit, for a defined additional period, in respect of a defined proportion of purchases made during a defined period, if the customers still have the inventories on hand upon expiration of the initial agreed credit period. Customers have no right to return these inventories, and must pay unconditionally when the additional credit period expires. In accordance with IFRS 15, revenue for these sales is recognized upon product delivery.
Where third parties hold Syngenta inventories on a consignment basis, revenue is recognized in the period that inventories are withdrawn from consignment and delivered to customers.
For product sales which are qualifying purchases in customer loyalty incentive programs, Syngenta allocates revenue between its qualifying product sales and the incentive awards of additional free or discounted products or services (“incentives”) based on the value of incentives to which customers are expected to be entitled, the relative stand-alone selling prices of the respective product sales and incentives and, where awards are subject to expiry, the extent to which customers are expected to redeem their rights based on historical experience of similar programs. Syngenta recognizes estimated liabilities for the incentives in the period in which it recognizes the associated product sales, and presents these liabilities as Contract liabilities in the consolidated balance sheet. In programs where the incentive is either a product normally sold by Syngenta, a third party product which Syngenta is primarily responsible for supplying to customers or for which Syngenta bears inventory risk, or a service provided to customers by a third party acting under Syngenta’s direction, Syngenta obtains control of the incentives before transferring them to customers, and so supplies the incentives as a principal. For these programs, Syngenta recognizes the revenue allocated to the incentives when customers receive them or redeem their right to an award. Revenue related to these programs is presented as part of Sales, and associated costs are presented within Cost of goods sold or Marketing and distribution expense as appropriate. In other programs, Syngenta acts as agent for a third party who supplies the incentives, and Syngenta recognizes any net income from supply of the incentive when the third party becomes obliged to supply the awards.
Syngenta periodically enters into prepayment contracts with customers whereby it receives advance payments for products to be delivered in a future period. These advance payments are recorded as liabilities and presented as part of Contract liabilities in the consolidated balance sheet. Advance payment liabilities are released and revenues associated with such advance payment transactions are recognized when control of the prepaid products passes to the customer.
Syngenta has not presented a separate line in the consolidated balance sheet for Contract assets because all material relevant assets are presented either as Inventories or Trade receivables. Incremental costs of obtaining customer contracts with a term of one year or less are expensed. Except for payments made to customers at inception of contracts which are recognized as intangible assets and purchase and production costs recognized as inventories, Syngenta has no other material incremental costs of obtaining contracts or direct costs of fulfilling contracts that qualify for recognition as an asset.
Notes to the Syngenta AG Group Consolidated Financial Statements Financial Report 2020
78
For certain customers in certain markets, trade receivables are settled either with proceeds from sales by such customers of agricultural commodities or by delivery of commodities to Syngenta by such customers. For these arrangements, Syngenta recognizes revenue when it has a legally enforceable receivable, the amount of which is reliably measurable based on an agreed price for the Syngenta products. Where Syngenta has a contract with the customer for physical delivery of a commodity at a fixed price which is hedged using derivative financial instruments, an embedded derivative is recognized for the fair value of the contract until physical delivery. When Syngenta subsequently resells the commodity, it classifies additional revenue as sales only to the extent that the original contract for the sale of Syngenta products included revenue that was contingent upon the commodity sales proceeds. Any remaining gains or losses on the commodity sale are recorded in Marketing and distribution expense in the consolidated income statement.
Research and development Research expenses are charged to the consolidated income statement when incurred. As disclosed in Note 2, internal development costs are capitalized as intangible assets only when there is an identifiable asset that can be completed and is expected to generate future economic benefits and when the cost of such an asset can be measured reliably. Costs incurred internally to develop new chemical or biological crop protection products based on active ingredients that have not yet obtained regulatory approval, or to develop new seed varieties containing genetically modified (GM) traits that have not yet obtained regulatory approval, are expensed as incurred because of the uncertainty inherent in the outcome of the regulatory approval process. Costs incurred in the design, development and testing of new or improved non-GM seed varieties and hybrids, of formulations of existing registered chemical active ingredients or projects to extend the application range of existing crop protection products, or of new and improved production processes that do not themselves require regulatory approval and that can be applied to products which have already obtained approval, are capitalized if the processes are technically feasible, Syngenta intends and has sufficient resources to complete the development, the product or process will generate future economic benefits, and expenditure attributable to developing the product or process can be measured reliably. Government grants received in respect of research and development costs, including tax credits treated as government grants for accounting purposes, are recognized in profit or loss in the same periods as the costs to which they relate. Development expenses Syngenta incurs to develop technology on behalf of a third party under a collaboration agreement are capitalized and amortized over the agreement term if Syngenta expects to recover the costs under the terms in that agreement.
Costs of purchasing distribution rights, patent rights and licenses to use or sell products, or technology or registration data are capitalized as intangible assets. Costs of applying for patents for internally developed products, costs of defending existing patents and costs of challenging patents held by third parties where these are considered invalid, are considered part of development expense and expensed as incurred.
Expenses by function Cost of goods sold includes costs of purchasing and producing inventories that have been sold to third parties, inbound and inter-site distribution expenses, impairment of inventories, environmental remediation costs associated with ongoing Syngenta manufacturing sites, and general overhead expenses of Syngenta’s Production and Supply function which are expensed as incurred. Marketing and distribution includes costs of selling products, providing technical support for products sold, marketing and promotional expenses, distribution of finished products to third party customers, and impairment of trade and other receivables. Research and development includes the expenses of Syngenta’s research sites and third party research collaboration agreements, expenses incurred during the regulatory process for Syngenta products and the costs of Syngenta’s global field trials organization. General and administrative includes expenses of general management, finance, human resources, information systems, legal affairs and taxes, corporate affairs and communications, business planning and corporate development functions. Services provided by these departments to the Production and Supply, Marketing and Distribution and Research and Development functions are allocated to and included within those other functions. Gains and losses arising on routine asset disposals and gains and losses reclassified from OCI when hedged forecast foreign currency trading transactions affect profit or loss are also reported within General and administrative. Restructuring is a separate general and administrative function as it is managed through a project management office which is accountable to the Executive Team. Impairment of property, plant and equipment that results from restructuring plans, rather than ongoing activities of the functions responsible for the assets, is included in Restructuring. Impairment of goodwill and intangible assets is also included in Restructuring unless a specific function is accountable for the impairment loss. Non-current asset depreciation and amortization are charged to the functions responsible for the related assets.
Restructuring Restructuring represents the effect on reported performance of initiating and enabling business changes that are considered major and that, in the opinion of management, will have a material effect on the nature and focus of Syngenta’s operations, and therefore require separate disclosure to provide a more thorough understanding of business performance. Restructuring includes the incremental costs of closing, restructuring or relocating existing operations, and gains or losses from related asset disposals. Restructuring also includes the effects of analyzing and preparing for potential industry consolidation transactions as well as completing and integrating significant business combinations and divestments, including related transaction costs, gains and losses. Recurring costs of normal business operations and routine asset disposal gains and losses, including those arising from sale and leaseback transactions carried out to optimize Syngenta AG group financing, are excluded.
Income taxes Income taxes for the year comprise current and deferred taxes, calculated using rates enacted or substantively enacted at the balance sheet date. Current tax is the expected tax payable on taxable income for the year and any adjustments to tax payable in respect of previous years. Deferred tax is recognized using the liability method and thus is calculated on temporary differences between the tax bases of assets and liabilities and their respective carrying amounts in the consolidated balance sheet. Syngenta accounts for income tax credits as a reduction in income tax expense if they are receivable solely through offset against an income tax liability, and treats them as government grants for accounting purposes if they are receivable in cash if no income tax liability arises against which Syngenta is required or permitted to offset the tax credits. Deferred tax is provided on temporary differences arising on investments in subsidiaries, associates and joint ventures, except where the timing of the reversal of the temporary difference can be controlled and it is probable that the difference will not reverse in the foreseeable future. Deferred tax liabilities are not recognized on the initial recognition of goodwill if the carrying amount of goodwill exceeds its tax base. Deferred tax assets, including those related to unused tax losses, are recognized to the extent that it is probable that future taxable profit will be available against which the assets can be utilized. Income tax expense, current and deferred, is recognized in profit or loss unless it relates to items recognized in OCI or in equity in which case the tax expense is also recognized in OCI or equity, respectively.
Notes to the Syngenta AG Group Consolidated Financial Statements Financial Report 2020
79
Syngenta’s policy is to comply fully with applicable tax regulations in all jurisdictions in which Syngenta’s operations are subject to income taxes. Syngenta’s estimates of current income tax expense and liabilities are calculated assuming that all tax computations filed by Syngenta’s subsidiaries will be subject to review or audit by the relevant tax authorities. Syngenta and the relevant tax authorities may have different interpretations of how regulations should be applied to actual transactions. Syngenta records provisions for taxes it estimates will ultimately be payable when the reviews or audits have been completed, including allowances for any interest and penalties which may become payable. Syngenta releases these provisions when the tax audit of the applicable year is completed or an Advance Pricing Agreement (APA) settlement is reached that impacts previous years’ tax payments, or otherwise when the statute of limitations for the applicable year expires, unless there is evident reason for earlier release.
Leases IFRS 16 “Leases” requires a lessee to account for all leases, unless exempt as described below, by recognizing a lease asset (right-of-use asset) for the right to use the asset underlying the lease (underlying asset) and a corresponding liability for lease payments during the lease term, defined as the non-cancellable period of the lease and any additional periods for which the lessee has an option to use the asset that it is reasonably certain to exercise. In assessing whether such periods are reasonably certain, Syngenta considers the length of the non-cancelable lease period in each lease, contractual terms and conditions relating to the optional period(s) and to exercising the option(s), recent or planned future leasehold improvements, the impact of terminating the lease on its operations and associated termination costs, and whether Syngenta is reasonably certain to continue unchanged all other significant terms in the current lease. The lease liability includes payment for an option to purchase the underlying asset if, and only if, Syngenta is reasonably certain to exercise that option.
As permitted by IFRS 16:
Syngenta has included in the lease liability payments for services associated with leases of cars, but not with leases of other types of asset;
Syngenta accounts for short term and low value item leases by expensing costs on a straight-line basis over the lease term, without recognizing right-of-use assets and liabilities. Short term leases are all leases with a term of less than one year on inception. Low value item leases are all leases of underlying assets worth $5,000 or less when new and which are independent of other assets.
For all other leases, on their commencement Syngenta recognizes:
a liability equal to the present value of payments required over the lease term for the use of the asset, excluding contingent payments, discounted at Syngenta’s incremental borrowing rate (IBR). Syngenta’s IBR is comprised of a reference rate based on cash and swap curves for the currency and maturity of the lease payments and a financing spread adjustment which differentiates between asset classes based on the value of the collateral offered by the nature of the underlying asset. The spread adjustment for leases of land and buildings is derived from market data for spreads on debt funded transactions to purchase commercial real estate. The spread adjustment for leases of other assets is derived from the spread on Syngenta’s senior unsecured notes;
a right-of-use asset equal to the lease liability, adjusted by lease payments made or incentives received, by initial direct costs of obtaining the lease and by an estimate of costs associated with obligations to decommission or restore the underlying asset or the site where it is located.
Where Syngenta sells an asset to a third party and then subsequently leases back the asset, the transaction is accounted for as a sale-and-leaseback transaction in accordance with IFRS 16. Each sale and leaseback transaction is accounted for either as a sale or a financing. Syngenta applies the revenue recognition guidance in IFRS 15 to determine whether control of the underlying asset passes to the buyer-lessor, in which case Syngenta accounts for the transaction as a sale. IFRS 15 guidance is also applied to any variable consideration in the sale contract to determine the amount of proceeds to recognize immediately on completion of the transaction. Where the sale of the asset is considered to have satisfied the performance obligation requirements of IFRS 15, the original asset is derecognized, a lease liability is recognized for the leaseback as described in the paragraph immediately above, and the right-of-use asset arising from the subsequent leaseback is recognized at the proportion of the previous carrying amount of the asset that relates to the right of use retained. Accordingly, only part of the gain or loss on disposal of the underlying asset is recognized immediately as any gain or loss arising on the transaction relates to the rights transferred. The deferred gain is therefore recognized through reduced depreciation charges for the right-of-use asset over the lease term. Where the sale of the asset is not considered to have satisfied the performance obligation requirements of IFRS 15, then no disposal of the original asset is considered to have taken place and none is accounted for. Syngenta instead recognizes a financial liability equal to the proceeds received from the buyer-lessor.
After commencement, the right-of-use asset is amortized systematically over the lease term, except where Syngenta is reasonably certain to exercise a purchase option in the lease agreement, in which case the asset is amortized over the same useful life that Syngenta would use to depreciate an item of Property, plant and equipment similar to the underlying asset, and is subject to review for impairment. The lease liability is accounted for at amortized cost using the IBR at lease commencement. The resulting interest cost is presented within Interest expense in the consolidated income statement. Lease payments which are contingent on use of the underlying asset are not included in the lease liability and are expensed as incurred.
Notes to the Syngenta AG Group Consolidated Financial Statements Financial Report 2020
80
Financial Instruments Trade and other accounts receivable Trade and other accounts receivable include invoiced amounts less adjustments for expected credit losses. Syngenta holds trade receivables to collect their contractual cash flows, and classifies and measures them at amortized cost, except for certain foreign currency sales transactions in which Syngenta offers to its customers a written exchange rate option embedded into the sales contract. Trade receivable/option contracts that result from these foreign currency sales transactions are classified as at fair value through profit or loss. The fair value of these trade receivables is measured by:
(a) remeasuring the embedded exchange rate option at fair value;
(b) retranslating the underlying trade receivable into the selling entity’s functional currency using closing spot exchange rates at the balance sheet date; and
(c) adjusting the resulting carrying amount of the combined receivable contract to reflect changes in customer credit risk. Syngenta includes this adjustment in the provision for doubtful receivables.
Factoring arrangements transferring substantially all economic risks and rewards associated with accounts receivable to a third party are accounted for by derecognizing the accounts receivable upon receiving the cash proceeds of the factoring arrangement. Factoring arrangements that transfer to a third party some, but not substantially all economic risks and rewards are accounted for by continuing to recognize Syngenta’s continuing rights over the receivable and by recognizing any related obligation to the third party factor.
Credit risk management practices Syngenta’s Corporate Financial Risk Group (CFFORG) monitors, proposes and coordinates country risk, credit management policies and processes including credit limit setting for major customers, approval of credit exceeding 360 days and credit insurance and risk transfer objectives. The CFFORG is supported by Regional, Territory and Country Trade Finance Credit Managers (TFCM) and Credit Committees (CC) with defined authority levels. The CC defines risk mitigation programs at country and customer level such as barter, collateral policy, payment terms, early payment rebates, and refinancing. The CC also defines the optimal credit risk level at customer and country level, approves customer credit facilities, credit scoring and payment terms, defines and reviews collection strategies including credit hold and release processes, treatment of critical customer cases and taking legal actions when collection efforts are insufficient to collect overdue balances, and sets yearly targets for accounts receivable performance. The TFCM coordinates the CC and is responsible for risk analysis, executing trade financing programs, collection negotiations and dispute resolution, and, where necessary, currency risk, export financing programs, documentary credits and commercial bank guarantees and credit risk insurance. The TFCM is supported by a Credit Operations team responsible for collection and dispute management.
Syngenta manages credit risk to operational assets through country and customer risk limits. Countries are assigned a risk rating based on external analysis of their economic, business and political risk and internal analysis of agricultural risk. Country exposure limits and minimum security requirements are applied in some defined high risk countries. A standardized credit scoring methodology is applied to all customers generating a creditworthiness score computed using a points-based system which takes into consideration financial and non-financial attributes and credit limits. Based on the total score achieved each customer is classified in a credit risk class which drives policy relating to sales order release, collection process and credit limit. Each customer’s credit position is consolidated across all relevant systems to provide a total business view of credit status and history.
Collateral is an important part of the risk mitigation strategy. Collateral is based on a list of locally accepted securities which may include cash, other financial instruments, barter operations or third party credit enhancements such as guarantees or insurance, but normally excludes non-financial assets. Collateral is validated based on its probability of and time to legal enforcement.
Receivable balances are written off only when there is no realistic prospect of their being collected, after completion of related legal actions and permanent cessation of business activity with the defaulting customer. Write-offs are subject to defined authority levels and are not used to solve small payment differences or valid commercial disputes with continuing customers.
Estimation of expected credit losses To estimate expected credit losses, trade receivables are grouped into portfolios by credit risk class and country and a provision matrix method is used. The principal inputs when determining matrix percentages are historical records of amounts written off in previous years, amounts currently subject to insolvency proceedings and the likelihood of eventual write offs of those amounts, the average credit period, past due information and historical experience. Assumptions are also made about forecast conditions for market credit, commodity price, currency and country risk, competition and regulation over the remaining credit period of the trade receivables outstanding at the balance sheet date. These assumptions are consistent with those used to prepare operational budgets for the following period. Rebate credits and validated collateral valued at its expected value are deducted from outstanding receivable balances when determining the maximum exposure to credit loss to which matrix percentages are applied. Expected recoveries under credit insurance policies which are not part of the agreement with the customer are accounted for separately from the expected credit losses and are recognized as assets when the insurer has agreed the claim.
Expected credit losses on other receivables and amortized cost financial assets are generally estimated by assessing each receivable individually. For balances reported as other receivables and current financial assets, lifetime expected credit losses are estimated. For balances reported as non-current financial assets, 12-month expected credit losses are estimated unless the credit risk has increased significantly since the asset was first recognized, in which case lifetime credit losses are estimated. Amounts more than 90 days past due are considered to be in default for this purpose.
Derivative and other financial instruments Regular way purchases and sales of marketable securities are recognized at settlement date.
Financial assets and liabilities which have remaining contractual maturities of 12 months or less at the balance sheet date are presented within Total current assets and Total current liabilities, respectively. Financial assets and liabilities which have remaining contractual maturities of more than 12 months are presented within Financial and other non-current assets and Financial debt and other non-current liabilities, respectively.
Equity investments in other entities which are not subsidiaries, associates or joint ventures of Syngenta are included in Financial and other non-current assets. They are classified and measured at fair value through OCI and are revalued to fair value at each reporting date, with all
Notes to the Syngenta AG Group Consolidated Financial Statements Financial Report 2020
81
changes in fair value recognized within OCI. In Syngenta’s opinion, presenting gains and losses on these investments in OCI is more consistent with Syngenta’s strategic investment objectives than presenting those gains and losses within profit and loss. The fair value of equity investments is measured as described in Note 25.
Other non-current receivables represent royalty and license receivables, loans to employees and other third parties, and amounts recoverable from third parties in reimbursement of environmental remediation and other costs. These receivables are stated at amortized cost, less provision for impairment where appropriate.
Financial debt is recognized initially at its fair value less transaction costs, which represents the net proceeds from issuing the debt. Subsequently, financial debt is stated at amortized cost using the effective interest method, except where subject to a fair value hedge relationship, in which case the carrying amount of the debt is adjusted by the change in the fair value of the hedged exposure during the hedge relationship.
Derivative financial instruments are recorded initially at their fair value when Syngenta becomes a party to the instrument. They are revalued to fair value at each reporting date and presented as financial assets when the fair value is positive and as financial liabilities when the fair value is negative.
Fair values of publicly traded derivatives are based on quoted market prices of the specific instruments held at the balance sheet date.
Fair values of non-publicly traded derivatives are valued using accepted economic methodologies for pricing these financial instruments, such as discounted cash flow analysis or option pricing models. The valuation models seek to make maximum use of market inputs existing at the balance sheet date. The methods used to determine the fair value of specific types of non-publicly traded derivatives are as follows:
Interest rate and cross-currency swaps are calculated as the present value of the estimated future cash flows. The future cash flows are determined using relevant market forward interest rates at the balance sheet date and are discounted using the zero-coupon rates with equivalent maturities for AA rated entities at the balance sheet date, as adjusted for the counterparty’s credit risk. These discount rates incorporate the impact of net credit risk present in those derivative instruments. For cross-currency swaps, the discount rates reflect the impact of the currency basis on the future cash flows denominated in different currencies;
Forward contracts are determined using relevant market exchange rates at the balance sheet date;
Currency options are valued using the Black-Scholes-Merton option pricing model, which incorporates spot exchange rates, zero coupon rates with equivalent maturities for entities with credit ratings which approximate Syngenta’s counterparty credit risk, and implied volatility in the market forward exchange rates at the balance sheet date; and
Commodity options are valued using the Black-Scholes-Merton option pricing model, which incorporates future commodity price curves with equivalent maturities and implied volatilities in the commodities markets at the balance sheet date, adjusted for counterparty credit risk.
Realized gains and losses on disposal of amortized cost financial assets, revaluation gains and losses on derivatives not designated as accounting hedges, and gains and losses corresponding to the ineffective portion of derivatives designated as accounting hedges are recorded in profit or loss as they arise.
Syngenta applies hedge accounting as follows:
Fair value hedges The designated hedging instruments are remeasured to fair value and the underlying hedged items are remeasured by the amount of change in the fair value of the hedged risk. The resulting remeasurement gains or losses are recognized in profit or loss as they occur.
Cash flow hedges For the effective portion of the hedge, gains and losses on remeasuring designated hedging instruments to fair value are recognized in OCI as part of the cash flow hedge reserve. If the hedged transaction results in recognition of a non-financial asset such as inventories, the cumulative hedge gain or loss is reclassified as part of the carrying amount of the related inventories. For other hedged transactions, the cumulative hedge gain or loss is reclassified from OCI into profit or loss in the period (or periods) during which the underlying hedged cash flows affect profit or loss.
When a hedging instrument expires or is sold, or when a hedge no longer meets the criteria for cash flow hedge accounting, any cumulative unrealized gain or loss on the hedging instrument remains in equity until the underlying hedged item affects profit or loss. However, if a hedged forecasted transaction is no longer expected to occur, the cumulative unrealized gain or loss on the hedging instrument is immediately reclassified into profit or loss.
Time value of options When Syngenta designates a derivative financial instrument that is, or contains, an option as a hedging instrument in a hedge accounting relationship, the time value of the options as measured using the Black-Scholes-Merton option pricing model is excluded from the hedge designation and accounted for as a cost of hedging, as follows. The change in the fair value of the option during its term is recognized in OCI to the extent that the option terms are aligned with the attributes of the hedged exposure. If the hedged item is a transaction, the cumulative change in time value is included in the initial carrying amount of any non-financial asset or liability recognized when the hedged transaction occurs, or otherwise is recognized in profit and loss when the cash flows from the hedged transaction affect profit and loss. If the hedged item is a risk that may affect profit or loss during the option term, the cumulative amount recognized in OCI is amortized into profit and loss on a straight line basis over the option term.
Notes to the Syngenta AG Group Consolidated Financial Statements Financial Report 2020
82
Net working capital For the purposes of presenting consolidated cash flows, the balance sheet items included in Net working capital are Inventories, Trade receivables, Other accounts receivable, Trade accounts payable, Contract liabilities, Other current assets, Other current liabilities, and similar items due after more than one year, such as minimum royalties from multi-year license agreements.
Inventories Purchased products are recorded at acquisition cost while own-manufactured products are recorded at manufacturing cost including a share of production overheads based on normal capacity. Cost of inventories is determined on a first-in-first-out basis. Allowances are made for inventories with a net realizable value less than cost, or which are slow moving. Net realizable value is the estimated selling price in the ordinary course of business, less the estimated costs of completion and costs to sell. Costs to sell include direct marketing, selling and distribution costs. Unsaleable inventories are fully written off.
Biological assets Biological assets represent growing plants and cuttings in Syngenta’s Flowers business and sugar cane seedlings within its Sugar cane business. In Flowers, young plants and cuttings are measured at fair value less costs to sell, with key inputs being current average third party net selling prices, actual average selling costs and, for immature assets, estimated stage of growth relative to mature assets. Sugar cane seedlings are measured at cost less impairment because fair value is not reliably measurable due to the nature of the asset not corresponding to traded assets or products in the market. The carrying amount of current consumable biological assets measured using the cost model is tested for impairment by comparing it with the assets’ net realizable value determined in accordance with IAS 2, “Inventories”. Syngenta classifies gains and losses from remeasuring biological assets to fair value, and impairment losses for biological assets measured at cost less impairment, within Cost of goods sold.
Property, plant and equipment Property, plant and equipment are recorded at acquisition or production cost, less accumulated depreciation and any impairment losses. Eligible borrowing costs are capitalized as part of the asset cost if construction is expected to take more than one year to complete. Capitalization ceases when the asset is ready for its intended use. Depreciation is charged on a straight-line basis to the income statement, starting from the date the asset is ready for use, over the following estimated useful lives:
Buildings 20 to 40 years Machinery and equipment 10 to 25 years Furniture and vehicles 5 to 20 years Computer hardware 3 to 7 years
Land is recorded at acquisition cost and is not subject to depreciation. Bearer biological assets are accounted for as Property, plant and equipment using the cost model and depreciated over their productive lives.
Expenditures made for existing property, plant and equipment that will provide future economic benefit are capitalized and depreciated over the revised remaining useful life of the asset.
Intangible assets other than goodwill Intangible assets, other than goodwill, are recorded at cost less accumulated amortization and any impairment losses. Currently, all such intangible assets are assigned a finite estimated useful life. The cost of acquired intangible assets other than goodwill consists of the purchase price including transaction costs. The cost of internally generated intangible assets consists of direct internal and external design, development, and testing costs incurred to make the asset ready for use in the manner intended by management. Borrowing costs associated with internal projects to develop new products or software are capitalized to the extent that the costs of the project itself are capitalized and the project is expected to take more than one year from inception to complete. Capitalization ceases when the products or software are ready for their intended uses.
Intangible assets are amortized starting from the date the asset is ready for use. In respect of product rights, this is when regulatory approval has been obtained. Asset lives are reviewed annually. The straight-line method of amortization is used except where another systematic basis better reflects the pattern of consumption of the economic benefits represented by the asset. Amortization is charged within the consolidated income statement to the function responsible for the asset, or to General and administrative.
Useful lives assigned to acquired product rights are based on the period over which Syngenta expects economic benefit from the product rights. Estimated lives assigned to most product rights upon acquisition are between 10 and 20 years and do not exceed 20 years for any asset.
Patents and trademarks are amortized over their estimated economic or legal life, whichever is shorter. Lives assigned are between 5 and 20 years.
Business combinations give Syngenta access to the distribution channels and customer relationships of the acquired business. These relationships normally continue to generate economic benefit to Syngenta following the acquisition. The useful lives of customer relationships are determined from management estimates of customer attrition rates. Estimated lives assigned are between 5 and 30 years.
Acquired in-process research and development (IPR&D), is valued at fair value at acquisition. It is assessed for impairment annually until it has been successfully developed and is available for use at which time it begins being amortized over its estimated useful life. Lives assigned are between 10 and 20 years.
Notes to the Syngenta AG Group Consolidated Financial Statements Financial Report 2020
83
Costs of successfully completed internal development projects which are capitalized because they meet the criteria described in Note 2 are amortized starting from launch of the related products, over periods that depend on the nature of the project, as follows:
New crop protection formulations 20 years Extension of existing crop protection formulations 15 years Extension of product label applications for existing crop protection products 10 years Seed breeding costs 4 to 9 years
Assets attributable to long-term supply agreements are amortized as part of cost of goods sold over the period of the supply agreements. Premiums paid for land use rights are amortized over the period of the rights, which are between 30 and 50 years.
Purchased software licenses are amortized over their remaining license terms. Internally developed software is amortized from the date it is ready for use until the sooner of its expected replacement date or the date significant costs are expected to be incurred to upgrade it. Lives assigned are between 3 and 10 years.
Goodwill Goodwill is the excess of the fair value of an acquired business over the fair value of its identifiable net assets at the acquisition date. Goodwill is recognized as an asset and presented within intangible assets. Goodwill is not amortized, but is tested annually for impairment and reduced by any impairment losses.
Impairment Property, plant and equipment, right-of-use assets, intangible assets and investments in associates and joint ventures are tested for impairment (“tested”) in accordance with IAS 36 unless classified as held-for-sale. Goodwill and intangible assets not yet ready for use are tested annually and are also reviewed at each interim and annual reporting date to determine whether conditions changed since the most recent review or annual test. Individual other non-current assets are reviewed at each reporting date to determine whether events or changes in conditions indicate that the carrying amount of each asset may not be recoverable. If any such indication exists, the asset is tested for impairment. Syngenta estimates an asset’s recoverable amount as the higher of the asset’s fair value less selling costs and its value in use, which is the present value of the cash flows expected from the asset’s use and eventual disposal. An impairment loss is recorded in the consolidated income statement to the extent that the carrying amount of the tested asset exceeds its recoverable amount. Impairment losses are not reversed for goodwill, but are reversed for other assets if their recoverable amounts subsequently increase.
Non-current assets held-for-sale Non-current assets and groups of assets are reclassified as held-for-sale when the assets are available for immediate sale in their present condition and a sale within one year is highly probable. Property, plant and equipment and intangible assets held-for-sale are remeasured at the lower of carrying amount and fair value less costs to sell at the date they meet the held-for-sale criteria at which time depreciation and amortization also ceases. Any resulting impairment loss is recognized in profit or loss. Fair value is measured based on bids received from potential buyers of the assets.
Provisions A provision is recognized in the balance sheet when Syngenta has a legal or constructive obligation to a third party or parties as a result of a past event, the amount of which can be reliably estimated and it is probable that an outflow of economic benefits will be required to settle the obligation. The amount recognized as a provision is the best estimate of the expenditure required to settle the obligation at the balance sheet date. Syngenta self-insures or uses a combination of insurance and self-insurance for certain risks. Provisions for these risks are estimated in part by considering historical claims experience and other actuarial assumptions and, where necessary, counterparty risk.
Environmental provisions Provisions for remediation costs are made when there is a present obligation, it is probable that expenditures for remediation work will be required within ten years (or a longer period if specified by a legal obligation) and the cost can be estimated within a reasonable range of possible outcomes. The costs are based on currently available facts: technology expected to be available at the time of the clean up; laws and regulations presently or virtually certain to be enacted; and prior experience in remediation of contaminated sites.
Environmental liabilities are recorded at the estimated amount at which the liability could be settled at the balance sheet date, and are discounted if the impact is material and if cost estimates and timing are considered reasonably certain.
Syngenta’s restructuring programs have involved closure of several sites to date. Remediation liabilities recognized when site closures are announced are accounted for as restructuring provisions.
Legal and product liability settlements For claims for which, according to Syngenta’s assessment, it is not probable that a liability exists or that there will be a future cash outflow or other sacrifice of economic benefits, Syngenta provides for the costs of defense only. For claims where an outcome unfavorable to Syngenta is assessed as more likely than not, provision is made for the estimated amount of damages and settlement, including directly attributable legal costs. No provision is made where the legal procedures are at too early a stage to estimate the outcome with any reliability.
Restructuring provisions and costs Restructuring costs are accrued (charged to provisions) when Syngenta has approved a detailed and formal restructuring plan and the restructuring has either commenced or been announced publicly and they qualify for recognition in accordance with IAS 37. Provisions for severance payments and related employment termination costs that do not depend on future service, are made in full when employees are given details of the restructuring plan and the termination benefits that will apply to individual employees should their contracts be terminated. Retention and other payments that depend on future service are recognized over the required service period. Restructuring costs relating to ongoing activities, such as relocation, training and information systems, do not qualify for provisioning under IAS 37 and are expensed when incurred.
Notes to the Syngenta AG Group Consolidated Financial Statements Financial Report 2020
84
Post-employment benefits For defined benefit plans, plan assets are measured at fair value. The plans’ holdings in publicly quoted investments are valued at closing prices at the balance sheet date. The plans’ holdings in pooled investment vehicles (PIVs) that are not publicly quoted are valued at the respective investment managers’ current estimate of fair value, on a basis consistent with each PIV’s most recent audited financial statements. Derivative contracts entered into directly by the pension plans are included within plan assets. Exchange traded derivatives are valued at quoted balance sheet date bid prices for contracts which are assets, or offer prices for contracts which are liabilities, at the balance sheet date. Fair values of over the counter derivatives are measured using independent third party pricing services. Insurance policies under which the plan will receive payments that match the timing and amount of specific plan benefits and can be used only to fund those benefits are valued at the same amount as the linked benefits within the related defined benefit obligation. Defined benefit obligations are measured at the present value of future benefit payments attributable to employee service rendered up to the balance sheet date, according to the benefit formula set out in the relevant pension plan rules and employment terms at the balance sheet date. Where a surplus of plan assets over the benefit obligation exists at the balance sheet date or would arise upon payment of the minimum funding commitment applicable to the pension plan, Syngenta evaluates the extent to which it will be able to realize the surplus over time through refund rights and reductions in the present value of its future contributions to the plan. To the extent that Syngenta cannot realize the surplus, the net defined benefit asset is reduced and, where applicable, an additional liability for minimum funding contributions is recognized. Benefit expense charged to profit or loss comprises current service cost, which is the cost to Syngenta of the increase in benefits earned from employee service in the period, gains and losses arising from amendments to and settlements of benefits that occurred during the period, and interest on the net defined benefit asset or liability, which is the change in the present value of that asset or liability arising from the passage of time during the period, measured using the rate used to discount the defined benefit obligation at the previous period end. In the consolidated income statement, current service cost is presented within the same function line as the other personnel costs of the related employees, and net interest cost is presented within Financial expense, net. The benefit obligation and cost are attributed to periods using the projected unit credit actuarial method and are measured using long-term assumptions about expected future length of employee service, increases in pay and pensions, longevity, and for healthcare plans, medical costs. Assumptions are reviewed annually. Gains and losses arising from variances between assumptions and actual outcomes, and from changes to assumptions, are recognized in OCI in the period in which they arise, and are not subsequently reclassified to profit and loss.
Contributions to defined contribution pension plans are recognized as an expense in profit or loss when they are due.
Employee Incentive plans Syngenta operates annual and long-term cash incentive plans to reward employee performance. Under the long-term plans, awards are subject to Syngenta performance over a three-year period. Syngenta accounts for annual and long-term plans respectively as short-term and long-term employee benefits in accordance with IAS 19.
Dividends and capital distributions Dividends payable to the shareholder of Syngenta AG are recorded as liabilities and as a reduction in shareholder’s equity when they are approved by the shareholder of Syngenta AG and any conditions for payment are satisfied.
Treasury shares Treasury shares are shown as a separate component of shareholder’s equity and stated at the amount paid to acquire them. Differences between this amount and the amount received upon their disposal are recorded as a movement in consolidated shareholder’s equity.
27. Subsequent events
On January 25, 2021, in order to pro-actively manage its debt portfolio and reduce future interest expense, Syngenta commenced a cash tender offer for any and all of its outstanding 4.375% USD Notes 2042 and 5.676% USD bond 2048 (see Note 18 for carrying values). The tender offer expired on January 29, 2021 with valid tenders received totaling approximately $278 million.
Approval of the Consolidated Financial Statements
These consolidated financial statements were approved by the Board of Directors on February 3, 2021.

© 2021 KPMG AG, a Swiss corporation, is a subsidiary of KPMG Holding AG, which is a member
firm of the KPMG global organization of independent member firms affiliated with KPMG International
Limited, a private English company limited by guarantee. All rights reserved.
KPMG AG
Viaduktstrasse 42
P.O. Box 3456
CH-4002 Basel
+41 58 249 91 91
kpmg.ch
Statutory Auditor’s Report to the General Meeting of Syngenta AG, Basel
Report on the Audit of the Consolidated Financial Statements
Opinion
We have audited the consolidated financial statements of Syngenta AG and its subsidiaries (the Group), which
comprise the consolidated balance sheet as at December 31, 2020 and the consolidated income statement,
consolidated statement of comprehensive income, consolidated cash flow statement and consolidated statement of
changes in equity for the year then ended, and notes to the consolidated financial statements, including a summary
of significant accounting policies.
In our opinion the accompanying consolidated financial statements give a true and fair view of the consolidated
financial position of the Group as at December 31, 2020, and its consolidated financial performance and its
consolidated cash flows for the year then ended in accordance with International Financial Reporting Standards
(IFRS) and comply with Swiss law.
Basis for Opinion
We conducted our audit in accordance with Swiss law, International Standards on Auditing (ISAs) and Swiss Auditing
Standards. Our responsibilities under those provisions and standards are further described in the Auditor’s
Responsibilities for the Audit of the Consolidated Financial Statements section of our report. We are independent of
the Group in accordance with the provisions of Swiss law and the requirements of the Swiss audit profession, as
well as the International Ethics Standards Board for Accountants’ International Code of Ethics for Professional
Accountants (including International Independence Standards) (IESBA Code), and we have fulfilled our other ethical
responsibilities in accordance with these requirements. We believe that the audit evidence we have obtained is
sufficient and appropriate to provide a basis for our opinion.
Responsibility of the Board of Directors for the Consolidated Financial Statements
The Board of Directors is responsible for the preparation of the consolidated financial statements that give a true
and fair view in accordance with IFRS and the provisions of Swiss law, and for such internal control as the Board of
Directors determines is necessary to enable the preparation of consolidated financial statements that are free from
material misstatement, whether due to fraud or error.
In preparing the consolidated financial statements, the Board of Directors is responsible for assessing the Group’s
ability to continue as a going concern, disclosing, as applicable, matters related to going concern and using the
going concern basis of accounting unless the Board of Directors either intends to liquidate the Group or to cease
operations, or has no realistic alternative but to do so.
Auditor’s Responsibilities for the Audit of the Consolidated Financial Statements
Our objectives are to obtain reasonable assurance about whether the consolidated financial statements as a whole
are free from material misstatement, whether due to fraud or error, and to issue an auditor’s report that includes our
opinion. Reasonable assurance is a high level of assurance, but is not a guarantee that an audit conducted in
accordance with Swiss law, ISAs and Swiss Auditing Standards will always detect a material misstatement when it
Syngenta AG, Basel
Statutory Auditor’s Report on
the Audit of the Consolidated
Financial Statements to the
General Meeting
exists. Misstatements can arise from fraud or error and are considered material if, individually or in the aggregate,
they could reasonably be expected to influence the economic decisions of users taken on the basis of these
consolidated financial statements.
As part of an audit in accordance with Swiss law, ISAs and Swiss Auditing Standards, we exercise professional judgment and maintain professional skepticism throughout the audit. We also:
Identify and assess the risks of material misstatement of the consolidated financial statements, whether due to fraud or error, design and perform audit procedures responsive to those risks, and obtain audit evidence that is sufficient and appropriate to provide a basis for our opinion. The risk of not detecting a material misstatement resulting from fraud is higher than for one resulting from error, as fraud may involve collusion, forgery, intentional omissions, misrepresentations, or the override of internal control.
Obtain an understanding of internal control relevant to the audit in order to design audit procedures that are appropriate in the circumstances, but not for the purpose of expressing an opinion on the effectiveness of the Group’s internal control.
Evaluate the appropriateness of accounting policies used and the reasonableness of accounting estimates and related disclosures made.
Conclude on the appropriateness of the Board of Directors’ use of the going concern basis of accounting and, based on the audit evidence obtained, whether a material uncertainty exists related to events or conditions that may cast significant doubt on the Group’s ability to continue as a going concern. If we conclude that a material uncertainty exists, we are required to draw attention in our auditor’s report to the related disclosures in the consolidated financial statements or, if such disclosures are inadequate, to modify our opinion. Our conclusions are based on the audit evidence obtained up to the date of our auditor’s report. However, future events or conditions may cause the Group to cease to continue as a going concern.
Evaluate the overall presentation, structure and content of the consolidated financial statements, including the disclosures, and whether the consolidated financial statements represent the underlying transactions and events in a manner that achieves fair presentation.
Obtain sufficient appropriate audit evidence regarding the financial information of the entities or business activities within the Group to express an opinion on the consolidated financial statements. We are responsible for the direction, supervision and performance of the Group audit. We remain solely responsible for our audit opinion.
We communicate with the Board of Directors or its relevant committee regarding, among other matters, the planned scope and timing of the audit and significant audit findings, including any significant deficiencies in internal control that we identify during our audit.
Syngenta AG, Basel
Statutory Auditor’s Report on
the Audit of the Consolidated
Financial Statements to the
General Meeting
Report on Other Legal and Regulatory Requirements
In accordance with article 728a para. 1 item 3 CO and Swiss Auditing Standard 890, we confirm that an internal control system exists, which has been designed for the preparation of consolidated financial statements according to the instructions of the Board of Directors.
We recommend that the consolidated financial statements submitted to you be approved.
KPMG AG
Michael Blume
Licensed Audit Expert
Auditor in Charge
Artem Chumakov
Basel, February 3, 2021
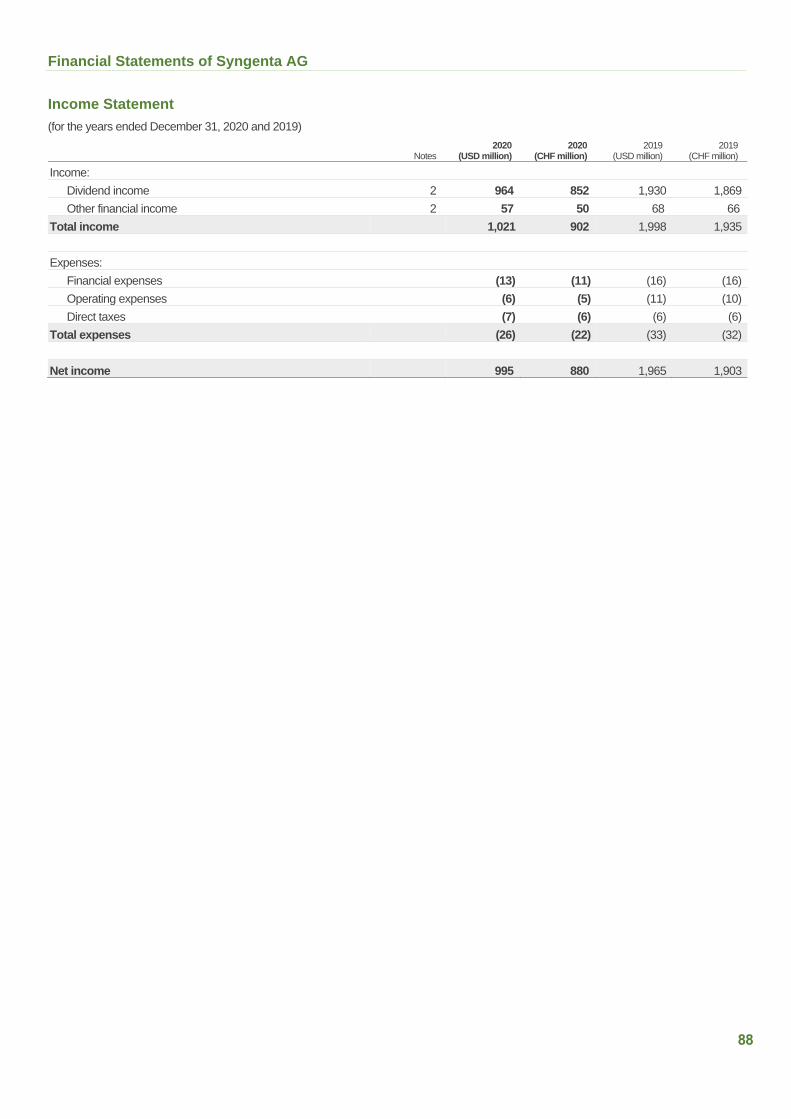
Financial Statements of Syngenta AG
88
Income Statement
(for the years ended December 31, 2020 and 2019)
Notes 2020
(USD million) 2020
(CHF million) 2019
(USD million) 2019
(CHF million)
Income:
Dividend income 2 964 852 1,930 1,869
Other financial income 2 57 50 68 66
Total income 1,021 902 1,998 1,935
Expenses:
Financial expenses (13) (11) (16) (16)
Operating expenses (6) (5) (11) (10)
Direct taxes (7) (6) (6) (6)
Total expenses (26) (22) (33) (32)
Net income 995 880 1,965 1,903
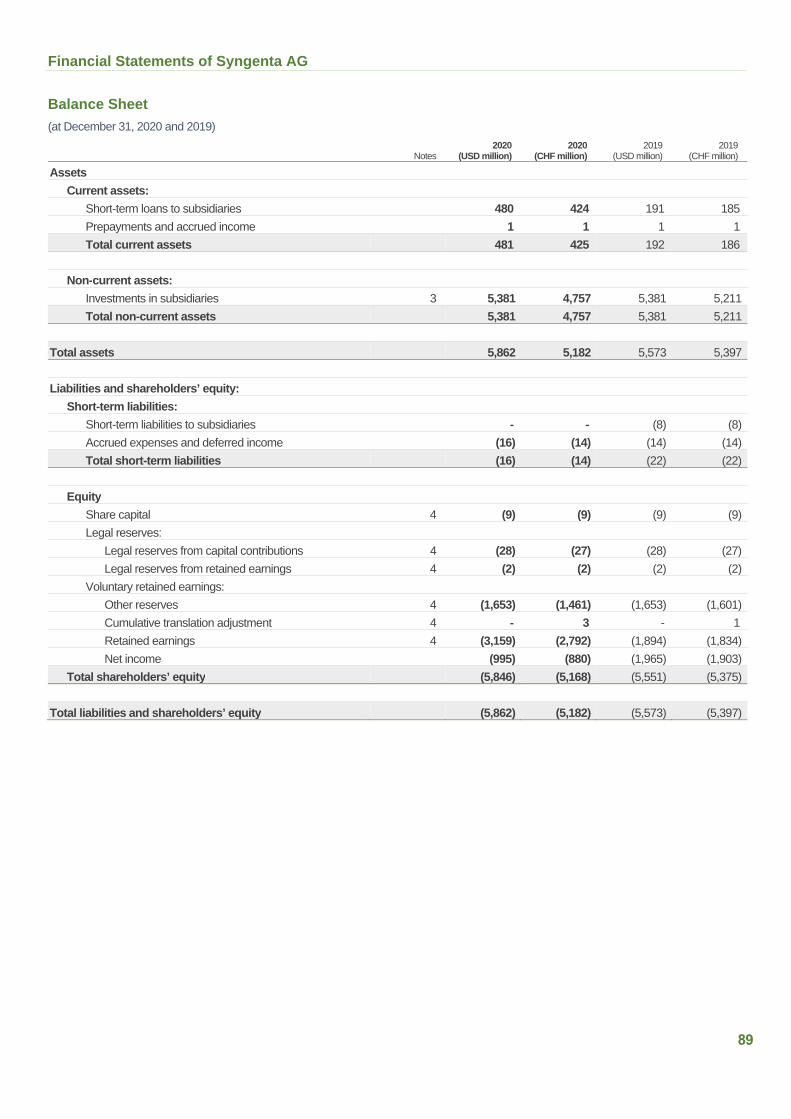
Financial Statements of Syngenta AG
89
Balance Sheet
(at December 31, 2020 and 2019)
Notes 2020
(USD million) 2020
(CHF million) 2019
(USD million) 2019
(CHF million)
Assets
Current assets:
Short-term loans to subsidiaries 480 424 191 185
Prepayments and accrued income 1 1 1 1
Total current assets 481 425 192 186
Non-current assets:
Investments in subsidiaries 3 5,381 4,757 5,381 5,211
Total non-current assets 5,381 4,757 5,381 5,211
Total assets 5,862 5,182 5,573 5,397
Liabilities and shareholders’ equity:
Short-term liabilities:
Short-term liabilities to subsidiaries - - (8) (8)
Accrued expenses and deferred income (16) (14) (14) (14)
Total short-term liabilities (16) (14) (22) (22)
Equity
Share capital 4 (9) (9) (9) (9)
Legal reserves:
Legal reserves from capital contributions 4 (28) (27) (28) (27)
Legal reserves from retained earnings 4 (2) (2) (2) (2)
Voluntary retained earnings:
Other reserves 4 (1,653) (1,461) (1,653) (1,601)
Cumulative translation adjustment 4 - 3 - 1
Retained earnings 4 (3,159) (2,792) (1,894) (1,834)
Net income (995) (880) (1,965) (1,903)
Total shareholders’ equity (5,846) (5,168) (5,551) (5,375)
Total liabilities and shareholders’ equity (5,862) (5,182) (5,573) (5,397)
Notes to the Financial Statements of Syngenta AG
90
1. Accounting policies
Ownership
Syngenta AG, domiciled in Basel, Switzerland, is a fully owned subsidiary of CNAC Saturn (NL) B.V.
On January 5, 2020, China National Chemical Corporation (“ChemChina”) announced a planned reorganization to bring together its Crop Protection and Seeds businesses, consisting of ChemChina’s holdings in the Syngenta AG group and in Adama Ltd., as well as major agricultural assets to be acquired from Sinochem Group. On June 18, 2020, the parent company, Syngenta Group Co. Ltd., announced the official launch of the Syngenta Group, a new global leader in agricultural science and innovation. The new entity, which is domiciled in China, but operationally headquartered in Switzerland, encompasses four business units: Syngenta Crop Protection, based in Basel, Switzerland; Syngenta Seeds, based in Chicago, USA; Adama, based in Airport City, Israel; and Syngenta Group China, based in Shanghai, China.
The ultimate parent company of Syngenta AG is ChemChina.
General aspects
These financial statements were prepared according to the provisions of the Swiss Law on Accounting and Financial Reporting (32nd title of the Swiss Code of Obligations) (the “Law”). The significant accounting and valuation principles applied that are not prescribed by the Law are described below.
On January 1, 2019, the accounting functional currency was changed from Swiss Franc (CHF) to US Dollar (USD). The change was made to reflect that Syngenta AG, under the ownership of ChemChina, has the USD as its predominant currency for the majority of its cash flows, which includes dividend payments made to CNAC Saturn (NL) B.V.
All references to the “Syngenta AG group” relate to Syngenta AG and its direct and indirect subsidiaries.
Exchange rate differences
Exchange rate differences recorded in the financial statements in USD: Except for investments in subsidiaries, associates and joint ventures, which are translated at historical rates, all assets and liabilities denominated in foreign currencies are translated into USD using year-end rates of exchange. Realized exchange gains and losses arising from these as well as those from business transactions denominated in foreign currencies are recorded in the income statement. Net unrealized exchange losses are recorded in the income statement; net unrealized gains, however, are deferred within accrued liabilities.
Exchange rate difference arising on translation of the financial statements from USD to CHF: All income statement and balance sheet positions were translated at the closing rate approved by the tax authorities of canton Basel-Stadt, which was 0.8839 for December 31, 2020. Share capital and legal reserves were translated at historical rates. The change in foreign exchange rate as compared to the closing rate of the previous year created a translation difference on the net assets, which was reflected as translation difference directly in voluntary retained earnings.
Investments in subsidiaries
Investments are recorded at acquisition cost less any impairment loss.
Foregoing a cash flow statement and additional disclosures in the notes
In accordance with the Law, Syngenta AG has decided to forego presenting additional information on interest-bearing liabilities and audit fees in the notes, as well as a cash flow statement, because it has prepared its consolidated financial statements in accordance with a recognized accounting standard (International Financial Reporting Standards as issued by the International Accounting Standards Board).
2. Information on income statement and balance sheet items
Dividend income
Dividend income in the current year consists entirely of dividends received from subsidiaries related to earnings from the previous business year.
Other financial income
Other financial income consists mainly of guarantee and other fees received from subsidiaries.
Short-term interest-bearing loans to/from subsidiaries
Syngenta AG receives loans from Syngenta AG group companies and provides loans to Syngenta AG group companies.
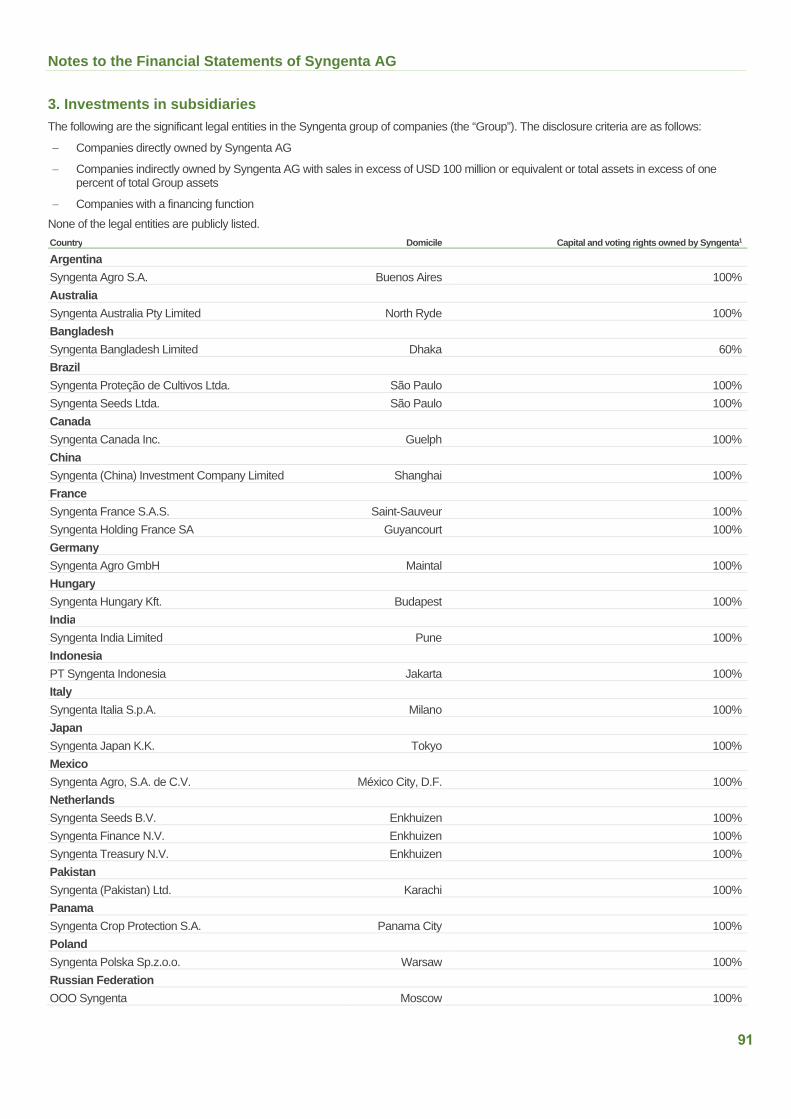
Notes to the Financial Statements of Syngenta AG
91
3. Investments in subsidiaries
The following are the significant legal entities in the Syngenta group of companies (the “Group”). The disclosure criteria are as follows:
Companies directly owned by Syngenta AG
Companies indirectly owned by Syngenta AG with sales in excess of USD 100 million or equivalent or total assets in excess of one percent of total Group assets
Companies with a financing function
None of the legal entities are publicly listed.
Country Domicile Capital and voting rights owned by Syngenta1
Argentina
Syngenta Agro S.A. Buenos Aires 100%
Australia
Syngenta Australia Pty Limited North Ryde 100%
Bangladesh
Syngenta Bangladesh Limited Dhaka 60%
Brazil
Syngenta Proteção de Cultivos Ltda. São Paulo 100%
Syngenta Seeds Ltda. São Paulo 100%
Canada
Syngenta Canada Inc. Guelph 100%
China
Syngenta (China) Investment Company Limited Shanghai 100%
France
Syngenta France S.A.S. Saint-Sauveur 100%
Syngenta Holding France SA Guyancourt 100%
Germany
Syngenta Agro GmbH Maintal 100%
Hungary
Syngenta Hungary Kft. Budapest 100%
India
Syngenta India Limited Pune 100%
Indonesia
PT Syngenta Indonesia Jakarta 100%
Italy
Syngenta Italia S.p.A. Milano 100%
Japan
Syngenta Japan K.K. Tokyo 100%
Mexico
Syngenta Agro, S.A. de C.V. México City, D.F. 100%
Netherlands
Syngenta Seeds B.V. Enkhuizen 100%
Syngenta Finance N.V. Enkhuizen 100%
Syngenta Treasury N.V. Enkhuizen 100%
Pakistan
Syngenta (Pakistan) Ltd. Karachi 100%
Panama
Syngenta Crop Protection S.A. Panama City 100%
Poland
Syngenta Polska Sp.z.o.o. Warsaw 100%
Russian Federation
OOO Syngenta Moscow 100%
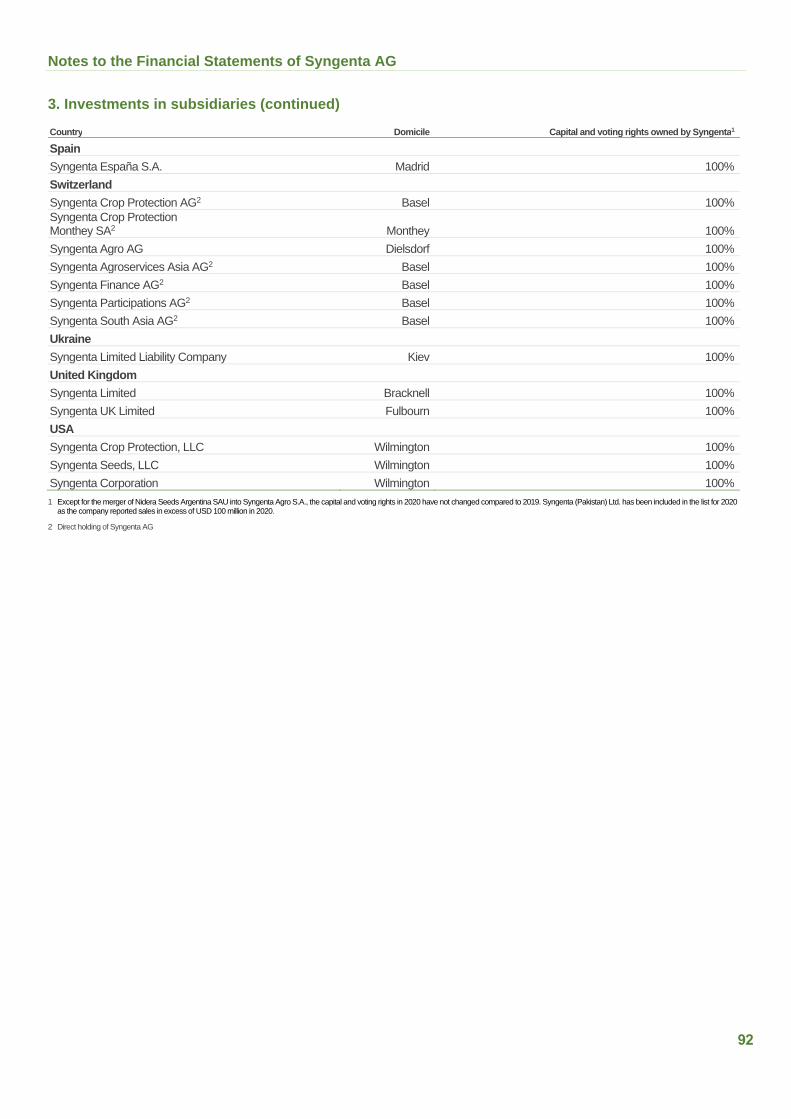
Notes to the Financial Statements of Syngenta AG
92
3. Investments in subsidiaries (continued)
Country Domicile Capital and voting rights owned by Syngenta1
Spain
Syngenta España S.A. Madrid 100%
Switzerland
Syngenta Crop Protection AG2 Basel 100%
Syngenta Crop Protection Monthey SA2 Monthey 100%
Syngenta Agro AG Dielsdorf 100%
Syngenta Agroservices Asia AG2 Basel 100%
Syngenta Finance AG2 Basel 100%
Syngenta Participations AG2 Basel 100%
Syngenta South Asia AG2 Basel 100%
Ukraine
Syngenta Limited Liability Company Kiev 100%
United Kingdom
Syngenta Limited Bracknell 100%
Syngenta UK Limited Fulbourn 100%
USA
Syngenta Crop Protection, LLC Wilmington 100%
Syngenta Seeds, LLC Wilmington 100%
Syngenta Corporation Wilmington 100%
1 Except for the merger of Nidera Seeds Argentina SAU into Syngenta Agro S.A., the capital and voting rights in 2020 have not changed compared to 2019. Syngenta (Pakistan) Ltd. has been included in the list for 2020 as the company reported sales in excess of USD 100 million in 2020.
2 Direct holding of Syngenta AG
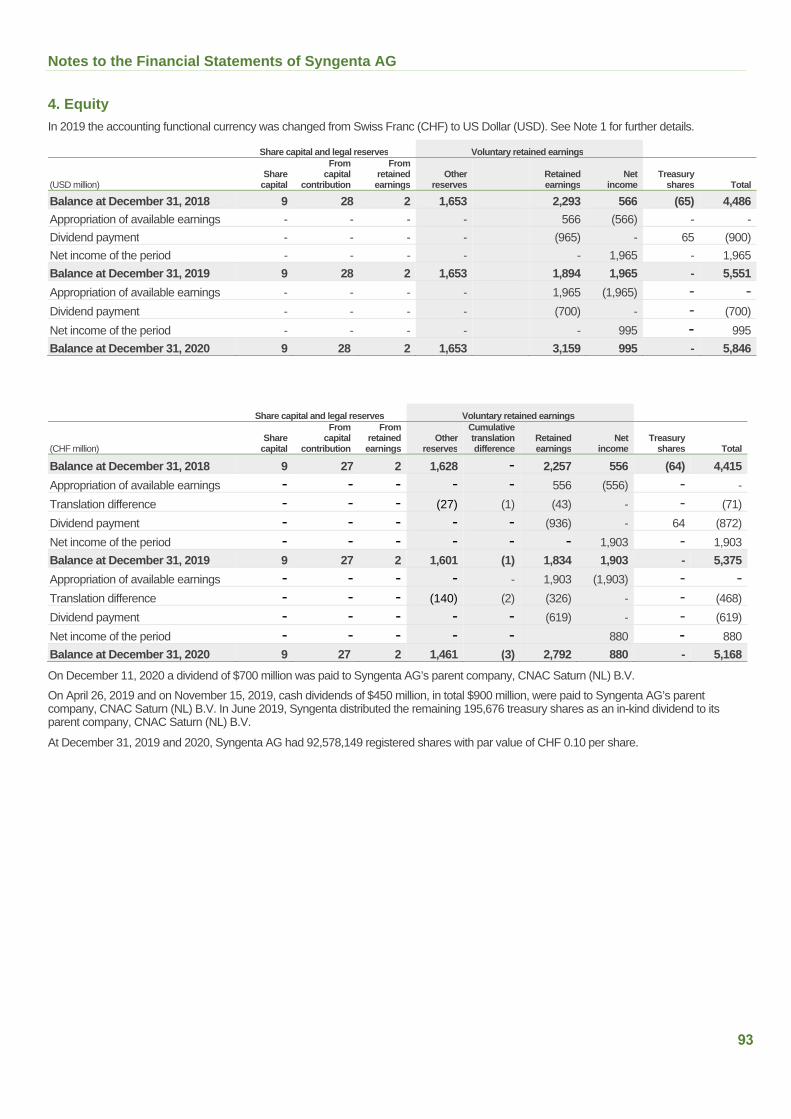
Notes to the Financial Statements of Syngenta AG
93
4. Equity
In 2019 the accounting functional currency was changed from Swiss Franc (CHF) to US Dollar (USD). See Note 1 for further details.
Share capital and legal reserves Voluntary retained earnings
(USD million) Share
capital
From capital
contribution
From retained earnings
Other reserves
Retained earnings
Net income
Treasury shares Total
Balance at December 31, 2018 9 28 2 1,653 2,293 566 (65) 4,486
Appropriation of available earnings - - - - 566 (566) - -
Dividend payment - - - - (965) - 65 (900)
Net income of the period - - - - - 1,965 - 1,965
Balance at December 31, 2019 9 28 2 1,653 1,894 1,965 - 5,551
Appropriation of available earnings - - - - 1,965 (1,965) - - Dividend payment - - - - (700) - - (700)
Net income of the period - - - - - 995 - 995
Balance at December 31, 2020 9 28 2 1,653 3,159 995 - 5,846
Share capital and legal reserves Voluntary retained earnings
(CHF million) Share
capital
From capital
contribution
From retained earnings
Other reserves
Cumulative translation difference
Retained earnings
Net income
Treasury shares Total
Balance at December 31, 2018 9 27 2 1,628 - 2,257 556 (64) 4,415
Appropriation of available earnings - - - - - 556 (556) - -
Translation difference - - - (27) (1) (43) - - (71)
Dividend payment - - - - - (936) - 64 (872)
Net income of the period - - - - - - 1,903 - 1,903
Balance at December 31, 2019 9 27 2 1,601 (1) 1,834 1,903 - 5,375
Appropriation of available earnings - - - - - 1,903 (1,903) - - Translation difference - - - (140) (2) (326) - - (468)
Dividend payment - - - - - (619) - - (619)
Net income of the period - - - - - 880 - 880
Balance at December 31, 2020 9 27 2 1,461 (3) 2,792 880 - 5,168
On December 11, 2020 a dividend of $700 million was paid to Syngenta AG’s parent company, CNAC Saturn (NL) B.V.
On April 26, 2019 and on November 15, 2019, cash dividends of $450 million, in total $900 million, were paid to Syngenta AG’s parent company, CNAC Saturn (NL) B.V. In June 2019, Syngenta distributed the remaining 195,676 treasury shares as an in-kind dividend to its parent company, CNAC Saturn (NL) B.V.
At December 31, 2019 and 2020, Syngenta AG had 92,578,149 registered shares with par value of CHF 0.10 per share.
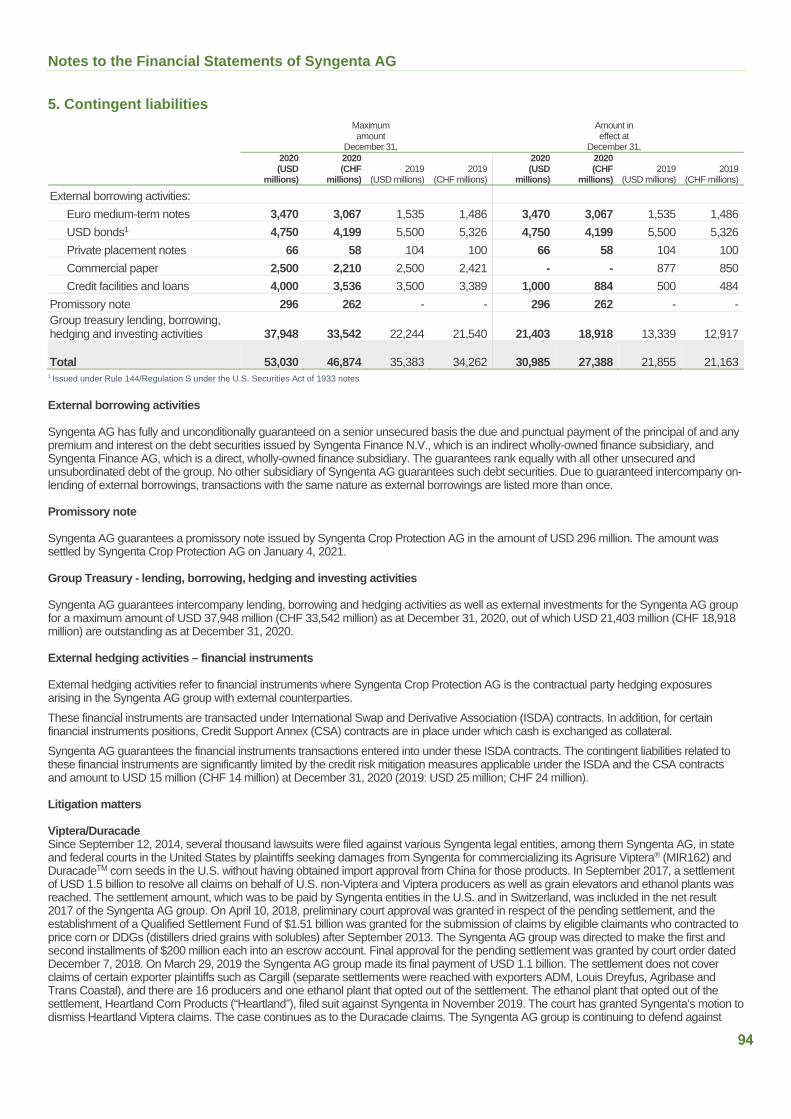
Notes to the Financial Statements of Syngenta AG
94
5. Contingent liabilities
Maximumamount
December 31,
Amount in effect at
December 31,
2020 (USD
millions)
2020 (CHF
millions) 2019
(USD millions) 2019
(CHF millions)
2020 (USD
millions)
2020 (CHF
millions) 2019
(USD millions) 2019
(CHF millions)
External borrowing activities:
Euro medium-term notes 3,470 3,067 1,535 1,486 3,470 3,067 1,535 1,486
USD bonds1 4,750 4,199 5,500 5,326 4,750 4,199 5,500 5,326
Private placement notes 66 58 104 100 66 58 104 100
Commercial paper 2,500 2,210 2,500 2,421 - - 877 850
Credit facilities and loans 4,000 3,536 3,500 3,389 1,000 884 500 484
Promissory note 296 262 - - 296 262 - -
Group treasury lending, borrowing, hedging and investing activities 37,948 33,542 22,244 21,540 21,403 18,918 13,339 12,917
Total 53,030 46,874 35,383 34,262 30,985 27,388 21,855 21,163 1 Issued under Rule 144/Regulation S under the U.S. Securities Act of 1933 notes
External borrowing activities
Syngenta AG has fully and unconditionally guaranteed on a senior unsecured basis the due and punctual payment of the principal of and any premium and interest on the debt securities issued by Syngenta Finance N.V., which is an indirect wholly-owned finance subsidiary, and Syngenta Finance AG, which is a direct, wholly-owned finance subsidiary. The guarantees rank equally with all other unsecured and unsubordinated debt of the group. No other subsidiary of Syngenta AG guarantees such debt securities. Due to guaranteed intercompany on-lending of external borrowings, transactions with the same nature as external borrowings are listed more than once.
Promissory note
Syngenta AG guarantees a promissory note issued by Syngenta Crop Protection AG in the amount of USD 296 million. The amount wassettled by Syngenta Crop Protection AG on January 4, 2021.
Group Treasury - lending, borrowing, hedging and investing activities
Syngenta AG guarantees intercompany lending, borrowing and hedging activities as well as external investments for the Syngenta AG group for a maximum amount of USD 37,948 million (CHF 33,542 million) as at December 31, 2020, out of which USD 21,403 million (CHF 18,918 million) are outstanding as at December 31, 2020.
External hedging activities – financial instruments
External hedging activities refer to financial instruments where Syngenta Crop Protection AG is the contractual party hedging exposures arising in the Syngenta AG group with external counterparties.
These financial instruments are transacted under International Swap and Derivative Association (ISDA) contracts. In addition, for certain financial instruments positions, Credit Support Annex (CSA) contracts are in place under which cash is exchanged as collateral.
Syngenta AG guarantees the financial instruments transactions entered into under these ISDA contracts. The contingent liabilities related to these financial instruments are significantly limited by the credit risk mitigation measures applicable under the ISDA and the CSA contracts and amount to USD 15 million (CHF 14 million) at December 31, 2020 (2019: USD 25 million; CHF 24 million).
Litigation matters
Viptera/Duracade Since September 12, 2014, several thousand lawsuits were filed against various Syngenta legal entities, among them Syngenta AG, in state and federal courts in the United States by plaintiffs seeking damages from Syngenta for commercializing its Agrisure Viptera® (MIR162) and DuracadeTM corn seeds in the U.S. without having obtained import approval from China for those products. In September 2017, a settlement of USD 1.5 billion to resolve all claims on behalf of U.S. non-Viptera and Viptera producers as well as grain elevators and ethanol plants was reached. The settlement amount, which was to be paid by Syngenta entities in the U.S. and in Switzerland, was included in the net result 2017 of the Syngenta AG group. On April 10, 2018, preliminary court approval was granted in respect of the pending settlement, and the establishment of a Qualified Settlement Fund of $1.51 billion was granted for the submission of claims by eligible claimants who contracted to price corn or DDGs (distillers dried grains with solubles) after September 2013. The Syngenta AG group was directed to make the first and second installments of $200 million each into an escrow account. Final approval for the pending settlement was granted by court order dated December 7, 2018. On March 29, 2019 the Syngenta AG group made its final payment of USD 1.1 billion. The settlement does not cover claims of certain exporter plaintiffs such as Cargill (separate settlements were reached with exporters ADM, Louis Dreyfus, Agribase andTrans Coastal), and there are 16 producers and one ethanol plant that opted out of the settlement. The ethanol plant that opted out of the settlement, Heartland Corn Products (“Heartland”), filed suit against Syngenta in November 2019. The court has granted Syngenta’s motion to dismiss Heartland Viptera claims. The case continues as to the Duracade claims. The Syngenta AG group is continuing to defend against

Notes to the Financial Statements of Syngenta AG
95
claims of exporters and plaintiffs that opted out of the settlement. It strongly believes that those claims are without merit and will vigorously defend the lawsuits.
Putative class actions similar to those in the U.S. were filed in Ontario and Quebec, Canada, against Syngenta Canada Inc. and Syngenta AG in December 2015 and February 2017, respectively. In the Ontario action, the judge granted Syngenta’s motion to strike and, by decision dated November 28, 2018, dismissed the action in its entirety. The plaintiff appealed and, while the Court of Appeal denied plaintiff’s appeal of the lower court’s decision dismissing the claim as to the negligent misrepresentation and Competition Act claims, it granted the appeal as to the premature commercialization claim which would allow the lawsuit to continue as to that claim alone. The Syngenta AG group filed the documents necessary to seek leave to appeal the Court of Appeal’s decision to the Supreme Court of Canada. On December 10, 2020, the Supreme Court of Canada denied Syngenta’s application for leave to appeal. The Quebec action is at a very early stage. The Canadianactions are not covered by the settlement in the U.S. The Syngenta AG group is continuing to vigorously defend against the Canadian actions and strongly believes that they are without merit.
AtrazineIn August 2013, a personal injury complaint relating to atrazine was filed under seal in St. Clair County, Illinois, State Court on behalf of an unnamed minor and his parents against Syngenta Crop Protection LLC, Syngenta AG and certain dealers and distributors. The Court granted the minor permission to proceed in the public record under the fictitious name “James Doe” - and for his parents to use the names “Jane Doe” and “John Doe”. The lawsuit alleges that James Doe’s congenital birth defect, hypospadias, was caused by his mother consuming atrazine contaminated drinking water while she was pregnant. The complaint alleges public nuisance, strict liability, and negligence and seeks unspecified damages together with the costs of suit. Fact discovery in the litigation started in early 2014 and is continuing. Syngenta strongly believes that the claims are without merit and is vigorously defending against the action.
Paraquat On September 15, 2017, a complaint was filed in St. Clair County, Illinois state court on behalf of plaintiffs Thomas Hoffmann and Diana Hoffmann against Syngenta Crop Protection, LLC; Syngenta AG; and Growmark, Inc. The complaint alleges that Mr. Hoffmann suffers from Parkinson’s disease caused by chronic exposure to the herbicide paraquat while working as a corn, soybean, and wheat farmer in Illinois. On October 6, 2017, an amended complaint was filed in St. Clair County, Illinois state court on behalf of twelve plaintiffs (seven men who are said to have been diagnosed with Parkinson’s disease and five of their wives) against Syngenta Crop Protection LLC, Syngenta AG and certain dealers and distributors. The complaint alleges that the seven men suffer from Parkinson’s disease due to chronic exposure to paraquat and states the following counts: (1) Strict Liability – Design Defect; (2) Strict Liability – Failure to Warn; (3) Negligence; (4) Public Nuisance; (5) Consumer Fraud & Deceptive Business Practices Act; and (6) Breach of Implied Warranty of Merchantability. The Syngenta AG group’s motion to dismiss was denied by court order dated July 31, 2018, and the case is now at the discovery stage. In December 2018, a complaint was filed in St. Clair County, Illinois state court on behalf of plaintiffs Marvin Wendler and Lorena Wendler against Syngenta Crop Protection, LLC, Syngenta AG, and certain dealers and distributors. The complaint asserts the same claims as the Hoffmann complaint. Also, in December 2018, a complaint was filed in St. Clair County, Illinois state court on behalf of plaintiffs Lloyd Pulcher and Patricia Pulcher against Syngenta AG and a distributor. The complaint asserts the same claims as the Hoffmann complaint. Syngenta Crop Protection, LLC filed its answer to the Wendler complaint in February 2019, and Syngenta AG filed its answers to the two complaints, Wendler and Pulcher, in March 2019.
In April 2019, ten complaints were filed in California state court on behalf of 16 plaintiffs (including ten men who are said to have been diagnosed with Parkinson’s disease and six of their wives). The complaints name Syngenta AG and Syngenta Crop Protection LLC andvarious distributors. The ten California complaints allege the following counts: (1) Strict Products Liability; (2) Negligence; (3) Public Nuisance; (4) California Consumer Legal Remedies Act; and (5) Breach of Implied Warranty of Merchantability. The California cases have been consolidated for pretrial purposes. On December 23, 2019, the court denied defendants’ motion to dismiss. No case schedule has been set and the California cases remain at an early stage. In late 2020, two of the complaints were dismissed because the plaintiffs passed away.
On July 16, 2020, the state court presiding over the St. Clair County, Illinois cases dismissed without prejudice the claims brought by Diana Hoffmann, individually and as administrator of the Estate of Thomas Hoffmann, and three other plaintiffs pursuant to a motion for withdrawal filed by those plaintiffs.
On July 22, 2020, a complaint was filed in Scott County, Missouri on behalf of two plaintiffs (a married couple). The complaint names Syngenta AG, Syngenta Corporation, Syngenta Crop Protection LLC, and Chevron USA, Inc. The plaintiffs allege the following counts: (1) Strict Liability in Tort - Design Defect; (2) Strict Liability in Tort - Failure to Warn; (3) Negligence; (4) Breach of Implied Warranty; and (5) Loss of Consortium. The case was removed to the Eastern District of Missouri on July 29, 2020, and Syngenta filed a motion to dismiss on September 9, 2020. The motion to dismiss is still pending, and no case schedule has been set.
On December 16–17, 2020, six additional complaints were filed in California state court on behalf of nine plaintiffs (including 6 men who are said to have been diagnosed with Parkinson’s disease and 3 of their wives). The complaints name Syngenta AG and Syngenta Crop Protection LLC and variously name Chevron USA, Inc. and/or Wilbur-Ellis Company, LLC as additional defendants. These complaints do not include a California Consumer Legal Remedies Act claim, but they otherwise allege the same counts as the April 2019 California complaints.
On December 22, 2020, a complaint was filed in St. Clair County, Illinois state court on behalf of plaintiffs Michael Kearns and Jean Kearns against Syngenta Crop Protection, LLC; Syngenta AG; and Growmark, Inc. The complaint alleges the following counts: (1) Strict Liability - Design Defect; (2) Strict Liability - Failure to Warn; (3) Negligence; (4) Public Nuisance; (5) Consumer Fraud and Deceptive Business Practices Act; and (6) Breach of Implied Warranty of Merchantability.
The Syngenta AG group strongly believes that the claims are without merit and is vigorously defending against the actions.
Canada beekeeper lawsuits In September 2014, a claim was filed in Ontario, Canada by two proposed representative members on behalf of a putative class comprising all beekeepers who have owned or continue to own and operate honey producing, pollinating, and/or queen bee rearing businesses in Canada since January 1, 2006, against a number of Syngenta AG group legal entities together with certain entities of a second manufacturer of neonicotinoid insecticides. Plaintiffs allege negligence through the sale by that manufacturer and by Syngenta AG group of products containing such insecticides in the knowledge that they would be injurious to bees and by virtue of misrepresentations and concealment relating thereto. Plaintiffs claim 400 million Canadian dollars ($314 million at December 31, 2020 exchange rates) general and 50 million
Notes to the Financial Statements of Syngenta AG
96
Canadian dollars ($39 million at December 31, 2020 exchange rates) punitive damages. The pleadings in the Ontario proceedings were subsequently amended by plaintiffs’ counsel to add waiver of tort and unlawful conspiracy to the single cause of action, negligence, which was previously pleaded. Both of the additional causes of action are ancillary to and largely dependent on the negligence claim. The class has not yet been authorized. The Syngenta AG group strongly believes that the claims are without merit and is vigorously defending against the action.
In October 2014, a Motion for Authorization was filed by the same firm of plaintiffs’ counsel in Montréal, Quebec seeking permission to bring a similar class proceeding in that province. The proposed representative plaintiff operates a family business specialized in the breeding of queen bees. The Quebec litigation closely resembles the original Ontario lawsuit claiming negligence except that, rather than a nationwide class, it alleges a class limited to Quebec. At this early stage damages are unspecified. The Motion for Authorization was argued in November 2017. The Quebec class has been authorized on August 20, 2018, and notices have been sent to potential class members. Plaintiffs’ motion to add Syngenta AG as a defendant has been granted. The Syngenta AG group strongly believes that the claims are without merit and is vigorously defending against the action.
Other In a Deed of Guarantee dated December 6, 2017, Syngenta AG guaranteed to Syngenta Pensions Trustee Limited (the “Fund”), that if Syngenta Limited, or other Syngenta affiliates (“Employers”), which participate in the Fund, do not pay punctually amounts they owe to the Fund, then Syngenta AG will pay that amount instead of the Employers.
In a Deed of Guarantee dated December 23, 2019, Syngenta AG guaranteed to Jealott’s Hill Unit Trust the rental payments for the Jealott’s Hill research station to be paid by Syngenta Limited.
Syngenta AG is part of a group of Swiss entities of Syngenta which are jointly and severally liable for the whole Swiss VAT amount due to the Swiss Tax authorities by this group.
6. Full-time equivalents
Syngenta AG does not have any employees.
7. Subsequent events
On January 25, 2021, in order to pro-actively manage its debt portfolio and reduce future interest expense, Syngenta Finance N.V., which is an indirect wholly-owned finance subsidiary, commenced a cash tender offer for any and all of its outstanding 4.375% USD Notes 2042 and 5.676% USD bond 2048 for which Syngenta AG acted as guarantor. The tender offer expired on January 29, 2021 with valid tenders received totaling approximately $278 million.
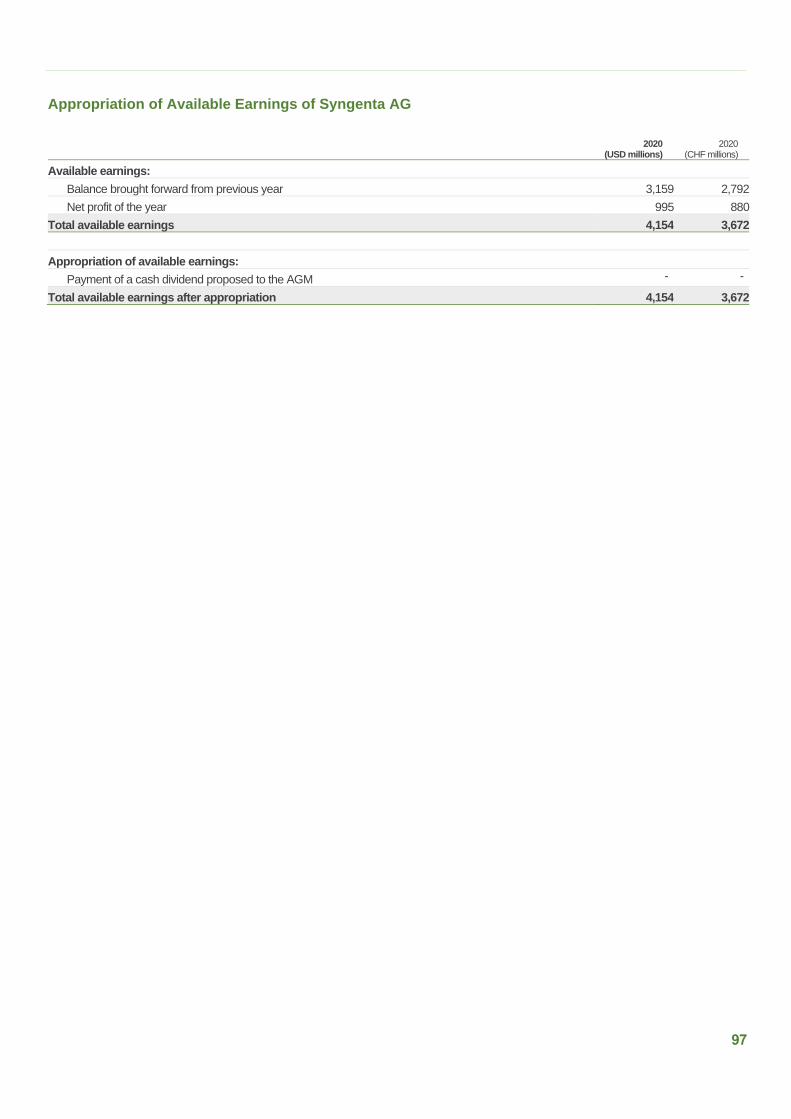
97
Appropriation of Available Earnings of Syngenta AG
2020 (USD millions)
2020 (CHF millions)
Available earnings:
Balance brought forward from previous year 3,159 2,792
Net profit of the year 995 880
Total available earnings 4,154 3,672
Appropriation of available earnings:
Payment of a cash dividend proposed to the AGM - -
Total available earnings after appropriation 4,154 3,672
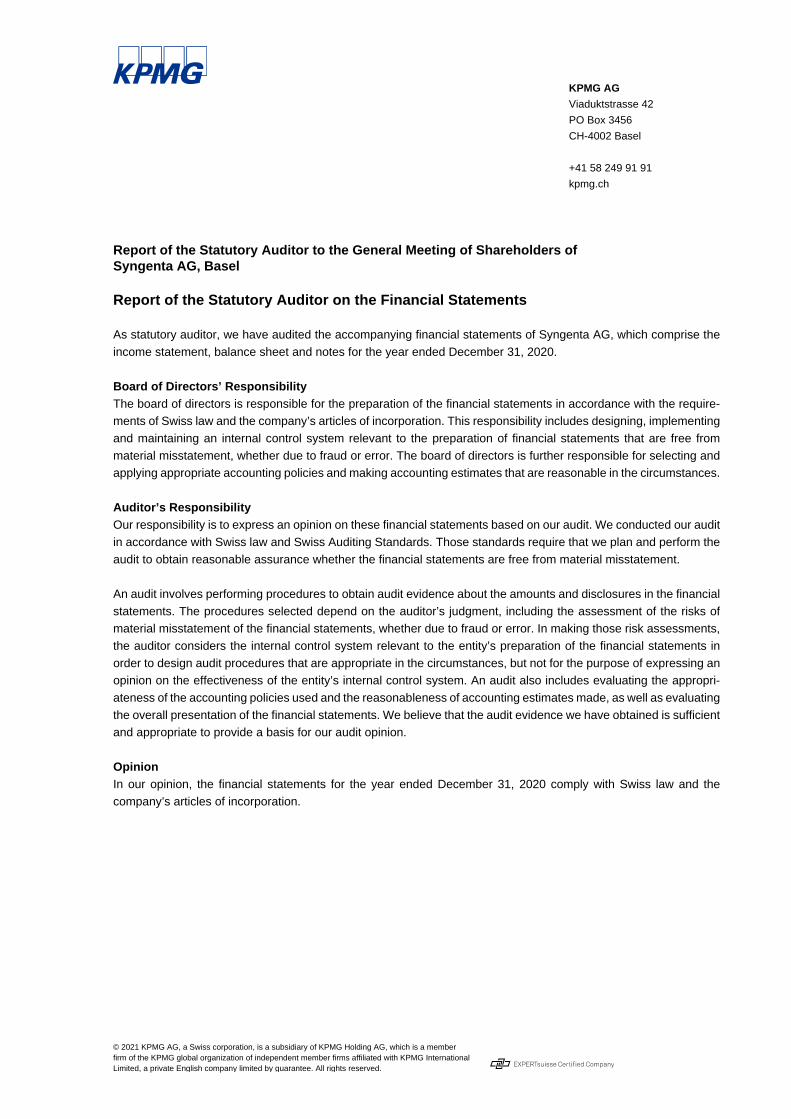
© 2021 KPMG AG, a Swiss corporation, is a subsidiary of KPMG Holding AG, which is a member
firm of the KPMG global organization of independent member firms affiliated with KPMG International
Limited, a private English company limited by guarantee. All rights reserved.
KPMG AG
Viaduktstrasse 42
PO Box 3456
CH-4002 Basel
+41 58 249 91 91
kpmg.ch
Report of the Statutory Auditor to the General Meeting of Shareholders of
Syngenta AG, Basel
Report of the Statutory Auditor on the Financial Statements
As statutory auditor, we have audited the accompanying financial statements of Syngenta AG, which comprise the
income statement, balance sheet and notes for the year ended December 31, 2020.
Board of Directors’ Responsibility
The board of directors is responsible for the preparation of the financial statements in accordance with the require-
ments of Swiss law and the company’s articles of incorporation. This responsibility includes designing, implementing
and maintaining an internal control system relevant to the preparation of financial statements that are free from
material misstatement, whether due to fraud or error. The board of directors is further responsible for selecting and
applying appropriate accounting policies and making accounting estimates that are reasonable in the circumstances.
Auditor’s Responsibility
Our responsibility is to express an opinion on these financial statements based on our audit. We conducted our audit
in accordance with Swiss law and Swiss Auditing Standards. Those standards require that we plan and perform the
audit to obtain reasonable assurance whether the financial statements are free from material misstatement.
An audit involves performing procedures to obtain audit evidence about the amounts and disclosures in the financial
statements. The procedures selected depend on the auditor’s judgment, including the assessment of the risks of
material misstatement of the financial statements, whether due to fraud or error. In making those risk assessments,
the auditor considers the internal control system relevant to the entity’s preparation of the financial statements in
order to design audit procedures that are appropriate in the circumstances, but not for the purpose of expressing an
opinion on the effectiveness of the entity’s internal control system. An audit also includes evaluating the appropri-
ateness of the accounting policies used and the reasonableness of accounting estimates made, as well as evaluating
the overall presentation of the financial statements. We believe that the audit evidence we have obtained is sufficient
and appropriate to provide a basis for our audit opinion.
Opinion
In our opinion, the financial statements for the year ended December 31, 2020 comply with Swiss law and the
company’s articles of incorporation.
Syngenta AG, Basel
Report of the Statutory Auditor
on the Financial Statements
to the General Meeting of Shareholders
Report on Other Legal Requirements
We confirm that we meet the legal requirements on licensing according to the Auditor Oversight Act (AOA) and
independence (article 728 CO) and that there are no circumstances incompatible with our independence.
In accordance with article 728a paragraph 1 item 3 CO and Swiss Auditing Standard 890, we confirm that an internal
control system exists, which has been designed for the preparation of financial statements according to the instruc-
tions of the board of directors.
We further confirm that the proposed appropriation of available earnings complies with Swiss law and the company’s
articles of incorporation. We recommend that the financial statements submitted to you be approved.
KPMG AG
Michael Blume
Licensed Audit Expert
Auditor in Charge
Artem Chumakov
Basel, February 3, 2021


Enter your title herSyngenta AG P.O. Box CH-4002 Basel Switzerland
Investor Relations T +41 61 323 2323 F +41 61 323 2424 E [email protected]
Media Relations T +41 61 323 2323 F +41 61 323 2424 E [email protected]
Sustainability E [email protected]
Syngenta switchboard T +41 61 323 1111 F +41 61 323 1212 www.syngenta.com
This publication is available on the Internet: www.syngenta.com
© 2021 Syngenta. All rights reserved. Editorial completion: March 2021
® Registered trademarks of a Syngenta Group Company
™ Trademarks of a Syngenta Group Company
The SYNGENTA wordmark, the SYNGENTA logo and BRINGING PLANT POTENTIAL TO LIFE are trademarks of a Syngenta Group Company
Cautionary statement regarding forward-looking statements: This document contains forward-looking statements, which can be identified by terminology such as “expect”, “would”, “will”, “potential”, “plans”, “prospects”, “estimated”, “aiming”, “on track” and similar expressions. Such statements may be subject to risks and uncertainties that could cause the actual results to differ materially from these statements.