Financial Projections & Valuation. Financial Projections The canvas tells the story of your venture...
30
Financial Projections & Valuation
-
Upload
maria-parsons -
Category
Documents
-
view
218 -
download
2
Transcript of Financial Projections & Valuation. Financial Projections The canvas tells the story of your venture...

Financial Projections
&
Valuation

Financial Projections
The canvas tells the story of your venture in a structured way.
Income Statement
Balance Sheet
Cash flow
The financial projections are a model of your venture, showing how your assumptions will play out.
A change in one must affect
the other

Income statement
How much you sold
Your cost for the units you sold
How much is left over
Things you spent money on whether or not you
sold anything
Profit (or in this case loss)
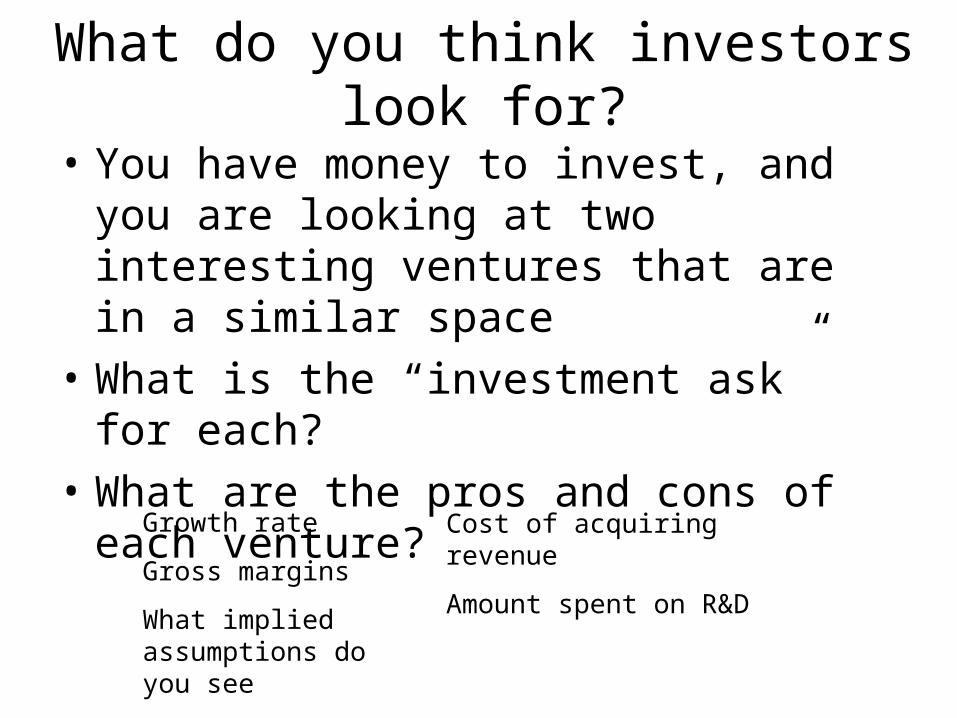
What do you think investors look for?
• You have money to invest, and you are looking at two interesting ventures that are in a similar space
• What is the “investment ask” for each?
• What are the pros and cons of each venture?
Growth rate
Gross margins
What implied assumptions do you see
Cost of acquiring revenue
Amount spent on R&D

What are investors looking for in your financial projections?
• A growth rate that is interesting• Attractive gross margins (50-60% is good if you
are a business with R&D)• Red ink (losses) that match your funding request
• The “Smell test” re assumptions:– Based in reality– Well thought-out and reasonable– You know your assumptions and have a plan for
validating them

Forecasting Revenue – one common approach
We’ve developed an innovative new free-range donut. We plan to open a chain of free-range donut shops starting in Vancouver.
Our revenue projection:
The market size is $100 million in Vancouver.
Conservatively, all we need is 1% of the market.
So our annual sales in Vancouver will be $1,000,000.
We’ll expand our market share, and add cities at 2 per year.
With 10 cities we will be at $15,000,000 annually.
Then we’ll expand into the US.

Forecasting Revenue – better:
A DRIVER is a business lever you can adjust to affect your revenue.
PRICE: for each “unit” sold
CHANNEL: is someone taking a percentage?
Number of UNITS: The number of units you sell increases over time. What are the actions you are taking to cause this?
Consider your initial assumptions to be hypotheses, and determine how to test them. Your test results bring credibility. And these will be your operating metrics in future!

Example: a Web businessDriver Value
Monthly Google searches 1,000,000
Other search engine searches 300,000
Total searches 1,300,000
DRIVER: Clickthru rate 5%
Monthly traffic from search 65,000 (5% of 1.3MM)
Other traffic (Twitter, Facebook..) 26,000
Total traffic 91,000
DRIVER: Conversion - % that buy 10%
PRICE: Revenue per new customer $0.99
New revenue per month $9,009
Revenue/mo from repeat customers $4,000
DRIVER: Attrition rate 10% - $400
Total revenue per month $12,609
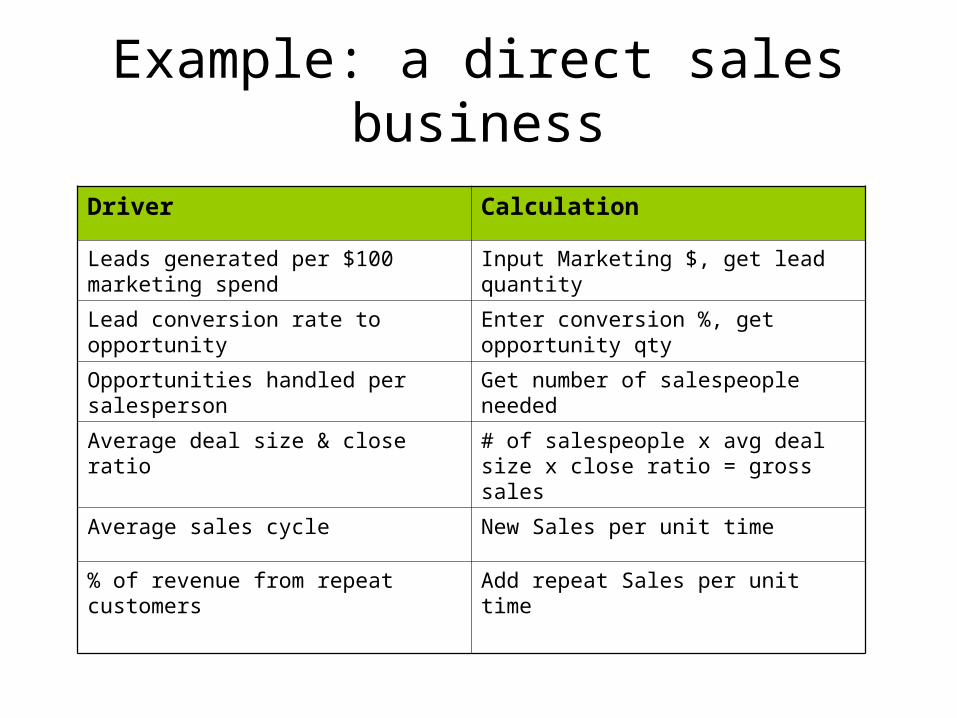
Example: a direct sales business
Driver Calculation
Leads generated per $100 marketing spend
Input Marketing $, get lead quantity
Lead conversion rate to opportunity Enter conversion %, get opportunity qty
Opportunities handled per salesperson Get number of salespeople needed
Average deal size & close ratio # of salespeople x avg deal size x close ratio = gross sales
Average sales cycle New Sales per unit time
% of revenue from repeat customers Add repeat Sales per unit time

Channel refresher
12
Cost of Goods ExpensesExpenses Reseller
Source: Mark Leslie, Stanford GSB
ExpensesExpenses
Price paidby buyer(100%)
Cost of Goods (COGS)
Reseller Channel
Direct Sales
YourRevenue
Price paidby buyer(100%)

Costs
• COGS – Cost of goods sold. – How much does each unit cost?
• Expenses– Amounts you spend each period whether or not you
make any sales
• Capital– One time purchases of expensive things like
manufacturing machinery

Jobs to be done
• Think about the “jobs to be done”
• Each “job to be done” has a cost
• Decide who is going to do the job. If indirect channel, then this reduces your revenue rather than increasing your cost.
• If you have indirect channel – do they do the jobs that need to be done completely, partly, or not at all?

See template spreadsheet.

Some expenses to think about
Insurance Consultants
Rent Patent costs
Telecom costs Hosting
Legal Salaries
Accounting Benefits
Travel Commissions
Marketing Bonuses
Trade shows

Financial projections –session 2

Things to consider (1)BMC sections are inter-dependent. A change in
one section will impact other sections.
Direct channel: higher revenue, higher cost.
Indirect channel: lower revenue, lower cost.
Self serve model: low service costs; consider cust acquisition cost.
Hi touch model: high service cost.
Luxury customers: likely hi-touch model. Hi margin.
Commodity customers: lower cost model, higher volume, lower margin.
Visible product: brand building costs.
Embedded or licensed product: IP protection.
Product design
R&D. In house? Outsourced?
Bloggers
OEMs
Manufacturing
Hosting

Things to consider (2)• Think of your costs being driven by revenue (not
the other way around). – If you could double revenue by doubling salespeople,
you’d just keep adding people until you employed the population of the world.
• Watch out for Butterfly Effect – where in your financial projection model will a relatively small change in assumption lead to a big change in results? – Investors will find these. It usually ends badly if you
aren’t prepared to address them.

Financial projections - summary
1. Your financial projections must closely reflect your business model canvas. They tell the same story!
2. Investors look for growth rate, high margins, realistic and test-able assumptions.
3. Revenue should be built bottom-up from your business drivers.
4. Costs should be driven by achievement of revenue.
5. Understand the major sensitivities in your model.

Next up: Valuation

Valuation for Startups
You need to raise money. How much of the company will you
have to give an investor in exchange for funding?
More??

Pre-money and post-money valuation
• Pre-money: the value of the venture before the investor’s money
• Post-money: the value of the venture immediately after the investor’s money
• Example:– Venture is worth $300,000 pre-money– Investor puts in $100,000– Venture is worth $400,000 post-money– What percentage does the investor now own?

Valuation for Startups
You are offering investors an opportunity to participate in your exciting new startup.
What are investors buying when they invest in a raw startup?

Valuation for Startups
What investors are buying in a raw startup:• A good idea together with a good plan• A committed team• Founders with experience• Founders with prior success• Traction (users, revenue, channel…)
The more of these you have, the greater the valuation you may be able to achieve. And
of course, vice versa.
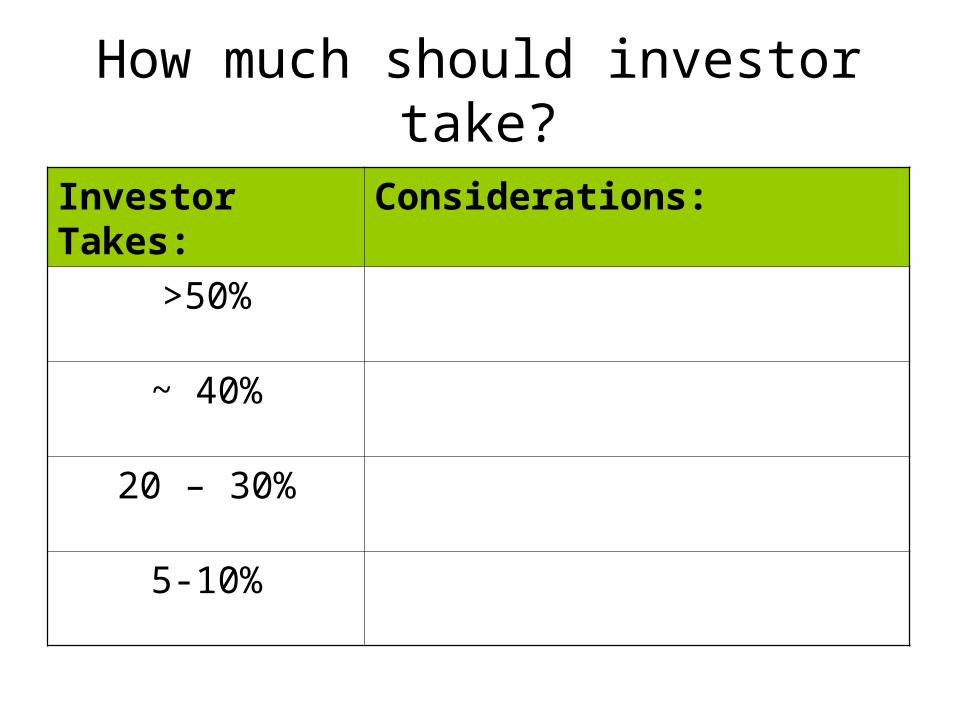
How much should investor take?
Investor Takes: Considerations:
>50%
~ 40%
20 – 30%
5-10%

How much should investor take?
Investor Takes: Considerations:
>50% Founder(s) lose control. Reduced incentive to work hard.
~ 40% Very little equity left for next financing round.
20 - 30% Likely range for substantial seed investment
5-10% Small early investment

Valuation & Investment Examples
Incubator7%
Angel15%
Super angel or group30%
$20K $100K $300K
$290K
$1,000K
$665K
Investment
Post-money
Valuation
Ownership
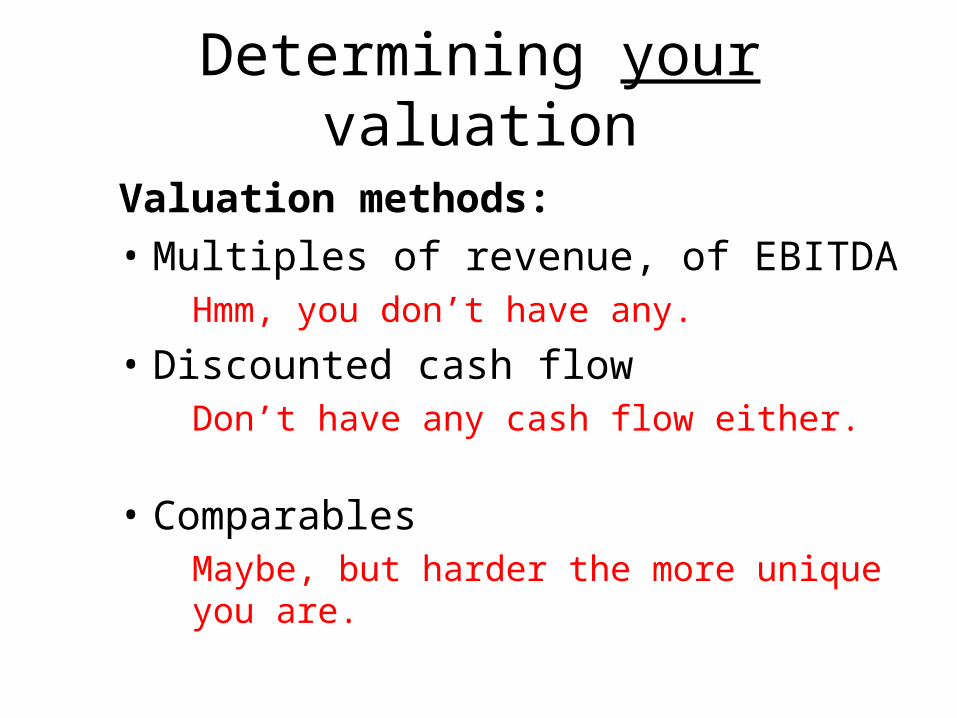
Determining your valuation
Valuation methods:
• Multiples of revenue, of EBITDAHmm, you don’t have any.
• Discounted cash flowDon’t have any cash flow either.
• ComparablesMaybe, but harder the more unique you are.

First-money-in valuation
• If this is the first money going into the venture, valuation is determined simply by:– The amount of money you raise– The ownership percentage it bought
• Among all the uncertainties, you must be able to show the minimum amount of money you need.
What is the minimumamount of money you need
in the first 18 months, to grow to the next stage?

First-money-in valuation
• Example: you’ve determined you need $150,000 in the first 18 months. – Consider the range of ownership you’ll (realistically)
need to give away– At 15%, your valuation is $150,000/15% = $1,000,000– At 30%, your valuation is $150,000/30% = $500,000
30%30%
Worth $150K
100%100%
Worth $500K

Team Valuation Exercise
• From your team financial projections:– How much cash do you need in the first 18 months?
When you ask investors for money, this is how much you need.
– What is your valuation range?– What percentage will you offer and why?
• Each team will present, first their elevator pitch (not an investor pitch!), followed by an explanation of the above valuation/percentage. You will have 120 seconds.