Financial Planning for Fishing Families - TAA Online … Planning for Fishing Families. 1 ... then...
31
Financial Planning for Fishing Families
Transcript of Financial Planning for Fishing Families - TAA Online … Planning for Fishing Families. 1 ... then...

Financial Planning forFishing Families
1
Dedicated to helping Maine small business succeed.
Trade Adjustment Assistance Program -- 2011
A Financial Planning Workshop for Fishing Families
Maine Small Business Development Centers(Maine SBDC)
Maine SBDC is a partnership program of the U. S. Small Business Administration (SBA) in association with the SBA/SBDC, the Maine Department of Economic and Community Development (DECD), the University of Southern Maine (USM), and leading economic and/or community development hosting organizations (Hosts), with support from the University of Maine (UMaine). Administered by USM's School of Business, Maine SBDC operates a network of service centers and outreach offices located conveniently throughout the State.
2
Dedicated to helping Maine small business succeed.

2
In collaboration with:
Who is SCORE and what does it do?
Volunteers with broad background of business and professional experience,
Provide business counseling at no charge, whenever you need it.
Offers workshops at moderate cost on:
Visit SCORE’s website: www.scoremaine.com to learn more
3
PO Box 268, Water StreetWiscasset, ME 04578
Phone: 207-882-4340 Fax: 207-882-4456www.ceimaine.org
4

3
5
David R. [email protected]
Center Director and Certified Business Counselor
Maine SBDC – Coastal Enterprises, Inc.
207-882-4340
Key issues for the lobster and shrimp industries?
Price at the boat
Cost of Fuel Cost of bait Status of market
Fishing regulations (season, days at sea, etc.) Lack of financing for processors Availability of other purchasers
Availability of financing to Maine fishermen
6

4
Whatever your problem might be, dealing with it requires you to plan
If you don’t know where you’re going any route will get you there
So, first you need to decide what it is you want to do and then develop a plan for achieving that goal
7
Success of your plan depends upon the data that forms it
You need to know the key facts that surround the problem – whether it is price at the boat, or the cost of fuel and bait
Not just what those numbers are right now, but the forces that will move those numbers – either up or down – during the current season, and perhaps for several seasons to come
If you don’t know those numbers, and are not conscious of those forces you won’t be able to plan ahead
8

5
Focus is absolutely essential – On those aspects of your business that you can impact Don’t be distracted by things you cannot “fix”
This is why knowing your “numbers” is so vital. If a cost is out-of-line you may not know it, and therefore won’t correct it.
Sustained Effort also essential –
You work at pulling traps or dragging nets almost every day. You’ve got to do the same with the details of your business. Look at them every day, figure out what you can do to improve.
9
Those are the basic reasons you need to develop a plan, but there are others. If you want or need to borrow money, the lender will want to see a
business plan If several of you are going to establish a “co-op”, you will want a
plan that includes all of you If you think you can afford a stern man, you best plan and project to
be sure you can pay him, or her If you are considering a partner, the two of you will need a plan to
be certain the business will achieve the goals for each and both of you
If you are thinking about expanding your business a plan will help you do it, and guide you away from unnecessary pitfalls
10

6
Managing your finances will be covered later in this presentation, but we emphasize how important it is to maintain accurate, up-to-date financial records.
You need: Balance sheet – preferably monthly, at least quarterly Profit and loss statement – preferably monthly Cash flow projections – for any plan, 12 months minimum,
24 months better, 36 months bestThis means accounting support: QuickBooks (or comparable accounting software) A good accountant Probably both!
11
Preparing the Financial Projections
The financial projections are a set of spreadsheetsNeed Microsoft Excel or equivalent software
That provide key financial data about the business; and
Should be supported with written statements of each “critical assumption” underlying the financial projections
12

7
Understanding the Terms There are four major financial statements needed: Cash Flow Projection Profit and Loss statement (P & L) Sources/Uses of cash Balance Sheet.
Breakeven analysis may be added.
Each projection serves a particular purpose
Each relates one to another –the numbers must not contradict one another
13
Each financial projection requires “critical assumptions” – write them down so
1st – you know how you arrived at the numbers
2nd – a lender can see how you arrived at the numbers
3rd – when information changes you can adjust the assumptions
14

8
Financial Plan
Cash Flow Projection – Be sure to describe the critical
assumptions that support this and future spreadsheets
Profit/Loss Projection – Pay particular attention to interest
expense and non-cash expenses, such as amortization or
depreciation
Sources and Uses of Cash – Pay particular attention to non-
operating uses of cash, for example owner’s withdrawals,
principal payments on debt
15
Financial Plan - continued
Balance Sheet – “Snapshots” at different points in time
corresponding to cash flow and P & L projections
Break-even analysis – Shows minimum volume required to
cover all expenses or new expenses
Capital equipment requirements – Determine how much
will you need, for what will it be used, with particular
attention to on-going working capital needs
16

9
Cash Accounting versus Accrual Accounting
It is important to understand difference between “cash accounting” and “accrual accounting”
For purposes of the Cash Flow Forecast what you want to know and project is the actual cash on hand at various points of time. “Cash is king!”
But for the P&L, revenues – sales made – are what count, whether you have received the cash or not
17
Cash Accounting Stated simply, cash accounting only measures “cash in” and “cash out” during the time period covered
Sales for which payment not yet received, or bills not yet paid, are NOT included
Sales made in one time period (month of June for example) but payment not received until July or even August are not included until the check is deposited
Purchases of supplies made in one month, but not paid for until the next month are not included in the cash flow projection until payment actually made
18
10
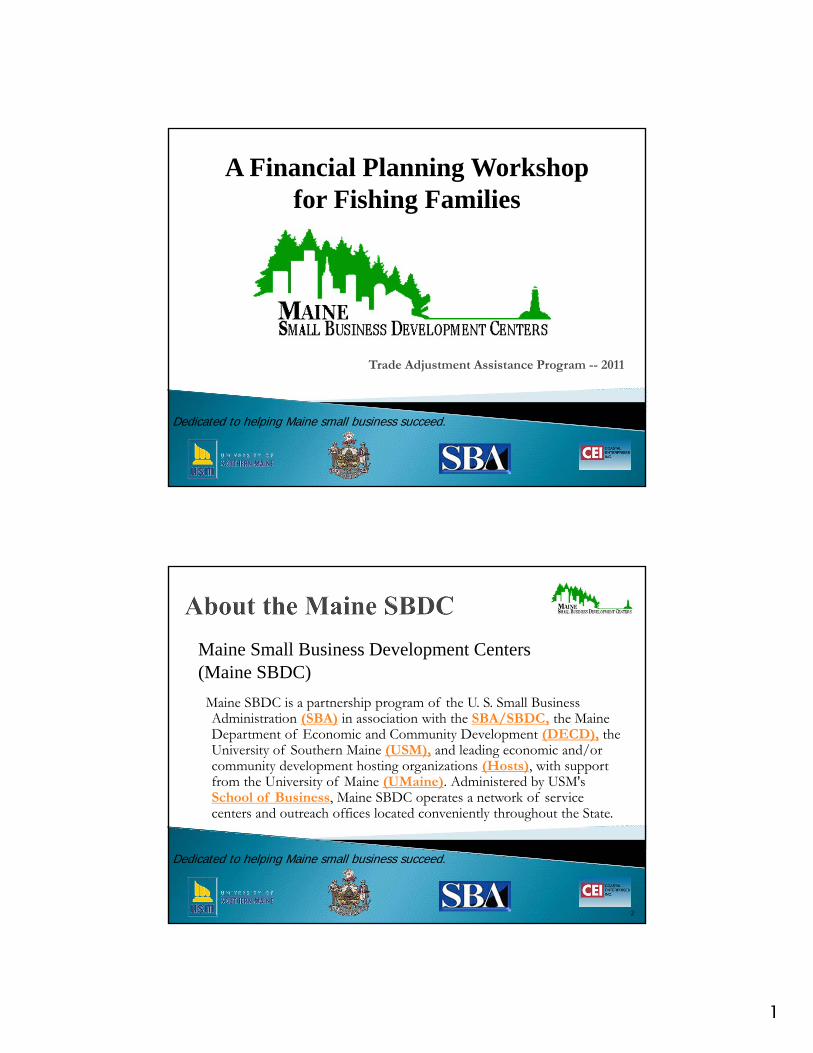
Accrual Accounting
Stated simply, accrual accounting recognizes sales and expenses when they are made, not necessarily when they’re received or paid for
Sales are booked when the sale is made even though payment may not be received for weeks or months
Likewise, expenses are booked when they are incurred, not when they are paid, which could be much later in the future
19
Cash Flow Forecast
This is difficult because it rests on assumptions, particularly about sales and revenues
Should cover a minimum of 12 months, better 24 months, best 36 months. Readers will understand the further out in time the projection the less certain it can be
The cash flow forecasts:Revenues received in cash from all salesCosts actually paid during time period coveredAnd calculates the cash produced/used during
period
20

11
FIRST RULE OF A SUCCESSFUL BUSINESS:
POSITIVE CASH FLOW(more cash in than cash out)
Get this one right and most of the rest takes care of itself!
21
How do you project revenues?
Narrative portion of plan should establish the following:
How many pounds of lobster or shrimp you think you can harvest and sell during the time period
Price per pound you believe will prevail over time period
If prices fluctuate, estimate monthly prices based on past history and “Kentucky windage”
22

12
The world is awash in data, it takes judgment to develop useful information
Your assumptions must be based on information developed by experience and research
Test your assumptions with information you obtain from others and your own experience
Write down/record your assumptions to support projections
Do NOT be reluctant to change assumptions as new/better information is obtained
23
Profit and Loss Statement (Income)
Measures business performance over a specified time period; e.g., monthly, quarterly, semi-annually and annually
Intended to determine taxable income (losses) and is governed by specific accounting and tax principles
Includes non-cash operating expenses, such as depreciation and amortization, for example, depreciation on your boat
24

13
Profit and Loss Statement (continued)
Includes all sales made or purchases contracted during period, even if payment not received or made until after end of period (accrual accounting)
Excludes non-tax deductible cash uses, such as principal payments on debt, owner’s withdrawal of funds
It is NOT the same as a cash flow forecast, although looks much the same
25
Sources and Uses of Funds
This combines data developed in Cash Flow Forecast, Profit & Loss and Balance Sheet
Includes all sources of funds: such as Owner contributions to capital Proceeds from loans Earnings from operations
Includes all uses of funds such as: Payments of loan principal Distributions of earnings to owners/investors Tax payments or distributions
26

14
Balance Sheet
The balance sheet is a “snapshot” of financial condition of the business at specific moments; i.e., end of month, end of quarter, end of year
The balance sheet includes:Assets: Current – cash, bank balances, accounts receivable,
inventory Fixed – land, buildings, machinery & equipment
Liabilities: Current – accounts payable, debts payable within one year Long term – loans/mortgages payable over more than 1
year
27
Balance Sheet (continued)
Owner’s Equity: Original capital paid in, added since beginning Accumulated earnings or losses over period since last
balance sheet (i.e., last 3 months, 6 months or 12 months)
It balances because the sum of the Total Liabilities and the Owner’s Equity MUST equal the Total Assets
The Owner’s Equity is the “plug figure”
28

15
The balance sheet is where the differences between “cash” accounting and “accrual” accounting are reconciled
Sales for which the revenue has not yet been received will be included in Accounts Receivable. They constitute an asset
Expenses which have not yet been paid will be included in Accounts Payable. They constitute a liability.
29
ASSETS = Liabilities + Owner’s Equity
If assets are less than liabilities, Owner’s Equity will be LESS than zero
30

16
Market Value vs. Bank Balance Sheet
The Bank Balance Sheet traditionally reports assets at their original value adjusted by their accumulated depreciation
The Market Value Balance Sheet reports assets at their current market value
They are not necessarily the same!
The Bank Balance Sheet is used for tax purposes while the Market Value Balance Sheet presents a more realistic picture, but it is more difficult to maintain
To keep this presentation simple, however, we’ll assume that the asset values would be the same under either method
31
Let’s develop a simple Cash Flow forecast for a lobsterman who shrimps in the winter
Along with a Profit and Loss Statement for a one-year period
A Balance Sheet showing the beginning of the year and the end of the year, and
A Sources and Uses of Cash for that year
32

17
First the “critical assumptions” that underlay the projected cash flow statement: This lobsterman works by himself, except during the
months June through October He does work 12 months each year, at least on the days
when he can He goes for shrimp between December 1 and April 15 He does not have his own wharf, so he has to pay wharf
fees for access to the water He does NOT have any debt at the moment. The
existence of debt service obviously would change the numbers materially.
33
Second, what information is important enough to be included? The number of pounds of lobster or shrimp landed each
month. The amount he is paid per pound at the wharf The gallons of fuel he is using What he is paying per gallon for fuel How much lobster bait he is using What he is paying for the bait How much he is using the stern man And what the stern man costs
34

18
Why are these important? These are the things most within his “control” The number of pounds he lands, however, is limited by
the number of traps he can set and handle, the number of hours in a day, and the weather
For shrimp and, in some areas, lobster the season may vary
Are there ways to increase the number of pounds landed for each gallon of fuel, or each barrel of bait used?
Could enough more pounds be landed to pay for a stern man for more of the year?
Tracking these numbers over time helps to improve the management of the business from year to year
35
What does having a cash flow projection do to help? It is essential if you want to borrow money. It shows the
lender you will (or will not) be able to pay the money back.
Understanding the numbers helps you decide on ways to improve or strengthen the business – for example Set more traps Invest in better equipment Maybe try shrimp traps Use a stern man more of the year Search for new markets and buyers
Let’s look a sample cash flow projection
36

19
Item Jan Feb March April May June July August Sept October Nov Dec Year
Cash On Hand $4,400.00 $4,830.00 $5,105.00 $5,998.75 $6,211.25 $6,530.00 $7,180.00 $7,555.00 $7,845.00 $8,022.50 $8,700.00 $8,950.00 $4,400.00
Income
# lbs landed 3300 3400 3450 3600 4000 4500 4500 4500 4500 4250 4000 3600 47,600Net Price/pound $3.75 $3.75 $3.75 $3.75 $3.75 $3.75 $3.75 $3.75 $3.75 $3.75 $3.75 $3.75 $3.75Total Dollars $12,375.00 $12,750.00 $12,937.50 $13,500.00 $15,000.00 $16,875.00 $16,875.00 $16,875.00 $16,875.00 $15,937.50 $15,000.00 $13,500.00 $178,500.00Variable Operating Expenses
Boat Fuel: # gals 700 700 725 750 775 800 800 800 800 800 800 750 9,200Price/gallon $2.75 $2.75 $2.75 $2.75 $2.75 $2.75 $2.75 $2.75 $2.75 $2.75 $2.75 $2.75 $2.75Total Dollars $1,925.00 $1,925.00 $1,993.75 $2,062.50 $2,131.25 $2,200.00 $2,200.00 $2,200.00 $2,200.00 $2,200.00 $2,200.00 $2,062.50 $25,300.00Bait: # drums 36 36 38 38 40 42 44 44 44 42 42 36 482price/drum $125.00 $125.00 $125.00 $125.00 $125.00 $125.00 $125.00 $125.00 $125.00 $125.00 $125.00 $125.00 $125.00Total Bait Expense $4,500.00 $4,500.00 $4,750.00 $4,750.00 $5,000.00 $5,250.00 $5,500.00 $5,500.00 $5,500.00 $5,250.00 $5,250.00 $4,500.00 $60,250.00Miscellaneous ExpensesMain. & Repair Boat $500.00 $500.00 $500.00 $500.00 $500.00 $500.00 $500.00 $500.00 $500.00 $500.00 $500.00 $500.00 $6,000.00Main. & Repair Equip $50.00 $50.00 $50.00 $50.00 $50.00 $50.00 $50.00 $50.00 $50.00 $50.00 $50.00 $50.00 $600.00Replace Equip & gear $500.00 $500.00 $500.00 $500.00 $500.00 $500.00 $500.00 $500.00 $500.00 $500.00 $500.00 $500.00 $6,000.00Misc. Supplies $100.00 $100.00 $100.00 $100.00 $100.00 $100.00 $100.00 $100.00 $100.00 $100.00 $100.00 $100.00 $1,200.00Licenses & permits $0.00 $0.00 $0.00 $0.00 $250.00 $265.00 $0.00 $0.00 $0.00 $0.00 $0.00 $75.00 $590.00Total Misc Expense $1,150.00 $1,150.00 $1,150.00 $1,150.00 $1,400.00 $1,415.00 $1,150.00 $1,150.00 $1,150.00 $1,150.00 $1,150.00 $1,225.00 $14,390.00Stern Man - share -$ -$ -$ -$ -$ 1,835.00$ 1,835.00$ 1,835.00$ 1,697.50$ 1,510.00$ -$ -$ $8,712.50Total Var Oper Exps $7,575.00 $7,575.00 $7,893.75 $7,962.50 $8,531.25 $10,700.00 $10,685.00 $10,685.00 $10,547.50 $10,110.00 $8,600.00 $7,787.50 $108,652.50General & Administrative ExpensesOwners Withdrawal $4,000.00 $4,000.00 $4,000.00 $5,000.00 $6,000.00 $5,000.00 $5,000.00 $5,000.00 $6,000.00 $5,000.00 $6,000.00 $5,000.00 $60,000.00Wharf Fees 150.00 150.00 150.00 150.00 150.00 150.00 150.00 150.00 150.00 150.00 150.00 150.00 1,800.00Property Insurance $0.00 $0.00 $0.00 $0.00 $0.00 $375.00 $0.00 $0.00 $0.00 $0.00 $0.00 $0.00 $375.00Liability Insurance $0.00 $0.00 $0.00 $0.00 $0.00 $0.00 $665.00 $0.00 $0.00 $0.00 $0.00 $0.00 $665.00Membership Dues $0.00 $0.00 $0.00 $0.00 $0.00 $0.00 $0.00 $0.00 $0.00 $0.00 $0.00 $125.00 $125.00Tax & accounting $220.00 $0.00 $0.00 $175.00 $0.00 $0.00 $0.00 $0.00 $0.00 $0.00 $0.00 $0.00 $395.00Property taxes $0.00 $750.00 $0.00 $0.00 $0.00 $0.00 $0.00 $750.00 $0.00 $0.00 $0.00 $0.00 $1,500.00Total G & A Expense $4,370.00 $4,900.00 $4,150.00 $5,325.00 $6,150.00 $5,525.00 $5,815.00 $5,900.00 $6,150.00 $5,150.00 $6,150.00 $5,275.00 $64,860.00TOTAL ALL EXPS $11,945.00 $12,475.00 $12,043.75 $13,287.50 $14,681.25 $16,225.00 $16,500.00 $16,585.00 $16,697.50 $15,260.00 $14,750.00 $13,062.50 $173,512.50Net Cash Flow $430.00 $275.00 $893.75 $212.50 $318.75 $650.00 $375.00 $290.00 $177.50 $677.50 $250.00 $437.50 $4,987.50
Cash Position $4,830.00 $5,105.00 $5,998.75 $6,211.25 $6,530.00 $7,180.00 $7,555.00 $7,845.00 $8,022.50 $8,700.00 $8,950.00 $9,387.50 $9,387.50
NOTES
Pounds landed and boat price These are estimates based on information from several sources. Your experience may be materially different.Fuel used and price These are estimates based on information from several sources. Your experience may be materially different.Bait: # drums and price These are estimates based on information from several sources. Your experience may be materially different.Stern Man - share Assumes 20% of the receipts, less 20% of the variable costs, excluding General & Administrative costsWharf Fees Assumes boat slip @ $150/month
Cash FlowStatement
37
Let’s look at the Profit and Loss Statement: What are the principal differences? Amount of revenues reported each month may not be
the same as shown on Cash Flow Projection Some Expense items may reflect different amounts than
shown on Cash Flow Projection Two new expenses not seen on Cash Flow:
Amortization and Depreciation – both NON-CASH expenses
Reported taxable income less than actual net cash generated
Note how much less taxable income there is versus net cash generated
Let’s look for these things as we examine a P & L
38

20
Item Jan Feb March April May June July August Sept October Nov Dec Year
Income
Revenues $12,375 $12,750 $12,938 $13,500 $15,000 $16,875 $16,875 $16,875 $16,875 $15,938 $15,000 $13,500 178,500.00$
Operating ExpensesBoat fuel $1,925.00 $1,925.00 $1,993.75 $2,062.50 $2,131.25 $2,200.00 $2,200.00 $2,200.00 $2,200.00 $2,200.00 $2,200.00 $2,062.50 25,300.00$
Bait $4,500.00 $4,500.00 $4,750.00 $4,750.00 $5,000.00 $5,250.00 $5,500.00 $5,500.00 $5,500.00 $5,250.00 $5,250.00 $4,500.00 60,250.00$
Main & Repair Boat $500.00 $500.00 $500.00 $500.00 $500.00 $500.00 $500.00 $500.00 $500.00 $500.00 $500.00 $500.00 6,000.00$
Main & Repair Equip $50.00 $50.00 $50.00 $50.00 $50.00 $50.00 $50.00 $50.00 $50.00 $50.00 $50.00 $50.00 600.00$
Replace Equip & Gear $500.00 $500.00 $500.00 $500.00 $500.00 $500.00 $500.00 $500.00 $500.00 $500.00 $500.00 $500.00 6,000.00$
Misc Supplies $100.00 $100.00 $100.00 $100.00 $100.00 $100.00 $100.00 $100.00 $100.00 $100.00 $100.00 $100.00 1,200.00$
Licenses & Permits $0.00 $0.00 $0.00 $0.00 $250.00 $265.00 $0.00 $0.00 $0.00 $0.00 $0.00 $75.00 590.00$
Stern Man Share $0.00 $0.00 $0.00 $0.00 $0.00 $1,835.00 $1,835.00 $1,835.00 $1,697.50 $1,510.00 $0.00 $0.00 8,712.50$
Wharf Fees $150.00 $150.00 $150.00 $150.00 $150.00 $150.00 $150.00 $150.00 $150.00 $150.00 $150.00 $150.00 1,800.00$
Property Insurance $0.00 $0.00 $0.00 $0.00 $0.00 $375.00 $0.00 $0.00 $0.00 $0.00 $0.00 $0.00 375.00$
Liability Insurance $0.00 $0.00 $0.00 $0.00 $0.00 $0.00 $665.00 $0.00 $0.00 $0.00 $0.00 $0.00 665.00$
Membership Dues $0.00 $0.00 $0.00 $0.00 $0.00 $0.00 $0.00 $0.00 $0.00 $0.00 $0.00 $125.00 125.00$
Tax & Accounting $220.00 $0.00 $0.00 $175.00 $0.00 $0.00 $0.00 $0.00 $0.00 $0.00 $0.00 $0.00 395.00$
Property Taxes $0.00 $750.00 $0.00 $0.00 $0.00 $0.00 $0.00 $750.00 $0.00 $0.00 $0.00 $0.00 1,500.00$
Depreciation Expense $250.00 $250.00 $250.00 $250.00 $250.00 $250.00 $250.00 $250.00 $250.00 $250.00 $250.00 $250.00 3,000.00$
Amortization Expense $90.83 $90.84 $90.83 $90.84 $90.83 $90.84 $90.83 $90.84 $90.83 $90.83 $90.83 $90.83 1,090.00$
TOTAL ALL EXPS $8,285.83 $8,815.84 $8,384.58 $8,628.34 $9,022.08 $11,565.84 $11,840.83 $11,925.84 $11,038.33 $10,600.83 $9,090.83 $8,403.33 $117,602.50
Net Taxable Income $4,089.17 $3,934.16 $4,552.92 $4,871.66 $5,977.92 $5,309.16 $5,034.17 $4,949.16 $5,836.67 $5,336.67 $5,909.17 $5,096.67 $60,897.50
NOTESSame assumptions as Cash Flow Projection
Assumes annual boat maintenance, equipment maintenance and trap replacement expense averaged over yearBoat being depreciated over 15 years @ $3,000/year; traps and gear depreciated over 5 years @ $500/yearamortization of all licenses and permits over 12-month period; would be the same if expensed rather than amortized.
Profit and Loss Statement
39
The Profit and Loss Statement is what determines income tax liability Cash Flow is what determines survival of business and
ability to pay for non-tax deductible items, such as principal payments on debt, purchase of new gear and equipment, and accumulation of what you need for a new boat
Cash Flow will be the first spreadsheet a lender will look at, Profit and Loss next, and finally the Balance Sheet
Now let’s look at the Balance Sheet.
40

21
Item 12/31 12/31
AssetsCash on hand $4,400.00 9,387.50Accounts Receiveable $0.00 0.00Subtotal $4,400.00 9,387.50
Fixed AssetsTraps and gear $2,500.00 2,500.00 - less accumulated depreciation -$1,500.00 -2,000.00Net Value Traps & Gear $1,000.00 500.00Boat $45,000.00 45,000.00 - less accumulated depreciation -$15,250.00 -16,625.00Net Value Boat $29,750.00 28,375.00Licenses & Permits $590.00 590.00 - less amortization -$590.00 -590.00Net Value licenses & permits $0.00 0.00
TOTAL ASSETS $35,150.00 38,262.50
LiabilitiesAccounts Payable $0.00 2,215.00Notes and mortgages $0.00 0.00Total Liabilities $0.00 2,215.00
Owner's Equity - Original investment $10,000.00 10,000.00 - Accumulated Earnings $25,150.00 86,047.50 - Owner withdrawals during year $0.00 -60,000.00Total Owner's Equity $35,150.00 $36,047.50
TOTAL LIABILITIES AND EQUITY $35,150.00 $38,262.50
Balance Sheet
41
Balance Sheet
If you had accrued income or expenses (i.e., not yet received or paid) note where would you put those numbers?
Note depreciation schedule – traps and gear over 5 years, boat over 15 years. These create significant “non-cash” expenses reducing taxable income, but get reflected in the net value of assets.
Note the owner withdrew less cash than he could have in order to build his working capital
42

22
Cash flow and profit are NOT the same thing and you need to know the difference
A successful business MUST maintain good accounting records and financial controls. Have someone who knows what they are doing keep your books
As the owner you must understand the financial statements to manage effectively
43
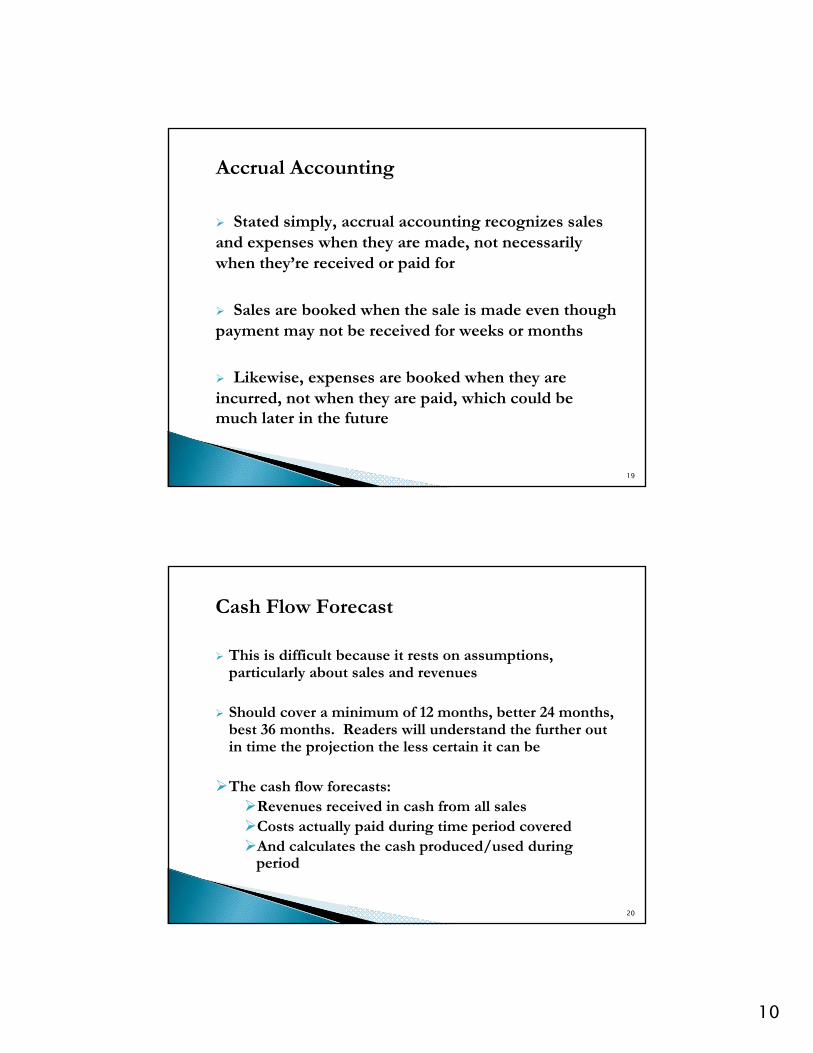
Sources and Uses of Cash
The first Source and Uses statement simply reflects what the Cash Flow Projection and the Balance Sheet show. Total cash in the business increased by $4,987.50
44
23
Sources and Uses of Cash #1 (simple)
Sources of Cash
Cash on hand beginning of year: $ 4,400.00
Net cash generated during year: $ 64,987.50
Uses of Cash
Owner withdrawal from business: $ -60,000.00
NET CASH REMAINING: $ 4,987.50
45
Sources and Uses of Cash (continued)
The second projects what might be required if the owner wants to purchase a new(er) boat
It assumes he can get approximately the depreciated value of his existing boat ($29,000) from a sale, and can borrow $30,000 from a bank at 7% payable over 10 years
46

24
Sources and Uses of Cash #2 Boat PurchaseSources of Cash
Cash on hand beginning of year: $ 4,400.00 Net cash generated during year: $ 4,987.50 Proceeds from sale of boat: $ 29,000.00 Bank Loan: $ 30,000.00
TOTAL AVAILABLE CASH: $ 68,387.50
Uses of Cash Purchase of new boat: $ -55,000.00
NET CASH REMAINING: $ 13,387.50
Debt Service for 10 year loan at 7% interest: Monthly payment would be: $ 348.36
Annual cash need would be: $ 4,183.20
47
Can he handle the debt service?
Out of nearly $65,000 cash generated each year, he will use more than $4,100.00 for debt service
He could reduce his Owner Withdrawal, or he could plan to increase revenues to cover the loan
So, if he is going to buy a new boat using a loan he’s going to need a plan that shows how he will be able to make the loan payments
48

25
As an added “check” on projections, you can do a break-even analysis
The formula for calculating the break-even point is:Break-Even (Revenue dollars needed) = (equals)
Fixed Costs ÷ 1-Variable Cost (as a % of sales)
How much additional revenue will he need to be able to make the loan payments?
This is keeping all of his other expenses (including owner’s draw) the same
49
Using the numbers from the cash flow projection, let’s see what the break-even analysis tells us:
Total Annual Fixed Cost of loan: $4,183.20Divided by
Variable Costs as % of revenues$108,652.50 ÷ 178,500 equals = 0.6087
1 minus (-) 0.6087 equals = 0.3913
Total Annual Fixed Cost divided by 0.3913 = $10,690.52
To pay for the loan, revenues will have to increase by that amount, or approximately 6% . That translates to an additional 2,856 pounds landed annually, or increasing the average price received by 22.5 cents to an average of approximately $3.98 per pound.
Are either possible?50

26
Financial ratios are a valuable and easy way to interpret the numbers found in statements
They can help to answer critical questions such as whether the business is carrying excess debt or inventory, whether customers are paying according to terms, whether the operating expenses are too high and whether the company assets are being used properly to generate income
Most importantly, it’s what the banks use to measure how you’re doing!
51
The current ratio gauges how capable a business is in paying current liabilities by using current assets only. Current ratio is also called the working capital ratio.
The formula is:
Total Current Assets
Total Current Liabilities
(that means Total Current Assets divided by Total Current Liabilities)
A good value for this ratio is 2 to 1 (or 2:1 or 2/1).
In our example the ratio is 9,387.50 ÷ 2,215.00 = 4.2.Very healthy!
52

27
Debt to equity is also called debt to net worth. It quantifies the relationship between the capital invested by owners and investors and the funds provided by creditors
The formula is:
Total Liabilities (or debt)
Net Worth (or Total Equity)
The higher the ratio, the greater the risk to a current or future creditor. A lower ratio means the company is more financially
stable and is probably in a better position to borrow money. However, an extremely low ratio may indicate that the owner is
too conservative and is not letting the business realize its full potential. In our example, the Debt to Equity Ratio is .061, which
may be considered too low a ratio.
53
Net profit margin shows how much net profit is derived from every dollar of total sales. It indicates how well the business has managed its operating expenses. It also can indicate whether the business is generating enough sales volume to cover minimum fixed costs and still leave an acceptable profit.
The formula is:
Net Profit
Total Sales
The higher the value for this ratio the better, but it must be over 0.0 to indicate a profitable company. In our example, the fisherman enjoys a Net Profit Margin of 34% or 34¢ for
every dollar of revenue brought in.
54

28
This evaluates how effectively the company employs its assets to generate a return. It measures efficiency.
The formula is:
Net Profit Before Taxes
Total Assets
For our fisherman, his Net Profit Before Taxes is $60,897.50 and his Assets are $38,262.50, for a return of 59%.
However, if the draw of $60,000 is considered, the return falls to 2.3%
55
To wrap it up: Use the Cash Flow Forecast to develop the Profit & Loss
Statement.
The P & L will tell you whether the business is profitable on an on-going basis. If cash is generally positive it should be profitable.
Use the Cash Flow Forecast and P & L to prepare the Balance Sheet and Sources and Uses of Cash.
You now have the financial statements your business plan requires.
Check your numbers using accepted financial ratios. This is the information a lender will rely upon to decide
whether to lend you money!
Be sure your numbers are consistent!
56

29
Something very important to remember:
There is help out there!
Your local Maine Small Business Development Center (Maine SBDC) is there to help.
Your local SCORE chapter may be of assistance.
Your local banker is a good source of information and advice.
They also know others who can help.
57
•www.mainesbdc.org
•www.mainebusinessworks.org
•www.sbdc.net
•www.sba.gov
58

30
For confidential, individualized, no cost to client business counseling and assistance contact:
Maine Small Business Development CenterLocation: Coastal Enterprises, Inc.Contact: David HillPhone: 207-882-4340 x178Email: [email protected]
59
Dedicated to helping Maine small business succeed.
Trade Adjustment Assistance Program -- 2011
A Financial Planning Workshop for Fishing Families
60
Thank you!