Financial Performance Analysis of Textile Companies in ...
13
Financial Performance Analysis of Textile Companies in Tamilnadu with Reference To Coimbatore – A Study Dr. R. Jayanthi, Associate Professor, Vidhya Sagar Women's College, Department of Commerce, Chengalpattu, Tamilnadu, India, Dr. B.Latha Lavanya, Associate Professor, MEASI Institute of Management, Royapettah, Chennai, Tamilnadu, India, ABSTRACT Indian Textile industry is one of the largest industries in India. It is the second largest industry in terms of providing employment opportunities to more than 35 million people in the country. Indian Textile industry contributes 7% of industrial output in terms of value, 2% of India's GDP and 15% of country's export earnings. The textiles industry has made a major contribution to the national economy in terms of net foreign exchange earnings and contribution to the GDP. India's overall textile exports during Financial Year 2017-18 stands at US$ 39.2 billion. India is the second largest producer and exporter of cotton in the world at $6.3 billion, close to China. India emerged as the largest producer of cotton in the world with the production of 345 lakh bales in 2016-17 and second largest exporter after China. Currently, the cotton industry is sustaining livelihoods of 5.8 million farmers and 40-50 Million people engaged in other activities like processing and trading. India is the largest producer of jute in the world. The Sericulture and Silk Sector: India is the second largest producer of silk in the world, producing around 18% of the world's total silk. Mulberry, Eri, Tasar, and Muga are the main types of silk produced in the country. It is a labor-intensive sector. The main purpose of this paper is to study and analyse Financial Performance of Textile Companies in Tamilnadu with Reference to Coimbatore (like Ambika Cotton Mills Limited, Bannari Amman Spinning Mills Limited, Gangotri Textiles Limited, KG Denim Limited and Lakshmi Mills Company Limited). This study was done based on secondary data collected from multiple sources of evidence, in addition to books, journals, websites, and newspapers. KEYWORDS: Current Ratio, Inventory, Financial Statement, Profit, Mean and Standard Deviation. INTRODUCTION India’s textiles sector is one of the oldest industries in Indian economy for several centuries. India's overall textile exports during Financial Year 2017-18 stands at US$ 39.2 billion and expected to increase to US$ 82.00 billion by 2021 from US$ 31.65 billion in Financial Year 2019 (up to January 2019). (Source: IBEF October 2019) India is the world’s second largest producer of textiles and garments. Rising per capita income, favorable demographics and preference to branded products are the boosting demand for textiles and garments producer. The size of India's textile market as of November 2017 was around US$ 150 billion, which is expected to touch US$ 223 billion market by 2021, growing at a CAGR of 12.2% between 2009-21. The new textile policy aims to achieve US$ 300 billion worth of textile exports by 2024-25 and create an additional 35 million jobs. By 2022, the Indian textile sector requires additional 17 million work forces. In 2018-19, Indian home textile industry reached US$ 4.95 billion. The textile industry to grow at a rate of 8.7% between 2007 and 2023 and reach US$ 226 billion by 2023. Favorable trade policies and superior quality are the drive force for textile exports. In FY19, India's textile exports increased 1.66% to US$ 35.969 billion as compared to US$ 35.381 in FY18. (Source: IBEF October 2019) Mukt Shabd Journal Volume IX, Issue VI, JUNE/2020 ISSN NO : 2347-3150 Page No : 127
Transcript of Financial Performance Analysis of Textile Companies in ...

Financial Performance Analysis of Textile Companies in Tamilnadu with
Reference To Coimbatore – A Study Dr. R. Jayanthi, Associate Professor, Vidhya Sagar Women's College, Department of
Commerce, Chengalpattu, Tamilnadu, India,
Dr. B.Latha Lavanya, Associate Professor, MEASI Institute of Management, Royapettah,
Chennai, Tamilnadu, India,
ABSTRACT
Indian Textile industry is one of the largest industries in India. It is the second largest
industry in terms of providing employment opportunities to more than 35 million people in the
country. Indian Textile industry contributes 7% of industrial output in terms of value, 2% of India's
GDP and 15% of country's export earnings. The textiles industry has made a major contribution to
the national economy in terms of net foreign exchange earnings and contribution to the GDP.
India's overall textile exports during Financial Year 2017-18 stands at US$ 39.2 billion.
India is the second largest producer and exporter of cotton in the world at $6.3 billion, close to
China. India emerged as the largest producer of cotton in the world with the production of 345
lakh bales in 2016-17 and second largest exporter after China.
Currently, the cotton industry is sustaining livelihoods of 5.8 million farmers and 40-50
Million people engaged in other activities like processing and trading. India is the largest producer
of jute in the world. The Sericulture and Silk Sector: India is the second largest producer of silk in
the world, producing around 18% of the world's total silk. Mulberry, Eri, Tasar, and Muga are the
main types of silk produced in the country. It is a labor-intensive sector.
The main purpose of this paper is to study and analyse Financial Performance of Textile
Companies in Tamilnadu with Reference to Coimbatore (like Ambika Cotton Mills Limited,
Bannari Amman Spinning Mills Limited, Gangotri Textiles Limited, KG Denim Limited and
Lakshmi Mills Company Limited). This study was done based on secondary data collected from
multiple sources of evidence, in addition to books, journals, websites, and newspapers.
KEYWORDS: Current Ratio, Inventory, Financial Statement, Profit, Mean and Standard
Deviation.
INTRODUCTION India’s textiles sector is one of the oldest industries in Indian economy for several centuries.
India's overall textile exports during Financial Year 2017-18 stands at US$ 39.2 billion and
expected to increase to US$ 82.00 billion by 2021 from US$ 31.65 billion in Financial Year 2019
(up to January 2019). (Source: IBEF October 2019)
India is the world’s second largest producer of textiles and garments. Rising per capita
income, favorable demographics and preference to branded products are the boosting demand for
textiles and garments producer. The size of India's textile market as of November 2017 was around
US$ 150 billion, which is expected to touch US$ 223 billion market by 2021, growing at a CAGR
of 12.2% between 2009-21. The new textile policy aims to achieve US$ 300 billion worth of textile
exports by 2024-25 and create an additional 35 million jobs. By 2022, the Indian textile sector
requires additional 17 million work forces. In 2018-19, Indian home textile industry reached US$
4.95 billion. The textile industry to grow at a rate of 8.7% between 2007 and 2023 and reach US$
226 billion by 2023. Favorable trade policies and superior quality are the drive force for textile
exports. In FY19, India's textile exports increased 1.66% to US$ 35.969 billion as compared to
US$ 35.381 in FY18. (Source: IBEF October 2019)
Mukt Shabd Journal
Volume IX, Issue VI, JUNE/2020
ISSN NO : 2347-3150
Page No : 127

The Indian textiles industry is extremely varied, with the hand-spun and hand-woven
textiles sectors at one end of the spectrum, while the capital intensive sophisticated mills sector at
the other end of the spectrum. The decentralized power looms/ hosiery and knitting sector form
the largest component of the textiles sector. The close linkage of the textile industry to agriculture
(for raw materials such as cotton) and the ancient culture and traditions of the country in terms of
textiles make the Indian textiles sector unique in comparison to the industries of other countries.
The Indian textile industry has the capacity to produce a wide variety of products suitable to
different market segments, both within India and across the world.
Company Profile: Ambika Cotton Mills Limited (ACML) is situated at Coimbatore. It is engaged in the
manufacturing of premium quality Compact and Eli twisted cotton yarn for hosiery and weaving.
It is plays a key role in the international and domestic yarn market with exports constituting 60%
of its revenues. Ambika Cotton Mills Ltd is a manufacturer of cotton yarn. It started as a private
limited company on 6th October 1988 and became a public limited company on 5th September
1994. It has 4 manufacturing units situated at Dindigul, Tamil Nadu with a total spindle capacity
of 108288 of Compacting System. Ambika Cotton Mills Ltd is number one in the shirting segment
and most preferred client of all top quality shirt manufacturers around the world. They hold a very
niche segment in the industry, with sound track record of product quality and delivery fulfillment.
Zero complaints with clients, shippers and raw material suppliers are their pride in the market.
They are also committed to GO GREEN INITIATION and produce over 110% of its power
requirement by clean wind power with installed capacity of 27.4 MW.
Bannari Amman Spinning Mills Limited started as Shiva Textiles (CBT) Limited on 10th July
1989, renamed as Bannari Amman Spinning Mills Ltd on October 11, 1991 and commenced its
commercial operations in the year 1995. Since inception the company has progressed to be a leader
in cotton yarn spinning in South India, a premium in the market for its products. It has two factories
for yarn spinning with an installed capacity of more than 135000 spindles at Dindigul, Tamil Nadu.
The weaving division at Coimbatore, Tamil Nadu, has an installation of 135 Sulzer projectile wider
width Looms. It also has a technical textile division comprising of coating, flocking and lamination
units.
Gangotri Textiles Limited (GTL) situated at Coimbatore was started as Gangotri Textiles Private
Limited on 26th July 1989 and became a public limited company on 1st January 1993. It has a
vertically integrated textile unit, with world class in-house facilities from processing yarn to
manufacture of finished garments. Gangotri incorporates the latest technology with hi-tech
machinery to produce the finest variety of textile products. It currently has installed capacity of
5,904 rotors that makes them a key player in the organized segment of the OE spinning industry.
GTL has set up wind mills with a total capacity of 3.30 MW and an oil based power generation
plant of 2 MW capacity.
K G Denim Limited (KGDL) situated at Coimbatore was started on 25th June 1992 and became
a public limited company in the year 1993. KGDL is a premier denim and apparel fabric
manufacturer, whose products are supplied to leading jeans wear makers, fashion brands and
retailers worldwide. Their products are sold under the trade mark Indigo Fabrics with various lines
like Strength, Pride, Ecstasy, Fortune and Passion and Trigger for readymade jeans. KGDL also
entered the home textiles market to provide innovative and specialized products for beds, blankets,
pillow cases and duvet/ comforter covers. KG Denim is part of textile group with annual turnover
of $150 million. It currently manufactures 24 million meters of denim fabrics, 12 million meters
of cotton fabrics, 2 million equivalent sheet sets of made-ups and 3 million jeans & trousers.
Mukt Shabd Journal
Volume IX, Issue VI, JUNE/2020
ISSN NO : 2347-3150
Page No : 128

Lakshmi Mills Company Limited established in the year 1910 by pioneer late G. Kuppuswamy
Naidu. The history of Lakshmi Mills is the way for history of the textile industry in Coimbatore.
Lakshmi Mills has contributed to the development of textile industry close to a century by
promoting self-reliance, research, import substitution, exports and technology. It has demonstrated
staying powerful by ensuring quality and customer satisfaction as its prime objectives. Only
company situated at Coimbatore that has celebrated its golden jubilee, diamond jubilee, platinum
jubilee and centenary celebration in the year 2010. The annual turnover of the company is around
Rs. 100 crores. Lakshmi Mills Company is a major textile yarn and cloth manufacturer in
Coimbatore, India. The promoters of the mill were also instrumental in starting various textile
machinery companies notably LMW, medical and educational institutions. The Lakshmi Mills
Company Limited has also contributed in various fields like education, synthetic machinery and
support systems. The companies have contributed in a large measure to the industry and to society.
OBJECTIVE OF THE STUDY The present study made an attempt to examine the financial soundness and performance of
Selected Textile companies in Tamilnadu with Reference to Coimbatore. The main objectives are:
To evaluate the financial statement analysis of Selected Textile Companies in Tamilnadu with
Reference to Coimbatore namely Ambika Cotton Mills Limited, Bannari Amman Spinning
Mills Limited, Gangotri Textiles Limited, KG Denim Limited and Lakshmi Mills Company
Limited using the different statistical tools.
To make comparative analyze of their financial soundness and performance under the study
period (i.e. for a period of 5 Years - between 1st April 2015 and 31st March 2019).
RESEARCH METHODOLOGY This research follows the analytical research methodology which is based on the
quantitative data. The main source of data used for the study is secondary data derived from the
published Annual Reports of the selected Textile Companies in Tamilnadu with Reference to
Coimbatore. The information related with theoretical background has been collected from
websites, journals, magazines, newspapers and books. Present study covers the financial statement
analysis of Selected Textile Companies in Tamilnadu with Reference to Coimbatore namely
Ambika Cotton Mills Limited, Bannari Amman Spinning Mills Limited, Gangotri Textiles
Limited, KG Denim Limited and Lakshmi Mills Company Limited for Five consecutive years.
The year of the study is between 2015 and 2019. The Rationale behind selecting is based on the
availability of data. For this purpose, exploratory method has been adopted as it helps to investigate
any problem with suitable hypothesis, and it is also important for the clarification of the concept.
LIMITATIONS OF THE STUDY The financial statements and annual report were used; hence the data collected is secondary in
nature.
False Results: In case the data upon which the ratios are computed are incorrect, then the ratios
calculated would also be incorrect.
Limited Comparability: The different accounting policies followed by firms will not make
some of the accounting ratios strictly comparable.
Ratio analysis is only a quantitative method of performance analysis and hence ignores
qualitative factors.
Ratio analysis is only to measure profitability, efficiency and financial soundness but they
aren’t the solution to real time problem.
The scope of study analysis is only for 5 years (between 2015 and 2019).
Mukt Shabd Journal
Volume IX, Issue VI, JUNE/2020
ISSN NO : 2347-3150
Page No : 129

TOOLS AND TECHNIQUES OF ANALYSIS The collected data have been suitably re-arranged, classified and tabulated as per the requirement
of the study and the following techniques have been applied:
A. Accounting Ratios: Accounting ratios like Current Ratio, Quick Ratio, Inventory Turnover
Ratio, operating profit Ratio and Net Profit Ratio for five financial years have been calculated.
Comparison of current to past performance using ratios enables analyst to assess a firm’s
progress.
B. Statistical Tools
• In order to facilitate study Arithmetic Mean, Standard Deviation, and Coefficient of
Variation have been calculated.
• Analysis is the key element of any research as it is the reliable way to test the hypothesis
framed by the investigator. This paper deals with the analysis of the secondary data
collected through published Annual Reports of the selected Textile Companies in
Tamilnadu with Reference to Coimbatore. The collected data has been codified, tabulated
and analysis has been conducted using the different statistical tools such as Descriptive
Statistics (like Mean, Standard Error, Standard Deviation, Median, Mode, Sample
Variance, Maximum, Minimum, Range, Count and Confidence Level - 95%).
Financial Statement Analysis of Selected Textile Companies in Tamilnadu with
Reference to Coimbatore
Financial Statement Analysis
Description AMBIKA COTTON MILLS LTD BANNARI AMMAN SPINNING MILLS LTD
2019 2018 2017 2016 2015 2019 2018 2017 2016 2015 Net Sales (Rs. in Crore) 655.6 584.47 528.61 492.31 495.54 999.83 892.04 868.45 771.00 680.42
Variable cost (Rs. in Crore) 538.87 483.18 428.46 404.54 385.51 913.75 844.72 781.57 683.66 605.83
Contribution = Net Sales – Variable Cost (Rs. in Crore) 116.73 101.29 100.15 87.77 110.03 86.08 47.32 86.88 87.34 74.59
EBT (Rs. in Crore) 86.83 79.55 72.00 58.94 63.78 19.07 7.64 14.45 27.72 19.14
Combined Leverage % = (Contribution ÷EBT) * 100 (%) 134.44 127.33 139.10 148.91 172.51 451.39 619.37 601.25 315.08 389.71
Total Debt (Rs. in Crore) 88.67 28.43 7.49 19.71 49.6 616.76 607.81 505.95 413.62 378.67
Net Worth (Rs. in Crore) 474.62 428.81 374.7 335.05 301.21 309.09 292.88 288.93 269.75 254.29
Debt Equity Ratio = Total Debt ÷ Net Worth (in times) 0.19 0.07 0.02 0.06 0.16 2.00 2.08 1.75 1.53 1.49
Current Asset (Rs. in Crore) 306.26 258.4 203.86 147.45 153.38 440.62 399.47 304.73 294.02 241.03
Current Liability (Rs. in Crore) 49.95 107.33 93.84 68.89 89.16 188.49 184.78 148.04 242.12 204.86
Current Ratio = Current Asset ÷ Current Liability (in times) 6.13 2.41 2.17 2.14 1.72 2.34 2.16 2.06 1.21 1.18
Total Assets (Rs. in Crore) 563.29 457.22 382.19 354.75 350.8 925.84 900.69 794.89 683.37 632.96
Proprietary Ratio = Net Worth ÷ Total Assets (in times) 0.84 0.94 0.98 0.94 0.86 0.33 0.33 0.36 0.39 0.40
EBIT (Rs. in Crore) 96.25 84.48 75.84 64.16 70.09 81.43 64.5 58.24 64.05 55.35
Interest = EBIT – EBT (Rs. in Crore) 9.42 4.93 3.84 5.22 6.31 62.36 56.86 43.79 36.33 36.21
Interest Coverage Ratio = EBIT ÷ Interest (in times) 10.22 17.14 19.75 12.29 11.11 1.31 1.13 1.33 1.76 1.53
Net Profit (Rs. in Crore) 63.18 61.07 55.74 44.46 51.18 19.34 7.34 11.20 18.55 12.83
Net Profit Ratio = Net Profit÷ Net Sales (in times) 0.10 0.10 0.11 0.09 0.10 0.02 0.01 0.01 0.02 0.02
Inventory (Rs. in Crore) 271.89 239.93 151.5 124.17 144.53 255.33 276.00 197.57 196.2 153.46
Liquid Asset = Current Asset – Inventory (Rs. in Crore) 34.37 18.47 52.36 23.28 8.85 185.29 123.47 107.16 97.82 87.57
Quick Ratio = Liquid Asset÷ Current Liability (in times) 0.69 0.17 0.56 0.34 0.10 0.98 0.67 0.72 0.40 0.43
Sales Turnover (Rs. in Crore) 655.60 584.47 528.61 492.31 495.54 999.83 892.04 868.45 771.00 680.42
Inventory Turnover Ratio = Sales Turnover ÷ Inventory (in times) 2.41 2.44 3.49 3.96 3.43 3.92 3.23 4.40 3.93 4.43
Equity Share Capital (Rs. in Crore) 5.72 5.73 5.73 5.88 5.88 15.75 15.75 15.75 15.75 15.75
Earnings Per Share (Rs.) 110.45 106.67 97.36 75.67 87.11 12.28 4.66 7.11 11.77 8.14
Book Value (Rs.) 829.76 749.00 654.49 570.29 512.7 196.20 185.91 183.4 171.23 161.41
Equity Dividend (%) 300.00 350.00 0.00 150.00 140.00 16.00 16.00 18.00 16.00 15.00
Shares in issue (Lakhs) 57.20 57.25 57.25 58.75 58.75 157.54 157.54 157.54 157.54 157.54
(Source: Secondary Data through Audited Annual Report)
Mukt Shabd Journal
Volume IX, Issue VI, JUNE/2020
ISSN NO : 2347-3150
Page No : 130

Financial Statement Analysis
Description GANGOTRI TEXTILES LTD KG DENIM LTD
2019 2018 2017 2016 2015 2019 2018 2017 2016 2015 Net Sales (Rs. in Crore) 0.00 1.46 0.58 26.03 74.30 692.87 634.94 617.69 651.73 591.78
Variable cost (Rs. in Crore) 0.26 1.50 2.22 26.12 68.43 630.26 601.53 556.83 555.61 554.74
Contribution = Net Sales – Variable Cost (Rs. in Crore) -0.26 -0.04 -1.64 -0.09 5.87 62.61 33.41 60.86 96.12 37.04
EBT (Rs. in Crore) -0.19 1.32 -0.50 -38.82 -45.94 15.42 9.22 38.80 35.38 1.96
Combined Leverage % = (Contribution ÷EBT) * 100 (%) 136.84 -3.03 328.00 0.23 -12.78 406.03 362.36 156.86 271.68 1889.80
Total Debt (Rs. in Crore) 245.45 0.00 0.00 279.77 365.13 169.83 132.87 97.01 122.18 136.03
Net Worth (Rs. in Crore) -235.69 -235.01 -236.34 -235.4 -196.6 114.35 107.99 103.99 80.04 61.23
Debt Equity Ratio = Total Debt ÷ Net Worth (in times) -1.04 0.00 0.00 -1.19 -1.86 1.49 1.23 0.93 1.53 2.22
Current Asset (Rs. in Crore) 0.04 0.16 0.83 1.48 13.01 223.96 250.79 207.90 191.51 173.77
Current Liability (Rs. in Crore) 6.22 251.61 254.56 9.49 17.94 179.48 223.11 169.39 162.52 164.56
Current Ratio = Current Asset ÷ Current Liability (in times) 0.01 0.00 0.00 0.16 0.73 1.25 1.12 1.23 1.18 1.06
Total Assets (Rs. in Crore) 9.76 -235 -236.33 44.36 168.54 284.18 240.85 201 202.2 197.26
Proprietary Ratio = Net Worth ÷ Total Assets (in times) -24.15 1.00 1.00 -5.31 -1.17 0.40 0.45 0.52 0.40 0.31
EBIT (Rs. in Crore) -0.19 1.32 -0.5 -25.99 -16.62 40.41 33.57 64.83 67.79 29.93
Interest = EBIT – EBT (Rs. in Crore) 0.00 0.00 0.00 12.83 29.32 24.99 24.35 26.03 32.41 27.97
Interest Coverage Ratio = EBIT ÷ Interest (in times) -- -- -- -2.03 -0.57 1.62 1.38 2.49 2.09 1.07
Net Profit (Rs. in Crore) -0.18 1.33 -0.53 -38.80 -45.90 10.98 5.83 24.58 21.12 0.21
Net Profit Ratio = Net Profit÷ Net Sales (in times) -- 0.91 -0.91 -1.49 -0.62 0.02 0.01 0.04 0.03 0.00
Inventory (Rs. in Crore) 0.00 0.00 0.26 0.26 8.66 130.24 143.73 120.49 107.76 123.78
Liquid Asset = Current Asset – Inventory (Rs. in Crore) 0.04 0.16 0.57 1.22 4.35 93.72 107.06 87.41 83.75 49.99
Quick Ratio = Liquid Asset÷ Current Liability (in times) 0.01 0.00 0.00 0.13 0.24 0.52 0.48 0.52 0.52 0.30
Sales Turnover (Rs. in Crore) 0.00 1.46 0.58 26.03 74.30 692.87 634.94 617.69 651.73 591.78
Inventory Turnover Ratio = Sales Turnover ÷ Inventory (in times) -- -- 2.23 100.12 8.58 5.32 4.42 5.13 6.05 4.78
Equity Share Capital (Rs. in Crore) 106.73 106.73 106.73 106.73 106.73 25.65 25.67 25.67 25.67 25.67
Earnings Per Share (Rs.) -0.06 0.41 -0.16 -11.90 -14.08 4.28 2.27 9.58 8.23 0.08
Book Value (Rs.) -99.99 -99.78 -100.19 -99.9 -88.00 44.58 42.09 40.53 31.2 23.87
Equity Dividend (%) -- -- -- -- -- 7.50 7.50 7.50 7.50 7.50
Shares in issue (Lakhs) 326.15 326.15 326.15 326.15 326.15 256.50 256.54 256.54 256.54 256.54
(Source: Secondary Data through Audited Annual Report)
Financial Statement Analysis
Description LAKSHMI MILLS COMPANY LTD
2019 2018 2017 2016 2015 Net Sales (Rs. in Crore) 247.70 236.68 227.23 199.20 221.30
Variable cost (Rs. in Crore) 240.26 211.83 213.45 191.82 200.87
Contribution = Net Sales – Variable Cost (Rs. in Crore) 7.44 24.85 13.78 7.38 20.43
EBT (Rs. in Crore) -4.15 2.71 4.44 1.47 2.82
Combined Leverage % = (Contribution ÷EBT) * 100 (%) -179.28 916.97 310.36 502.04 724.47
Total Debt (Rs. in Crore) 61.45 68.14 58.08 56.81 52.26
Net Worth (Rs. in Crore) 443.58 491.33 357.61 35.64 35.35
Debt Equity Ratio = Total Debt ÷ Net Worth (in times) 0.14 0.14 0.16 1.59 1.48
Current Asset (Rs. in Crore) 68.30 69.29 58.92 159.47 153.32
Current Liability (Rs. in Crore) 56.12 52.72 44.01 38.10 40
Current Ratio = Current Asset ÷ Current Liability (in times) 1.22 1.31 1.34 4.19 3.83
Total Assets (Rs. in Crore) 505.03 559.48 415.69 92.43 87.59
Proprietary Ratio = Net Worth ÷ Total Assets (in times) 0.88 0.88 0.86 0.39 0.40
EBIT (Rs. in Crore) 5.88 11.36 12.73 11.78 12.9
Interest = EBIT – EBT (Rs. in Crore) 10.03 8.65 8.29 10.31 10.08
Interest Coverage Ratio = EBIT ÷ Interest (in times) 0.59 1.31 1.54 1.14 1.28
Net Profit (Rs. in Crore) -7.93 1.42 1.07 1.05 4.29
Net Profit Ratio = Net Profit÷ Net Sales (in times) -0.03 0.01 0.00 0.01 0.02
Inventory (Rs. in Crore) 32.69 31.53 36.61 136.64 129.77
Liquid Asset = Current Asset – Inventory (Rs. in Crore) 35.61 37.76 22.31 22.83 23.55
Quick Ratio = Liquid Asset÷ Current Liability (in times) 0.63 0.72 0.51 0.60 0.59
Sales Turnover (Rs. in Crore) 247.70 236.68 227.23 199.2 221.3
Inventory Turnover Ratio = Sales Turnover ÷ Inventory (in times) 7.58 7.51 6.21 1.46 1.71
Equity Share Capital (Rs. in Crore) 6.96 6.96 6.96 6.96 6.96
Earnings Per Share (Rs.) -114.03 20.46 15.32 15.07 61.69
Book Value (Rs.) 6,377.35 7,063.86 5,141.31 512.35 508.12
Equity Dividend (%) 5.00 9.00 9.00 9.00 15.00
Shares in issue (Lakhs) 6.96 6.96 6.96 6.96 6.96
(Source: Secondary Data through Audited Annual Report)
Contribution: “Contribution” represents the portion of sales revenue that is not consumed by
variable costs and so contributes to the coverage of fixed costs. This concept is one of the key
building blocks of break-even analysis.
Mukt Shabd Journal
Volume IX, Issue VI, JUNE/2020
ISSN NO : 2347-3150
Page No : 131
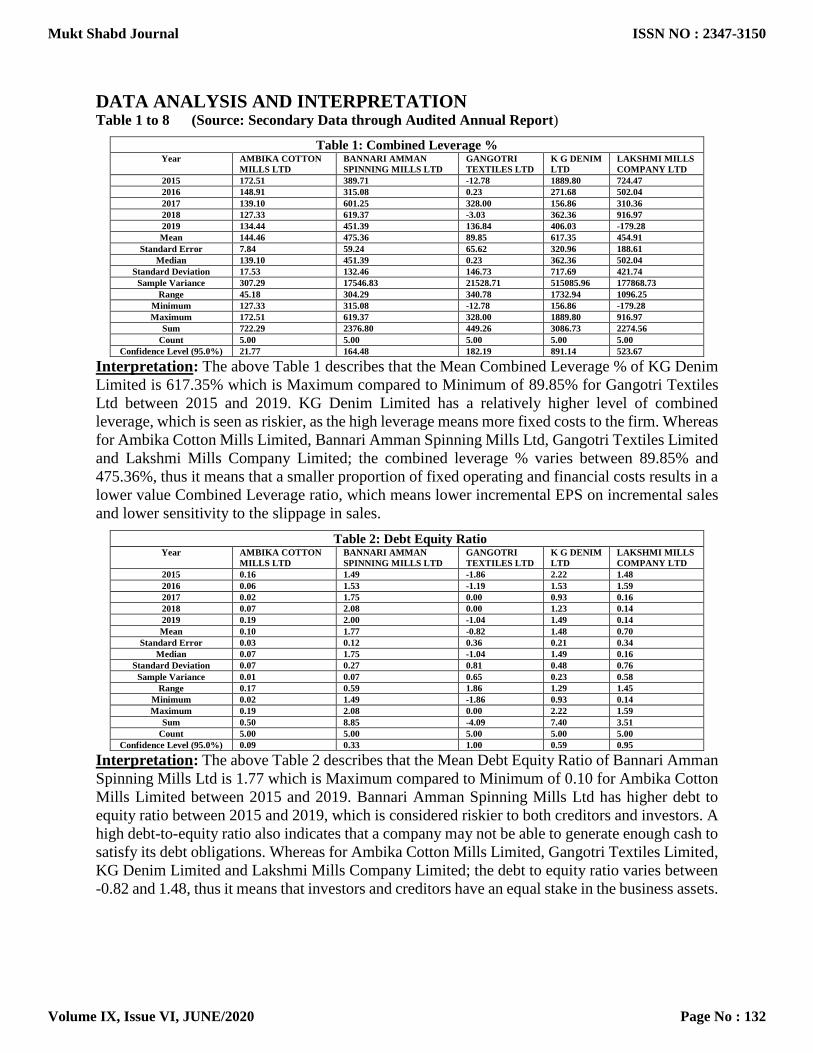
DATA ANALYSIS AND INTERPRETATION Table 1 to 8 (Source: Secondary Data through Audited Annual Report)
Table 1: Combined Leverage % Year AMBIKA COTTON
MILLS LTD
BANNARI AMMAN
SPINNING MILLS LTD
GANGOTRI
TEXTILES LTD
K G DENIM
LTD
LAKSHMI MILLS
COMPANY LTD
2015 172.51 389.71 -12.78 1889.80 724.47
2016 148.91 315.08 0.23 271.68 502.04
2017 139.10 601.25 328.00 156.86 310.36
2018 127.33 619.37 -3.03 362.36 916.97
2019 134.44 451.39 136.84 406.03 -179.28
Mean 144.46 475.36 89.85 617.35 454.91
Standard Error 7.84 59.24 65.62 320.96 188.61
Median 139.10 451.39 0.23 362.36 502.04
Standard Deviation 17.53 132.46 146.73 717.69 421.74
Sample Variance 307.29 17546.83 21528.71 515085.96 177868.73
Range 45.18 304.29 340.78 1732.94 1096.25
Minimum 127.33 315.08 -12.78 156.86 -179.28
Maximum 172.51 619.37 328.00 1889.80 916.97
Sum 722.29 2376.80 449.26 3086.73 2274.56
Count 5.00 5.00 5.00 5.00 5.00
Confidence Level (95.0%) 21.77 164.48 182.19 891.14 523.67
Interpretation: The above Table 1 describes that the Mean Combined Leverage % of KG Denim
Limited is 617.35% which is Maximum compared to Minimum of 89.85% for Gangotri Textiles
Ltd between 2015 and 2019. KG Denim Limited has a relatively higher level of combined
leverage, which is seen as riskier, as the high leverage means more fixed costs to the firm. Whereas
for Ambika Cotton Mills Limited, Bannari Amman Spinning Mills Ltd, Gangotri Textiles Limited
and Lakshmi Mills Company Limited; the combined leverage % varies between 89.85% and
475.36%, thus it means that a smaller proportion of fixed operating and financial costs results in a
lower value Combined Leverage ratio, which means lower incremental EPS on incremental sales
and lower sensitivity to the slippage in sales.
Table 2: Debt Equity Ratio Year AMBIKA COTTON
MILLS LTD
BANNARI AMMAN
SPINNING MILLS LTD
GANGOTRI
TEXTILES LTD
K G DENIM
LTD
LAKSHMI MILLS
COMPANY LTD
2015 0.16 1.49 -1.86 2.22 1.48
2016 0.06 1.53 -1.19 1.53 1.59
2017 0.02 1.75 0.00 0.93 0.16
2018 0.07 2.08 0.00 1.23 0.14
2019 0.19 2.00 -1.04 1.49 0.14
Mean 0.10 1.77 -0.82 1.48 0.70
Standard Error 0.03 0.12 0.36 0.21 0.34
Median 0.07 1.75 -1.04 1.49 0.16
Standard Deviation 0.07 0.27 0.81 0.48 0.76
Sample Variance 0.01 0.07 0.65 0.23 0.58
Range 0.17 0.59 1.86 1.29 1.45
Minimum 0.02 1.49 -1.86 0.93 0.14
Maximum 0.19 2.08 0.00 2.22 1.59
Sum 0.50 8.85 -4.09 7.40 3.51
Count 5.00 5.00 5.00 5.00 5.00
Confidence Level (95.0%) 0.09 0.33 1.00 0.59 0.95
Interpretation: The above Table 2 describes that the Mean Debt Equity Ratio of Bannari Amman
Spinning Mills Ltd is 1.77 which is Maximum compared to Minimum of 0.10 for Ambika Cotton
Mills Limited between 2015 and 2019. Bannari Amman Spinning Mills Ltd has higher debt to
equity ratio between 2015 and 2019, which is considered riskier to both creditors and investors. A
high debt-to-equity ratio also indicates that a company may not be able to generate enough cash to
satisfy its debt obligations. Whereas for Ambika Cotton Mills Limited, Gangotri Textiles Limited,
KG Denim Limited and Lakshmi Mills Company Limited; the debt to equity ratio varies between
-0.82 and 1.48, thus it means that investors and creditors have an equal stake in the business assets.
Mukt Shabd Journal
Volume IX, Issue VI, JUNE/2020
ISSN NO : 2347-3150
Page No : 132

Table 3: Current Ratio Year AMBIKA COTTON
MILLS LTD
BANNARI AMMAN
SPINNING MILLS LTD
GANGOTRI
TEXTILES LTD
K G DENIM
LTD
LAKSHMI MILLS
COMPANY LTD
2015 1.72 1.18 0.73 1.06 3.83
2016 2.14 1.21 0.16 1.18 4.19
2017 2.17 2.06 0.00 1.23 1.34
2018 2.41 2.16 0.00 1.12 1.31
2019 6.13 2.34 0.01 1.25 1.22
Mean 2.91 1.79 0.18 1.17 2.38
Standard Error 0.81 0.25 0.14 0.04 0.67
Median 2.17 2.06 0.01 1.18 1.34
Standard Deviation 1.81 0.55 0.31 0.08 1.50
Sample Variance 3.29 0.31 0.10 0.01 2.24
Range 4.41 1.16 0.73 0.19 2.97
Minimum 1.72 1.18 0.00 1.06 1.22
Maximum 6.13 2.34 0.73 1.25 4.19
Sum 14.57 8.95 0.90 5.84 11.89
Count 5.00 5.00 5.00 5.00 5.00
Confidence Level (95.0%) 2.25 0.69 0.39 0.10 1.86
Interpretation: The above Table 3 describes that the Mean Current Ratio of Ambika Cotton Mills
Limited is 2.91 which is maximum compared to minimum of 0.18 for Gangotri Textiles Limited
between 2015 and 2019. Gangotri Textiles Limited has lower Current Ratio (0.18) between 2015
and 2019; this indicates that the company may have problems meeting its short-term obligations
(Current Liabilities). Since the current ratio is less than 1.0 indicates the poor quality and the debt
repayment capacity of the firm is not satisfactory. Also, it doesn’t ensure the safety of the
investments made by the creditors. Whereas for Bannari Amman Spinning Mills, Gangotri Textiles
Limited, KG Denim Limited and Lakshmi Mills Company Limited; the Current Ratio varies
between 0.18 and 2.38, thus it also indicates that the company may have problems meeting its
short-term obligations and doesn’t ensure the safety of the investments made by the creditors. The
current ratio measures the company's ability to pay short-term and long-term obligations.
Table 4: Proprietary Ratio Year AMBIKA COTTON
MILLS LTD
BANNARI AMMAN
SPINNING MILLS LTD
GANGOTRI
TEXTILES LTD
K G DENIM
LTD
LAKSHMI MILLS
COMPANY LTD
2015 0.86 0.40 -1.17 0.31 0.40
2016 0.94 0.39 -5.31 0.40 0.39
2017 0.98 0.36 1.00 0.52 0.86
2018 0.94 0.33 1.00 0.45 0.88
2019 0.84 0.33 -24.15 0.40 0.88
Mean 0.91 0.36 -5.73 0.42 0.68
Standard Error 0.03 0.01 4.75 0.03 0.12
Median 0.94 0.36 -1.17 0.40 0.86
Standard Deviation 0.06 0.03 10.62 0.08 0.26
Sample Variance 0.00 0.00 112.71 0.01 0.07
Range 0.14 0.07 25.15 0.21 0.49
Minimum 0.84 0.33 -24.15 0.31 0.39
Maximum 0.98 0.40 1.00 0.52 0.88
Sum 4.56 1.81 -28.63 2.08 3.41
Count 5.00 5.00 5.00 5.00 5.00
Confidence Level (95.0%) 0.07 0.04 13.18 0.10 0.33
Interpretation: The above Table 4 describes that the Mean proprietary ratio of Ambika Cotton
Mills Limited is 0.91 which is maximum compared to minimum of -5.73for Gangotri Textiles
Limited between 2015 and 2019. Ambika Cotton Mills Limited has higher proprietary ratio (0.91)
between 2015 and 2019, it means stockholders has contributed 91% of the total tangible assets and
the remaining 9% have been contributed by creditors. The proprietary ratio shows the contribution
of stockholders’ in total capital of the company. A high proprietary ratio, therefore, indicates a
strong financial position of the company and greater security for creditors. Whereas for Bannari
Amman Spinning Mills Ltd, Gangotri Textiles Limited, KG Denim Limited and Lakshmi Mills
Company Limited; the proprietary ratio varies between -5.73 and 0.68, A low ratio indicates that
the company is already heavily depending on debts for its operations. A large portion of debts in
the total capital may reduce creditor’s interest, increase interest expenses and the risk of
bankruptcy. Having a very high proprietary ratio does not always mean that the company has an
Mukt Shabd Journal
Volume IX, Issue VI, JUNE/2020
ISSN NO : 2347-3150
Page No : 133

ideal capital structure. A company with a very high proprietary ratio may not be taking full
advantage of debt financing for its operations that is also not a good sign for the stockholders.
Table 5: Interest Coverage Ratio Year AMBIKA COTTON
MILLS LTD
BANNARI AMMAN
SPINNING MILLS LTD
GANGOTRI
TEXTILES LTD
K G DENIM
LTD
LAKSHMI MILLS
COMPANY LTD
2015 11.11 1.53 -0.57 1.07 1.28
2016 12.29 1.76 -2.03 2.09 1.14
2017 19.75 1.33 -- 2.49 1.54
2018 17.14 1.13 -- 1.38 1.31
2019 10.22 1.31 -- 1.62 0.59
Mean 14.10 1.41 -0.52 1.73 1.17
Standard Error 1.85 0.11 0.39 0.25 0.16
Median 12.29 1.33 0.00 1.62 1.28
Standard Deviation 4.14 0.24 0.88 0.57 0.36
Sample Variance 17.11 0.06 0.77 0.32 0.13
Range 9.53 0.63 2.03 1.42 0.95
Minimum 10.22 1.13 -2.03 1.07 0.59
Maximum 19.75 1.76 0.00 2.49 1.54
Sum 70.51 7.06 -2.60 8.65 5.86
Count 5.00 5.00 5.00 5.00 5.00
Confidence Level (95.0%) 5.14 0.30 1.09 0.70 0.44
Interpretation: The above Table 5 describes that the Mean Interest Coverage ratio of Ambika
Cotton Mills Limited is 14.10 which is maximum compared to minimum of -0.52for Gangotri
Textiles Limited between 2015 and 2019. Ambika Cotton Mills Limited has higher Interest
Coverage ratio (14.10) between 2015 and 2019. Whereas for Bannari Amman Spinning Mills Ltd,
Gangotri Textiles Limited, KG Denim Limited and Lakshmi Mills Company Limited; the Interest
Coverage ratio varies between -0.52 and 1.73. Since Interest Coverage Measurement is above 1, it
means that the company is making more than enough money to pay its interest obligations with
some extra earnings left over to make the principle payments. Most creditors look for coverage to
be at least 1.5 before they will make any loans. In other words, banks want to be sure a company
make at least 1.5 times the amount of their current interest payments. The interest coverage ratio
of a company states how easily a company can pay its interest expense on outstanding debt. A
higher ratio is preferable.
Table 6: Net Profit Ratio Year AMBIKA COTTON
MILLS LTD
BANNARI AMMAN
SPINNING MILLS LTD
GANGOTRI
TEXTILES LTD
K G DENIM
LTD
LAKSHMI MILLS
COMPANY LTD
2015 0.10 0.02 -0.62 0.00 0.02
2016 0.09 0.02 -1.49 0.03 0.01
2017 0.11 0.01 -0.91 0.04 0.00
2018 0.10 0.01 0.91 0.01 0.01
2019 0.10 0.02 -- 0.02 -0.03
Mean 0.10 0.02 -0.42 0.02 0.00
Standard Error 0.00 0.00 0.41 0.01 0.01
Median 0.10 0.02 -0.62 0.02 0.01
Standard Deviation 0.01 0.01 0.92 0.02 0.02
Sample Variance 0.00 0.00 0.84 0.00 0.00
Range 2.00 -3.33 -0.01 -1.20 2.61
Minimum 0.09 0.01 -1.49 0.00 -0.03
Maximum 0.11 0.02 0.91 0.04 0.02
Sum 0.50 0.08 -2.11 0.10 0.01
Count 5.00 5.00 5.00 5.00 5.00
Confidence Level (95.0%) 0.01 0.01 1.14 0.02 0.02
Interpretation: The above Table 6 describes that the Mean Net profit ratio of Ambika Cotton
Mills Limited is 0.10 which is maximum compared to minimum of -0.42 for Gangotri Textiles
Limited between 2015 and 2019. Ambika Cotton Mills Limited has higher Net profit ratio (0.10)
between 2015 and 2019. Whereas for Bannari Amman Spinning Mills Ltd, Gangotri Textiles
Limited, KG Denim Limited and Lakshmi Mills Company Limited; the Net profit ratio varies
between -0.42 and 0.02. Net profit ratio (NP ratio) is a popular profitability ratio that shows
relationship between net profit after tax and net sales. Net profit (NP) ratio is a useful tool to
measure the overall profitability of the business. A high ratio indicates the efficient management
Mukt Shabd Journal
Volume IX, Issue VI, JUNE/2020
ISSN NO : 2347-3150
Page No : 134

of the affairs of business. There is no norm to interpret this ratio. To see whether the business is
constantly improving its profitability or not, the analyst should compare the ratio with the previous
years’ ratio, the industry’s average and the budgeted net profit ratio. The use of net profit ratio in
conjunction with the assets turnover ratio helps in ascertaining how profitably the assets have been
used during the period.
Table 7: Quick Ratio Year AMBIKA COTTON
MILLS LTD
BANNARI AMMAN
SPINNING MILLS LTD
GANGOTRI
TEXTILES LTD
K G DENIM
LTD
LAKSHMI MILLS
COMPANY LTD
2015 0.10 0.43 0.24 0.30 0.59
2016 0.34 0.40 0.13 0.52 0.60
2017 0.56 0.72 0.00 0.52 0.51
2018 0.17 0.67 0.00 0.48 0.72
2019 0.69 0.98 0.01 0.52 0.63
Mean 0.37 0.64 0.08 0.47 0.61
Standard Error 0.11 0.11 0.05 0.04 0.03
Median 0.34 0.67 0.01 0.52 0.60
Standard Deviation 0.25 0.24 0.11 0.10 0.08
Sample Variance 0.06 0.06 0.01 0.01 0.01
Range 0.59 0.58 0.24 0.22 0.21
Minimum 0.10 0.40 0.00 0.30 0.51
Maximum 0.69 0.98 0.24 0.52 0.72
Sum 1.86 3.20 0.38 2.34 3.05
Count 5.00 5.00 5.00 5.00 5.00
Confidence Level (95.0%) 0.31 0.29 0.13 0.12 0.09
Interpretation: The above Table 7 describes that the Mean Quick ratio of Bannari Amman
Spinning Mills Ltd is 0.64 which is maximum compared to minimum of 0.08 for Gangotri Textiles
Limited between 2015 and 2019. Bannari Amman Spinning Mills Ltd has higher Quick ratio (0.64)
between 2015 and 2019. Whereas for Ambika Cotton Mills Limited, Gangotri Textiles Limited,
KG Denim Limited and Lakshmi Mills Company Limited; the Quick Ratio varies between 0.08
and 0.61. Quick ratio (also known as “acid test ratio” and “liquid ratio”) is used to test the ability
of a business to pay its short-term debts. It measures the relationship between liquid assets and
current liabilities. Liquid assets are equal to total current assets minus inventories and prepaid
expenses. Quick ratio is more reliable test of short-term solvency than current ratio because it
shows the ability of the business to pay short term debts immediately. Inventories and prepaid
expenses are excluded from current assets for the purpose of computing quick ratio because
inventories may take long period of time to be converted into cash and prepaid expenses cannot
be used to pay current liabilities. Generally, a quick ratio of 1:1 is considered satisfactory. Like
current ratio, this ratio should also be interpreted carefully. Having a quick ratio of 1:1 or higher
does not mean that the company has a strong liquidity position because a company may have high
quick ratio but slow paying debtors. On the other hand, a company with low quick ratio may have
fast moving inventories. The analyst, therefore, must have a hard look on the nature of individual
assets.
Mukt Shabd Journal
Volume IX, Issue VI, JUNE/2020
ISSN NO : 2347-3150
Page No : 135

Table 8: Inventory Turnover Ratio Year AMBIKA COTTON
MILLS LTD
BANNARI AMMAN
SPINNING MILLS LTD
GANGOTRI
TEXTILES LTD
K G DENIM
LTD
LAKSHMI MILLS
COMPANY LTD
2015 3.43 4.43 8.58 4.78 1.71
2016 3.96 3.93 100.12 6.05 1.46
2017 3.49 4.40 2.23 5.13 6.21
2018 2.44 3.23 -- 4.42 7.51
2019 2.41 3.92 -- 5.32 7.58
Mean 3.08 3.87 25.59 5.23 5.69
Standard Error 0.39 0.24 24.85 0.33 1.44
Median 2.97 3.93 1.12 5.23 6.86
Standard Deviation 0.77 0.48 49.70 0.67 2.89
Sample Variance 0.60 0.23 2470.04 0.45 8.35
Range 1.55 1.17 100.12 1.63 6.12
Minimum 2.41 3.23 0.00 4.42 1.46
Maximum 3.96 4.40 100.12 6.05 7.58
Sum 12.30 15.48 102.35 20.92 22.76
Count 4.00 4.00 4.00 4.00 4.00
Confidence Level (95.0%) 1.23 0.77 79.08 1.07 4.60
Interpretation: The above Table 8 describes that the Mean Inventory Turnover ratio of Lakshmi
Mills Company Limited is 5.69 which is maximum compared to minimum of 3.08 for Ambika
Cotton Mills Limited between 2015 and 2019. Lakshmi Mills Company Limited has higher
Inventory Turnover ratio (5.69) between 2015 and 2019. Whereas for Ambika Cotton Mills
Limited, Gangotri Textiles Limited, KG Denim Limited and Bannari Amman Spinning Mills Ltd;
the Net profit ratio varies between 3.08 and 5.23.Inventory turnover ratio (ITR) is an activity ratio
and is a tool to evaluate the liquidity of company’s inventory. It measures how many times a
company has sold and replaced its inventory during a certain period. Inventory turnover ratio varies
significantly among industries. A high ratio indicates fast moving inventories and a low ratio, on
the other hand, indicates slow moving or obsolete inventories in stock. A low ratio may also be
the result of maintaining excessive inventories needlessly. Maintaining excessive inventories
unnecessarily indicates poor inventory management because it involves tiding up funds that could
have been used in other business operations.
FINDINGS Ambika Cotton Mills Limited (ACML) Financial Analysis:
Net profit for the year inclined by 3.46% YoY (2018 & 2019).
The company's current liabilities during FY19 stood at Rs 49.95 crore as compared to Rs
107.33 crore in FY18, thereby witnessing a decrease of 53.46%.
Growth of 12.17% in total income (2019) as compared to 10.62% growth in the previous year
(2018)
Growth of 6.62% in Gross Profit (2019) as against growth of 6.98% in the previous year
(2018).
Current assets rise 18.52% and stood at Rs 306.26 crore.
Overall, the total assets and liabilities for FY19 stood at Rs 6.13 billion as against Rs 5.65
billion during FY18, thereby witnessing a growth of 8.62%.
The trailing twelve-month earnings per share (EPS) of the company stands at Rs 110.45 (2019),
an incline from the EPS of Rs 106.67 recorded last year (2018).
Current Ratio: The Company’s current ratio improved and stood at 6.13 during FY19, from
2.41 during FY18.
Interest Coverage Ratio: The Company’s interest coverage ratio deteriorated and stood at
10.22x during FY19, from 17.14x during FY18. The interest coverage ratio of a company states
how easily a company can pay its interest expense on outstanding debt. A higher ratio is
preferable.
Mukt Shabd Journal
Volume IX, Issue VI, JUNE/2020
ISSN NO : 2347-3150
Page No : 136

Bannari Amman Spinning Mills Limited Financial Analysis:
Overall turnover of the company increased by 12.34% (2019) when compared with the
previous year (2018).
Net profit for the year inclined by 163.49% YoY (2018 & 2019).
The company's current liabilities during FY19 stood at Rs 188.49 crore as compared to Rs
184.78 crore in FY18, thereby witnessing an increase of 2.01%.
Current assets rise 10.30% and stood at Rs 440.62 crore.
Overall, the total assets and liabilities for FY19 stood at Rs 11.14 billion as against Rs 10.85
billion during FY18, thereby witnessing a growth of 2.66%.
The trailing twelve-month earnings per share (EPS) of the company stands at Rs 12.28 (2019),
an incline from the EPS of Rs 4.66 recorded last year (2018).
Current Ratio: The Company’s current ratio improved and stood at 2.34 during FY19, from
2.16 during FY18.
Interest Coverage Ratio: The Company’s interest coverage ratio improved and stood at 1.31x
during FY19, from 1.13x during FY18.
Gangotri Textiles Ltd Financial Analysis:
Net profit for the year declined by 113.53% YoY (2018 & 2019).
The company's current liabilities during FY19 stood at Rs 6.22 crore as compared to Rs
251.61 crore in FY18, thereby witnessing a decrease of 97.53%.
Current assets fall 75% and stood at Rs 0.04 crore.
Overall, the total assets and liabilities for FY19 stood at Rs 0.160 billion as against Rs 0.166
billion during FY18, thereby witnessing a decline (growth) of 3.79%.
The trailing twelve-month earnings per share (EPS) of the company stand at Rs. 106.73 for
both 2019 and 2018.
Current Ratio: The Company’s current ratio improved and stood at 0.01 during FY19, from
0.00 during FY18.
Interest Coverage Ratio: The Company’s interest coverage ratio during FY19 and FY18 can’t
be calculated as EBIT and EBT are same, hence Interest is zero. Therefore interest coverage
ratio is infinity for FY19 and FY18 and due to no sales during FY19.
K G Denim Ltd Financial Analysis:
Overall turnover with a growth of 9% (2019) when compared with the previous year (2018).
Net profit for the year inclined by 88.34% YoY (2018 & 2019).
The company's current liabilities during FY19 stood at Rs 179.48 crore as compared to Rs
223.11 crore in FY18, thereby witnessing a decrease of 19.56%.
Current assets fall 10.70% and stood at Rs 223.96 crore.
Overall, the total assets and liabilities for FY19 stood at Rs 4.637 billion as against Rs 4.64
billion during FY18, thereby witnessing a decline (growth) of 0.06%.
The trailing twelve-month earnings per share (EPS) of the company stands at Rs 25.65 (2019),
a decline from the EPS of Rs 25.67 recorded last year (2018).
Current Ratio: The Company’s current ratio improved and stood at 1.25 during FY19, from
1.12 during FY18.
Interest Coverage Ratio: The Company’s interest coverage ratio improved and stood at 1.62x
during FY19, from 1.38x during FY18.
Lakshmi Mills Company Ltd Financial Analysis:
Revenue during FY2019 was 24,770 lakhs and it sustained a Net Loss of 415 lakhs before
deferred tax of 378 lakhs.
Net profit for the year declined by 658.45% YoY (2018 & 2019).
Mukt Shabd Journal
Volume IX, Issue VI, JUNE/2020
ISSN NO : 2347-3150
Page No : 137
The company's current liabilities during FY19 stood at Rs 56.12 crore as compared to Rs
52.72 crore in FY18, thereby witnessing an increase of 6.45%.
Current assets fall 1.43% and stood at Rs 68.3 crore.
Overall, the total assets and liabilities for FY19 stood at Rs 5.61 billion as against Rs 6.12
billion during FY18, thereby witnessing a decline (growth) of 8.34%.
The trailing twelve-month earnings per share (EPS) of the company stands at Rs -114.03
(2019), a decline from the EPS of Rs 20.46 recorded last year (2018).
Current Ratio: The Company’s current ratio deteriorated and stood at 1.22 during FY19, from
1.31 during FY18.
Interest Coverage Ratio: The Company’s interest coverage ratio deteriorated and stood at
0.59x during FY19, from 1.31x during FY18.
CONCLUSION Textile industry to grow at a rate of 8.7% between 2007 and 2023 and reach US$ 226 billion
by 2023. Indian Textile industry contributes 7% of industrial output in terms of value, 2% of
India's GDP and 15% of country's export earnings.
Textiles industry has made a major contribution to the national economy in terms of net
foreign exchange earnings and contribution to the GDP.
The new textile policy implemented by Government of India, aims to achieve US$ 300
billion worth of textile exports by 2024-25 and create an additional 35 million jobs and by
2022, the Indian textile sector requires additional 17 million work forces.
Ambika Cotton Mills Limited (ACML), Financial Performance improved largely on account
of broad basing the products and continued improvisation of the production process. It
continued its emphasis on its core strength of making specialty yarn made up of superior
cotton, offering products to the specific needs of the customers and also coupled with product
innovation. Overall their policy orientation has contributed to the sustained financial
performance of the company.
Bannari Amman Spinning Mills Limited, performance was satisfactory during FY2019 and
the overall performance of the Company looks positive.
Gangotri Textiles Ltd could not do any business during the FY2019, since it has sold the
entire assets of the company for the non-payment of loan. Thus effecting the manufacturing
operation for the entire FY2019. Also led to selling of all the units.
K G Denim Ltd has three main product segments viz., Fabric (Denim / Apparel), Home
Textiles and Apparel. It bagged Golden Trophy awarded by Texprocil for its export
performance. The Net Profit had increased considerably due to increase in export volumes
and favourable exchange rates.
Lakshmi Mills Company Ltd, primary focus is to minimize potential adverse effects on its
financial performance. It sustained a Net Loss of 415 lakhs (2019) before deferred tax of 378
lakhs, when compared with the previous year (2018).
The present study on “Financial Performance Analysis of Textile Industry in Tamilnadu with
Reference To Coimbatore” using the ratios and leverage helps to have a better insight about
the financial background and financial performance of the company.
From the analysis it was found that the overall financial performance of the company was
moderate, this was due to steep rise in raw material costs and largely driven by demand and
supply conditions as also directly proportional to automobile sales to some extent.
Net profit was in a declining tread for all the selected Textile companies.
Mukt Shabd Journal
Volume IX, Issue VI, JUNE/2020
ISSN NO : 2347-3150
Page No : 138

REFERENCES 1. Annual Reports of selected Textile Companies in Tamilnadu with Reference to Coimbatore for Five
consecutive years: Ambika Cotton Mills Limited, Bannari Amman Spinning Mills Limited, Gangotri
Textiles Limited, KG Denim Limited and Lakshmi Mills Company Limited.
2. Ambika Cotton Mills Limited, Bannari Amman Spinning Mills Limited, Gangotri Textiles Limited,
KG Denim Limited and Lakshmi Mills Company Limited- Key Financial Ratios
(https://www.dynamiclevels.com) [Accessed: 17/02/2020].
3. C.R Kothari (1990), Research Methodology, second revised – edition, New Age international (P)
Limited, Publishers, New Delhi.
4. Gupta S P (2007), Statistical Tools and Techniques, GK Publications.
5. Statistical Data Analysis using Excel 2016.
6. Source: Dion Global Solutions Limited - Ambika Cotton Mills Limited, Bannari Amman Spinning
Mills Limited, Gangotri Textiles Limited, KG Denim Limited and Lakshmi Mills Company Limited.
7. Textile industry in India; https://en.wikipedia.org/wiki/Textile_industry_in_India [Accessed:
17/02/2020].
8. Textile industry; https://en.wikipedia.org/wiki/Textile_industry [Accessed: 17/02/2020].
9. Textile Industry & Market Growth in India; https://www.ibef.org/industry/textiles.aspx [Accessed:
17/02/2020].
10. Annual Report 2018 – 2019; http://texmin.nic.in/sites/default/files/Textiles-AnnualReport2018-
2019(English).pdf [Accessed: 17/02/2020].
Mukt Shabd Journal
Volume IX, Issue VI, JUNE/2020
ISSN NO : 2347-3150
Page No : 139