Financial literacy of high school students in the ... WP 17-18.pdf · TIER WORKING PAPER SERIES...
28
Financial literacy of high school students in the Netherlands: knowledge, attitudes, self-efficacy, and behavior Aisa Amagir, Wim Groot, Henriëtte Maassen van den Brink, and Arie Wilschut TIER WORKING PAPER SERIES TIER WP 17/18
Transcript of Financial literacy of high school students in the ... WP 17-18.pdf · TIER WORKING PAPER SERIES...

Financial literacy of high school students in the Netherlands:
knowledge, attitudes, self-efficacy, and behavior
Aisa Amagir, Wim Groot, Henriëtte Maassen van den Brink, and Arie Wilschut
TIER WORKING PAPER SERIES
TIER WP 17/18

Financial literacy of high school students in the Netherlands: knowledge, attitudes, self-efficacy, and behavior
Aisa Amagir1, Wim Groot2, Henriëtte Maassen van den Brink3, and Arie Wilschut4
Abstract
We examine levels of financial literacy (knowledge, attitudes, self-efficacy, and behavior) among 15-year-old high
school students in the Netherlands (N = 2,025), and investigate which factors are associated with diverse financial
literacy components. Our findings show that certain population groups, such as immigrant students, those with lower
cognitive and mathematical ability, those with low SES, those with mothers without a college degree, and those who
do not discuss financial matters with family and peers, have lower levels of financial literacy. These findings are
useful for designing effective financial education and intervention programs, and for identifying groups that may
benefit from financial education programs the most. Financial education in high school is needed to ensure more
equal opportunities.
Keywords: financial literacy; personal finance
JEL codes: D14
This is a working paper. Please do not cite or distribute without permission of the authors.
1 Corresponding author, Centre for Applied Research in Education (CARE), Amsterdam University of Applied
Sciences, Postbus 1025, 1000BA Amsterdam, the Netherlands. Phone: +31621155464,
E-mail : [email protected]
2 Top Institute Evidence Based Education Research (TIER), Maastricht University, Maastricht, Netherlands
3 Top Institute Evidence Based Education Research (TIER), Faculty of Economics and Business, University of
Amsterdam, Amsterdam, Netherlands
4 Centre for Applied Research in Education (CARE), Amsterdam University of Applied Sciences, Netherlands

2
Introduction
Financial literacy is an essential competence in societies depending on individual responsibility and self-sufficiency.
This also applies to young people growing up in a society in which the financial landscape is complex (Amagir,
Groot, Maassen van den Brink, and Wilschut 2017). This has led to the recognition that better knowledge and
understanding of financial concepts and risks could help improve financial decision making among adults and young
people (OECD 2017). To identify which groups are at risk of low financial literacy, and which factors are associated
with the financial literacy of high school students, it is necessary to measure current levels of financial literacy. Such
data can help in identifying young people in need of financial literacy education, and can be used to design effective
financial education programs tailored to specific groups. The number of countries in which financial education is
being implemented in schools is increasing (OECD 2017). However, in the Netherlands, it is currently not a
mandatory part of the curriculum. There is some limited attention paid to financial education topics such as
budgeting and buying goods and services depending on the priorities set by schools or individual teachers (Money
Wise 2014).
The OECD (2014, 33) defines financial literacy as a broader concept than just financial knowledge:
“knowledge and understanding of financial concepts and risks, and the skills, motivation and confidence to apply
such knowledge and understanding in order to make effective decisions across a range of financial contexts.”
For this study, we define financial literacy as a combination of on the one hand financial knowledge, and
on the other hand attitudes towards money, financial self-efficacy, and financial behavior that support the
implementation of financial knowledge in daily financial decision making. In line with Amagir et al. (2017), we
distinguish three components in our definition of financial literacy: (1) financial knowledge; (2) attitudes towards
money and financial self-efficacy; and (3) financial behavior. To make financially responsible decisions, it is
necessary to be informed adequately about concepts related to the intended behavior. Furthermore, to apply
something outside the context in which it has been learnt, it is necessary to develop positive attitudes towards money
and have the self-efficacy to do so. Applied to financial literacy, self-efficacy is the belief that one has about the
ability to manage money (Bandura 1997; 2006). With regard to attitudes towards money, Barry (2016) identifies
five factors that influence young adults: (1) power/prestige; (2) financial planning; (3) quality because of money; (4)
importance of money; and (5) adherence to money. Having the attitude that, with money, one is able to influence
and impress others is characteristic of the power/prestige factor. These people see money as a symbol of success and

3
power (Barry 2016; Yamauchi and Templer 1982). Attitudes towards financial planning relate to how important one
finds it to budget and to use money carefully, while quality because of money means that people find it important to
buy the best products available, even though they have to pay more. The importance of money factor relates to the
idea that money is important and valuable, whereas adherence to money involves people’s attitudes toward the costs
or prices of the goods they buy (Barry 2016). Micarello et al. (2012) suggest that in situations of consumption,
people display a reflexive attitude. Based on this idea, they constructed a think-before-acting scale that measures
how important students find it to choose their goals based on the knowledge they have of a situation, and how
important they find it to take responsibility for the consequences of their actions (Micarello et al. 2012).
Few studies have investigated which factors are related to the financial literacy of high school students per
se, and most of these are restricted to cognitive aspects (Cameron et al. 2014; Erner et al. 2016; OECD 2014; 2017;
Sohn et al. 2012). To our knowledge, no studies have investigated the factors associated with high school students’
financial literacy: financial knowledge, attitudes towards money, financial self-efficacy, and financial behavior. To
fill this gap, we examine the levels of financial literacy among high school students in the Netherlands for all four of
these aspects, and explore the factors influencing them, while taking into account a range of individual and
household characteristics and indicators of ability and financial socialization and experience.
Factors related to financial literacy
In line with Cameron et al. (2014), we distinguish five groups of variables that potentially influence
financial literacy: (1) demographic characteristics of students (age, gender); (2) students’ ability (ability in
mathematics, cognitive ability/educational level, language spoken at home, and formal financial education), and
immigrant background; (3) socio-economic status (SES), parental wealth, and parents’ education level; (4) financial
socialization; and (5) financial experiences.
With regard to the first group, Lusardi and Mitchell (2014) indicate that there is an inverse U-shaped
relationship between age and financial knowledge with the lowest financial knowledge levels among the young and
the old. With respect to gender differences, the relevant literature is not conclusive; some studies report that gender
is a strong predictor of students’ level of financial knowledge, in favor of boys (Lusardi et al. 2010; Mandell 2008).
On the other hand, PISA (OECD 2017) results show that gender differences among 15 year olds differ between

4
countries, with no gender differences in financial knowledge performance found in the Netherlands. Furthermore,
people are brought up differently and socialize with their parents in different ways (Hare-Mustin and Marecek
1990), and this may influence attitudes and behavior of men and women differently. The literature has found that
men are more interested in money, while women are more conservative and security conscious (Furnham 1984;
Edwards 2007). With respect to financial behavior, Lyons (2004) reports that among college students, women show
riskier credit card behavior than men. Danes and Haberman (2007) state that among high school students, boys say
they achieve their financial goals better than girls do, whereas girls report using budgeting and comparing prices.
The literature provides evidence that financial literacy correlates with mathematics ability and the language
spoken at home (Cameron et al. 2014; Erner et al. 2016; OECD 2017). The relationship between the language
spoken at home and financial knowledge is supported by Förster et al. (2017), who report that the financial
knowledge of college students in Germany who mostly speak a language other than German at home is lower than
students who speak German at home. The PISA (OECD 2017) results show that on average in OECD countries,
students without an immigrant background perform better in financial knowledge tests than immigrant students. The
difference in scores related to immigrant background among OECD countries is largest in the Flemish Community
of Belgium, Italy, the Netherlands, and Spain. Similarly, the results of the Jumpstart Coalition for Personal Financial
Literacy (Mandell 2008) show lower financial knowledge levels among African-American college students
compared to European-American college students. Furthermore, the students’ educational level also seems to be
related to financial knowledge levels, and to attitudes towards money. Erner et al. (2016) found that German
students with a higher educational level in high school score higher on financial knowledge than students with a
lower educational level in high school. Lusardi et al. (2010) and Mandell (2008) have found that students with
higher cognitive ability are more likely to display higher financial knowledge levels, while Furnham (1984) states
that less well-educated people tend to be more interested in money than their highly educated counterparts.
Furthermore, a review of financial literacy education programs reveals that students who receive financial education
in school score higher on financial knowledge tests and show healthier money-related attitudes than students who do
not receive financial education (Amagir et al. 2017). Likewise, Danes and Haberman (2007) found that financial
education in school increases self-efficacy of high school students. It has also been shown that parental wealth
(Cameron et al. 2014), SES (Ali et al. 2016), and parents’ education level (Lusardi et al. 2010) are positively
associated with high school students’ financial knowledge.

5
The financial socialization of high school students is also related to financial literacy. We define financial
socialization, in line with Ward (1974, 2), as the “process by which young people acquire skills, knowledge, and
attitudes relevant to their effective functioning as consumers in the marketplace.” Financial socialization occurs
through many different pathways, including school, media (Sohn et al. 2012), and peers (Drever et al. 2015). Lusardi
et al. (2010) emphasize that both parents and peers play an important role in the relationship of young people with
their social environment. Yet, it is widely recognized that parents are the main agents of socialization for children
and adolescents (Drever et al. 2015), and Shim et al. (2009) show that parents who teach their children about
financial management have more impact on their children’s financial knowledge than financial education in high
school or the workplace. Students who discuss money matters with their parents score higher on questions about
financial concepts than students that never discuss the subject (Mandell 2001; OECD 2107), while college students
that discuss financial matters and learn about managing money from their parents demonstrate healthier financial
attitudes and behaviors (Jorgensen and Savla 2010). Further, Shim et al. (2013) report that students whose parents
actively taught them about financial management show more financial self-confidence and demonstrate more
positive financial attitudes and behaviors (e.g. in budgeting, paying, borrowing, investing, and saving).
Finally, adolescents may also increase their financial understanding when they have personal financial
experiences (Sherraden et al. 2011), such as holding a bank account and receiving a monthly allowance, which are
associated with higher levels of financial knowledge (OECD 2017; Sohn et al. 2012). On the other hand, several
studies note that an allowance by itself seems ineffective in establishing responsible financial behavior (Bucciol and
Veronesi 2014; Kim and Chatterjee 2013). Drever et al. (2015) further note that the effects of receiving an
allowance depend on the parents’ financial socialization practices. Giving pocket money in childhood while exerting
parental control over how to spend the money, combined with giving advice on saving in the adolescent phase,
seems to be the most effective strategy to increase saving behavior as an adult (Bucciol and Veronesi 2014).
Furthermore, students who gain financial experience through a part-time job score higher on financial knowledge
tests than students without a part-time job (OECD 2017; Valentina and Khayum 2005).

6
Methodology
Sample
For this study, we surveyed ninth-grade high school students with an average age of 14.62 years (SD = .685, age
range: 12–18) in the western part of the Netherlands in four educational tracks (EP-Nuffic 2015) in March 2017.
Dutch secondary education is divided into three main tracks: a four-year pre-vocational track (VMBO), a five-year
general secondary track (HAVO), and a six-year pre-university track (VWO); the lowest four-year track is
subdivided into a basic (VMBO-BK) and a more advanced level (VMBO-GT). We approached 37 high schools, of
which 22 agreed to participate in the survey. The 15 schools that declined to participate mostly did so because the
timing of the survey interfered with regular lessons, exams, or other research projects. Because financial education is
currently not part of the curricula in the Netherlands, we administered the survey during economics or tutor group
lessons. Students in the Netherlands receive economics instruction in eighth or ninth grade at all three levels of
secondary education. We initially administered 2,952 questionnaires, and 2,333 students returned them. Of the 2,333
students, 2,025 students completed the whole questionnaire, and these were used for the descriptive statistics (Table
1). Not all schools provided the required data, which meant 1,532 (for knowledge) and 1,492 (for attitudes, efficacy,
and behavior) students could be used in the final multilevel analyses. Table 1 (see Appendix) presents the summary
of the statistics for the full study sample (N = 2,025).
Measurements
Students were given 50 minutes to complete a background questionnaire, a financial knowledge test, and a
survey designed to assess attitudes towards money, financial self-efficacy, financial behavior, financial experiences,
and financial socialization issues. Furthermore, schools provided data on which students received financial
education and about the type of materials used, whether an existing financial education program or financial
education lessons designed by individual teachers. The schools also provided information on the math grades of the
students. Students’ background characteristics included educational level, gender, birthplace, and date of birth. We
asked students which language they used most at home and the birthplace of both parents to determine their (non-)
immigrant background, and asked them to record the highest educational level of both parents. To determine the
socio-economic status (SES) of the area, we asked students for their home postcode. The SES of the area consists of
four main components: the average income in a neighborhood, the percentage of people with a low income, the
7
percentage of people with a low education level, and the percentage of unemployed residents. This is a commonly
used measure to determine the SES of a particular area.
To measure the high school students’ knowledge of personal finance, we used an adapted version of the
Council for Economic Education (CEE) Test of Financial Knowledge (TFK) that consists of 40 multiple-choice
items (Walstad and Rebeck 2017). The TFK has been developed to assess the financial knowledge of eighth and
ninth-grade students in the USA in the following content areas: (1) earning an income; (2) buying goods and
services; (3) saving; (4) using credit; (5) financial investing; and (6) protecting and insuring (Walstad and Rebeck
2016). These content areas are based on the US National Standards for Financial Literacy (CEE 2013). The items in
the test are classified into two levels of intellectual skills; there are 15 items at a lower level (knowledge or
comprehension) and 25 items at a higher level (application that might include analysis and evaluation). We
translated and adjusted the test to the Dutch context in accordance with the non-mandatory Dutch standards for
financial education (NIBUD 2015), which meant we modified four items because of differences between Dutch and
American banks, financial institutions, and businesses. Based on the feedback received from teachers of economics,
we refined the test after a pilot study involving 249 students from different high school tracks. Finally, we
performed an item-and-test analysis to confirm the reliability and discriminating power of the financial knowledge
test. As a result of the pilot, we modified several individual items of the financial knowledge test for the final
survey.
To measure attitudes towards money, we modified and extracted items of the Money Attitude Scale by
Yamauchi and Templer (1982), the Attitudes Towards Money scale by Barry (2016), and the CAED Autonomy
(reflexive) scale by Micarello et al. (2012). We chose these scales because they reflect a broad domain of attitudes
towards money. Specifically, these scales reflect psychological aspects of money (power, success, status, and
superiority), a money management aspect (e.g. budgeting), and attitudes towards money in situations of
consumption. We added items that measure attitudes towards saving behavior, because this is an essential aspect of
the personal finance domain. Based on principal components factor analyses, we eliminated two individual items
that cross-loaded and eliminated items with factor loadings below 0.4. The preliminary study resulted in a 23-item
questionnaire divided into four aspects of attitudes towards money: power/prestige, financial planning, think before
acting, and quality for money. All items were rated on a 4-point Likert scale, ranging from “strongly disagree” to
“strongly agree.” The power/prestige aspect measured items like “I believe money is a symbol of success” and

8
“money is the most important goal in my life.” The second scale, financial planning, measured items including “I
find it important to keep track of my expenses” and “I find it important to make ends meet.” Meanwhile, the scale
think before acting measured items such as “I like to think thoroughly before deciding to buy something” and “I like
to research prices whenever I have the money to buy something.” Finally, the scale quality for money measured
items like “I don’t mind spending more to get the very best” and “I only buy name-brand products.” All the items
and the results of the final principal components factor analysis can be found in Table 1. The reliability scores were
found to be acceptable, with a Cronbach α of .82 for power/prestige, .75 for financial planning, .62 for think before
acting, and .61 for quality for money.
Insert Table 1
Self-efficacy was measured by asking the students to indicate on an 11-point scale: “How much confidence
do you have in your own ability to manage money?” The scale ranged from (0) cannot do, to (5) moderately
certainly can do, to (10) highly certainly can do (10) (Bandura 2006). Responsible financial behavior was measured
using eight items by asking the participants how frequently they had engaged in different activities, such as saving
for a particular purchase, budgeting their money, and making ends meet. Responses to all items were based on a 4-
point Likert scale, ranging from “never” to “very often.” The Cronbach α of .61 was acceptable.
The extent to which the students discuss financial matters with their parents or others and participate in the
family’s financial decisions was measured using five items on a 4-point Likert scale, ranging from “never” to “very
often.” The reliability scores of the two financial socialization scales were acceptable, with a Cronbach α of .61 and
.66 respectively. The results of the principal components factor analysis can be found in Table 2.
Insert Table 2
Financial experience was measured by asking the respondents whether they received pocket money and
whether they had a part-time job.
To increase the quality of our measurements (attitudes towards money, self-efficacy, financial behavior,
and financial socialization), we asked experts from Money Wise, a platform in which partners from the financial
sector, science, government, education, and information and consumer organizations pool their strengths to advance

9
responsible financial behavior in the Netherlands, and Nibud, a non-profit independent organization in the
Netherlands that gives information and advice on the financial matters of private households , for feedback
regarding the clarity of individual items. Based on this feedback, some items were either combined or eliminated.
Furthermore, we tested the instrument in a pilot study involving 156 students from different high school tracks
before administering the final survey.
Results
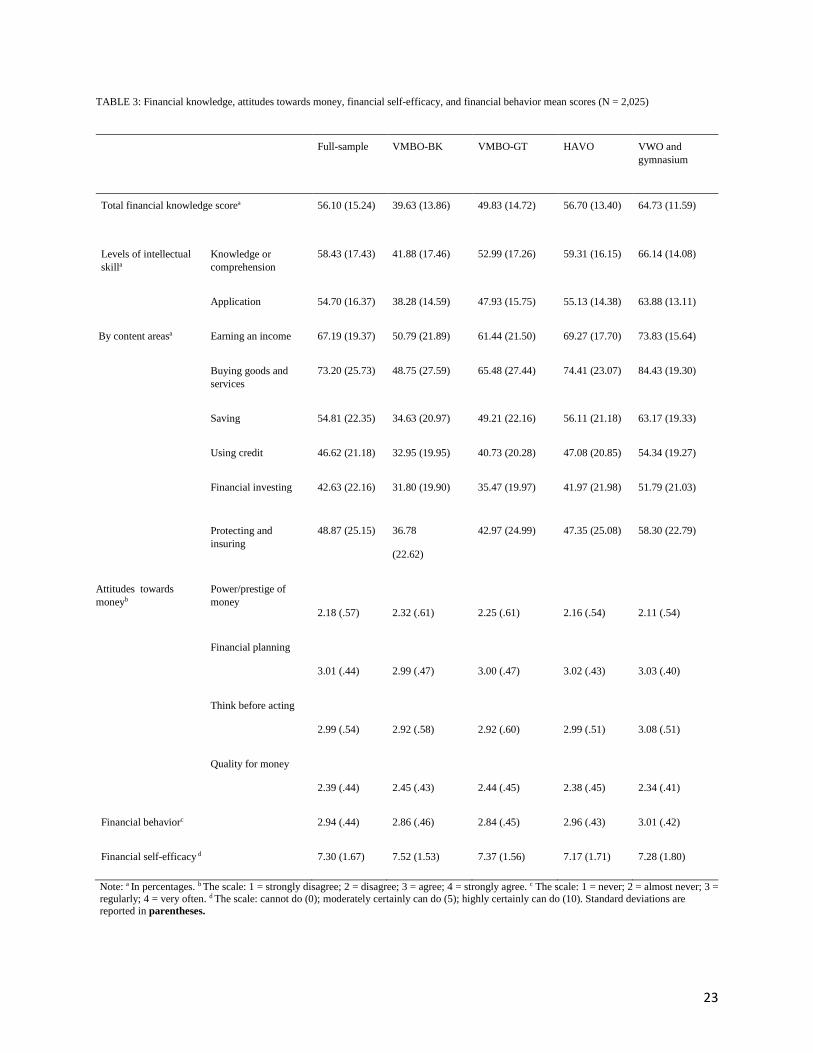
Table 3 presents the descriptive statistics for the financial knowledge test, the attitude towards money scale,
the financial self-efficacy scale, and the financial behavior scale. On average, students answered 56.1% (SD = 15.24)
of the financial knowledge questions correctly. The ANOVA indicated that there was a statistically significant
difference at the p < .01 level in financial knowledge scores for the four high school tracks [F(3, 2024) = 220.61, p =
.000]. A post hoc Tukey test showed that VMBO-BK students, from the lowest track, scored statistically
significantly lower (M = 39.6%, SD = 13.86, p = .000) than VWO students from the highest track (M = 64.7%, SD =
11.59, p = .000), with students from the two other tracks representing the middle ground. The financial knowledge
scores reflect the ranking order inherent in the Dutch high school system, and therefore are as expected. Our results
also show that the performance difference measured at the means between the 90th and 10th percentiles is 42.5%.
Overall, students perform slightly better at the knowledge or comprehension level compared to the application level,
with mean percentages of 58.4% (SD = 17.43) against 54.7% (SD = 16.37). With regard to the financial scores by
content, students overall score low on Financial Investing concepts (M = 42.63%, SD = 22.16) and high on Buying
Goods and Services concepts (M = 73.2%, SD = 25.73), with the exception of students from the lowest high school
track, who score the highest on concepts regarding Earning an Income. This corresponds with the findings of Money
Wise (2014), who report there is some limited attention paid to financial education topics such as buying goods and
services in the Netherlands.
With regard to attitudes towards money, the ANOVA indicate that all of the differences between the high
school tracks are statistically significant (p < .01), with the exception of the financial planning aspect [F(3, 2024) =
.599, p = .616]. For the first factor, power/prestige of money, a post hoc Tukey test shows that students from the
lowest track score statistically significantly higher (M = 2.32 , SD = .61) than students from the highest track (M =
2.11, SD = .54, p = .000). The higher the high school track, the lower the score on power/prestige of money.

10
Furthermore, students from the highest track (M = 3.08, SD = .51) score statistically significantly higher on the think
before acting scale compared to the lowest track students (M = 2.92, SD = .58, p = .003). For the fourth aspect, we
observe a different pattern. Students from the VMBO-BK track score (M = 2.45, SD = .43) statistically significantly
higher on quality for money compared to the highest track students (M = 2.34, SD = .41, p = .009). To sum up,
students from the lowest tracks think less before they decide to buy something compared to the highest-track
students; however, on the other hand, the lowest-track students find it important to get the best quality that one can
buy with money, and think that money offers power and prestige.
The overall average scores for financial behavior also show a ranking order that represent the high school
tracks, with an statistically significant difference between the tracks [F(3, 2024) = 18.221, p = .000]. Students from
the VWO track (M = 3.01, SD = .42) report engaging more often in healthier financial behavior than the VMBO-BK
students (M = 2.86, SD = .46, p = .000) and VMBO-GT students (M = 2.84, SD = .45, p = .000). Furthermore, no
statistically significant difference in financial self-efficacy scores is found for the four high school tracks [F(3, 2024)
= 2.523, p = .056].
Insert Table 3
Because of the nested structure of the data commonly found in educational settings, we performed a multilevel
analysis in MLwiN (Rasbash et al. 2009) at the school (level 2) and individual level (the lowest, level 1) in order to
identify the factors related to financial knowledge, attitudes towards money, financial self-efficacy, and financial
behavior.
In Table 4, we present linear models for factors related to financial knowledge for both the full sample and
split by high school track, comparable to how Erner et al. (2016) present their results for the German high school
tracks. For the full-sample model, the largest differences in financial knowledge scores are exhibited between the
high school tracks; the differences in financial knowledge scores represent the ranking order in our Dutch
educational system, as discussed previously. Furthermore, students without an immigrant background (born in the
Netherlands) score 2.6 points higher than students born outside the Netherlands, while students with fathers born in
the Netherlands score statistically significantly higher than immigrant students. Students whose mothers have a
college degree also score higher, and students who received financial education at school score 3.5 points higher in
financial knowledge than students who did not receive financial education. At the lowest level (VMBO-BK), we

11
find a statistically significant positive relationship between formal financial education, SES, language spoken at
home, and financial knowledge scores. For HAVO students, we find a negative relationship between formal
financial education and the financial knowledge score. We find no statistically significant gender differences in
financial knowledge scores for the full sample or by high school track.
Insert Table 4
Table 5 presents linear models for factors related to attitudes towards money, self-efficacy, and behavior for
the full sample. With regard to gender, boys score statistically significantly higher on financial behavior and on the
attitudes towards money scales of power/prestige, think before acting, and quality for money, while girls score
statistically significantly higher on the financial planning scale. Meanwhile, students with a high SES score
statistically significantly higher on the scale quality for money than students with a low SES. Furthermore, there is a
negative relationship between math grade and the scales power/prestige and quality for money; this means that for
each extra math grade point, the power/prestige score and quality for money scores are expected to decrease. For the
financial planning, think before acting, and financial behavior scales, there is a positive relationship with the math
grade. It is remarkable that formal financial education is only statistically significant for financial self-efficacy.
It appears there are some cultural-based differences between the students, as having a mother born in
Morocco or Suriname/Nederland Antilles seems to be the largest positive predictor for power/prestige. A mother
born in Suriname/Nederland Antilles is also positively related to financial planning and quality for money. On the
other hand, there is a negative relationship between financial behavior and students with fathers born in
Suriname/Netherlands Antilles. Financial socialization factors, such as discussing financial matters with peers and
parents and participating in the family’s financial decisions, are positively associated with both financial planning
and think before acting. There is also a positive relationship between discussing financial matters with peers and
parents and the power/prestige and financial behavior factors. Furthermore, there is a positive relationship between
participating in the family’s financial decisions and quality for money, and a negative relationship between receiving
pocket money and financial behavior. Having a part-time job is statistically significantly related to financial self-
efficacy. With regard to the high school tracks, students from the lower high school track have lower financial
behavior scores than students from the highest track, out of which only the two middle high school tracks are

12
statistically significant. Furthermore, students from the three lower high school tracks score lower on the think
before acting scale, compared to those from the highest track.
Insert Table 5
Discussion
Compared to American high school students, students in the Netherlands scored on average higher on a
similar test (TFK) (Walstad and Rebeck 2016). However, the results of this study reveal that there are statistically
significant and large differences in the financial knowledge levels of students from the different Dutch high school
tracks. This finding is consistent with studies by Erner et al. (2016), Mandell (2008), and Lusardi et al. (2010), who
found that students with higher cognitive ability or from a higher high school track were more likely to display
higher financial knowledge levels. The large gap in means we identified between the 90th and 10th percentiles
(42.5%) is consistent with the PISA (OECD 2017) study among 15-year-olds, which shows a gap in financial
knowledge of 39% (312 scored points out of 800) between the 90th and 10th percentiles in the Netherlands. Among
the OECD countries, the largest gaps in knowledge were observed in the Netherlands and Beijing-Shanghai-Jiangsu-
Guangdong (China). Consistent with the findings of Furnham (1984), our results show that students from the lower
high school tracks see money more as a means of establishing power compared to students from the higher high
school levels. In our multilevel analysis, it appears that this result is only statistically significant for HAVO students.
High school level is also a predictor for financial planning, think before acting, and financial behavior. We also
found a positive significant relationship between math grades and attitudes towards money and financial behavior.
In line with Cameron et al. (2014) and PISA (OECD 2017), our results show that math grade is also a predictor for
financial knowledge. High school track and math grade as predictors for financial knowledge, attitudes towards
money, and financial behavior may imply that the ability to solve personal financial problems might reflect the
general ability to solve problems of every type (Mandell 2008).
In line with Amagir et al. (2017), who report that financial education in schools can improve adolescents’
financial knowledge, our findings show that this school-based financial education is positively associated with
higher financial knowledge scores, with the exception of the HAVO track. At the lowest level (VMBO-BK),
financial education does make a significant difference to the level (8.8 points higher) of financial knowledge.

13
Notably, VMBO-BK students received financial education through an existing financial education program, whereas
HAVO students received financial education using materials developed by individual teachers. Consistent with
Danes and Haberman (2007), our results show that financial education does make a difference in how much
confidence students have in their own ability to manage money (self-efficacy). Interestingly, we found that financial
socialization factors such as discussing money matters with peers and parents relate more strongly to attitudes
towards money and financial behavior than the financial education provided in high school. Our findings also show
that participating in the family’s financial decisions positively relates to financial planning and think before acting.
These findings are consistent with the results of Jorgensen and Savla (2010) and Shim et al. (2013), who report that
students who discuss financial matters and actively learn about managing money from their parents have more
positive attitudes towards money and healthier financial behavior. However, we found no relationship between
financial socialization through parents and peers and financial knowledge. One explanation for these patterns could
be that financial education programs in schools place more emphasis on knowledge gains and less on attitudinal and
behavioral aspects, whereas the interactions with parents and peers emphasize and form these attitudinal and
behavioral aspects. This study also showed that girls and boys differ in their attitudes towards money and financial
behavior. Boys score higher on power/prestige, think before acting and quality for money, whereas girls score higher
on financial planning. An explanation might be that boys tend to be more concerned with money as a status symbol,
while girls are more conservative and security conscious (Furnham 1984; Edwards 2007). Further, we found boys to
score higher on financial behavior than girls, which is in line with Lyons’ findings (2004). On the other hand, no
statistically significant gender differences were found in financial knowledge scores; this confirms the findings of
PISA (OECD 2017), where no gender differences were found among 15-year-olds in the Netherlands.
As with Lusardi et al. (2010), we found that students whose mothers have a college degree have more
financial knowledge, while the SES of the area contributed to two significant differences. First, students with a high
SES have higher financial knowledge scores than students with a low SES. This is in line with Ali et al. (2016), who
found that SES predicts financial knowledge scores. Second, students with a high or middle-ranking SES score
higher on quality for money compared to students with a low SES, which suggests that students with a high SES
find it more important to buy the best products available, even though they have to pay more.
Consistent with previous international studies (Cameron et al. 2014; Erner et al. 2016; Förster et al. 2017;
OECD 2017), our results show a positive relationship between the language spoken at home and the financial

14
knowledge level. The gap we found in financial knowledge scores between immigrant and non-immigrant students
supports the results of PISA (OECD 2017) and Mandell (2008). In addition, there seem to be cultural differences in
attitudes towards money and financial behavior between immigrant and non-immigrant students, as those born in the
Netherlands score lower on power/prestige than students born outside the Netherlands. Furthermore, if we focus on
the ethnic background of the parents, it seems that immigrant students with mothers born in Morocco or
Suriname/Netherlands Antilles see money more as a symbol of success and power than students without an
immigrant background. On the other hand, students with a mother born in Suriname/Nederland Antilles have
positive attitudes towards money in terms of the financial planning and quality for money factors. Furthermore,
immigrant students with a father born in Suriname/Netherlands Antilles have lower financial behaviors levels than
students with a father born in the Netherlands. An explanation for these findings could be the absence of Surinamese
and Antillean fathers; in the Netherlands, almost half of the Surinamese and Antillean families are single-parent
families, of which 90% are maternal families (Distelbrink and Ketner 2011). In addition, Lyons (2004) reports that
black and/or Hispanic students are more likely to exhibit risky financial behavior.
Interestingly, the financial experience of having a job is only statistically significant for financial self-
efficacy. Further, the negative association we found between receiving pocket money and financial behavior
confirms previous evidence from Bucciol and Veronesi (2014) and Kim and Chatterjee (2013), who report that an
allowance is only effective in combination with parental socialization.
The results of this study highlight a number of areas of concern. Certain population groups, such as
immigrant students, those with less cognitive ability and low SES, those with mothers without a college degree, and
those who do not discuss financial matters with family and peers, are disadvantaged by having a lower financial
knowledge score and do not possess the attitude required to implement this knowledge in daily financial decision
making. Thus, these findings support the need for financial education in high school to ensure more equal
opportunities. The significant heterogeneity we found between students means that a “one size fits all” approach
is not suitable. In the design of financial education programs, several aspects must be taken into account, as our
study shows that the financial literacy of students is more than just financial knowledge. Therefore, financial
education programs should also focus on attitudinal and behavioral components to strengthen financial decision
making in daily life. Our findings also highlight the importance of developing financial education programs that
address differences in attitudes and behaviors between boys and girls. The study also shows the importance of

15
parents and peers on the attitude and behavior of students. Thus, involving parents and peers in high school financial
education programs could make these programs more effective. This is in line with findings by Lusardi et al. (2010),
Bruhn et al. (2016), and the OECD (2017), who report that involving parents in the financial education of their
children may result in higher financial literacy levels. Such financial education program could also have a positive
impact on the financial literacy of the parents.
Conclusion
Our results support and extend previous research on factors relating to financial knowledge, attitudes
towards money, financial self-efficacy, and financial behavior among high school students. However, we can not
claim anything about the direction of the causality of the relationships, further research is required to address this
issue. Our outcomes are in line with previous studies, and thereby confirm the validity of our instruments. Each life
stage involves different money issues. Thus, to develop the instruments further, we must explore the factors related
to the financial literacy of students. This study demonstrates that students’ attitudes towards money and financial
behavior are complex and varied. Although we provide evidence about factors that discriminate between students’
attitudes towards money and financial behavior, further investigation is needed to explain cultural and gender-
related differences between students. Future research must also investigate whether parenting styles, culturally
determined or not, affect the financial literacy of students. Finally, experimental studies involving high school
students are needed to investigate whether financial education can improve financial decision making in their daily
lives.

16
Acknowledgements
This study was supported in part by Money Wise Platform (In Dutch: Wijzer in geldzaken).
Compliance with Ethical Standards
Conflict of interest: The authors declare that they have no conflict of interest.
Ethical Approval: All procedures performed in studies involving human participants were in accordance with the
ethical standards of the institutional and/or national research committee and with the 1964 Helsinki declaration and
its later amendments or comparable ethical standards.

17
References
Ali, P., M. E. Anderson, C. H. McRae, and I. Ramsay. 2016. The financial literacy of young people: Socio-
economic status, language background and the rural-urban chasm. Australian and International Journal of Rural
Education 26 (1): 54–66.
Amagir, A., W. Groot, H. Maassen van den Brink, and A. Wilschut. 2017. A review of financial-literacy education
programs for children and adolescents. Citizenship, Social and Economics Education, 1– 25. DOI :
10.1177/2047173417719555
Bandura, A. 1997. Self-efficacy: The exercise of control. New York: Freeman.
—2006. Guide for constructing self-efficacy scales. Self-Efficacy Beliefs of Adolescents 5: 307–337.
Barry, D. 2016. Measurement of young adults’ attitudes towards money. In International handbook of financial
literacy, ed. C. Aprea, E. Wuttke, K. Breuer, N. K. Koh, P. Davies, B. Greimel-Fuhrmann, and J. S. Lopus, 449–
464. Singapore: Springer.
Bruhn, M., L. de Souza Leão, A. Legovini, R. Marchetti, and B. Zia. 2016. The impact of high school financial
education: Evidence from a large-scale evaluation in Brazil. American Economic Journal: Applied Economics 8 (4):
256–295.
Bucciol, A., and M. Veronesi. 2014. Teaching children to save: What is the best strategy for lifetime savings?
Journal of Economic Psychology 45: 1–17.
Cameron, M. P., R. Calderwood, A. Cox, S. Lim, and M. Yamaoka. 2014. Factors associated with financial literacy
among high school students in New Zealand. International Review of Economics Education 16: 12–21.
Council for Economic Education (CEE) 2013. National standards for financial literacy. New York: CEE.
Danes, S. M., and H. Haberman. 2007. Teen financial knowledge, self-efficacy, and behavior: A gendered view.
Journal of Financial Counseling and Planning 18 (2): 48–60.
Distelbrink, M., and S. Ketner. 2011. Vaderschap is geen playstation. Pedagogiek 31 (1): 53–67.
Drever, A. I., E. Odders-White, C. W. Kalish, N. M. Else-Quest, E. M. Hoagland, and E. N. Nelms. 2015.
Foundations of financial well‐being: Insights into the role of executive function, financial socialization, and
experience‐based learning in childhood and youth. Journal of Consumer Affairs 49 (1): 13–38.
Edwards, R., M. W. Allen, and C. R. Hayhoe. 2007. Financial attitudes and family communication about students’
finances: The role of sex differences. Communication Reports 20 (2): 90–100. DOI: 10.1080/08934210701643719
EP-Nuffic 2015. Education system: The Netherlands (2nd edition, January 2011; Version 4, January 2015).
Retrieved from https://www.nuffic.nl/en/publications/find-a-publication/education-system-the-netherlands.pdf
Erner, C., M. Goedde-Boyske, and M. Oberste. 2016. Financial literacy of high school students: Evidence from
Germany. The Journal of Economic Education 47 (2): 95–105. DOI: 10.1080/00220485.2016.1146102
Förster, M., R. Happ, and D. Molerov. 2017. Using the US Test of Financial Literacy in Germany—Adaptation and
validation. The Journal of Economic Education 48 (2): 123–135. DOI: 10.1080/00220485.2017.1285737
Furnham, A. 1984. Many sides of the coin: The psychology of money usage. Personality and
Individual Differences 5: 501–509.

18
Hare-Mustin, R. T., and J. Marecek. 1990. Gender and the meaning of difference. In Making a difference:
Psychology and the construction of gender, ed. R. T. Hare-Mustin and J. Marecek, 22–64. New Haven: Yale
University Press.
Jorgensen, B. L., and J. Savla. 2010. Financial literacy of young adults: The importance of parental socialization.
Family Relations 59 (4): 465–478. DOI: 10.1111/j.1741-3729.
2010.00616.x.
Kim, J., and S. Chatterjee. 2013. Childhood financial socialization and young adults’ financial management. Journal
of Financial Counseling and Planning 24 (1): 61–79, 91–92. Retrieved from https://search-proquest-
com.rps.hva.nl:2443/docview/1412584809?accountid=130632
Lusardi, A., O. S. Mitchell, and V. Curto. 2010. Financial literacy among the young. Journal of Consumer Affairs 44
(2): 358–380.
Lusardi, A., and O. S. Mitchell. 2014. The economic importance of financial literacy: Theory and evidence. Journal
of Economic Literature 52 (1): 5–44. Retrieved from http://www.jstor.org/stable/24433857
Lyons, A. C. 2004. A profile of financially at‐risk college students. Journal of Consumer Affairs 38 (1): 56–80.
Mandell, L. 2008. The financial literacy of young American adults: Results of the 2008 national Jump$tart
Coalition survey of high school seniors and college students. Washington, DC: Jump$tart Coalition.
Micarello, H., M. Palacios, and M. Burgos. 2012. Application of the CAEd autonomy scale to assess the impact of
financial education. CAEd. Retrieved from http://www.pesquisa.caedufjf.net/wp-
content/uploads/2012/03/autonomia_marcelo_burgos.pdf.
Money Wise (Wijzer in geldzaken) 2014. Financieel gedrag van kinderen en jongeren. Retrieved from
http://www.wijzeringeldzaken.nl/platform-wijzeringeldzaken/publicaties/7546-wig-rapp-fin-gedrag-kinderen-v3.pdf
National Institute for Family Finance Information (NIBUD) 2015. Nibud learning goals and competences for
children and adolescents (revised edition). Retrieved from https://www.nibud.nl/wp-content/uploads/Learning-
goals-and-competences-for-children-and-adolescents.pdf
Organisation for Economic Co-operation and Development (OECD) 2014. PISA 2012 results: Students and money:
Financial literacy skills for the 21st century (Vol. VI). In PISA. Paris: OECD Publishing. Retrieved from
http://dx.doi.org/10.1787/9789264208094-en
—2017. PISA 2015 results (Volume IV): Students’ financial literacy. Paris: OECD Publishing. Retrieved from
http://dx.doi.org/10.1787/9789264270282-en
Rasbash, J., F. Steele, W. J. Browne, and H. Goldstein. 2009. A user’s guide to MLwiN, v2.10. Bristol: Centre for
Multilevel Modelling, University of Bristol.
Sherraden, M. S., L. Johnson, B. Guo, and W. Elliott. 2011. Financial capability in children: Effects of participation
in a school-based financial education and savings program. Journal of Family and Economic Issues 32 (3): 385–399.
Shim, S., J. J. Xiao, B. L. Barber, and A. C. Lyons. 2009. Pathways to life success: A conceptual model of financial
well-being for young adults. Journal of Applied Developmental Psychology 30 (6): 708–723.
Shim, S., J. Serido, L. Bosch, and C. Tang. 2013. Financial identity‐processing styles among young adults: A
longitudinal study of socialization factors and consequences for financial capabilities. Journal of Consumer Affairs
47 (1): 128–152.

19
Sohn, S. H., S. H. Joo, J. E. Grable, S. Lee, and M. Kim. 2012. Adolescents’ financial literacy: The role of financial
socialization agents, financial experiences, and money attitudes in shaping financial literacy among South Korean
youth. Journal of Adolescence 35 (4), 969–980.
Valentine, G. P., and M. Khayum. 2005. Financial literacy skills of students in urban and rural high schools. Delta
Pi Epsilon Journal 47 (1): 1–10.
Walstad, W. B., and K. Rebeck. 2016. Test of financial knowledge: Examiner’s manual. New York: Council for
Economic Education.
—2017. The test of financial literacy: Development and measurements characteristics. The Journal of Economic
Education 48 (2): 113–122.
Ward, S. 1974. Consumer socialization. Journal of Consumer Research 1 (2): 1–14.
Yamauchi, K. T., and D. J. Templer. 1982. The development of a money attitude scale. Journal of Personality
Assessment 46 (5): 522–528.

20
Appendix
TABLE 1: Study sample description (N = 2,025)
All levels (%) Preparatory
secondary
vocational
education
(VMBO-BK)
(%)
Preparatory
secondary
vocational
education
(VMBO-GT)
(%)
Senior
general
education
(HAVO)
(%)
Pre-university
education (VWO
and gymnasium)
(%)
Gender Male 50.5 63.8 52.7 47.2 49.0
Language spoken at
home
Dutch 88.6 74.1 80.9 89.7 91.0
SES Low 33.6 68.4 38.5 29.5 25.0
Moderate 32.7 21.8 32 36.0 32.8
High 33.6 9.8 29.6 34.4 42.3
Formal financial
education
Yes 17.1 31.6 13.0 21 12.4
Higher education degree: Mother 37.2 10.3 19.7 36.5 58.7
Higher education degree: Father 36.5 12.7 19.9 35.5 56.7
Student’s country of
birth
The Netherlands 94.3 85.1 92.9 96.2 95.7
Mother’s country of
birth
The Netherlands 75.7 51.5 68.2 79.9 83.1
Morocco 6.8 14.4 11.1 4.0 4.7
Turkey 4.8 12.0 7.1 4.4 1.7
Suriname/Netherlands
Antilles
2.8 8.4 3.4 2.5 1.1
Other 9.9 13.8 10.1 9.2 9.5
Father’s country of
birth
The Netherlands 75.6 50.0 68.4 79.5 83.9
Morocco 6.9 13.7 10.3 4.9 4.5
Turkey 5.3 12.5 8.5 4.6 1.9

21
Suriname/Netherlands
Antilles
3.3 9.5 4.1 2.7 1.9
Other 8.8 14.3 8.7 8.4 7.9
Part-time job (Yes) 41.1 38.5 41.6 42.5 39.8
Monthly allowance (Yes) 83.1 83.9 85.4 83.2 81.0
Tables and figures
TABLE 1: Attitudes towards money (factor loadings)
Power/prestige
Financial
planning
Think before
acting Quality for money
I believe money is a symbol of success. .76 .03 -.01 .09
Money can help you express how successful you
are. .72 -.06 .11 .10
Money is the most important goal in my life. .74 .02 -.17 .05
I feel that money is the only thing that I can really
count on. .73 .02 -.10 .06
I believe you can influence other people to do
things for you with money. .68 -.06 .16 .06
I firmly believe that money can solve all my
problems. .68 .03 -.10 .09
I believe you can impress others by owning
expensive things. .59 -.14 .15 .16
I find it important to keep track of my expenses. -.02 .68 .22 -.01
I find it important to keep track of my income. .07 .62 .23 .05
I find it important to do financial planning for the
future. .06 .60 -.04 -.02
I find it important to make ends meet. .01 .58 .17 .01
I find it important to use my money very
carefully. -.17 .60 .20 -.02
I find it important to save money for the future. -.05 .61 -.02 .01

22
I find it important to save money for unexpected
expenses. -.02 .52 .06 -.05
I find it important to research prices whenever I
have the money to buy something. .07 .07 .76 -.09
I find it important to know if there are any
discounts or deals currently available for the
purchases I want to make.
.04 .14 .66 -.06
Whenever I buy more expensive items, I always
try to obtain more information on the product’s
quality.
-.12 .20 .62 .11
I like to think thoroughly before deciding to buy
something. -.18 .31 .47 .02
I pay more to get the very best, because I know
that is important. .07 .04 .07 .66
I don’t mind spending more to get the very best. -.01 .05 -.05 .63
I buy the most expensive items available. .25 -.14 -.22 .61
I only buy name-brand products. .31 -.10 -.10 .59
I only buy top-of-the-line products. .03 .16 .20 .56
TABLE 2: Financial socialization (factor loadings)
Discuss financial matters Decision making/advise
How often do you talk about managing
money at home? .81 .01
How often do you talk about managing
money with friends? .76 .03
How often do you talk about budgeting
your expenses at home? .69 .32
How often do you participate in the
family’s financial decisions? .12 .84
How often do you give advice to your
parents about managing money? .13 .83
23
TABLE 3: Financial knowledge, attitudes towards money, financial self-efficacy, and financial behavior mean scores (N = 2,025)
Full-sample VMBO-BK
VMBO-GT
HAVO
VWO and
gymnasium
Total financial knowledge scorea 56.10 (15.24) 39.63 (13.86) 49.83 (14.72) 56.70 (13.40) 64.73 (11.59)
Levels of intellectual
skilla
Knowledge or
comprehension
58.43 (17.43) 41.88 (17.46) 52.99 (17.26) 59.31 (16.15) 66.14 (14.08)
Application 54.70 (16.37) 38.28 (14.59) 47.93 (15.75) 55.13 (14.38) 63.88 (13.11)
By content areasa Earning an income 67.19 (19.37) 50.79 (21.89) 61.44 (21.50) 69.27 (17.70) 73.83 (15.64)
Buying goods and
services
73.20 (25.73) 48.75 (27.59) 65.48 (27.44) 74.41 (23.07) 84.43 (19.30)
Saving 54.81 (22.35) 34.63 (20.97) 49.21 (22.16) 56.11 (21.18) 63.17 (19.33)
Using credit 46.62 (21.18) 32.95 (19.95) 40.73 (20.28) 47.08 (20.85) 54.34 (19.27)
Financial investing 42.63 (22.16) 31.80 (19.90) 35.47 (19.97) 41.97 (21.98) 51.79 (21.03)
Protecting and
insuring
48.87 (25.15) 36.78
(22.62)
42.97 (24.99) 47.35 (25.08) 58.30 (22.79)
Attitudes towards
moneyb
Power/prestige of
money 2.18 (.57)
2.32 (.61)
2.25 (.61)
2.16 (.54)
2.11 (.54)
Financial planning
3.01 (.44)
2.99 (.47)
3.00 (.47)
3.02 (.43)
3.03 (.40)
Think before acting
2.99 (.54)
2.92 (.58)
2.92 (.60)
2.99 (.51)
3.08 (.51)
Quality for money
2.39 (.44)
2.45 (.43)
2.44 (.45)
2.38 (.45)
2.34 (.41)
Financial behaviorc 2.94 (.44) 2.86 (.46) 2.84 (.45) 2.96 (.43) 3.01 (.42)
Financial self-efficacy d 7.30 (1.67) 7.52 (1.53) 7.37 (1.56) 7.17 (1.71) 7.28 (1.80)
Note: a In percentages. b The scale: 1 = strongly disagree; 2 = disagree; 3 = agree; 4 = strongly agree. c The scale: 1 = never; 2 = almost never; 3 = regularly; 4 = very often. d The scale: cannot do (0); moderately certainly can do (5); highly certainly can do (10). Standard deviations are reported in parentheses.

24
TABLE 4: Factors related to financial knowledge (multilevel analyses)
Full-
sample b
(SE)
VMBO-BK
b (SE)
VMBO-T
b (SE)
HAVO
b (SE)
VWO
b (SE)
Intercept
55.179
(2.016)***
29.078
(4.720)***
39.979
(3.735)***
48.194
(3.763)***
59.153
(2.830)***
Male
-0.324
(0.642) -1.909 (2.292) -2.013 (1.405) 0.929 (1.177) -0.170 (0.949)
Middle SES1 0.258 (0.907) 2.519 (2.943) 0.594 (1.889) -0.578 (1.690) -0.811 (1.390)
Highest SES1
0.719
(0.969) 6.377 (3.589)* 0.769 (1.969) 0.764 (1.758) 0.140 (1.450)
Math grade
0.724
(0.258)*** 1.508 (0.766)** 2.389 (0.586)*** 0.798 (0.488) 0.161 (0.378)
Formal financial education 3.462 (1.932)* 8.754 (2.635)*** 2.593 (2.574) -6.583 (3.497)* 4.433 (2.780)
Language spoken at home: Dutch2
1.369
(1.134) 5.539 (2.902)* 1.283 (2.173) 0.454 (2.189) 0.658 (2.047)
College degree: Father
0.105
(0.785) -4.493 (3.584) 2.612 (1.871) -0.477 (1.390) 0.273 (1.087)
College degree: Mother 1.629 (0.781)** -1.030 (3.592) 4.354 (1.875)** 2.428 (1.380)** -0.098 (1.093)
Student’s birth country: The Netherlands3
2.572 (1.453)* -0.015 (3.299) 6.466 (3.257)* 4.046 (3.031) -0.873 (2.276)
Father’s birth country: The Netherlands3
3.677
(1.025)*** 1.157 (3.996) 2.054 (2.155) 4.128 (1.787)** 5.409 (1.628)*** Mother’s birth country: The
Netherlands3
-0.981
(1.020) -1.023 (3.873) -1.596 (2.107) -1.902 (1.960) 1.273 (1.507)
Socialization: Discuss financial matters -0.483 (0.550) -2.744 (1.653) -0.940 (1.267) 1.372 (1.007) -1.055 (0.827)
Socialization: Decisions
-0.193
(0.469) -1.029 (1.474) -0.532 (0.977) -0.542 (0.891) 0.596 (0.706)
Pocket money
0.892
(0.845) 3.424 (3.062) 3.033 (1.886) 0.771 (1.574) -0.217 (1.213)
Job 0.394 (0.640) 3.296 (2.168) 0.457 (1.407) -0.094 (1.183) -0.802 (0.943)
VMBO-BK4
-21.607
(1.760)***
VMBO-T4
-10.123
(1.022)***
HAVO4 -8.075 (0.810)***
Variance explained:
School level 31.7% 14.2% 24.2% 6.2% 27.7%
N 19 5 12 10 10
Individual level 13.1% 1.1% 5.7% 10.1% 11.0%
N 1,532 145 366 484 537
ICC 4.4% 0% 0.9% 3.7% 3.8%
–2*log likelihood
12.039.087
1.138.241
2.912.376
3.833.980
4.063.940
Note: 1 reference category: low SES. 2 reference category: other languages. 3 reference category: other countries. 4 reference category: VWO. *p < .10; **p < .05; ***p < .01

25
TABLE 5: Factors related to attitudes towards money, financial self-efficacy, and financial behavior (multilevel analyses)
Dependent variable
Independent variables
Attitudes:
Power/prestigea
b (SE)
Attitudes:
Financial
planninga
b (SE)
Attitudes:
Think before
actinga
b (SE)
Attitudes:
Quality for
moneya
b (SE)
Financial self-
efficacyb
b (SE)
Financial
behaviorc
b (SE)
Intercept
2.124
(0.097)***
3.007
(0.076)***
2.894
(0.097)***
2.196
(0.078)***
7.253
(0.301)***
2.954
(0.074)***
Male
0.313
(0.028)***
-0.048
(0.022)**
0.204
(0.028)***
0.150
(0.022)*** -0.078 (0.088)
0.122
(0.022)***
Middle SES1 0.021 (0.039) 0.031 (0.030) -0.003 (0.038) 0.051 (0.031)* 0.027 (0.119) 0.040 (0.029)
High SES1 0.013 (0.041) -0.002 (0.032) 0.011 (0.041) 0.066 (0.033)** -0.029 (0.123) 0.012 (0.031)
Math grade -0.049
(0.011)***
0.025
(0.009)*** 0.027 (0.011)**
-0.018
(0.009)** -0.010 (0.034)
0.039
(0.009)***
Formal financial
education -0.074 (0.060) 0.072 (0.054) 0.058 (0.064) 0.019 (0.047) 0.286 (0.146)* 0.040 (0.039)
Language spoken at
home: Dutch2 -0.070 (0.051) -0.014 (0.040) 0.068 (0.051) -0.051 (0.041) -0.116 (0.161) -0.007 (0.040)
College degree: Father 0.026 (0.034) 0.029 (0.026) -0.013 (0.034) 0.008 (0.027) 0.115 (0.108) 0.053 (0.026)**
College degree: Mother 0.043 (0.034) -0.017 (0.026) 0.005 (0.034) 0.034 (0.027) 0.039 (0.108) 0.021 (0.026)
Student’s birth country:
The Netherlands3
-0.134
(0.066)** 0.078 (0.051) 0.047 (0.065) 0.027 (0.053) -0.020 (0.208) 0.047 (0.051)
Father’s birth country:
Morocco4 -0.160 (0.126) 0.084 (0.098) -0.061 (0.125) 0.058 (0.101) 0.262 (0.393) -0.138 (0.097)
Father’s birth country:
Turkey4 -0.094 (0.120) 0.008 (0.093) 0.161 (0.119) 0.035 (0.097) -0.028 (0.378) -0.045 (0.093)
Father’s birth country:
Suriname/Netherlands
Antilles4 -0.069 (0.090) 0.015 (0.069) 0.011 (0.088) 0.088 (0.072) 0.183 (0.285)
-0.143
(0.069)**
Father’s birth country:
Other4 0.053 (0.058) 0.092 (0.045)* 0.051 (0.058) 0.046 (0.047) 0.039 (0.183) -0.009 (0.045)
Birth country Mother:
Morocco4 0.295 (0.129)** -0.135 (0.100) 0.005 (0.127) -0.063 (0.103) -0.196 (0.402) -0.019 (0.099)
Mother’s birth country:
Turkey4 0.045 (0.128) 0.105 (0.099) 0.041 (0.126) -0.023 (0.102) -0.047 (0.398) -0.100 (0.098)
Mother’s birth country:
Suriname/Netherlands
Antilles4 0.348 (0.105)** 0.200 (0.081)** -0.000 (0.104)
0.274
(0.084)*** -0.142 (0.329) 0.097 (0.081)
Mother’s birth country:
Other4 0.067 (0.053) 0.014 (0.041) 0.056 (0.053) -0.016 (0.043) -0.073 (0.167)
-0.126
(0.041)***
Socialization: Discuss
financial matters 0.046 (0.024)**
0.166
(0.018)***
0.085
(0.024)*** 0.028 (0.019) 0.000 (0.076)
0.133
(0.019)***
Socialization: Decisions 0.014 (0.021)
0.047
(0.016)***
0.054
(0.020)*** 0.028 (0.016)* -0.041 (0.065) 0.018 (0.016)

26
Pocket money -0.004 (0.037) -0.042 (0.028) -0.023 (0.036) 0.036 (0.030) -0.008 (0.116)
-0.085
(0.028)***
Job -0.015 (0.028) -0.009 (0.022) -0.036 (0.028) 0.015 (0.022)
0.211
(0.089)** -0.016 (0.022)
VMBO-BK5 0.087 (0.063) -0.038 (0.053)
-0.196
(0.065)*** 0.081 (0.049) 0.291 (0.177) -0.070 (0.045)
VMBO-T5 0.063 (0.041) -0.022 (0.033)
-0.170
(0.042)*** 0.076 (0.033)** 0.151 (0.123)
-0.124
(0.031)***
HAVO5 0.084 (0.035)**
-0.073
(0.027)***
-0.138
(0.035)*** 0.033 (0.028) -0.018 (0.109)
-0.079
(0.027)***
Variance explained:
School level (between)
N
2.1%
19
1.0%
19
1.0%
19
0,5%
19
0,0%
19
4.6%
19
Individual level (within)
N
14.4%
1,492
15%
1,493
8.3%
1,492
8.2%
1,493
2.0%
1,465
10.7%
1,492
ICC 3.0% 2.4% 1.5% 1.1% 0.0% 0.6%
–2*log likelihood 2.320.950 1.558.058
2.285.032 1.662.739 5.628.889 1.557.694
Note: a The scale: 1 = strongly disagree; 2 = disagree; 3 = agree; 4 = strongly agree. b The scale: cannot do (0); moderately certainly can do (5);
highly certainly can do (10). c The scale: 1 = never; 2 = almost never; 3 = regularly; 4 = very often. 1 reference category: low SES. 2 reference
category: other languages. 3 reference category: other countries. 4 reference category: the Netherlands. 5 reference category: VWO.
*p < .10; **p < .05; ***p < .01

TIER WORKING PAPER SERIES
TIER WP 17/18
© TIER 2017
ISBN 978-94-003-0135-1