Financial Intermediation in Private Equity: How Well Do ...
45
Financial Intermediation in Private Equity: How Well Do Funds of Funds Perform? Robert S. Harris* Tim Jenkinson** Steven N. Kaplan*** and Ruediger Stucke**** Abstract This paper focuses on funds of funds (FOFs) as a form of financial intermediation in private equity (both buyout and venture capital). Compared to investments in hedge funds or publicly traded stocks, private equity investments in direct funds are less liquid, less easily scaled and have higher search and monitoring costs. As a consequence, FOFs in private equity may provide valuable intermediation for investors who want exposure to the asset class. We benchmark FOF performance (net of their fees) against both public equity markets and strategies of direct investment into private equity funds. We also examine the types of portfolios private equity FOFs create when they pool investor capital. After accounting for fees, primary FOFs provide returns equal to or above public market indices for both buyout and venture capital. While FOFs focusing on buyouts outperform public markets, they underperform direct fund investment strategies in buyout. In contrast, the average performance of FOFs in venture capital is on a par with results from direct venture fund investing. This suggests that FOFs in venture capital (but not in buyouts) are able to identify and access superior performing funds. This Draft: June 2015 Keywords: Private Equity; Fund of Funds; Financial Intermediation JEL classification: G20, G23 * University of Virginia Darden School of Business, ** Said Business School, University of Oxford and CEPR, *** University of Chicago Booth School of Business and NBER, and **** Warburg Pincus. This research has been supported by the UAI Foundation. We thank Burgiss for supplying data and especially James Bachman and Julia Bartlett. We also thank Wendy Hu and William Waller for excellent research assistance. Harris has invested in private and public equities and has held a board position for funds investing in public equities. Kaplan has invested in and consulted to buyout and venture capital funds of funds. Jenkinson has consulted to limited partners, and has held board positions in private equity backed portfolio companies and in a fund investing in private equity. He also has invested in private and public equities. Address correspondence to Robert Harris, University of Virginia Darden School of Business, 100 Darden Boulevard, Charlottesville, VA 22901 or e-mail at [email protected].
Transcript of Financial Intermediation in Private Equity: How Well Do ...

Financial Intermediation in Private Equity:
How Well Do Funds of Funds Perform?
Robert S. Harris* Tim Jenkinson** Steven N. Kaplan*** and Ruediger Stucke****
Abstract This paper focuses on funds of funds (FOFs) as a form of financial intermediation in private equity (both buyout and venture capital). Compared to investments in hedge funds or publicly traded stocks, private equity investments in direct funds are less liquid, less easily scaled and have higher search and monitoring costs. As a consequence, FOFs in private equity may provide valuable intermediation for investors who want exposure to the asset class. We benchmark FOF performance (net of their fees) against both public equity markets and strategies of direct investment into private equity funds. We also examine the types of portfolios private equity FOFs create when they pool investor capital. After accounting for fees, primary FOFs provide returns equal to or above public market indices for both buyout and venture capital. While FOFs focusing on buyouts outperform public markets, they underperform direct fund investment strategies in buyout. In contrast, the average performance of FOFs in venture capital is on a par with results from direct venture fund investing. This suggests that FOFs in venture capital (but not in buyouts) are able to identify and access superior performing funds.
This Draft: June 2015
Keywords: Private Equity; Fund of Funds; Financial Intermediation
JEL classification: G20, G23
* University of Virginia Darden School of Business, ** Said Business School, University of Oxford and CEPR, *** University of Chicago Booth School of Business and NBER, and **** Warburg Pincus. This research has been supported by the UAI Foundation. We thank Burgiss for supplying data and especially James Bachman and Julia Bartlett. We also thank Wendy Hu and William Waller for excellent research assistance. Harris has invested in private and public equities and has held a board position for funds investing in public equities. Kaplan has invested in and consulted to buyout and venture capital funds of funds. Jenkinson has consulted to limited partners, and has held board positions in private equity backed portfolio companies and in a fund investing in private equity. He also has invested in private and public equities. Address correspondence to Robert Harris, University of Virginia Darden School of Business, 100 Darden Boulevard, Charlottesville, VA 22901 or e-mail at [email protected].

1
This paper analyses funds of funds (FOFs) as a form of financial intermediation in private equity.
While there is a large literature on direct fund investing in private equity, there is scant evidence
on FOFs which themselves invest in these direct funds. Compared to hedge funds or publicly
traded stocks, private equity investments in direct funds are illiquid, not easily scaled and have
high search and monitoring costs. By pooling capital across investors, FOFs create a second level
of intermediation that potentially provides specialized investment skills, diversification and lower
cost services (e.g. due to economies of scale) for investors wanting exposure to private equity.
Against these advantages must be weighed the additional fees charged by the FOF manager.
We benchmark FOF performance, net of their fees, against both public equity markets
and strategies of direct fund investment. Our research takes advantage of detailed, fund-level
cash flows from Burgiss on both FOFs and direct funds. We use information on their holdings to
understand the types of portfolios they create for their investors. As with previous research on
private equity, we distinguish between buyout and venture capital (VC) investments.
We find that FOFs – both in buyout and VC – have generated returns above those from
investing in public equities. As a result, exposure to private equity through FOFs would have
increased returns relative to public equities, although investors would bear illiquidity costs
associated with private equity investing. These higher returns remain even after accounting for
fees that occur at both the FOF and direct fund level. Our measures of FOF performance are
through year-end 2012 and cover FOFs that started in years 1987 through 2007.
When we compare FOFs to direct fund investing, we find significantly lower returns for
FOFs that focus on corporate finance (e.g. buyout) or are generalist funds compared with
portfolios formed by “random” direct fund investing in similar direct funds. In contrast, FOFs in
VC perform roughly on a par with portfolios of direct funds, even after fees. Moreover,
strategies for investing in direct funds may be constrained by limits on fund access or manager

2
selection skills. We show that VC FOFs often outperform direct investing handicapped by these
limitations. In addition, given the highly dispersed nature of direct fund returns in venture, VC
FOFs create more risk reduction through diversification than is true in buyout. In general, our
results suggest that FOFs focusing on VC provide more advantages than those in buyout.
The remainder of the paper is structured as follows. In Section 1, we discuss the role of
FOFs as financial intermediaries in private equity and related research on the performance of
direct private equity funds. In Section 2, we explain our metrics of performance and data. In
Section 3, we study FOF performance, both in absolute terms and relative to investments in
public equity. We follow in Section 4 with a discussion of the types of portfolios FOFs form. In
Section 5, we compare FOF performance to direct equity investing which we measure using
portfolios of direct funds. In Section 6, we discuss the results in light of constraints on direct
fund investing. We summarize our results and discuss their implications in Section 7.
1. Financial Intermediation by Funds of Funds in Private Equity
There is a large literature in economics on financial intermediaries. The explanations for
intermediation typically depend on either transactions costs or information advantages.1
Transactions costs arguments rely on the intermediary’s ability to pool capital and supply lower
cost services (e.g. due to economies of scale). Other explanations cite advantages that an
intermediary can provide due to superior information.
In private equity, the first level of intermediation occurs with the formation of direct
funds. Rather than investing directly in companies, investors become limited partners (LPs) in a
direct private equity fund set up by general partners (GPs). In turn, the “direct” fund makes the
1 See Fang, Ivashina and Lerner (2015) for a brief overview of financial intermediation and selected
references.

3
investments in companies. The GPs are the active managers of the fund’s resources and supply
expertise, effort and networks to make and structure investments in their portfolio companies,
participate in value creation by those firms, and exit the investments. GPs supply only a small
part of the capital and receive management fees and a fraction of the profits (“carried interest”)
from the investments in the underlying companies. Though terms vary across funds, a typical fee
structure is “2 and 20”: the GP gets an annual management fee of 2% of assets and receives 20%
of the gains when the fund exits its investments.2
But LP investments in direct funds are illiquid, relatively undiversified, not easily scaled,
and have high search and monitoring costs.3 Given the costs and frictions in direct fund
investment, FOFs provide a second level of intermediation. GPs set up a FOF to provide
specialized expertise and services for investing in direct funds. The end investor becomes an LP
in the FOF, which in turn is an LP in direct funds. Most FOFs are “primary” and make capital
commitments to direct funds when those funds are raising capital.4 In contrast, “secondary”
FOFs provide liquidity to LPs by purchasing their existing interests in one or more direct funds.
In this paper we focus on primary FOFs.
To provide valuable intermediation, a FOF must create a profile of return and risk that is
better than investors can otherwise achieve. Potential advantages offered by a FOF must,
however, be weighed against the extra layer of fees charged by FOFs. Mirroring fee structures for
2 In practice, the definition of management fees and carried interest involves several complications. For instance, the management fee is typically levied on committed (not invested) capital during the “investment period” and then remaining invested capital thereafter. And carried interest may not be paid unless a minimum hurdle rate (such as an internal rate of return of 8%) is exceeded. For more information on the economics of private equity funds see Metrick and Yasuda (2010). 3 In light of these issues, the U. S. government restricts private equity fund investments to qualified investors who meet wealth thresholds and are deemed able to bear the risks and illiquidity of the asset class. 4 Some primary FOFs also co-invest with direct funds and invest in secondary FOFs. The former may reduce fees and carry from direct funds and the latter ameliorate the j-curve effect on performance. The firm (GPs) that creates a FOF (e.g. HarbourVest Partners, LLC) is typically a registered investment adviser under the Investment Advisers Act of 1940.

4
direct funds, FOF’s charge annual management fees on capital and often take a carried interest.
Surveys suggest that FOFs charge management fees of around 1% (or less) annually with a
carried interest of 5%.5 As a comparison, Fang, Ivashina and Lerner (2015) report that large
institutional investors, who can take advantage of economies of scale in-house, have annual costs
of investing in direct funds of about 0.11% of committed capital.
In 1979, Adams Street Partners established the first private equity FOF for institutional
investors. Thirty years later, FOFs accounted for about 12% of the capital raised by private
equity funds during the decade ending 2009.6 While each FOF is different, three items are
frequently cited as benefits to LPs who put money into a FOF.
The first potential benefit is cost-effective diversification. Unlike investing in public
equity, investors cannot purchase low cost, well-diversified portfolios across the private equity
asset class or its subcomponents. Moreover, direct funds often have substantial minimum
investment levels (often $5 million for an institutional client) as well as limitations on the
maximum investment by any LP. Some institutional portfolios are too small to provide cost
effective diversification across direct funds, including across company life cycles, sectors,
vintage years and geography. Such an investor might use a FOF to effectively “scale up” and
participate in more and larger funds than would be possible with its investment base alone.
Conversely, a larger investor can use a FOF to “scale down” its allocation to invest across a
5 Based on surveys of FOFs, Dow Jones (2010) report a median (mean) management fee of 1% (.94%). About two-thirds of all FOFs charged management fees in the range of 76 to 100 basis points and about three-fourths scale down the fee in the later years of the fund. For primary FOFs, the median (mean) carried interest is 5% (5.2%) and four-fifths had carried interest of less than 10%. Secondary FOFs, on average, charged slightly higher carried interest with a median (mean) of 6% (6.9%). For the vast majority of FOFs, carried interest is subject to a preferred return, most often in the range of 8%; that is the GP does not participate in profits until after the preferred return is earned. Dow Jones conducted this survey for a number of years but has not continued the publication after 2010. 6 These figures come from Harris, Jenkinson and Stucke (2010) based on Preqin fundraising data. The 12% figure includes both primary and secondary FOFs. For each year in that decade, FOFs accounted for over 10% of capital raised. Since 2009, FOF fundraising has fallen to a lower percentage. For instance, Preqin (2013) reports FOF fund raising at 8% in 2010, 7% in 2011 and 6% in 2012.

5
variety of direct funds in smaller pieces than it would normally consider. Primary FOFs typically
make capital commitments to a number of direct funds spanning a number of vintage years. As
part of providing these “diversification” services, the FOF may be able to take advantages of
economies of scale in areas such as fund administration and liquidity management.
A second service provided by FOFs is fund selection and monitoring. Some investors
(e.g. smaller institutions or those unable provide competitive compensation) may find it cost
prohibitive or impossible to employ the necessary expertise and people to perform the required
due diligence and to make informed decisions on direct funds. FOFs serve as an intermediary to
provide the expertise that can be particularly important when dealing in geographies, industries or
sectors in which the investor has limited or no experience.
A third potential advantage of FOFs is the ability to gain access into otherwise
unattainable investments. These might be special opportunities to co-invest (with a lower fee
structure) along with a direct fund or to have access to the direct fund itself. The conventional
wisdom for investors in direct private equity funds is to invest in partnerships that have
performed well in the past, so-called top quartile funds. This conventional wisdom is based on
the belief that performance in private equity persists across direct funds for the same partnership.
Top-performing GPs may choose to limit direct fund size rather than raise fees, and established
FOFs may have privileged access as a result of investing in earlier funds.
A recent survey of LP investors (Preqin, 2013) finds that the most cited reason for
investing in private equity FOFs is diversification (63% of respondents). Other factors noted by
respondents are manager expertise (37%), access to specific markets (34%), lack of resources
(32%), access to specific funds (26%), size of portfolio (16%) and lack of experience (13%).
Clearly, these cited reasons are not mutually exclusive, but match closely to the three main
potential roles we identify for FOFs.

6
Past research on FOFs in other alternative asset classes such as hedge funds often
questions the value of their performance. 7 However, the higher illiquidity costs and information
asymmetries in private equity relative to hedge funds may lead to higher intermediary benefits for
private equity FOFs than in the hedge fund industry. To date there is scant research on FOFs in
private equity.8
Other research on private equity suggests that factors affecting value created by FOFs as
intermediaries may differ between venture capital and buyout funds, and may have changed over
time as the private equity industry has developed. Lerner, Shoar and Wongsunwai (2007) study
LP investments in direct funds from 1991 to 1998 and find that FOFs have relatively poor
performance. At the same time, endowment investors (notably educational and other nonprofit
institutions) have private equity returns superior to those of other institutional investors. They
attribute this advantage to endowments having advantages in evaluating and gaining access to
private equity funds compared to other institutional investors.
These relationships appear to have changed. Sensoy, Wang and Weisbach (2014) study
fund investments in the 1990s and 2000s, and report that endowments do no better (in fact worse)
than other institutional investors (for the vintage years 1999-2006). They document that the
outperformance of endowments in the 1990s was largely due to greater access to top-performing 7 Brown, Goetzmann and Liang (2004) find that individual hedge funds dominate FOFs on an after-fee return or Sharpe ratio basis. Fung, et al (2008) study hedge fund FOFs over the decade 1995 to 2004 and find that the average FOF delivers alpha only in the period between October 1998 and March 2000. They do find, however, that a subset of FOFs consistently delivers alpha. Ang et al (2008) argue that FOFs need to be compared to direct fund portfolios that would be available to investors in the absence of FOFs and conclude that hedge fund FOF performance justifies the extra layer of fees. However, as an illustration of the important differences between hedge funds and private equity, in studying illiquid assets Cornelius et al (2013) explicitly exclude hedge funds and limit their focus to private equity and real assets. 8 Preqin and other industry sources provide useful reports on private equity FOFs. Gresch and von Wyss (2011) study a small sample of private equity FOFs using Preqin data but are unable to calculate PMEs. Studying IRRs and multiples of investment capital, they compare FOFs to investments in single direct funds and conclude that the low dispersion of FOF returns makes them attractive compared to direct funds of the same vintage year. They do not look at portfolios of direct funds nor do they control for vintage year differences between FOFs and the direct funds in which they invest.

7
venture capital funds. They point to the “general maturing of the industry” as a wide array of
investors (in addition to endowments) have gained experience with private equity. If more
institutional investors have developed the skills and relationships to pursue private equity
investing, the value proposition of a FOF may appeal to fewer investors than in earlier periods.
Moreover, a wide array of consultants and advisors compete with FOFs to supply services to
investors.10
Consistent with the results in Sensoy et al, recent research shows that the persistence of
GP performance has weakened over time for buyout funds. Kaplan and Schoar (2005) find that
direct funds in both buyout and venture capital had significant performance persistence in earlier
years (before 2001). More recently, however, Harris, Jenkinson, Kaplan and Stucke (2014) find
that while persistence has persisted in venture capital, it has eroded significantly for buyout funds
after 2000. Since direct buyout funds have become a larger part of private equity investments,
this drop in persistence may have eroded any “access value” offered by FOFs in buyout.
2. Measures of Performance and Data
We compare FOFs to two alternate forms of investments. The first is public equities.
Unlike private equity investing, public markets provide investors with liquid, cost-effective ways
to create diversified portfolios. Thus for an investor without the capabilities to navigate direct
fund investing, the public equity route is an obvious alternative to a FOF.
We use the public market equivalent (PME) from Kaplan and Schoar (2005), which
compares an investment in a private equity fund to an equivalently timed investment in the
10 Recently, some providers are offering products constructed as diversified portfolios of public stocks that they claim track private equity performance. It is too early to tell how these will perform and how widely they will be used. They do, however, offer potential competition to FOFs. See for instance, the Thomson-Reuters Investable Venture Capital Index: http://www.reuters.com/article/2012/10/22/idUS137869+22-Oct-2012+HUG20121022

8
relevant public market index. The PME calculation discounts (or invests) all cash distributions to,
and any residual value of, the fund at the public market total return and divides the resulting
value by the value of all cash contributions discounted (or invested) at the public market total
return.11 The PME can be viewed as a market-adjusted multiple of invested capital (net of fees).
A PME of 1.30, for example, implies that at the end of the fund’s life, investors ended up with
30% more than they would have if they had invested in the public markets.
Our second alternative to FOFs is investing in direct private equity funds. Benchmarking
FOFs against direct funds brings up the inevitable question of what direct fund portfolio investors
could create on their own. After all, if each investor could readily and cost-effectively navigate
direct fund investing, the economic rationale for a FOF would disappear.12 Our approach is to
compare an actual FOF’s PME against a distribution of PMEs for synthetic FOFs. These
synthetic FOFs are formed as portfolios of randomly chosen direct funds drawn from the set of
all direct funds which fit a set of investment criteria. The FOF is matched to the investment
criteria using its vintage year and investment focus (e.g. buyout or venture capital). Such
synthetic FOFs capture diversification benefits absent in single direct funds. As an example, we
match a FOF that specializes in buyout against synthetic FOFs from a “naïve” investment
strategy of randomly picking direct funds that have the same strategy (i.e. buyout) and are spread
over a number of vintage years. The PME of each of these synthetic FOFs is calculated resulting
in a distribution of PMEs.
Because all our performance measures are net of fees, FOFs would have lower returns
than direct funds unless they can create above average performance in their direct fund
investments by choosing better performing funds. For a given investor, these results shed light
11 Harris, Jenkinson and Kaplan (2014) provide more detailed discussion of PMEs and the role of residual Net Asset Values when funds are not fully liquidated. 12 Ang, Rhodes-Kropf and Zhao (2008) discuss the general issue and study FOFs investing in hedge funds.

9
on the tradeoff in using FOFs given the investor’s capabilities and feasible alternative investment
strategies.
To conduct our analysis we use data on fund-level, timed cash flows and fund valuations
from Burgiss. This research quality database was first used by Harris, Jenkinson and Kaplan
(2014), and is sourced from a broad base of over 200 institutional investors, who use Burgiss’
systems for audit and performance measurement. The data is cross-checked for accuracy by
comparing the records of different investors in the same fund. Our data measure performance
through December 31, 2012. We restricted our study to FOFs with vintage years in 2007 and
earlier. This allows five years for the FOF to make investments prior to our analysis of
performance. Few commercial providers have such detailed, or such high-quality, data, although
they often have large samples of self-reported IRRs and investment multiples.13
We use cash flows for 294 primary FOFs (all primary FOFs in Burgiss with assigned
vintages of 2007 and earlier). Burgiss categorizes FOFs as corporate finance, generalist or
venture capital.14 The first FOF category primarily targets buyout funds but also includes some
mezzanine, distressed debt and special situations funds. The last category targets venture capital
and the generalist category has a mix of corporate finance and venture capital. As we report later,
one interesting finding is that FOFs tend to provide diversification not only across funds within a
particular investment class, but often diversify across classes as well. For instance, some FOFs
that predominately invest in buyout funds also include some VC fund investments.
As part of our comparison of FOF performance, we also use cash flows for the direct
funds in the Burgiss database (through vintage year 2012). Our data do not contain the names of 13 Harris, Jenkinson and Kaplan (2014) provide a more detailed discussion of the advantages of Burgiss data, the nature of other data sets and how the data sets compare. That research’s conclusions lead us to doubt that Burgiss data have an overall positive or negative bias in terms of performance. 14 Burgiss classifies a vintage year as the year in which a fund first draws capital from its LPs. Burgiss also provides the geographic focus of the fund, Of the 294 funds, 222 focus on North America with most of the rest focusing on Europe.

10
the FOFs or the underlying direct funds. We state all cash flows in US dollars. For a subset of
the FOFs, we also have some information of each FOF’s portfolio composition through year-end
2012. These holdings data include the count and weight (percent of committed capital) of the
underlying direct funds in each of the FOFs by vintage year and sub-asset class.
3. Fund of Fund Absolute Performance and Performance Relative to Public Markets
Table 1 compares Burgiss data to a FOF sample drawn from Preqin, an alternative
commercial data source. While Preqin has summary performance data for a larger number FOFs,
it unfortunately does not have cash-flow data needed to compute PMEs for more than a modest
subset.15 As a result, Table 1 reports two metrics widely used by funds and investors to gauge
absolute performance. The first measure is the LP’s annualized internal rate of return (IRR)
based on fund contributions and distributions. The distributions include the estimated value of
any unrealized investments (or residual value) as of the last reporting date. The second measure
is the multiple of invested capital (MOIC), also referred to as the ratio of total value to paid in
(TVPI). The multiple’s numerator is the sum of all fund distributions and the value of unrealized
investments. The denominator is the sum of all fund contributions by LPs. Given the relatively
short history of the FOF industry, it is only in the late 1990s that individual vintage years have
more than a few observations. This makes it impossible to provide reliable vintage year averages
for earlier years. The first vintage year that has coverage in the Burgiss data is 1987, but 1997 is
the first year with more than three observations.
15 Preqin’s data is largely derived from Freedom of Information Act requests, where investors provide information on cash invested, realizations and net asset values on a quarterly basis. It is, therefore, a quarterly aggregation of the cash flows, rather than the individual, timed cash-flows in the Burgiss data. Preqin reports the first fund of funds in vintage year of 1979 but typically has only one observation per vintage year until the late 1980s and hits double digits only in 1997.

11
Table 1 shows that the absolute performance measures are very similar across the two
samples. For FOFs with vintage years 1997-2007, the sample average IRR is 6.7% for the
Burgiss sample and 7.2% for Preqin. Sample average TVPIs for this period are very similar for
the two groupings, respectively 1.31 and 1.27. Medians and averages of vintage year figures
confirm the similarity across samples. Thus across our sample period, Table 1 shows our set of
FOFs from Burgiss have performance consistent with that of the larger Preqin sample for which
detailed cash flow data are not available. A notable feature in Table 1 is the high absolute
performance in the infancy of the FOF industry: IRRs and money multiples are much higher for
funds started prior to 1997.
Of more interest than these absolute return measures is performance relative to pubic
markets. Figure 1 plots the overall distribution of PMEs for FOFs using the Burgiss sample.16
Panel A shows that FOFs have outperformed the broad market average as measured by the S&P
500. Across all FOFs in the Burgiss sample, the average PME using the S&P 500 is 1.13 which is
significantly above one (p-value < 0.01). The median PME is 1.08. Panel B charts PMEs against
the Russell 2000, an index for smaller publicly traded firms which is sometimes used by LPs as a
benchmark. PMEs against the Russell 2000 are generally lower than those using the S&P 500 but
remain above 1.0 on average. Across all funds of funds, the average is 1.04 (statistically greater
than 1.0 at the 0.08 level). The median is 1.0.
Table 2 segments the PMEs by vintage year. The average PME using the S&P 500 is one
or above in each vintage year shown. Median figures display a similar pattern of
outperformance. PMEs are especially high in the early years, with an average PME of 1.49 in the
16 We cannot compute PMEs for the Preqin sample since detailed cash flow data are unavailable. Given the similar absolute performance measures by vintage year shown in Table 1 for the Preqin and Burgiss samples, we would expect the Preqin sample to have PMEs very similar to those shown in Figure 1. Harris, Kaplan and Jenkinson (2014) show the close empirical relationship between absolute measures of performance and PMEs.

12
1997 vintage and 1.59 for earlier years. PMEs using the Russell 2000 are, since 1996, lower
(especially for the 1998 and 1999 vintage years for which the average PME is below 0.90) and,
like those using the S&P 500, display strong outperformance in the early vintage years.
Earlier research (Harris, Jenkinson and Kaplan, 2014) documents that direct VC funds
performed exceptionally well for vintages in the 1990s, but then saw a dramatic drop. Table 3
segments our FOF sample into three categories: corporate finance, generalists and VC. Due to the
limited number of observations in some years, we aggregate over vintage-year groupings. Using
the S&P 500, Panel A of Table 3 shows that all three FOF categories have mean PMEs
significantly above one. Moreover, Table 3 echoes the findings for direct VC funds that show
dramatic shifts in venture performance over time.
For VC FOFs, Panel A reports a mean PME of 1.16 over the entire sample (significantly
different from one at the 0.02 level). The performance is exceptionally strong for the vintages
prior to 1998 with a mean (median) PME of 2.02 (2.00). This drops off dramatically thereafter:
for the next four vintages (1998-2001) the average PME is below 0.90. Such trends reflect FOF
investments in direct funds from a number of vintage years after the FOF’s launch. Panel A also
shows that the median PME for venture FOFs is 1.01, well below the mean. This gap reflects the
variability of returns in VC investing—a topic to which we return later in the paper.
Panel A also displays that corporate finance FOFs have outperformed the S&P 500. The
mean PME for corporate finance FOFs is 1.14 over the sample period (significantly different
from one at the 0.01 level); the median is 1.11. Unlike VC, corporate FOF performance has not
shifted much over time; the mean and median PMEs are above 1.0 for each period displayed.
This pattern for corporate finance FOFs (who largely invest in buyout) echoes the findings on
direct buyout funds that consistently show PMEs above 1.0 over time (see Harris, Jenkinson and
Kaplan (2014)). Generalist FOFs (which invest in both venture and buyout) have a mean PME of

13
1.10 (significantly different from one at the 0.01 level) against the S&P 500 and a time pattern of
results closer to corporate finance than to venture. The median PME figure for generalists is 1.09.
Panel B of Table 3 replicates Panel A using the Russell 2000 as a benchmark. Consistent
with the overall sample results shown earlier, PMEs against the Russell 2000 are lower for the
sample: means of 1.04 for corporate finance, 0.98 for generalist and 1.12 for venture. Only the
mean PME for corporate finance is still significantly different from one (at 0.02 level). Median
PME values are also lower in Panel B.
Overall, Figure 1 and Table 2 display that, historically, FOFs have provided returns above
those of the S&P 500. FOFs have also, on average, had returns equal or above the Russell 2000
though the margin of outperformance is narrower. This outperformance is after fees since all
performance measures are based on the net-of- fee cash flows to LPs. In addition, Table 2 shows
that the high absolute performance in the early years of the industry (IRRs and money multiples
in Table 1) also corresponds to higher performance relative to public markets. Table 3 shows that
all three categories of FOFs have an average PME above one against the S&P 500 and that the
shifts in FOF performance over time appear largely driven by changes in how VC FOFs
performed.
A more complete analysis of FOF benefits to investors requires comparison of FOF and
direct fund performance, which we turn to in the next section. It does appear, however, that on
average, FOFs have historically provided returns higher than those in public markets.
4. Funds of Funds and Direct Fund Investing
As a first step in comparing FOFs and direct funds, Table 4 presents simple regressions to
investigate performance differences between FOFs and single direct funds. Fund performance,
using data from both individual FOFs and individual direct funds, is regressed against a zero-one

14
dummy variable which equals 1 for a FOF and 0 for a direct fund. All regressions incorporate
vintage year fixed effects. Regression I includes all FOFs and direct funds. The coefficient of
minus 0.0656, significant at the 0.01 level, indicates that the average PME for FOFs is almost 7%
less than the comparable PME for direct funds. Regressions II through IV segment the sample.
Regression II includes only corporate finance funds (both FOF and direct) and hence compares
funds investing in this sub-asset class. Regression III includes only VC funds while regression
IV includes generalist FOFs and all direct funds. The results show that FOFs who are generalists
(regression IV) or specialize in corporate finance (regression II) have significantly lower PMEs
than direct funds – 10% to 12% less. In contrast, VC FOFs (regression III) have PMEs that are
not statistically different from those achieved by direct VC fund investing.17
The differences in Table 4 across FOF categories are striking and suggest quite different
implications about FOF performance in VC versus other areas of private equity. Yet Table 4
compares single FOFs to single direct funds. This approach fails to capture the main reasons, as
noted earlier, many LPs say they invest in FOFs – namely diversification.
The diversification benefits delivered by FOFs depend on the nature of the underlying
variability in direct fund performance. To illustrate, Figure 2 plots the distribution of PMEs
(against the S&P 500) for our sample of direct funds. Across direct buyout funds, Panel A shows
a standard deviation of 0.55. For direct VC funds, Panel B shows a more dispersed distribution
with a standard deviation of 1.78. The higher standard deviation for VC reflects higher variation
across funds in the same vintage year as well as more variation over time in performance. Panel
B also displays a pronounced gap of 0.37 between mean and median PMEs. Direct VC funds
thus have much more dispersed performance with the mean boosted upwards by the spectacular 17 Regressions, not shown, find that PMEs for FOFs focusing outside North America were not significantly different from the rest of the sample.

15
performance of very successful funds. In contrast, the spread between mean and median PMEs
for direct buyout funds (Panel A) is only 0.08. The contrast between Panels A and B suggests a
more important role for FOFs in venture capital to diversify across direct funds and vintage years,
and, potentially, to gain access to the top-performing direct funds.
FOFs diversify across funds and show, as expected, smaller dispersion in performance
than single direct funds. Moreover, the reduction in dispersion is much more pronounced in
venture than in buyout. Across our sample of venture FOFs, the standard deviation of PMEs
against the S&P 500 is 0.57, about a third of the comparable value (1.78) for direct VC funds;
and for venture FOFs the gap between mean and median PME is 0.15, less than half the gap for
direct VC funds. In contrast, for corporate finance FOFs (largely buyout), the standard deviation
of PMEs is 0.24, about half the value (0.55) for direct buyout funds; and the gap between the
mean and median is 0.03 compared to 0.08 for direct buyout funds. Overall the figures show, not
surprisingly given the higher underlying variability in direct venture fund performance, that
venture FOFs have higher dispersion in performance than FOFs focusing on buyout. That said,
venture FOFs provide larger risk reduction benefits relative to single funds than do FOFs
focusing on buyout.
The natural benchmarks for FOFs are portfolios of direct funds, not single direct funds.
What types of portfolios do FOF managers create for their LPs? To address this question, we use
detailed information on portfolio composition, which is available for a subset of our sample. The
first block of columns in Table 5 summarizes results for all 190 FOFs for which we have this
portfolio information. The results show patterns of diversification across funds and vintage
years. The mean (median) number of direct funds held is 25.6 (22.5). Moreover, FOFs commit,

16
on average, 18.6% of their capital to direct funds in their first year (i.e. their vintage year).18 The
average for year 2 is 32.9%. By the end of year 3, on average almost 80% of FOFs’ capital is
accounted for, and by year 4 over 90%.
Subsequent columns in Table 5 are segmented by FOF categories: corporate finance,
generalist or venture capital. FOFs focusing on corporate finance tend to hold fewer funds that do
those who are generalists or focus on VC. This appears consistent with higher benefits of
diversification in venture because of the underlying variability of returns. There are similar
patterns of vintage year diversification across corporate finance, generalist and VC.
As would be expected, corporate finance FOFs focus primarily on buyout: the median
corporate finance fund has 87.2% of capital committed to buyout and even the 25th percentile
value is 76.5%. Some FOFs classified as corporate finance funds have substantial allocations to
direct funds investing in mezzanine, distressed debt and special situations. The mean allocation
of 16.6% is quite close to the 75th percentile value of 17.6% reflecting the fact that some
corporate finance FOFs focus outside traditional buyout. A minority of corporate finance FOFs
have a smattering of investment in real assets and venture capital.
FOFs classified as generalists have more broadly diversified portfolios in terms of sub-
asset classes. On average, about 55% of generalists’ portfolios are allocated to buyout, 35% to
various stages of VC and the remainder is spread across real assets, mezzanine, distressed debt,
special situations and other. As with corporate finance FOFs, there is variation across generalists’
portfolios: a fourth of these FOFs have buyout exposures of 65.4% or above and a fourth have
18 Sometimes primary FOF make commitments to direct funds that are in later rounds of closing their fund. In this instance, the FOF will have a position in a direct fund from a prior vintage year. In our sample these were small figures, typically well less than 10 % of the FOF. In the figure for year 1 reported in Table 1 we have accumulated all direct funds in that or prior vintage years.

17
exposures no larger than 45.4%. Similarly, there is variation in how the generalists deploy capital
not allocated to buyout.
FOFs classified as VC invest, on average, over 85% of their capital in direct VC funds,
with about half of that (40.3%) in early stage direct funds. Direct VC funds pursuing a balanced
approach (i.e. investments across different stages) represent 37.8% of the FOFs’ capital, on
average, while late stage direct venture funds make up less than 10% of capital. Since “balanced”
direct funds have a mix of early and late stage, our figures suggest that over half of capital, on
average, is in early stage VC.
While VC FOFs, as expected, place most of their capital in venture, Table 5 shows a
potential “style drift” towards buyout for some FOF managers. Over three quarters of all venture
FOFs have some capital in buyout, the average allocation is 15.2%, and over a fourth have
buyout allocations above 20%. We say potential because it is always possible that some funds
pursue strategies that are a mix of venture and buyout. Funds that invest in growth equity – like
Oak Investment Partners and Summit Partners – are particularly difficult to classify. While a VC
FOF may consider such funds as venture, it is possible that Burgiss will classify them as buyout
or corporate finance.19
Behind the average figures, FOFs vary in the number of direct funds they hold and the
speed with which they deploy capital. Looking at the first block of columns in Table 5, about a
fourth of FOFs have 15 or fewer direct funds, another fourth of the sample have over 32 funds.
Apparently, some FOFs focus on a relatively small set of funds that they expect to be high
performing. Other FOFs appear to behave more like index funds, spreading their capital across a
large number of direct funds (occasionally over 50). In terms of capital deployment, one fourth
19 We replicated Table 5 for FOFs started prior to 2000 and again for those started after 2000. For both subsets, patterns of holdings were similar to those reported in Table 5.

18
of FOFs have commitments to year 1 of 5.7% or less; and another one fourth have commitments
to year 1 of 24.5% or higher. For vintage years 5 and onwards, the median value for
commitments is only 2% but some FOFs are still in an investment mode as shown by 75th
percentile value of 12.2% (aggregated over all the vintage years beginning with year 5).
In summary, portfolios created by FOFs hold, on average, 20 to 30 direct funds and
commit the vast majority of their capital to four vintage years. While general categorizations of
FOFs (e.g. corporate finance, generalists or venture capital) are useful, they do not always
capture style differences in terms of the portfolios FOFs actually form.

19
5. Comparing Funds of Funds to Strategies of Direct Fund Investing
To compare FOFs to direct fund investing, we create synthetic FOFs (portfolios of direct
funds) as performance benchmarks. These synthetic portfolios are comprised of randomly
selected funds that satisfy a specified investment policy for a sub-asset strategy (e.g. buyout or
VC) and diversification across a number of funds and vintage years. As an example, a “naïve”
benchmark strategy for a FOF in buyout could be investing only in direct buyout funds and
spreading that investment over four vintage years to create portfolios of 20 direct buyout funds (5
direct funds per vintage year beginning with the vintage year of the FOF). We create 10,000
synthetic FOFs that fit that strategy, resulting in a distribution of PMEs for these synthetic
portfolios. We start with this type of naïve strategy and later adjust it based on characteristics of
FOF portfolios (Table 5) or limitations on investment opportunities.20
Figure 3 illustrates a “naïve” benchmark distribution created for an individual FOF
classified as corporate finance and having a 2005 vintage year. The synthetic portfolios contain
20 direct buyout funds spread over vintage years 2005-2008. Figure 3 shows that the mean PME
for that benchmark strategy was 1.16. If an actual FOF had a PME of 1.18, this would imply an
excess PME of .02 (1.18-1.16). That same PME would fall in the 60th percentile of performance.
We repeat this process for each FOF in the sample to get a distribution of excess performance
measures.
Figure 4 shows the distribution of excess PMEs comparing FOFs to a “naïve” strategy of
direct investing. Corporate finance FOFs are matched against portfolios of direct buyout funds,
20 We did simulations both with and without replacement. The two approaches provided almost identical results in terms of performance benchmarks and lead to the same conclusions about FOF performance. We report results with replacement. As expected, the synthetic portfolios have much lower dispersion than single direct funds and the gap between mean and median performance is drastically reduced. For instance, for the “naïve” buyout (venture) strategy, the gap between mean and median PME is typically less than 0.01 (0.10) in a vintage year and the vintage year average for the gap is 0.01 (0.049).

20
VC FOFs against direct venture funds and generalists against a mix of buyout (60%) and venture
(40%). Panel A of Table 6 summarizes the results. For all FOFs, the mean excess PME is -0.06,
which is significantly negative at the 1% level. Both corporate finance and generalist FOFs also
have significantly negative average PMEs of -0.06 and -0.10 respectively. In contrast, the mean
excess PME for venture FOFs is 0.02 and is not significantly different from zero. Percentile
values across the groupings reveal the same patterns through a different, but interesting, lens. The
average corporate finance FOF would have been in the 32nd percentile of the synthetic funds. The
average generalist FOF did not fare much better, being in the 35th percentile. However, the
average VC FOF would have been in the 49th percentile of synthetic funds, suggesting that
managers of VC FOF, on average, largely “earn their fees” by their choice of, and access to, the
direct funds. The percentile figures also provide insight on the benefits of diversification created
by VC FOFs compared to single direct funds. If we benchmark single direct VC funds (not
FOFs) against the naïve synthetic portfolios, the mean ranking is the 39th percentile—well below
the 49th percentile value for VC FOFs. Corporate finance direct funds, on the other hand, have a
mean rank of the 50th percentile against a naïve strategy—well above the comparable figures for
corporate finance and generalists FOFs. These differences in patterns for VC and corporate
finance FOFs show the large importance of diversification in venture investing where outsized
returns on some investments play a key role.
Panel B of Table 6 mirrors Panel A, but takes advantage of our holdings data to “inform”
the direct fund benchmark with a mix of sub-asset classes and number of funds reflecting average
portfolios that FOFs actually create. FOFs with a corporate finance focus are benchmarked
against a blend of 20 direct funds, buyout (80%) and other corporate finance funds (20%). The
other corporate finance direct funds (mezzanine, special situations and distressed debt) reflect
corporate finance FOF diversification into these investments. For FOFs classified as venture

21
capital, we benchmark against 28 direct funds, 80% venture and 20% buyout. In the case of
generalist FOFs we weight buyout at 60% and venture at 40% across 28 funds. The excess PME
performance results in Panel B are essentially the same as those in Panel A. Venture FOFs
perform on par with direct fund investing but corporate finance and generalists FOFs perform
significantly worse than the direct fund strategy21. Table 7 repeats the process but reports excess
returns relative to the median. The general patterns are the same: corporate finance and generalist
FOFs underperform, while venture FOFs do not.
To examine changes since the early years of the FOF industry, we repeated the analysis in
Table 6 separately for FOFs formed in or prior to 2000 and those formed afterwards. For both
periods (results not shown), corporate finance FOFs, generalist FOFs and FOFs overall had
negative excess PMEs. VC FOFs had a small positive excess PME in the earlier years and zero
thereafter, but the difference was not significant. Overall, the sub-period results echo the
conclusions for the entire period.
For the 190 FOFs for which we have holdings information (summarized in Table 5), we
create even more refined benchmarks using FOF-specific (rather than average) figures on number
of funds and allocations across vintage years and sub-asset classes. We form synthetic FOFs
assuming an investor can mimic an individual FOF’s allocation strategy but selects direct funds
randomly. These “FOF-level” benchmarks arguably provide a stronger test of FOF fund
selection skills since they assume that an investor can match a FOF’s abilities at vintage year
diversification and sub-asset allocation. Table 8 shows that across all FOFs, the mean excess
21 There is some downward shift in the percentile ranking of VC FOFs. This is because adding buyout funds in the informed strategy reduces the dispersion of the synthetic fund distributions against which VC FOFs are benchmarked. This is true for every vintage year and is expected since the performance of buyout funds is not as variable as it is for VC funds. The poorer performing VC FOFs thus drop in their percentile scores. In contrast, the percentile rankings of the stellar performing individual VC FOFs do not shift appreciably since they were already very high and can't go much higher. The net result is that the average percentile ranking of VC FOFs is lower against the informed distribution, even though the mean excess PME is virtually unchanged.!!
22
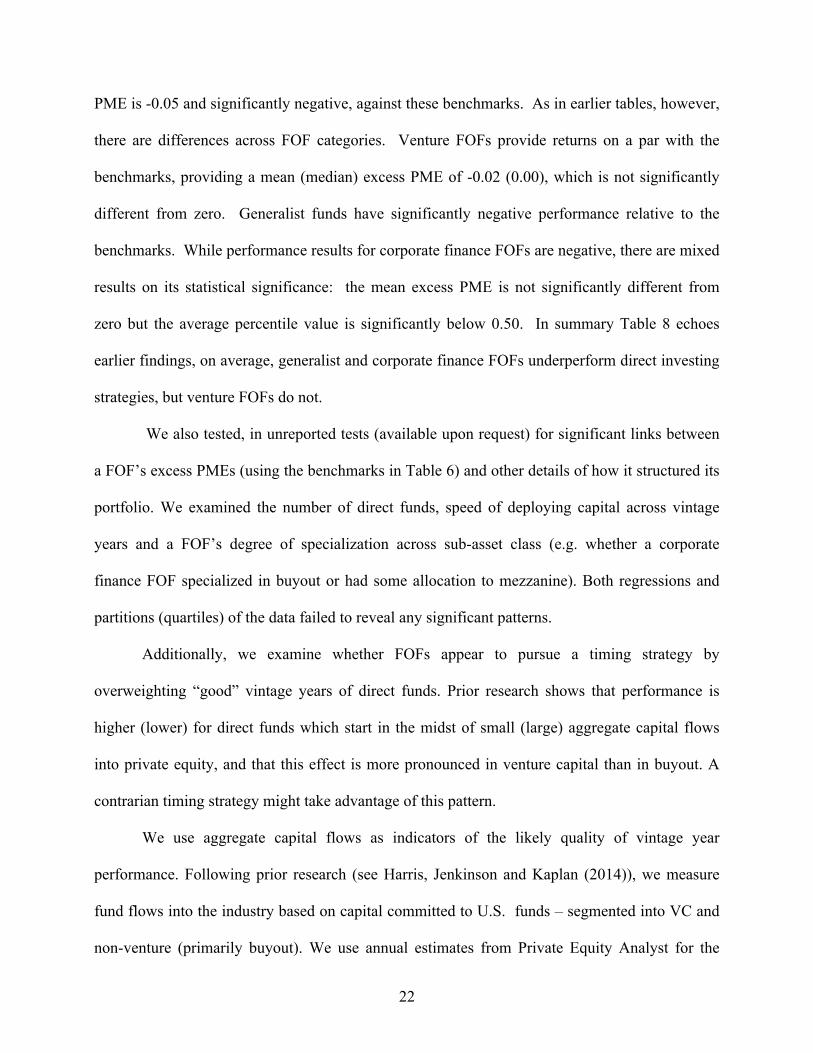
PME is -0.05 and significantly negative, against these benchmarks. As in earlier tables, however,
there are differences across FOF categories. Venture FOFs provide returns on a par with the
benchmarks, providing a mean (median) excess PME of -0.02 (0.00), which is not significantly
different from zero. Generalist funds have significantly negative performance relative to the
benchmarks. While performance results for corporate finance FOFs are negative, there are mixed
results on its statistical significance: the mean excess PME is not significantly different from
zero but the average percentile value is significantly below 0.50. In summary Table 8 echoes
earlier findings, on average, generalist and corporate finance FOFs underperform direct investing
strategies, but venture FOFs do not.
We also tested, in unreported tests (available upon request) for significant links between
a FOF’s excess PMEs (using the benchmarks in Table 6) and other details of how it structured its
portfolio. We examined the number of direct funds, speed of deploying capital across vintage
years and a FOF’s degree of specialization across sub-asset class (e.g. whether a corporate
finance FOF specialized in buyout or had some allocation to mezzanine). Both regressions and
partitions (quartiles) of the data failed to reveal any significant patterns.
Additionally, we examine whether FOFs appear to pursue a timing strategy by
overweighting “good” vintage years of direct funds. Prior research shows that performance is
higher (lower) for direct funds which start in the midst of small (large) aggregate capital flows
into private equity, and that this effect is more pronounced in venture capital than in buyout. A
contrarian timing strategy might take advantage of this pattern.
We use aggregate capital flows as indicators of the likely quality of vintage year
performance. Following prior research (see Harris, Jenkinson and Kaplan (2014)), we measure
fund flows into the industry based on capital committed to U.S. funds – segmented into VC and
non-venture (primarily buyout). We use annual estimates from Private Equity Analyst for the

23
current and previous vintage years. This sum provides an (imperfect) estimate of the amount of
capital available to fund deals.22 To compare these capital flows over a long period of time, we
deflate the two-year capital commitments by the total value of the U.S. stock market (CRSP total
market index) at the beginning of the vintage year. We assign vintage years into quartiles based
on those flows. Due to the inverse relationship between flows and performance, our top (fourth)
quartile expected performance years are ones with the lowest capital flows.
To measure vintage year timing, we estimate the amount by which FOFs over- or under-
weight vintage years compared to a “standard” allocation. To illustrate, suppose a FOF started in
1998 and had a policy to commit equal amounts of capital across four years; the standard
allocation would be 25% per year. If the FOF actually allocated 30% in vintage year 1999 (year
two for the FOF), then that year would be over-weighted by 5% (30%-25%= 5%). These weights
sum to zero over the life of the FOF. We apply these weights to our measure of vintage year
quality. Continuing our example, suppose that 1999 was a good vintage year for direct fund
performance (which we designate as 4 reflecting fourth quartile). The product of the over-
weighting and vintage year quality (0.2 = 0.05 x 4) measures the positive effect of over-
weighting that good year. Summing over all vintage years for the FOF we get a summary
measure of timing ability. The measure is expected to be zero if the FOF has no timing ability
and will be positive (negative) if the FOF systematically over-weights (under-weights) the better
vintage years during its life.
To implement the approach we use the average from Table 5 to estimate “standard”
vintage year allocations by FOF category. The actual allocations are those of the individual FOF
thus restricting our analysis to the 190 FOFs for which we have holdings data. In our 22 Another method would be to estimate the “dry powder” – capital committed that has not been invested – for buyouts and VC separately, by year back to the mid-1990s. However, such estimates are only available for recent years.

24
calculations, we apply venture flows to characterize year quality for VC FOFs and the non-
venture flows for corporate finance and generalist FOFs.
For venture FOFs, the mean value of timing is -0.04, which is not significantly different
from zero at the 10% level (p-value is 0.30). The median is also -0.04. This suggests that venture
FOFs do not benefit from timing skills, relative to the standard allocation. Similar results are
found for generalists FOF, which have a statistically insignificant mean (median) value of 0.02
(0.00).
In contrast, for buyout FOFs the mean value of timing is -0.11, which is significantly
different from zero at the 1% level. The median is -0.07. This suggests that buyout FOFs are
actually hurt by their timing.23
Given the difficulty of estimating an expected allocation to a vintage year, we do not draw
strong conclusions from this analysis. They certainly suggest that superior timing abilities are
not, on average, apparent among FOF managers. If anything, they suggest FOF managers
focusing on buyout are, on average, prone to overweight high volume direct fund years, which
contributes to their under-performance of synthetic benchmark portfolios.
6. Limitations on Direct Fund Investing
The direct fund investing strategies in the prior section assumed that an investor could
randomly select any direct fund that satisfied a selected vintage year and sub-asset class profile.
In practice, however, access to some direct funds may be limited and the ability to identify top
performing funds is inherently difficult (as illustrated by research on performance persistence:
23 We repeated this analysis assuming a standard allocation of spreading capital equally over four years. The results are very similar and conclusions unchanged. We also repeated the analysis using two alternative definitions of year quality. One was the actual percentage value of the capital flows, not grouped into vintage year quartiles. The other was vintage year quartiles based on the mean PME of direct funds from that vintage year (i.e. the actual ex-post average performance for venture and non-venture separately). In each instance, the results are similar and the conclusions about timing unchanged.

25
Kaplan and Schoar (2005), Korteweg and Sorensen (2014) and Harris, Jenkinson, Kaplan and
Stucke (2014)). These constraints are likely to be particularly relevant for smaller investors or
those who have little or no experience of investing in private equity, for whom employing a FOF
manager is the obvious alternative to building internal capability and constructing a portfolio of
direct fund investments.
FOFs often cite improved fund access and selection as important sources of value to their
investors. Such features may be especially valuable in venture capital where the distribution of
fund returns is highly dispersed (see Figure 3). To illustrate the importance of having top-
performing funds in a portfolio, we create synthetic FOFs, as before, but impose limitations on
the set of direct funds to be used. We then compare FOFs to these new benchmarks. We consider
four hypothetical scenarios in which either the synthetic FOF does not have access to a fund or
has a reduced chance of being in the fund (either due to access or selection skill).
Panel A of Table 9 excludes the single top performing (as measured by PME) direct
buyout fund in each vintage year and the single top-performing venture fund for the year. The
results are striking. While corporate finance and generalist FOFs still underperform, venture
capital FOFs now show an average positive excess PME of 0.10 (significant at the 5% level).
This positive performance attests to the outsized effects on returns in venture capital from a small
number of very successful funds. Panel B excludes the top deciles of buyout and venture funds
for each vintage year and shows that, overall, FOFs outperform this handicapped direct
investing—an average excess PME of 0.07 (significant at the 1% level). This is driven by the
performance of venture capital FOFs which have an average excess PME of 0.20 which places
the average venture FOF in the top quartile of the constrained synthetic FOF distribution.
Panels C and D of Table 8 do not eliminate any direct funds but simply change the
probability of investing in a high performing fund. In Panel C, the probability that a synthetic
26
FOF invests in a top-decile fund is reduced to half that of being in other funds. Panel D halves the
probability for the entire top quartile of direct funds. In both panels, venture FOFs outperform
direct fund investing while corporate finance and generalist FOFs do not. In Panel D the excess
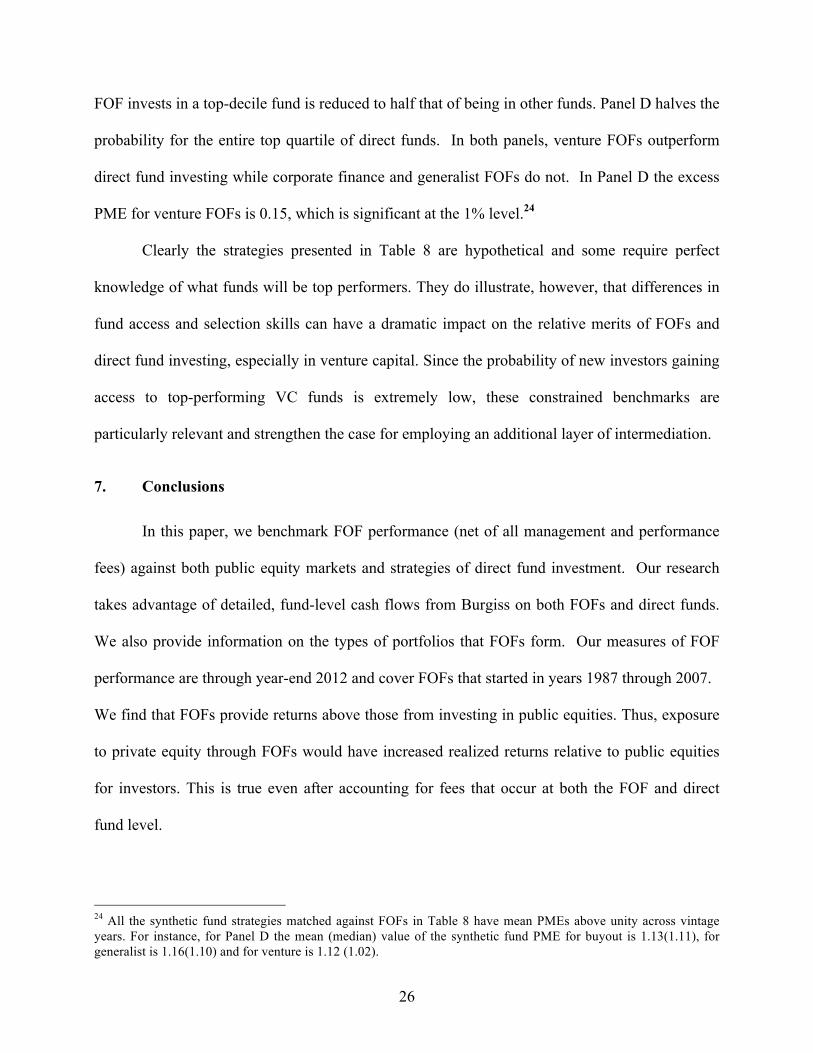
PME for venture FOFs is 0.15, which is significant at the 1% level.24
Clearly the strategies presented in Table 8 are hypothetical and some require perfect
knowledge of what funds will be top performers. They do illustrate, however, that differences in
fund access and selection skills can have a dramatic impact on the relative merits of FOFs and
direct fund investing, especially in venture capital. Since the probability of new investors gaining
access to top-performing VC funds is extremely low, these constrained benchmarks are
particularly relevant and strengthen the case for employing an additional layer of intermediation.
7. Conclusions
In this paper, we benchmark FOF performance (net of all management and performance
fees) against both public equity markets and strategies of direct fund investment. Our research
takes advantage of detailed, fund-level cash flows from Burgiss on both FOFs and direct funds.
We also provide information on the types of portfolios that FOFs form. Our measures of FOF
performance are through year-end 2012 and cover FOFs that started in years 1987 through 2007.
We find that FOFs provide returns above those from investing in public equities. Thus, exposure
to private equity through FOFs would have increased realized returns relative to public equities
for investors. This is true even after accounting for fees that occur at both the FOF and direct
fund level.
24 All the synthetic fund strategies matched against FOFs in Table 8 have mean PMEs above unity across vintage years. For instance, for Panel D the mean (median) value of the synthetic fund PME for buyout is 1.13(1.11), for generalist is 1.16(1.10) and for venture is 1.12 (1.02).

27
In comparison to portfolios of direct funds, we find that overall – across all types of
private equity – FOFs have lower returns than do portfolios of direct funds. This lower
performance is significantly different from zero for FOFs that focus on corporate finance (e.g.
buyout) or are generalist. In contrast, FOFs in VC perform roughly on a par with portfolios
formed by “random” direct fund investing even after fees. Moreover, strategies for investing in
direct funds may be constrained by limits on fund access or manager selection skills. We show
that FOFs in venture capital often outperform direct investing handicapped by these limitations –
which are likely to be particularly relevant to investors without a long track record of investing in
successful VC funds. Given that such funds typically limit access to new investors, some
established VC FOF managers are able to provide their investors access to top-performing funds.
Therefore, the evidence suggests that VC FOF managers are more likely, through fund selection
or access, to overcome their additional layer of fees than are buyout FOFs. In addition, our
analysis suggests that VC FOFs create more risk reduction through diversification than is true in
buyout.
Our results also are broadly consistent with recent research on the persistence of GP
performance. Harris, Jenkinson, Kaplan and Stucke (2014) find that the performance of direct
venture funds has been persistent over time while performance persistence of direct buyout funds
has largely disappeared in recent years. Our finding that FOFs focusing on buyouts underperform
direct fund investing (likely because of the additional FOF fees) is consistent with the inability of
FOFs to choose direct funds that will outperform. This, in turn, is consistent with a lack of
persistence in buyout funds. Our result that venture FOFs perform as well as the average direct
venture fund (despite the additional FOF fees) is consistent with the ability of some venture FOFs
to choose, and gain access to, direct venture funds that will outperform. This, in turn, is
consistent with persistence in VC returns.

28

29
References
Ang, A., M. Rhodes-Kropf and R. Zhao, 2008, Do Funds-of-Funds Deserve their Fees-on-Fees?
Journal of Investment Management, Vol. 6, No. 4, 34-58.
Brown, S., W. Goetzmann and B. Lang, 2004, Fees on Fees in Funds of Funds. Journal of
Investment Management.
Cornelius, P., T. Meyer, C. Diller and D. Guennoc, 2013, Mastering Illiquidity: Risk
Management for Portfolios of Limited Partnership Funds. Wiley.
Dow Jones, 2010. Private Equity Funds: State of the Market.
Fang, L., V. Ivashina and J. Lerner, 2015, The Disintermediation of Financial Markets: Direct
Investing in Private Equity. Journal of Financial Economics, forthcoming.
Fung, W., D. Hsieh, N. Naik and T. Ramadorai, 2008, Hedge Funds: Performance, Risk and
Capital Formation. Journal of Finance, Vol. LXIII, No. 4.
Gresch, N. and R. von Wyss, 2011, Private Equity Funds of Funds vs. Funds: A Performance
Comparison. The Journal of Private Equity, Vol. 14, No. 2, 43-58.
Harris, R., T. Jenkinson, and R. Stucke, 2010, A White Paper on Private Equity Research. UAI
Working Paper.
Harris R., T. Jenkinson and S. Kaplan, 2014, Private Equity Performance: What do we Know?
Journal of Finance, 69 (5), 1851-1882.
Harris, R., T. Jenkinson, S. Kaplan and R. Stucke, 2014, Has Persistence Persisted in Private
Equity? Evidence from Buyout and Venture Capital Funds. Working paper, SSRN
2304808.
Kaplan, S. N., and A. Schoar, 2005, Private Equity Returns: Persistence and Capital flows.
Journal of Finance 60, 1791-1823.

30
Korteweg, A. and M. Sorensen, 2014. Skill and Luck in Private Equity Performance. Working
Paper, Stanford University.
Lerner, J., A. Schoar and W. Wongsunwai, 2007, Smart Institutions, Foolish Choices? The
Limited Partner Performance Puzzle. Journal of Finance 62:731-64.
Metrick, Andrew, and Ayako Yasuda, 2010, The Economics of Private Equity Funds. Review of
Financial Studies 23: 2303-2341.
Preqin, The 2013 Preqin Private Equity Fund of Funds Review
Sensoy, B., Y. Wang and M. Weisbach, 2014, Limited Partner Performance and the Maturing of
the Private Equity Industry. Journal of Financial Economics 112, 320-343.

Figure 1: Histogram of Funds of Funds PMEs
This figure plots the histogram of the Public Market Equivalents (PMEs) for the 294 funds of fundsin our sample. The sample covers the period 1987 to 2007. Panel A reports the PMEs using the S&P500 as the benchmark portfolio. Panel B reports the PMEs using the Russell 2000 as the benchmarkportfolio. The solid (dashed) vertical line in each panel denotes the sample mean (median).
Panel A: PME S&P 500
0 1 2 3 4 5 6
PME S&P 500
0
5
10
15
20
Perc
ent
1.08Median =0.35σ =1.13µ =
Panel B: PME Russell 2000
0 1 2 3 4 5 6
PME Russell 2000
0
5
10
15
20
Perc
ent
1.00Median =0.42σ =1.04µ =
32

Figure 2: Histogram of Direct Fund PMEs
This figure plots the histogram of the Public Market Equivalents (PMEs) relative to the S&P 500for the direct funds in our sample. The sample covers the period 1987 to 2007. Panel A reports thePMEs for buyout funds. Panel B reports the for venture capital funds. The solid (dashed) verticalline in each panel denotes the sample mean (median).
Panel A: Buyout Fund PME
0 1 2 3 4 5 6 7 8 9 10
PME S&P 500
0
5
10
Perc
ent
1.19Median =0.55σ =1.27µ =701N =
Panel B: VC Fund PME
0 1 2 3 4 5 6 7 8 9 10
PME S&P 500
0
5
10
Perc
ent
0.94Median =1.78σ =1.31µ =880N =
33

Figure 3: Histogram of Synthetic Buyout FOFs for 2005
This figure plots the histogram of S&P 500 PMEs for the synthetic naive buyout funds of fundsfor vintage year 2005. These synthetic portfolios are formed by the procedure outlined in the text.The dashed vertical line denotes the sample mean. The solid vertical line denotes the PME for anexample fund of funds in our sample.
0.5 1.0 1.5 2.0
PME S&P 500
0
3
6
9
12
15
18
Perc
ent
60.00Fund %-tile =0.02Fund Excess PME =1.18Fund PME =0.09σ =1.16µ =
34

Figure 4: Histogram of Excess Performance of Funds of Funds Compared to Portfolios of DirectFunds
This figure plots the histogram of the Excess PME for the 294 funds of funds in our sample. ExcessPME is measured relative to the synthetic naive funds of funds. These synthetic portfolios areformed by the procedure outlined in the text. The sample covers the period 1987 to 2007. Thesolid (dashed) vertical line denotes the sample mean (median).
-2.5 -2.0 -1.5 -1.0 -0.5 0.0 0.5 1.0 1.5 2.0 2.5
Excess PME
0
5
10
15
20
Perc
ent
-0.07Median =0.30σ =
-0.06µ =
35

Table 1: Internal Rate of Return and Investment Multiples for Funds of Funds in Burgiss and Preqin Samples
This table presents average and median internal rates of return (IRR) and investment multiples (total value to paid in, TVPI) forall funds of funds (FoFs) in the Burgiss database and in Preqin. IRR and TVPI numbers are as of December 2012.
Number of FoFs IRR Average IRR Median TVPI Average TVPI MedianVintage Year Burgiss Preqin Burgiss Preqin Burgiss Preqin Burgiss Preqin Burgiss Preqin
1996 and earlier 14 44 25.4 28.7 15.6 24.5 3.02 2.48 2.27 2.481997 8 11 22.5 14.6 10.7 6.9 1.76 1.36 1.60 1.361998 17 18 4.2 6.2 5.7 6.1 1.27 1.38 1.35 1.381999 18 29 4.4 4.0 4.0 3.6 1.26 1.24 1.27 1.242000 25 35 6.7 7.2 5.4 6.5 1.45 1.33 1.36 1.332001 14 47 10.4 9.4 10.8 9.7 1.56 1.54 1.63 1.542002 9 25 9.9 10.6 10.3 9.6 1.50 1.55 1.47 1.552003 23 35 9.6 8.4 9.6 8.0 1.45 1.43 1.49 1.432004 25 45 5.5 7.7 6.0 6.7 1.28 1.34 1.28 1.342005 35 70 5.0 7.0 5.3 5.5 1.24 1.24 1.24 1.242006 60 82 5.5 5.6 5.3 5.2 1.23 1.19 1.21 1.192007 46 102 5.9 6.0 6.2 6.2 1.19 1.18 1.18 1.18
1987-2007 294 543 7.6 9.1 6.2 6.8 1.39 1.28 1.27 1.281997-2007 280 499 6.7 7.2 6.0 6.4 1.31 1.27 1.26 1.27
VY Avg 97-07 8.1 7.9 7.2 6.7 1.38 1.34 1.37 1.34
36

Table 2: Public Market Equivalents (PMEs) of Funds of Funds in Burgiss Sample
This table presents average and median PME (public market equivalent) figures based on the S&P500 and the Russell 2000 total return indices for all funds of funds (FoFs) in the Burgiss database.
Number PME S&P 500 PME Russell 2000Vintage Year of FoFs P25 Average Median P75 P25 Average Median P75
1996 and earlier 14 0.90 1.59 1.11 2.01 0.96 1.85 1.04 2.491997 8 0.79 1.49 1.34 1.74 0.65 1.31 0.99 1.441998 17 1.02 1.11 1.22 1.30 0.77 0.86 0.92 1.031999 18 1.00 1.08 1.09 1.23 0.76 0.86 0.85 1.002000 25 0.93 1.17 1.11 1.20 0.82 0.98 0.93 1.042001 14 0.99 1.26 1.25 1.46 0.92 1.13 1.11 1.312002 9 1.17 1.22 1.20 1.26 1.08 1.12 1.10 1.162003 23 1.10 1.22 1.24 1.30 1.02 1.14 1.16 1.222004 25 0.97 1.10 1.11 1.19 0.91 1.04 1.05 1.122005 35 1.04 1.07 1.07 1.13 0.96 1.00 1.01 1.062006 60 0.96 1.05 1.03 1.11 0.89 0.99 0.98 1.052007 46 0.95 1.00 0.98 1.05 0.89 0.94 0.94 0.99
1987-2007 294 0.97 1.13 1.08 1.22 0.89 1.04 1.00 1.091997-2007 280 0.97 1.11 1.08 1.20 0.89 1.00 0.99 1.09
VY Avg 97-07 0.99 1.16 1.15 1.27 0.88 1.03 1.00 1.13
37

Table 3: PME of Funds of Funds by Investment Strategy
This table presents average (Avg) and median (Med) of PMEs for corporate finance, generalist, andventure capital funds of funds in Burgiss. Panel A reports PMEs relative to the S&P 500 and PanelB reports relative to the Russell 2000.
Panel A: PME S&P 500Corp. Fin. Focus Generalist Focus VC Focus
Vintage Year N Avg Med N Avg Med N Avg Med
! 1997 4 1.38 1.42 8 1.06 0.93 10 2.02 2.001998/99 11 1.20 1.23 18 1.11 1.15 6 0.88 0.812000/01 16 1.46 1.39 13 1.16 1.13 10 0.85 0.842002/03 15 1.25 1.24 9 1.22 1.20 8 1.17 1.162004/05 26 1.08 1.10 16 1.07 1.07 18 1.09 1.132006/07 63 1.04 1.03 23 1.03 0.99 20 1.01 0.99
1987-2007 135 1.14 1.11 87 1.10 1.10 72 1.16 1.011997-2007 132 1.14 1.11 83 1.09 1.10 65 1.07 0.99
Panel B: PME Russell 2000Corp. Fin. Focus Generalist Focus VC Focus
Vintage Year N Avg Med N Avg Med N Avg Med
! 1997 4 1.32 1.24 8 1.03 0.84 10 2.29 2.091998/99 11 0.92 0.99 18 0.88 0.87 6 0.69 0.622000/01 16 1.24 1.25 13 1.00 0.97 10 0.74 0.742002/03 15 1.16 1.17 9 1.12 1.10 8 1.10 1.082004/05 26 1.02 1.02 16 1.01 1.01 18 1.03 1.052006/07 63 0.97 0.95 23 0.97 0.94 20 0.96 0.94
1987-2007 135 1.04 1.02 87 0.98 0.98 72 1.12 0.951997-2007 132 1.04 1.02 83 0.97 0.98 65 0.98 0.94
38

Table 4: Performance of Funds of Funds Compared to Individual Direct Funds
This table reports regression results where the dependent variable measures the PME (public mar-ket equivalent) of a fund relative to the S&P 500. The sample includes both direct funds and fundsof funds for the period 1987-2007. The sample includes 294 funds of funds (135 Corporate Fi-nance, 87 Generalist, and 72 Venture Capital) and 1,828 direct funds (948 Corporate Finance and880 Venture Capital). Fund of Funds is a binary variable equal to 1.0 when the fund is a fund offunds and equal to 0.0, otherwise. Column I includes all funds, Column II includes funds classifiedas Corporate Finance, Column III includes funds classified as Venture Capital, and Column IV in-cludes funds classified as Generalist. Vintage year effects are fixed. !, !!, !!! denotes significanceat the 10, 5 and 1 percent levels, respectively.
(I) (II) (III) (IV)All Funds of
FundsCorp. Fin.Focus VC Focus Generalist
Focus
Intercept 1:3472!!! 1:2162!!! 1:4892!!! 1:3426!!!Fund of Funds !0:0656!! !0:1067!!! !0:0119 !0:1212!!!
Number of Observations 2,122 1,083 952 1,915
R-square 0:0553 0:0859 0:1350 0:0539Adjusted R-square 0:0458 0:0678 0:1155 0:0434
39

Table 5: Portfolio Composition of Funds of Funds
This table presents the patterns of investments into primary direct funds by funds of funds in the Burgiss database for which detailedinformation on the underlying portfolio is available. We distinguish fund investments across the vintage year of direct funds (i.e., afund of funds’ investment year) and sub-asset class. The sample covers the period 1987 to 2007. Figures represent the percentageof a fund of fund’s capital committed to primary direct funds for the lower quartile (P25), average (mean), median, and upperquartile (P75). Mezz/DD/SS includes mezzanine, distressed debt and special situations as identified by Burgiss.
All Funds of Funds (n=190) Corporate Finance (n=83) Generalist (n=54) Venture Capital (n=53)P25 Avg Med P75 P25 Avg Med P75 P25 Avg Med P75 P25 Avg Med P75
Number of Funds 15.0 25.6 22.5 32.0 14.0 21.4 19.0 28.0 16.0 30.2 26.0 35.0 18.0 27.6 26.0 35.0
Year 1 5.7 18.6 13.2 24.5 6.0 18.5 13.3 24.5 5.3 19.9 14.2 25.9 5.4 17.5 9.6 22.7Year 2 19.0 32.9 31.2 44.8 18.4 32.1 32.0 43.8 20.6 35.9 34.5 48.1 19.0 31.1 27.7 42.4Year 3 12.6 26.7 27.0 37.8 12.9 27.2 26.8 36.8 6.6 22.4 24.3 33.8 17.9 30.1 31.4 41.3Year 4 – 12.1 8.8 19.8 – 11.5 8.1 18.4 – 13.0 11.5 22.7 0.4 12.0 8.3 21.8Year 5+ – 9.8 2.0 12.2 – 10.7 1.9 14.6 – 8.9 4.3 12.2 – 9.2 1.4 11.1
Buyout 20.8 52.3 54.7 84.4 76.5 76.2 87.2 94.3 45.4 55.1 54.7 65.4 3.1 12.1 8.9 21.0Mezz/DD/SS – 8.7 0.5 7.7 – 16.6 4.9 17.6 – 5.1 4.1 7.7 – 0.1 – –Real Assets – 1.1 – – – 1.0 – – – 1.9 – 3.7 – 0.3 – –VC Early – 16.9 9.4 30.2 – 1.7 – 3.4 5.4 17.4 15.1 26.9 27.9 40.3 41.2 49.1VC Balanced – 15.7 9.7 25.7 – 2.1 – 3.4 8.9 14.7 14.2 20.3 29.7 37.8 37.9 46.0VC Late – 3.8 0.3 5.8 – 0.8 – – – 2.9 1.7 5.2 3.6 9.4 7.4 13.7Other – 1.5 – – – 1.5 – – – 3.0 – – – – – –
40

Table 6: Performance of Funds of Funds Compared to Portfolios of Direct Funds
This table reports summary statistics for performance metrics of Funds of Funds PMEs relative to Synthetic Funds of Funds PMEs.The benchmark portfolio for the calculation of PME is the S&P 500. Excess PME is the difference in the Fund of Funds PME andthe mean PME of the Synthetic Funds of Funds in the same strategy and vintage year. Percentile PME is the percentile of the Fundof Funds PME in the distribution of Synthetic Funds of Funds PMEs in the same strategy and vintage year. Panel A constructssynthetic funds of funds based on the naive strategy outlined in the text. Panel B constructs synthetic funds of funds based on theinformed strategy outlined in the text. For the averages, we report the significance of the test of the hypothesis that Excess PMEequals 0.0 and Percentile PME equals 50.0. !, !!, !!! denotes significance at the 10, 5 and 1 percent levels, respectively.
Panel A: Naive Synthetic Funds of Funds
All Funds of Funds (n=294) Corporate Finance (n=135) Generalist (n=87) Venture Capital (n=72)P25 Avg Med P75 P25 Avg Med P75 P25 Avg Med P75 P25 Avg Med P75
Excess PME !0:15 !0:06!!!!0:07 0:03 !0:16 !0:06!!!!0:08 0:01 !0:16 !0:10!!!!0:09 0:02 !0:08 0:02 !0:03 0:06Percentile PME 6:00 36:91!!! 27:00 69:00 3:00 31:81!!! 14:00 58:00 6:00 34:99!!! 26:00 63:00 22:00 48:79 49:00 74:00
Panel B: Informed Synthetic Funds of Funds
All Funds of Funds (n=294) Corporate Finance (n=135) Generalist (n=87) Venture Capital (n=72)P25 Avg Med P75 P25 Avg Med P75 P25 Avg Med P75 P25 Avg Med P75
Excess PME !0:16 !0:05!!!!0:06 0:03 !0:15 !0:05!!!!0:07 0:02 !0:17 !0:10!!!!0:09 0:03 !0:13 0:01 !0:04 0:04Percentile PME 4:00 35:38!!! 18:50 67:00 3:00 33:81!!! 17:00 60:00 3:00 32:39!!! 17:00 67:00 9:00 41:92! 41:00 72:50
41

Table 7: Summary Statistics of Excess PME Relative to Median
This table reports summary statistics for Funds of Funds PMEs relative to Synthetic Funds of Funds PMEs. The benchmarkportfolio for the calculation of PME is the S&P 500. Excess PME is the difference in the Fund of Funds PME and the median PMEof the Synthetic Funds of Funds in the same strategy and vintage year. The first row constructs synthetic funds of funds based onthe naive strategy outlined in the text. The second row constructs synthetic funds of funds based on the informed strategy outlinedin the text. For the averages, we report the significance of the test of the hypothesis that Excess PME equals 0.0 and PercentilePME equals 50.0. !, !!, !!! denotes significance at the 10, 5 and 1 percent levels, respectively.
All Funds of Funds (n=294) Corporate Finance (n=135) Generalist (n=87) Venture Capital (n=72)P25 Avg Med P75 P25 Avg Med P75 P25 Avg Med P75 P25 Avg Med P75
Naive Strategy !0:13 !0:03!! !0:06 0:05 !0:16 !0:06!!!!0:07 0:01 !0:13 !0:08!!!!0:07 0:05 !0:07 0:06 !0:00 0:09Informed Strategy !0:14 !0:04!! !0:06 0:04 !0:14 !0:05!!!!0:06 0:03 !0:16 !0:08!!!!0:08 0:04 !0:11 0:04 !0:02 0:08
42

Table 8: Performance of Funds of Funds with Holdings Data Compared to Fund of Fund-level Benchmarks
This table reports summary statistics for performance metrics of Funds of Funds PMEs relative to Synthetic Funds of Funds PMEs.The benchmark portfolio for the calculation of PME is the S&P 500. Excess PME is the difference in the Fund of Funds PMEand the mean PME of the Synthetic Funds of Funds in the same strategy and vintage year. Percentile PME is the percentile ofthe Fund of Funds PME in the distribution of Synthetic Funds of Funds PMEs in the same strategy and vintage year. Syntheticfunds of funds are constructed using the Fund of Fund-level benchmarking strategy outlined in the text. For the averages, wereport the significance of the test of the hypothesis that Excess PME equals 0.0 and Percentile PME equals 50.0. !, !!, !!! denotessignificance at the 10, 5 and 1 percent levels, respectively.
All Funds of Funds (n=190) Corporate Finance (n= 83) Generalist (n=54) Venture Capital (n=53)P25 Avg Med P75 P25 Avg Med P75 P25 Avg Med P75 P25 Avg Med P75
Excess PME !0:12 !0:05!!!!0:03 0:04 !0:11 !0:01 !0:03 0:03 !0:20 !0:12!!!!0:06 0:03 !0:12 !0:02 0:00 0:09Percentile PME 15:00 42:63!!! 39:00 67:00 17:00 42:45!! 37:00 66:00 10:00 37:52!!! 28:00 63:00 21:00 48:11 57:00 72:00
43
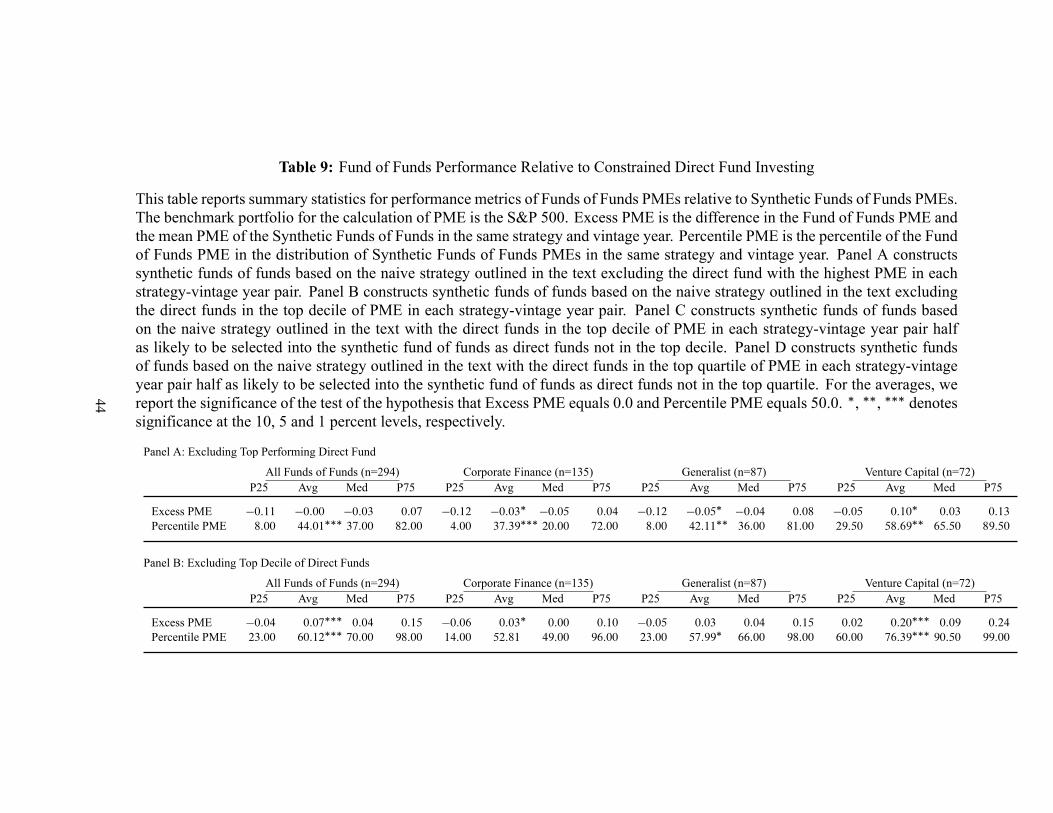
Table 9: Fund of Funds Performance Relative to Constrained Direct Fund Investing
This table reports summary statistics for performance metrics of Funds of Funds PMEs relative to Synthetic Funds of Funds PMEs.The benchmark portfolio for the calculation of PME is the S&P 500. Excess PME is the difference in the Fund of Funds PME andthe mean PME of the Synthetic Funds of Funds in the same strategy and vintage year. Percentile PME is the percentile of the Fundof Funds PME in the distribution of Synthetic Funds of Funds PMEs in the same strategy and vintage year. Panel A constructssynthetic funds of funds based on the naive strategy outlined in the text excluding the direct fund with the highest PME in eachstrategy-vintage year pair. Panel B constructs synthetic funds of funds based on the naive strategy outlined in the text excludingthe direct funds in the top decile of PME in each strategy-vintage year pair. Panel C constructs synthetic funds of funds basedon the naive strategy outlined in the text with the direct funds in the top decile of PME in each strategy-vintage year pair halfas likely to be selected into the synthetic fund of funds as direct funds not in the top decile. Panel D constructs synthetic fundsof funds based on the naive strategy outlined in the text with the direct funds in the top quartile of PME in each strategy-vintageyear pair half as likely to be selected into the synthetic fund of funds as direct funds not in the top quartile. For the averages, wereport the significance of the test of the hypothesis that Excess PME equals 0.0 and Percentile PME equals 50.0. !, !!, !!! denotessignificance at the 10, 5 and 1 percent levels, respectively.
Panel A: Excluding Top Performing Direct Fund
All Funds of Funds (n=294) Corporate Finance (n=135) Generalist (n=87) Venture Capital (n=72)P25 Avg Med P75 P25 Avg Med P75 P25 Avg Med P75 P25 Avg Med P75
Excess PME !0:11 !0:00 !0:03 0:07 !0:12 !0:03! !0:05 0:04 !0:12 !0:05! !0:04 0:08 !0:05 0:10! 0:03 0:13Percentile PME 8:00 44:01!!! 37:00 82:00 4:00 37:39!!! 20:00 72:00 8:00 42:11!! 36:00 81:00 29:50 58:69!! 65:50 89:50
Panel B: Excluding Top Decile of Direct Funds
All Funds of Funds (n=294) Corporate Finance (n=135) Generalist (n=87) Venture Capital (n=72)P25 Avg Med P75 P25 Avg Med P75 P25 Avg Med P75 P25 Avg Med P75
Excess PME !0:04 0:07!!! 0:04 0:15 !0:06 0:03! 0:00 0:10 !0:05 0:03 0:04 0:15 0:02 0:20!!! 0:09 0:24Percentile PME 23:00 60:12!!! 70:00 98:00 14:00 52:81 49:00 96:00 23:00 57:99! 66:00 98:00 60:00 76:39!!! 90:50 99:00
44

Table 9: Fund of Funds Performance Relative to Constrained Direct Fund Investing (cont.)
Panel C: Reweighted Top Decile of Direct Funds
All Funds of Funds (n=294) Corporate Finance (n=135) Generalist (n=87) Venture Capital (n=72)P25 Avg Med P75 P25 Avg Med P75 P25 Avg Med P75 P25 Avg Med P75
Excess PME !0:09 0:00 !0:02 0:09 !0:11 !0:02 !0:04 0:05 !0:10 !0:04 !0:04 0:08 !0:04 0:10! 0:03 0:13Percentile PME 11:00 46:98 44:00 83:00 6:00 40:74!!! 27:00 78:00 11:00 44:94 43:00 82:00 37:00 61:15!!! 67:00 87:50
Panel D: Reweighted Top Quartile of Direct Funds
All Funds of Funds (n=294) Corporate Finance (n=135) Generalist (n=87) Venture Capital (n=72)P25 Avg Med P75 P25 Avg Med P75 P25 Avg Med P75 P25 Avg Med P75
Excess PME !0:07 0:04!! 0:01 0:11 !0:09 0:01 !0:02 0:07 !0:08 !0:00 !0:01 0:11 !0:01 0:15!!! 0:07 0:17Percentile PME 21:00 54:32!! 59:00 88:00 12:00 47:56 39:00 85:00 21:00 52:56 57:00 86:00 53:00 69:10!!! 78:50 89:00
45