Financial Condition Report 2020 - Swiss Re
127
Transforming Tomorrow Together Financial Condition Report 2020
Transcript of Financial Condition Report 2020 - Swiss Re

TransformingTomorrowTogether
Financial Condition Report 2020

Swiss Re LtdSwiss Re Ltd is the holding company of the Swiss Re Group. Its shares are listed in accordance with the International ReportingStandard on SIX Swiss Exchange and traded under the symbol SREN.

Swiss Re Financial Condition Report 2020 1
Contents
Introduction 2About this report 2
Swiss Re Group 5Management summary 6Business activities 8Performance 9Governance and risk management 10Risk profile 12Valuation 16Capital management 20Solvency 21
Swiss Reinsurance Company Ltd 23Management summary 24Business activities 26Performance 30Governance and risk management 35Risk profile 37Valuation 39Capital management 44Solvency 45
Swiss Re Corporate Solutions Ltd 49Management summary 50Business activities 52Performance 54Governance and risk management 58Risk profile 60Valuation 62Capital management 67Solvency 68
Swiss Re Nexus Reinsurance Company Ltd 73Management summary 74Business activities 76Performance 78Governance and risk management 81Risk profile 83Valuation 85Capital management 89Solvency 90
Swiss Re International SE Zurich branch 95Management summary 96Business activities 97Performance 98
iptiQ EMEA P&C S.A., Luxembourg, Zurich branch 105Management summary 106Business activities 107Performance 109
Appendix 115Methodology and valuation 116Cautionary note on forward-looking statements 121Note on risk factors 123
2 Swiss Re Financial Condition Report 2020
Introduction
About this report
This Financial Condition Report (Report or Financial Condition Report) is a mandatory public disclosure for Swiss regulated re/insurance entities required by FINMA Circular 2016/2 Disclosure – insurers (Circular). The publication requirements are set forth in the Circular. This Report includes qualitative and quantitative information on business activities, performance, risk management and the Swiss Solvency Test (SST) information of the Swiss Re Group (Group) as well as its Swiss-regulated re/insurance entities: Swiss Reinsurance Company Ltd (SRZ), Swiss Re Corporate Solutions Ltd (SRCS), Swiss Re International SE, Luxembourg, Zurich branch (SRI SE Zurich branch) and iptiQ EMEA P&C S.A., Luxembourg, Zurich branch (iptiQ EMEA P&C Zurich branch) and Swiss Re Nexus Reinsurance Company Ltd, formerly Swiss Life Capital Reinsurance Ltd (SRN). A large part of the required information included in the Report is available in other public disclosures provided by Swiss Re, such as the Group’s Financial Report, available under www.swissre.com/investors/financial-information. Readers of this Report should also consult these public disclosures. Information not included in other publicly available disclosures can be found mainly in the valuation and solvency sections of this Report.
The preparation of the SST information requires management to make a number of estimates and assumptions. The valuation of assets and liabilities reflects best estimates of underlying cash flows (eg premiums, claims, commissions, expenses, etc), using models and taking into consideration all relevant information available at the relevant balance sheet date. In line with other valuation methods based on projections of future cash flows, economic valuations involve significant judgement when establishing which assumptions to use. The Group and its Swiss regulated re/insurance entities actively and carefully review assumptions, selecting those that are considered most appropriate and seeking consistency among business activities. Valuations are updated at each balance sheet date as experience develops and more information becomes available. In-force business assets and liabilities include estimates for premiums as well as claims and benefit payments not yet received from ceding companies at the balance sheet date. In addition, the Group and its Swiss regulated re/insurance entities have certain assets and liabilities for which liquid market prices are not available.
All of the foregoing estimates are determined on a market-consistent basis using all relevant information available at the time of valuation. However, actual results could differ significantly from these estimates.
Please see also the Cautionary note on forward-looking statements and the Note on risk factors in this Report.
Scope and requirements
Cautionary note on the Financial Condition Report

Swiss Re Financial Condition Report 2020 3
The financial information included in this Report is based on the following accounting frameworks:
The consolidated financial statements of the Group are prepared in accordance with US Generally Accepted Accounting Principles (US GAAP) and reported in US dollars.
The statutory financial statements of Swiss regulated legal entities are prepared in accordance with Swiss law and reported in Swiss francs (they are converted into US dollars for the SST balance sheet comparison with Swiss statutory).
SST information uses Swiss Re’s internal model which has been approved by FINMA. The internal Economic Value Management (EVM) framework is the basis for preparing the SST balance sheets as both frameworks are based on market-consistent valuation principles. Valuation differences between EVM and SST mainly affect capital costs and deferred taxes. EVM is the Group-proprietary integrated economic valuation and steering framework, consistently measuring economic performance across all businesses. EVM and SST financial statements are reported in US dollars.
The risk exposure basis for SST is a projection for the period from 1 January to 31 December 2021 and is based on the economic balance sheet as of 31 December 2020 and adjustments to reflect 1 January 2021 business shifts. Potential SST model or data limitations identified during the SST process are reported to FINMA as part of the SST Report 2021 with an impact assessment whenever possible. All comparative information is based on the SST Report 2020 filed with FINMA in April 2020.
The reported solvency information for 2021 is consistent with the information provided in the SST Report 2021 for Group, SRZ, SRCS and SRN. The SST Report 2021 is filed with FINMA in April 2021 and is subject to FINMA’s review and approval.
This Report has not been audited. The US GAAP financial statements of the Group and the statutory financial statements of Swiss Re Ltd and its Swiss regulated re/insurance entities are audited. Please refer to the reports of the statutory auditor referenced in this Report.
Accounting and risk basis
Audit

4 Swiss Re Financial Condition Report 2020
Swiss Re Financial Condition Report 2020 5
Swiss Re Group
Management summary 6
Business activities 8
Performance 9
Governance and risk management 10
Risk profile 12
Valuation 16
Capital management 20
Solvency 21

6 Swiss Re Financial Condition Report 2020
Management summary
Despite a challenging year, Swiss Re Group maintains a very strong solvency level of 215% in SST 2021. The decrease of 17pp compared to SST 2020 is mainly driven by COVID-19-related claims and reserves, the significant decline in interest rates and higher financial market volatilities. These effects are partly offset by the sale of ReAssure Group Plc, a positive investment and underwriting performance (excluding COVID-19) and higher supplementary capital.
The Group SST 2021 ratio lies within the new target range of 200‒250%, which replaces the fixed Group SST target to better align with market practice.
This Report provides qualitative and quantitative information about the financial condition of the Group. This Report includes financial and risk management information already published in the Group’s 2020 Financial Report available under www.swissre.com/investors/financial-information.
Group SST 2021 in USD millions
SST RBC – MVM
41 504
SST TC – MVM
19 308
Group SST 2020 in USD millions
SST RBC – MVM
41 873
SST TC – MVM
18 021
SST RBC: SST risk-bearing capitalSST TC: SST target capital MVM: Market value margin
Solvency overview
Swiss Re Group
= 215%
= 232%
Swiss Re Financial Condition Report 2020 7
In this section, we provide information about the Group’s business model, the strategy and significant events. > Read more
We present the performance of the year under review based on the US GAAP financial statements. > Read more
This section provides an overview of the system of governance, key governing bodies, risk management systems and policies. > Read more
The main components of the total risk calculated under SST are discussed in this section. > Read more
In this section, we provide the SST balance sheet and additional quantitative and qualitative explanations on differences to the US GAAP audited financial statements of the Group. > Read more
The Group’s capital management strategy and key changes in 2020 are discussed in this section. > Read more
This section presents the SST calculation for the Group and includes explanations on changes relative to the prior year. > Read more
Business activities
Performance
Governance and risk management
Risk profile
Valuation
Capital management
Solvency

8 Swiss Re Financial Condition Report 2020
Swiss Re Group
Business activities
For information on the Group strategy, please see the section Our business and strategy in the 2020 Business Report on pages 16 and 17.
For information on the Group structure and shareholders, please see the Group structure and shareholders section in the 2020 Financial Report on pages 84 and 85.
For information on net premiums earned and fee income from policyholders by geography, see Note 2 to the financial statements included in the 2020 Financial Report on page 212.
For information on the Group’s significant subsidiaries and equity investees, see Note 20 to the financial statements included in the 2020 Financial Report on pages 278–280.
For information on the Group’s use of special purpose vehicles, see Note 21 to the financial statements (including all material balances related to variable interest entities) included in the 2020 Financial Report on pages 281–284.
For information on significant events and acquisitions, please refer to the Information policy section on page 112 and Note 10 to the financial statements (Acquisitions and disposals) included in the 2020 Financial Report on page 258.
In 2020 PricewaterhouseCoopers Ltd was the auditor of Swiss Re Ltd and its subsidiaries. For more information on Swiss Re Group s auditor, please see the section Auditors in the 2020 Financial Report on pages 110 and 111. The audit report of the statutory auditor can be found in the 2020 Financial Report on pages 286–290.
Business information
Significant events
Report of the statutory auditor

Swiss Re Financial Condition Report 2020 9
Performance
The Group publicly discloses detailed financial results in the 2020 Financial Report (available on www.swissre.com/investors/financial-information). Please refer to the following specific sections for more information: Summary of financial statements on pages 12–13 Group results on pages 14–17 Income statement on page 182 Statement of comprehensive income on page 183 Note 7 on Investments on pages 236–243
10 Swiss Re Financial Condition Report 2020
Governance and risk management
For information on the composition of the Board of Directors and Executive Management of Swiss Re Ltd, see sections relating to the Board of Directors and Executive Management in the 2020 Financial Report on pages 88–107.
All information on Swiss Re’s risk management and risk governance is publicly disclosed in the 2020 Financial Report, pages 50–77.
Swiss Re’s Risk Management function is embedded throughout the Group and is an integral part of our business model. Risk Management is mandated to ensure that the Group and its legal entities have the necessary expertise, frameworks and infrastructure to support good risk-taking. In addition, Risk Management monitors and ensures adherence to applicable frameworks.
All risk-related activities, regardless of the legal entities in which they are undertaken, are subject to Swiss Re’s risk management framework, which comprises the following major elements:
A risk policy and risk governance documentation – the Group risk governance documents are organised hierarchically, across five levels, which are mirrored by equivalent documents at legal entity level; see 2020 Financial Report, page 62.
Four key risk management principles, which apply consistently across all risk categories at Group and legal entity level; see 2020 Financial Report, page 62.
Three fundamental roles for delegated risk-taking, including the three lines of control; 2020 Financial Report, page 62.
A description of Swiss Re’s risk culture that promotes risk awareness, rigor and discipline across all risk management activities; see 2020 Financial Report, page 63.
The organisation of risk management, including responsibilities at Board and executive level; see 2020 Financial Report, pages 64–65.
Swiss Re’ s risk control framework, which comprises a body of standards that establish an internal control system for taking and managing risk; see 2020 Financial Report, page 65.
The Group’s risk appetite framework, including its overall risk appetite statement, risk tolerance and capacity limits. The risk appetite framework establishes the overall approach through which Swiss Re practices controlled risk-taking throughout the Group; see 2020 Financial Report, page 66.
Swiss Re’s internal risk model provides a meaningful assessment of the risks to which the Group is exposed and is an important tool for managing our business. It determines the capital requirements for internal purposes and forms the basis for regulatory reporting under the SST and under Solvency II for our legal entities in the European Economic Area (EEA) and the United Kingdom. For more information, please see the Internal control system and risk model section of the 2020 Financial Report.
Board of Directors and Executive Management
Governance and Risk management
Swiss Re Group

Swiss Re Financial Condition Report 2020 11
Swiss Re regularly assesses its risk exposure across all risk categories. We identify and evaluate emerging threats and opportunities through a systematic framework that includes the assessment of potential surprise factors that could affect known loss potentials:
Swiss Re is exposed to a broad risk landscape, see 2020 Financial Report, page 68–69.
Insurance risks are all risks that Swiss Re takes through its underwriting activities, including related risks such as inflation or uncertainty in pricing and reserving. For details on our insurance risk management for property and casualty risks as well as life and health risks, see 2020 Financial Report, page 70–71.
In respect to financial risks, Swiss Re distinguishes between financial market risk and credit risk. Financial market risk is the risk that assets or liabilities may be impacted by movements in financial market prices or rates − such as equity prices, interest rates, credit spreads, foreign exchange rates or real estate prices. Credit risk is the risk of incurring a financial loss due to diminished creditworthiness or default of Swiss Re’s counterparties or of third parties (credit spread risk falls under financial market risk). For more information, see 2020 Financial Report, page 72–73.
Swiss Re also assesses other risks such as liquidity risk, operational risk, strategic risk, regulatory risk, political risk, model risk, valuation risk, sustainability risk and emerging risk. These risks are not explicitly part of the Group’s economic capital requirement, but are actively monitored and controlled due to their significance for Swiss Re. For more information, see 2020 Financial Report, page 74–77.

12 Swiss Re Financial Condition Report 2020
Swiss Re Group
Risk profile
Swiss Re is exposed to insurance and financial risks that are calculated in its internal risk model, as well as other risks that are not explicitly part of the economic capital requirement but are actively monitored and controlled due to their significance for Swiss Re. These include operational, liquidity, model, valuation, regulatory, political, strategic and sustainability risks (see Swiss Re’s risk landscape, 2020 Financial Report, page 68).
Property and casualty insurance risk is mainly driven by underlying risks inherent in the business Swiss Re underwrites, in particular natural catastrophe risk, non-life claims inflation, costing and reserving and man-made risk. The main drivers of life and health insurance risk are mortality trend and lethal pandemic risk.
The Group’s financial risk derives from financial market risk as well as from credit risk. Key drivers of financial market risk are credit spread and equity risk. Credit risk is mainly driven by the credit and surety business and default risk of capital market products.
Total risk is based on 99% tail value-at-risk (tail VaR) and represents the average unexpected loss that occurs with a frequency of less than once in 100 years over a one-year time horizon.
USD millions SST 2020 SST 2021 Change since SST 2020
Property and casualty 11 708 12 895 1 187
Life and health 9 857 11 852 1 996Financial market 11 218 10 594 ‒624Credit1 3 496 3 186 ‒310Diversification –14 945 ‒16 174 ‒1 228Total risk 21 332 22 353 1 021
1 Credit comprises credit default and migration risk from both asset management and underwriting. It excludes credit spread risk, which is part of financial market risk.
Insurance risk overview Financial risk overview
Property and casualty 49%Life and health 51%
Credit spread 42%Equity 28%Credit 21%Other FM 9%
Total risk

Swiss Re Financial Condition Report 2020 13
Swiss Re’s internal model takes account of the accumulation and diversification between individual risks. The effect of diversification at the category level, which is shown in the table above, represents the difference between total risk (the Group’s 99% tail VaR) and the sum of standalone tail VaR amounts for the individual risk categories. This amount does not reflect diversification within risk categories. The extent of diversification is largely determined by the selected level of aggregation – the higher the aggregation level, the lower the diversification effect.
Total risk increases to USD 22.4 billion driven by higher insurance risk, offset partly by lower financial market and credit risk. The higher weight of insurance risk leads to increased diversification at risk category level.
The increase in property and casualty risk is mainly driven by a rise in non-life claims inflation risk reflecting the heightened probability of extreme inflation outcomes, as well as an increase in costing and reserving risk mainly due to COVID-19-related reserves.
Higher life and health risk mainly reflects the business growth in Asia and the US, resulting in higher exposure to mortality trend, lethal pandemic and critical illness risk. The increase is further driven by the impact of lower interest rates and the appreciation of the Canadian dollar and British pound against the US dollar.
The decrease in financial market risk is driven mainly by the sale of ReAssure Group Plc and an increase in credit hedges, which reduced credit spread risk. This is partly offset by higher financial market volatilities resulting from the COVID-19-related market turbulence, as well as by the appreciation of major currencies against the US dollar.
Credit risk decreases mainly due to the sale of ReAssure Group Plc and the increase in credit hedges.

14 Swiss Re Financial Condition Report 2020
Swiss Re Group
Swiss Re uses a Group-wide risk matrix methodology and Swiss Re’s Global Risk Register to capture operational risks. The matrix in particular focuses on risks approaching or exceeding Swiss Re’s own risk tolerance as they require management actions. Adherence to risk tolerance is monitored and reported at least on a quarterly basis. The overall control environment within Swiss Re Group remains adequate.
Key focus areas of the Group’s operational risk management include capturing insights and experience from the COVID-19 pandemic, and reflecting these in underwriting processes and controls.
For details on other significant risks, including liquidity, model, valuation, regulatory, political, strategic and sustainability risks, see the Group’s 2020 Financial Report sections on Liquidity management on page 60, Swiss Re’s risk landscape on pages 68–69, and Management of other significant risks on pages 74–77.
Swiss Re uses 99% tail VaR to measure its risk concentrations. Additionally, risk concentrations are also measured via value at risk calculations for major natural catastrophe scenarios with a 200-year return period and stress calculations for credit default, as well as sensitivities to key financial market parameters.
The tables below provide details on potential annualised unexpected losses from insurance peak scenarios with a return period of 200 years as well as the potential annualised unexpected loss from a credit default event. The most severe financial risk sensitivities are shown in terms of their impact on the SST ratio.
In SST 2021, the largest natural catastrophe exposure for Swiss Re Group derives from the Atlantic hurricane scenario with a USD 5.8 billion loss. Lethal pandemic and credit default losses are estimated to be at USD 3.6 billion and USD 2.2 billion, respectively.
Insurance risk stress tests: Annualised unexpected loss, 99.5% VaR in USD millions
SST 2021
Atlantic hurricane 5 826Californian earthquake 4 739Japanese earthquake 4 101European windstorm 2 345Lethal pandemic 3 616
Excluding earned premiums for business written and reinstatement premiums that could be triggered as a result of the event.
Credit risk stress test: Annualised unexpected loss, 99.5% VaR in USD millions
SST 2021
Credit default 2 228Excluding earned premiums for business written and reinstatement premiums that could be triggered as a result of the event.
Operational risk
Other significant risks
Risk concentration

Swiss Re Financial Condition Report 2020 15
Among the financial market sensitivities shown below, the Group is most sensitive to a 50-basis-point decrease in interest rates, which would result in an estimated decrease in the SST ratio of 14 percentage points.
Financial market SST ratio sensitivities SST 2021
Interest rate +50bps 12ppInterest rate –50bps ‒14ppSpreads +50bps ‒5ppSpreads –50bps 5ppEquity values +25% 3ppEquity values –25% ‒4ppReal estate values +25% 6ppReal estate values –25% ‒7pp
Swiss Re manages and controls its risks through an extended limit framework. The Group employs internal retrocession and funding agreements to efficiently manage capital across Swiss Re and ensure that risk-taking in individual legal entities is well diversified. Insurance risks are also mitigated through retrocession, insurance risk swaps or transferring risk to capital markets. For financial risks, Swiss Re uses financial market derivative instruments as well as financial market securities to hedge financial market and credit risk arising from investments and insurance liabilities.
Risk mitigation

16 Swiss Re Financial Condition Report 2020
Swiss Re Group
Valuation
The SST balance sheet is prepared based on the same market-consistent valuation principles as applied in Swiss Re’s internal EVM framework. EVM is therefore used as a basis for preparing the SST balance sheet and valuation adjustments to EVM mainly affect capital costs and deferred taxes. The difference between assets and liabilities is defined as the SST net asset value, which is the basis for the calculation of the SST risk-bearing capital (RBC).
The SST valuation methodology is further described in the > Appendix of this Report.
SST balance sheet
USD millions Notes SST 2020 SST 2021Change since
SST 2020
Market-consistent value of investments
Real estate 4 668 5 117 448 Participations n/aFixed-income securities 1 96 773 82 912 ‒13 861 Loans 2 223 1 960 ‒263 Mortgages 1 980 1 458 ‒522 Equities 2 990 4 894 1 903 Other investments 9 765 20 573 10 808 Collective investment schemes n/a Alternative investments 2 3 865 4 468 604 Structured products n/a Other investments 3 5 901 16 105 10 204 Total investments 118 400 116 913 ‒1 487
Market-consistent value of other assets
Financial investments from unit-linked life insurance 4 32 971 463 ‒32 508 Receivables from derivative financial instruments 507 297 ‒210 Deposits made under assumed reinsurance contracts 5 11 764 17 231 5 467 Cash and cash equivalents 6 9 611 5 458 ‒4 153 Reinsurers‘ share of best estimate of provisions for insurance liabilities
6 742 5 744 ‒998
Direct insurance: life insurance business (excluding unit-linked life insurance)
7 1 974 307 ‒1 667
Reinsurance: life insurance business (excluding unit-linked life insurance)
917 1 422 505
Direct insurance: non-life insurance business 2 033 2 192 159 Direct insurance: health insurance business n/a Reinsurance: non-life insurance business 1 870 1 779 ‒91 Reinsurance: health insurance business n/a Direct insurance: other business n/a Reinsurance: other business n/a Direct insurance: unit-linked life insurance business –96 96 Reinsurance: unit-linked life insurance business 43 43 n/aFixed assets 127 100 ‒28 Deferred acquisition costs n/aIntangible assets n/aReceivables from insurance business 15 343 15 899 556 Other receivables 2 149 1 451 ‒698 Other assets 8 4 815 7 484 2 670 Unpaid share capital n/aAccrued assets 134 110 ‒24 Total other assets 84 163 54 237 ‒29 926
Total market-consistent value of assets 202 563 171 150 ‒31 413
Swiss Re Financial Condition Report 2020 17
USD millions Notes SST 2020 SST 2021Change since
SST 2020
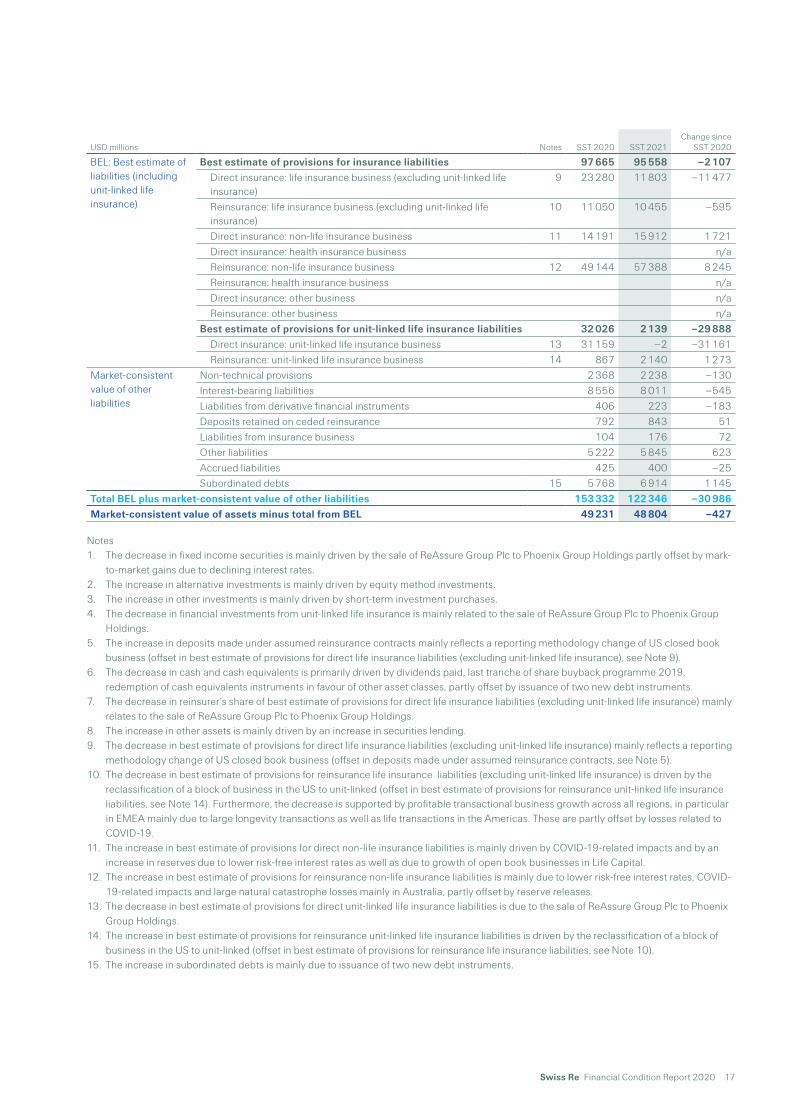
BEL: Best estimate of liabilities (including unit-linked life insurance)
Best estimate of provisions for insurance liabilities 97 665 95 558 ‒2 107 Direct insurance: life insurance business (excluding unit-linked life
insurance) 9 23 280 11 803 ‒11 477
Reinsurance: life insurance business (excluding unit-linked life insurance)
10 11 050 10 455 ‒595
Direct insurance: non-life insurance business 11 14 191 15 912 1 721 Direct insurance: health insurance business n/a Reinsurance: non-life insurance business 12 49 144 57 388 8 245 Reinsurance: health insurance business n/a Direct insurance: other business n/a Reinsurance: other business n/aBest estimate of provisions for unit-linked life insurance liabilities 32 026 2 139 ‒29 888 Direct insurance: unit-linked life insurance business 13 31 159 ‒2 ‒31 161 Reinsurance: unit-linked life insurance business 14 867 2 140 1 273
Market-consistent value of other liabilities
Non-technical provisions 2 368 2 238 ‒130Interest-bearing liabilities 8 556 8 011 ‒545Liabilities from derivative financial instruments 406 223 ‒183Deposits retained on ceded reinsurance 792 843 51Liabilities from insurance business 104 176 72Other liabilities 5 222 5 845 623Accrued liabilities 425 400 ‒25Subordinated debts 15 5 768 6 914 1 145
Total BEL plus market-consistent value of other liabilities 153 332 122 346 ‒30 986Market-consistent value of assets minus total from BEL 49 231 48 804 ‒427
Notes1. The decrease in fixed income securities is mainly driven by the sale of ReAssure Group Plc to Phoenix Group Holdings partly offset by mark-
to-market gains due to declining interest rates.2. The increase in alternative investments is mainly driven by equity method investments.3. The increase in other investments is mainly driven by short-term investment purchases.4. The decrease in financial investments from unit-linked life insurance is mainly related to the sale of ReAssure Group Plc to Phoenix Group
Holdings.5. The increase in deposits made under assumed reinsurance contracts mainly reflects a reporting methodology change of US closed book
business (offset in best estimate of provisions for direct life insurance liabilities (excluding unit-linked life insurance), see Note 9).6. The decrease in cash and cash equivalents is primarily driven by dividends paid, last tranche of share buyback programme 2019,
redemption of cash equivalents instruments in favour of other asset classes, partly offset by issuance of two new debt instruments.7. The decrease in reinsurer‘s share of best estimate of provisions for direct life insurance liabilities (excluding unit-linked life insurance) mainly
relates to the sale of ReAssure Group Plc to Phoenix Group Holdings.8. The increase in other assets is mainly driven by an increase in securities lending.9. The decrease in best estimate of provisions for direct life insurance liabilities (excluding unit-linked life insurance) mainly reflects a reporting
methodology change of US closed book business (offset in deposits made under assumed reinsurance contracts, see Note 5).10. The decrease in best estimate of provisions for reinsurance life insurance liabilities (excluding unit-linked life insurance) is driven by the
reclassification of a block of business in the US to unit-linked (offset in best estimate of provisions for reinsurance unit-linked life insurance liabilities, see Note 14). Furthermore, the decrease is supported by profitable transactional business growth across all regions, in particular in EMEA mainly due to large longevity transactions as well as life transactions in the Americas. These are partly offset by losses related to COVID-19.
11. The increase in best estimate of provisions for direct non-life insurance liabilities is mainly driven by COVID-19-related impacts and by an increase in reserves due to lower risk-free interest rates as well as due to growth of open book businesses in Life Capital.
12. The increase in best estimate of provisions for reinsurance non-life insurance liabilities is mainly due to lower risk-free interest rates, COVID-19-related impacts and large natural catastrophe losses mainly in Australia, partly offset by reserve releases.
13. The decrease in best estimate of provisions for direct unit-linked life insurance liabilities is due to the sale of ReAssure Group Plc to Phoenix Group Holdings.
14. The increase in best estimate of provisions for reinsurance unit-linked life insurance liabilities is driven by the reclassification of a block of business in the US to unit-linked (offset in best estimate of provisions for reinsurance life insurance liabilities, see Note 10).
15. The increase in subordinated debts is mainly due to issuance of two new debt instruments.

18 Swiss Re Financial Condition Report 2020
Swiss Re Group
The SST balance sheet comparison with the audited financial statements provides insights into the main valuation and scope differences.
An overview of the main valuation and scope differences and the definition of the aggregated line items are included in the > Appendix of this Report.
Real estateDifferences in valuation: In SST, real estate is measured at market value, while under US GAAP real estate is carried at depreciated cost.
Loans Differences in scope: Reinsurance contracts on a funds held basis for company-owned life insurance are reported as policy loans for SST (reflecting a look-through approach). Under US GAAP, those assets are part of the funds held by ceding companies and other receivables from reinsurance.
Differences in valuation: In SST, policy loans are valued by discounting future estimated cash flows at risk-free rates, while under US GAAP policy loans are carried at amortised costs.
Other investmentsDifferences in scope: Derivatives and securities lending are disclosed under other assets for SST reporting. For US GAAP, those financial instruments are reflected in other investments.
Differences in valuation: Equity accounted investments in private equity and hedge funds are valued at fair value in SST. US GAAP generally values such investments utilising net asset values subject to adjustments, as deemed necessary for restrictions on redemption.
Funds held by ceding companies and other receivables from reinsurance Differences in scope: Reinsurance contracts on a funds held basis for company-owned life insurance are reported as policy loans for SST (reflecting a look-through approach). Under US GAAP, those assets are part of the funds held by ceding companies and other receivables from reinsurance.
Differences in valuation: In SST, funds held for which an interest is credited are valued by discounting future estimated cash flows at risk-free rates. Under US GAAP, funds held are generally accounted for at face value including accrued interest.
SST balance sheet comparison with US GAAP
Assets
USD millions US GAAP SST Difference
Real estate 2 602 5 117 2 515Investments in subsidiaries and affiliated companies n/a
Fixed income securities 83 018 82 912 ‒106Loans 1 905 1 960 55Mortgages 1 410 1 458 48Equity securities 4 899 4 894 ‒5Other investments 26 396 20 573 ‒5 823Investments for unit-linked and with-profit business 463 463 0Cash and cash equivalents 5 470 5 458 ‒12Funds held by ceding companies and other receivables from reinsurance 26 660 33 130 6 470Reinsurance recoverable from retrocessions 5 892 5 744 ‒148Other assets 23 907 9 442 ‒14 465Total assets 182 622 171 150 ‒11 472

Swiss Re Financial Condition Report 2020 19
Reinsurance recoverable from retrocessionsDifferences in valuation: same principles apply as for re/insurance liabilities before retrocession described below.
Other assets Differences in scope: Derivative and securities lending agreements assets are included in other assets for SST, whereas under US GAAP they are reported as part of other investments.
Differences in valuation: SST does not recognise deferred taxes, deferred acquisition costs, goodwill and other intangibles, which are reported under US GAAP.
Re/insurance liabilities before retrocessionsDifferences in scope: SST includes universal life type contracts under re/insurance liabilities. US GAAP discloses those contracts in policyholder account balances. As referred to in the table in the appendix, policyholder account balances for US GAAP are part of unit-linked and with-profit business for the comparison. US GAAP accounts for those under unit-linked and with profit liabilities.
Differences in valuation: In SST, re/insurance liabilities are valued using best estimates for both life and non-life business. US GAAP uses locked-in assumptions and makes allowance for possible adverse deviation for certain life business. Further differences arise from different treatment of discounting under the two frameworks. SST generally discounts all estimated cash flows based on current risk-free rates, whereas US GAAP does not discount non-life business and generally uses locked-in historical discount rates to discount life business liabilities.
Unit-linked and with-profit liabilitiesDifferences in scope: SST unit-linked and with-profit liabilities are compared with US GAAP policy-holder account balances which include generally universal life type contracts as well.
DebtDifferences in scope: SST shows all debt, including contingent capital instruments, as debt liability. US GAAP classifies certain contingent capital instruments as debt at amortised costs or as equity depending on the instruments’ characteristics.
Differences in valuation: SST excludes own credit risk in the valuation of debt not qualified as SST supplementary capital. SST supplementary capital instruments are fair valued. US GAAP generally values debt instruments at amortised costs.
Other liabilitiesDifferences in valuation: Deferred tax liabilities are not valued in SST, whereas under US GAAP they are part of other liabilities.
Liabilities
USD millions US GAAP SST Difference
Re/insurance liabilities before retrocession 117 023 95 558 ‒21 465Unit-linked and with-profit liabilities 5 192 2 139 ‒3 053Debt 11 737 14 925 3 188Funds held under reinsurance treaties 5 146 843 ‒4 303Other liabilities 16 266 8 882 ‒7 384Total liabilities 155 364 122 346 ‒33 018

20 Swiss Re Financial Condition Report 2020
Swiss Re Group
Capital management
For information on the Group’s capitalisation structure, please see the Financial strength and capital management section in the 2020 Financial Report on pages 54–59, Capital structure on pages 86–87 and Note 11 to the financial statements (Debt and contingent capital instruments) on pages 259–261.
For the Group Statement of shareholders’ equity, see pages 188–189 of the 2020 Financial Report.
For more details on > Valuation differences between shareholders’ equity and SST net asset value, please refer to the Group Valuation section of this Report.
Swiss Re Financial Condition Report 2020 21
Solvency
For information on the Group’s solvency information, risk-bearing capital, target capital and SST ratio, please see the Financial strength and capital management section on pages 54–56 of the 2020 Financial Report.
Swiss Re uses an internal risk model to determine the economic capital required to support the risks on the Group’s book, as well as to allocate risk-taking capacity to the different lines of business. The model also provides the basis for capital cost allocation in Swiss Re’s EVM framework, which is used for pricing, profitability evaluation and compensation decisions. In addition to these internal purposes, the model is used to determine regulatory capital requirements under economic solvency frameworks such as the SST and Solvency II.
For more information, please see the Internal control system and risk model section of the 2020 Financial Report.
In 2017, FINMA approved Swiss Re’s internal model and its components for SST reporting purposes under their revised model review process.
Since SST 2020, two major internal model changes have been implemented; both changes were approved by FINMA in October 2020:
Market value margin – To improve market consistency and more adequately reflect differences between interest rates of different currencies, two changes have been made: discounting in original currencies and using forward rates to discount to future years. These changes reduce the MVM and increase the Group’s SST ratio.
Lapse risk – The model has been further strengthened by including additional dependencies and correlations, as well as anti-selective lapses for lapse trend. These changes result in minor increases of lapse and mortality trend shortfall and have no material impact on the Group’s total risk or MVM.

22 Swiss Re Financial Condition Report 2020

Swiss Re Financial Condition Report 2020 23
Swiss Reinsurance Company Ltd
Management summary 24
Business activities 26
Performance 30
Governance and risk management 35
Risk profile 37
Valuation 39
Capital management 44
Solvency 45

24 Swiss Re Financial Condition Report 2020
Management summary
In SST 2021, the solvency of Swiss Reinsurance Company Ltd (SRZ) is 176%, 31pp lower than in SST 2020. The decrease is mainly driven by COVID-19-related claims and reserves, the significant decline in interest rates and higher financial market volatilities. These effects are partly offset by a positive investment and underwriting performance (excluding COVID-19) and higher supplementary capital.
The risk transfer programme to assume liabilities from Swiss Re Corporate Solutions Ltd (SRCS) as of 1 January 2021 also contributed to the decrease in the SST ratio. This programme is part of the planned streamlining of the legal entity structure announced in September 2020, which, when completed, is expected to increase the SST ratio of SRZ.
This Report provides qualitative and quantitative information about the financial condition of SRZ. This Report includes financial information already published in SRZ’s 2020 Annual Report, available on www.swissre.com/investors/financial-information.
SST 2021 in USD millions
SST RBC – MVM
29 855
SST TC – MVM
16 918
SST 2020 in USD millions
SST RBC – MVM
29 177
SST TC – MVM
14 041
SST RBC: SST risk-bearing capitalSST TC: SST target capital MVM: Market value margin
Solvency overview
Swiss Reinsurance Company Ltd
= 176%
= 208%

Swiss Re Financial Condition Report 2020 25
In this section, we provide information about the business model, the strategy and significant events. > Read more
We present the performance of the year under review based on the Swiss statutory income statement. > Read more
This section provides an overview of the system of governance, key governing bodies, risk management systems and policies. > Read more
The main components of the total risk calculated under SST are discussed in this section. > Read more
In this section, we provide the SST balance sheet and additional quantitative and qualitative explanations on differences to SRZ’s audited statutory financial statements. > Read more
SRZ’s capital management strategy and key changes in 2020 are discussed in this section. > Read more
This section presents SRZ’s SST calculation and includes explanation of changes relative to the prior year. > Read more
Business activities
Performance
Governance and risk management
Risk profile
Valuation
Capital management
Solvency

26 Swiss Re Financial Condition Report 2020
Business activities
SRZ’s vision is to “make the world more resilient”, a key component of which is to close the protection gap – the difference between insured and total economic losses. This vision is supported by the mission to create smarter solutions for the clients through new perspectives, knowledge and capital.
SRZ operates within the strategy set out by the Swiss Re Group. The goals are consistent with the overall Swiss Re Group financial targets and the strategy is informed by the components of the Swiss Re Group strategy.
SRZ seeks to become the leading player in the wholesale reinsurance industry based on a combination of the underwriting knowledge and experience, geographic and product diversification, and financial strength, as well as appropriate allocation of capital to risk portfolios, to meet the Swiss Re Group’s financial targets over the cycle.
In furtherance of strategic goals, SRZ will seek to focus on growth, through systematic capital allocation, as well as applying the risk knowledge to support capital allocation. As a global organisation with a wide product range and geographical reach, SRZ systematically allocates capital by balancing opportunities on a risk-adjusted basis to generate sustainable earnings and growth over the long-term. An annual top-down capital allocation underpins SRZ business planning process; throughout the year, SRZ actively steers its deployed capacity to maximise return. SRZ can change the capital allocated to particular risk pools as markets move and it develops new insights. This activity is rooted in the ability to take a forward-looking perspective on the economics of risk pools and allocate capital accordingly.
SRZ intends to continue to emphasise differentiation, continue to focus on high growth markets, broaden and diversify its client base to increase access to risk, enhance research and development efforts, continue to focus on technology and finally maintain leadership in sustainability.
Market environmentThe global premiums in non-life reinsurance grew by around 4% in real terms in 2020, with a moderate expansion and stable reinsurance demand in advanced markets and China. Other emerging markets suffered from a lower exposure growth in the primary market. In terms of COVID-19 claims and natural catastrophes, namely the hurricane landfalls, as well as upward revisions to loss estimates, pushed overall losses higher. While COVID-19 claims are still unfolding, the reinsurance industry will take a significant share of the estimated industry loss.
The underlying, catastrophe-adjusted underwriting result improved. This was partly due to better reinsurance prices, which gained momentum through 2020, after a more moderate January 2020 renewal season. There were rate increases in loss-affected lines and regions, but little spillover into unaffected lines. However, significant pricing improvements were registered in the retrocession market, which was adversely affected by high losses between 2017 and 2019 and a significant capacity crunch due to the withdrawal of capital suppliers.
OutlookFor the renewal rounds in 2021, SRZ expects a further increase of reinsurance price as a reflection of elevated losses from natural catastrophes since 2017 and from COVID-19 claims. Premium income of the reinsurance industry is expected to grow by 7% in 2021 and by 5% in 2022, mainly driven by higher prices.
SRZ has developed a clear strategy based on the contribution of its three main pillars (core, transactions and solutions). SRZ is applying an active portfolio mix shifting over the last 18 months in line with its Target Liability Portfolio and continues to focus on managing exposures. In terms of lines of business development, underwriting of new US casualty business has been adjusted to help achieve
Reinsurance strategy and priorities
Property & Casualty Reinsurance business
Swiss Reinsurance Company Ltd

Swiss Re Financial Condition Report 2020 27
significant profitability improvements. In Property and Casualty, SRZ incorporated learnings from recent natural catastrophe events to reinforce strong track record in this line of business. Furthermore, SRZ is targeting growth opportunities in Specialty.
Market environmentThe global life and health reinsurance premiums grew by 6% in 2020. This growth was mostly driven by the expansion in emerging medical expense markets, mainly in China and India, compared to a globally lower growth in mortality and health-related reinsurance. Against this background, life reinsurers have sought to increase revenues through large, individual risk transfer transactions that help primary insurers stabilise income and/or bolster their balance sheets. The introduction of risk-based capital regimes has prompted much of this activity. Another area of growth has been longevity risk transfer.
The contribution from investments declined further, due to the ongoing low interest rate environment, which was even accentuated by the further expansionary monetary policy. The underwriting performance was in turn negatively impacted by elevated mortality claims due to COVID-19.
OutlookThe continued recovery in primary insurance should support growth in life reinsurance revenues, including a recovery in traditional business. Premium growth will nonetheless likely remain moderate, especially in the large advanced markets. In real terms, SRZ forecasts global life reinsurance premiums will increase by around 2.5% in 2021 and 2022, while health reinsurance is expected to develop by around 6% annually. This will be mainly driven by the highly populated and growing economies in China and India.
SRZ is focused on underwriting to ensure it can compete in an evolving insurance landscape. Underwriting reflects both near-term COVID-19 considerations and longer-term trends. With this strategic positioning and broad range of opportunities in Life and Health, SRZ supports profitable new business growth and attractiveness and diversification of the in-force portfolio.
Strategy and prioritiesFinancial investments are managed in accordance with Swiss Re‘s Targeted Standard on Asset Management and SRZ’s investment guidelines, which are intended to ensure compliance with regulatory requirements. The general principle governing investment management in SRZ is the creation of economic value based on returns relative to the liability benchmark, while adhering to the investment guidelines and the general prudence principle. The liability benchmark is determined by approximating an investable benchmark from projected liability cash flows. A cash benchmark is used for the economic surplus.
OutlookThe global economy has seen a stronger-than-expected recovery after the pandemic-induced “sudden stop” in spring. However, the renewed COVID-19 waves in both the US and Europe, which occurred as the weather cooled, weighed on economic growth in the fourth quarter, resulting in a 2020 global real Gross Domestic Product (GDP) growth which will still be deeply negative.
Looking ahead, the global economy is expected to recover in 2021, although not all economies will reach pre-COVID-19 GDP levels this year. Inflationary pressure is expected to remain moderate even though base effects are likely to lead to a temporary increase in the very near term. In this environment, monetary policy is set to remain highly accommodative. Continued fiscal support is likely necessary to sustain the recovery.
Life & Health Reinsurance business
Investments
28 Swiss Re Financial Condition Report 2020
Swiss Reinsurance Company Ltd
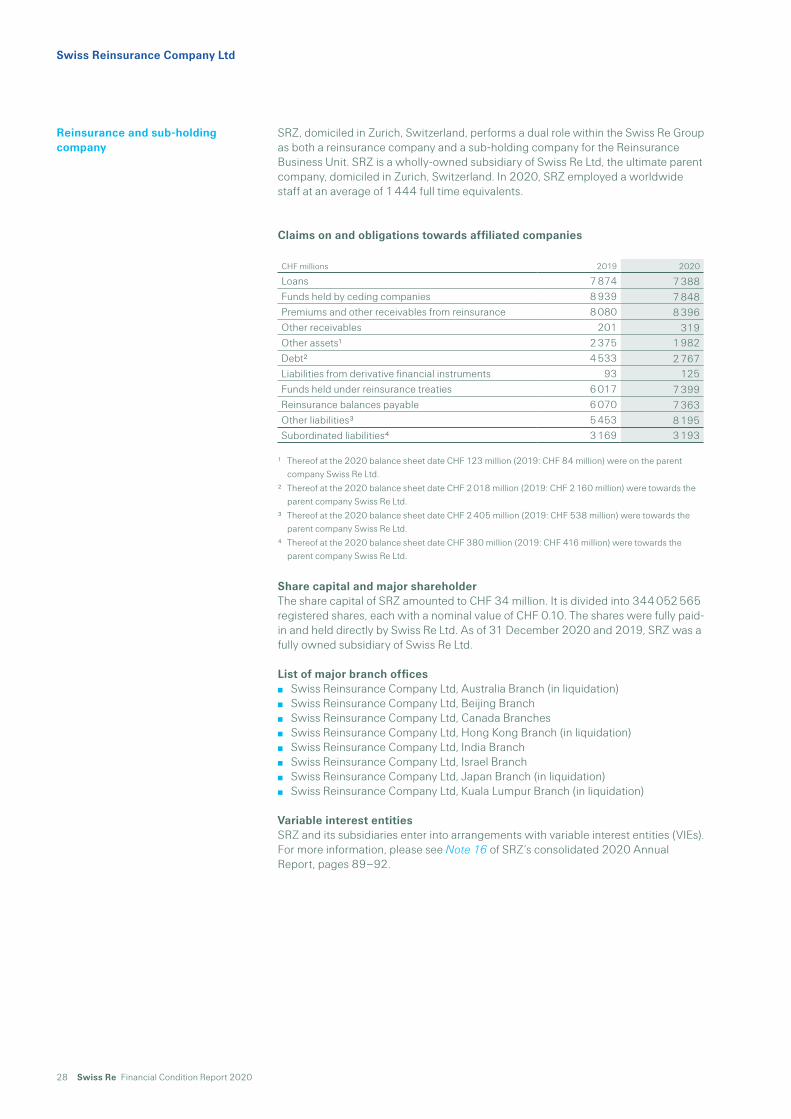
SRZ, domiciled in Zurich, Switzerland, performs a dual role within the Swiss Re Group as both a reinsurance company and a sub-holding company for the Reinsurance Business Unit. SRZ is a wholly-owned subsidiary of Swiss Re Ltd, the ultimate parent company, domiciled in Zurich, Switzerland. In 2020, SRZ employed a worldwide staff at an average of 1 444 full time equivalents.
Claims on and obligations towards affiliated companies
CHF millions 2019 2020
Loans 7 874 7 388Funds held by ceding companies 8 939 7 848Premiums and other receivables from reinsurance 8 080 8 396Other receivables 201 319Other assets1 2 375 1 982Debt2 4 533 2 767Liabilities from derivative financial instruments 93 125Funds held under reinsurance treaties 6 017 7 399Reinsurance balances payable 6 070 7 363Other liabilities3 5 453 8 195Subordinated liabilities4 3 169 3 193
1 Thereof at the 2020 balance sheet date CHF 123 million (2019: CHF 84 million) were on the parent company Swiss Re Ltd.
2 Thereof at the 2020 balance sheet date CHF 2 018 million (2019: CHF 2 160 million) were towards the parent company Swiss Re Ltd.
3 Thereof at the 2020 balance sheet date CHF 2 405 million (2019: CHF 538 million) were towards the parent company Swiss Re Ltd.
4 Thereof at the 2020 balance sheet date CHF 380 million (2019: CHF 416 million) were towards the parent company Swiss Re Ltd.
Share capital and major shareholderThe share capital of SRZ amounted to CHF 34 million. It is divided into 344 052 565 registered shares, each with a nominal value of CHF 0.10. The shares were fully paid-in and held directly by Swiss Re Ltd. As of 31 December 2020 and 2019, SRZ was a fully owned subsidiary of Swiss Re Ltd.
List of major branch offices Swiss Reinsurance Company Ltd, Australia Branch (in liquidation) Swiss Reinsurance Company Ltd, Beijing Branch Swiss Reinsurance Company Ltd, Canada Branches Swiss Reinsurance Company Ltd, Hong Kong Branch (in liquidation) Swiss Reinsurance Company Ltd, India Branch Swiss Reinsurance Company Ltd, Israel Branch Swiss Reinsurance Company Ltd, Japan Branch (in liquidation) Swiss Reinsurance Company Ltd, Kuala Lumpur Branch (in liquidation)
Variable interest entitiesSRZ and its subsidiaries enter into arrangements with variable interest entities (VIEs). For more information, please see Note 16 of SRZ’s consolidated 2020 Annual Report, pages 89‒92.
Reinsurance and sub-holding company

Swiss Re Financial Condition Report 2020 29
Financial Year 2020Swiss Statutory net income for 2020 amounted to CHF 1 586 million, driven by gains from various large intragroup transactions, partly offset by COVID-19 and large natural catastrophe losses. Life & Health Reinsurance result was further positively impacted by assumption updates.
COVID-19 losses in property and casualty business amounted to CHF 1 403 million, largely due to the business interruptions and event cancellation losses. COVID-19 losses in life and health business amounted to CHF 377 million, mainly driven by additional adverse mortality experience. Excluding these COVID-19 related claims and changes in reserves for the year, income before income tax expense for 2020 was CHF 3 401 million.
The investment result benefitted from the distribution of retained income from investment funds of CHF 626 million.
In order to further align the legal entity structure with the management view in Asia, SRZ sold the assets and liabilities of its Australia, Hong Kong, Japan and Malaysia branches to Swiss Re Asia Pte. Ltd. With this sale SRZ transferred the related rights and obligations as well as the employees of the branches. Following the transfers, the intragroup retrocession agreements were restructured, including the inception of a life and health intragroup retrocession agreement with Swiss Re Asia Pte. Ltd, Hong Kong branch. Additionally, SRZ novated the non-disability income business assumed from Swiss Re Life & Health Australia Limited to Swiss Re Asia Pte. Ltd.
SRZ retroceded a share of its global life and health portfolio to Swiss Re Nexus Reinsurance Company Ltd (SRN), formerly Swiss Re Life Capital Reinsurance Ltd, a new indirect subsidiary of SRZ after its purchase by Swiss Re Reinsurance Holding Company Ltd. Further, the retrocession agreement for the Canada life and health business was recaptured by SRN.
The aforementioned large intercompany transactions impacted both SRZ’s income statement and balance sheet, resulting in a net income of CHF 3 063 million, and were accompanied by capital contributions from SRZ to subsidiaries of Swiss Re Reinsurance Holding Company Ltd of CHF 6 783 million.
In addition, the financial year 2020 was characterised by significant foreign exchange impacts, affecting both SRZ’s income statement and balance sheet, mainly as a result of the weakening of the US dollar against the Swiss franc.
OutlookIn order to further streamline the legal entity structure and to optimise the capital efficiency as well as Swiss Re Group and Business Units funding options, Swiss Re Group intends to reorganise the legal entity structure of its Corporate Solutions Business Unit. In this context, SRCS will upon receipt of required approvals transfer the rights and obligations of all its assets and liabilities as well as its employees to SRZ in the form of a merger, with an accounting effective date 1 January 2021. SRZ would in turn have separate holding companies for the Business Units of Reinsurance and Corporate Solutions. With this reorganisation SRZ will become the sole direct wholly-owned operating subsidiary of Swiss Re Ltd in 2021.
Further, Swiss Re Life Capital Ltd will transfer the rights and obligations of all its assets and liabilities to SRZ in the form of a merger, with an accounting effective date 1 January 2021.
In 2020 PricewaterhouseCoopers Ltd was the auditor of SRZ. For more information, please see the Report of the statutory auditor in SRZ’s 2020 Annual Report, pages 123‒127.
Significant events
Report of the statutory auditor

30 Swiss Re Financial Condition Report 2020 Swiss Re Financial Condition Report 2020 31
Swiss Reinsurance Company Ltd
Performance
Income statement – Swiss statutory
Total Life Accident & Health Motor Marine, aviation, transport Property Casualty Miscellaneous
CHF millions 2019 2020 2019 2020 2019 2020 2019 2020 2019 2020 2019 2020 2019 2020 2019 2020
Premiums written gross 27 666 23 953 5 447 4 789 3 334 3 434 3 993 2 696 834 858 7 095 6 626 4 925 3 999 2 038 1 551Premiums written retroceded ‒4 823 ‒3 104 ‒803 ‒984 –652 ‒957 ‒537 ‒308 ‒187 ‒81 ‒2 287 ‒617 ‒267 ‒73 ‒90 ‒84Premiums written net 22 843 20 849 4 644 3 805 2 682 2 476 3 456 2 389 647 776 4 808 6 009 4 658 3 926 1 948 1 468Change in unearned premiums gross ‒2 075 664 ‒6 ‒2 –35 30 ‒381 270 ‒54 ‒101 ‒260 530 ‒934 ‒19 ‒405 ‒44Change in unearned premiums retroceded 104 ‒1 027 5 26 ‒9 ‒99 16 ‒36 43 ‒822 48 ‒66 ‒20 ‒9Premiums earned 20 872 20 486 4 638 3 808 2 673 2 507 3 066 2 560 609 639 4 591 5 717 3 772 3 840 1 523 1 415Other reinsurance revenues 2 446 3 946 709 2 709 701 1198 21 15 5 19 ‒80 965 73 31 26Total revenues from reinsurance business 23318 24 432 5 347 6 516 3 374 3 705 3 087 2 575 609 645 4 610 5 636 4 737 3 914 1 554 1 441Claims paid and claim adjustment expenses gross ‒11 782 ‒18 179 ‒328 ‒3 632 –1 642 ‒2 594 ‒1 669 ‒2 197 ‒644 ‒508 ‒5 666 ‒5 982 ‒1 236 ‒2 346 ‒597 ‒920Claims paid and claim adjustment expenses retroceded 3 966 2 357 821 ‒686 –185 ‒469 388 266 127 130 2 607 2 925 119 124 89 67Change in unpaid claims and life and health benefits gross ‒9 643 ‒1 031 ‒4 325 ‒472 –935 201 ‒614 294 ‒6 9 ‒864 610 ‒2 646 ‒1 716 ‒253 43Change in unpaid claims and life and health benefits retroceded 980 108 2 1366 547 1 103 ‒119 ‒62 ‒25 ‒49 591 ‒2 138 ‒130 ‒16 18Change in unpaid claims for unit-linked life insuranceClaims incurred ‒16 479 ‒16 745 ‒3 830 ‒3 425 –2 215 ‒1 758 ‒2 014 ‒1 699 ‒548 ‒418 ‒3 332 ‒4 584 ‒3 763 ‒4 069 ‒777 ‒792Acquisition and operating costs gross ‒7 251 ‒6 638 ‒1 203 ‒903 –944 ‒1 021 ‒1 374 ‒1 072 ‒195 ‒188 ‒1 673 ‒1 657 ‒1 297 ‒1 245 ‒565 ‒552Acquisition and operating costs retroceded 1 151 964 70 112 226 239 280 210 52 32 400 287 86 47 37 37Acquisition and operating costs net ‒6 100 ‒5 674 ‒1 133 ‒791 –718 ‒782 ‒1 094 ‒862 ‒143 ‒155 ‒1 273 ‒1 370 ‒1 211 ‒1 199 ‒528 ‒515Other reinsurance expenses ‒2 055 ‒865 ‒1 010 ‒487 –139 ‒371 1 ‒1 ‒23 ‒884 ‒5 ‒1Total expenses from reinsurance business ‒24 634 ‒23 284 ‒5 973 ‒4 703 –3 072 ‒2 910 ‒3 107 ‒2 561 ‒691 ‒573 ‒4 628 ‒5 956 ‒5 858 ‒5 273 ‒1 305 ‒1 308Investment income 5 660 2051Investment expenses ‒270 ‒322Investment result 5 390 1 729 0 0 0 0 0 0 0 0 0 0 0 0 0 0Investment result from unit-linked life insuranceOther financial income 1 580 3 217Other financial expenses ‒2 063 ‒3 778Operating result 3 591 2 316 0 0 0 0 0 0 0 0 0 0 0 0 0 0Interest expenses on debt and subordinated liabilities ‒419 ‒324Other income 20 158Other expenses ‒390 ‒529Extraordinary income and expensesIncome before income tax expense 2 802 1 621 0 0 0 0 0 0 0 0 0 0 0 0 0 0Income tax expense ‒98 ‒35Net income 2 704 1 586 0 0 0 0 0 0 0 0 0 0 0 0 0 0

32 Swiss Re Financial Condition Report 2020
Swiss Reinsurance Company Ltd
Total revenues and expenses from reinsurance amounted to a gain of CHF 1 148 million in 2020, compared to a loss of CHF 1 316 million in 2019. Excluding the COVID-19- related claims and changes in reserves for the year of CHF 1 780 million, SRZ’s reinsurance result amounted to a gain of CHF 3 354 million in 2020.
Life & Health Reinsurance result increased from a loss of CHF 324 million in 2019 to a gain of CHF 2 608 million in 2020, mostly driven by one-off gains from the intragroup retrocession restructuring with Swiss Re Asia Pte. Ltd and SRN as well as the Asian branch transfers to Swiss Re Asia Pte. Ltd and a subsequent intragroup retrocession agreement with Swiss Re Asia Pte. Ltd, Hong Kong branch. Property & Casualty Reinsurance result decreased from a loss of CHF 992 million in 2019 to a loss of CHF 1 460 million in 2020. This was largely due to the COVID-19 losses, especially in Europe and mainly in property and liability lines of business, due to the business interruptions and event cancellation losses, as well as losses from the Beirut explosion. Despite large losses from hurricanes in the US and hailstorms and flooding in Australia, SRZ was exposed to less natural catastrophe losses, compared to the prior year, and benefitted from positive prior year loss experience in 2020.
Premiums earned decreased from CHF 20 872 million in 2019 to CHF 20 486 million in 2020. Both property and casualty as well as life and health business were impacted by the intragroup retrocession restructuring following the Asian branch transfers to Swiss Re Asia Pte. Ltd. Premiums earned for the life and health business were further negatively impacted by foreign exchange impacts and the newly incepted intragroup agreement, to retrocede a share of SRZ’s global life and health portfolio to SRN. These movements were partly offset by the business volume increase and the new intragroup retrocession agreement with Swiss Re Asia Pte. Ltd, Hong Kong branch. The volume increase in the property and casualty business was mainly driven by retrocession agreements with affiliated companies in the US and Swiss Re Europe S.A. (property) as well as the casualty business in Europe. This was partly offset by the business volume decrease in Americas (motor) and higher external retrocession premiums (property).
Other reinsurance revenues increased from CHF 2 446 million in 2019 to CHF 3 946 million in 2020, mainly in life and health business, due to one-off gains from the novation of the non-disability income business assumed from Swiss Re Life & Health Australia Limited to Swiss Re Asia Pte. Ltd, the Asian branch transfers to Swiss Re Asia Pte. Ltd as well as the inception of a new intragroup retrocession agreement with SRN. This was partly offset by one-off gains in 2019 from the inception of an external life and health retrocession agreement in Asia and the property and casualty business, mostly driven by the restructuring of several intragroup retrocession agreements with affiliated companies in the US, incepted in 2019 (casualty).
Claims incurred increased from CHF 16 479 million in 2019 to CHF 16 745 million in 2020, mostly reflecting the COVID-19 and large natural catastrophe losses in 2020 (property). The comparison of the individual claims line items is affected by the Asian branch transfers to Swiss Re Asia Pte. Ltd, the restructuring of several intragroup retrocession agreements as well as the various large life and health transactions, creating substantial changes year-over-year. In aggregate, these various movements fully offset each other.
Property and casualty claims paid and claim adjustment expenses net increased from CHF 6 482 million in 2019 to CHF 8 441 million in 2020, mainly reflecting the restructuring of several intragroup retrocession agreements with affiliated companies in the US in the prior year with an offset in change in unpaid claims net (casualty). Property and casualty change in unpaid claims net decreased from CHF 3 952 million in 2019 to CHF 3 121 million in 2020, additionally due to significant reserve releases in Japan, mostly related to the typhoons Jebi, Hagibis and Trami, and the positive impact from a recapture of a non-proportional treaty with Swiss Re Asia Pte. Ltd, due to prior year losses (property). This was offset by the COVID-19 losses, the large natural catastrophe losses in the US and the significant man-made losses such as Beirut explosion (property).
Reinsurance result

Swiss Re Financial Condition Report 2020 33
Life and health claims paid and claim adjustment expenses net and change in unpaid claims net increased from CHF 2 910 million in 2019 to CHF 6 398 million in 2020, primarily impacted by the intragroup retrocession restructuring with SRN in 2020 as well as the intragroup retrocession restructuring with Swiss Re Life & Health America Inc. in the prior year. These restructurings were fully offset in life and health benefits net.
Life and health benefits net increased from a loss of CHF 3 136 million in 2019 to a gain of CHF 1 215 million in 2020, mainly driven by the intragroup retrocession restructuring with SRN in 2020 as well as the intragroup retrocession restructuring with Swiss Re Life & Health America Inc. in the prior year. These restructurings were fully offset in life and health claims paid and claim adjustment expenses net and change in unpaid claims net. Furthermore, the reserve decreased due to assumption updates, partly offset by interest rate movements.
Acquisition and operating costs net decreased from CHF 6 100 million in 2019 to CHF 5 674 million in 2020, mostly in life and health business, due to an accounting methodology change in Asia as well as from the business retroceded by Swiss Re Europe S.A. and one-off gains in 2019 from the inception of an external life and health retrocession agreement in Asia.
Other reinsurance expenses decreased from CHF 2 055 million in 2019 to CHF 865 million in 2020, mainly impacted by the restructuring of several intragroup retrocession agreements with affiliated companies in the US, incepted in 2019 (casualty), partly offset by one-off losses from the newly incepted intragroup retrocession agreement with Swiss Re Asia Pte. Ltd, Hong Kong branch in the life and health business.
Investment income and expenses net result decreased from CHF 5 390 million in 2019 to CHF 1 729 million in 2020. The decrease was mainly driven by the lower dividend income from subsidiaries and affiliated companies of CHF 79 million, compared to the prior year of CHF 2 657 million, mostly related to the dividend from Swiss Re Reinsurance Holding Company Ltd of CHF 2 615 million. In addition, the distribution of retained income from investment funds decreased from CHF 1 474 million in 2019 to CHF 626 million in 2020.
Investment result

34 Swiss Re Financial Condition Report 2020
Swiss Reinsurance Company Ltd
Investment result
CHF millions Income Value readjustments Realised gains 2020 Total
Investment incomeInvestments in subsidiaries and affiliated companies 79 79Fixed income securities 505 369 874Loans 201 3 204MortgagesEquity securities 20 7 103 130 Shares in investment funds 626 8 19 653 Short-term investments 12 6 18 Alternative investments 59 1 8 68Other investments 697 9 33 739Income from investment services 25 25Investment income 1 527 16 508 2 051
CHF millions Expenses Value adjustments Realised losses 2020 Total
Investment expensesInvestments in subsidiaries and affiliated companies –16 –16Fixed income securities –61 –61LoansEquity securities –31 –92 –123 Shares in investment funds Short-term investments –1 –1 Alternative investments –31 –31Other investments 0 –31 –1 –32Investment management expenses –90 –90Investment expenses –90 –78 –154 –322
Investment result 1 729
CHF millions Income Value readjustments Realised gains 2019 Total
Investment incomeInvestments in subsidiaries and affiliated companies 2 657 2 657Fixed income securities 568 211 779Loans 303 303Mortgages 3 3Equity securities 30 32 118 180 Shares in investment funds 1 524 12 25 1 561 Short-term investments 51 1 52 Alternative investments 41 6 18 65Other investments 1 616 18 44 1 678Income from investment services 60 60Investment income 5 234 53 373 5 660
CHF millions Expenses Value adjustments Realised losses 2019 Total
Investment expensesInvestments in subsidiaries and affiliated companies –83 –83Fixed income securities –34 –34MortgagesEquity securities –16 –4 –20 Shares in investment funds –9 –1 –10 Short-term investments –1 –1 Alternative investments –14 –14Other investments 0 –23 –2 –25Investment management expenses –108 –108Investment expenses –108 –122 –40 –270
Investment result 5 390
Swiss Re Financial Condition Report 2020 35
Governance and risk management
Board of Directors Walter B. Kielholz, Chairman Renato Fassbind, Vice Chairman Raymond K. F. Ch’ien, Member of the Board of Directors Sergio P. Ermotti, Member of the Board of Directors Karen Gavan, Member of the Board of Directors Joachim Oechslin, Member of the Board of Directors Deanna Ong, Member of the Board of Directors Jay Ralph, Member of the Board of Directors Joerg Reinhardt, Member of the Board of Directors Philip K. Ryan, Member of the Board of Directors Sir Paul Tucker, Member of the Board of Directors Jacques de Vaucleroy, Member of the Board of Directors Susan L. Wagner, Member of the Board of Directors Larry Zimpleman, Member of the Board of Directors
Changes in 2020 Sergio P. Ermotti, Joachim Oechslin and Deanna Ong have been elected as new
members of the Board of Directors as of 25 March 2020 Trevor Manuel and Eileen Rominger stepped down as members of the Board of
Directors as of 25 March 2020
Executive Management Moses Ojeisekhoba, Chief Executive Officer Urs Baertschi, Member of the Executive Committee Claudia Cordioli, Chief Financial Officer, Member of the Executive Committee Russell Higginbotham, Member of the Executive Committee Jonathan Isherwood, Member of the Executive Committee Gianfranco Lot, Member of the Executive Committee Mike Mitchell, Member of the Executive Committee Paul Murray, Member of the Executive Committee Nicola Parton, Member of the Executive Committee Jason Richards, Member of the Executive Committee James Shepherd, Member of the Executive Committee Torben Thomsen, Chief Risk Officer, Member of the Executive Committee Robert Wiest, Member of the Executive Committee Philip Long, Appointed Actuary, not Member of the Executive Committee
Changes in 2020 Torben Thomsen, Chief Risk Officer, has been appointed as member of the
Executive Committee as of 1 January 2020 (this position is new in the Executive Committee)
Claudia Cordioli, Chief Financial Officer, has been appointed as member of the Executive Committee as of 1 February 2020
Gerhard Lohmann, formerly Chief Financial Officer, stepped down as member of the Executive Committee as of 1 February 2020
Jonathan Isherwood, CEO Americas (formerly Head Globals), has changed his function as of 1 April 2020. He was already a member of the Executive Committee
Gianfranco Lot, Head Globals, has been appointed as member of the Executive Committee as of 1 April 2020
John Eric Smith, formerly CEO Americas, stepped down as a member of the Executive Committee as of 1 April 2020
Board of Directors and Executive Management
36 Swiss Re Financial Condition Report 2020
Swiss Reinsurance Company Ltd
As a Business Unit top-level entity, SRZ is subject to enhanced governance requirements, which apply to all “Level I” classified legal entities, which includes the following requirements:
Develop and maintain corporate and risk governance documentation that governs the responsibilities of the legal entity Board, committees and management
Establish committee(s) covering Audit, as well as Finance and Risk, to support the legal entity Board in performing its oversight responsibility for risk and capital steering
Designate a Chief Risk Officer and Chief Financial Officer
All risk-related activities of SRZ and its subsidiaries are subject to Swiss Re’s risk management framework, which includes:
An independent Risk Management function responsible for risk oversight and control across Swiss Re and comprises dedicated risk teams for legal entities and regions, as well as central teams that provide specialised risk expertise and oversight.
A clearly defined risk control framework which comprises a body of standards that establish an internal control system for taking and managing risk.
Moreover, risk management activities at SRZ are complemented by Swiss Re’s Group Internal Audit and Compliance units.
Swiss Re’s 2020 Financial Report describes the governance and risk management structure as it applies to SRZ. For more information, please refer to the > Group governance and risk management section.
Governance and risk management

Swiss Re Financial Condition Report 2020 37
Risk profile
SRZ is exposed to insurance and financial risks that are calculated in its internal risk model, as well as other risks that are not explicitly part of the economic capital requirement but are actively monitored and controlled due to their significance for the entity. These include operational, liquidity, model, valuation, regulatory, political, strategic and sustainability risks (see Swiss Re s risk landscape, 2020 Financial Report, page 68).
Property and casualty (P&C) risk is mainly driven by natural catastrophe, non-life claims inflation, costing and reserving as well as man-made risk. The main drivers of life and health insurance risk are mortality trend and lethal pandemic risk.
The financial risk of SRZ derives from both financial market and credit risk. Key drivers of financial market risk are credit spread risk and equity risk. Credit risk is mainly driven by credit and surety and default risk of capital market products.
Total risk is based on 99% tail value at risk (tail VaR) and represents the average unexpected loss that occurs with a frequency of less than once in 100 years over a one-year time horizon.
USD millions SST 2020 SST 2021Change since
SST 2020
Property and casualty 10 692 12 635 1 944Life and health 9 712 11 809 2 097Financial market 7 485 9 154 1 669Credit1 2 331 2 901 570Diversification –12 864 ‒15 530 ‒2 666Total risk 17 355 20 969 3 614
1 Credit comprises credit default and migration risk from both asset management and underwriting. It excludes credit spread risk, which is part of financial market risk.
Total risk increases to USD 21.0 billion due to higher risk across all risk categories driven by exposure increase as well by the impact of lower interest rates, market volatility and appreciation of main currencies against the US dollar. The increase in property and casualty risk is mainly driven by higher non-life
claims inflation risk reflecting the heightened probability of extreme inflation outcomes, as well as an increase in costing and reserving risk mainly due to COVID-19-related reserves. P&C risk also increases due to new risk transfer agreements between SRCS and SRZ.
Higher life and health risk reflects the impact of lower interest rates and the appreciation of main currencies against the US dollar. The increase is also driven by business growth in Asia and the US, resulting in higher exposure to lethal pandemic, mortality trend and critical illness risk, further supported by business transfer from SRN.
The increase in financial market risk is mainly driven by higher equity exposures, higher market volatilities and appreciation of main currencies against the US dollar.
The increase in credit risk is mainly due to credit & surety risk which is assumed from SRCS under the new risk transfer agreements.
Swiss Re’s internal model takes account of the accumulation and diversification between individual risks. The effect of diversification at the category level, which is shown in the table above, represents the difference between total risk (the company’s 99% tail VaR) and the sum of standalone tail VaR amounts for the individual risk categories. This amount does not reflect diversification within risk categories. The extent of diversification is largely determined by the selected level of aggregation – the higher the aggregation level, the lower the diversification effect.
Total risk
38 Swiss Re Financial Condition Report 2020
Swiss Reinsurance Company Ltd
SRZ uses a Group-wide risk matrix methodology and Swiss Re’s Global Risk Register to capture operational risks. The matrix in particular focuses on risks approaching or exceeding SRZ’s own risk tolerance as they require management actions. Adherence to risk tolerance is monitored and reported at least on a quarterly basis. The overall control environment within SRZ remains adequate.
Key focus areas of SRZ’s operational risk management include capturing insights and experience from the COVID-19 pandemic, and reflecting these in underwriting processes and controls.
For details on other significant risks, including liquidity, model, valuation, regulatory, political, strategic and sustainability risks, see the Group’s 2020 Financial Report sections on Liquidity management on page 60, Swiss Re s risk landscape on pages 68–69, and Management of other significant risks on pages 74–77.
Among tested financial market sensitivities, the SRZ’s SST ratio is most sensitive to a 50-basis point decrease in interest rates.
SRZ manages and controls its risks through an extended limit framework. Insurance risks are also mitigated through retrocession, insurance risk swaps or transferring risk to capital markets. For financial risks, SRZ uses financial market derivative instruments as well as financial market securities to hedge financial market and credit risk arising from investments and insurance liabilities.
Operational risk
Other significant risks
Risk concentration
Risk mitigation

Swiss Re Financial Condition Report 2020 39
Valuation
The SST balance sheet is prepared based on the same market-consistent valuation principles as applied in Swiss Re’s internal EVM framework. EVM is therefore used as a basis for preparing the SST balance sheet and valuation adjustments to EVM mainly affect capital costs and deferred taxes. The difference between assets and liabilities is defined as the SST net asset value, which is the basis for the calculation of the SST RBC.
The SST valuation methodology is further described in the > Appendix of this Report.
SST balance sheet
USD millions Notes SST 2020 SST 2021Change since
SST 2020
Market-consistent value of investments
Real estate n/aParticipations 1 19 686 26 930 7 244Fixed-income securities 2 21 483 21 346 –137Loans 10 136 10 663 527Mortgages 2 –1Equities 1 270 1 249 –21Other investments 17 168 23 965 6 796 Collective investment schemes 3 13 526 15 481 1 954 Alternative investments 910 741 –169 Structured products n/a Other investments 4 2 732 7 744 5 011Total investments 69 745 84 154 14 409
Market-consistent value of other assets
Financial investments from unit-linked life insurance n/aReceivables from derivative financial instruments 213 304 90Deposits made under assumed reinsurance contracts 5 18 541 24 815 6 274Cash and cash equivalents 2 774 2 551 –223Reinsurers‘ share of best estimate of provisions for insurance liabilities
9 459 12 967 3 507
Direct insurance: life insurance business (excluding unit-linked life insurance)
n/a
Reinsurance: life insurance business (excluding unit-linked life insurance)
6 3 173 9 359 6 185
Direct insurance: non-life insurance business n/a Direct insurance: health insurance business n/a Reinsurance: non-life insurance business 7 6 286 3 608 –2 678 Reinsurance: health insurance business n/a Direct insurance: other business n/a Reinsurance: other business n/a Direct insurance: unit-linked life insurance business n/a Reinsurance: unit-linked life insurance business n/aFixed assets 3 2 0Deferred acquisition costs n/aIntangible assets n/aReceivables from insurance business 13 640 13 535 –105Other receivables 508 532 25Other assets 8 5 027 6 855 1 829Unpaid share capital n/aAccrued assets 93 89 –4Total other assets 50 257 61 650 11 393
Total market-consistent value of assets 120 001 145 804 25 802

40 Swiss Re Financial Condition Report 2020
Swiss Reinsurance Company Ltd
Notes1. The increase in participations reflects the restructuring of SRN that became an indirect subsidiary of SRZ as well as the Asian branch
transfers to Swiss Re Asia Pte. Ltd. Furthermore, the increase is driven by the capital contribution in-kind from Swiss Re Ltd to support principal investment activities in Asia. This is partly offset by an increase in MVM of subsidiaries.
2. The decrease in fixed income securities is mainly driven by the impact of the transfers of the Asian branches to Swiss Re Asia Pte. Ltd and the transfers of assets to SRN related to the intra-group retrocession restructuring and the capital contributions, as well as a reallocation to short-term investments. This is largely offset by transfers from Swiss Re Life and Health America Inc. and from Swiss Re Asia Pte. Ltd as well as favourable market conditions.
3. The increase in collective investment schemes mainly reflects the favourable impact of declining interest rates and the appreciation of the underlying currencies against the US dollar as reporting currency.
4. The increase in other investments reflects the increases in short-term investments, mainly due to reallocation between investments categories towards short-term as well as settlements from large transactions.
5. The increase in deposits made under assumed reinsurance contracts is reflecting a reporting methodology change of US closed book business (offset in best estimate of provisions for life insurance liabilities, see Note 9). Furthermore, the increase is driven by the intra-group retrocession from Swiss Re Life and Health America Inc reflecting an update in market valuation and a new large transaction as well as higher volumes in the intra-group business from US property and specialty business. Additionally, the increase reflects a reclassification related to the intra-group retrocession from SRCS (offset in in the best estimate of provisions for non-life insurance liabilities, see Note 10). This is partly offset by the recapture of the Canada L&H business by SRN.
6. The increase in reinsurance life insurance business (excluding unit-linked life insurance) is mainly related to the existing intra-group retrocession to SRN following a reporting methodology change in the US closed book business. The new intra-group retrocession towards SRN further contributes to the observed increase.
7. The decrease in reinsurance non-life insurance business mainly relates to the termination of the intra-group retrocessions from the Asian branches towards Swiss Re Asia Pte. Ltd following their transfers to Swiss Re Asia Pte. Ltd.
8. The increase in other assets is mainly driven by the increase in securities lending.9. The increase in the best estimate of provisions for life insurance liabilities mainly reflects a reporting methodology change of US closed
book business (offset in deposits made under assumed reinsurance contracts, see Note 5). New large in-force transactions in Japan and a large intra-group retrocession from Swiss Re Life and Health America Inc. also contribute to the higher provisions. The increase is further driven by the shift of the Asian branches to Swiss Re Asia Pte. Ltd, the novation of the Australia non-disability income business to Swiss Re Asia Pte. Ltd, and the recapture of the Canada L&H business by SRN. Additionally, this is impacted by reserve increases due to COVID-19.
10. The increase in the best estimate of provisions for non-life insurance liabilities is mainly driven by business growth in the US as well as by COVID-19 losses. This is further driven by a new intra-group retrocession from SRCS and by a reclassification related to existing intra-group retrocession from SRCS (offset in deposits made under assumed reinsurance contracts, see Note 5). This is partly offset by the transfers of the Asian branches to Swiss Re Asia Pte. Ltd.
USD millions Notes SST 2020 SST 2021Change since
SST 2020
BEL: Best estimate of liabilities (including unit-linked life insurance)
Best estimate of provisions for insurance liabilities 57 467 72 184 14 717 Direct insurance: life insurance business (excluding unit-linked life
insurance) n/a
Reinsurance: life insurance business (excluding unit-linked life insurance)
9 13 321 23 921 10 601
Direct insurance: non-life insurance business n/a Direct insurance: health insurance business n/a Reinsurance: non-life insurance business 10 44 146 48 263 4 116 Reinsurance: health insurance business n/a Direct insurance: other business n/a Reinsurance: other business n/aBest estimate of provisions for unit-linked life insurance liabilities 0 0 0 Direct insurance: unit-linked life insurance business n/a Reinsurance: unit-linked life insurance business n/a
Market-consistent value of other liabilities
Non-technical provisions 1 015 1 132 117Interest-bearing liabilities 11 5 258 3 751 –1 507Liabilities from derivative financial instruments 407 574 167Deposits retained on ceded reinsurance 12 6 365 13 405 7 041Liabilities from insurance business 13 4 672 5 929 1 257Other liabilities 14 7 252 11 744 4 493Accrued liabilities 57 49 –8Subordinated debts 15 5 760 6 714 954
Total BEL plus market-consistent value of other liabilities 88 253 115 483 27 230Market-consistent value of assets minus total from BEL 31 749 30 321 –1 428
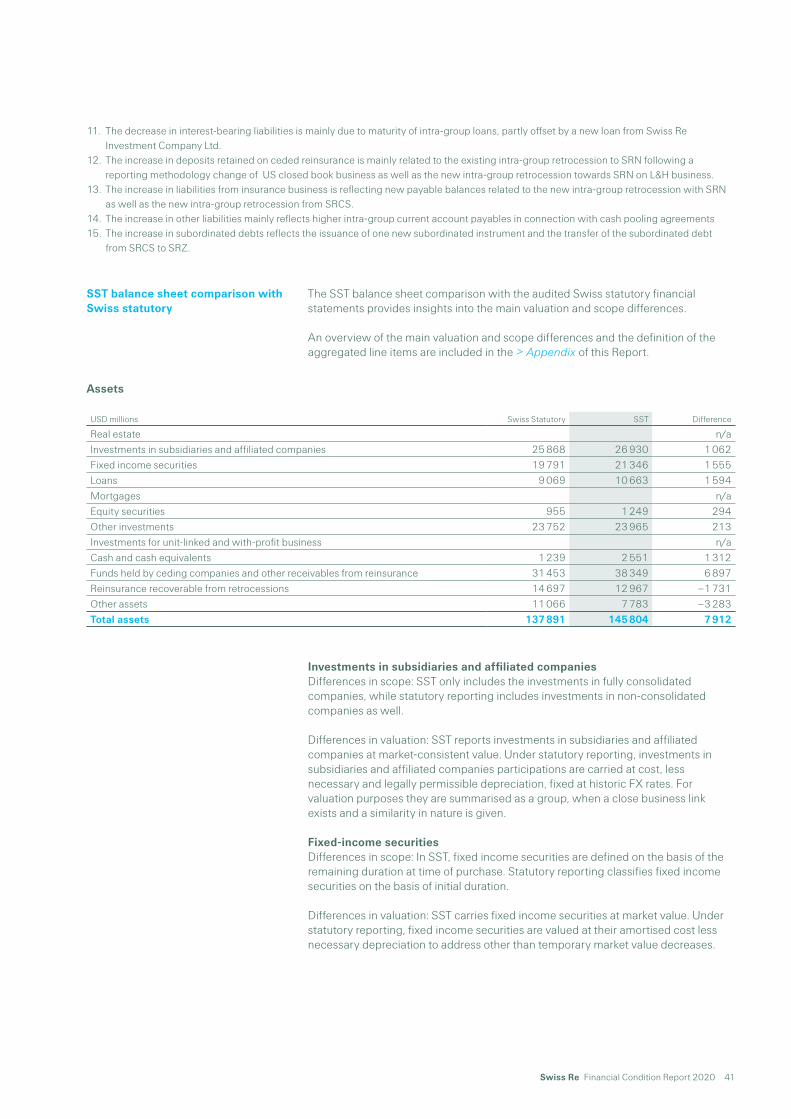
Swiss Re Financial Condition Report 2020 41
11. The decrease in interest-bearing liabilities is mainly due to maturity of intra-group loans, partly offset by a new loan from Swiss Re Investment Company Ltd.
12. The increase in deposits retained on ceded reinsurance is mainly related to the existing intra-group retrocession to SRN following a reporting methodology change of US closed book business as well as the new intra-group retrocession towards SRN on L&H business.
13. The increase in liabilities from insurance business is reflecting new payable balances related to the new intra-group retrocession with SRN as well as the new intra-group retrocession from SRCS.
14. The increase in other liabilities mainly reflects higher intra-group current account payables in connection with cash pooling agreements 15. The increase in subordinated debts reflects the issuance of one new subordinated instrument and the transfer of the subordinated debt
from SRCS to SRZ.
The SST balance sheet comparison with the audited Swiss statutory financial statements provides insights into the main valuation and scope differences.
An overview of the main valuation and scope differences and the definition of the aggregated line items are included in the > Appendix of this Report.
Investments in subsidiaries and affiliated companiesDifferences in scope: SST only includes the investments in fully consolidated companies, while statutory reporting includes investments in non-consolidated companies as well.
Differences in valuation: SST reports investments in subsidiaries and affiliated companies at market-consistent value. Under statutory reporting, investments in subsidiaries and affiliated companies participations are carried at cost, less necessary and legally permissible depreciation, fixed at historic FX rates. For valuation purposes they are summarised as a group, when a close business link exists and a similarity in nature is given.
Fixed-income securitiesDifferences in scope: In SST, fixed income securities are defined on the basis of the remaining duration at time of purchase. Statutory reporting classifies fixed income securities on the basis of initial duration.
Differences in valuation: SST carries fixed income securities at market value. Under statutory reporting, fixed income securities are valued at their amortised cost less necessary depreciation to address other than temporary market value decreases.
SST balance sheet comparison with Swiss statutory
Assets
USD millions Swiss Statutory SST Difference
Real estate n/aInvestments in subsidiaries and affiliated companies 25 868 26 930 1 062Fixed income securities 19 791 21 346 1 555Loans 9 069 10 663 1 594Mortgages n/aEquity securities 955 1 249 294Other investments 23 752 23 965 213Investments for unit-linked and with-profit business n/aCash and cash equivalents 1 239 2 551 1 312Funds held by ceding companies and other receivables from reinsurance 31 453 38 349 6 897Reinsurance recoverable from retrocessions 14 697 12 967 ‒1 731Other assets 11 066 7 783 ‒3 283Total assets 137 891 145 804 7 912

42 Swiss Re Financial Condition Report 2020
Swiss Reinsurance Company Ltd
LoansDifferences in valuation: In SST, policy loans and intra-group loans are valued by discounting future estimated cash flows at risk-free rates, while under statutory reporting those loans are carried at nominal value. Value adjustments are recorded where the expected recovery value is lower than the nominal value. Infrastructure loans are carried at their amortised cost less necessary depreciation to address other than temporary market value decreases.
Equity securitiesDifferences in scope: In SST, Swiss Re Ltd shares are not valued, whereas they are part of equity securities for statutory reporting.
Differences in valuation: SST values equity securities at market value. Under statutory reporting, equity securities are carried at the lower of cost or market value.
Other investments
Differences in scope: In SST, short-term investments are defined on the basis of the remaining duration at time of purchase. Statutory reporting classifies short-term investments on the basis of initial duration. In SST, other investments include non-consolidated investments in subsidiaries and affiliated companies, while in statutory reporting these are reported as investments in subsidiaries and affiliated companies.
Differences in valuation: SST reports other investments such as investment funds, private equity or hedge funds at market value. In statutory reporting, these investments are generally valued at cost or lower market value.
Cash and cash equivalentsDifferences in scope: In SST, short-term investments are defined based on the remaining duration at time of purchase, while statutory reporting classifies these investments based on the initial duration into short-term or cash and cash equivalents.
Funds held by ceding companies and other receivables from reinsuranceDifferences in scope: In statutory reporting, receivables from reinsurance include an additional provision for bad debts, while in SST this is part of the best estimate liabilities.
Differences in valuation: In SST, funds held by ceding companies for which an interest is credited are valued by discounting future estimated cash flows at risk-free rates. Under statutory reporting, funds held are generally measured at the consideration received or at market value of the underlying assets. In SST, the balance of the policy loans for corporate-owned life insurance is included in funds held, while in statutory reporting funds held include only the contractual cash deposits. In statutory reporting, receivables from reinsurance include the receivable on deposit accounted business, while in SST this is part of the best estimate liabilities.
Reinsurance recoverable from retrocessionsDifferences in valuation: Same principles apply as for re/insurance liabilities before retrocession described below.
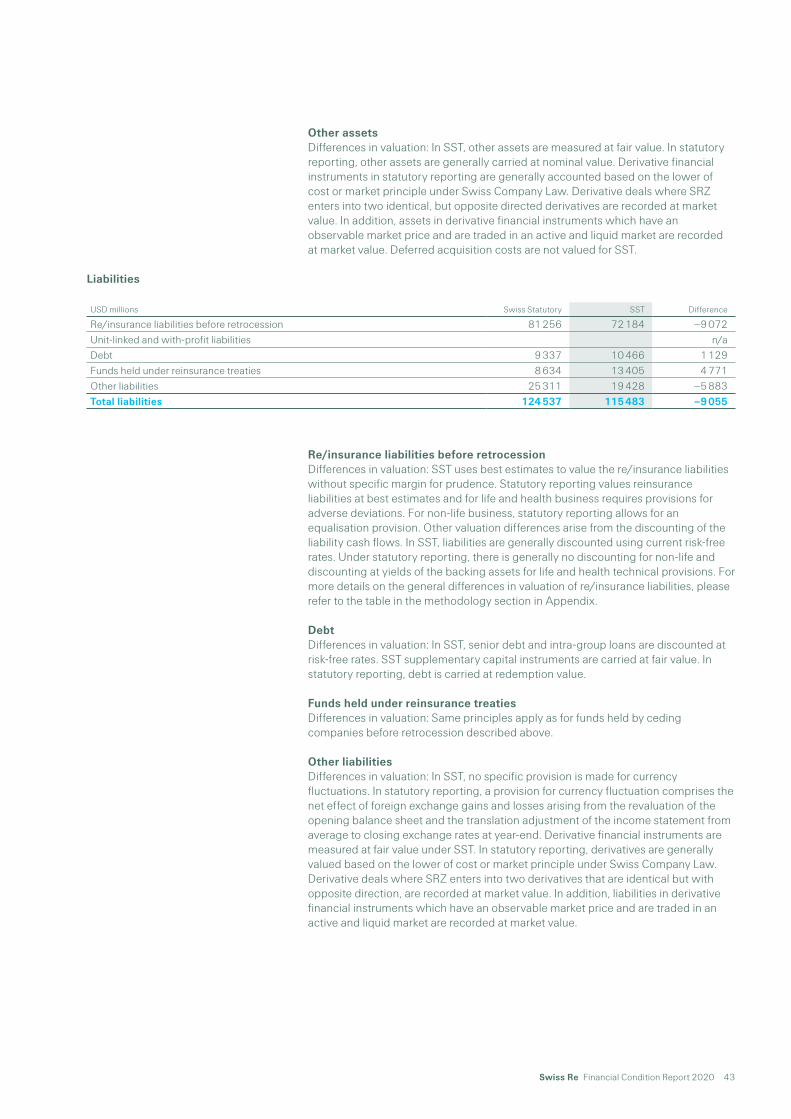
Swiss Re Financial Condition Report 2020 43
Other assetsDifferences in valuation: In SST, other assets are measured at fair value. In statutory reporting, other assets are generally carried at nominal value. Derivative financial instruments in statutory reporting are generally accounted based on the lower of cost or market principle under Swiss Company Law. Derivative deals where SRZ enters into two identical, but opposite directed derivatives are recorded at market value. In addition, assets in derivative financial instruments which have an observable market price and are traded in an active and liquid market are recorded at market value. Deferred acquisition costs are not valued for SST.
Re/insurance liabilities before retrocessionDifferences in valuation: SST uses best estimates to value the re/insurance liabilities without specific margin for prudence. Statutory reporting values reinsurance liabilities at best estimates and for life and health business requires provisions for adverse deviations. For non-life business, statutory reporting allows for an equalisation provision. Other valuation differences arise from the discounting of the liability cash flows. In SST, liabilities are generally discounted using current risk-free rates. Under statutory reporting, there is generally no discounting for non-life and discounting at yields of the backing assets for life and health technical provisions. For more details on the general differences in valuation of re/insurance liabilities, please refer to the table in the methodology section in Appendix.
DebtDifferences in valuation: In SST, senior debt and intra-group loans are discounted at risk-free rates. SST supplementary capital instruments are carried at fair value. In statutory reporting, debt is carried at redemption value.
Funds held under reinsurance treatiesDifferences in valuation: Same principles apply as for funds held by ceding companies before retrocession described above.
Other liabilitiesDifferences in valuation: In SST, no specific provision is made for currency fluctuations. In statutory reporting, a provision for currency fluctuation comprises the net effect of foreign exchange gains and losses arising from the revaluation of the opening balance sheet and the translation adjustment of the income statement from average to closing exchange rates at year-end. Derivative financial instruments are measured at fair value under SST. In statutory reporting, derivatives are generally valued based on the lower of cost or market principle under Swiss Company Law. Derivative deals where SRZ enters into two derivatives that are identical but with opposite direction, are recorded at market value. In addition, liabilities in derivative financial instruments which have an observable market price and are traded in an active and liquid market are recorded at market value.
Liabilities
USD millions Swiss Statutory SST Difference
Re/insurance liabilities before retrocession 81 256 72 184 ‒9 072Unit-linked and with-profit liabilities n/aDebt 9 337 10 466 1 129Funds held under reinsurance treaties 8 634 13 405 4 771Other liabilities 25 311 19 428 ‒5 883Total liabilities 124 537 115 483 ‒9 055

44 Swiss Re Financial Condition Report 2020
Swiss Reinsurance Company Ltd
Capital management
In order to further streamline the legal entity structure and to optimise the capital efficiency as well as Swiss Re Group and Business Units funding options, Swiss Re Group intends to reorganise the legal entity structure of its Corporate Solutions Business Unit. In this context, SRCS upon receipt of required approvals will transfer the rights and obligations of all its assets and liabilities as well as its employees to SRZ in the form of a merger, with an accounting effective date 1 January 2021. SRZ would in turn have separate holding companies for the Business Units of Reinsurance and Corporate Solutions. With this reorganisation SRZ will become the sole direct wholly-owned operating subsidiary of Swiss Re Ltd in 2021. Further, Swiss Re Life Capital Ltd will transfer the rights and obligations of all its assets and liabilities to SRZ in the form of a merger, with an accounting effective date 1 January 2021.
The risk tolerance respectability criteria for the Swiss Re Group are set out in the Group Risk Policy. The Group and SRZ Boards are responsible for approving the risk tolerance criteria, as well as for monitoring and reviewing risk tolerance. To ensure the resilience of SRZ as the main operating entity from a capital and liquidity perspective, Swiss Re’s risk tolerance criteria includes resilience limits for SRZ to ensure that the main operating entity is able to withstand capital and liquidity stresses.
Change in shareholder s equity
CHF millions Share capitalLegal capital
reservesLegal profit
reservesVoluntary
profit reserves
Retained earnings brought forward
Net income for financial year
Total shareholderʼs
equity
Shareholderʼs equity 1.1.2019 34 6 778 650 1 439 60 1 231 10 192Allocations relating to the dividend paid 1 250 –19 –1 231 0Dividend for the financial year 2019 –1 662 –1 662Net income for the financial year 2 704 2 704Shareholderʼs equity 31.12.2019 34 6 778 650 1 027 41 2 704 11 234
Shareholderʼs equity 1.1.2020 34 6 778 650 1 027 41 2 704 11 234Allocations relating to the dividend paid –1 611 4 311 4 –2 704 0Dividend for the financial year 2020 –1 611 –1 611Contribution in-kind in 20201 594 594Net income for the financial year 1 586 1 586Shareholderʼs equity 31.12.2020 34 5 761 650 3 727 45 1 586 11 803
Shareholder’s equity increased from CHF 11 234 million as of 31 December 2019 to CHF 11 803 million as of 31 December 2020.
The increase reflected the net income for the financial year 2020 of CHF 1 586 million and the contribution in-kind by Swiss Re Ltd of its investment in Swiss Re Investments Holding Company Ltd of CHF 594 million, partly offset by the dividend payment in cash for the financial year 2019 of CHF 1 611 million.
Shareholder’s equity
Swiss Re Financial Condition Report 2020 45
Solvency
SRZ uses an internal risk model to determine the economic capital required to support the risks on SRZ’s book, as well as to allocate risk-taking capacity to the different lines of business. The model also provides the basis for capital cost allocation in Swiss Reʼs EVM framework, which is used for pricing, profitability evaluation and compensation decisions. In addition to these internal purposes, the model is used to determine regulatory capital requirements under economic solvency frameworks such as the SST and Solvency II.
For more information, please see the Internal control system and risk model section of the 2020 Financial Report.
In 2017, FINMA approved Swiss Re’s internal model and its components for SST reporting purposes under their revised model review process.
Since SST 2020, two major model changes have been implemented; both changes were approved by FINMA in October 2020:
Market value margin – To improve market consistency and more adequately reflect differences between interest rates of different currencies, two changes have been made: discounting in original currencies and using forward rates to discount to future years.
Lapse risk – The model has been further strengthened by including additional dependencies and correlations, as well as anti-selective lapses for lapse trend.
In SST 2021, the solvency of SRZ is 176%, 31pp lower than in SST 2020. The decrease is mainly driven by COVID-19-related claims and reserves, the significant decline in interest rates and higher financial market volatilities. These effects are partly offset by a positive investment and underwriting performance (excluding COVID-19) and higher supplementary capital.
The ratio is calculated as SST risk-bearing capital (SST RBC) minus market value margin (MVM), divided by SST target capital (SST TC) minus MVM.
Solvency
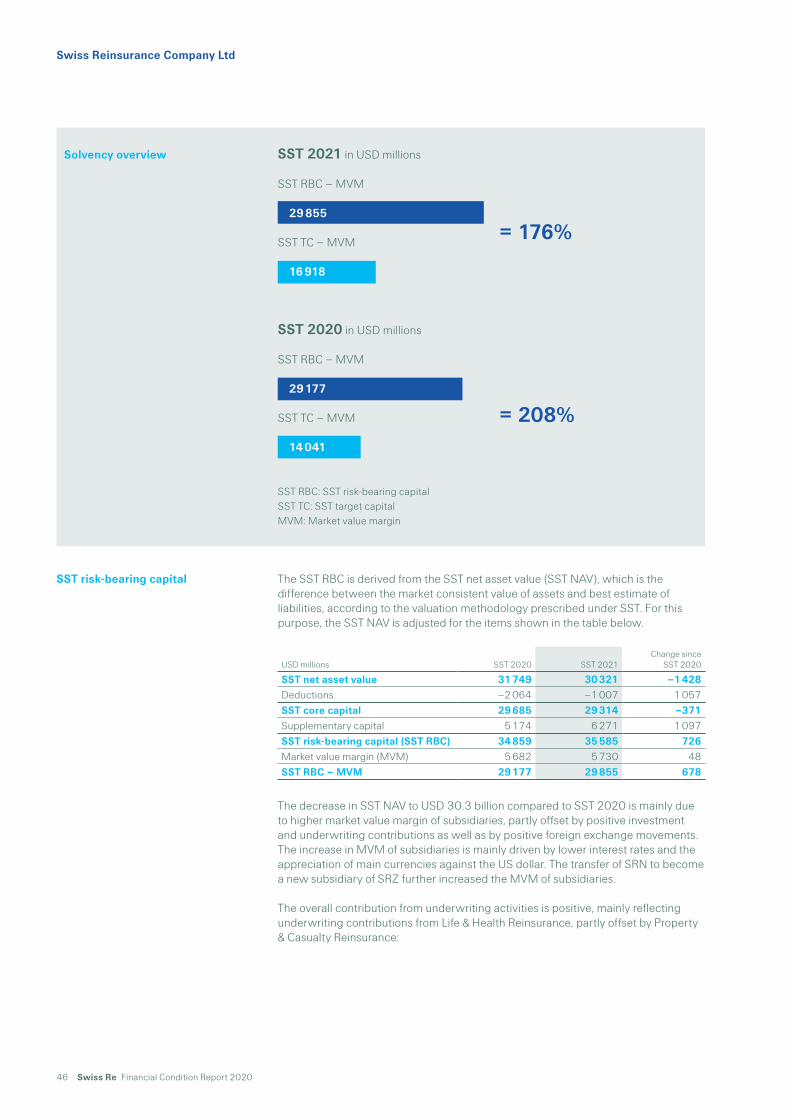
46 Swiss Re Financial Condition Report 2020
Swiss Reinsurance Company Ltd
SST 2021 in USD millions
SST RBC – MVM
29 855
SST TC – MVM
16 918
SST 2020 in USD millions
SST RBC – MVM
29 177
SST TC – MVM
14 041
SST RBC: SST risk-bearing capitalSST TC: SST target capital MVM: Market value margin
The SST RBC is derived from the SST net asset value (SST NAV), which is the difference between the market consistent value of assets and best estimate of liabilities, according to the valuation methodology prescribed under SST. For this purpose, the SST NAV is adjusted for the items shown in the table below.
USD millions SST 2020 SST 2021Change since
SST 2020
SST net asset value 31 749 30 321 –1 428Deductions –2 064 –1 007 1 057SST core capital 29 685 29 314 –371Supplementary capital 5 174 6 271 1 097SST risk-bearing capital (SST RBC) 34 859 35 585 726Market value margin (MVM) 5 682 5 730 48SST RBC – MVM 29 177 29 855 678
The decrease in SST NAV to USD 30.3 billion compared to SST 2020 is mainly due to higher market value margin of subsidiaries, partly offset by positive investment and underwriting contributions as well as by positive foreign exchange movements. The increase in MVM of subsidiaries is mainly driven by lower interest rates and the appreciation of main currencies against the US dollar. The transfer of SRN to become a new subsidiary of SRZ further increased the MVM of subsidiaries.
The overall contribution from underwriting activities is positive, mainly reflecting underwriting contributions from Life & Health Reinsurance, partly offset by Property & Casualty Reinsurance:
Solvency overview
SST risk-bearing capital
= 176%
= 208%

Swiss Re Financial Condition Report 2020 47
The Property & Casualty Reinsurance negative contribution is mainly driven by losses related to COVID-19, adverse experience and assumption updates mainly in US liability business as well as by large natural catastrophe losses mainly in Australia and several man-made loss updates. This is partly compensated by natural catastrophe reserve releases for typhoons Jebi and Hagibis, hurricane Dorian and strong renewals from property natural catastrophe and specialty.
The Life & Health Reinsurance positive contribution reflects profitable transactional business growth across all regions, in particular in EMEA, mainly due to large longevity transactions as well as life transactions in the Americas. This is partly offset by losses related to COVID-19 mainly driven by higher incurred and expected mortality claims in the US and the UK as well as higher disability claims mainly in Australia.
The contribution from investment activities is positive, mainly driven by favourable interest rate impact on the net duration position, strong real estate performance and by profits from principal investments.
Positive foreign exchange movements are mainly due to the appreciation of the Swiss franc and the Euro against the US dollar.
The dividend payment leads to a decline in the SST NAV, partly offset by a capital contribution in-kind from Swiss Re Ltd to support principal investment activities in Asia.
Deductions reflect the decrease in the projected dividend (to be paid in 2021) as well as higher deferred taxes on real estate.
Supplementary capital is recognised as risk bearing under SST. The increase in SST supplementary capital reflects the issuance of one new subordinated instrument and the transfer of subordinated debt from SRCS.
A description of the change in MVM, which represents the capital costs for the run-off period, is provided together with the SST target capital comments below.
To derive SST target capital, total risk is adjusted for the line item Other impacts as shown below.
USD millions SST 2020 SST 2021Change since
SST 2020
Total risk 17 355 20 969 3 614Other impacts 2 368 1 679 ‒688SST target capital (TC) 19 723 22 648 2 925Market value margin (MVM) 5 682 5 730 48SST target capital – MVM 14 041 16 918 2 877
SST target capital increases to USD 22.7 billion due to a higher total risk (see Risk profile for details).
Other impacts mainly reflect market value margin, the impact from business development over the forecasting period as well as requirements from FINMA that are not included in total risk as they are not consistent with Swiss Re’s own risk view.
The market value margin remains largely unchanged in SST 2021, with model updates (usage of forward interest rates, discounting in original currencies, and flat yield curve extrapolation past fifty years) offsetting the increase due to lower interest rates.
SST target capital

48 Swiss Re Financial Condition Report 2020

Swiss Re Financial Condition Report 2020 49
Swiss Re Corporate Solutions Ltd
Management summary 50
Business activities 52
Performance 54
Governance and risk management 58
Risk profile 60
Valuation 62
Capital management 67
Solvency 68

50 Swiss Re Financial Condition Report 2020
Swiss Re Corporate Solutions Ltd
Management summary
In SST 2021, the SST ratio of Swiss Re Corporate Solutions Ltd (SRCS) increases to 229% mainly driven by management actions to reorganise its legal entity structure. As part of this restructuring, SRCS is planned to be merged with SRZ in mid-2021 subject to receipt of the required approvals. An agreement is now in place with SRZ for a 100% loss portfolio transfer for all losses incurred in accident year 2019 and 2020 and a new 100% quota share covers accident year 2021. The agreement substantially improves the SST ratio and is partly offset by the transfer of a USD 0.5bn subordinated loan to SRZ, as well as COVID-19-related losses incurred in 2020.
This Report provides qualitative and quantitative information about the financial condition of SRCS.
SST 2021 in USD millions
SST RBC – MVM
1 347
SST TC – MVM
588
SST 2020 in USD millions
SST RBC – MVM
2 550
SST TC – MVM
1 809
SST RBC: SST risk-bearing capitalSST TC: SST target capital MVM: Market value margin
Solvency Overview
= 229%
= 141%

Swiss Re Financial Condition Report 2020 51
In this section, we provide information about the business model, the strategy and significant events. > Read more
We present the performance of the year under review based on the Swiss statutory income statement. > Read more
This section provides an overview of the system of governance, key governing bodies, risk management systems and policies. > Read more
The main components of the total risk calculated under SST are discussed in this section. > Read more
In this section, we provide the SST balance sheet and additional quantitative and qualitative explanations on differences to the audited statutory financial statements of SRCS. > Read more
The capital management strategy of SRCS and key changes in 2020 are discussed in this section. > Read more
This section presents SRCS’ SST calculation and includes explanation on changes compared to the prior year. > Read more
Business activities
Performance
Governance and risk management
Risk profile
Valuation
Capital management
Solvency

52 Swiss Re Financial Condition Report 2020
Swiss Re Corporate Solutions Ltd
Business activities
Strategy and prioritiesSRCS conducts the commercial insurance business of the Swiss Re Group and is committed to deliver long-term profitability and economic growth. Corporate Solutions offers customised, innovative and multi-line, multi-year risk transfer solutions, taking into account the unique needs of local markets and specialty industries. Outlook The commercial insurance market experienced significant price gains through 2020 continuing the trend started in 2019. Corporate Solutions expects market hardening to continue in 2021, but to potentially slow by end of year as pricing deficiencies close and capital re-enters the market.
Strategy and prioritiesFinancial investments are managed in accordance with Swiss Re‘s Targeted Standard on Asset Management and SRCS’s investment guidelines, which are intended to ensure compliance with regulatory requirements. The general principle governing investment management in SRCS is the creation of economic value on the basis of returns relative to the liability benchmark, while adhering to the investment guidelines and the general prudence principle. The liability benchmark is determined by approximating an investable benchmark from projected liability cash flows. A cash benchmark is used for the economic surplus.
OutlookThe global economy has seen a stronger-than-expected recovery after the pandemic-induced “sudden stop” in spring. However, the renewed COVID-19 waves in both the US and Europe, which occurred as the weather cooled, weighed on economic growth in the fourth quarter, resulting in a 2020 global real Gross Domestic Product (GDP) growth which will still be deeply negative.
Looking ahead, the global economy is expected to recover in 2021, although not all economies will reach pre-COVID-19 GDP levels this year. Inflationary pressure is expected to remain moderate even though base effects are likely to lead to a temporary increase in the very near term. In this environment, monetary policy is set to remain highly accommodative. Continued fiscal support is likely necessary to sustain the recovery.
In order to further streamline the legal entity structure, Swiss Re Group intends to reorganise its legal entity structure. In this context SRCS will transfer, upon receipt of the required approvals, the rights and obligations of all its assets and liabilities as well as its employees to SRZ in the form of a merger. This transaction is scheduled for 2021. The Business Unit Corporate Solutions will remain separately in SRZ.
Reinsurance business
Investments
Structural changes

Swiss Re Financial Condition Report 2020 53
SRCS, domiciled in Zurich, Switzerland, performs a dual role within the Swiss Re Group as both a reinsurance company and a sub-holding company for the Corporate Solutions Business Unit. SRCS is a wholly-owned subsidiary of Swiss Re Ltd, the ultimate parent company domiciled in Zurich, Switzerland.
Claims on and obligations towards affiliated companies
CHF millions 2019 2020
Loans 1 212 1 052Funds held by ceding companies 642 597Reinsurance recoverable on technical provisions retroceded
1 780 2 326
Premiums and other receivables from reinsurance 1 833 2 120Other receivables 414 423Funds held under reinsurance treaties 342 484Reinsurance balances payable 1 400 1 318Other liabilities 10 79Subordinated liabilities1 291
1 The subordinated liabilities were against the parent company Swiss Re Ltd. It is a subordinated floating rate callable loan due in 2028 with a first optional redemption date on 19 December 2023. The subordinated loan was repaid early as part of the conversion of the loan into equity. There were no other outstanding claims on and obligations towards the parent company Swiss Re Ltd at the end of the periods 2019 and 2020.
Share capital and major shareholderThe nominal share capital of SRCS amounted to CHF 100 million. It is divided into 100 000 shares, each with a nominal value of CHF 1 000. The shares were fully paid-in and held directly by Swiss Re Ltd. As of 31 December 2020 and 2019, SRCS was a wholly-owned subsidiary of Swiss Re Ltd.
List of branch offices Swiss Re Corporate Solutions Ltd, Labuan Branch
Variable interest entitiesSRCS and its subsidiaries have no material off-balance sheet postions or risks transferred to special purpose vehicles.
The financial year under review was marked by the losses due to COVID-19-related claims and reserves in relation to event cancellation. In addition, several losses occurred, eg Hurricane Laura.
SRCS also entered into a 100% intragroup quota share retrocession with SRZ, effective for business incepting 1 July 2020 onwards.
In 2020 PricewaterhouseCoopers Ltd was the auditor of SRCS. For more information, please see the Report of the statutory auditor.
Reinsurance and sub-holding company
Significant events
Report of the statutory auditor

54 Swiss Re Financial Condition Report 2020 Swiss Re Financial Condition Report 2020 55
Swiss Re Corporate Solutions Ltd
Performance
Income statement – Swiss statutory
Total Personal accident Health Motor Marine, aviation, transport Property Casualty Miscellaneous
CHF millions 2019 2020 2019 2020 2019 2020 2019 2020 2019 2020 2019 2020 2019 2020 2019 2020
Premiums written gross 4 315 3 303 16 3 338 290 4 454 356 1 855 1 645 1 162 842 486 167Premiums written retroceded –323 ‒1 300 ‒2 –29 ‒183 –148 ‒695 –131 ‒317 –15 ‒103Premiums written net 3 992 2 003 16 3 338 288 4 425 173 1 707 950 1 031 525 471 64Change in unearned premiums gross –841 110 6 –52 ‒2 –1 2 18 40 –400 ‒86 –295 ‒36 –111 186Change in unearned premiums retroceded 21 751 1 2 111 6 368 14 197 –1 74Premiums earned 3 172 2 864 16 9 286 287 3 2 445 324 1 313 1 232 750 686 359 324Other reinsurance revenues 75 7 5 3 70 3 1Total revenues from reinsurance business 3 247 2 871 16 9 286 287 3 2 445 324 1 318 1 235 820 689 359 325Claims paid and claim adjustment expenses gross –2 138 ‒2 043 –7 ‒7 –89 ‒194 –1 ‒1 –415 ‒253 –914 ‒875 –581 ‒522 –131 ‒191Claims paid and claim adjustment expenses retroceded –967 309 –1 19 –1 45 –965 243 2Change in unpaid claims gross –1 495 ‒827 1 –100 ‒13 –1 –73 ‒1 –100 ‒567 –1 044 ‒118 –177 ‒129Change in unpaid claims retroceded 1 603 29 43 32 –5 177 1 565 ‒205 25Change in unpaid claims for unit-linked life insuranceClaims incurred –2 997 ‒2 532 –7 ‒6 –189 ‒207 –2 ‒1 –446 ‒203 –1 020 ‒1 220 –1 025 ‒602 –308 ‒293Acquisition and operating costs gross –1 146 ‒1 020 –6 ‒2 –76 ‒112 –1 ‒1 –162 ‒94 –458 ‒493 –284 ‒194 –159 ‒124Acquisition and operating costs retroceded 3 115 17 2 55 2 32 –1 11Acquisition and operating costs net –1 143 ‒905 –6 ‒2 –76 ‒112 –1 ‒1 –162 ‒77 –456 ‒438 –282 ‒162 –160 ‒113Other reinsurance expenses –75 ‒8 –75 ‒8Total expenses from reinsurance business –4 215 ‒3 445 –13 ‒8 –265 ‒319 –3 ‒2 –608 ‒280 –1 476 ‒1 658 –1 382 ‒772 –468 ‒406Investment income 239 92Investment expenses –8 ‒23Investment result 231 69 0 0 0 0 0 0 0 0 0 0 0 0 0 0Investment result from unit-linked life insuranceOther financial income 6 21Other financial expenses –32 ‒62Operating result –763 ‒546 0 0 0 0 0 0 0 0 0 0 0 0 0 0Interest expenses on debt and subordinated liabilities –39 ‒24Other income 24 18Other expenses –79 ‒51Extraordinary income and expensesIncome before income tax expense –857 ‒603 0 0 0 0 0 0 0 0 0 0 0 0 0 0Income tax expense –1 1Net income –858 ‒602 0 0 0 0 0 0 0 0 0 0 0 0 0 0
56 Swiss Re Financial Condition Report 2020
Swiss Re Corporate Solutions Ltd
Total revenues and expenses from reinsurance business experienced a loss of CHF 574 million in 2020, compared to a loss of CHF 968 million in 2019.
Premiums earned decreased from CHF 3 172 million in 2019 to CHF 2 864 million in 2020, mainly due to the higher intragroup retrocession between SRCS and SRZ, partially offset by rate increases and continued selective underwriting.
Claims incurred decreased from CHF 2 997 million in 2019 to CHF 2 532 million in 2020. The decrease was mainly driven by the pruning steps taken to improve the profitability of the business as well as intragroup retrocessions between SRCS and SRZ. The decrease was partially offset by higher claims incurred due to COVID-19.
Acquisition costs decreased from CHF 940 million in 2019 to CHF 709 million in 2020. The decrease was mainly driven by the positive effect of the pruning activities as well as the new intragroup retrocession between SRCS and SRZ.
Operating costs decreased from CHF 203 million in 2019 to CHF 196 million in 2020. The decrease was mainly due to lower management expenses.
Investment income decreased from CHF 239 million in 2019 to CHF 92 million in 2020. The decrease was mainly due to the one-off dividend income received in 2019 from the Lux fund, partially compensated by higher investment income in 2020.
Investment expenses increased from CHF 8 million in 2019 to CHF 23 million in 2020.
Investment result

Swiss Re Financial Condition Report 2020 57
Investment result
CHF millions Income Value readjustment Realised gains 2020 Total
Investment incomeSubsidiaries and affiliated companies
Fixed income securities 29 7 36Equity securitiesLoans 21 21 Shares in investment funds 2 31 33 Short-term investments 2 2 Alternative investmentsOther investments 4 0 31 35Income from investment servicesInvestment income 54 0 38 92
CHF millions Expenses Value adjustment Realised losses 2020 Total
Investment expensesSubsidiaries and affiliated companies ‒10 ‒10Fixed income securities ‒5 ‒5Equity securitiesLoans Shares in investment funds Short-term investments Alternative investmentsOther investments 0 0 0 0Investment management expenses ‒8 ‒8Investment expenses ‒8 ‒10 ‒5 ‒23
Investment result 69
CHF millions Income Value readjustment Realised gains 2019 Total
Investment incomeSubsidiaries and affiliated companiesFixed income securities 27 4 31Equity securitiesLoans 42 42 Shares in investment funds 114 44 158 Short-term investments 6 1 7 Alternative investmentsOther investments 120 0 45 165Income from investment services 1 1Investment income 190 0 49 239
CHF millions Expenses Value adjustment Realised losses 2019 Total
Investment expensesSubsidiaries and affiliated companiesFixed income securities –1 –1Equity securitiesLoans Shares in investment funds Short-term investments Alternative investmentsOther investments 0 0 0 0Investment management expenses –7 –7Investment expenses –7 0 –1 –8
Investment result 231

58 Swiss Re Financial Condition Report 2020
Swiss Re Corporate Solutions Ltd
Governance and risk management
Board of Directors Walter B. Kielholz, Chairman Renato Fassbind, Vice Chairman Raymond K. F. Ch’ien, Member of the Board of Directors Sergio P. Ermotti, Member of the Board of Directors Karen Gavan, Member of the Board of Directors Joachim Oechslin, Member of the Board of Directors Deanna Ong, Member of the Board of Directors Jay Ralph, Member of the Board of Directors Joerg Reinhardt, Member of the Board of Directors Philip K. Ryan, Member of the Board of Directors Sir Paul Tucker, Member of the Board of Directors Jacques de Vaucleroy, Member of the Board of Directors Susan L. Wagner, Member of the Board of Directors Larry Zimpleman, Member of the Board of Directors
Changes in 2020 Sergio P. Ermotti, Joachim Oechslin and Deanna Ong have been elected as new
members of the Board of Directors as of 25 March 2020 Trevor Manuel and Eileen Rominger stepped down as members of the Board of
Directors as of 25 March 2020
Executive Management Andreas Berger, Chief Executive Officer Nina Arquint, Chief Risk Officer, Member of the Executive Committee Angelo Colombo, Member of the Executive Committee Samrat Dua, Member of the Executive Committee Ivan Gonzalez, Member of the Executive Committee Matthias Grass, Chief Financial Officer, Member of the Executive Committee Ashley Hirst, Member of the Executive Committee Fred Kleiterp, Member of the Executive Committee Kera McDonald, Member of the Executive Committee Jonathan Rake, Member of the Executive Committee Marc Scheidegger, Member of the Executive Committee Markus Stiefel, Member of the Executive Committee Edmond Kartun, Appointed Actuary, not Member of the Executive Committee
Changes in 2020 Nina Arquint, Chief Risk Officer, has been appointed as member of the Executive
Committee as of 1 January 2020 (this position is new in the Executive Committee)
James George, formerly Chief Claims Officer, stepped down as a member of the Executive Committee as of 1 April 2020
Andreas Berger, Chief Executive Officer, took over the function as Chief Claims Officer and member of the Executive Committee ad interim from 1 April 2020 to 1 June 2020
Marc Scheidegger, Chief Claims Officer, has been appointed as a member of the Executive Committee as of 1 June 2020
Matthias Grass, Chief Financial Officer, has been appointed as member of the Executive Committee as of 1 July 2020
Martin Müller, formerly Chief Financial Officer, stepped down as a member of the Executive Committee as of 1 July 2020
Board of Directors and Executive Management

Swiss Re Financial Condition Report 2020 59
As a Business Unit top-level entity, SRCS is subject to enhanced governance requirements, which apply to all “Level I” classified legal entities, which includes the following requirements:
Develop and maintain corporate and risk governance documentation that governs the responsibilities of the legal entity Board, committees and management
Establish committee(s) covering Audit, as well as Finance and Risk, to support the legal entity Board in performing its oversight responsibility for risk and capital steering
Designate a Chief Risk Officer and Chief Financial Officer
All risk-related activities of SRCS and its subsidiaries are subject to Swiss Re’s risk management framework, which includes:
An independent Risk Management function responsible for risk oversight and control across Swiss Re and comprises dedicated risk teams for legal entities and regions, as well as central teams that provide specialised risk expertise and oversight.
A clearly defined risk control framework which comprises a body of standards that establish an internal control system for taking and managing risk.
Moreover, risk management activities at SRCS are complemented by Swiss Re’s Group Internal Audit and Compliance units.
Swiss Re’s 2020 Financial Report describes the governance and risk management structure as it applies to SRCS. For more information, please refer to the > Group governance and risk management section.
Governance and risk management

60 Swiss Re Financial Condition Report 2020
Swiss Re Corporate Solutions Ltd
Risk profile
SRCS is exposed to insurance and financial risks that are calculated in Swiss Re’s internal risk model, as well as other risks that are not explicitly part of the economic capital requirement but are actively monitored and controlled due to their significance for the entity. These include operational, liquidity, model, valuation, regulatory, political, strategic and sustainability risks (see Swiss Re’s risk landscape, 2020 Financial Report, page 68).
The risk profile of SRCS, as part of the execution of management actions to optimise capital protection, has shifted during 2020 towards a higher concentration of financial market and credit risk relative to insurance risk. An agreement is now in place with SRZ for a 100% loss portfolio transfer for all losses incurred in accident year 2019 and 2020 and a new 100% quota share covers accident year 2021. Further protection measures for accident years 2018 and prior had been implemented in 2019 already, so that only limited underwriting risk remains in SRCS.
The table below shows the risk categories calculated in Swiss Re’s internal risk model. On the insurance risk, SRCS is exposed to property and casualty risk, which is mainly driven by costing and reserving, man-made and natural catastrophe risk.
Financial market risk is mainly driven by credit spread, interest rate and equity risk. The reduction in credit & surety due to the loss portfolio transfer and the quota share in place with SRZ drives the reduction in credit risk. Credit risk is mainly driven by default risk of capital market products and the credit and surety business.
Total risk is based on 99% tail value at risk and represents the average unexpected loss that occurs with a frequency of less than once in 100 years over a one-year time horizon.
USD millions SST 2020 SST 2021Change since
SST 2020
Property and casualty risk 1 403 385 ‒1 018Life and health risk n/aFinancial market risk 489 449 ‒41Credit risk1 731 177 ‒554Diversification –753 ‒313 440Total risk 1 870 697 ‒1 173
1 Credit comprises credit default and migration risk from both asset management and underwriting. It excludes credit spread risk, which is part of financial market risk.
In SST 2021, total risk decreases to USD 0.7 billion. This is mainly due to lower property, casualty, as well as credit risk. The property and casualty risk decrease is largely driven by new risk transfer
agreements with SRZ which reduce all insurance risks, in particular, man-made, costing and reserving and natural catastrophe risk.
Financial market risk decreases mainly due to a reduction in weather and energy derivatives; this is partly offset by an increase in interest rate risk driven by the widening of the duration mismatch between assets and liabilities which resulted from the new risk transfer agreements with SRZ.
The credit risk decrease is largely driven by new risk transfer agreements with SRZ.
Swiss Re’s internal model takes account of the accumulation and diversification between individual risks. The effect of diversification at the category level, which is shown in the table above, represents the difference between total risk (the company’s 99% tail VaR) and the sum of standalone tail VaR amounts for the individual risk categories. This amount does not reflect diversification within risk categories. The extent of diversification is largely determined by the selected level of aggregation – the higher the aggregation level, the lower the diversification effect.
Total risk

Swiss Re Financial Condition Report 2020 61
SRCS uses a Group-wide risk matrix methodology and Swiss Re’s Global Risk Register to capture operational risks. The matrix in particular focuses on risks approaching or exceeding SRCS’ own risk tolerance as they require management actions. Adherence to risk tolerance is monitored and reported at least on a quarterly basis. The overall control environment within SRCS remains adequate.
Key focus areas of SRCS’ operational risk management include capturing insights and experience from the COVID-19 pandemic, and reflecting these in underwriting processes and controls.
For details on other significant risks, including liquidity, model, valuation, regulatory, political, strategic and sustainability risks, see the Group’s 2020 Financial Report sections on Liquidity management on page 60, Swiss Re’s risk landscape on pages 68 and 69, and Management of other significant risks on pages 74–77.
Among tested financial market sensitivities, SRCS’ SST ratio is most sensitive to a 50bp rise in credit spreads.
SRCS manages and controls its risks through an extended limit framework. Insurance risks are also mitigated through retrocession. For financial risks, SRCS uses financial market derivative instruments as well as financial market securities to hedge financial market and credit risk arising from investments and insurance liabilities.
Operational risk
Other significant risks
Risk concentration
Risk mitigation
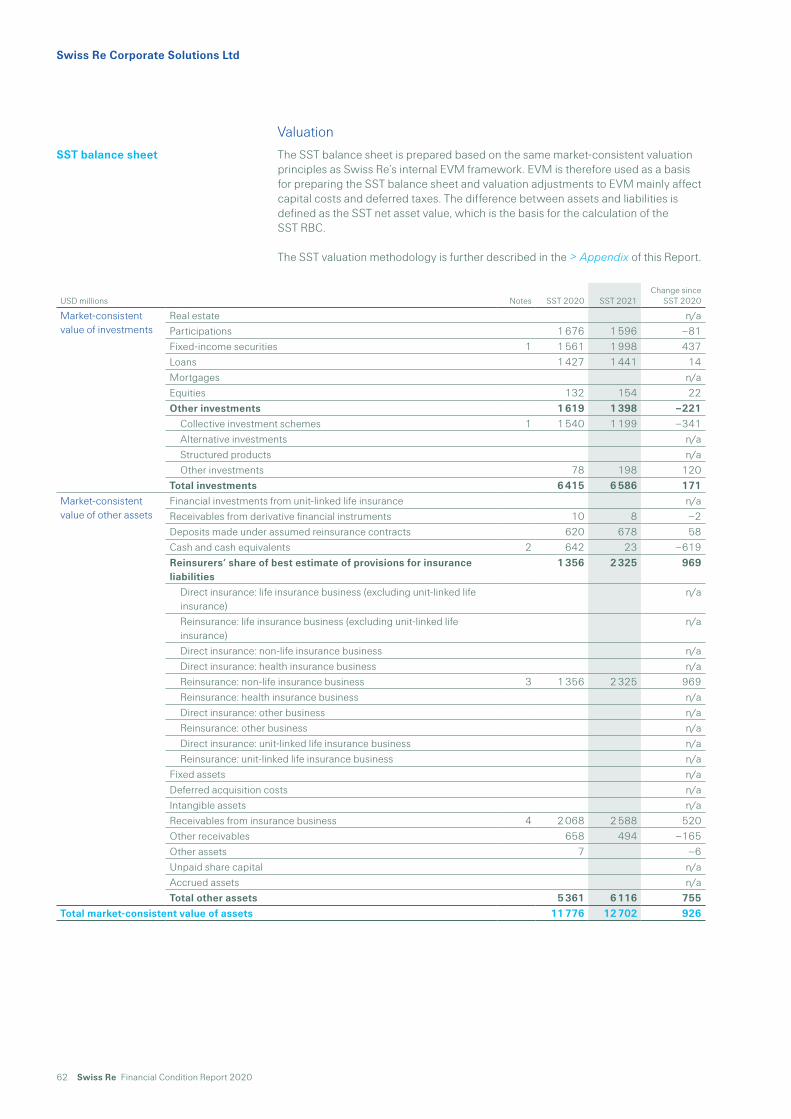
62 Swiss Re Financial Condition Report 2020
Swiss Re Corporate Solutions Ltd
Valuation
The SST balance sheet is prepared based on the same market-consistent valuation principles as Swiss Re’s internal EVM framework. EVM is therefore used as a basis for preparing the SST balance sheet and valuation adjustments to EVM mainly affect capital costs and deferred taxes. The difference between assets and liabilities is defined as the SST net asset value, which is the basis for the calculation of the SST RBC.
The SST valuation methodology is further described in the > Appendix of this Report.
SST balance sheet
USD millions Notes SST 2020 SST 2021Change since
SST 2020
Market-consistent value of investments
Real estate n/aParticipations 1 676 1 596 ‒81 Fixed-income securities 1 1 561 1 998 437 Loans 1 427 1 441 14 Mortgages n/aEquities 132 154 22 Other investments 1 619 1 398 ‒221 Collective investment schemes 1 1 540 1 199 ‒341 Alternative investments n/a Structured products n/a Other investments 78 198 120 Total investments 6 415 6 586 171
Market-consistent value of other assets
Financial investments from unit-linked life insurance n/aReceivables from derivative financial instruments 10 8 ‒2 Deposits made under assumed reinsurance contracts 620 678 58 Cash and cash equivalents 2 642 23 ‒619 Reinsurers‘ share of best estimate of provisions for insurance liabilities
1 356 2 325 969
Direct insurance: life insurance business (excluding unit-linked life insurance)
n/a
Reinsurance: life insurance business (excluding unit-linked life insurance)
n/a
Direct insurance: non-life insurance business n/a Direct insurance: health insurance business n/a Reinsurance: non-life insurance business 3 1 356 2 325 969 Reinsurance: health insurance business n/a Direct insurance: other business n/a Reinsurance: other business n/a Direct insurance: unit-linked life insurance business n/a Reinsurance: unit-linked life insurance business n/aFixed assets n/aDeferred acquisition costs n/aIntangible assets n/aReceivables from insurance business 4 2 068 2 588 520 Other receivables 658 494 ‒165 Other assets 7 ‒6 Unpaid share capital n/aAccrued assets n/aTotal other assets 5 361 6 116 755
Total market-consistent value of assets 11 776 12 702 926

Swiss Re Financial Condition Report 2020 63
USD millions Notes SST 2020 SST 2021Change since
SST 2020
BEL: Best estimate of liabilities (including unit-linked life insurance)
Best estimate of provisions for insurance liabilities 5 7 236 8 543 1 306 Direct insurance: life insurance business (excluding unit-linked life
insurance) n/a
Reinsurance: life insurance business (excluding unit-linked life insurance)
n/a
Direct insurance: non-life insurance business n/a Direct insurance: health insurance business n/a Reinsurance: non-life insurance business 7 236 8 543 1 306 Reinsurance: health insurance business n/a Direct insurance: other business n/a Reinsurance: other business n/aBest estimate of provisions for unit-linked life insurance liabilities 0 0 0 Direct insurance: unit-linked life insurance business n/a Reinsurance: unit-linked life insurance business n/a
Market-consistent value of other liabilities
Non-technical provisions 23 5 ‒18 Interest-bearing liabilities 6 509 509 Liabilities from derivative financial instruments 11 21 10 Deposits retained on ceded reinsurance 7 548 548 Liabilities from insurance business 1 457 1 530 73 Other liabilities 262 119 ‒144 Accrued liabilities 11 16 4 Subordinated debts 8 847 ‒847
Total BEL plus market-consistent value of other liabilities 9 848 11 289 1 441 Market-consistent value of assets minus total from BEL 1 928 1 413 ‒515
Notes1. The changes in fixed income securities and collective investment schemes reflect a shift from investment funds fixed income securities to
direct investments in fixed income securities, mostly US bonds.2. The decrease in cash and cash equivalents reflects additional investments in fixed-income securities and a cash payment for the Loss
Portfolio Transfer cover with SRZ.3. The increase in reinsurers‘ share of best estimate of provisions for insurance liabilities for non-life reinsurance business is driven by a new
intra-group retrocession with SRZ and by a reclassification related to the existing intra-group retrocession with SRZ (offset in deposits retained on ceded reinsurance, see Note 7).
4. The increase in receivables from insurance business is mainly driven by the change of the intra-group retrocession program with Westport Insurance Corporation and First Specialty Insurance Corporation, as well as higher receivables from Swiss Re International SE and SRZ.
5. The increase in non-life reinsurance best estimate liabilities before retrocessions is mainly driven by higher reserving actions, including reserves for losses related to COVID-19.
6. The increase in the interest-bearing liabilities is due to a new loan with SRZ.7. The increase in deposits retained on ceded reinsurance reflects a reclassification related to the existing intra-group retrocession with SRZ
(offset in reinsurers‘ share of best estimate of provisions for insurance liabilities for non-life reinsurance business, see Note 3). Furthermore, an increase is driven by a new retrocession with SRZ.
8. The decrease in subordinated debts reflects the repayment of the internal hybrid loan and the transfer of the subordinated loan to SRZ.
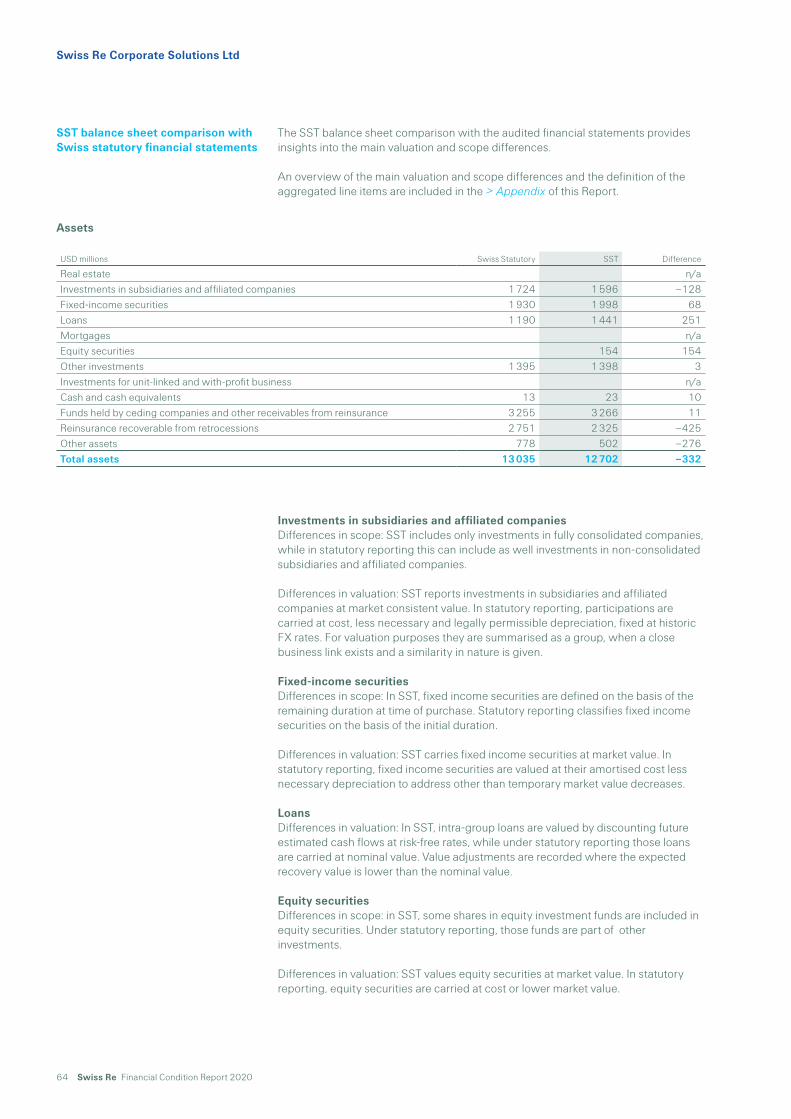
64 Swiss Re Financial Condition Report 2020
Swiss Re Corporate Solutions Ltd
The SST balance sheet comparison with the audited financial statements provides insights into the main valuation and scope differences.
An overview of the main valuation and scope differences and the definition of the aggregated line items are included in the > Appendix of this Report.
Investments in subsidiaries and affiliated companiesDifferences in scope: SST includes only investments in fully consolidated companies, while in statutory reporting this can include as well investments in non-consolidated subsidiaries and affiliated companies.
Differences in valuation: SST reports investments in subsidiaries and affiliated companies at market consistent value. In statutory reporting, participations are carried at cost, less necessary and legally permissible depreciation, fixed at historic FX rates. For valuation purposes they are summarised as a group, when a close business link exists and a similarity in nature is given.
Fixed-income securitiesDifferences in scope: In SST, fixed income securities are defined on the basis of the remaining duration at time of purchase. Statutory reporting classifies fixed income securities on the basis of the initial duration.
Differences in valuation: SST carries fixed income securities at market value. In statutory reporting, fixed income securities are valued at their amortised cost less necessary depreciation to address other than temporary market value decreases.
LoansDifferences in valuation: In SST, intra-group loans are valued by discounting future estimated cash flows at risk-free rates, while under statutory reporting those loans are carried at nominal value. Value adjustments are recorded where the expected recovery value is lower than the nominal value.
Equity securitiesDifferences in scope: in SST, some shares in equity investment funds are included in equity securities. Under statutory reporting, those funds are part of other investments.
Differences in valuation: SST values equity securities at market value. In statutory reporting, equity securities are carried at cost or lower market value.
SST balance sheet comparison with Swiss statutory financial statements
Assets USD millions Swiss Statutory SST Difference
Real estate n/aInvestments in subsidiaries and affiliated companies 1 724 1 596 ‒128Fixed-income securities 1 930 1 998 68Loans 1 190 1 441 251Mortgages n/aEquity securities 154 154Other investments 1 395 1 398 3Investments for unit-linked and with-profit business n/aCash and cash equivalents 13 23 10Funds held by ceding companies and other receivables from reinsurance 3 255 3 266 11Reinsurance recoverable from retrocessions 2 751 2 325 ‒425Other assets 778 502 ‒276Total assets 13 035 12 702 ‒332

Swiss Re Financial Condition Report 2020 65
Other investmentsDifferences in scope: In SST, short-term investments are defined on the basis of the remaining duration at time of purchase. Statutory reporting classifies short-term investments on the basis of initial duration. In SST, some public equity investment funds are classified as part of the equity securities. In statutory reporting, shares in investment funds are classified as other investments.
Differences in valuation: SST reports other investments such as shares in investment funds, private equity or hedge funds at market value. In statutory reporting, those securities are valued at cost, less necessary and legally permissible depreciation.
Cash and cash equivalentsDifferences in scope: In SST, short-term investments are defined based on the remaining duration at time of purchase, while statutory reporting classifies these investments based on the initial duration into short-term or cash and cash equivalents.
Differences in valuation: SST reports other investments such as investment funds, private equity or hedge funds at market value. In statutory reporting, these investments are generally valued at lower of cost or market value.
Funds held by ceding companies and other receivables from reinsuranceDifferences in scope: In statutory reporting, receivables from reinsurance include an additional provision for bad debts, while in SST this is part of the best estimate liabilities.
Differences in valuation: In SST, funds held by ceding companies for which interest is credited are valued by discounting future estimated cash flows at risk-free rates. Under statutory reporting, those funds held are generally measured at the consideration received or at market value of the underlying assets. In statutory reporting, receivables from reinsurance include the receivable on deposit accounted business, while in SST this is part of the best estimate liabilities.
Reinsurance recoverable from retrocessionsDifferences in valuation: Same principles apply as for re/insurance liabilities before retrocession described below.
Other assetsDifferences in scope: In SST, reinsurance recoverables are part of re/insurance liabilities, whereas they are disclosed in other assets in statutory reporting.
Differences in valuation: In SST, other assets are measured at fair value. In statutory reporting, other assets are generally carried at nominal value. Deferred acquisition costs are not valued for SST.

66 Swiss Re Financial Condition Report 2020
Swiss Re Corporate Solutions Ltd
Re/insurance liabilities before retrocessionDifferences in scope: In SST, reinsurance recoverables are shown in (re)insurance liabilities. In statutory reporting, reinsurance recoverables are disclosed within other assets.
Differences in valuation: In SST, liabilities are generally discounted using current risk-free rates. In statutory reporting there is generally no discounting for non-life technical provisions.
DebtDifferences in valuation: In SST, senior debt and intra-group loans are discounted at risk-free rates. SST supplementary capital instruments are carried at fair value. In statutory reporting, debt is carried at redemption value.
Other liabilitiesDifferences in valuation: In SST, no specific provision is made for currency fluctuations. In statutory reporting, a provision for currency fluctuation comprises the net effect of foreign exchange gains and losses arising from the revaluation of the opening balance sheet and the translation adjustment of the income statement from average to closing exchange rates at year-end. Derivative financial instruments are measured at fair value under SST. In statutory reporting, derivatives generally are carried at cost, less necessary and legally permissible depreciation.
Liabilities
USD millions Swiss Statutory SST Difference
Re/insurance liabilities before retrocession 9 609 8 543 ‒1 067Unit-linked and with-profit liabilities n/aDebt 500 509 9
Funds held under reinsurance treaties 548 548 0Other liabilities 1 795 1 690 ‒104Total liabilities 12 452 11 289 ‒1 162

Swiss Re Financial Condition Report 2020 67
Capital management
In order to further streamline the legal entity structure and to optimise the capital efficiency as well as Swiss Re Group and Business Units funding options, Swiss Re Group intends to reorganise the legal entity structure of its Corporate Solutions Business Unit. In this context, SRCS will upon receipt of the required approvals transfer the rights and obligations of all its assets and liabilities as well as its employees to SRZ in the form of a merger, with an accounting effective date 1 January 2021. SRZ would in turn have separate holding companies for the Business Units of Reinsurance and Corporate Solutions. With this reorganisation SRZ will become the sole direct wholly-owned operating subsidiary of Swiss Re Ltd in 2021.
Change in shareholder’s equity
CHF millions Share CapitalLegal capital
reservesVoluntary
profit reservesLoss brought
forwardNet loss for the
financial year
Total Shareholder’s
equity
Shareholder’s equity 1.1.2019 100 1 491 903 –890 –498 1 106Capital injection on 24.6.2019 from Swiss Re Ltd 584 584Allocation to voluntary profit reserves –1 584 1 584 0Allocation to retained earnings –498 498 0Dividend for the financial year 2018Net result for the year –858 –858Shareholder’s equity 31.12.2019 100 491 2 487 –1 388 –858 832
Shareholder’s equity 1.1.2020 100 491 2487 ‒1388 ‒858 832Capital injection on 19.6.2020 from Swiss Re Ltd 286 286Allocation to voluntary profit reserves ‒725 725 0Allocation to retained earnings ‒858 858 0Dividend for the financial year 2019Net result for the year ‒602 ‒602
Shareholder’s equity 31.12.2020 100 52 3 212 ‒2 246 ‒602 516
Shareholder’s equity decreased from CHF 832 million at 31 December 2019 to CHF 516 million at 31 December 2020. The decrease resulted from the net loss for 2020 of CHF 602 million, partially offset by the capital contribution of CHF 286 million from Swiss Re Ltd.
The nominal share capital of SRCS remained unchanged at CHF 100 million at 31 December 2020.
Shareholder’s equity

68 Swiss Re Financial Condition Report 2020
Swiss Re Corporate Solutions Ltd
Solvency
SRCS uses an internal risk model to determine the economic capital required to support the risks on the SRCS’s book, as well as to allocate risk-taking capacity to the different lines of business. The model also provides the basis for capital cost allocation in Swiss Re’s EVM framework, which is used for pricing, profitability evaluation and compensation decisions. In addition to these internal purposes, the model is used to determine regulatory capital requirements under economic solvency frameworks such as the SST and Solvency II.
For more information, please see the Internal control system and risk model section of the 2020 Financial Report.
In 2017, FINMA approved Swiss Re s internal model and its components for SST reporting purposes under their revised model review process.
Since SST 2020, two major internal model changes have been implemented; both changes were approved by FINMA in October 2020:
Market value margin – To improve market consistency and more adequately reflect differences between interest rates of different currencies, two changes have been made: discounting in original currencies and using forward rates to discount to future years.
Lapse risk – The model has been further strengthened by including additional dependencies and correlations, as well as anti-selective lapses for lapse trend.
The SST ratio of SRCS increases to 229% mainly driven by management actions to reorganise its legal entity structure. As part of this restructuring, SRCS is planned to be merged with SRZ in mid-2021 subject to receipt of the required approvals. An agreement is now in place with SRZ for a 100% loss portfolio transfer for all losses incurred in accident years 2019 and 2020 and a new 100% quota share covers accident year 2021. The agreement substantially improves the SST ratio and is partly offset by the transfer of a USD 0.5bn subordinated loan to SRZ, as well as COVID-19-related losses incurred in 2020.
The ratio is calculated as SST risk-bearing capital (SST RBC) minus market value margin (MVM), divided by SST target capital (SST TC) minus MVM.
Solvency
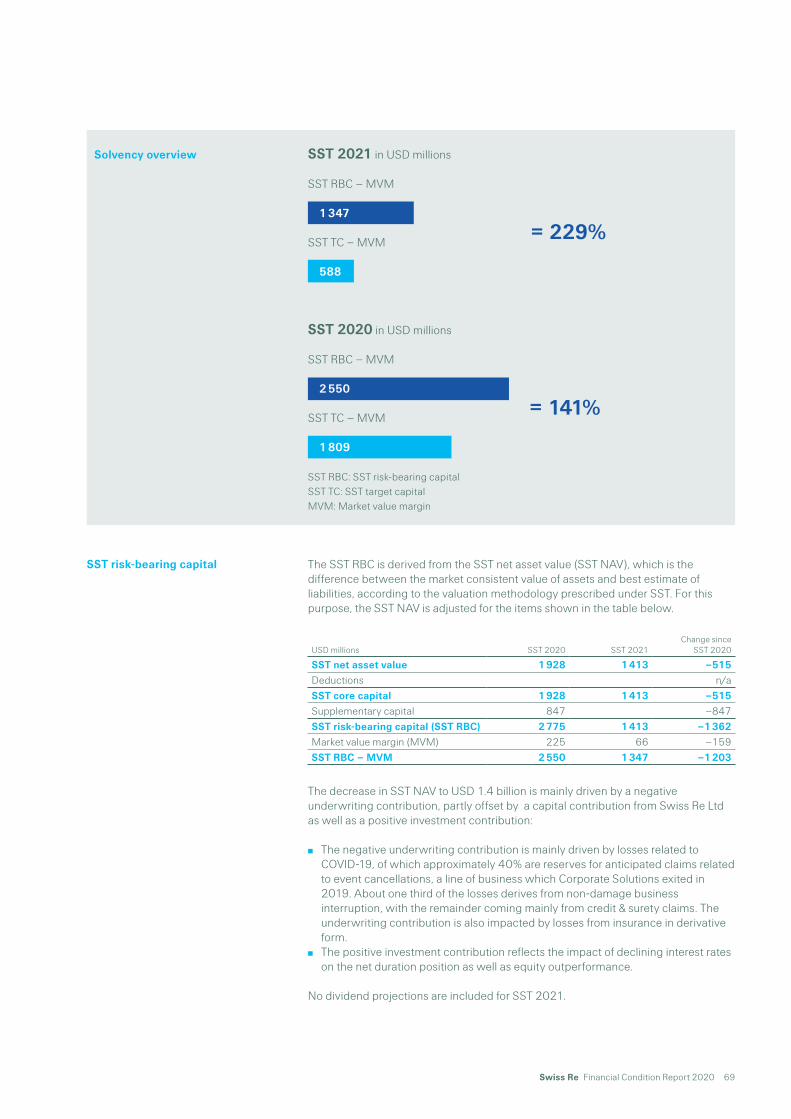
Swiss Re Financial Condition Report 2020 69
= 229%
= 141%
SST 2021 in USD millions
SST RBC – MVM
1 347
SST TC – MVM
588
SST 2020 in USD millions
SST RBC – MVM
2 550
SST TC – MVM
1 809
SST RBC: SST risk-bearing capitalSST TC: SST target capital MVM: Market value margin
The SST RBC is derived from the SST net asset value (SST NAV), which is the difference between the market consistent value of assets and best estimate of liabilities, according to the valuation methodology prescribed under SST. For this purpose, the SST NAV is adjusted for the items shown in the table below.
USD millions SST 2020 SST 2021Change since
SST 2020
SST net asset value 1 928 1 413 ‒515Deductions n/aSST core capital 1 928 1 413 ‒515Supplementary capital 847 ‒847SST risk-bearing capital (SST RBC) 2 775 1 413 ‒1 362Market value margin (MVM) 225 66 ‒159SST RBC – MVM 2 550 1 347 ‒1 203
The decrease in SST NAV to USD 1.4 billion is mainly driven by a negative underwriting contribution, partly offset by a capital contribution from Swiss Re Ltd as well as a positive investment contribution:
The negative underwriting contribution is mainly driven by losses related to COVID-19, of which approximately 40% are reserves for anticipated claims related to event cancellations, a line of business which Corporate Solutions exited in 2019. About one third of the losses derives from non-damage business interruption, with the remainder coming mainly from credit & surety claims. The underwriting contribution is also impacted by losses from insurance in derivative form.
The positive investment contribution reflects the impact of declining interest rates on the net duration position as well as equity outperformance.
No dividend projections are included for SST 2021.
Solvency overview
SST risk-bearing capital
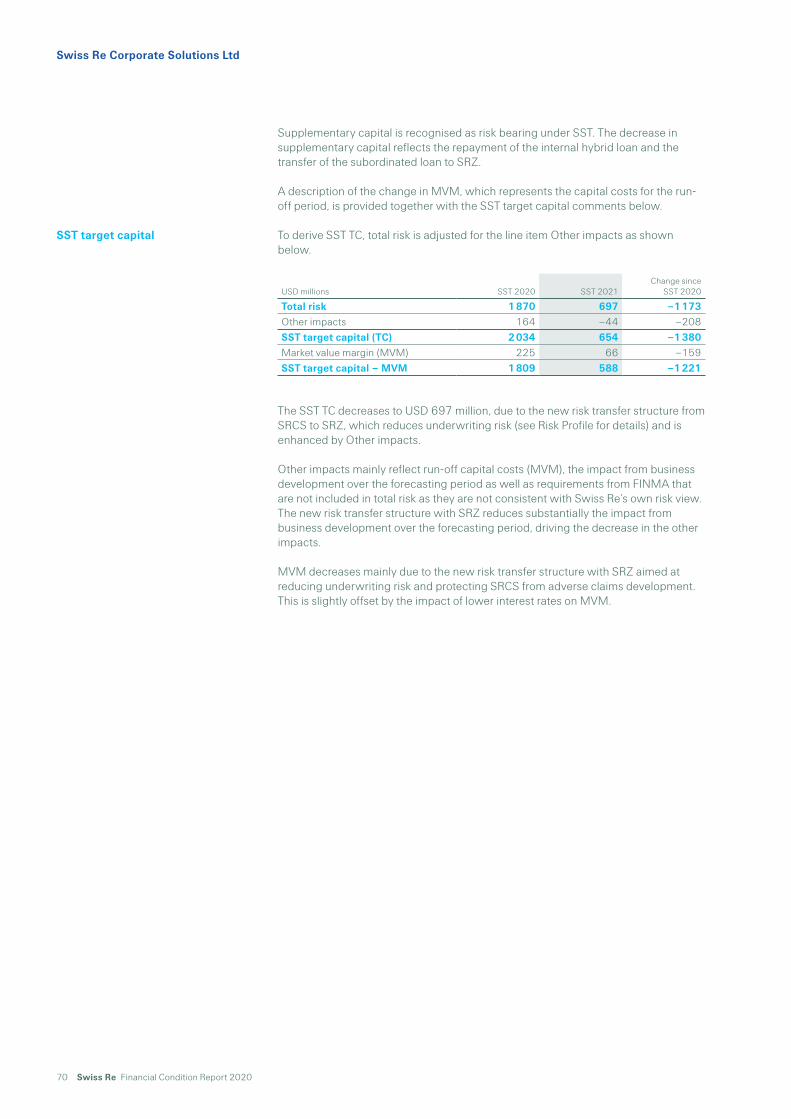
70 Swiss Re Financial Condition Report 2020
Swiss Re Corporate Solutions Ltd
Supplementary capital is recognised as risk bearing under SST. The decrease in supplementary capital reflects the repayment of the internal hybrid loan and the transfer of the subordinated loan to SRZ.
A description of the change in MVM, which represents the capital costs for the run-off period, is provided together with the SST target capital comments below.
To derive SST TC, total risk is adjusted for the line item Other impacts as shown below.
USD millions SST 2020 SST 2021Change since
SST 2020
Total risk 1 870 697 ‒1 173Other impacts 164 ‒44 ‒208SST target capital (TC) 2 034 654 ‒1 380Market value margin (MVM) 225 66 ‒159SST target capital – MVM 1 809 588 ‒1 221
The SST TC decreases to USD 697 million, due to the new risk transfer structure from SRCS to SRZ, which reduces underwriting risk (see Risk Profile for details) and is enhanced by Other impacts.
Other impacts mainly reflect run-off capital costs (MVM), the impact from business development over the forecasting period as well as requirements from FINMA that are not included in total risk as they are not consistent with Swiss Re’s own risk view. The new risk transfer structure with SRZ reduces substantially the impact from business development over the forecasting period, driving the decrease in the other impacts.
MVM decreases mainly due to the new risk transfer structure with SRZ aimed at reducing underwriting risk and protecting SRCS from adverse claims development. This is slightly offset by the impact of lower interest rates on MVM.
SST target capital

Swiss Re Financial Condition Report 2020 71
This page intentionally left blank

72 Swiss Re Financial Condition Report 2020
Swiss Re Financial Condition Report 2020 73
Swiss Re Nexus Reinsurance Company Ltd
Management summary 74
Business activities 76
Performance 78
Governance and risk management 81
Risk profile 83
Valuation 85
Capital management 89
Solvency 90

74 Swiss Re Financial Condition Report 2020
Swiss Re Nexus Reinsurance Company Ltd
Management summary
In SST 2021, the SST ratio of Swiss Re Nexus Reinsurance Company Ltd (SRN) increases to 205%, 36 points higher than in SST 2020. This change is driven by the restructure of SRN in November 2020.
Formerly an internal reinsurance carrier within Swiss Re’s Life Capital Business Unit under the name Swiss Re Life Capital Reinsurance Ltd (SRLC Re), SRLC Re was renamed to SRN in November 2020 and became an indirect subsidiary of SRZ. SRN now operates as a provider of reinsurance to other Swiss Re Group entities including SRZ, currently through proportional quota share coverage. This is reflected in the company’s balance sheet as well as its risk profile.
This Report provides qualitative and quantitative information about the financial condition of SRN.
SST 2021 in USD millions
SST RBC – MVM
4 152
SST TC – MVM
2 027
SST 2020 in USD millions
SST RBC – MVM
1 108
SST TC – MVM
658
SST RBC: SST risk-bearing capitalSST TC: SST target capital MVM: Market value margin
Solvency overview
= 205%
= 168%

Swiss Re Financial Condition Report 2020 75
In this section, we provide information about the business model, the strategy and significant events. > Read more
We present the performance of the year under review based on the Swiss statutory income statement. > Read more
This section provides an overview of the system of governance, key governing bodies, risk management systems and policies. > Read more
The main components of the total risk calculated under SST are discussed in this section. > Read more
In this section, we provide the SST balance sheet and additional quantitative and qualitative explanations on differences to the audited statutory financial statements of SRN. > Read more
SRN’s capital management strategy and key changes in 2020 are discussed in this section. > Read more
This section presents SRN’s SST calculation and includes explanations on changes compared to the prior year. > Read more
Business activities
Performance
Governance and risk management
Risk profile
Valuation
Capital management
Solvency

76 Swiss Re Financial Condition Report 2020
Swiss Re Nexus Reinsurance Company Ltd
Business activities
Strategy and prioritiesSRN has gone through fundamental changes in 2020, as a consequence of the disbandment of the Business Unit Life Capital and the business need to establish a second Swiss regulated carrier under Business Unit Reinsurance.
With effect from 13 November 2020, SRLC Re became a wholly owned subsidiary of Swiss Re Reinsurance Holding Company Ltd, a fully owned subsidiary of SRZ. All the shares of SRLC Re were sold from Swiss Re Life Capital Ltd to Swiss Re Reinsurance Holding Company Ltd, both belonging to Swiss Re Group and ultimately owned and controlled by Swiss Re Ltd.
With effect from 13 November 2020, SRLC Reʼs name was changed to SRN. SRN’s new purpose is to be a dedicated intra-group retrocession (IGR) carrier to enable a sustainable IGR structure for SRZ, its branches and to improve operational efficiency. SRN had no employees of its own.
OutlookSRN is an indirect subsidiary (100%) of SRZ and a FINMA licensed carrier. SRN now operates as a provider of reinsurance to other Swiss Re Group entities including SRZ to improve operational efficiency and to manage SRZ statutory capital volatility in a more sustainable way.
SRN’s priorities for 2021 include:
Further IGR restructurings are expected to take place in the course of 2021, to manage SRNʼs risk profile and capital strength.
To achieve its goal of being an IGR carrier within Swiss Re Group.
Strategy and prioritiesFinancial investments are managed in accordance with Swiss Re‘s Targeted Standard on Asset Management and SRN’s investment handbook, which are intended to ensure compliance with regulatory requirements. The general principle governing investment management in SRN is the creation of economic value based on returns relative to the liability benchmark, while adhering to the investment handbook and the general prudence principle. The liability benchmark is determined by approximating an investable benchmark from projected liability cash flows. A cash benchmark is used for the economic surplus.
OutlookThe global economy has seen a stronger-than-expected recovery after the pandemic-induced “sudden stop” in spring. However, the renewed COVID-19 waves in both the US and Europe, which occurred as the weather cooled, weighted on economic growth in the fourth quarter, resulting with a 2020 global real Gross Domestic Product (GDP) growth which will still be deeply negative.
Looking ahead, the global economy is expected to recover in 2021, although not all economies will reach pre-COVID-19 GDP levels this year. Inflationary pressure is expected to remain moderate even though base effects are likely to lead to a temporary increase in the very near term. In this environment, monetary policy is set to remain highly accommodative. Continued fiscal support is likely necessary to sustain the recovery.
Reinsurance business
Investments

Swiss Re Financial Condition Report 2020 77
SRN is a wholly-owned subsidiary of Swiss Re Reinsurance Holding Company Ltd. SRN is domiciled in Zurich, Switzerland.
Claims on and obligations towards affiliated companies CHF millions 2019 2020
Premiums and other receivables from reinsurance 1 400 1 565
Funds held by ceding companies 6 017 7 413Loans 20Other receivables 116 1 502Funds held under reinsurance treaties 1 068Reinsurance balances payable 1 167 667Other liabilities 20 51
None of these balances are towards the parent company Swiss Re Reinsurance Holding Company Ltd.
Share capital and major shareholderThe share capital of SRN amounted to CHF 10 million. It is divided into 10 000 registered shares, each with a nominal value of CHF 1 000. The shares were fully paid-in and held directly by Swiss Re Reinsurance Holding Company Ltd. As of 31 December 2019, SRN was a fully owned subsidiary of Swiss Re Reinsurance Holding Company Ltd.
Variable interest entitiesSRN has no off-balance sheet positions or risks transferred to special purpose vehicles.
As preparation for the sale of SRLC Re to Swiss Re Reinsurance Holding Company Ltd, on 13 November 2020 its direct and indirect subsidiaries were transferred via a dividend-in-kind contribution to its parent Swiss Re Life Capital Ltd.
In the last quarter of 2020, SRN recaptured a substantial share of Canada Life and Health in-force IGR (recapture of Canada L&H business) with SRZ, to establish an efficient and sustainable IGR setup for the Canadian L&H in-force business. To ensure a financially strong SRN carrier with a robust business mix, a new intra-group retrocession with SRZ has been set up to cover SRZ’s L&H business.
The recapture of Canada L&H business and new intra-group retrocession with SRZ were accompanied by capital contributions from SRZ.
In 2020 PricewaterhouseCoopers Ltd was the auditor of SRN. For more information, please see the Report of the statutory auditor.
Reinsurance and sub-holding companies
Significant events
Report of the statutory auditor

78 Swiss Re Financial Condition Report 2020 Swiss Re Financial Condition Report 2020 79
Swiss Re Nexus Reinsurance Company Ltd
Performance
Income statement – Swiss statutoryTotal Life Accident & Health Motor Property Casualty Miscellaneous
CHF millions 2019 2020 2019 2020 2019 2020 2019 2020 2019 2020 2019 2020 2019 2020
ReinsurancePremiums written gross 1 525 1 926 741 920 784 951 54 1Premiums written retroceded ‒430 ‒594 ‒470 ‒321 40 ‒225 ‒48Premiums written net 1 095 1 332 271 599 824 726 0 6 0 1 0 0 0 0Change in unearned premiums gross ‒4 ‒60 ‒5 ‒4 ‒8 ‒46 ‒1Change in unearned premiums retroceded ‒66 41 ‒66 41Premiums earned 1 025 1 313 271 594 754 718 0 1 0 0 0 0 0 0Other reinsurance revenues 595 393 535 353 60 40Total revenues from reinsurance business 1 620 1 706 805 947 815 758 0 1 0 0 0 0 0 0Claims paid and claim adjustment expenses gross ‒1 440 1 007 ‒756 844 ‒684 163Claims paid and claim adjustment expenses retroceded 489 1 405 320 890 169 515Change in unpaid claims and life and health benefits gross ‒10 ‒2 819 34 ‒1 703 ‒44 ‒1 110 ‒6Change in unpaid claims and life and health benefits retroceded ‒180 ‒1 008 ‒26 ‒713 ‒154 ‒301 6Change in unpaid claims for unit-linked life insuranceClaims incurred ‒1 141 ‒1 415 ‒427 ‒682 ‒714 ‒733 0 0 0 0 0 0 0 0Acquisition and operating costs gross ‒331 ‒425 ‒190 ‒258 ‒141 ‒165 ‒2Acquisition and operating costs retroceded 47 48 45 26 2 20 2Acquisition and operating costs net ‒284 ‒377 ‒145 ‒232 ‒139 ‒145 0 0 0 0 0 0 0 0Other reinsurance expenses ‒180 ‒1 034 ‒151 ‒737 ‒29 ‒297Total expenses from reinsurance business ‒1 605 ‒2 826 ‒723 ‒1 651 ‒882 ‒1 175 0 0 0 0 0 0 0 0Investment income 11 17Investment expenses ‒1 ‒222Investment result 10 ‒205 0 0 0 0 0 0 0 0 0 0 0 0Investment result from unit-linked life insuranceOther financial income 20 26Other financial expenses ‒17 ‒26Operating result 28 ‒1 325 0 0 0 0 0 0 0 0 0 0 0 0Interest expenses on debt and subordinated liabilitiesOther incomeOther expenses ‒9 ‒91Extraordinary income and expensesIncome before income tax expense 19 ‒1 416 0 0 0 0 0 0 0 0 0 0 0 0Income tax expense ‒12Net income/loss 7 ‒1 416 0 0 0 0 0 0 0 0 0 0 0 0
Total revenues and expenses from reinsurance business amounted to CHF ‒1 120 million in 2020, compared to CHF 15 million in 2019. The main drivers for results in 2020 were a new intra-group retrocession with SRZ and recapture of Canada L&H business. Additionally, 2020 was impacted by new business strain on the iptiQ open book businesses arising from continued growth, adverse experience and reserve strengthening in the open and closed book businesses.
Premiums earned increased from CHF 1 025 million in 2019 to CHF 1 313 million in 2020. The increase was predominately driven by a new intra-group retrocession with SRZ and recapture of Canada L&H business.
Other reinsurance revenues decreased from CHF 595 million in 2019 to CHF 393 million in 2020 mainly due to lower revenues from the closed book businesses and the recapture of retrocession arrangement with Swiss Re Life and Health Americas Inc. for the in-force businesses in 2019.
Reinsurance results Claims and claim adjustment expenses and life and health benefits increased from CHF 1 141 million in 2019 to CHF 1 415 million in 2020. The increase was driven by a new intra-group retrocession with SRZ, more exposure following recapture of Canada L&H business, adverse experience and reserve strengthening.
Acquisition and operating costs net increased from CHF 284 million in 2019 to CHF 377 million in 2020, mainly driven by a new intra-group retrocession with SRZ.
Other reinsurance expenses increased from CHF 180 million in 2019 to CHF 1 034 million in 2020 due to the costs related to the set up of a new intra-group retrocession with SRZ and recapture of Canada L&H business.

80 Swiss Re Financial Condition Report 2020
Investment result
Swiss Re Nexus Reinsurance Company Ltd
Investment result decreased from CHF 10 million in 2019 to CHF ‒205 million in 2020 largely due to the loss resulting from the transfer of the participations to Swiss Re Life Capital Ltd.
Investment result
CHF millions Income Value readjustments Realised gains 2020 Total
Investment incomeInvestments in subsidiaries and affiliated companiesFixed income securities 13 2 15Loans Short-term investments 1 1 2Other investments 1 0 1 2Income from investment servicesInvestment income 14 0 3 17
CHF millions Expenses Value readjustments Realised losses 2020 Total
Investment expensesInvestments in subsidiaries and affiliated companies –216 –216Fixed income securities –1 –1Loans Short-term investmentsOther investments 0 0 0 0Investment management expenses –1 –5Investment expenses –1 –216 –1 –222
Investment result –205
CHF millions Income Value readjustments Realised gains 2019 Total
Investment incomeInvestments in subsidiaries and affiliated companiesFixed income securities 9 1 10Loans Short-term investments 1 1Other investments 1 0 0 1Income from investment servicesInvestment income 10 0 1 11
CHF millions Expenses Value readjustments Realised losses 2019 Total
Investment expensesInvestments in subsidiaries and affiliated companiesFixed income securitiesLoans Short-term investmentsOther investments 0 0 0 0Investment management expenses –1 –1Investment expenses –1 0 0 –1
Investment result 10
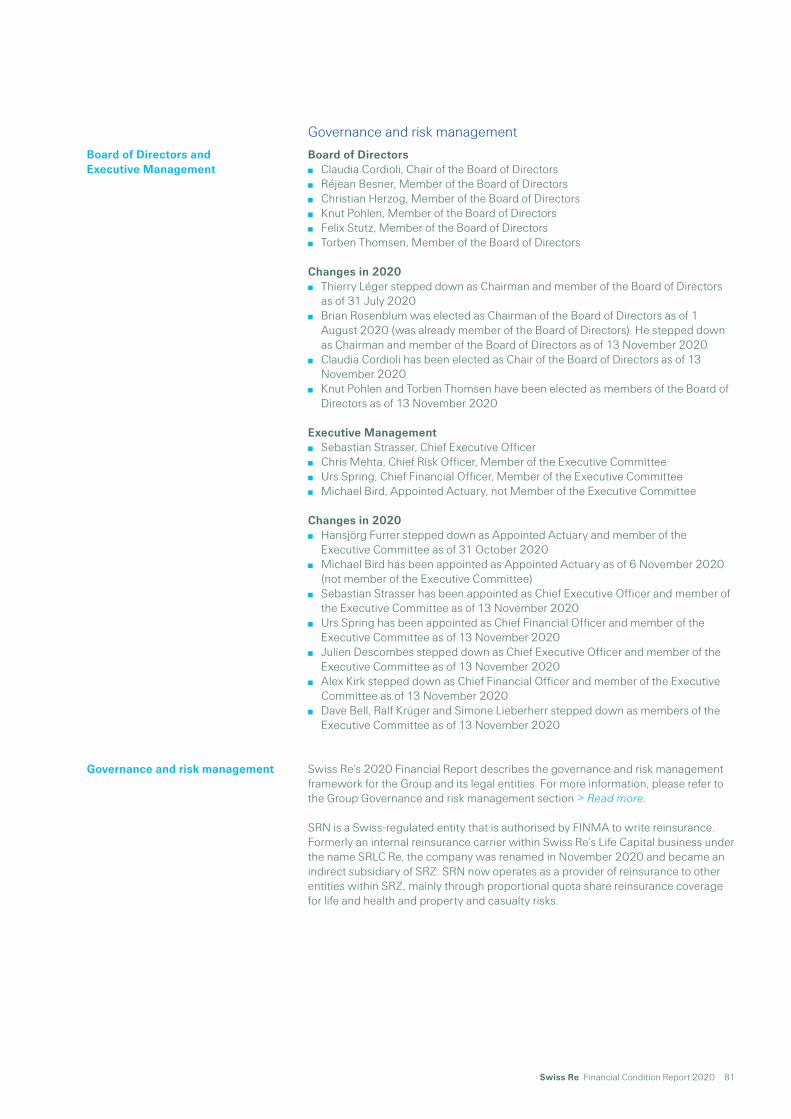
Swiss Re Financial Condition Report 2020 81
Governance and risk management
Board of Directors Claudia Cordioli, Chair of the Board of Directors Réjean Besner, Member of the Board of Directors Christian Herzog, Member of the Board of Directors Knut Pohlen, Member of the Board of Directors Felix Stutz, Member of the Board of Directors Torben Thomsen, Member of the Board of Directors
Changes in 2020 Thierry Léger stepped down as Chairman and member of the Board of Directors
as of 31 July 2020 Brian Rosenblum was elected as Chairman of the Board of Directors as of 1
August 2020 (was already member of the Board of Directors). He stepped down as Chairman and member of the Board of Directors as of 13 November 2020
Claudia Cordioli has been elected as Chair of the Board of Directors as of 13 November 2020
Knut Pohlen and Torben Thomsen have been elected as members of the Board of Directors as of 13 November 2020
Executive Management Sebastian Strasser, Chief Executive Officer Chris Mehta, Chief Risk Officer, Member of the Executive Committee Urs Spring, Chief Financial Officer, Member of the Executive Committee Michael Bird, Appointed Actuary, not Member of the Executive Committee
Changes in 2020 Hansjörg Furrer stepped down as Appointed Actuary and member of the
Executive Committee as of 31 October 2020 Michael Bird has been appointed as Appointed Actuary as of 6 November 2020
(not member of the Executive Committee) Sebastian Strasser has been appointed as Chief Executive Officer and member of
the Executive Committee as of 13 November 2020 Urs Spring has been appointed as Chief Financial Officer and member of the
Executive Committee as of 13 November 2020 Julien Descombes stepped down as Chief Executive Officer and member of the
Executive Committee as of 13 November 2020 Alex Kirk stepped down as Chief Financial Officer and member of the Executive
Committee as of 13 November 2020 Dave Bell, Ralf Krüger and Simone Lieberherr stepped down as members of the
Executive Committee as of 13 November 2020
Swiss Re’s 2020 Financial Report describes the governance and risk management framework for the Group and its legal entities. For more information, please refer to the Group Governance and risk management section > Read more.
SRN is a Swiss-regulated entity that is authorised by FINMA to write reinsurance. Formerly an internal reinsurance carrier within Swiss Re’s Life Capital business under the name SRLC Re, the company was renamed in November 2020 and became an indirect subsidiary of SRZ. SRN now operates as a provider of reinsurance to other entities within SRZ, mainly through proportional quota share reinsurance coverage for life and health and property and casualty risks.
Board of Directors and Executive Management
Governance and risk management
82 Swiss Re Financial Condition Report 2020
Swiss Re Nexus Reinsurance Company Ltd
SRN has set out its risk governance, responsibilities, risk appetite and risk limits in the SRN Risk Management Standards. These standards are reviewed annually or in the event of a significant change in the business structure or governance arrangements of the company. They have been issued by the SRN Board as an addendum to the Group and SRN risk documents.
As a “Level I” classified legal entity, SRN is subject to enhanced governance requirements which includes the following requirements:
Develop and maintain corporate and risk governance documentation that governs the responsibilities of the legal entity Board, committees and management
Establish committee(s) covering Audit, as well as Finance and Risk, to support the legal entity Board in performing its oversight responsibility for risk and capital steering
Designate a Chief Risk Officer and Chief Financial Officer
All risk-related activities of SRN are subject to Swiss Re’s risk management framework, which includes:
A clear separation of management and Board supervision, representation of external directors and governance documentation to establish the roles and responsibilities of the company’s governing bodies.
An independent Risk Management function responsible for risk oversight and control across Swiss Re and comprises dedicated risk teams for legal entities and regions, as well as central teams that provide specialised risk expertise and oversight.
A clearly defined risk control framework which comprises a body of standards that establish an internal control system for taking and managing risk.
In addition, SRN fully adopts Swiss Re’s risk management principles, including roles for delegated risk-taking and oversight, as well as risk culture and behaviour.
Moreover, risk management activities at SRN are complemented by Swiss Re’s Group Internal Audit and Compliance units.

Swiss Re Financial Condition Report 2020 83
Risk profile
SRN is exposed to insurance and financial risks, as well as other risks that are not explicitly part of the economic capital requirement but are actively monitored and controlled due to their significance for the entity. These include operational, liquidity, model, valuation, regulatory, political and strategic risks (see Swiss Re’s risk landscape, 2020 Financial Report, page 68).
On the insurance risk side, SRN is exposed to life and health risk, which is dominated by mortality trend risk and also driven by lapse, lethal pandemic and critical illness risk. Property and casualty risks are currently not material.
The financial risk of SRN arises from both financial market risk and credit risk. Key drivers of financial market risk are foreign exchange, credit spread and interest rate risk. Credit risk is mainly driven by the default risk on fixed income products.
Total risk is based on 99% tail value-at-risk (tail VaR) and represents the average unexpected loss that occurs with a frequency of less than once in 100 years over a one-year time horizon.
USD millions SST 2020 SST 2021Change since
SST 2020
Property and casualty n/aLife and health 522 2 005 1 483Financial market 364 986 622Credit1 81 124 43Diversification –309 ‒884 ‒575Total risk 658 2 232 1 575
1 Credit comprises credit default and migration risk from both asset management and underwriting. It excludes credit spread risk, which is part of financial market risk.
Total risk increases to USD 2.2 billion, driven by higher life and health risk, which reflects increased risk exposure following the restructure of SRN.
Swiss Re’s internal model takes account of the accumulation and diversification between individual risks. The effect of diversification at the category level, which is shown in the table above, represents the difference between total risk (the company’s 99% tail VaR) and the sum of standalone tail VaR amounts for the individual risk categories. This amount does not reflect diversification within risk categories. The extent of diversification is largely determined by the selected level of aggregation – the higher the aggregation level, the lower the diversification effect.
SRN uses a Group-wide risk matrix methodology and Swiss Re’s Global Risk Register to capture operational risks. The matrix in particular focuses on risks approaching or exceeding SRN’s own risk tolerance as they require management actions. Adherence to risk tolerance is monitored and reported at least on a quarterly basis. The overall control environment within SRN remains adequate.
Key focus areas of the SRN’s operational risk management include project-related risks, related to the transition of SRN into a subsidiary of SRZ.
For details on other significant risks, including liquidity, model, valuation, regulatory, political, strategic and sustainability risks, see the Group’s 2020 Financial Report sections on Liquidity Management on page 60, Swiss Re’s risk landscape on pages 68–69, and Management of other significant risks on pages 74–77.
Total risk
Operational risk
Other significant risks

84 Swiss Re Financial Condition Report 2020
Swiss Re Nexus Reinsurance Company Ltd
Among tested financial market sensitivities, the SRN’s SST ratio is most sensitive to a 50-basis point decrease in interest rates.
SRN manages and controls its risks through a limit framework.
Risk concentration
Risk mitigation

Swiss Re Financial Condition Report 2020 85
Valuation
The SST balance sheet is prepared based on the same market-consistent valuation principles as applied in Swiss Re’s internal EVM framework. EVM is therefore used as a basis for preparing the SST balance sheet and valuation adjustments to EVM mainly affect capital costs and deferred taxes. The difference between assets and liabilities is defined as the SST net asset value, which is the basis for the calculation of the SST RBC.
The SST valuation methodology is further described in the > Appendix of this Report.
SST balance sheet
USD millions Notes SST 2020 SST 2021Change since
SST 2020
Market-consistent value of investments
Real estate n/aParticipations 1 312 ‒312 Fixed-income securities 2 634 2 065 1 431 Loans 3 21 ‒21 Mortgages n/aEquities n/aOther investments 38 43 5 Collective investment schemes n/a Alternative investments n/a Structured products n/a Other investments 38 43 5 Total investments 1 005 2 109 1 103
Market-consistent value of other assets
Financial investments from unit-linked life insurance n/aReceivables from derivative financial instruments 3 1 ‒2 Deposits made under assumed reinsurance contracts 4 6 198 13 182 6 984 Cash and cash equivalents 56 14 ‒42 Reinsurers‘ share of best estimate of provisions for insurance liabilities
5 –273 160 433
Direct insurance: life insurance business (excluding unit-linked life insurance)
n/a
Reinsurance: life insurance business (excluding unit-linked life insurance)
–273 80 353
Direct insurance: non-life insurance business n/a Direct insurance: health insurance business n/a Reinsurance: non-life insurance business 80 80 Reinsurance: health insurance business n/a Direct insurance: other business n/a Reinsurance: other business n/a Direct insurance: unit-linked life insurance business n/a Reinsurance: unit-linked life insurance business n/aFixed assets n/aDeferred acquisition costs n/aIntangible assets n/aReceivables from insurance business 6 1 445 1 788 342 Other receivables 7 109 1 668 1 559 Other assets n/aUnpaid share capital n/aAccrued assets n/aTotal other assets 7 538 16 812 9 274
Total market-consistent value of assets 8 544 18 921 10 377

86 Swiss Re Financial Condition Report 2020
Swiss Re Nexus Reinsurance Company Ltd
USD millions Notes SST 2020 SST 2021Change since
SST 2020
BEL: Best estimate of liabilities (including unit-linked life insurance)
Best estimate of provisions for insurance liabilities 8 4 831 11 875 7 043 Direct insurance: life insurance business (excluding unit-linked life
insurance) n/a
Reinsurance: life insurance business (excluding unit-linked life insurance)
4 831 11 784 6 952
Direct insurance: non-life insurance business n/a Direct insurance: health insurance business n/a Reinsurance: non-life insurance business 91 91 Reinsurance: health insurance business n/a Direct insurance: other business n/a Reinsurance: other business n/aBest estimate of provisions for unit-linked life insurance liabilities 0 0 0 Direct insurance: unit-linked life insurance business n/a Reinsurance: unit-linked life insurance business n/a
Market-consistent value of other liabilities
Non-technical provisions 24 31 7 Interest-bearing liabilities n/aLiabilities from derivative financial instruments 3 1 ‒2 Deposits retained on ceded reinsurance 9 1 149 0 ‒1 149 Liabilities from insurance business 10 1 220 749 ‒471 Other liabilities 3 6 3 Accrued liabilities 1 2 1 Subordinated debts n/a
Total BEL plus market-consistent value of other liabilities 7 231 12 664 5 433 Market-consistent value of assets minus total from BEL 1 313 6 257 4 944
Notes1. The decrease in participations reflects the Business Unit Life Capital reorganisation.2. The increase in fixed income securities is largely driven by the capital contribution received in the form of fixed income securities
accompanying the recapture of Canada L&H business.3. The decrease in loans reflects the repayment of a subordinated loan from Elips Life AG.4. The increase in deposits made under assumed reinsurance contracts relates mainly to a methodology change of closed book US business
(offset in best estimate of provisions for insurance liabilities, see Note 8), a new intra-group retrocession with SRZ and recapture of Canada L&H business.
5. The increase of reinsurers‘ share of best estimate of provisions for insurance liabilities is mainly driven by the retrocession arrangements with SRZ on iptiQ open book businesses.
6. The increase of receivables from insurance business is mainly driven by the outstanding settlement related to the new intra-group retrocession with SRZ.
7. The increase of other receivables relates to a higher cash pooling balance, largely denominated in US dollar.8. The increase of best estimate of provisions for insurance liabilities relates mainly to a methodology change of closed book US business
(offset in deposits made under assumed reinsurance contracts, see Note 4), as well as to a new intra-group retrocession with SRZ and recapture of Canada L&H business.
9. The decrease of deposits retained on ceded reinsurance is due to recapture of Canada L&H business.10. The decrease of liabilities from insurance business largely relates to recapture of Canada L&H business and retrocession arrangements with
SRZ on iptiQ open book businesses.

Swiss Re Financial Condition Report 2020 87
The SST balance sheet comparison with the audited Swiss statutory financial statements provides insights on the main valuation and scope differences.
An overview of the main valuation and scope differences and the definition of the aggregated line items are included in the > Appendix of this Report.
Fixed income securitiesDifferences in scope: In SST, fixed income securities are defined on the basis of the remaining duration at time of purchase. Statutory reporting classifies fixed income securities on the basis of initial duration.
Differences in valuation: SST carries fixed income securities at market value. Under statutory reporting, fixed income securities are valued at their amortised cost less necessary depreciation to address other than temporary market value decreases.
Other investmentsDifferences in scope: In SST, short-term investments are defined on the basis of the remaining duration at time of purchase. Statutory reporting classifies short-term investments between cash and cash equivalents and other investments on the basis of initial duration.
Cash and cash equivalentsDifferences in scope: In SST, short-term investments are defined based on the remaining duration at time of purchase, while statutory reporting classifies these investments based on the initial duration into short-term investments or cash and cash equivalents.
Funds held by ceding companies and other receivables from reinsuranceDifferences in valuation: In SST, funds held by ceding companies for which an interest is credited are valued by discounting future estimated cash flows at risk-free rates. Under statutory reporting, funds held are generally measured at the consideration received or at market value of the underlying assets. In SST, the balance of the policy loans for corporate-owned life insurance is included in funds held, while in statutory reporting funds held include only the contractual cash deposits. In statutory reporting, receivables from reinsurance include the receivable on deposit accounted business, while in SST this is part of the best estimate liabilities.
Reinsurance recoverable from retrocessions Differences in valuation: Same principles apply as for re/insurance liabilities before retrocession described below.
SST balance sheet comparison with Swiss statutory
Assets
USD millions Swiss Statutory SST Difference
Real estate n/aInvestments in subsidiaries and affiliated companies n/aFixed income securities 1 983 2 065 82Loans n/aMortgages n/aEquity securities n/aOther investments 50 43 –7Investments for unit-linked and with-profit business n/aCash and cash equivalents 1 14 13Funds held by ceding companies and other receivables from reinsurance 10 158 14 970 4 813Reinsurance recoverable from retrocessions 142 160 18Other assets 1 723 1 669 –54Total assets 14 056 18 921 4 865

88 Swiss Re Financial Condition Report 2020
Swiss Re Nexus Reinsurance Company Ltd
Other assetsDifferences in valuation: In SST, other assets are measured at fair value. Under statutory reporting, other assets are generally carried at nominal value. Derivative financial instruments in statutory reporting are generally accounted based on the lower of cost or market principle under Swiss Company Law. Deferred acquisition costs are not valued for SST.
Re/insurance liabilities before retrocessionDifferences in valuation: SST uses best estimates to value the reinsurance liabilities without specific margin for prudence. Statutory reporting values reinsurance liabilities at best estimates and requires provisions for adverse deviations. Other valuation differences arise from the discounting of the liability cash flows. In SST, liabilities are generally discounted using current market risk-free rates. Under statutory reporting, discounting of life and health technical provisions generally uses asset-consistent yields, whereas there is generally no discounting for non-life business. It should also be noted that in some instances certain additional methodological differences may exist between the two valuation bases.
For more details on the general differences in valuation of re/insurance liabilities, please refer to the table in the methodology section in the > Appendix.
Other liabilitiesDifferences in valuation: In SST, no specific provision is made for currency fluctuations. Under statutory reporting, a provision for currency fluctuation comprises the net effect of foreign exchange gains and losses arising from the revaluation of the opening balance sheet and the translation adjustment of the income statement from average to closing exchange rates at year-end. Derivative financial instruments are measured at fair value under SST. Under statutory reporting, derivatives are generally valued based on the lower of cost or market principle under Swiss Company Law.
Liabilities
USD millions Swiss Statutory SST Difference
Re/insurance liabilities before retrocession 10 595 11 875 1 279Unit-linked and with-profit liabilities n/aDebt n/aFunds held under reinsurance treaties n/aOther liabilities 841 790 –51Total liabilities 11 436 12 664 1 228

Swiss Re Financial Condition Report 2020 89
Capital management
SRN has established a capital target based on SST capital, in line with the Group approach to capitalising subsidiaries. This is used as a basis for capital planning and determining capital management actions. The entity is expected to operate in a range around the target, with any deficits addressed through capital contributions from Group or other actions.
Shareholder’s equity increased from CHF 587 million as of 31 December 2019 to CHF 2 316 million as of 31 December 2020.
The increase was driven by the capital contributions of CHF 3 594 million, partly offset by the net loss for the financial year 2020 of CHF ‒1 416 million and the transfer of the participations to Swiss Re Life Capital Ltd in the form of a dividend-in-kind of CHF ‒449 million.
Change in shareholder‘s equity
CHF millionsShare
Capital
Legal capital
reserves
Legal profit
reserves
Voluntary profit
reserves
Retained earnings brought forward
Net income for the
financial year
Total Shareholder’s
equity
Shareholder’s equity 1.1.2019 10 70 161 3 42 286Allocations relating to AGM decision 2018 –65 110 –3 –42Dividend for the financial year 2019 –150 –150Capital contributions allocated to legal reserves from capital contribution
444 444
Capital contributions allocated to voluntary profit reservesNet income/loss for the financial year 7 7Shareholder’s equity 31.12.2019 10 449 0 121 0 7 587
Shareholder’s equity 1.1.2020 10 449 121 7 587Allocations relating to AGM decision 2019 –444 451 –7 0Dividend-in-kind for financial year 20201 –449 –449Capital contributions allocated to legal reserves from capital contribution
279 279
Capital contributions allocated to voluntary profit reserves 3 315 3 315Net income/loss for the financial year –1 416 –1 416Shareholder’s equity 31.12.2020 10 284 3 438 ‒1 416 2 316
1 Dividend-in-kind reflecting the transfer of direct and indirect subsidiaries to Swiss Re Life Capital Ltd.
Shareholder’s equity

90 Swiss Re Financial Condition Report 2020
Swiss Re Nexus Reinsurance Company Ltd
Solvency
SRN uses an internal risk model to determine the economic capital required to support the risks on SRN’s book, as well as to allocate risk-taking capacity to the different lines of business. The model also provides the basis for capital cost allocation in Swiss Re’s EVM framework, which is used for pricing, profitability evaluation and compensation decisions. In addition to these internal purposes, the model is used to determine regulatory capital requirements under economic solvency frameworks such as the SST and Solvency II.
For more information, please see the Internal control system and risk model section of the 2020 Financial Report.
In 2017, FINMA approved Swiss Re’s internal model and its components for SST reporting purposes under their revised model review process.
Since SST 2020, two major internal model changes have been implemented; both changes were approved by FINMA in October 2020:
Market value margin – To improve market consistency and more adequately reflect differences between interest rates of different currencies, two changes have been made: discounting in original currencies and using forward rates to discount to future years.
Lapse risk – The model has been further strengthened by including additional dependencies and correlations, as well as anti-selective lapses for lapse trend.
In SST 2021, the SST ratio of SRN increases to 205%, 36 points higher than in SST 2020. This change is driven by the restructure of SRN in November 2020.
The ratio is calculated as SST risk-bearing capital (SST RBC) minus market value margin (MVM), divided by SST target capital (SST TC) minus MVM.
Solvency

Swiss Re Financial Condition Report 2020 91
= 205%
= 168%
SST 2021 in USD millions
SST RBC – MVM
4152
SST TC – MVM
2027
SST 2020 in USD millions
SST RBC – MVM
1 108
SST TC – MVM
658
SST RBC: SST risk-bearing capitalSST TC: SST target capital MVM: Market value margin
The SST RBC is derived from the SST net asset value (SST NAV), which represents the difference between the market consistent value of assets and best estimate of liabilities, according to the valuation methodology prescribed under SST. For this purpose, the SST NAV is adjusted for the items shown in the table below.
USD millions SST 2020 SST 2021Change since
SST 2020
SST net asset value 1 313 6 257 4 944Deductions n/aSST core capital 1 313 6 257 4 944Supplementary capital n/aSST risk-bearing capital (SST RBC) 1 313 6 257 4 944Market value margin (MVM) 205 2 105 1 900SST RBC – MVM 1 108 4 152 3 044
Solvency overview
SST risk-bearing capital

92 Swiss Re Financial Condition Report 2020
Swiss Re Nexus Reinsurance Company Ltd
The increase in SST NAV to USD 6.3 billion is driven by an increase in total risk exposure following the restructure of SRN:
The restructure captures the impact of a new inwards intra-group retrocession and the recapture of an existing outwards intra-group retrocession. It further captures the transfer of subsidiaries from SRN to its former parent, Swiss Re Life Capital Ltd.
These changes were accompanied by capital contributions from SRZ.
No dividend projection is included for SST 2021.
SRN has no supplementary capital.
A description of the change in MVM, which represents the capital costs for the run-off period, is provided together with the SST target capital comments below.
To derive SST TC, total risk is adjusted for the line item Other impacts as shown below.
USD millions SST 2020 SST 2021Change since
SST 2020
Total risk 658 2 232 1 575Other impacts 205 1 900 1 695SST target capital (TC) 863 4 132 3 269Market value margin (MVM) 205 2 105 1 900SST target capital – MVM 658 2 027 1 369
SST TC increases to USD 4.1 billion, reflecting higher total exposure risk following the restructure of SRN (see Risk profile for details > Read more).
Other impacts mainly reflect run-off capital costs (MVM), the impact from business development over the forecasting period as well as requirements from FINMA that are not included in total risk as they are not consistent with Swiss Re’s own risk view.
The increase in MVM is mainly driven by the increase in mortality trend risk following the recapture of an outwards retrocession.
SST target capital

Swiss Re Financial Condition Report 2020 93
This page intentionally left blank

94 Swiss Re Financial Condition Report 2020

Swiss Re Financial Condition Report 2020 95
Swiss Re International SE Zurich branch
Management summary 96
Business activities 97
Performance 98

96 Swiss Re Financial Condition Report 2020
Swiss Re International SE Zurich branch
Management summary
Swiss Re International SE, Luxembourg, Zurich branch (SRI SE Zurich branch), domiciled in Zurich, Switzerland, is a re/insurance branch within the Swiss Re Group. SRI SE Zurich branch engages in Swiss and foreign commercial re/insurance business.
SRI SE Zurich branch is part of Swiss Re International SE, Luxembourg which is regulated by the Commissariat aux Assurances, the Luxembourg insurance supervisory authority. SRI SE Zurich branch is also locally supervised by FINMA, the Swiss insurance supervisory authority. Information about the solvency position of Swiss Re International SE, Luxembourg is disclosed according to Luxembourg regulations only. Swiss regulations do not require the disclosure of solvency information of SRI SE Zurich branch in this Report.
This Report provides qualitative and quantitative information about the statutory financial condition of SRI SE Zurich branch.
In this section, we provide information about the business model, the strategy and significant events. > Read more
We present the performance of the year under review based on the Swiss statutory income statement. > Read more
Business activities
Performance

Swiss Re Financial Condition Report 2020 97
Business activities
Strategy and prioritiesSRI SE Zurich branch, through its branches, conducts re/insurance business and is committed to deliver long-term profitability and economic growth. It offers customised, innovative and multi-line, multi-year risk transfer solutions, taking into account the unique needs of local markets and specialty industries.
OutlookThe commercial insurance market experienced significant price gains through 2020 continuing the trend started in 2019. Corporate Solutions expects market hardening to continue in 2021, but to potentially slow by end of the year as pricing deficiencies close and capital re-enters the market.
Strategy and prioritiesFinancial investments are managed in accordance with Swiss Re‘s Targeted Standard on Asset Management and SRI SE Zurich branch’s investment guidelines, which are intended to ensure compliance with regulatory requirements. The general principle governing investment management in SRI SE Zurich branch is the creation of economic value on the basis of returns relative to the liability benchmark, while adhering to the investment guidelines and the general prudence principle. The liability benchmark is determined by approximating an investable benchmark from projected liability cash flows.
OutlookThe global economy has seen a stronger-than-expected recovery after the pandemic-induced “sudden stop” in spring. However, the renewed COVID-19 waves in both the US and Europe, which occurred as the weather cooled, weighed on economic growth in the fourth quarter, resulting with a 2020 global real Gross Domestic Product (GDP) growth which will still be deeply negative.
Looking ahead, the global economy is expected to recover in 2021, although not all economies will reach pre-COVID-19 GDP levels this year. Inflationary pressure is expected to remain moderate even though base effects are likely to lead to a temporary increase in the very near term. In this environment, monetary policy is set to remain highly accommodative. Continued fiscal support is likely necessary to sustain the recovery.
SRI SE Zurich branch, domiciled in Zurich, Switzerland, is a re/insurance branch within the Swiss Re Group. SRI SE Zurich branch is part of Swiss Re International SE, Luxembourg.
Re/insurance strategy and priorities
Investments
Re/insurance and holding company
Claims on and obligations towards affiliated companies
CHF thousandsParent
companies 2019Other Group
companies 2019Parent
companies 2020Other Group
companies 2020
Premiums and other receivables from re/insurance 7 437 200 26 689 182Other receivables 32 081 330Re/insurance balances payable 73 136 63 83 883 90Other liabilities 11 162 –11 365 9 377 10 658
In 2020 PricewaterhouseCoopers Ltd was the auditor of SRI SE Zurich branch. For more information, please see the Report of the statutory auditor.
Report of the statutory auditor

98 Swiss Re Financial Condition Report 2020
Swiss Re International SE Zurich branch
Performance
Income statement – Swiss statutory
CHF millions 2019 2020
Premiums written gross 152 155Premiums written retroceded –137 –141Premiums written net 15 14Change in unearned premiums gross 6 4Change in unearned premiums retroceded –6 –3Premiums earned 15 15
Other re/insurance revenuesTotal revenues from re/insurance business 15 15Claims paid and claim adjustment expenses gross –82 –128Claims paid and claim adjustment expenses retroceded 80 120Change in unpaid claims gross –105 –23Change in unpaid claims retroceded 93 18Change in unpaid claims for unit-linked life insuranceClaims incurred –14 –13Acquisition and operating costs gross –39 –29Acquisition and operating costs retroceded 35 28Acquisition and operating costs net –4 –1Other re/insurance expensesTotal expenses from re/insurance business –18 –14Investment income 1 1Investment expenses
Investment result 1 1Investment result from unit-linked life insuranceOther financial incomeOther financial expensesOperating result –2 2Interest expenses on debt and subordinated liabilitiesOther income 5 1Other expenses –1 –5
Extraordinary income and expensesIncome before income tax expense 2 –2Income tax expenseNet income 2 –2

Swiss Re Financial Condition Report 2020 99
This page intentionally left blank
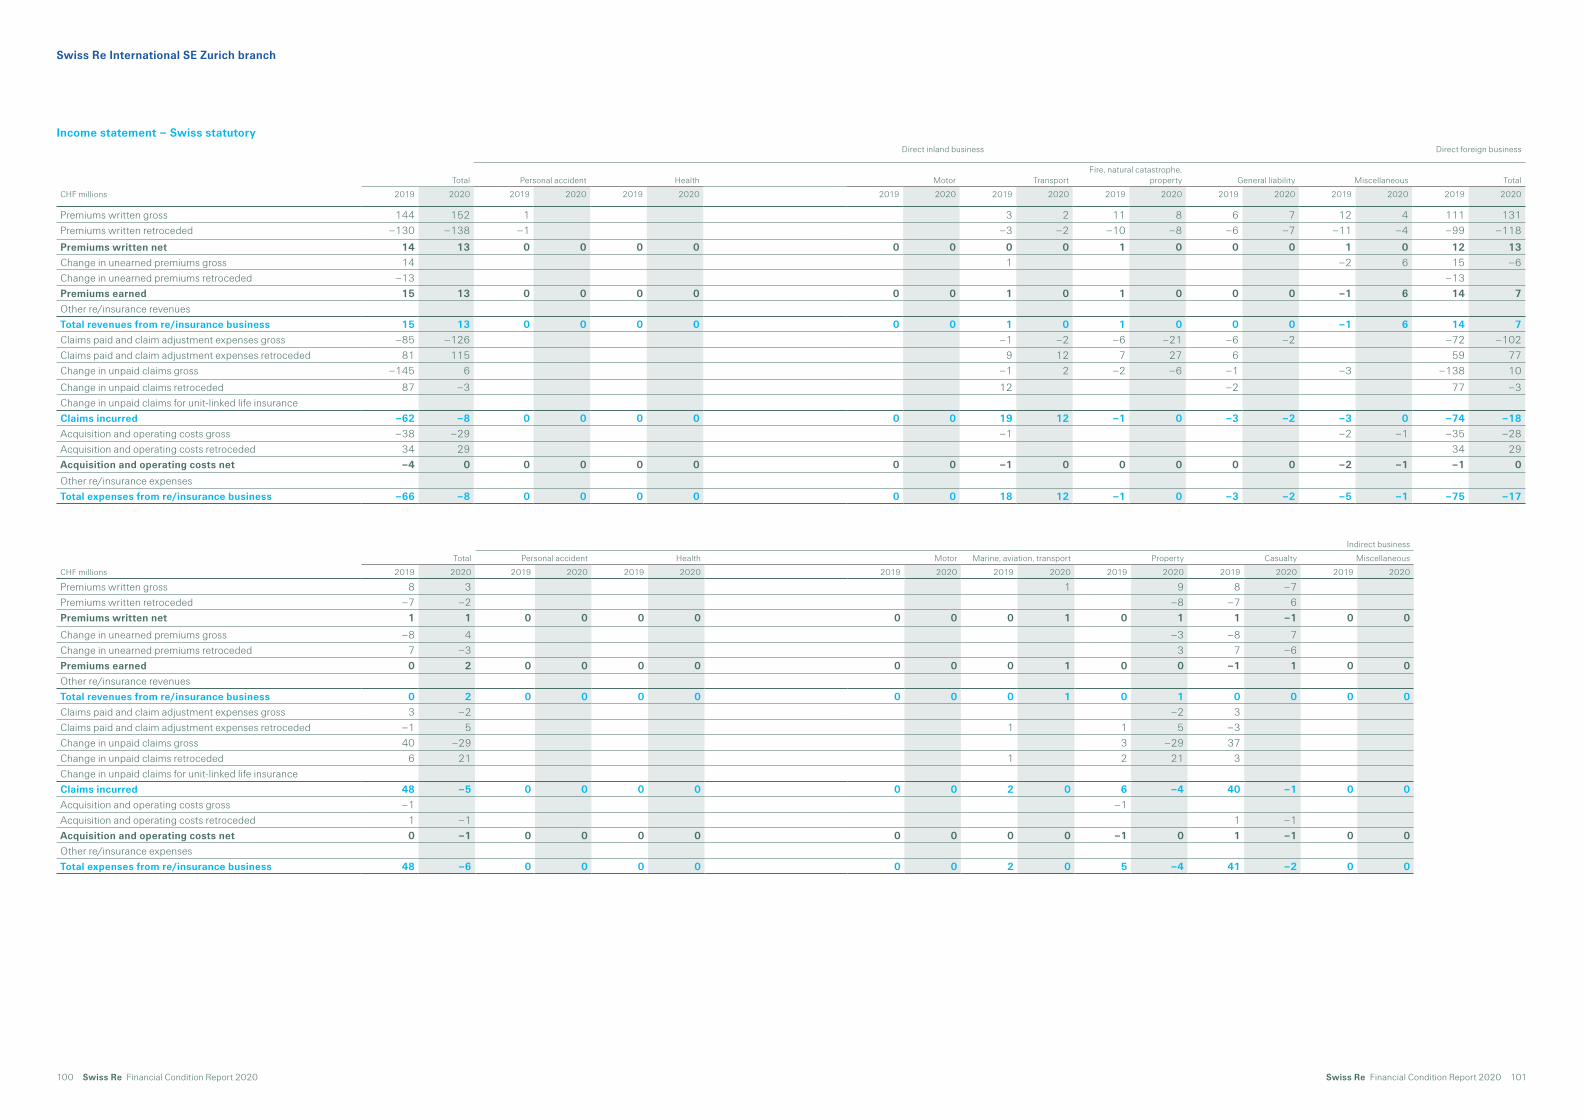
100 Swiss Re Financial Condition Report 2020 Swiss Re Financial Condition Report 2020 101
Swiss Re International SE Zurich branch
Income statement – Swiss statutoryDirect inland business Direct foreign business
Total Personal accident Health Motor TransportFire, natural catastrophe,
property General liability Miscellaneous Total
CHF millions 2019 2020 2019 2020 2019 2020 2019 2020 2019 2020 2019 2020 2019 2020 2019 2020 2019 2020
Premiums written gross 144 152 1 3 2 11 8 6 7 12 4 111 131Premiums written retroceded –130 –138 –1 –3 –2 –10 –8 –6 –7 –11 –4 –99 –118
Premiums written net 14 13 0 0 0 0 0 0 0 0 1 0 0 0 1 0 12 13Change in unearned premiums gross 14 1 –2 6 15 –6Change in unearned premiums retroceded –13 –13Premiums earned 15 13 0 0 0 0 0 0 1 0 1 0 0 0 ‒1 6 14 7Other re/insurance revenuesTotal revenues from re/insurance business 15 13 0 0 0 0 0 0 1 0 1 0 0 0 ‒1 6 14 7Claims paid and claim adjustment expenses gross –85 ‒126 –1 ‒2 –6 –21 –6 –2 –72 ‒102Claims paid and claim adjustment expenses retroceded 81 115 9 12 7 27 6 59 77Change in unpaid claims gross –145 6 –1 2 –2 –6 –1 –3 –138 10
Change in unpaid claims retroceded 87 ‒3 12 –2 77 ‒3Change in unpaid claims for unit-linked life insuranceClaims incurred –62 ‒8 0 0 0 0 0 0 19 12 ‒1 0 ‒3 ‒2 ‒3 0 ‒74 ‒18Acquisition and operating costs gross –38 ‒29 –1 –2 ‒1 –35 ‒28Acquisition and operating costs retroceded 34 29 34 29Acquisition and operating costs net –4 0 0 0 0 0 0 0 ‒1 0 0 0 0 0 ‒2 ‒1 ‒1 0
Other re/insurance expensesTotal expenses from re/insurance business –66 ‒8 0 0 0 0 0 0 18 12 ‒1 0 ‒3 ‒2 ‒5 ‒1 ‒75 ‒17
Indirect business
Total Personal accident Health Motor Marine, aviation, transport Property Casualty Miscellaneous
CHF millions 2019 2020 2019 2020 2019 2020 2019 2020 2019 2020 2019 2020 2019 2020 2019 2020
Premiums written gross 8 3 1 9 8 ‒7Premiums written retroceded –7 ‒2 ‒8 –7 6Premiums written net 1 1 0 0 0 0 0 0 0 1 0 1 1 ‒1 0 0
Change in unearned premiums gross –8 4 ‒3 –8 7Change in unearned premiums retroceded 7 ‒3 3 7 ‒6Premiums earned 0 2 0 0 0 0 0 0 0 1 0 0 ‒1 1 0 0Other re/insurance revenuesTotal revenues from re/insurance business 0 2 0 0 0 0 0 0 0 1 0 1 0 0 0 0Claims paid and claim adjustment expenses gross 3 ‒2 ‒2 3Claims paid and claim adjustment expenses retroceded –1 5 1 1 5 –3Change in unpaid claims gross 40 ‒29 3 ‒29 37Change in unpaid claims retroceded 6 21 1 2 21 3Change in unpaid claims for unit-linked life insuranceClaims incurred 48 ‒5 0 0 0 0 0 0 2 0 6 ‒4 40 ‒1 0 0Acquisition and operating costs gross –1 –1Acquisition and operating costs retroceded 1 ‒1 1 ‒1Acquisition and operating costs net 0 ‒1 0 0 0 0 0 0 0 0 ‒1 0 1 ‒1 0 0Other re/insurance expensesTotal expenses from re/insurance business 48 ‒6 0 0 0 0 0 0 2 0 5 ‒4 41 ‒2 0 0

102 Swiss Re Financial Condition Report 2020
Technical result amounted to a profit of CHF 2 million in 2020, compared to a loss of CHF 3 million in 2019.
Claims incurred decreased by CHF 2 million to CHF 13 million in 2020, mainly due to various claims improvements. This was partially offset by an increase in claims from the property line of business. On a net basis, COVID-19 related claims impacted mainly the Credit and Surety line of business.
Acquisition and Operating costs retroceded decreased by CHF 8 million to CHF 28 million, mainly due to lower operating expenses resulting in a lower overriding comission.
Acquisition and Operating costs gross decreased by CHF 11 million due to lower expense charges from the Group.
Swiss Re International SE Zurich branch
Investment result CHF thousands Income Value readjustments Realised gains 2020 total
Investment incomeFixed-income securities 82 82
Other investments (Short-term investments) 361 64 425Investment income 443 0 64 507
Expenses Value adjustments Realised losses 2020 total
Investment expensesFixed-income securitiesInvestment management expenses ‒10 ‒10Other investments (Short-term investments) ‒2 ‒2Investment expenses ‒10 0 ‒2 ‒12
Investment result 433 0 62 495
CHF thousands Income Value readjustments Realised gains 2019 total
Investment incomeFixed-income securities 962 2 964Other investments (Short-term investments) 407 9 416Investment income 1 369 0 11 1 380
Expenses Value adjustments Realised losses 2019 total
Investment expensesFixed-income securities –4 –4Investment management expenses –44 –44Other investments (Short-term investments) –5 –5Investment expenses –44 0 –9 –53
Investment result 1 325 0 2 1 327

Swiss Re Financial Condition Report 2020 103
Change in capital and retained earnings
CHF thousandsCurrent account with Branch s head office
Retained earnings brought forward Net result Total
Beginning balance 1.1.2019 59 616 ‒911 ‒1 194 57 511Allocation to retained earnings ‒1 194 1 194 0Capital contributionDecrease of payables 2 842 2 842Net loss for financial year 2 372 2 372Net capital and retained earnings 31.12.2019 62 458 ‒2 105 2 372 62 725
Beginning balance 1.1.2020 62 458 ‒2105 2372 62 725Allocation to retained earnings 2372Capital repatriation ‒29 000 ‒29 000Corrective reclassificationsNet income for financial year ‒1649 ‒1649Net capital and retained earnings 31.12.2020 33 458 267 ‒1649 32 076

104 Swiss Re Financial Condition Report 2020

Swiss Re Financial Condition Report 2020 105
iptiQ EMEA P&C S.A., Luxembourg, Zurich branch
Management summary 106
Business activities 107
Performance 109

106 Swiss Re Financial Condition Report 2020
iptiQ EMEA P&C S.A., Luxembourg, Zurich branch
Management summary
iptiQ EMEA P&C S.A., Zurich branch (iptiQ EMEA P&C Zurich branch), domiciled in Zurich, Switzerland, is an insurance branch within the Swiss Re Group. iptiQ EMEA P&C Zurich branch engages in personal lines insurance business in Switzerland.
iptiQ EMEA P&C Zurich branch is part of iptiQ EMEA P&C S.A. which is regulated by the Commissariat aux Assurances, the Luxembourg insurance supervisory authority. iptiQ EMEA P&C Zurich branch is also locally supervised by FINMA, the Swiss insurance supervisory authority. Information about the solvency position of iptiQ EMEA P&C S.A. is disclosed according to Luxembourg regulations only. Swiss regulations do not require the disclosure of solvency information of iptiQ EMEA P&C Zurich branch in this Report.
This Report provides qualitative and quantitative information about the statutory financial condition of iptiQ EMEA P&C Zurich branch.
In this section, we provide information about the business model, the strategy and significant events. > Read more
We present the performance of the year under review based on the Swiss statutory income statement. > Read more
Business activities
Performance

Swiss Re Financial Condition Report 2020 107
Business activities
Strategy and prioritiesiptiQ EMEA P&C S.A. has identified opportunities to provide simple, transparent and targeted insurance covers for non-life risks accessible through attractive digital user journeys. In the digital age, customer needs are becoming more diverse and require customised products rather than the standard product bundles still predominant in European markets. iptiQ EMEA P&C S.A. sees an attractive opportunity in offering both, simple and transparent products comprising individual product modules that are bundled together as well as customised covers related to the business-to-business partners’ products (eg modern covers, embedded covers, single item covers), consequently focusing on customers’ specific situations and their needs.
In addition to the unmet protection needs of the customers, many companies with large existing retail customer bases are searching for ways of further monetising their customer bases while expanding the scope of offerings they provide. Insurance is one such potential offering. It requires deep product and risk management as well as servicing expertise and capabilities. These companies are looking for partners such as iptiQ EMEA P&C S.A. to supply them with digitally enabled and customisable insurance offerings that fit their specific journeys and customer needs and provide additional value to their core business.
OutlookDuring 2020 iptiQ EMEA P&C S.A. continued to grow in the markets in Germany and Switzerland that existed at the end of the prior financial year, while it simultaneously entered new key markets in the Netherlands and Italy, mainly through motor, household, property and cyber insurance products. The outlook for 2021 is to continue to develop partnerships and increase portfolios with each partner in the existing markets.
Strategy and prioritiesThe general principle governing the management of the investments in the iptiQ EMEA P&C Zurich branch is the creation of economic value on the basis of returns relative to the liability benchmark, while adhering to the investment guidelines and the prudent person principle. The liability benchmark is determined by approximating an investable benchmark from projected liability cash flows. A cash benchmark is used for the economic surplus. In light of the fact that the iptiQ EMEA P&C Zurich branch has only recently started to write insurance business the investment strategy at present is to ensure that the assets are sufficient to meet liquidity requirements.
OutlookIn terms of the investment outlook for 2021, government bond yields are expected to remain negative for longer. The iptiQ EMEA P&C Zurich branch will consider the possibility to invest a part of its cash and cash equivalents into Swiss Pfandbriefe in 2021 in accordance with the Branch’s investment guidelines and the limitations imposed by the Strategic Asset Allocation as approved by the Board of Directors of iptiQ EMEA P&C S.A.
iptiQ EMEA P&C Zurich branch, domiciled in Zurich, Switzerland, is an insurance branch within the Swiss Re Group. iptiQ EMEA P&C Zurich branch is part of iptiQ EMEA P&C S.A.
Re/insurance strategy and priorities
Investments
Re/insurance and holding company
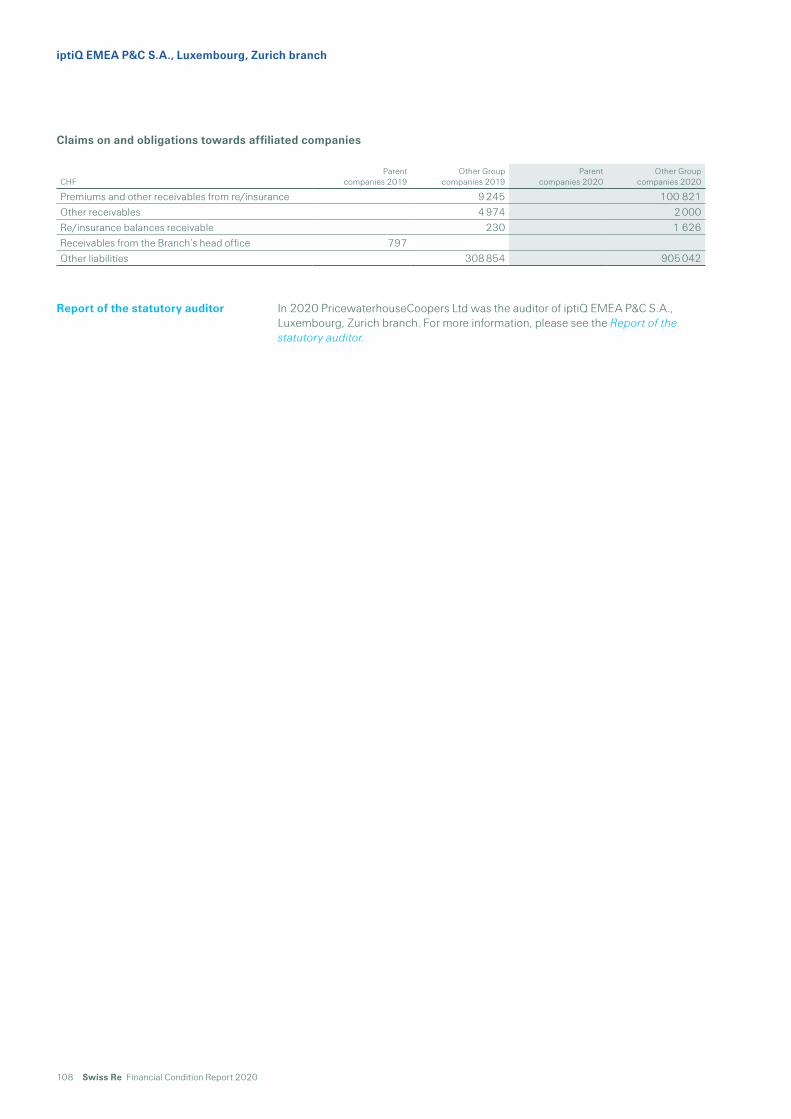
108 Swiss Re Financial Condition Report 2020
iptiQ EMEA P&C S.A., Luxembourg, Zurich branch
In 2020 PricewaterhouseCoopers Ltd was the auditor of iptiQ EMEA P&C S.A., Luxembourg, Zurich branch. For more information, please see the Report of the statutory auditor.
Report of the statutory auditor
Claims on and obligations towards affiliated companies
CHF Parent
companies 2019Other Group
companies 2019Parent
companies 2020Other Group
companies 2020
Premiums and other receivables from re/insurance 9 245 100 821Other receivables 4 974 2 000Re/insurance balances receivable 230 1 626Receivables from the Branch’s head office 797Other liabilities 308 854 905 042

Swiss Re Financial Condition Report 2020 109
Performance
Income statement – Swiss statutory
CHF 2019 2020
Premiums written gross 1 508 137 710Premiums written retroceded –1 357 –123 939Premiums written net 151 13 771Change in unearned premiums gross –1 253 ☺–80 420Change in unearned premiums retroceded 1 127 72 378Premiums earned 25 5 729Other re/insurance revenuesTotal revenues from re/insurance business 25 5 729Change in paid claims gross –31 162Change in paid claims retroceded 28 046Change in paid claims net 0 – 3 116Change in unpaid claims gross –96 –25 114Change in unpaid claims retroceded 86 22 603Change in unpaid claims net –10 –2 511Claims incurred –10 –5 627Acquisition and operating costs gross –701 520 –3 210 021Acquisition and operating costs retroceded 9 043 111 373Acquisition and operating costs net –692 477 –3 098 648Other re/insurance expensesTotal expenses from re/insurance business –692 487 –3 104 275Investment income 1 946Investment expenses –690 –14 235Investment result –690 –12 289Other financial incomeOther financial expensesOperating result –693 152 –3 110 835Interest expenses on debt and subordinated liabilitiesOther incomeOther expenses –31 927 –27 779Extraordinary income and expensesIncome before income tax expense –725 079 –3 138 614Income tax expense –2 100Net income –727 179 –3 138 614
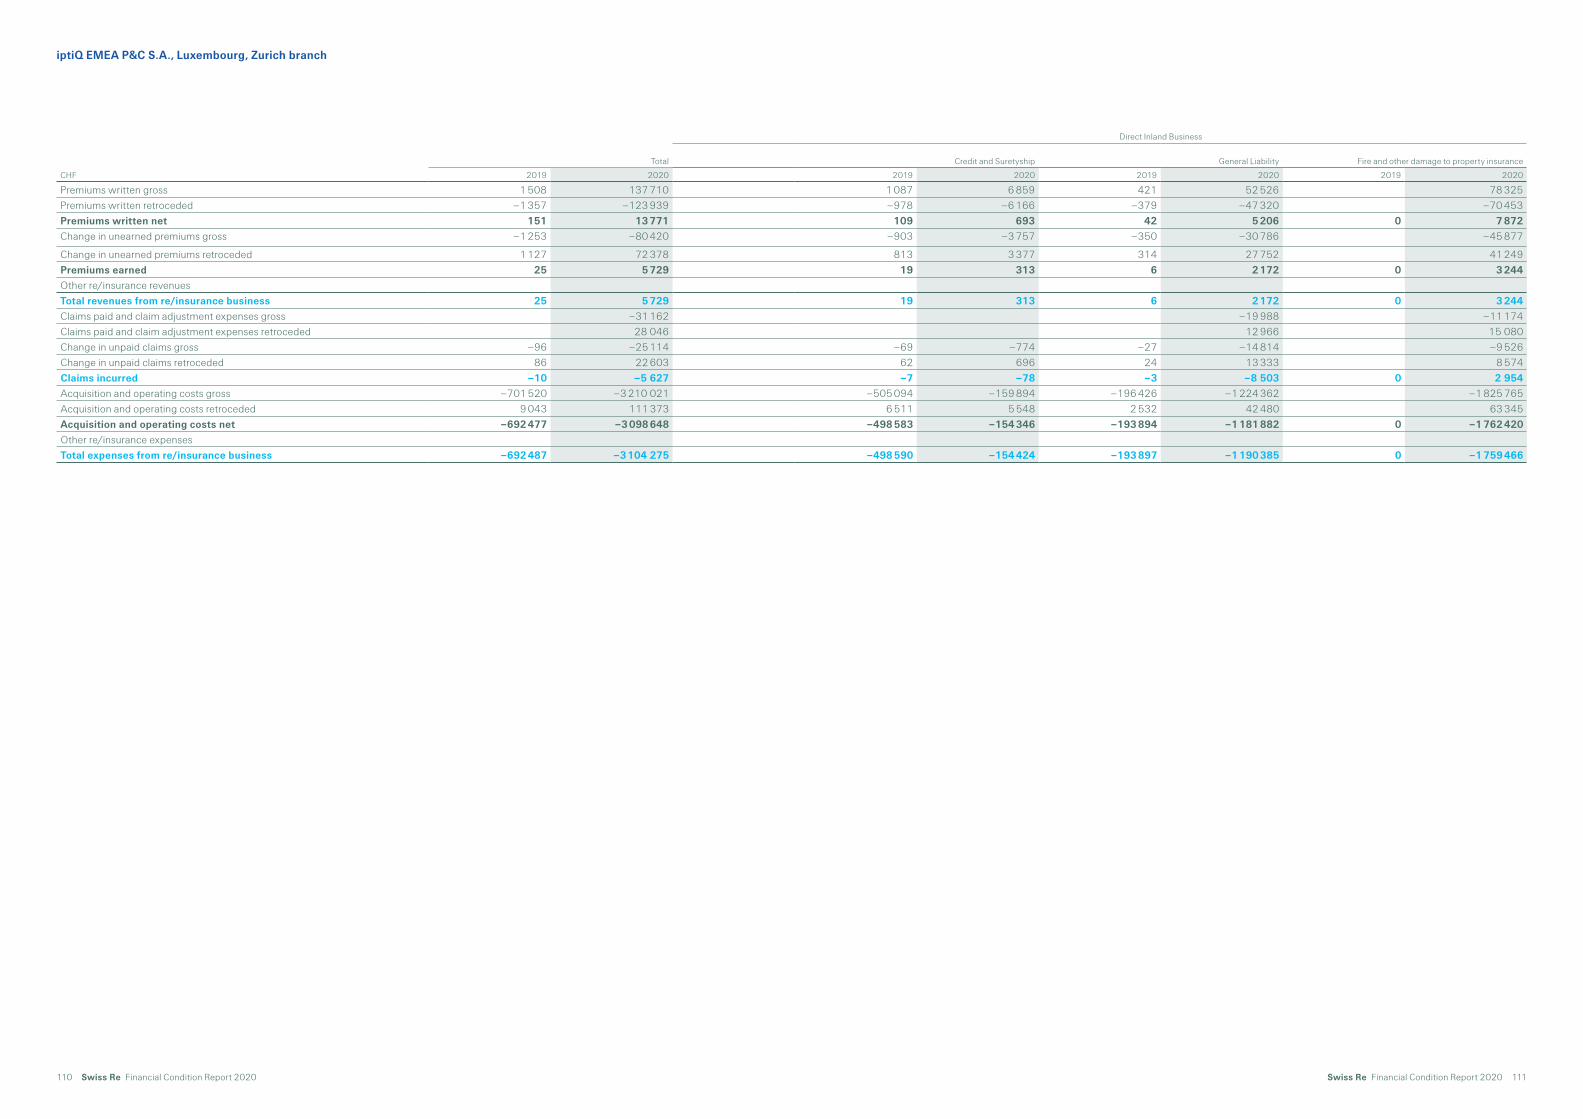
110 Swiss Re Financial Condition Report 2020 Swiss Re Financial Condition Report 2020 111
Direct Inland Business
Total Credit and Suretyship General Liability Fire and other damage to property insurance
CHF 2019 2020 2019 2020 2019 2020 2019 2020
Premiums written gross 1 508 137 710 1 087 6 859 421 52 526 78 325Premiums written retroceded –1 357 –123 939 –978 –6 166 –379 –47 320 –70 453Premiums written net 151 13 771 109 693 42 5 206 0 7 872Change in unearned premiums gross –1 253 –80 420 –903 –3 757 –350 –30 786 –45 877
Change in unearned premiums retroceded 1 127 72 378 813 3 377 314 27 752 41 249Premiums earned 25 5 729 19 313 6 2 172 0 3 244Other re/insurance revenuesTotal revenues from re/insurance business 25 5 729 19 313 6 2 172 0 3 244Claims paid and claim adjustment expenses gross –31 162 –19 988 –11 174Claims paid and claim adjustment expenses retroceded 28 046 12 966 15 080Change in unpaid claims gross –96 –25 114 –69 –774 –27 –14 814 –9 526Change in unpaid claims retroceded 86 22 603 62 696 24 13 333 8 574Claims incurred –10 –5 627 –7 –78 –3 –8 503 0 2 954Acquisition and operating costs gross –701 520 –3 210 021 –505 094 –159 894 –196 426 –1 224 362 –1 825 765Acquisition and operating costs retroceded 9 043 111 373 6 511 5 548 2 532 42 480 63 345Acquisition and operating costs net –692 477 –3 098 648 –498 583 –154 346 –193 894 –1 181 882 0 –1 762 420Other re/insurance expensesTotal expenses from re/insurance business –692 487 –3 104 275 –498 590 –154 424 –193 897 –1 190 385 0 –1 759 466
iptiQ EMEA P&C S.A., Luxembourg, Zurich branch

112 Swiss Re Financial Condition Report 2020
Total revenues and expenses from insurance business experienced a loss of CHF 3 138 614 in 2020, compared to a loss of CHF 727 179 in 2019.
Premiums earned increased by CHF 5 704 to CHF 5 729 in 2020, mainly due to the launch of a household insurance product (content and private liability) in the Swiss market.
Claims incurred increased by CHF 5 617 to CHF 5 627 in 2020. This increase was driven by the same key factor described above in respect of the increase in premiums earned. The claims incurred are higher than the premiums earned because of the allocation of claims management expenses.
Net investment loss increased by CHF 11 599 to CHF 12 289 in 2020 compared to the prior year, mainly due to the negative interest on the investments held.
Investment result
Investment result CHF Income Value readjustments Realised gains 2020 total
Investment incomeFixed-income securitiesOther investments (Cash and cash equivalents) 1 946 1 946Investment income 1 946 0 0 1 946
Expenses Value adjustments Realised losses 2020 total
Investment expensesFixed-income securitiesInvestment management expenses –202 –202Other investments (Cash and cash equivalents) ☺–14 033 –14 033Investment expenses –14 235 0 0 –14 235
Investment result –12 289
CHF thousands Income Value readjustments Realised gains 2019 total
Investment incomeFixed-income securitiesOther investments (Cash and cash equivalents)Investment income 0 0 0 0
Expenses Value adjustments Realised losses 2019 total
Investment expensesFixed-income securitiesInvestment management expensesOther investments (Cash and cash equivalents) –690 –690Investment expenses –690 0 0 –690
Investment result –690
iptiQ EMEA P&C S.A., Luxembourg, Zurich branch

Swiss Re Financial Condition Report 2020 113
Change in capital and retained earnings
CHF Current account with Branchʼs head office
Retained earnings brought forward Net result Total
Beginning balance 1.1.2019Allocation to retained earningsCash capital contribution 1 950 000 1 950 000Cash capital withdrawalIncrease of payablesNet loss for financial year –727 179 –727 179Net capital and retained earnings 31.12.2019 1 950 000 0 –727 179 1 222 821
Beginning balance 1.1.2020 1 950 000 –727 179 1 222 821Allocation to retained earningsCash capital contribution 1 555 572 1 555 572Cash capital withdrawalIncrease of payablesNet income for financial year –3 138 614 –3 138 614Net capital and retained earnings 31.12.2020 3 505 572 –727 179 –3 138 614 –360 221

114 Swiss Re Financial Condition Report 2020

Swiss Re Financial Condition Report 2020 115
Appendix
This appendix provides further information on the SST methodology and the valuation for solvency purposes. The scope, the legal basis and the components of the SST calculation are explained. The main valuation and scope differences between the SST balance sheet and the audited financial statements are summarised.

116 Swiss Re Financial Condition Report 2020
Appendix
Methodology and valuation
The SST is the solvency regime applicable to re/insurance entities and groups domiciled in Switzerland. The key principles of the SST are defined in the Insurance Supervision Ordinance (ISO) and in the FINMA circular 2017/03 on SST.
Swiss Re Group and its Swiss regulated entities submit their SST report to FINMA. The SST report 2021 is filed with FINMA in April 2021. The published SST ratio is subject to FINMA’s review and approval. Swiss Re applies an internal model to calculate the SST ratio, which is also subject to FINMA’s approval.
The calculation of the SST ratio includes forward-looking elements. For factors that could affect the SST ratio, see > Note on risk factors and > Cautionary note on forward-looking statements.
The SST is a market-consistent and risk-based approach to determine available and required capital. An entity is solvent under SST if the available capital (the SST risk- bearing capital) is higher than the required capital (the SST target capital).
The SST ratio determines the solvency position of an entity:
SST risk-bearing capital – market value margin
SST target capital – market value margin
The market value margin (ie, the run-off capital costs) is a reserve for capital costs included in the SST target capital. FINMA circular 2017/03 on SST requires that the market value margin is subtracted from the SST risk-bearing capital and the SST target capital, aligning the definition of the SST ratio more closely with Solvency II.
The SST risk-bearing capital is the amount of capital that is available to protect the policyholders of an entity in case of a large and unexpected adverse event.
The SST risk-bearing capital is derived as follows:
SST net asset value
– Deductions
+ Supplementary capital
= SST risk-bearing capital
The SST net asset value is the value of an entity’s assets minus the value of its liabilities. All traded assets and liabilities are marked to market, based on quoted prices in active markets or observable inputs. Non-traded assets and liabilities are valued on a market-consistent basis. Insurance liabilities are valued on a market- consistent basis by replicating future best-estimate expected cash flows with liquid financial market instruments. As the majority of the insurance liabilities do not contain embedded financial market risks other than interest-rate risk, the market-consistent value of liabilities is determined by discounting estimated future cash flows using prevailing risk-free interest rates. If insurance liabilities include embedded options or guarantees (eg variable annuities or interest sensitive life business), they are valued on a market-consistent basis using stochastic models and other appropriate valuation techniques. Own debt not qualified as SST supplementary capital is valued using risk-free discounting, whereas debt qualified as supplementary capital is fair valued.
Introduction
Key principles
SST risk-bearing capital

Swiss Re Financial Condition Report 2020 117
Other assets are valued based on market-consistent valuations or using US GAAP valuations where appropriate. Other liabilities mainly consists of securities sold under agreements to repurchase, securities sold short, payables for securities in transit and other creditors. Since other liabilities are not in the focus of re/insurance activities, as a simplification their valuation is aligned with US GAAP. Hence, securities sold short are valued based on market-consistent valuations, other creditors are valued based on the nominal, and lastly securities sold under agreements to repurchase and payables for securities in transit are valued based on amortised cost. Deferred tax assets and liabilities are not valued under SST. The value of a participation is based on its SST net asset value including the market value margin.
The deductions from SST net asset value consist of dividends for the upcoming one- year period and deferred tax on real estate. No deductions are made for own shares and intangible assets, as these items are not valued in Swiss Re’s SST balance sheet.
The supplementary capital consists of additional risk-absorbing capital instruments, such as hybrid debt. The eligibility of debt instruments as supplementary capital is defined in the ISO and subject to FINMA’s approval.
The SST target capital represents the capital required to cover the risks assumed by the company. It is based on the company’s total risk. In order to derive SST target capital, the total risk is adjusted for various items summarised under other impacts. An entity’s total risk is measured in terms of 99% shortfall, ie the average
unexpected loss at entity level that occurs with a frequency of less than once in 100 years over a one-year time horizon. All losses are a combination of insurance, financial market and credit losses, and accumulation as well as diversification between individual risks is taken into account.
Other impacts include the minimum cost of holding capital after the one-year SST period until the end of a potential run-off period (market value margin) as required by SST, the impact from business development over the forecasting period, as well as requirements from FINMA that are not included in total risk as they are not consistent with Swiss Re’s own risk view.
The SST target capital includes the minimum cost of holding capital after the one-year SST period until the end of a potential run-off period. Known as the MVM at the end of the risk assessment period, this represents the amount required to compensate a third party for the capital costs associated with running-off the insurance and reinsurance portfolio following a shortfall event. For a solo legal entity, only business assumed on the own book (including intra-group transactions) is considered; however, the consolidated view of Swiss Re Group also takes into account the business assumed through all its subsidiaries.
The MVM is calculated using the 99% shortfall on projected insurance and reinsurance exposure from the end of the solvency assessment period onwards, discounted back to the beginning of the period with US dollar rates, as most of the long-tail business is written in that currency. The sum of the calculated present values is then multiplied by the 6% capital cost rate specified by FINMA.
This Report includes a comparison of the SST balance sheet with audited financial statements. The consolidated financial statements of the Group are prepared in accordance with US GAAP. The statutory financial statements of Swiss Reinsurance Company Ltd, Swiss Re Corporate Solutions Ltd, Swiss Re Nexus Reinsurance Company Ltd, Swiss Re International SE, Luxembourg (Zurich branch) and iptiQ EMEA P&C S.A., Luxembourg (Zurich branch) are based on Swiss law.
SST target capital
Market value margin
SST balance sheet

118 Swiss Re Financial Condition Report 2020
Appendix
Valuation and scope differences with audited financial statements
SST US GAAP Statutory
Actuarial assumptions
Best estimate Non-life business: reinsurance contracts are accrued when insured events occur and are based on the estimated ultimate cost of settling the claims. Unearned premium reserves are calculated based on a „pro-rata“ share of the estimated premium written, taking into account seasonality of risk when necessaryLife and health business: assumptions are generally set when the contract is issued or purchased, making allowance for possible adverse deviation (PAD)
Non-life business: reinsurance contracts are accrued when insured events occur and are based on the estimated ultimate cost of settling the claims; Unearned premium reserves are calculated based on a „pro-rata“ share of the estimated premium written, taking into account seasonality of risk when necessary; allowance for equalisation reservesLife and health business: best estimate with additional provisions for possible adverse deviations (PAD)
Liability cash-flows Discounted using risk-free rates; market-consistent valuation of options and guarantees
Non-life business: generally no discountingLife and health business: generally discounted based on book yields, with a PAD applied; generally no market-consistent valuation of embedded options and guarantees; for some derivative instruments (eg, variable annuities) a full stochastic valuation is carried out
Non-life business: generally no discountingLife and health business: generally discounted at historical yields of assets backing liabilities, with a PAD applied; generally no market-consistent valuation of embedded options and guarantees; for some derivative instruments (eg, variable annuities) a full stochastic valuation is carried out
Capital generation from new business
Recognised upfront for all Deferred over time (unearned premium reserve)
Deferred over time for positive expectation (unearned premium reserve), immediately for negative expectation
Explicit margin for risk
MVM is part of SST target capital. Valuation of subsidiaries on the balance sheet include MVM
No No
Investment assets Market values Mostly market values, with some exceptions such as real estate and real estate for own use which are held at depreciated cost
Fixed income securities and short-term investment at amortised value, shares in investment funds at cost or lower market value, loans at nominal value
Goodwill and intangibles
Not recognised Recognised, goodwill subject to impairment test, intangibles subject to amortisation
Normally no goodwill recognition; intangibles and potential goodwill amortised/depreciated on a straight line basis
Senior debt, subordinated debt and convertible instruments
Valuation at fair value excluding own credit risk, except for supplementary capital instruments which are valued at fair value with no adjustment1
Generally valued at amortised cost; for convertible instruments classification depends on the instrument‘s characteristics. It is either classified as debt at amortised costs or as equity
Generally valued at redemption value; all debt positions recognised as liabilities
Deferred taxes No Yes NoContract boundaries Contracts incepted until 31
December 2020 as well as business shifts as of 1 January 2021
Contracts incepted until 31 December 2020
Contracts incepted until 31 December 2020
Minority interest SST recognises minority interests in the proportional consolidation of assets and liabilities
Minority interest are recognised as part of the statement of shareholders‘ equity
No minority interests on standalone financial statement
Sub-consolidation principles for solo view
Some entities are sub-consolidated for SST reporting
Not applicable No sub-consolidation applied for statutory reporting
1 For the purpose of the balance sheet comparisons, SST may recognise subordinated debt and convertibles as supplementary capital for solvency assessment upon FINMA approval.

Swiss Re Financial Condition Report 2020 119
The balance sheet comparisons included in this Report are provided on an aggregated basis, which is explained in the following table (empty cells denote items that are not reflected in the respective view):
Comparison with audited financial statements
Account for comparison SST accounts (as published) US GAAP accounts (as published) Statutory accounts (as published)
Assets:Real estate Real estate Investment real estateInvestments in subsidiaries and affiliated companies
Participations Investments in subsidiaries and affiliated companies
Fixed-income securities Fixed-income securities Available-for-sale, at fair value Trading
Fixed-income securities
Loans Loans Policy loans, mortgages and other loans2
Loans
Mortgages Mortgages Policy loans, mortgages and other loans2
Mortgages
Equity securities Equities At fair value through earnings Equity securities Other investments Collective investment
schemes Alternative investments Structured products Other investments
Short-term investments, at fair value
Other invested assets
Shares in investment funds Short-term investments Alternative investments
Investments for unit-linked and with-profit business
Financial investments from unit-linked life business
Investments for unit-linked and with-profit business
Cash and cash equivalents Cash and cash equivalents Cash and cash equivalents Cash and cash equivalentsFunds held by ceding companies and other receivables from reinsurance
Deposits made under assumed reinsurance contracts
Receivables from insurance business
Premiums and other receivables
Funds held by ceding companies
Funds held by ceding companies
Premiums and other receivables from reinsurance
Reinsurance recoverable from retrocessions
Reinsurers‘ share of best estimate of provisions for insurance liabilities
Reinsurance recoverable on unpaid claims and policy benefits
☺Reinsurance recoverable from unpaid claims
☺Reinsurance recoverable from liabilities life and health
☺Reinsurance recoverable from unearned premiums
☺Reinsurance recoverable from provision for profit commissions
Other assets Receivables from derivative financial instruments
Fixed assets Other receivables Other assets Accrued assets
Accrued investment income Deferred acquisition costs Acquired present value of
future profits Goodwill Income taxes recoverable Deferred tax assets Other assets
Assets in derivative financial instruments
Tangible assets Deferred acquisition costs Intangible assets Other receivables Other assets Accrued income

120 Swiss Re Financial Condition Report 2020
Appendix
Account for comparison SST accounts (as published) US GAAP accounts (as published) Statutory accounts (as published)
Liabilities:Reinsurance liabilities before retrocessions
Best estimate of provisions for insurance liabilities3
Unpaid claims and claim adjustment expenses
Liabilities for life and health policy benefits
Unearned premiums
Unpaid claims Liabilities for life and health
policy benefits Unearned premiums Provisions for profit
commissions Equalisation provision
Unit-linked and with profit liabilities
Best estimate of provisions for unit-linked life insurance liabilities4
Policyholder account balances5
Debt Interest-bearing liabilities Subordinated debts
Short-term debt Long-term debt
Debt Subordinated liabilities
Funds held under reinsurance treaties
Deposits retained on ceded reinsurance
Funds held under reinsurance treaties
Funds held under reinsurance treaties
Other liabilities Non-technical provisions Liabilities from derivative
financial instruments Liabilities from insurance
business Other liabilities Accrued liabilities
Reinsurance balances payable Income taxes payable Deferred and other non-
current tax liabilities Accrued expenses and other
liabilities
Tax provisions Provision for currency
fluctuation Other provisions Liabilities from derivative
financial instruments Reinsurance balances payable Other liabilities Accrued expenses
2 This information is not disclosed separately under US GAAP. However, for the comparison, loan and mortgage figures are separated in order to align with the granularity of the SST accounts.
3 Excluding unit-linked life insurance.4 Before and after retrocession for direct insurance and active reinsurance.5 Policyholder account balances also includes some non-linked, non-participating universal life type contracts.
The change in SST net asset value presented in this Report is attributed to the following drivers: Underwriting contribution: consists of new business impacts based on best
estimate cash flow projections and risk-free discounting, and impacts on in-force business from experience variances, assumption changes and reserve releases.
Investment contribution: is derived from mark-to-market return on investments less the minimum risk benchmark return. The latter is the return on the theoretical investment portfolio that would minimise the financial market risk exposure of the entity.
Market value margin of subsidiaries. Other contributions: consists particularly of other assets and liabilities and current
taxes. Capital movements: consists of dividends paid and capital repatriation. Other, such as impact of foreign exchange movements.
The drivers of change in SST net asset value are prepared on a best-effort basis to support the analysis of the SST net asset value. The calculation of the SST net asset value is based on the EVM balance sheet and not the drivers identified above.
Drivers of change in SST net asset value

Swiss Re Financial Condition Report 2020 121
Cautionary note on forward-looking statements
Certain statements and illustrations contained herein are forward-looking. These statements (including as to plans, objectives, targets and trends) and illustrations provide current expectations of future events based on certain assumptions and include any statement that does not directly relate to a historical fact or current fact.
Forward-looking statements typically are identified by words or phrases such as “anticipate”, “assume”, “believe”, “continue”, “estimate”, “expect”, “foresee”, “intend”, “may increase”, “may fluctuate” and similar expressions, or by future or conditional verbs such as “will”, “should”, “would” and “could”. These forward-looking statements involve known and unknown risks, uncertainties and other factors, which may cause the Group’s actual results of operations, financial condition, solvency ratios, capital or liquidity positions or prospects to be materially different from any future results of operations, financial condition, solvency ratios, capital or liquidity positions or prospects expressed or implied by such statements or cause Swiss Re to not achieve its published targets. Such factors include, among others:
the frequency, severity and development of insured claim events, particularly natural catastrophes, man-made disasters, pandemics, acts of terrorism or acts of war;
mortality, morbidity and longevity experience; the cyclicality of the reinsurance sector; central bank intervention in the financial markets, trade wars or other protectionist
measures relating to international trade arrangements, adverse geopolitical events, domestic political upheavals or other developments that adversely impact global economic conditions;
increased volatility of, and/or disruption in, global capital and credit markets; the Group’s ability to maintain sufficient liquidity and access to capital markets,
including sufficient liquidity to cover potential recapture of reinsurance agreements, early calls of debt or debt-like arrangements and collateral calls due to actual or perceived deterioration of the Group’s financial strength or otherwise;
the Group’s inability to realise amounts on sales of securities on the Group’s balance sheet equivalent to their values recorded for accounting purposes;
the Group’s inability to generate sufficient investment income from its investment portfolio, including as a result of fluctuations in the equity and fixed income markets, the composition of the investment portfolio or otherwise;
changes in legislation and regulation, and the interpretations thereof by regulators and courts, affecting the Group or its ceding companies, including as a result of comprehensive reform or shifts away from multilateral approaches to regulation of global operations;
the lowering or loss of one of the financial strength or other ratings of one or more companies in the Group, and developments adversely affecting its ability to achieve improved ratings;
uncertainties in estimating reserves, including differences between actual claims experience and underwriting and reserving assumptions;
policy renewal and lapse rates; uncertainties in estimating future claims for purposes of financial reporting,
particularly with respect to large natural catastrophes and certain large man-made losses, as significant uncertainties may be involved in estimating losses from such events and preliminary estimates may be subject to change as new information becomes available;
legal actions or regulatory investigations or actions, including in respect of industry requirements or business conduct rules of general applicability;
the outcome of tax audits, the ability to realise tax loss carryforwards and the ability to realise deferred tax assets (including by reason of the mix of earnings in a jurisdiction or deemed change of control), which could negatively impact future earnings, and the overall impact of changes in tax regimes on the Group’s business model;
changes in accounting estimates or assumptions that affect reported amounts of assets, liabilities, revenues or expenses, including contingent assets and liabilities;
changes in accounting standards, practices or policies;
122 Swiss Re Financial Condition Report 2020
Appendix
strengthening or weakening of foreign currencies; reforms of, or other potential changes to, benchmark reference rates; failure of the Group’s hedging arrangements to be effective; significant investments, acquisitions or dispositions, and any delays, unforeseen
liabilities or other costs, lower-than-expected benefits, impairments, ratings action or other issues experienced in connection with any such transactions;
extraordinary events affecting the Group’s clients and other counterparties, such as bankruptcies, liquidations and other credit-related events;
changing levels of competition; the effects of business disruption due to terrorist attacks, cyberattacks, natural
catastrophes, public health emergencies, hostilities or other events; limitations on the ability of the Group’s subsidiaries to pay dividends or make other
distributions; and operational factors, including the efficacy of risk management and other internal
procedures in anticipating and managing the foregoing risks.
These factors are not exhaustive. The Group operates in a continually changing environment and new risks emerge continually. Readers are cautioned not to place undue reliance on forward-looking statements. Swiss Re undertakes no obligation to publicly revise or update any forward-looking statements, whether as a result of new information, future events or otherwise.
This communication is not intended to be a recommendation to buy, sell or hold securities and does not constitute an offer for the sale of, or the solicitation of an offer to buy, securities in any jurisdiction, including the United States. Any such offer will only be made by means of a prospectus or offering memorandum, and in compliance with applicable securities laws.
Swiss Re Financial Condition Report 2020 123
Note on risk factors
The operations, investments and other activities of Swiss Re Ltd (“Swiss Re”) and its subsidiaries (collectively, the “Group”) are subject to a range of risks that could adversely impact the Group’s business, financial condition, results of operations, liquidity and cash flows.
The global spread of the novel coronavirus and the disease it causes (“COVID-19”), and the actions taken to slow the spread of the pandemic, have had an adverse impact on communities, social and business interactions, economic activity and economies across the globe. After significant contractions in 2020, the global economy is expected to experience a protracted and uneven recovery in 2021. The impact of the pandemic on recovery of individual economies will be affected by their respective capacities to absorb shocks and the fiscal responses of their governments, and more broadly by continuing uncertainties over the impact of new strains of the virus and the effectiveness of vaccines against new strains, the timeline for the rollout of vaccination programs, the duration of immunity and resulting restrictions on mobility. Despite the impact of the pandemic on the global economy, the global insurance markets (as measured by premium growth) were less severely impacted in 2020 than expected (although the life market was more adversely affected than the non-life market) and premium growth is expected to recover, alongside recovery of the global economy, in 2021 and 2022, supported by rate hardening. Growth is expected to be led by China and, to a lesser extent, by other markets in Asia, aided in the case of life business by greater awareness of the importance post-pandemic of mortality and health coverage, as well as digital insurance penetration.
For the Group, in Property & Casualty Reinsurance, the COVID-19 crisis (in particular the impact on businesses and business activity) had the greatest impact on event cancellation, non-damage business interruption covers, and credit and surety. In Life & Health Reinsurance, the COVID-19 crisis had the greatest impact on mortality exposures. The majority of losses were incurred in the second and fourth quarters, largely driven by business closings and excess mortality, and reported 2020 losses continue to reflect high levels of incurred but not reported (IBNR) reserves.
The COVID-19 crisis prompted regulatory actions, including regulatory guidance in a number of US states in respect of temporary policyholder leniency, and legislative proposals in respect of policy exclusions and retroactive business interruption coverage. Legal challenges have been brought in a variety of jurisdictions, including, most notably, test cases brought in the United Kingdom by the Financial Conduct Authority, in respect of which the UK Supreme Court largely found on appeal, by the insurance company parties, in favour of holders of business interruption insurance policies, and in Australia, where a Court of Appeal also found in favour of policyholders. Legal actions on a range of pandemic-related claims are likely to continue in a number of jurisdictions.
The COVID-19 crisis continues, and the ultimate toll of the pandemic in terms of lives lost, societal dislocations, business activity, economic growth, broader costs to society and industry losses remain highly uncertain. Many pandemic-related developments interact with long-term trends and outlooks, including the impact of persistent low yields on the insurance industry. It also remains to be seen how public-private partnership initiatives may evolve to address future pandemics.
Swiss Re’s operations as well as its investment returns are subject to conditions in the financial markets and macroeconomic factors, which are outside of its control. Financial, credit and foreign exchange markets are experiencing continued periods of volatility reflecting a range of political, geopolitical, economic and other uncertainties, some of the more significant of which are inter-related. Further adverse developments or the continuation of adverse trends that, in turn, have a negative impact on financial markets and economic conditions, could limit the Group’s ability to access the capital markets and bank funding markets, could adversely affect the ability of counterparties to meet their obligations to the Group and could adversely affect the confidence of the ultimate buyers of insurance and
Coronavirus
General impact of adverse market conditions

124 Swiss Re Financial Condition Report 2020
Appendix
reinsurance. Any of the foregoing factors, developments and trends could have an adverse effect on the Group’s investment results, which in the current extremely low interest rate environment could have a material adverse effect on the Group’s overall results, make it difficult to determine the value of certain assets in the Group’s portfolio, make it more difficult to acquire suitable investments to meet its risk and return criteria and otherwise have a material adverse effect on its business and operations.
Swiss Re and its subsidiaries operate in a highly regulated environment, which continues to change over time. The regulatory regimes to which members of the Group are subject have changed significantly in recent years and are expected to continue to evolve. While some regulation is national in scope, the global nature of the Group’s business means that its operations are subject in effect to a patchwork of global, national and regional standards. Swiss Re and its subsidiaries are subject to group supervision and Swiss Re’s subsidiaries are also subject to applicable regulation in each of the jurisdictions in which they conduct business, particularly Switzerland, the United States, the United Kingdom, Luxembourg and Germany. The Group and its Swiss regulated entities and branches are subject to the Swiss Solvency Test and, through its legal entities and branches organised in the European Economic Area (“EEA”) and the United Kingdom, Solvency II (which going forward as between the EEA and the UK could diverge).
While certain regulatory processes are designed in part to foster convergence and achieve recognition of group supervisory schemes, the Group continues to face risks of extra-territorial application of regulations, particularly as to group supervision and group solvency requirements. In addition, regulators in jurisdictions beyond those where the Group has core operations increasingly are playing a far greater oversight role, requiring more localised resources and, despite a predominantly local focus, also raise issues of a cross-border nature. Furthermore, evolving regulatory schemes and requirements may be inconsistent or may conflict with each other, thereby subjecting the Group, particularly in light of the increasing focus on legal entities in isolation, to higher compliance and legal costs, as well as the possibility of higher operational, capital and liquidity costs.
On the international level, certain large insurance companies were designated as global systemically important insurers (“G-SIIs”) and reinsurance companies faced potential designation as G-SIIs. While further designations have been suspended until 2022, the determination to discontinue G-SII designations altogether will only be made in 2022, based on an assessment of progress made by the International Association of Insurance Supervisors (“IAIS”), in establishing a new holistic framework for systemic risk that was adopted in November 2019 and implemented as of the beginning of 2020. The new framework embraces an enhanced set of policy measures targeted at the exposures and activities that can lead to systemic risks from the insurance sector as a whole. The Group cannot predict what additional regulatory changes will be implemented as the IAIS systemic risk process evolves and what any such changes may mean for how the Group is structured in any particular jurisdiction and how aspects of its business may be affected. Moreover, the Group cannot predict whether the Financial Stability Board will endorse the new IAIS holistic framework or retain the existing G-SII approach, or what regulatory changes may apply in the future to ceding companies in the context of broader designations of reinsurers as systemically important.
In addition, large internationally active insurance groups (“IAIGs”), which is a designation compiled by the IAIS as identified by group-wide supervisors, may become subject to a risk-based group-wide global insurance capital standard (“ICS”). ICS Version 2.0 was adopted in November 2019, and is expected to take effect in 2025, following a five-year confidential reporting period during which no supervisory action will be taken on the basis of the monitoring. In November 2019, the IAIS also adopted the Common Framework for the Supervision of Internationally Active Insurance Groups (“ComFrame”), as well as some changes to a number of Insurance Core Principles (“ICPs”) – guidance and standards on supervision of
Regulatory changes

Swiss Re Financial Condition Report 2020 125
insurers and which apply to insurance companies regardless of size and international exposures. ComFrame strengthens ICP requirements for IAIGs and proposes that the group-wide supervisor, in consultation with the host supervisors, should exercise discretion in requiring IAIGs to submit resolution plans. Swiss Re expects that it will be classified as an IAIG.
The Group cannot predict which legislative and/or regulatory initiatives will be enacted or promulgated, what the scope and content of these initiatives ultimately will be, when they will be effective and what the implications will be for the industry, in general, and for the Group, in particular. The Group may be subject to changes in views of its regulators in respect of the models that the Group uses for capital and solvency purposes, and could be adversely affected if, for example, it is required to use standard models rather than internal models. Generally, legal and regulatory changes could have a material impact on the Group’s business. Notwithstanding the departure of the United Kingdom from the EU single market and customs union, continued uncertainty regarding the ways in which the future relationship between the United Kingdom and the European Union will evolve could also impact the legislative and/or regulatory regimes to which the Group is subject (including Solvency II), both in the United Kingdom and in the European Union.
Regulatory changes also could occur in areas of broader application, such as competition policy and tax laws. For example, changes in tax laws, or the interpretation of the tax laws or tax regulations in jurisdictions in which the Group does business, or withdrawals of tax rulings in jurisdictions such as Switzerland that have issued such rulings to Swiss Re, could increase the taxes the Group pays, or impact the attractiveness of products offered by the Group, the Group’s investment activities or the value of deferred tax assets. These changes, or inconsistencies between the various regimes that apply to the Group, could increase the costs of doing business (including due to increased capital requirements), reduce access to liquidity, limit the scope of current or future business or affect the competitive balance, or could make reinsurance less attractive to primary insurers.
Volatility and disruption in the global financial markets could expose the Group to significant financial and capital markets risk, including changes in interest rates, credit spreads, equity prices and foreign currency exchange rates, which may adversely impact the Group’s financial condition, results of operations, liquidity and capital position. The Group’s exposure to interest rate risk is primarily related to the market price and cash flow variability associated with changes in interest rates. In general, low interest rates continue to pose significant challenges to the insurance and reinsurance industries, with earnings capacity under stress unless lower investment returns can be offset by lower combined ratios or higher returns from other asset classes, which in a soft market cycle is a challenge. Exposure to credit spreads primarily relates to market price and cash flow variability associated with changes in credit spreads. When credit spreads widen, the net unrealised loss position of the Group’s investment portfolio can increase, as could other-than-temporary impairments.
The Group is exposed to changes in the level and volatility of equity prices, as well as the value of securities or instruments that derive their value from a particular equity security, a basket of equity securities or a stock index. The Group is also subject to equity price risk to the extent that the values of life-related benefits under certain products and life contracts, most notably variable annuity contracts, are wholly or partially exposed, directly and/or indirectly, to market fluctuations, including equity prices. To the extent market values fall, the financial exposure on guarantees related to these contracts would increase to the extent this exposure is not hedged. While the Group has an extensive hedging programme covering its existing variable annuity business, certain risks cannot be hedged, including actuarial, basis and correlation risks. Exposure to foreign exchange risk arises from changes in spot prices, forward prices and volatilities of currency rates.
Market risk

126 Swiss Re Financial Condition Report 2020
Appendix
These risks can have a significant effect on investment returns and market values of securities positions, which in turn may affect both the Group’s results of operations and financial condition. The Group continues to focus on asset-liability management for its investment portfolio, but pursuing even this strategy has its risks – including a possible mismatch between investments and liability benchmarks – that in turn can lead to reinvestment risk. The Group seeks to manage the risks inherent in its investment portfolio by repositioning the portfolio from time to time, as needed, and to reduce risk and fluctuations through the use of hedges and other risk management tools.
If the credit markets were to deteriorate, the Group could experience losses. Changes in the market value of the underlying securities and other factors impacting their price could give rise to market value losses. The Group could also face write-downs in other areas of its portfolio, including other structured instruments, and the Group and its counterparties could face difficulties in valuing credit-related instruments. Differences in opinion with respect to valuations of credit-related instruments could result in legal disputes among the Group and its counterparties as to their respective obligations, the outcomes of which are difficult to predict and could be material. The Group is also subject to credit and other risks in its credit business, including reliance on banks that underwrite and monitor facilities in which the Group participates and potential default by borrowers under those facilities.
The Group’s business requires, and its clients expect, that it has sufficient capital and sufficient liquidity to meet its re/insurance obligations, and that this would continue to be the case following the occurrence of any foreseeable event or series of events, including extreme catastrophes, that would trigger insurance or reinsurance coverage obligations. The Group’s uses of funds include, among other things, its obligations arising in its insurance and reinsurance businesses (including claims and other payments as well as insurance provision repayments due to portfolio transfers, securitisations and commutations), which may include large and unpredictable claims (including catastrophe claims), funding of capital requirements and operating costs, payment of principal and interest on outstanding indebtedness and funding of acquisitions. The Group also has unfunded capital commitments in its private equity and hedge fund investments, which could result in funding obligations at a time when it is subject to liquidity constraints. In addition, the Group has potential collateral requirements in connection with a number of reinsurance arrangements, the amounts of which may be material and the meeting of which could require the Group to liquidate cash equivalents or other securities.
The Group manages liquidity and funding risks by focusing on the liquidity stress that is likely to result from extreme capital markets scenarios or from extreme loss events or combinations of the two. Generally, the ability to meet liquidity needs could be adversely impacted by factors that the Group cannot control, such as market dislocations or interruptions, adverse economic conditions, severe disruption in the financial and worldwide credit markets and the related increased constraints on the availability of credit; changes in interest rates, foreign exchange rates and credit spreads; or by perceptions among market participants of the extent of the Group’s liquidity needs.
Unexpected liquidity needs (including to meet collateral calls) could require the Group to increase levels of indebtedness or to liquidate investments or other assets. Should the Group require liquidity at a time when access to bank funding and the capital markets is limited, it may be unable to secure new sources of funding. The Group’s ability to meet liquidity needs through asset sales may be constrained by market conditions and the related stress on valuations. In addition, the Group’s ability to meet liquidity needs through the incurrence of debt may be limited by constraints on the general availability of credit in the case of bank funding, and adverse market conditions, in the case of capital markets debt. Failure to meet covenants in lending arrangements could further constrain access to liquidity. The Group’s ability to meet liquidity needs may also be constrained by regulatory requirements that require regulated entities to maintain or increase regulatory capital, or that restrict intra-
Credit risk
Liquidity risks

Swiss Re Financial Condition Report 2020 127
group transactions, the timing of dividend payments from subsidiaries or the fact that certain assets may be encumbered or are otherwise not tradeable. Finally, any adverse ratings action against the Group could trigger a need for further liquidity (for example, by triggering termination provisions or margin calls/collateral delivery requirements in contracts to which Swiss Re is a party) at a time when the Group’s ability to obtain liquidity from external sources is limited by such ratings action. See also “Risks relating to credit rating downgrades.”
The Group is exposed to the risk of defaults, or concerns about defaults, by its counterparties. Issuers or borrowers whose securities or loans the Group holds, trading counterparties, counterparties under swaps and other derivative contracts, clearing agents, clearing houses and other financial intermediaries may default on their obligations to the Group due to bankruptcy, insolvency, lack of liquidity, adverse economic conditions, operations failure, fraud or other reasons, which could also have a material adverse effect on the Group. The Group has increased its allocation to higher return-generating strategies, including high-quality corporate debt and some alternative assets, which tend to also be subject to potentially greater counterparty risk.
The Group could also be adversely affected by the insolvency of, or other credit constraints affecting, counterparties in its insurance and reinsurance operations. Moreover, the Group could be adversely affected by liquidity issues at ceding companies or at third parties to whom the Group has retroceded risk, and such risk could be exacerbated to the extent any such exposures are concentrated.
Ratings are an important factor in establishing the competitive position of reinsurance companies. Third-party rating agencies assess and rate the financial strength of reinsurers and insurers, such as Swiss Re. These ratings are intended to measure a company’s ability to repay its obligations and are based upon criteria established by the rating agencies. Ratings may be solicited or unsolicited and may be revised downward or revoked at the sole discretion of the rating agencies.
The Group’s ratings reflect the current opinion of the relevant rating agencies. One or more of the Group’s ratings could be downgraded or withdrawn in the future. In addition, unsolicited ratings may also be downgraded or withdrawn, such as a downgrade in April 2020 of unsolicited insurer financial strength and long-term issuer default ratings assigned to various entities within the Group. Rating agencies may increase the frequency and scope of ratings reviews, revise their criteria or take other actions that may negatively impact the Group’s ratings and/or the ratings of its legal entities, which it cannot predict. In addition, changes to the process or methodology of issuing ratings, or the occurrence of events or developments affecting the Group, could adversely affect the Group’s existing ratings or make it more difficult for the Group to achieve improved ratings which it would otherwise have expected.
As claims paying and financial strength ratings are key factors in establishing the competitive position of reinsurers, a decline in Swiss Re’s ratings and/or the ratings of its key rated legal entities could make reinsurance provided by the Group less attractive to clients relative to reinsurance from competitors with similar or stronger ratings. A decline in ratings could also cause the loss of clients who are required by policy or regulation to purchase reinsurance only from reinsurers with certain ratings. Certain larger reinsurance and derivative contracts may contain terms that would allow the ceding companies or counterparties to terminate the contract if the Group’s ratings or those of its subsidiaries are downgraded beyond a certain threshold. Furthermore, ratings directly impact the availability and terms of unsecured financing (potentially impacting the Group’s ability to rollover existing facilities or obtain new facilities) and declines in the Group’s ratings or the ratings of legal entities within the Group could also obligate the Group to provide collateral or other guarantees in the course of its business or trigger early termination of funding arrangements, potentially resulting in a need for additional liquidity. As a ratings decline could also have a material adverse impact on the Group’s costs of borrowing
Counterparty risks
Risks relating to credit rating downgrades

128 Swiss Re Financial Condition Report 2020
Appendix
or ability to access the capital markets, the adverse implications of a downgrade could be more severe. These same factors could also impact the Group’s insurance business.
In the ordinary course of business, the Group is involved in lawsuits, arbitrations and other formal and informal dispute resolution procedures, the outcomes of which determine the Group’s rights and obligations under insurance, reinsurance or other contractual agreements. From time to time, the Group may institute, or be named as a defendant in, legal proceedings, and the Group may be a claimant or respondent in arbitration proceedings. These proceedings could involve coverage or other disputes with ceding companies, disputes with parties to which the Group transfers risk under reinsurance arrangements, disputes with other counterparties or other matters. The Group cannot predict the outcome of any of the foregoing, which could be material for the Group.
The Group could in the future be involved in investigations and regulatory proceedings, which could result in adverse judgments, settlements, fines and other outcomes. These investigations and proceedings could relate to insurance or reinsurance matters, or could involve broader business conduct rules, including those in respect of market abuse, bribery, money laundering, trade sanctions, and data protection and privacy. The Group also is subject to audits and challenges from time to time by tax authorities, which could result in increases in tax costs, changes to internal structures and interest and penalties. Tax authorities may also actively pursue additional taxes based on retroactive changes to tax laws. The Group could be subject to risks arising from alleged, or actual, violations of any of the foregoing, and could also be subject to litigation or enforcement actions arising from potential employee misconduct, including non-compliance with internal policies and procedures, negligence and malfeasance, such as undertaking or facilitating cyber-attacks on internal systems. Substantial legal liability could materially adversely affect the Group’s business, financial condition or results of operations or could cause significant reputational harm, which could seriously affect its business.
As part of the Group’s ordinary course operations, the Group is subject to a variety of risks, including risks that reserves may not adequately cover future claims and benefits; risks that catastrophic events (including natural catastrophes, such as hurricanes, cyclones, tornadoes, windstorms, hailstorms, wildfires, floods and earthquakes, as well as extreme space weather events such as solar storms and geomagnetic activity, and man-made disasters, such as acts of terrorism, cyberattacks and other disasters such as explosions, industrial accidents and fires, as well as pandemics) are inherently unpredictable in terms of both their frequency and severity and have exposed, and may continue to expose, the Group to unexpected large losses (and related uncertainties in estimating future claims in respect of such events); changes in the insurance industry that affect ceding companies, particularly those that further increase their sensitivity to counterparty risk; competitive conditions (including as a result of consolidation and the availability of significant levels of alternative capacity); cyclicality of the industry; risks related to emerging claims and coverage issues (including, in particular, social inflation), which trends may potentially be exacerbated by the COVID-19 crisis; macro developments giving rise to emerging risks, such as climate change and technological developments (including greater exposure to cyber risks (where accumulation risk is yet to be fully understood), which could have a range of consequences from operational disruption, to loss of proprietary or customer data, to greater regulatory burdens and potential liability); risks arising from the Group’s dependence on policies, procedures and expertise of ceding companies; risks related to investments in emerging markets; and risks related to the failure of, or attacks directed at, the Group’s operational systems and infrastructure, including its information technology networks and systems. Any of the foregoing, as well as the occurrence of future risks that the Group’s risk management procedures fail to identify or anticipate, could have a material adverse effect on the Group, and could also give rise to reputational risk.
Legal and regulatory risks
Insurance, operational and other risks

Swiss Re Financial Condition Report 2020 129
The Group is subject to risks relating to the preparation of estimates and assumptions that its management uses, for example, as part of its risk models as well as those that affect the reported amounts of assets, liabilities, revenues and expenses in the Group’s financial statements (such as assumptions related to the Group’s capital requirements and anticipated liabilities), including assumed and ceded business. For example, the Group estimates premiums pending receipt of actual data from ceding companies, which actual data could deviate from the estimates (and could be adversely affected if premiums turn out to be lower, while claims stay the same). In addition, particularly with respect to large natural catastrophes, it may be difficult to estimate losses, and preliminary estimates may be subject to a high degree of uncertainty and change as new information becomes available. Deterioration in market conditions could have an adverse impact on assumptions used for financial reporting purposes, which could affect possible impairment of present value of future profits, fair value of assets and liabilities, deferred acquisition costs or goodwill. Moreover, regulators could require the use of standard models instead of permitting the use of internal models. To the extent that management’s estimates or assumptions prove to be incorrect, it could have a material impact on underwriting results (in the case of risk models) or on reported financial condition or results of operations (in the case of accounting judgments), and such impact could be material.
The Group’s results may be impacted by changes in accounting standards, or changes in the interpretation of accounting standards. Changes in accounting standards could impact future reported results or require restatement of past reported results. The Group’s results may also be impacted if regulatory authorities take issue with any conclusions the Group may reach in respect of accounting matters.
The Group uses non-GAAP financial measures in its external financial reporting. These measures are not prepared in accordance with US GAAP or any other comprehensive set of accounting rules or principles and should not be viewed as a substitute for measures prepared in accordance with US GAAP. Moreover, these may be different from, or otherwise inconsistent with, non-GAAP financial measures used by other companies. These measures have inherent limitations, are not required to be uniformly applied and are not audited.
The Group includes in its annual report a section in respect of its results, including financial statements, prepared in accordance with the Group’s proprietary economic value management (“EVM”) principles (“EVM report”). Financial information included in the EVM report contains non-GAAP financial measures. The EVM principles differ significantly from US GAAP and, accordingly, the Group’s results prepared in accordance with US GAAP will differ from its EVM results, and those differences could be material. The Group’s annual EVM results can be more volatile than the US GAAP results because, among others, assets and liabilities are measured on a market consistent basis, profit recognition on new contracts is recognised at inception rather than over the life time of the contract, and life and health actuarial assumptions are on a best estimate basis as opposed to generally being locked-in. The Group’s EVM financial statements should not be viewed as a substitute for the Group’s US GAAP financial statements.
Swiss Re is a holding company, a legal entity separate and distinct from its subsidiaries, including Swiss Reinsurance Company Ltd. As a holding company with no operations of its own, Swiss Re is dependent upon dividends and other payments from its direct and indirect operating subsidiaries. The Group is in the process of streamlining its legal entity structure, with the expectation that, over time, its structure will continue to evolve. In the future it may, for example, elect again to partner with minority investors or may elect otherwise to dispose of interests in Group businesses or portions thereof, or to grow through acquisitions. To the extent it undertakes acquisitions, it is subject to the risks inherent in acquiring and integrating new operations.
Use of models; accounting matters
Risks related to the Swiss Re corporate structure

© 2021 Swiss Re. All rights reserved
Swiss Re Ltd Mythenquai 50/60 P.O. Box 8022 Zurich Switzerland
Telephone +41 43 285 2121 Fax +41 43 282 2999 www.swissre.com