Financial Characteristics doc - Illinois FBFM Characteristics doc.pdf · establishing guidelines...
27
Financial Characteristics of Illinois Farms 2014 – 2015
Transcript of Financial Characteristics doc - Illinois FBFM Characteristics doc.pdf · establishing guidelines...

Financial Characteristics of Illinois Farms
2014 – 2015

Introduction
A considerable amount of attention has been given to the measurement of the financial characteristics of farm businesses. The American Bankers Association formed the Farm Financial Standards Task Force (now Farm Financial Standards Council) to make recommendations regarding standards for farm financial reporting and analysis. The recommendations from the council outline the terminology, ratio computation and interpretation to be used in farm financial analysis. When data are available, the financial characteristics reported in this publication follow the recommended format.
For many years, Robert Morris Associates (RMA) has produced comparative historical financial data for a wide range of businesses. These data have aided businesses, lenders and other professionals in establishing guidelines for the financial analysis of a specific business. This study provides similar information for farm businesses. The format and procedures used to calculate the financial measures resemble those used by RMA. This study continues the research initiated in the publication Financial Characteristics of Illinois Farms: 1985-86.
The purpose of this study is to describe the financial performance and characteristics of a sample of Illinois farms. The composite attributes and distribution of the data are described followed by a set of tables which contain common-size financial statements and widely used financial ratios. Each of the tables is grouped into categories based on size, type, tenure, age and financial structure of the farm business. This grouping serves three main purposes. First, an individual can compare his or her farm operation and performance measures to farms with similar characteristics. Second, lenders and other parties can use the data as benchmarks in credit evaluations and other financial analyses. Third, the tables provide information about the aggregate structure and performance of the farm sector.
Because the farms in the data base are from the Midwest, the financial measures included on the tables are not intended to be absolute norms for the farm sector; rather, the intention is to set up some general guidelines for analysis of farm businesses.

Tables and Figure
Table 1. Sample Farms Distribution by Location
Table 2. Sample Farms Distribution by Farm Type
Table 3. Financial Measures for Farms by Farm Type
Table 4. Financial Measures for Farms by Debt to Asset Ratio
Table 5. Financial Measures for Grain Farms by Farm Size Tillable Acres
Table 6. Financial Measures for Farms by Farm Size Total Assets
Table 7. Financial Measures for Farms by Farm Size Net Worth
Table 8. Financial Measures for Farms by Farm Size Value of Farm Production
Table 9. Financial Measures for Farms by Tenure Level
Table 10. Financial Measures for Farms by Net Farm Income Level
Table 11. Financial Measures for Farms by Rate of Return on Farm Assets
Table 12. Financial Measures for Farms by Age of Operator
Table 13. Financial Measures for Hog Farms and Grain Farms, 2001-2005
Table 14. Modified Cost vs. Fair Market Value Comparison of Financial Measures, 2005
Table 15. Working Capital to VFP across select producer characteristics, 2004-2005
Table 16. Term Debt and Capital Lease Ratio across producer characteristics, 2004-2005
Figure 1. Machinery Investment by Tillable Acre

DESCRIPTION OF THE DATA
Approximately 5,700 farms (cooperators) are enrolled in the Illinois Farm Business Farm Management Association (FBFM). This includes about one of every four farms in Illinois having over 500 acres or total farm sales over $100,000. Farmers' records are carefully screened and edited by professional field staff who certify about 2,600 farm records as usable for comparative analysis.
In 1985, FBFM initiated a review process of cooperators' balance sheets. Some of the criteria used for this review process are listed below:
• Sole proprietors only. • Current liabilities must be free of significant omissions due to the oversight of accounts
payable, accrued interest, accrued income taxes and current portions of intermediate and long term debt.
• Accounts receivable and prepaid expenses must be specifically examined by the field staff to check for any errors and/or omissions.
• Non-farm assets and liability data must be complete. • Beginning balance plus money borrowed must equal ending balance plus principal paid for
each loan. • Valuation of any equity in leased equipment must be added to the fair market value of
equipment.
For the balance sheet information to enter the final data set, the following two criteria also had to be met:
• Value of farm production greater than $40,000. • Classified as a full time farmer. In this study, a farmer is classified as a full time farmer if three
or more months of operator labor are used in the farm business.
There were 2,601 certified balance sheets in 2015 and 2,692 in 2001. Table 1 shows the distribution of these farms by location in Illinois for 2015. About 70 percent of the sample farms are located in central Illinois.
Table 2 shows the distribution of farms by farm type. About 95 percent of the farms in the sample are grain farms. Grain farms, as defined in this study, are farms where the value of feed fed to livestock is less than 40 percent of the crop returns. The remaining farms in the sample are primarily hog farms (farms on which the value of feed fed was more than 40 percent of the crop returns and the hog enterprise received more than half of the value of feed fed) and dairy farms.

DEFINITIONS OF TERMS
Acres: Tillable acres farmed by the operator.
Age: Age of the FBFM cooperator.
Assets: The fair market value of operator's assets included on the balance sheet.
Beef farms: Farms on which the value of feed fed was more than 40 percent of the crop returns and the beef enterprise received more than half of the value of the feed fed.
Current assets: Current assets generally include items that can be quickly converted to cash without loss of value or items that are used up during the normal business cycle of the farm operation. For this study, current assets include the fair market value of the following items:
• Cash • Hedging account balances • Savings account balances • Marketable stocks and bonds • Accounts receivable • Crop and feed inventories • Market livestock • Prepaid expenses • Other current items
Current liabilities: Obligations that are payable within the following 12 months. Current liabilities include the following items:
• Short term operating notes • Accounts payable • Accrued taxes • Accrued interest • Principal on intermediate and long term notes due in 1 year • Other current liabilities
Dairy farms: Farms on which the value of feed fed was more than 40 percent of the crop returns and the dairy enterprise received more than one third of the value of the feed fed.
Depreciation: The allocation of the cost of assets over the projected life of the assets. In 2003, Illinois FBFM changed the depreciation calculation method from a tax depreciation to an economic depreciation. Economic depreciation does not include additional bonus depreciation, expense election, or rapid acceleration of depreciation currently allowed by the Internal Revenue Service. The change in methods was used to more closely reflect the actual decline in depreciable assets from year to year.
Farm assets: Total fair market value of total assets excluding the following items:
• Marketable stocks and bonds • Other and non farm current assets • Cash value life insurance • Home furnishings and personal items • Retirement accounts • Notes receivable I.T. • Contracts and notes receivable L.T.

• Non farm real estate • Personal residence
Farm equity: The difference between fair market value of farm assets and the amount of liabilities.
Fixed assets: Fixed assets are items that are used or held in the business over a long period of time. A general rule of thumb is a period of 10 years or more. The land valuation procedures are discussed below. Fixed assets include the fair market value of the following items:
• Farm real estate • Buildings and improvements • Personal residence • Other non farm real estate • Contracts and notes receivable • Other fixed assets
Grain farms: Farms where the value of the feed fed to all livestock enterprises was less than 40 percent of the crop returns.
Hog farms: Farms on which the value of feed fed was more than 40 percent of the crop returns and the hog enterprise received more than half of the value of the feed fed.
Interest expense: Cash interest paid plus or minus any change in accrued interest.
Intermediate assets: Intermediate assets are those assets that are used or held in the farm business over several years. Many of these assets are depreciated and replaced over a period of time, typically two to ten years. Both cost and fair market values of assets are kept in the records. Cost values are maintained with the tax depreciation records while fair market values are determined by the farmer and field staff based on the estimated current market value of the asset. Intermediate assets in this study include the fair market value of the following items:
• Notes receivable • Machinery, equipment and auto • Breeding livestock • Cash value life insurance • Home furnishings, personal items • Securities not readily marketable • Farm Credit System stock • Retirement accounts • Other intermediate assets
Intermediate liabilities: Intermediate liabilities are obligations typically having an original maturity of 2 to 10 years. These include the following items:
• Deferred portion of intermediate term notes • Life insurance policy notes • Other intermediate liabilities
Labor charge: The charge for unpaid family and operator labor. Labor was charged at $3,850 per month in 2014 and and $3,900 per month in 2015.
Land valuation: A basic value on bare land is established for each farm according to the soil rating.

The fair market value is entered directly by fieldstaff based on cooperators estimation.
The modified cost value of land is entered directly by fieldstaff based on what was paid for the land, including improvements. Long term liabilities: Long term liabilities are obligations having an original maturity exceeding 10 years. These include the following items:
• Deferred portion real estate mortgages • Deferred portion land contracts • Other long term liabilities Net farm income (NFI) from operations: The sum of the operator's share of gross sales plus net change in inventories less all expenses for items purchased, including interest paid and annual depreciation.
Net worth: The fair market value of assets less the amount of liabilities.
Soil Productivity Index: The average index representing the inherent productivity of all tillable land on the farm. Individual soil types are assigned an index ranging downward from 100.
Tenure: The proportion of the operator's owned acreage divided by the total acreage used in the farm operation.
Value of farm production (VFP): The total for cash value of sales of products and services, less the cost of purchased feed and livestock, plus the change in inventory values for grain and livestock, plus the change in accounts receivable, plus government payments, plus the value of farm products used on the farm.
Value of feed fed: Value of on the farm and commercial feed fed to livestock. The prices used for on the farm grains and pasture fed are standardized for all farms in the Illinois FBFM service. Commercial feeds are priced at the original cost.

DEFINITION OF RATIOS
PROFITABILITY RATIOS
Rate of Return on Farm Assets (ROA)
Computation: Net farm income from operations plus farm interest payments less unpaid labor charge for operator and family divided by average total farm assets (fair market value).
Interpretation: This ratio measures the pre tax rate of return on farm assets and can be used to measure the effective utilization of assets on the profitability of the business.
Rate of Return on Farm Equity (ROE)
Computation: Net farm income from operations less unpaid labor charge for operator and family divided by average farm equity (fair market value).
Interpretation: This ratio relates the pre tax returns to the level of equity capital employed in the farm business. Caution should be used when interpreting this ratio. A high ratio, normally associated with a profitable farm, may indicate an under capitalized farm while a low ratio, which normally indicates an inefficient or unprofitable farm, may indicate a more conservative, high equity farm. This measure, like many of the other ratios, should be used in conjunction with other ratios when analyzing a farm business.
Profit Margin Ratio
Computation: Net farm income from operations plus farm interest payments less unpaid operator and family labor divided by value of farm production.
Interpretation: This ratio is an efficiency measure that shows the return to capital and management as a percent of adjusted gross production (VFP).
LIQUIDITY RATIOS
Current Ratio
Computation: Current assets divided by current liabilities.
Interpretation: This ratio is a measure of the farmers' ability to meet short run obligations without disrupting the ongoing business. The higher the ratio, the more "cushion" the farmer has in meeting his or her current obligations. This ratio may be limited by the quality of the assets and/or the ability to quickly convert the specific current assets into cash.
Current plus Intermediate Ratio
Computation: Current plus intermediate assets divided by current plus intermediate liabilities.
Interpretation: This ratio measures farmers' utilization of short and intermediate term assets as reserves relative to debt claims against these assets. Many contractually "short term" notes are actually longer term in the expected repayment period. Thus, the classification between short and intermediate may be somewhat arbitrary. Also, many farmers obtain most of their short and intermediate term financing from the same lender. This ratio supplies beneficial information on collateral availability and secondary repayment capacity for both the borrower and the lender.

Working Capital to Value of Farm Production
Computation: Working capital (Current assets - Current liabilities) divided by value of farm production (VFP)
Interpretation: Working capital (current assets - current liabilities) is a measure of the amount of funds available to purchase inputs after the sale of current assets and the payment of all current liabilities. Working capital compared to VFP relates the amount of working capital to the size of the operation. The higher the ratio, the more liquidity the farm operation has to meet current obligations. The ratio varies across farm types and other farmer characteristics.
Debt Servicing Ratio
Computation: Farm interest expense plus annual scheduled intermediate and long term principal payments divided by value of farm production.
Interpretation: The proportion of value of farm production that must be used to meet financing costs and debt obligations.
SOLVENCY AND COVERAGE RATIOS
Debt to Equity (leverage)
Computation: Total liabilities divided by net worth.
Interpretation: This ratio expresses the extent to which debt capital is combined with equity capital. It shows the inherent risk to creditors, but at the same time may reveal the farm's potential for future growth if operating earnings exceed the fixed commitments associated with debt.
Debt to Asset
Computation: Total debt divided by total assets (fair market value).
Interpretation: This ratio is another way of expressing the risk exposure of the farm business (debt/(debt+equity)).
Interest Coverage
Computation: Net farm income from operations plus interest payments divided by interest expense.
Interpretation: This ratio is a measure of a farm's ability to meet interest payments. As the value of the interest coverage ratio increases, the farmer's exposure to financial risk decreases. The interest coverage ratio is analogous to an asset to debt ratio taken from the balance sheet. The coverage ratio relates asset returns to debt obligations for a period of time while the asset to debt ratio relates total assets to total debt at a point in time.
REPAYMENT CAPACITY
Term Debt and Capital Lease Ratio

Computation: (Net farm income from operations plus non-farm income plus depreciation plus interest on term debt plus interest on capital leases less income taxes less family living withdrawals) divided by annual scheduled principal and interest payments on term debt and capital leases
Interpretation: The measure provides a measure of the ability of the borrower to cover all term debt and capital lease payments. The greater the ratio, the greater the margin to meet all term debt and capital lease payments.
FINANCIAL EFFICIENCY RATIOS
Asset Turnover
Computation: Value of farm production divided by total average farm assets (fair market value).
Interpretation: This is a general measure of the farm's efficiency of asset utilization. The higher the ratio, the more effectively assets are used to generate revenue. This ratio typically shows wide variations across farm types.
Operating Expense Ratio
Computation: Total operating expenses less depreciation divided by value of farm production.
Interpretation: The relationship of operating expense to value of farm production. Measures the farm's efficiency of operating expense management. The measure typically varies by farm type.
Depreciation Expense Ratio
Computation: Total farm depreciation divided by value of farm production.
Interpretation: The relationship of depreciation expense to value of farm production. The measure typically varies by farm type and will vary from year to year, especially when accelerated tax depreciation methods are used to estimate depreciation.
Interest Expense Ratio
Computation: Total farm interest expense divided by value of farm production.
Interpretation: The relationship of interest expense to value of farm production. Often used as a measure of the financial risk of the farm operation.
NFI from Operations Ratio
Computation: Net farm income from operations divided by value of farm production.
Interpretation: A pre-tax efficiency measure that measures the return to labor, capital and management as a percent of value of farm production.

COMPARISON OF FINANCIAL MEASURES USING MODIFIED COST vs. FAIR MARKET VALUE ASSET VALUATION
All of the financial measures reported thus far have been calculated using asset values that are valued at their current market value. Therefore, to make proper use of Tables 3-13, analysts must also follow similar valuation procedures. Table 14 shows the difference in financial measures using assets valued at fair market value and at modified cost.
Land valuation procedures are summarized in the definition of terms section of this publication. The major difference between modified cost and fair market value occurs in the valuation of machinery, buildings and land. The modified cost values for machinery and buildings are simply the sum of original basis of each asset less accumulated tax depreciation claimed on each asset. The modified cost value of crop inventory and market livestock are normally valued at the current price. Other assets are valued at cost when information is available.
The primary purpose of this table is to show that when analyzing farm business operations, the valuation procedures used are extremely important. They are especially important when comparing an individual operation to another operation or to a sample of farms. Comparisons should not be made unless consistent asset valuation procedures have been followed.

Table 1. Sample Farms - Distribution by Location
Year Number of cooperators in this analysis
Percentage of total in this analysis
2015 Data Central Illinois 1,713 66% Northern Illinois 656 25% Southern Illinois 232 9%
2015 All Farms 2,601 2014 All Farms 2,692 2013 All Farms 2,5972012 All Farms 2,599 2011 All Farms 2,542 2010 All Farms 2,511 2009 All Farms 2,519 2008 All Farms 2,512 2007 All Farms 2,627 2006 All Farms 2,440 2005 All Farms 2,599 2004 All Farms 2,6372003 All Farms 2,6292002 All Farms 2,4832001 All Farms 2,6372000 All Farms 2,4171999 All Farms 2,4871998 All Farms 2,1501997 All Farms 2,2711996 All Farms 2,0611995 All Farms 2,022
Table 2. Sample Farms - Distribution by Farm Type
Farm Type Number of cooperators Percentage of total Grain 2,462 94.7Hog 32 1.2Dairy 59 2.3Beef Cattle 18 0.7Other 30 1.2Total 2,601 100.0
An organization of farmers enrolled in local farm management associations cooperating with the University of Illinois Department of Agricultural and Consumer Economics FBFM 2015
YEAR

Table 3. Financial Measures for Farms by Farm Type2014 Beef All 2015 Beef All
Hog Grain Dairy Cattle Farms FARM TYPE Hog Grain Dairy Cattle Farms38 2,532 53 25 2,692 NUMBER OF FARMS 32 2,462 59 18 2,6011% 94% 2% 1% 100% Percent of Sample 1% 95% 2% 1% 100%
ASSETS5.2 5.1 2.6 4.0 5.1 Cash and Equivalents 3.1 5.2 2.3 4.7 5.1
11.1 14.8 8.7 6.9 14.5 Crops and Feed 8.9 13.0 7.5 5.8 12.811.0 0.4 0.9 15.7 0.7 Market Livestock 9.5 0.3 0.7 11.7 0.5
2.9 3.6 1.5 2.1 3.5 All Other Current Assets 3.2 4.0 1.7 2.0 3.930.2 23.9 13.6 28.8 23.8 Total Current Assets 24.6 22.5 12.3 24.3 22.221.0 29.9 34.7 28.2 29.9 Intermediate Assets 23.0 30.0 36.2 31.2 30.148.9 46.2 51.7 43.0 46.4 Fixed Assets 52.4 47.6 51.6 44.5 47.7
100.0 100.0 100.0 100.0 100.0 Total 100.0 100.0 100.0 100.0 100.0LIABILITIES
14.4 7.5 3.9 11.2 7.6 Oper., short term notes <1 yr. 12.0 8.2 4.4 11.6 8.21.7 1.6 2.3 1.4 1.6 Cur. Maturities. I.T. & L.T. 1.9 1.6 2.5 2.3 1.60.2 0.1 0.1 0.0 0.1 CCC and Other Loans 0.2 0.1 0.1 0.0 0.12.2 2.0 1.2 1.1 2.0 All Other Current Liabilities 1.9 1.9 1.4 1.1 1.9
18.5 11.2 7.4 13.7 11.3 Total Current Liabilities 16.0 11.9 8.5 14.9 11.92.4 3.3 4.5 3.4 3.4 Intermediate Liabilities 3.1 3.2 5.4 4.7 3.3
12.0 8.1 16.8 7.1 8.3 Long Term Liabilities 14.2 8.8 18.7 8.3 9.132.9 22.6 28.7 24.2 22.9 Total Liabilities 33.3 23.8 32.6 28.0 24.267.1 77.4 71.3 75.8 77.1 Net Worth 66.7 76.2 67.4 72.0 75.8
100.0 100.0 100.0 100.0 100.0 Total 100.0 100.0 100.0 100.0 100.0INCOME DATA
100.0 100.0 100.0 100.0 100.0 Value of Farm Production 100.0 100.0 100.0 100.0 100.059.7 72.2 57.2 64.7 71.6 Operating Expenses 97.8 82.4 79.6 142.0 82.8
8.2 11.8 8.4 11.2 11.7 Depreciation 15.8 14.4 12.5 24.7 14.532.1 16.0 34.4 24.1 16.7 Operating Profit -13.6 3.2 7.9 -66.7 2.6
4.3 3.2 4.2 4.5 3.3 Interest Expense 7.9 4.3 6.6 10.2 4.427.8 12.8 30.2 19.6 13.4 NFI from Operations -21.4 -1.1 1.3 -76.9 -1.8
FARM DATA786 1,116 413 434 1,097 Tillable Acres 713 1,153 418 401 1,1350.28 0.22 0.45 0.31 0.23 Tenure 0.28 0.22 0.41 0.33 0.22
RATIOSPROFITABILITY
12.3 3.9 14.4 7.8 4.2 0.3 1.3 2.0 -2.8 1.37.3 1.6 7.2 4.1 1.7 Return on Farm Assets % -4.7 -0.6 -1.4 -7.7 -0.72.4 -0.4 3.4 0.0 -0.4 -7.0 -3.0 -4.4 -11.8 -3.2
16.8 4.2 19.9 12.5 4.6 -1.4 0.8 0.9 -4.4 0.89.5 1.2 8.6 4.1 1.3 Return on Farm Equity % -6.3 -1.7 -3.6 -8.0 -1.7
-0.8 -1.5 2.7 -1.3 -1.5 -17.7 -5.7 -9.5 -22.9 -6.036.7 17.3 32.6 31.7 18.1 1.2 6.4 5.1 -34.5 6.324.8 7.1 25.8 20.7 7.6 Profit Margin Ratio % -21.9 -4.9 -8.4 -87.7 -5.2
3.2 -3.3 16.3 -0.3 -3.0 -35.6 -19.8 -27.5 -123.8 -20.6LIQUIDITY
4.73 5.79 4.85 6.23 5.69 2.67 5.84 3.53 5.04 5.542.01 2.32 2.00 2.18 2.31 Current 1.56 2.05 1.36 1.86 2.011.41 1.31 1.12 1.41 1.30 1.04 1.13 0.90 1.23 1.115.56 10.06 10.06 7.99 9.97 4.54 10.42 8.09 9.40 10.193.48 4.24 4.63 3.44 4.23 Current plus Intermediate 2.98 4.02 3.88 3.53 3.962.12 2.52 2.75 2.39 2.51 1.70 2.34 2.44 2.29 2.334.07 4.04 7.92 4.64 4.14 10.22 5.35 10.62 11.79 5.539.59 9.76 11.25 10.44 9.87 Debt Servicing Ratio % 17.21 12.10 18.93 20.81 12.41
14.84 16.13 17.01 20.04 16.23 28.39 19.69 26.17 49.04 20.18SOLVENCY and COVERAGE
16.8 8.5 14.5 8.2 8.6 24.1 7.9 18.5 6.2 8.332.3 23.5 40.8 28.1 24.3 Debt/Equity % 50.3 25.5 53.2 38.5 26.472.5 51.7 73.1 51.0 52.3 89.5 56.2 82.0 109.6 57.315.1 7.8 12.7 7.6 7.9 19.4 7.4 15.6 5.8 7.724.8 19.0 29.0 21.9 19.6 Debt/Assets % 33.5 20.4 34.7 27.8 20.942.6 34.1 42.2 33.8 34.4 47.2 36.0 45.0 52.3 36.4
45.47 28.22 22.25 25.07 27.47 3.38 11.34 4.92 1.00 10.4410.07 6.68 9.73 7.92 6.87 Interest Coverage -0.09 1.96 1.59 -4.05 1.90
5.12 2.07 4.71 4.99 2.18 -3.37 -1.12 -0.85 -13.19 -1.22FINANCIAL EFFICIENCY
0.48 0.35 0.43 0.35 0.35 0.29 0.30 0.33 0.18 0.300.30 0.22 0.29 0.20 0.22 Asset Turnover 0.18 0.18 0.19 0.08 0.180.20 0.14 0.21 0.12 0.14 0.11 0.11 0.13 0.05 0.1149.2 61.9 50.2 51.6 61.1 69.9 70.3 66.3 86.2 70.359.2 71.7 56.5 57.4 70.9 Operating Expense Ratio 97.8 80.6 77.7 134.7 80.768.6 81.8 64.3 69.1 81.4 115.5 91.6 93.6 171.8 92.0
4.6 7.6 5.4 7.5 7.5 8.5 9.2 7.8 14.5 9.26.1 11.0 7.4 9.2 10.9 Depreciation Expense Ratio 12.0 13.2 11.0 20.6 13.28.7 15.0 10.8 13.1 14.8 17.9 18.5 14.5 36.2 18.51.1 0.6 1.6 0.4 0.7 2.6 0.8 2.3 3.4 0.92.9 2.3 4.3 4.1 2.3 Interest Expense Ratio 6.3 2.9 6.1 9.1 3.04.8 4.5 6.2 5.6 14.8 10.1 5.8 9.8 14.1 18.5
40.5 24.5 40.0 37.3 25.4 9.3 13.5 16.2 -8.1 13.530.5 14.2 31.1 29.4 14.8 NFI From Operations Ratio -12.2 2.5 2.1 -57.7 2.221.2 3.3 23.6 15.3 3.7 -28.7 -10.7 -13.1 -128.3 -11.1
ABSOLUTE MEASURES-$ (means)4,101,177 3,725,766 2,782,682 3,020,099 3,716,064 Assets 3,788,429 3,782,681 2,347,260 2,783,537 3,755,7421,250,188 752,435 739,017 667,758 762,216 Liabilities 1,257,874 789,518 675,989 572,109 795,5522,850,989 2,973,330 2,043,665 2,352,340 2,953,848 Net Worth 2,530,555 2,993,163 1,671,271 2,211,428 2,960,1901,138,816 634,677 683,815 484,160 643,122 Value of Farm Production 596,645 543,973 413,552 192,023 541,484
40,841 20,649 28,615 20,881 21,245 Interest Expense 44,694 23,294 26,364 19,406 23,705326,186 79,348 213,088 131,981 86,478 Net Farm Income (107,840) 3,694 6,871 (106,162) 1,606
Source: FBFM Data

2014 20150-20 21-40 41-70 71-100 > 100 DEBT TO ASSET RATIO (%) 0-20 21-40 41-70 71-100 > 100
1,379 837 444 30 2 NUMBER OF FARMS 1,260 806 469 65 151% 31% 16% 1% 0% Percent of Sample 48% 31% 18% 2% 0%
ASSETS7.2 2.9 2.7 3.9 0.0 Cash and Equivalents 7.4 2.9 2.8 3.1 0.0
12.4 15.9 18.4 18.4 0.0 Crops and Feed 10.6 13.8 16.1 17.7 0.00.4 0.7 1.2 2.3 0.0 Market Livestock 0.3 0.6 0.9 1.5 0.03.1 3.9 4.0 3.5 0.0 All Other Current Assets 3.4 4.4 4.3 4.2 0.0
23.0 23.4 26.3 28.1 0.0 Total Current Assets 21.6 21.7 24.1 26.5 0.027.5 32.0 33.2 27.8 0.0 Intermediate Assets 27.6 31.6 34.3 29.4 0.049.4 44.6 40.5 44.1 0.0 Fixed Assets 50.8 46.7 41.5 44.0 0.0
100.0 100.0 100.0 100.0 0.0 Total 100.0 100.0 100.0 100.0 0.0LIABILITIES
2.5 9.7 17.6 24.9 0.0 Oper., short term notes <1 yr. 2.4 10.2 17.6 27.3 0.00.8 2.1 2.9 3.8 0.0 Cur. Maturities. I.T. & L.T. 0.8 2.0 3.0 3.4 0.00.0 0.1 0.4 1.2 0.0 CCC and Other Loans 0.0 0.2 0.3 0.6 0.01.6 2.1 2.8 2.5 0.0 All Other Current Liabilities 1.4 1.9 3.0 3.7 0.04.9 14.1 23.8 32.3 0.0 Total Current Liabilities 4.5 14.3 23.9 35.0 0.01.4 4.5 6.8 10.7 0.0 Intermediate Liabilities 1.2 3.8 7.0 9.4 0.02.5 10.8 19.9 35.2 0.0 Long Term Liabilities 2.5 11.2 19.8 33.8 0.08.8 29.4 50.5 78.2 0.0 Total Liabilities 8.3 29.3 50.7 78.2 0.0
91.2 70.6 49.5 21.8 0.0 Net Worth 91.7 70.7 49.3 21.8 0.0100.0 100.0 100.0 100.0 0.0 Total 100.0 100.0 100.0 100.0 0.0
INCOME DATA100.0 100.0 100.0 100.0 100.0 Value of Farm Production 100.0 100.0 100.0 100.0 100.069.6 72.6 75.3 77.9 0.0 Operating Expenses 81.5 83.3 84.3 93.0 0.012.5 11.9 9.6 5.7 0.0 Depreciation 16.0 14.3 11.8 8.6 0.017.9 15.6 15.1 16.3 100.0 Operating Profit 2.6 2.4 4.0 -1.6 100.01.6 4.6 5.9 7.1 0.0 Interest Expense 2.1 5.9 7.6 9.3 0.0
16.3 11.0 9.1 9.2 100.0 NFI from Operations 0.5 -3.5 -3.6 -10.9 100.0FARM DATA
938 1,269 1,265 1,072 0 Tillable Acres 996 1,284 1,264 1,031 00.28 0.19 0.12 0.15 0.00 Tenure 0.28 0.20 0.14 0.11 0.00
RATIOSPROFITABILITY
3.3 4.5 6.7 9.0 0.0 0.9 1.5 2.0 0.8 0.01.5 1.8 2.3 4.2 0.0 Return on Farm Assets % -0.6 -0.7 -0.7 -2.9 0.0
-0.3 -0.3 -1.1 -0.3 0.0 -2.5 -3.4 -4.4 -8.9 0.03.4 5.2 11.2 43.9 na 0.8 0.8 0.6 -6.6 na1.4 1.2 0.7 11.9 na Return on Farm Equity % -0.9 -2.4 -5.4 -35.7 na
-0.6 -1.9 -6.3 -18.6 na -3.2 -6.8 -13.7 -69.8 na19.0 17.4 16.1 12.5 0.0 6.7 6.6 6.0 0.1 0.09.0 7.1 6.0 4.3 0.0 Profit Margin Ratio % -6.3 -4.0 -4.1 -6.8 0.0
-3.0 -2.3 -4.3 -2.2 0.0 -22.7 -19.0 -18.5 -29.8 0.0LIQUIDITY
11.55 2.25 1.43 1.10 0.00 12.34 2.10 1.26 0.91 0.005.21 1.59 1.10 0.84 0.00 Current 5.32 1.44 0.99 0.73 0.002.72 1.20 0.83 0.71 0.00 2.59 1.05 0.73 0.60 0.00
19.20 3.83 2.40 1.78 0.00 21.22 3.87 2.37 1.47 0.009.26 2.93 1.96 1.29 0.00 Current plus Intermediate 10.09 2.92 1.90 1.25 0.005.15 2.39 1.61 1.15 0.00 5.39 2.28 1.58 1.09 0.000.34 9.11 9.91 10.15 0.00 0.34 11.04 11.56 12.55 0.005.65 13.54 14.75 13.35 0.00 Debt Servicing Ratio % 7.03 16.47 17.97 15.95 0.00
11.00 19.84 21.02 22.61 0.00 13.47 23.96 26.13 26.36 0.00SOLVENCY and COVERAGE
3.3 31.7 77.4 264.9 na 2.7 32.2 78.5 259.3 na8.9 41.6 96.9 356.0 na Debt/Equity % 7.8 40.9 97.0 307.0 na
16.2 51.6 126.9 438.6 na 15.6 51.5 127.8 525.5 na3.2 24.1 43.6 72.6 0.0 2.6 24.4 44.0 72.2 0.08.2 29.4 49.2 78.1 0.0 Debt/Assets % 7.2 29.1 49.2 75.4 0.0
13.9 34.1 55.9 81.4 0.0 13.5 34.0 56.1 84.0 0.0345.30 8.16 5.64 5.77 0.00 113.35 3.72 3.10 1.91 0.0020.68 4.06 2.89 2.72 0.00 Interest Coverage 5.93 1.05 1.06 0.42 0.006.03 1.39 0.74 1.18 0.00 -1.39 -1.34 -0.76 -0.97 0.00
FINANCIAL EFFICIENCY0.26 0.37 0.52 0.85 0.00 0.21 0.31 0.45 0.63 0.000.17 0.25 0.36 0.52 0.00 Asset Turnover 0.13 0.20 0.32 0.35 0.000.11 0.18 0.25 0.35 0.00 0.09 0.15 0.20 0.26 0.0059.3 62.6 65.4 74.3 0.0 68.8 70.8 73.1 78.2 0.068.5 72.0 76.0 79.0 0.0 Operating Expense Ratio 78.5 81.9 82.2 88.6 0.078.4 82.4 86.1 87.6 0.0 90.6 91.8 94.6 102.5 0.07.8 7.9 5.9 3.0 0.0 10.1 9.5 7.5 4.6 0.0
11.6 11.0 8.8 4.3 0.0 Depreciation Expense Ratio 14.7 13.1 11.0 7.0 0.015.9 14.6 12.6 7.7 0.0 20.4 18.0 14.9 10.5 0.00.1 2.1 2.9 3.0 0.0 0.1 2.7 3.6 4.8 0.00.9 3.7 4.7 4.2 0.0 Interest Expense Ratio 1.1 4.6 5.6 7.4 0.02.3 5.9 7.6 9.2 0.0 2.9 7.4 9.8 11.5 0.0
28.5 22.0 20.4 18.0 0.0 16.4 10.7 10.7 6.0 0.017.8 12.2 9.0 10.5 0.0 NFI From Operations Ratio 4.9 0.1 0.4 -5.2 0.07.7 2.5 -1.5 1.9 0.0 -9.4 -12.6 -14.4 -22.4 0.0
ABSOLUTE MEASURES-$ (means)3,968,534 3,882,904 2,788,390 1,418,715 0 Assets 4,144,376 3,913,685 2,759,893 1,487,734 0
340,178 1,123,714 1,368,600 1,127,566 0 Liabilities 346,508 1,136,776 1,366,533 1,141,043 03,628,356 2,759,190 1,419,789 291,150 0 Net Worth 3,797,868 2,776,909 1,393,360 346,690 0
529,008 762,762 774,894 629,750 0 Value of Farm Production 450,045 641,790 626,108 453,172 07,798 31,602 42,710 34,098 0 Interest Expense 8,773 33,933 44,288 36,902 0
94,944 87,340 61,503 43,974 0 Net Farm Income 18,606 (4,749) (25,274) (53,680) 0
Table 4. Financial Measures for Farms by Debt to Asset Ratio
Source: FBFM Data
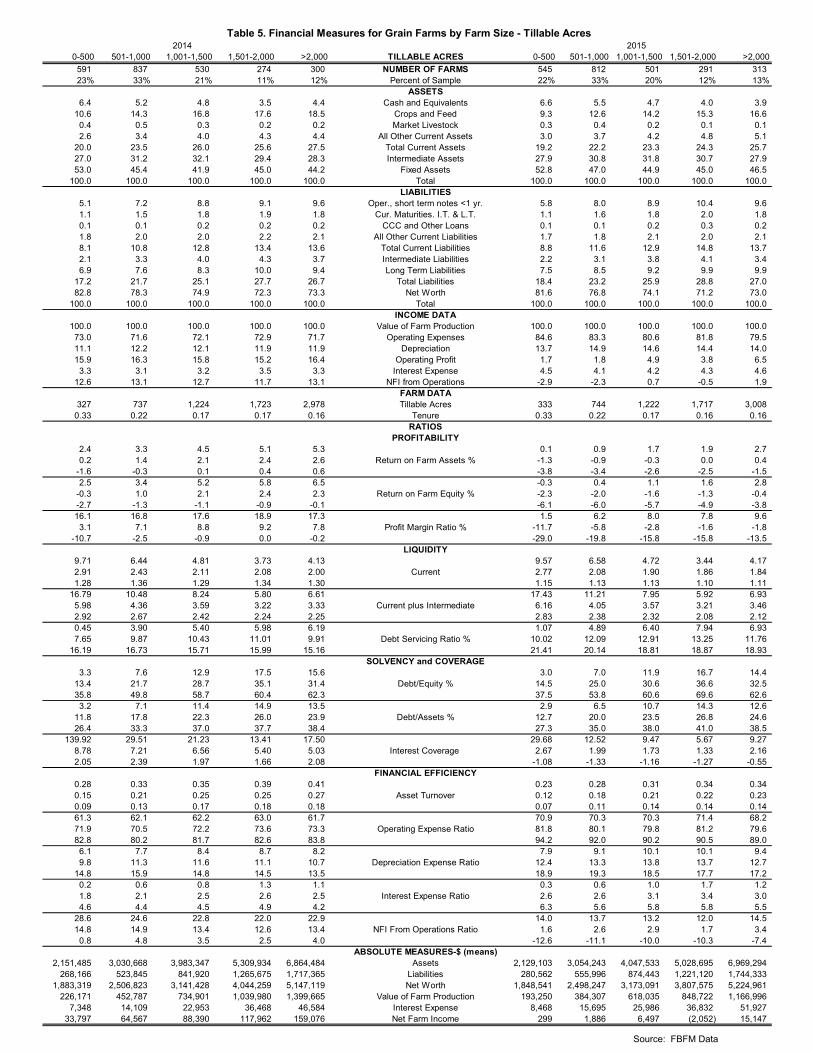
2014 20150-500 501-1,000 1,001-1,500 1,501-2,000 >2,000 TILLABLE ACRES 0-500 501-1,000 1,001-1,500 1,501-2,000 >2,000591 837 530 274 300 NUMBER OF FARMS 545 812 501 291 31323% 33% 21% 11% 12% Percent of Sample 22% 33% 20% 12% 13%
ASSETS6.4 5.2 4.8 3.5 4.4 Cash and Equivalents 6.6 5.5 4.7 4.0 3.9
10.6 14.3 16.8 17.6 18.5 Crops and Feed 9.3 12.6 14.2 15.3 16.60.4 0.5 0.3 0.2 0.2 Market Livestock 0.3 0.4 0.2 0.1 0.12.6 3.4 4.0 4.3 4.4 All Other Current Assets 3.0 3.7 4.2 4.8 5.1
20.0 23.5 26.0 25.6 27.5 Total Current Assets 19.2 22.2 23.3 24.3 25.727.0 31.2 32.1 29.4 28.3 Intermediate Assets 27.9 30.8 31.8 30.7 27.953.0 45.4 41.9 45.0 44.2 Fixed Assets 52.8 47.0 44.9 45.0 46.5
100.0 100.0 100.0 100.0 100.0 Total 100.0 100.0 100.0 100.0 100.0LIABILITIES
5.1 7.2 8.8 9.1 9.6 Oper., short term notes <1 yr. 5.8 8.0 8.9 10.4 9.61.1 1.5 1.8 1.9 1.8 Cur. Maturities. I.T. & L.T. 1.1 1.6 1.8 2.0 1.80.1 0.1 0.2 0.2 0.2 CCC and Other Loans 0.1 0.1 0.2 0.3 0.21.8 2.0 2.0 2.2 2.1 All Other Current Liabilities 1.7 1.8 2.1 2.0 2.18.1 10.8 12.8 13.4 13.6 Total Current Liabilities 8.8 11.6 12.9 14.8 13.72.1 3.3 4.0 4.3 3.7 Intermediate Liabilities 2.2 3.1 3.8 4.1 3.46.9 7.6 8.3 10.0 9.4 Long Term Liabilities 7.5 8.5 9.2 9.9 9.9
17.2 21.7 25.1 27.7 26.7 Total Liabilities 18.4 23.2 25.9 28.8 27.082.8 78.3 74.9 72.3 73.3 Net Worth 81.6 76.8 74.1 71.2 73.0
100.0 100.0 100.0 100.0 100.0 Total 100.0 100.0 100.0 100.0 100.0INCOME DATA
100.0 100.0 100.0 100.0 100.0 Value of Farm Production 100.0 100.0 100.0 100.0 100.073.0 71.6 72.1 72.9 71.7 Operating Expenses 84.6 83.3 80.6 81.8 79.511.1 12.2 12.1 11.9 11.9 Depreciation 13.7 14.9 14.6 14.4 14.015.9 16.3 15.8 15.2 16.4 Operating Profit 1.7 1.8 4.9 3.8 6.53.3 3.1 3.2 3.5 3.3 Interest Expense 4.5 4.1 4.2 4.3 4.6
12.6 13.1 12.7 11.7 13.1 NFI from Operations -2.9 -2.3 0.7 -0.5 1.9FARM DATA
327 737 1,224 1,723 2,978 Tillable Acres 333 744 1,222 1,717 3,0080.33 0.22 0.17 0.17 0.16 Tenure 0.33 0.22 0.17 0.16 0.16
RATIOSPROFITABILITY
2.4 3.3 4.5 5.1 5.3 0.1 0.9 1.7 1.9 2.70.2 1.4 2.1 2.4 2.6 Return on Farm Assets % -1.3 -0.9 -0.3 0.0 0.4
-1.6 -0.3 0.1 0.4 0.6 -3.8 -3.4 -2.6 -2.5 -1.52.5 3.4 5.2 5.8 6.5 -0.3 0.4 1.1 1.6 2.8
-0.3 1.0 2.1 2.4 2.3 Return on Farm Equity % -2.3 -2.0 -1.6 -1.3 -0.4-2.7 -1.3 -1.1 -0.9 -0.1 -6.1 -6.0 -5.7 -4.9 -3.816.1 16.8 17.6 18.9 17.3 1.5 6.2 8.0 7.8 9.63.1 7.1 8.8 9.2 7.8 Profit Margin Ratio % -11.7 -5.8 -2.8 -1.6 -1.8
-10.7 -2.5 -0.9 0.0 -0.2 -29.0 -19.8 -15.8 -15.8 -13.5LIQUIDITY
9.71 6.44 4.81 3.73 4.13 9.57 6.58 4.72 3.44 4.172.91 2.43 2.11 2.08 2.00 Current 2.77 2.08 1.90 1.86 1.841.28 1.36 1.29 1.34 1.30 1.15 1.13 1.13 1.10 1.11
16.79 10.48 8.24 5.80 6.61 17.43 11.21 7.95 5.92 6.935.98 4.36 3.59 3.22 3.33 Current plus Intermediate 6.16 4.05 3.57 3.21 3.462.92 2.67 2.42 2.24 2.25 2.83 2.38 2.32 2.08 2.120.45 3.90 5.40 5.98 6.19 1.07 4.89 6.40 7.94 6.937.65 9.87 10.43 11.01 9.91 Debt Servicing Ratio % 10.02 12.09 12.91 13.25 11.76
16.19 16.73 15.71 15.99 15.16 21.41 20.14 18.81 18.87 18.93SOLVENCY and COVERAGE
3.3 7.6 12.9 17.5 15.6 3.0 7.0 11.9 16.7 14.413.4 21.7 28.7 35.1 31.4 Debt/Equity % 14.5 25.0 30.6 36.6 32.535.8 49.8 58.7 60.4 62.3 37.5 53.8 60.6 69.6 62.63.2 7.1 11.4 14.9 13.5 2.9 6.5 10.7 14.3 12.6
11.8 17.8 22.3 26.0 23.9 Debt/Assets % 12.7 20.0 23.5 26.8 24.626.4 33.3 37.0 37.7 38.4 27.3 35.0 38.0 41.0 38.5
139.92 29.51 21.23 13.41 17.50 29.68 12.52 9.47 5.67 9.278.78 7.21 6.56 5.40 5.03 Interest Coverage 2.67 1.99 1.73 1.33 2.162.05 2.39 1.97 1.66 2.08 -1.08 -1.33 -1.16 -1.27 -0.55
FINANCIAL EFFICIENCY0.28 0.33 0.35 0.39 0.41 0.23 0.28 0.31 0.34 0.340.15 0.21 0.25 0.25 0.27 Asset Turnover 0.12 0.18 0.21 0.22 0.230.09 0.13 0.17 0.18 0.18 0.07 0.11 0.14 0.14 0.1461.3 62.1 62.2 63.0 61.7 70.9 70.3 70.3 71.4 68.271.9 70.5 72.2 73.6 73.3 Operating Expense Ratio 81.8 80.1 79.8 81.2 79.682.8 80.2 81.7 82.6 83.8 94.2 92.0 90.2 90.5 89.06.1 7.7 8.4 8.7 8.2 7.9 9.1 10.1 10.1 9.49.8 11.3 11.6 11.1 10.7 Depreciation Expense Ratio 12.4 13.3 13.8 13.7 12.7
14.8 15.9 14.8 14.5 13.5 18.9 19.3 18.5 17.7 17.20.2 0.6 0.8 1.3 1.1 0.3 0.6 1.0 1.7 1.21.8 2.1 2.5 2.6 2.5 Interest Expense Ratio 2.6 2.6 3.1 3.4 3.04.6 4.4 4.5 4.9 4.2 6.3 5.6 5.8 5.8 5.5
28.6 24.6 22.8 22.0 22.9 14.0 13.7 13.2 12.0 14.514.8 14.9 13.4 12.6 13.4 NFI From Operations Ratio 1.6 2.6 2.9 1.7 3.40.8 4.8 3.5 2.5 4.0 -12.6 -11.1 -10.0 -10.3 -7.4
ABSOLUTE MEASURES-$ (means)2,151,485 3,030,668 3,983,347 5,309,934 6,864,484 Assets 2,129,103 3,054,243 4,047,533 5,028,695 6,969,294
268,166 523,845 841,920 1,265,675 1,717,365 Liabilities 280,562 555,996 874,443 1,221,120 1,744,3331,883,319 2,506,823 3,141,428 4,044,259 5,147,119 Net Worth 1,848,541 2,498,247 3,173,091 3,807,575 5,224,961
226,171 452,787 734,901 1,039,980 1,399,665 Value of Farm Production 193,250 384,307 618,035 848,722 1,166,9967,348 14,109 22,953 36,468 46,584 Interest Expense 8,468 15,695 25,986 36,832 51,927
33,797 64,567 88,390 117,962 159,076 Net Farm Income 299 1,886 6,497 (2,052) 15,147
Table 5. Financial Measures for Grain Farms by Farm Size - Tillable Acres
Source: FBFM Data

2014 20150-1 1.1-1.75 1.76-2.5 2.6-3.25 >3.25 TOTAL ASSETS ($Millions) 0-1 1.1-1.75 1.76-2.5 2.6-3.25 >3.25
269 424 418 378 1,203 NUMBER OF FARMS 281 388 407 371 1,15410% 16% 16% 14% 45% Percent of Sample 11% 15% 16% 14% 44%
ASSETS7.3 5.2 4.6 5.2 4.7 Cash and Equivalents 6.8 5.1 4.6 5.0 4.9
20.3 16.7 15.2 14.6 12.3 Crops and Feed 18.7 14.5 13.7 12.4 10.51.1 0.8 0.8 0.6 0.5 Market Livestock 1.0 0.6 0.5 0.6 0.34.5 3.5 3.4 3.5 3.2 All Other Current Assets 5.4 4.2 4.0 3.8 3.4
33.2 26.2 24.0 24.0 20.7 Total Current Assets 31.8 24.4 22.9 21.8 19.139.4 36.7 32.8 29.8 24.3 Intermediate Assets 39.6 37.7 33.3 30.1 24.127.4 37.1 43.2 46.2 55.0 Fixed Assets 28.6 37.9 43.8 48.1 56.8
100.0 100.0 100.0 100.0 100.0 Total 100.0 100.0 100.0 100.0 100.0LIABILITIES
11.9 9.5 8.2 7.5 5.7 Oper., short term notes <1 yr. 13.1 11.0 9.1 8.1 5.82.2 1.9 1.7 1.7 1.3 Cur. Maturities. I.T. & L.T. 2.4 2.0 1.8 1.6 1.30.2 0.2 0.1 0.1 0.1 CCC and Other Loans 0.1 0.2 0.2 0.1 0.13.4 2.3 2.1 1.8 1.6 All Other Current Liabilities 3.4 2.2 2.2 1.6 1.4
17.7 13.9 12.1 11.0 8.7 Total Current Liabilities 19.0 15.4 13.3 11.3 8.65.6 4.2 3.8 3.3 2.4 Intermediate Liabilities 5.4 4.5 3.8 3.0 2.2
10.1 9.2 8.2 7.6 7.9 Long Term Liabilities 13.5 9.1 8.9 8.5 8.333.4 27.3 24.1 22.0 19.0 Total Liabilities 37.9 29.1 25.9 22.8 19.166.6 72.7 75.9 78.0 81.0 Net Worth 62.1 70.9 74.1 77.2 80.9
100.0 100.0 100.0 100.0 100.0 Total 100.0 100.0 100.0 100.0 100.0INCOME DATA
100.0 100.0 100.0 100.0 100.0 Value of Farm Production 100.0 100.0 100.0 100.0 100.073.8 72.1 73.0 72.4 70.2 Operating Expenses 81.6 84.7 86.4 85.4 80.4
8.0 10.2 11.4 12.3 13.0 Depreciation 9.7 12.6 13.8 15.7 16.218.2 17.6 15.7 15.3 16.8 Operating Profit 8.7 2.7 -0.2 -1.1 3.4
2.4 3.3 3.3 3.2 3.5 Interest Expense 3.8 4.3 4.2 4.5 4.715.7 14.3 12.4 12.0 13.3 NFI from Operations 4.9 -1.6 -4.4 -5.6 -1.3
FARM DATA649 698 853 983 1,457 Tillable Acres 747 760 895 994 1,4850.09 0.16 0.19 0.21 0.30 Tenure 0.09 0.15 0.18 0.22 0.30
RATIOSPROFITABILITY
10.7 5.8 4.4 4.1 3.4 3.7 0.9 0.5 1.0 1.41.2 1.7 1.6 1.6 1.7 Return on Farm Assets % -1.8 -1.7 -1.5 -1.2 0.0
-4.2 -1.2 -0.7 -0.5 0.1 -7.6 -4.6 -4.2 -3.7 -1.616.4 7.3 4.8 4.5 3.5 4.9 -0.2 -0.2 0.3 1.0
0.4 1.2 1.1 1.1 1.5 Return on Farm Equity % -5.3 -4.1 -2.8 -2.4 -0.8-8.6 -3.2 -1.9 -1.6 -0.5 -15.5 -9.1 -7.6 -6.2 -3.012.5 16.2 16.3 18.4 20.4 1.9 2.7 2.5 5.5 9.8-0.2 5.1 6.4 8.0 10.6 Profit Margin Ratio % -12.2 -9.7 -8.6 -7.5 -0.8
-16.5 -8.4 -3.3 -3.3 0.7 -31.6 -22.8 -24.1 -24.1 -14.9LIQUIDITY
5.20 4.58 5.09 5.24 6.66 3.48 4.17 4.88 5.99 6.791.80 1.91 2.11 2.36 2.62 Current 1.55 1.56 1.88 1.95 2.381.05 1.11 1.23 1.34 1.45 0.92 0.96 1.04 1.15 1.277.15 8.23 8.80 9.28 12.12 5.88 7.73 9.40 11.51 12.183.48 3.70 4.11 4.28 4.58 Current plus Intermediate 3.01 3.27 3.99 4.06 4.672.16 2.35 2.56 2.60 2.63 1.90 2.07 2.26 2.35 2.552.50 4.11 5.40 5.00 4.30 3.45 6.32 6.02 5.33 5.707.59 9.78 9.89 10.78 10.49 Debt Servicing Ratio % 9.99 12.52 12.03 12.65 13.37
12.33 15.91 14.95 16.82 17.45 15.77 19.99 18.56 20.80 21.69SOLVENCY and COVERAGE
15.3 11.3 11.0 9.5 6.3 22.0 11.9 10.6 7.3 6.247.8 32.9 26.6 22.2 19.5 Debt/Equity % 58.9 35.4 30.8 24.0 19.491.5 67.4 55.2 47.2 41.3 112.8 74.7 64.0 49.5 41.513.7 10.2 9.9 8.6 5.9 18.1 10.9 9.6 6.8 5.833.1 24.7 21.0 18.2 16.3 Debt/Assets % 37.1 26.2 23.5 19.3 16.347.9 40.3 35.6 32.0 29.2 53.0 43.0 39.0 33.1 29.3
43.19 27.73 22.53 24.21 27.66 20.58 9.44 8.26 9.40 9.8711.86 7.17 6.73 6.73 6.27 Interest Coverage 4.08 1.82 1.59 1.26 1.88
3.00 2.18 2.35 1.97 2.06 0.04 -1.32 -1.79 -1.90 -0.83FINANCIAL EFFICIENCY
0.75 0.45 0.35 0.31 0.24 0.64 0.40 0.31 0.27 0.200.49 0.32 0.26 0.22 0.17 Asset Turnover 0.44 0.26 0.22 0.18 0.130.35 0.20 0.18 0.14 0.11 0.30 0.17 0.14 0.11 0.0961.5 61.0 63.5 60.8 60.3 67.5 72.8 73.3 71.8 68.374.0 71.9 71.7 70.8 69.9 Operating Expense Ratio 80.2 82.3 83.5 83.5 78.083.9 82.3 82.5 82.0 79.8 92.6 93.1 95.1 95.3 88.6
3.6 6.0 7.2 8.4 8.8 4.6 7.5 9.1 9.8 11.27.1 8.7 10.4 11.3 12.0 Depreciation Expense Ratio 8.6 10.7 12.6 13.5 14.9
11.3 13.5 14.3 15.8 15.7 12.9 17.0 17.7 19.9 19.80.5 0.8 0.7 0.7 0.7 0.7 1.1 1.0 0.8 0.91.6 2.3 2.4 2.2 2.4 Interest Expense Ratio 2.3 3.0 2.8 3.0 3.23.3 4.3 4.6 4.3 5.0 4.7 6.2 5.8 6.0 6.5
29.8 27.1 24.6 25.2 24.2 21.7 13.1 10.6 12.1 13.817.9 15.5 14.9 13.5 14.2 NFI From Operations Ratio 8.4 1.9 0.4 -0.8 2.8
5.1 3.1 3.6 3.2 3.8 -5.2 -10.2 -13.1 -16.1 -10.1ABSOLUTE MEASURES-$ (means)
642,607 1,383,989 2,123,488 2,855,627 6,048,983 Assets 638,752 1,385,925 2,120,737 2,876,243 6,170,910208,242 371,522 507,717 625,581 1,155,152 Liabilities 238,036 399,067 545,480 655,791 1,197,743434,365 1,012,467 1,615,770 2,230,047 4,893,832 Net Worth 400,716 986,859 1,575,256 2,220,452 4,973,167225,903 356,211 462,856 569,663 923,255 Value of Farm Production 205,071 316,712 410,756 481,615 764,328
5,125 9,963 14,363 16,855 32,597 Interest Expense 6,466 11,816 16,006 19,566 35,94537,667 53,965 61,338 71,841 122,186 Net Farm Income 13,486 4,773 (7,001) (5,248) 2,887
Table 6. Financial Measures for Farms by Farm Size - Total Assets
Source: FBFM Data

2014 2014< .75 .76-1.5 1.6-2.25 2.26-3 >3 NET WORTH ($Millions) < .75 .76-1.5 1.6-2.25 2.26-3 >3353 516 455 366 1002 NUMBER OF FARMS 389 464 432 354 96213% 19% 17% 14% 37% Percent of Sample 15% 18% 17% 14% 37%
ASSETS5.7 4.6 4.9 5.2 5.2 Cash and Equivalents 5.5 4.2 4.8 4.8 5.5
20.5 16.5 15.0 13.7 11.5 Crops and Feed 18.5 14.5 13.0 11.9 9.81.2 0.9 0.7 0.4 0.4 Market Livestock 1.0 0.8 0.3 0.4 0.34.5 3.5 3.6 3.4 3.1 All Other Current Assets 5.1 4.3 4.0 3.7 3.3
31.8 25.5 24.2 22.7 20.2 Total Current Assets 30.1 23.8 22.2 20.7 18.937.8 36.6 31.9 28.2 23.3 Intermediate Assets 38.7 36.7 32.3 28.2 23.130.4 37.9 43.9 49.0 56.5 Fixed Assets 31.2 39.5 45.5 51.1 58.0
100.0 100.0 100.0 100.0 100.0 Total 100.0 100.0 100.0 100.0 100.0LIABILITIES
15.0 9.9 7.5 6.0 4.3 Oper., short term notes <1 yr. 16.4 11.5 7.7 6.3 4.22.5 2.1 1.6 1.4 1.1 Cur. Maturities. I.T. & L.T. 2.8 2.1 1.6 1.4 1.10.3 0.2 0.1 0.1 0.1 CCC and Other Loans 0.2 0.3 0.2 0.0 0.13.5 2.2 1.9 1.7 1.5 All Other Current Liabilities 3.4 2.4 1.7 1.6 1.3
21.3 14.5 11.1 9.1 6.9 Total Current Liabilities 22.8 16.1 11.1 9.2 6.76.5 4.6 3.2 2.7 1.9 Intermediate Liabilities 6.9 4.3 3.1 2.4 1.7
14.7 9.5 7.9 6.7 6.3 Long Term Liabilities 16.6 10.1 8.4 7.5 6.542.5 28.6 22.2 18.5 15.1 Total Liabilities 46.3 30.5 22.7 19.1 14.957.5 71.4 77.8 81.5 84.9 Net Worth 53.7 69.5 77.3 80.9 85.1
100.0 100.0 100.0 100.0 100.0 Total 100.0 100.0 100.0 100.0 100.0INCOME DATA
100.0 100.0 100.0 100.0 100.0 Value of Farm Production 100.0 100.0 100.0 100.0 100.073.8 72.7 73.5 73.3 68.8 Operating Expenses 82.5 86.3 86.3 83.3 79.6
7.8 10.8 11.8 12.5 13.3 Depreciation 9.8 13.2 14.5 15.4 16.718.4 16.5 14.7 14.2 18.0 Operating Profit 7.7 0.6 -0.8 1.2 3.7
3.6 3.8 3.3 2.9 3.1 Interest Expense 4.9 5.1 4.2 4.2 4.114.8 12.7 11.5 11.3 14.9 NFI from Operations 2.8 -4.5 -5.1 -3.0 -0.4
FARM DATA761 796 952 1,047 1,453 Tillable Acres 882 855 931 1,071 1,4860.09 0.16 0.20 0.23 0.32 Tenure 0.09 0.15 0.20 0.25 0.32
RATIOSPROFITABILITY
9.8 5.2 4.0 3.2 3.3 3.6 0.8 0.6 1.2 1.32.3 1.8 1.3 1.3 1.8 Return on Farm Assets % -1.4 -2.1 -1.4 -0.7 0.0
-2.9 -1.2 -1.0 -0.3 0.3 -6.6 -5.1 -4.1 -2.8 -1.418.6 6.6 4.3 3.4 3.5 4.0 -0.5 -0.1 0.4 1.0
-999.9 1.0 0.9 1.0 1.6 Return on Farm Equity % -999.9 -4.8 -2.8 -1.6 -0.6-999.9 -3.1 -2.3 -1.0 -0.2 -999.9 -9.8 -6.9 -4.4 -2.5
14.3 16.2 16.0 16.7 21.2 3.3 3.0 2.7 5.6 10.21.4 5.7 5.7 6.7 11.9 Profit Margin Ratio % -7.1 -10.5 -9.1 -4.9 -0.6
-12.0 -6.0 -4.6 -1.8 1.6 -26.1 -24.1 -24.1 -21.2 -15.2LIQUIDITY
2.79 3.46 5.06 6.14 8.60 2.21 2.87 5.08 6.41 9.091.35 1.67 2.15 2.60 3.29 Current 1.13 1.41 1.90 2.21 3.260.92 1.09 1.33 1.46 1.77 0.79 0.89 1.15 1.26 1.584.52 6.03 8.72 10.86 14.32 3.90 5.72 9.98 12.32 15.542.52 3.25 4.30 4.55 5.79 Current plus Intermediate 2.30 2.94 4.15 4.52 6.181.75 2.25 2.58 2.80 3.10 1.57 2.04 2.41 2.55 3.084.66 5.82 5.19 4.65 2.75 6.38 7.62 6.27 5.22 3.369.29 11.47 9.89 9.80 8.94 Debt Servicing Ratio % 12.54 13.50 12.88 12.11 11.17
14.84 17.75 15.99 15.38 16.20 18.60 22.89 19.14 20.41 20.08SOLVENCY and COVERAGE
37.8 17.1 11.0 7.8 4.5 48.7 18.7 10.5 6.8 4.272.6 40.5 25.7 20.1 14.2 Debt/Equity % 89.1 43.6 26.5 21.3 13.2
141.1 68.8 47.2 38.9 29.4 166.0 74.2 51.3 41.7 29.327.6 14.6 9.9 7.2 4.3 32.8 15.8 9.5 6.4 4.042.2 28.8 20.5 16.7 12.4 Debt/Assets % 47.2 30.4 21.0 17.5 11.758.7 40.8 32.0 28.0 22.7 62.5 42.6 33.9 29.4 22.7
20.40 17.15 23.30 24.98 56.21 10.08 6.10 6.90 9.79 19.305.68 5.77 6.55 7.39 7.75 Interest Coverage 2.58 1.19 1.18 1.89 2.532.01 1.73 1.73 2.29 2.86 -0.26 -1.56 -2.15 -1.09 -0.75
FINANCIAL EFFICIENCY0.70 0.43 0.33 0.29 0.22 0.61 0.35 0.27 0.23 0.180.48 0.32 0.24 0.20 0.15 Asset Turnover 0.44 0.26 0.20 0.16 0.120.35 0.21 0.17 0.14 0.11 0.30 0.18 0.13 0.11 0.0862.8 61.9 63.4 62.4 58.8 69.8 74.0 73.2 70.9 67.774.3 72.0 72.8 70.8 68.2 Operating Expense Ratio 81.0 83.6 83.6 81.0 77.384.0 82.6 83.3 82.5 78.6 92.4 94.9 96.0 91.6 87.6
3.8 7.0 7.4 8.4 9.1 4.8 8.4 9.5 10.3 11.56.9 9.7 10.9 11.6 12.2 Depreciation Expense Ratio 8.4 11.9 12.9 14.1 15.4
10.5 13.5 15.0 15.8 16.0 12.7 17.1 18.5 18.9 20.41.2 1.0 0.8 0.6 0.4 1.6 1.4 0.9 0.9 0.42.6 2.7 2.3 2.1 2.0 Interest Expense Ratio 3.6 3.9 3.0 2.8 2.74.7 5.1 4.4 4.1 4.5 6.4 6.8 6.0 5.9 5.63.2 2.9 2.5 2.8 5.4 -7.2 -12.8 -14.8 -11.8 -9.5
15.8 14.5 12.9 13.3 15.3 NFI From Operations Ratio 5.6 -0.4 -0.8 1.4 3.427.2 25.6 23.7 23.3 26.2 17.3 10.5 11.5 11.1 15.4
ABSOLUTE MEASURES-$ (means)836,757 1,694,077 2,503,275 3,303,462 6,473,122 Assets 881,653 1,734,337 2,519,043 3,328,562 6,605,459394,843 554,895 636,190 694,640 1,080,314 Liabilities 454,549 607,337 659,052 726,723 1,110,849441,914 1,139,182 1,867,085 2,608,822 5,392,808 Net Worth 427,105 1,127,000 1,859,991 2,601,839 5,494,610304,457 448,122 546,014 630,157 911,682 Value of Farm Production 297,997 389,099 457,230 537,030 752,917
10,680 16,264 18,272 19,584 29,489 Interest Expense 13,701 18,185 19,673 21,771 32,93444,774 56,098 61,953 67,487 134,888 Net Farm Income 8,534 (9,075) (13,218) 1,349 10,707
Table 7. Financial Measures for Farms by Farm Size - Net Worth
Source: FBFM Data

2014 201540-250 251-500 501-750 751-1,000 >1,000 VFP ($Thous.) 40-250 251-500 501-750 751-1,000 >1,000
517 825 565 307 478 NUMBER OF FARMS 685 839 490 286 30119% 31% 21% 11% 18% Percent of Sample 26% 32% 19% 11% 12%
ASSETS7.8 5.6 4.4 3.5 3.1 Cash and Equivalents 7.5 4.8 4.2 3.6 3.1
10.3 13.3 16.0 16.8 18.0 Crops and Feed 9.4 12.3 14.6 15.1 16.60.4 0.6 1.0 0.8 0.7 Market Livestock 0.6 0.6 0.4 0.3 0.32.5 3.2 3.5 4.1 4.6 All Other Current Assets 2.9 3.8 4.1 4.7 5.3
21.0 22.7 24.9 25.3 26.4 Total Current Assets 20.4 21.4 23.4 23.7 25.327.7 31.1 31.6 29.4 28.3 Intermediate Assets 29.0 31.3 31.1 29.0 28.751.3 46.2 43.5 45.3 45.4 Fixed Assets 50.6 47.3 45.5 47.3 46.0
100.0 100.0 100.0 100.0 100.0 Total 100.0 100.0 100.0 100.0 100.0LIABILITIES
4.8 6.6 8.6 9.6 9.6 Oper., short term notes <1 yr. 5.6 7.8 9.4 10.6 10.91.2 1.5 1.7 1.8 1.9 Cur. Maturities. I.T. & L.T. 1.3 1.6 1.8 1.9 1.90.1 0.1 0.2 0.1 0.2 CCC and Other Loans 0.1 0.2 0.1 0.3 0.22.0 1.9 2.1 2.0 1.9 All Other Current Liabilities 1.9 1.8 2.1 1.8 1.98.1 10.1 12.6 13.6 13.6 Total Current Liabilities 8.8 11.4 13.5 14.6 14.92.6 3.1 3.8 3.8 3.9 Intermediate Liabilities 2.5 3.2 3.7 3.8 3.88.2 7.0 8.4 9.0 10.2 Long Term Liabilities 8.9 8.6 8.9 10.0 10.5
18.9 20.2 24.7 26.5 27.7 Total Liabilities 20.3 23.2 26.1 28.5 29.281.1 79.8 75.3 73.5 72.3 Net Worth 79.7 76.8 73.9 71.5 70.8
100.0 100.0 100.0 100.0 100.0 Total 100.0 100.0 100.0 100.0 100.0INCOME DATA
100.0 100.0 100.0 100.0 100.0 Value of Farm Production 100.0 100.0 100.0 100.0 100.071.5 70.5 70.6 73.2 73.7 Operating Expenses 85.8 82.4 81.0 81.5 81.512.0 12.1 11.9 11.2 11.0 Depreciation 15.4 14.8 14.1 14.2 12.816.5 17.4 17.5 15.6 15.3 Operating Profit -1.2 2.8 4.8 4.3 5.7
3.7 3.0 3.1 3.3 3.5 Interest Expense 5.1 4.1 4.0 4.5 4.412.8 14.4 14.4 12.3 11.8 NFI from Operations -6.3 -1.3 0.8 -0.2 1.3
FARM DATA488 746 1,082 1,426 2,165 Tillable Acres 575 850 1,284 1,688 2,4330.29 0.24 0.19 0.20 0.19 Tenure 0.27 0.23 0.19 0.19 0.18
RATIOSPROFITABILITY
2.2 3.5 5.1 4.8 5.2 0.1 0.9 1.8 2.2 2.50.0 1.3 2.3 2.2 2.8 Return on Farm Assets % -1.6 -0.9 0.0 -0.2 0.7
-1.9 -0.4 0.5 0.1 0.6 -4.6 -3.4 -2.5 -2.0 -1.32.1 3.6 6.1 5.9 6.2 -0.3 0.3 1.3 1.7 2.4
-0.5 0.9 2.2 2.2 2.8 Return on Farm Equity % -2.8 -1.9 -1.0 -1.4 -0.2-3.1 -1.5 -0.3 -0.9 -0.5 -7.2 -6.2 -5.6 -4.9 -3.611.5 17.5 19.1 19.8 20.4 -3.3 5.5 9.8 10.4 11.1-3.3 6.7 10.6 10.0 11.1 Profit Margin Ratio % -19.5 -5.8 -0.7 -1.3 3.0
-21.2 -3.2 2.5 0.5 3.0 -41.0 -19.3 -12.8 -11.8 -5.6LIQUIDITY
10.43 6.79 4.87 3.56 3.72 9.44 5.84 4.42 3.59 3.103.28 2.67 2.06 2.04 1.94 Current 2.97 2.08 1.83 1.64 1.731.29 1.37 1.31 1.22 1.29 1.20 1.13 1.09 1.04 1.11
20.10 11.42 8.28 6.35 5.64 17.21 10.69 7.98 6.34 5.076.26 4.86 3.75 3.27 3.14 Current plus Intermediate 5.92 4.18 3.48 3.01 2.942.90 2.80 2.45 2.27 2.20 2.75 2.40 2.22 1.93 2.040.33 3.39 5.05 6.66 6.14 1.12 4.99 6.61 8.18 7.497.90 9.43 10.96 10.54 10.29 Debt Servicing Ratio % 11.25 12.69 12.54 13.75 11.86
18.78 15.91 16.40 15.71 15.24 22.90 20.00 18.87 19.96 18.72SOLVENCY and COVERAGE
2.9 6.8 11.2 14.9 18.2 3.4 7.7 12.0 16.6 21.113.4 18.5 28.4 29.8 35.5 Debt/Equity % 14.9 25.1 30.1 34.3 37.843.8 42.4 57.8 62.6 63.2 48.9 51.6 63.5 69.6 65.9
2.9 6.4 10.1 12.9 15.4 3.3 7.2 10.7 14.2 17.411.8 15.6 22.1 23.0 26.2 Debt/Assets % 13.0 20.1 23.2 25.8 27.430.6 29.8 36.6 38.5 38.7 32.9 34.0 38.8 41.2 39.7
230.59 36.83 22.12 13.80 12.44 42.38 10.44 9.54 5.55 5.679.96 7.89 6.91 5.75 4.87 Interest Coverage 2.53 1.96 1.93 1.28 1.691.73 2.64 2.61 2.12 1.70 -1.51 -1.30 -0.96 -1.27 -0.45
FINANCIAL EFFICIENCY0.32 0.32 0.35 0.35 0.39 0.26 0.27 0.31 0.31 0.340.15 0.20 0.24 0.24 0.27 Asset Turnover 0.13 0.17 0.21 0.21 0.240.08 0.13 0.16 0.18 0.19 0.07 0.11 0.13 0.15 0.1759.2 60.0 61.2 64.0 63.9 69.6 70.0 70.1 70.9 72.270.4 69.7 69.8 72.5 75.2 Operating Expense Ratio 81.7 79.5 80.0 81.2 81.982.3 79.4 79.1 82.9 84.1 96.0 91.7 90.2 91.6 89.6
5.2 7.4 8.2 8.1 8.2 7.7 9.2 10.3 10.0 9.410.0 11.3 11.2 10.9 10.6 Depreciation Expense Ratio 13.0 13.4 13.5 13.4 12.516.7 16.0 15.2 13.9 13.2 21.0 19.3 17.9 17.1 15.5
0.1 0.5 0.9 1.2 1.4 0.3 0.7 1.1 1.5 1.71.7 2.0 2.3 2.6 2.8 Interest Expense Ratio 2.5 3.0 3.0 3.6 3.45.0 4.3 4.4 4.7 4.8 6.7 5.8 5.6 6.7 5.8
30.5 27.4 24.7 22.5 21.1 15.6 13.4 13.9 11.9 11.415.5 15.6 15.7 13.5 11.4 NFI From Operations Ratio 0.9 2.9 3.2 0.8 2.9
0.3 5.2 5.9 3.3 2.6 -16.7 -11.2 -10.3 -9.9 -5.9ABSOLUTE MEASURES-$ (means)
1,864,908 2,723,187 3,574,433 4,589,019 7,038,649 Assets 2,046,786 2,961,700 4,086,718 5,292,035 7,859,655217,738 420,360 709,736 1,061,884 1,810,708 Liabilities 263,430 533,276 849,585 1,303,492 2,167,000
1,647,170 2,302,827 2,864,697 3,527,135 5,227,941 Net Worth 1,783,356 2,428,423 3,237,132 3,988,544 5,692,654162,316 370,834 616,089 861,591 1,524,747 Value of Farm Production 159,856 367,558 610,311 865,727 1,474,645
5,743 11,425 18,929 28,510 53,033 Interest Expense 7,662 15,505 24,703 39,408 66,52423,568 55,889 92,623 108,903 185,647 Net Farm Income (6,296) (1,302) 8,167 21 18,515
Table 8. Financial Measures for Farms by Farm Size - Value of Farm Production
Source: FBFM Data

2014 20150-10 11-25 26-50 51-75 > 75 TENURE (% land owned) 0-10 11-25 26-50 51-75 > 75
1,076 666 585 219 146 NUMBER OF FARMS 1,041 640 578 220 12240% 25% 22% 8% 5% Percent of Sample 40% 25% 22% 8% 5%
ASSETS5.9 4.4 4.4 4.3 6.5 Cash and Equivalents 6.1 4.2 4.4 4.3 5.9
19.5 14.1 10.5 7.9 5.8 Crops and Feed 17.1 12.5 9.0 6.8 5.10.7 0.8 0.7 0.4 0.7 Market Livestock 0.5 0.6 0.5 0.4 0.64.2 3.7 3.0 1.8 1.5 All Other Current Assets 5.1 3.8 3.0 2.1 1.6
30.3 22.9 18.5 14.4 14.5 Total Current Assets 28.7 21.1 16.9 13.6 13.239.3 27.6 22.5 18.1 17.3 Intermediate Assets 39.6 27.8 22.5 18.4 17.930.3 49.5 59.0 67.5 68.2 Fixed Assets 31.7 51.0 60.6 68.0 68.9
100.0 100.0 100.0 100.0 100.0 Total 100.0 100.0 100.0 100.0 100.0LIABILITIES
10.7 7.7 4.7 3.1 1.9 Oper., short term notes <1 yr. 11.9 8.1 4.8 3.1 2.32.0 1.6 1.3 1.0 0.6 Cur. Maturities. I.T. & L.T. 2.1 1.6 1.3 1.0 0.70.2 0.1 0.1 0.1 0.0 CCC and Other Loans 0.2 0.1 0.1 0.1 0.02.6 1.9 1.5 1.2 1.0 All Other Current Liabilities 2.6 1.7 1.4 1.1 0.9
15.5 11.3 7.6 5.4 3.5 Total Current Liabilities 16.8 11.5 7.6 5.3 3.95.0 3.0 2.1 1.6 0.8 Intermediate Liabilities 4.8 2.9 2.0 1.6 0.86.9 10.1 9.3 8.9 5.5 Long Term Liabilities 7.6 10.8 10.4 9.1 6.8
27.4 24.4 19.0 15.9 9.8 Total Liabilities 29.2 25.2 19.9 16.0 11.572.6 75.6 81.0 84.1 90.2 Net Worth 70.8 74.8 80.1 84.0 88.5
100.0 100.0 100.0 100.0 100.0 Total 100.0 100.0 100.0 100.0 100.0INCOME DATA
100.0 100.0 100.0 100.0 100.0 Value of Farm Production 100.0 100.0 100.0 100.0 100.074.8 72.1 68.9 66.7 63.9 Operating Expenses 84.0 83.8 81.5 81.2 76.911.4 11.3 12.3 13.1 11.6 Depreciation 13.5 14.6 15.4 16.5 14.913.8 16.6 18.8 20.2 24.5 Operating Profit 2.5 1.6 3.1 2.2 8.2
2.5 3.5 4.0 4.8 3.5 Interest Expense 3.4 4.6 5.4 6.2 5.011.3 13.1 14.9 15.4 21.0 NFI from Operations -0.9 -3.0 -2.3 -4.0 3.2
FARM DATA1,162 1,263 1,076 801 376 Tillable Acres 1,210 1,297 1,123 734 417
0.03 0.17 0.35 0.61 0.89 Tenure 0.03 0.17 0.35 0.62 0.88RATIOS
PROFITABILITY5.6 4.2 3.3 2.5 2.5 1.7 1.1 1.3 0.8 0.81.8 2.0 1.7 1.1 0.9 Return on Farm Assets % -1.2 -0.8 -0.2 -0.4 -0.2
-1.1 -0.2 0.1 -0.3 -0.3 -4.9 -3.0 -1.9 -2.0 -1.37.4 4.5 3.4 2.5 2.4 1.3 0.3 0.8 0.3 0.51.5 1.6 1.4 0.7 0.5 Return on Farm Equity % -3.1 -2.1 -1.0 -1.1 -0.7
-2.8 -1.4 -0.7 -0.6 -0.6 -9.8 -6.0 -3.5 -3.0 -1.815.1 18.6 20.1 21.6 27.8 5.0 4.8 9.0 8.4 11.3
5.8 8.0 10.9 9.0 8.3 Profit Margin Ratio % -5.8 -6.1 -3.0 -6.4 -2.1-5.0 -1.4 -1.7 -2.9 -3.3 -20.8 -19.0 -20.7 -25.5 -23.8
LIQUIDITY4.96 4.76 5.95 8.90 14.03 4.62 4.29 6.48 7.54 12.382.03 2.10 2.64 3.00 4.44 Current 1.78 1.78 2.44 2.84 3.971.21 1.27 1.51 1.35 1.87 1.03 1.09 1.24 1.27 1.518.37 8.17 11.58 16.29 27.30 8.15 8.26 12.67 14.02 24.913.76 3.77 4.57 5.59 9.16 Current plus Intermediate 3.52 3.48 4.66 5.70 9.132.33 2.47 2.75 2.80 4.24 2.15 2.22 2.56 2.74 3.743.95 5.95 4.91 3.17 0.00 4.98 7.41 5.86 5.80 0.118.70 11.05 11.64 11.37 3.90 Debt Servicing Ratio % 10.23 13.56 14.74 15.22 9.22
13.58 16.81 18.57 21.06 15.71 16.75 20.29 24.59 25.75 24.54SOLVENCY and COVERAGE
12.8 11.6 6.5 3.7 1.2 12.9 11.2 6.2 3.5 1.432.8 28.1 18.9 12.8 5.3 Debt/Equity % 36.8 31.6 21.0 13.8 6.268.5 51.1 41.2 32.7 16.0 75.5 55.8 42.4 31.6 18.711.4 10.4 6.1 3.6 1.2 11.4 10.1 5.8 3.4 1.424.7 22.0 15.9 11.4 5.1 Debt/Assets % 26.9 24.0 17.4 12.1 5.840.7 34.2 29.2 24.6 13.8 43.1 35.8 29.8 24.0 15.8
27.93 17.58 28.69 52.26 999.99 12.82 5.96 8.65 13.09 999.997.64 5.66 6.55 7.23 23.28 Interest Coverage 2.15 1.25 2.08 1.92 5.492.38 1.84 2.19 2.03 3.68 -1.73 -1.25 -0.84 -0.37 0.62
FINANCIAL EFFICIENCY0.49 0.28 0.20 0.14 0.11 0.43 0.23 0.16 0.12 0.100.36 0.22 0.15 0.11 0.08 Asset Turnover 0.31 0.19 0.12 0.09 0.070.26 0.18 0.12 0.08 0.06 0.22 0.14 0.10 0.07 0.0564.0 62.6 60.3 56.7 53.1 71.7 72.6 68.2 66.8 65.474.7 71.7 67.7 65.4 61.2 Operating Expense Ratio 82.9 82.1 77.4 76.1 74.984.9 81.8 76.9 76.3 73.6 94.2 92.2 89.8 88.4 82.7
7.0 8.0 7.9 8.4 6.5 8.1 9.7 10.4 10.3 8.810.2 11.1 11.3 12.2 10.4 Depreciation Expense Ratio 11.9 13.7 14.5 14.8 14.014.1 14.3 15.4 17.1 15.8 17.2 18.1 19.4 21.2 19.6
0.6 1.2 0.7 0.4 0.0 0.7 1.6 1.0 0.6 0.01.8 2.9 3.0 2.9 1.0 Interest Expense Ratio 2.3 3.9 3.9 4.4 2.23.3 5.1 5.6 6.7 4.8 4.6 6.4 7.8 9.2 8.2
22.5 23.7 27.1 28.9 36.8 12.9 10.6 14.6 15.1 21.313.2 13.7 17.1 16.6 22.0 NFI From Operations Ratio 2.4 -0.4 3.7 3.2 6.7
2.6 3.2 5.6 4.4 9.3 -10.6 -11.7 -11.2 -10.9 -8.0ABSOLUTE MEASURES-$ (means)
2,510,668 3,942,100 4,888,063 5,503,040 4,192,087 Assets 2,524,680 3,993,436 5,028,033 5,132,421 4,502,932626,496 911,584 899,669 869,131 369,960 Liabilities 630,417 956,474 955,122 835,820 531,829
1,884,171 3,030,516 3,988,394 4,633,909 3,822,127 Net Worth 1,894,264 3,036,961 4,072,912 4,296,601 3,971,103641,925 743,424 648,621 540,595 326,154 Value of Farm Production 538,565 635,973 541,833 415,265 296,677
15,895 25,929 26,211 27,197 10,485 Interest Expense 17,429 29,128 29,588 27,406 14,26272,389 92,033 103,421 95,385 83,721 Net Farm Income (631) (10,537) 11,432 8,149 26,032
Table 9. Financial Measures for Farms by Tenure Level
Source: FBFM Data

2014 2015< 50 51-125 126-200 201-275 > 275 NET FARM INCOME ($Thous.) < 50 51-125 126-200 201-275 > 275
1168 795 386 174 169 NUMBER OF FARMS 1899 472 145 45 4043% 30% 14% 6% 6% Percent of Sample 73% 18% 6% 2% 2%
ASSETS5.2 5.5 4.7 4.9 3.8 Cash and Equivalents 5.0 5.5 5.2 4.2 6.6
13.3 14.7 16.2 16.9 16.1 Crops and Feed 12.0 14.5 15.4 16.5 13.80.3 0.6 1.0 1.5 1.8 Market Livestock 0.5 0.5 0.2 0.3 0.43.1 3.5 4.0 4.1 4.1 All Other Current Assets 3.6 4.5 5.4 5.1 4.4
22.0 24.2 25.8 27.5 25.8 Total Current Assets 21.1 24.9 26.0 26.0 25.231.4 29.9 28.5 27.3 24.7 Intermediate Assets 30.8 29.0 27.8 28.0 22.146.6 45.9 45.7 45.2 49.5 Fixed Assets 48.1 46.1 46.2 46.0 52.8
100.0 100.0 100.0 100.0 100.0 Total 100.0 100.0 100.0 100.0 100.0LIABILITIES
8.5 6.8 6.9 8.0 5.7 Oper., short term notes <1 yr. 8.8 6.4 6.6 7.7 4.21.7 1.5 1.4 1.5 1.4 Cur. Maturities. I.T. & L.T. 1.7 1.3 1.5 1.7 1.30.2 0.1 0.1 0.1 0.1 CCC and Other Loans 0.2 0.0 0.0 0.1 0.01.8 2.0 2.1 2.3 2.0 All Other Current Liabilities 1.8 2.3 2.2 2.2 2.2
12.2 10.5 10.5 11.9 9.2 Total Current Liabilities 12.5 10.1 10.4 11.7 7.63.8 3.3 3.0 2.3 2.6 Intermediate Liabilities 3.5 2.8 2.7 3.0 1.19.2 6.8 7.9 8.4 10.1 Long Term Liabilities 9.5 7.7 8.1 9.8 9.5
25.3 20.6 21.5 22.6 21.9 Total Liabilities 25.5 20.6 21.2 24.6 18.174.7 79.4 78.5 77.4 78.1 Net Worth 74.5 79.4 78.8 75.4 81.9
100.0 100.0 100.0 100.0 100.0 Total 100.0 100.0 100.0 100.0 100.0INCOME DATA
100.0 100.0 100.0 100.0 100.0 Value of Farm Production 100.0 100.0 100.0 100.0 100.081.9 66.8 62.0 60.8 55.7 Operating Expenses 89.0 67.8 64.6 64.0 57.313.3 10.8 10.5 10.1 10.1 Depreciation 15.6 11.5 11.7 10.7 11.1
4.8 22.5 27.4 29.1 34.2 Operating Profit -4.6 20.7 23.8 25.2 31.64.2 2.6 2.6 2.2 2.8 Interest Expense 5.1 2.8 2.4 3.3 2.60.6 19.9 24.9 26.9 31.4 NFI from Operations -9.7 17.9 21.4 21.9 29.0
FARM DATA892 987 1,333 1,549 2,017 Tillable Acres 1,034 1,194 1,633 1,923 2,5040.22 0.22 0.23 0.22 0.28 Tenure 0.22 0.22 0.21 0.23 0.29
RATIOSPROFITABILITY
0.4 4.2 6.9 8.7 9.7 -0.3 3.3 5.8 7.3 7.4-0.7 2.3 4.1 5.6 7.0 Return on Farm Assets % -1.7 1.8 3.3 4.9 5.0-2.5 1.4 2.6 3.6 4.7 -4.4 1.0 2.0 3.1 3.4-0.4 4.5 9.1 10.1 12.5 -1.2 3.2 7.5 8.5 8.5-1.9 2.2 4.4 6.5 8.4 Return on Farm Equity % -3.5 1.6 3.4 5.6 5.5-5.6 1.1 2.7 3.8 5.5 -8.1 0.7 1.8 3.2 3.81.3 16.7 24.6 29.6 36.7 -2.5 13.5 20.2 26.1 33.5
-4.5 11.1 18.8 22.2 30.4 Profit Margin Ratio % -12.8 9.1 16.1 19.5 26.9-14.4 6.3 13.4 18.3 24.3 -27.1 4.8 12.0 15.5 22.0
LIQUIDITY4.69 6.84 5.91 5.60 6.23 4.82 8.38 6.29 4.77 7.881.78 2.61 2.67 3.18 2.86 Current 1.76 3.09 3.01 2.26 3.701.08 1.40 1.69 1.75 1.85 1.02 1.38 1.68 1.65 1.868.72 11.22 10.19 11.53 10.30 9.16 13.59 12.03 7.49 14.703.54 4.57 4.64 5.33 4.55 Current plus Intermediate 3.63 5.21 5.18 4.01 5.802.24 2.70 2.84 2.84 3.00 2.20 2.84 2.95 2.85 2.985.77 3.30 4.07 3.52 3.82 6.58 2.42 3.89 5.92 0.65
11.68 9.03 8.35 7.71 7.74 Debt Servicing Ratio % 13.76 9.08 8.76 9.73 8.9519.19 14.63 13.79 12.23 12.98 22.49 14.81 13.86 14.67 15.82
SOLVENCY and COVERAGE9.9 7.1 8.6 8.4 9.8 9.1 5.5 6.4 16.1 6.3
29.2 20.5 22.4 20.4 24.9 Debt/Equity % 29.3 18.5 23.9 27.6 15.362.0 44.9 46.9 50.9 48.2 61.7 45.4 49.0 52.5 35.6
9.1 6.6 7.9 8.0 8.9 8.4 5.2 6.0 13.9 5.922.7 17.0 18.3 17.1 19.9 Debt/Assets % 22.7 15.6 19.3 21.6 13.338.3 31.0 31.9 34.1 32.5 38.2 31.2 32.9 34.4 26.27.00 52.93 43.12 58.97 48.46 3.13 54.24 47.22 15.37 438.521.75 10.47 12.51 15.57 16.88 Interest Coverage 0.41 10.00 13.52 9.79 22.23
-0.21 5.13 6.47 7.74 8.87 -2.48 4.35 6.11 5.42 8.31FINANCIAL EFFICIENCY
0.34 0.35 0.36 0.36 0.33 0.28 0.34 0.33 0.35 0.310.21 0.22 0.23 0.24 0.24 Asset Turnover 0.18 0.19 0.21 0.24 0.200.13 0.14 0.15 0.18 0.17 0.10 0.13 0.13 0.18 0.1273.0 60.4 54.5 54.4 49.5 77.1 61.8 60.2 56.5 50.681.9 67.8 62.4 61.7 56.1 Operating Expense Ratio 85.7 68.9 65.1 66.3 56.389.8 74.9 69.4 68.0 61.7 96.7 75.3 69.6 71.1 64.3
8.1 6.9 7.3 7.0 7.3 9.8 7.6 8.1 6.5 9.012.0 10.4 10.1 9.9 9.5 Depreciation Expense Ratio 14.2 11.0 11.9 11.3 10.917.0 14.4 13.7 13.0 12.4 19.9 15.3 15.2 14.3 13.7
1.0 0.4 0.6 0.4 0.8 1.2 0.4 0.5 1.5 0.13.0 1.9 1.8 2.0 1.8 Interest Expense Ratio 3.6 1.8 1.7 2.5 1.55.7 3.9 3.5 3.3 3.9 6.9 4.2 3.8 4.3 3.39.6 26.8 31.7 34.6 39.3 4.1 23.5 25.9 28.0 40.32.0 17.9 23.8 25.8 31.7 NFI From Operations Ratio -3.9 16.4 20.7 20.6 31.2
-5.9 12.5 16.8 20.1 24.2 -17.2 11.3 15.8 16.2 22.3ABSOLUTE MEASURES-$ (means)
2,994,956 3,276,787 4,461,285 4,845,530 7,901,252 Assets 3,455,698 3,758,754 5,447,135 6,263,808 9,011,918700,432 580,808 840,168 896,766 1,726,013 Liabilities 789,286 628,479 901,374 1,422,243 1,975,857
2,294,525 2,695,979 3,621,117 3,948,764 6,175,239 Net Worth 2,666,412 3,130,274 4,545,761 4,841,565 7,036,061496,836 541,037 778,279 961,739 1,497,615 Value of Farm Production 480,091 556,403 859,559 1,139,413 1,454,387
21,105 15,535 21,491 22,849 46,863 Interest Expense 24,626 16,644 23,529 38,702 47,035(9,471) 84,192 157,574 233,765 446,323 Net Farm Income (43,682) 80,116 158,197 229,157 401,584
Table 10. Financial Measures for Farms by Net Farm Income From Operations Level
Source: FBFM Data

2014 2015 < 0 0-4 4-8 8-12 > 12 Rate of Return on Farm Assets (%) < 0 0-4 4-8 8-12 > 12793 1193 434 137 135 NUMBER OF FARMS 1549 827 135 35 5529% 44% 16% 5% 5% Percent of Sample 60% 32% 5% 1% 2%
ASSETS5.5 5.0 4.4 4.8 6.4 Cash and Equivalents 5.1 4.9 4.9 4.0 8.7
13.4 12.6 17.9 18.5 23.4 Crops and Feed 12.2 11.9 17.3 17.7 27.10.3 0.3 1.0 2.3 2.9 Market Livestock 0.6 0.3 0.2 0.7 2.03.1 3.2 4.3 4.5 5.1 All Other Current Assets 3.5 4.0 5.3 6.5 7.2
22.3 21.1 27.6 30.1 37.7 Total Current Assets 21.4 21.1 27.7 28.8 45.032.3 26.7 31.4 33.6 34.6 Intermediate Assets 31.5 26.3 33.2 38.0 33.545.4 52.2 40.9 36.3 27.7 Fixed Assets 47.1 52.6 39.1 33.1 21.5
100.0 100.0 100.0 100.0 100.0 Total 100.0 100.0 100.0 100.0 100.0LIABILITIES
8.3 5.9 8.8 9.9 11.9 Oper., short term notes <1 yr. 8.8 6.4 10.5 10.5 9.31.7 1.3 1.8 2.2 2.2 Cur. Maturities. I.T. & L.T. 1.7 1.4 2.1 2.4 2.00.2 0.1 0.2 0.1 0.2 CCC and Other Loans 0.2 0.1 0.1 0.0 0.31.8 1.7 2.3 2.9 3.8 All Other Current Liabilities 1.7 1.8 2.3 3.1 6.1
11.9 9.0 13.0 15.1 18.2 Total Current Liabilities 12.4 9.8 15.0 16.1 17.63.7 2.6 3.7 3.8 6.0 Intermediate Liabilities 3.4 2.7 4.3 5.6 5.97.7 7.5 9.1 12.5 12.3 Long Term Liabilities 8.1 9.9 13.1 15.4 11.3
23.3 19.1 25.9 31.4 36.5 Total Liabilities 23.9 22.4 32.4 37.1 34.976.7 80.9 74.1 68.6 63.5 Net Worth 76.2 77.6 67.6 62.9 65.1
100.0 100.0 100.0 100.0 100.0 Total 100.0 100.0 100.0 100.0 100.0INCOME DATA
100.0 100.0 100.0 100.0 100.0 Value of Farm Production 100.0 100.0 100.0 100.0 100.087.0 67.9 62.5 58.5 55.9 Operating Expenses 92.9 69.5 65.0 60.1 58.414.2 12.0 9.7 8.3 5.1 Depreciation 16.4 12.7 9.6 9.0 5.4-1.2 20.1 27.8 33.2 39.0 Operating Profit -9.3 17.8 25.5 31.0 36.23.7 3.3 2.9 2.7 1.9 Interest Expense 4.6 4.5 3.4 2.5 1.1
-4.9 16.7 24.9 30.5 37.1 NFI from Operations -13.9 13.3 22.1 28.5 35.1FARM DATA
899 1,128 1,349 1,143 1,118 Tillable Acres 1,006 1,286 1,458 1,424 1,5080.21 0.28 0.18 0.12 0.10 Tenure 0.21 0.27 0.15 0.13 0.06
RATIOSPROFITABILITY
-0.7 2.7 6.6 10.6 26.3 -1.1 2.2 6.4 10.4 26.6-1.7 1.8 5.4 9.5 16.6 Return on Farm Assets % -2.5 1.3 5.5 9.9 19.5-4.0 1.0 4.6 8.8 14.4 -5.0 0.6 4.5 8.7 15.3-1.6 2.7 8.3 16.2 45.5 -2.0 1.9 8.4 16.3 50.9-3.5 1.5 6.6 13.1 27.4 Return on Farm Equity % -4.6 0.8 6.7 14.2 28.5-7.7 0.4 5.1 11.2 19.7 -9.6 -0.1 5.1 11.4 21.0-3.4 16.0 26.5 32.1 35.0 -6.8 12.1 22.8 26.1 26.4-9.1 9.0 18.9 24.8 27.3 Profit Margin Ratio % -16.4 7.2 15.9 16.9 15.6
-19.5 4.2 13.4 19.6 17.9 -30.3 2.9 9.8 13.3 -3.5LIQUIDITY
5.23 6.90 4.76 4.87 4.33 5.20 6.61 4.18 3.37 5.041.87 2.62 2.27 2.05 2.35 Current 1.87 2.39 1.78 1.71 3.151.13 1.44 1.38 1.26 1.52 1.04 1.21 1.22 1.18 1.359.56 11.78 8.08 6.38 5.45 9.98 11.86 6.61 6.10 8.683.87 4.75 4.00 3.65 3.50 Current plus Intermediate 3.90 4.39 3.21 3.42 3.442.35 2.71 2.44 2.22 2.41 2.28 2.50 2.14 2.17 2.264.88 3.63 4.95 6.22 2.50 6.13 5.16 5.11 5.28 0.14
11.03 10.14 9.34 9.70 5.73 Debt Servicing Ratio % 13.26 12.30 10.06 9.21 4.9118.10 16.74 14.18 12.96 9.73 21.41 19.55 15.86 11.28 9.12
SOLVENCY and COVERAGE8.0 6.4 12.8 18.5 24.4 8.0 6.4 18.7 27.3 20.1
24.9 18.8 29.3 43.0 56.2 Debt/Equity % 24.9 24.5 51.4 64.7 53.956.4 40.3 60.0 80.6 84.1 55.6 49.1 81.9 115.8 105.1
7.5 6.0 11.4 15.6 19.6 7.4 6.0 15.8 21.5 16.719.9 15.8 22.7 30.1 36.8 Debt/Assets % 20.0 19.6 33.9 39.3 35.036.1 28.7 37.5 44.6 48.1 35.8 32.9 45.0 53.7 51.35.36 34.25 31.20 43.19 52.99 2.15 20.91 29.01 24.81 433.470.66 7.38 12.12 13.48 23.42 Interest Coverage -0.49 5.10 9.79 16.27 44.31
-1.29 3.32 5.92 8.32 13.29 -3.46 2.38 5.08 7.65 16.13FINANCIAL EFFICIENCY
0.34 0.26 0.38 0.48 0.89 0.28 0.26 0.42 0.67 1.110.21 0.18 0.28 0.38 0.66 Asset Turnover 0.18 0.17 0.31 0.49 0.810.12 0.12 0.21 0.30 0.47 0.10 0.11 0.24 0.33 0.5478.5 61.4 55.4 51.6 48.0 81.2 63.1 60.1 52.7 48.586.5 68.9 62.6 57.5 55.7 Operating Expense Ratio 89.2 70.6 66.0 58.9 59.893.9 76.0 70.0 65.6 64.6 99.3 77.1 70.5 70.6 68.3
8.8 8.1 6.8 5.4 2.3 10.4 8.9 6.4 5.9 1.812.8 11.3 9.4 8.1 4.8 Depreciation Expense Ratio 15.0 12.2 9.2 9.1 4.618.2 15.0 12.2 11.1 7.4 21.0 15.9 12.3 11.5 7.1
0.8 0.5 0.9 0.8 0.6 1.0 0.8 0.9 1.5 0.12.6 2.3 2.1 2.3 1.5 Interest Expense Ratio 3.3 3.0 2.3 2.1 0.75.2 4.7 4.1 4.0 2.7 6.2 6.4 4.9 3.8 1.84.2 23.4 30.8 37.1 43.5 1.0 19.2 26.2 34.4 46.2
-2.3 15.6 24.2 30.5 35.7 NFI From Operations Ratio -7.7 12.3 21.2 29.2 33.6-9.7 9.3 18.1 24.7 28.1 -20.1 6.9 16.6 21.9 25.0
ABSOLUTE MEASURES-$ (means)3,078,479 4,490,243 3,738,526 2,595,935 1,684,351 Assets 3,326,165 4,923,931 3,191,563 1,928,398 836,521
669,747 803,572 890,664 708,063 581,935 Liabilities 711,534 981,269 901,152 577,752 248,6972,408,732 3,686,671 2,847,861 1,887,872 1,102,417 Net Worth 2,614,631 3,942,662 2,290,412 1,350,645 587,824
516,760 648,776 819,995 726,485 682,193 Value of Farm Production 473,202 648,073 711,460 626,969 390,26419,654 22,134 24,242 18,574 15,815 Interest Expense 21,767 28,933 24,177 15,248 3,906
(25,991) 90,471 191,208 221,213 238,418 Net Farm Income (57,454) 72,009 153,968 162,347 130,052
Table 11. Financial Measures for Farms by Rate of Return on Farm Assets
Source: FBFM Data

2014 2015less than 30 30 - 39 40 - 49 50 - 59 60 & over AGE OF OPERATOR less than 30 30 - 39 40 - 49 50 - 59 60 & over
82 226 383 899 1102 NUMBER OF FARMS 80 220 341 834 11263% 8% 14% 33% 41% Percent of Sample 3% 8% 13% 32% 43%
ASSETS8.7 5.2 4.1 3.7 6.3 Cash and Equivalents 7.6 5.2 4.1 3.7 6.2
21.0 17.1 17.0 16.2 11.3 Crops and Feed 21.4 15.0 15.5 14.1 9.91.5 1.2 1.2 0.6 0.4 Market Livestock 1.1 0.9 1.0 0.4 0.35.0 4.4 3.9 4.1 2.6 All Other Current Assets 5.6 4.9 4.3 4.3 3.1
36.1 27.9 26.2 24.5 20.6 Total Current Assets 35.6 26.0 24.9 22.5 19.527.7 32.9 33.8 32.4 25.9 Intermediate Assets 24.8 32.5 33.9 33.0 26.736.2 39.2 40.0 43.1 53.5 Fixed Assets 39.6 41.5 41.2 44.4 53.8
100.0 100.0 100.0 100.0 100.0 Total 100.0 100.0 100.0 100.0 100.0LIABILITIES
11.6 10.7 10.5 8.6 4.8 Oper., short term notes <1 yr. 10.8 12.1 11.4 9.3 5.42.8 2.4 1.9 1.7 1.1 Cur. Maturities. I.T. & L.T. 2.6 2.8 2.1 1.7 1.10.4 0.3 0.1 0.1 0.1 CCC and Other Loans 0.4 0.2 0.1 0.2 0.13.8 2.3 2.2 2.0 1.6 All Other Current Liabilities 4.3 2.5 2.1 2.0 1.5
18.6 15.8 14.7 12.5 7.6 Total Current Liabilities 18.0 17.5 15.8 13.1 8.25.5 5.9 4.3 3.6 2.2 Intermediate Liabilities 4.4 5.7 4.7 3.4 2.2
22.2 17.3 10.6 8.2 4.7 Long Term Liabilities 26.4 19.9 12.3 8.5 5.346.3 39.0 29.6 24.3 14.5 Total Liabilities 48.9 43.1 32.8 25.0 15.653.7 61.0 70.4 75.7 85.5 Net Worth 51.1 56.9 67.2 75.0 84.4
100.0 100.0 100.0 100.0 100.0 Total 100.0 100.0 100.0 100.0 100.0INCOME DATA
100.0 100.0 100.0 100.0 100.0 Value of Farm Production 100.0 100.0 100.0 100.0 100.069.6 71.8 70.0 71.9 71.9 Operating Expenses 76.1 77.9 82.6 82.2 84.9
6.9 9.4 10.8 12.1 12.5 Depreciation 7.1 11.2 13.0 15.3 15.623.5 18.8 19.1 15.9 15.5 Operating Profit 16.9 11.0 4.4 2.5 -0.4
4.0 4.3 3.6 3.5 2.7 Interest Expense 5.1 6.3 4.6 4.7 3.819.5 14.5 15.5 12.4 12.8 NFI from Operations 11.8 4.6 -0.2 -2.2 -4.2
FARM DATA1,362 1,157 1,252 1,225 905 Tillable Acres 1,516 1,214 1,258 1,248 971
0.14 0.13 0.17 0.19 0.31 Tenure 0.12 0.14 0.16 0.19 0.29RATIOS
PROFITABILITY13.0 8.7 6.1 4.1 2.6 8.0 3.9 2.4 1.3 0.6
5.8 3.5 2.9 2.0 1.0 Return on Farm Assets % 1.3 0.5 -0.2 -0.7 -0.91.2 -0.4 0.2 -0.2 -0.6 -3.4 -3.5 -3.6 -3.5 -2.9
30.8 13.1 7.6 4.5 2.7 17.3 4.9 1.8 0.8 0.210.6 3.8 2.7 1.7 0.7 Return on Farm Equity % -1.0 -1.7 -2.1 -2.1 -1.6-0.1 -4.3 -1.2 -1.6 -1.3 -15.1 -10.7 -7.6 -6.6 -4.619.0 18.1 20.3 17.6 17.6 5.5 9.9 9.0 6.7 4.6
6.6 6.7 10.4 8.4 6.0 Profit Margin Ratio % -6.3 -1.6 -2.4 -4.7 -7.6-13.7 -4.3 -0.9 -0.9 -5.1 -30.8 -16.9 -16.6 -18.2 -24.9
LIQUIDITY4.33 3.79 3.93 4.30 9.55 3.66 3.12 3.41 4.17 8.881.94 1.78 1.88 1.93 3.35 Current 1.93 1.41 1.66 1.70 3.021.15 1.14 1.15 1.26 1.60 1.01 0.95 0.98 1.04 1.345.31 5.52 6.16 7.31 15.34 5.03 4.80 5.55 7.29 16.442.57 2.79 3.29 3.65 6.06 Current plus Intermediate 2.79 2.59 3.02 3.56 6.161.78 1.97 2.23 2.43 3.14 1.71 1.82 1.89 2.23 2.825.26 6.35 5.93 5.95 0.91 3.41 8.79 7.67 7.05 2.538.41 11.83 10.28 10.80 8.38 Debt Servicing Ratio % 11.52 14.06 13.18 12.98 10.72
15.24 17.62 15.90 17.66 14.77 19.33 24.10 20.30 20.92 18.93SOLVENCY and COVERAGE
37.8 36.0 18.6 14.2 3.6 51.4 42.3 22.7 12.9 3.384.1 64.2 38.7 28.4 11.6 Debt/Equity % 104.2 76.6 45.3 30.6 12.5
190.3 106.2 69.3 53.9 28.1 220.4 124.2 84.2 56.7 30.929.1 26.4 15.7 12.4 3.5 33.9 29.7 18.5 11.4 3.245.7 39.1 28.0 22.1 10.4 Debt/Assets % 51.0 43.4 31.3 23.4 11.165.7 51.5 41.0 35.0 21.9 68.8 55.4 45.9 36.2 23.6
36.50 13.23 18.17 17.54 92.77 32.74 7.00 6.35 6.61 24.409.86 5.29 6.21 5.90 9.52 Interest Coverage 5.13 2.16 1.79 1.43 2.013.64 1.91 2.12 1.95 2.48 1.09 0.21 -1.02 -1.42 -1.46
FINANCIAL EFFICIENCY0.85 0.55 0.43 0.35 0.24 0.67 0.50 0.38 0.29 0.200.57 0.39 0.30 0.24 0.15 Asset Turnover 0.49 0.34 0.26 0.20 0.130.32 0.26 0.20 0.17 0.10 0.34 0.22 0.17 0.13 0.0859.1 60.4 59.6 61.5 61.7 61.6 66.2 68.8 70.6 71.169.3 73.8 70.0 71.4 70.5 Operating Expense Ratio 75.5 78.3 81.1 80.7 81.779.9 82.9 80.3 81.5 81.6 89.1 88.8 91.2 91.2 94.1
2.9 5.0 7.0 8.3 7.8 3.0 6.4 8.3 10.5 9.75.1 8.6 10.0 11.2 11.5 Depreciation Expense Ratio 5.1 9.9 11.8 13.9 14.39.4 12.5 13.9 15.0 15.8 9.5 15.1 16.3 19.2 19.40.4 1.6 1.4 1.1 0.2 0.8 2.2 1.6 1.3 0.32.4 3.2 2.7 2.6 1.6 Interest Expense Ratio 3.1 4.0 3.6 3.3 2.44.4 5.5 4.6 4.9 4.0 6.3 7.8 6.3 6.1 5.6
32.7 27.1 26.5 22.8 25.9 25.8 16.4 14.0 12.4 12.620.7 15.7 15.6 13.6 14.8 NFI From Operations Ratio 12.1 5.6 3.4 1.3 1.311.4 4.2 4.8 3.6 2.5 -3.8 -5.1 -8.1 -11.8 -14.3
ABSOLUTE MEASURES-$ (means)1,147,504 2,017,932 3,190,664 4,072,891 4,146,954 Assets 1,014,547 2,030,011 3,158,091 4,052,109 4,249,157
542,268 811,772 881,716 965,323 561,195 Liabilities 532,305 843,079 929,376 988,889 621,242605,236 1,206,160 2,308,948 3,107,568 3,585,759 Net Worth 482,243 1,186,931 2,228,714 3,063,221 3,627,915384,259 559,736 720,546 780,900 540,177 Value of Farm Production 296,260 491,984 615,965 641,595 471,873
14,516 23,366 25,102 27,152 15,151 Interest Expense 14,727 27,316 26,571 29,686 18,33973,568 73,695 100,133 101,052 73,424 Net Farm Income 30,721 18,420 13,235 (2,038) (4,571)
Table 12. Financial Measures for Farms by Age of Operator
Source: FBFM Data
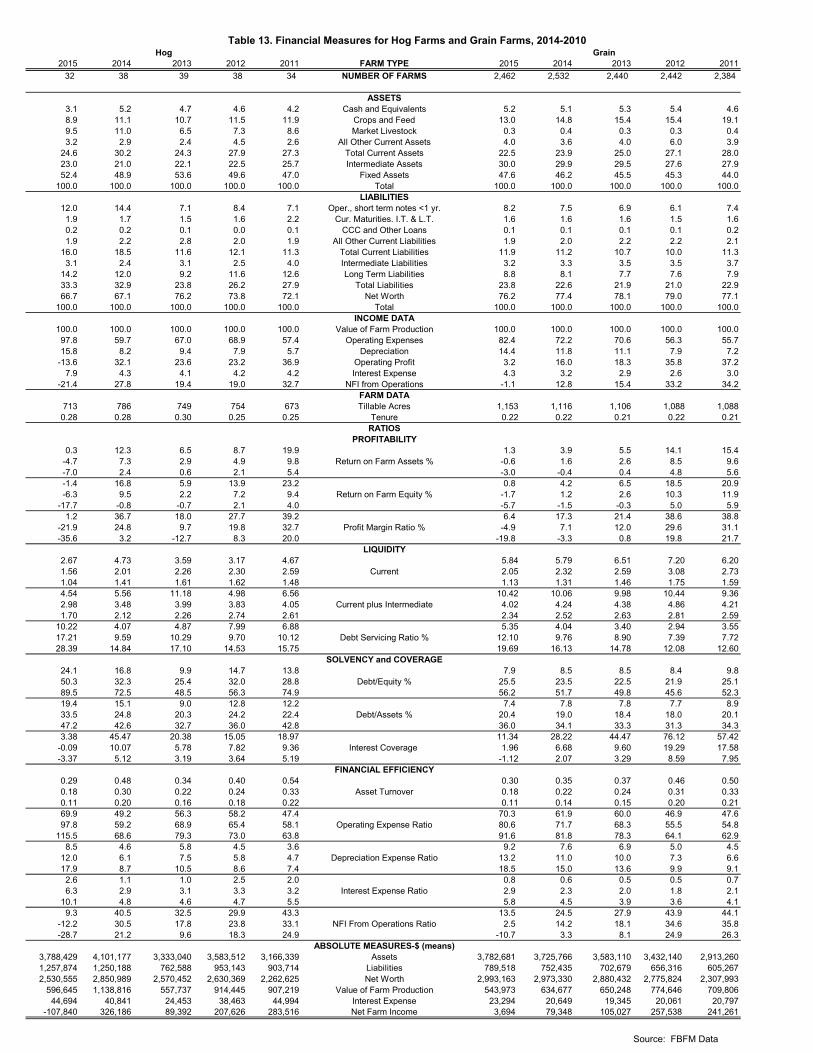
2015 2014 2013 2012 2011 FARM TYPE 2015 2014 2013 2012 201132 38 39 38 34 NUMBER OF FARMS 2,462 2,532 2,440 2,442 2,384
ASSETS3.1 5.2 4.7 4.6 4.2 Cash and Equivalents 5.2 5.1 5.3 5.4 4.68.9 11.1 10.7 11.5 11.9 Crops and Feed 13.0 14.8 15.4 15.4 19.19.5 11.0 6.5 7.3 8.6 Market Livestock 0.3 0.4 0.3 0.3 0.43.2 2.9 2.4 4.5 2.6 All Other Current Assets 4.0 3.6 4.0 6.0 3.9
24.6 30.2 24.3 27.9 27.3 Total Current Assets 22.5 23.9 25.0 27.1 28.023.0 21.0 22.1 22.5 25.7 Intermediate Assets 30.0 29.9 29.5 27.6 27.952.4 48.9 53.6 49.6 47.0 Fixed Assets 47.6 46.2 45.5 45.3 44.0
100.0 100.0 100.0 100.0 100.0 Total 100.0 100.0 100.0 100.0 100.0LIABILITIES
12.0 14.4 7.1 8.4 7.1 Oper., short term notes <1 yr. 8.2 7.5 6.9 6.1 7.41.9 1.7 1.5 1.6 2.2 Cur. Maturities. I.T. & L.T. 1.6 1.6 1.6 1.5 1.60.2 0.2 0.1 0.0 0.1 CCC and Other Loans 0.1 0.1 0.1 0.1 0.21.9 2.2 2.8 2.0 1.9 All Other Current Liabilities 1.9 2.0 2.2 2.2 2.1
16.0 18.5 11.6 12.1 11.3 Total Current Liabilities 11.9 11.2 10.7 10.0 11.33.1 2.4 3.1 2.5 4.0 Intermediate Liabilities 3.2 3.3 3.5 3.5 3.7
14.2 12.0 9.2 11.6 12.6 Long Term Liabilities 8.8 8.1 7.7 7.6 7.933.3 32.9 23.8 26.2 27.9 Total Liabilities 23.8 22.6 21.9 21.0 22.966.7 67.1 76.2 73.8 72.1 Net Worth 76.2 77.4 78.1 79.0 77.1
100.0 100.0 100.0 100.0 100.0 Total 100.0 100.0 100.0 100.0 100.0INCOME DATA
100.0 100.0 100.0 100.0 100.0 Value of Farm Production 100.0 100.0 100.0 100.0 100.097.8 59.7 67.0 68.9 57.4 Operating Expenses 82.4 72.2 70.6 56.3 55.715.8 8.2 9.4 7.9 5.7 Depreciation 14.4 11.8 11.1 7.9 7.2
-13.6 32.1 23.6 23.2 36.9 Operating Profit 3.2 16.0 18.3 35.8 37.27.9 4.3 4.1 4.2 4.2 Interest Expense 4.3 3.2 2.9 2.6 3.0
-21.4 27.8 19.4 19.0 32.7 NFI from Operations -1.1 12.8 15.4 33.2 34.2FARM DATA
713 786 749 754 673 Tillable Acres 1,153 1,116 1,106 1,088 1,0880.28 0.28 0.30 0.25 0.25 Tenure 0.22 0.22 0.21 0.22 0.21
RATIOSPROFITABILITY
0.3 12.3 6.5 8.7 19.9 1.3 3.9 5.5 14.1 15.4-4.7 7.3 2.9 4.9 9.8 Return on Farm Assets % -0.6 1.6 2.6 8.5 9.6-7.0 2.4 0.6 2.1 5.4 -3.0 -0.4 0.4 4.8 5.6-1.4 16.8 5.9 13.9 23.2 0.8 4.2 6.5 18.5 20.9-6.3 9.5 2.2 7.2 9.4 Return on Farm Equity % -1.7 1.2 2.6 10.3 11.9
-17.7 -0.8 -0.7 2.1 4.0 -5.7 -1.5 -0.3 5.0 5.91.2 36.7 18.0 27.7 39.2 6.4 17.3 21.4 38.6 38.8
-21.9 24.8 9.7 19.8 32.7 Profit Margin Ratio % -4.9 7.1 12.0 29.6 31.1-35.6 3.2 -12.7 8.3 20.0 -19.8 -3.3 0.8 19.8 21.7
LIQUIDITY2.67 4.73 3.59 3.17 4.67 5.84 5.79 6.51 7.20 6.201.56 2.01 2.26 2.30 2.59 Current 2.05 2.32 2.59 3.08 2.731.04 1.41 1.61 1.62 1.48 1.13 1.31 1.46 1.75 1.594.54 5.56 11.18 4.98 6.56 10.42 10.06 9.98 10.44 9.362.98 3.48 3.99 3.83 4.05 Current plus Intermediate 4.02 4.24 4.38 4.86 4.211.70 2.12 2.26 2.74 2.61 2.34 2.52 2.63 2.81 2.59
10.22 4.07 4.87 7.99 6.88 5.35 4.04 3.40 2.94 3.5517.21 9.59 10.29 9.70 10.12 Debt Servicing Ratio % 12.10 9.76 8.90 7.39 7.7228.39 14.84 17.10 14.53 15.75 19.69 16.13 14.78 12.08 12.60
SOLVENCY and COVERAGE24.1 16.8 9.9 14.7 13.8 7.9 8.5 8.5 8.4 9.850.3 32.3 25.4 32.0 28.8 Debt/Equity % 25.5 23.5 22.5 21.9 25.189.5 72.5 48.5 56.3 74.9 56.2 51.7 49.8 45.6 52.319.4 15.1 9.0 12.8 12.2 7.4 7.8 7.8 7.7 8.933.5 24.8 20.3 24.2 22.4 Debt/Assets % 20.4 19.0 18.4 18.0 20.147.2 42.6 32.7 36.0 42.8 36.0 34.1 33.3 31.3 34.33.38 45.47 20.38 15.05 18.97 11.34 28.22 44.47 76.12 57.42
-0.09 10.07 5.78 7.82 9.36 Interest Coverage 1.96 6.68 9.60 19.29 17.58-3.37 5.12 3.19 3.64 5.19 -1.12 2.07 3.29 8.59 7.95
FINANCIAL EFFICIENCY0.29 0.48 0.34 0.40 0.54 0.30 0.35 0.37 0.46 0.500.18 0.30 0.22 0.24 0.33 Asset Turnover 0.18 0.22 0.24 0.31 0.330.11 0.20 0.16 0.18 0.22 0.11 0.14 0.15 0.20 0.2169.9 49.2 56.3 58.2 47.4 70.3 61.9 60.0 46.9 47.697.8 59.2 68.9 65.4 58.1 Operating Expense Ratio 80.6 71.7 68.3 55.5 54.8
115.5 68.6 79.3 73.0 63.8 91.6 81.8 78.3 64.1 62.98.5 4.6 5.8 4.5 3.6 9.2 7.6 6.9 5.0 4.5
12.0 6.1 7.5 5.8 4.7 Depreciation Expense Ratio 13.2 11.0 10.0 7.3 6.617.9 8.7 10.5 8.6 7.4 18.5 15.0 13.6 9.9 9.12.6 1.1 1.0 2.5 2.0 0.8 0.6 0.5 0.5 0.76.3 2.9 3.1 3.3 3.2 Interest Expense Ratio 2.9 2.3 2.0 1.8 2.1
10.1 4.8 4.6 4.7 5.5 5.8 4.5 3.9 3.6 4.19.3 40.5 32.5 29.9 43.3 13.5 24.5 27.9 43.9 44.1
-12.2 30.5 17.8 23.8 33.1 NFI From Operations Ratio 2.5 14.2 18.1 34.6 35.8-28.7 21.2 9.6 18.3 24.9 -10.7 3.3 8.1 24.9 26.3
ABSOLUTE MEASURES-$ (means)3,788,429 4,101,177 3,333,040 3,583,512 3,166,339 Assets 3,782,681 3,725,766 3,583,110 3,432,140 2,913,2601,257,874 1,250,188 762,588 953,143 903,714 Liabilities 789,518 752,435 702,679 656,316 605,2672,530,555 2,850,989 2,570,452 2,630,369 2,262,625 Net Worth 2,993,163 2,973,330 2,880,432 2,775,824 2,307,993
596,645 1,138,816 557,737 914,445 907,219 Value of Farm Production 543,973 634,677 650,248 774,646 709,80644,694 40,841 24,453 38,463 44,994 Interest Expense 23,294 20,649 19,345 20,061 20,797
-107,840 326,186 89,392 207,626 283,516 Net Farm Income 3,694 79,348 105,027 257,538 241,261
GrainHog Table 13. Financial Measures for Hog Farms and Grain Farms, 2014-2010
Source: FBFM Data

501-1,000 1,001-1,500 1,501-2,000 > 2,000 All 501-1,000 1,001-1,500 1,501-2,000 > 2,000 AllAcres Acres Acres Acres Acres Acres Acres Acres Acres Acres
485 289 156 214 1,144 NUMBER OF FARMS 485 289 156 214 1,144
ASSETS7.2 6.3 5.9 5.3 7.1 Cash and Equivalents 5.1 4.8 4.4 4.0 5.1
18.4 19.8 20.9 22.0 18.7 Crops and Feed 12.2 13.8 14.3 16.2 12.70.7 0.4 0.3 0.2 0.5 Market Livestock 0.5 0.3 0.2 0.1 0.35.7 6.2 7.4 6.8 6.0 All Other Current Assets 3.8 4.4 5.0 4.9 4.1
32.0 32.7 34.5 34.2 32.4 Total Current Assets 21.7 23.3 23.9 25.3 22.227.7 27.3 25.7 24.2 27.3 Intermediate Assets 30.1 30.1 28.2 25.9 28.840.3 40.0 39.8 41.5 40.3 Fixed Assets 48.3 46.7 48.0 48.8 48.9
100.0 100.0 100.0 100.0 100.0 Total 100.0 100.0 100.0 100.0 100.0LIABILITIES
11.8 12.4 13.1 12.8 11.6 Oper., short term notes <1 yr. 7.8 8.7 8.8 8.8 7.82.4 2.5 2.7 2.5 2.4 Cur. Maturities. I.T. & L.T. 1.6 1.7 1.8 1.7 1.60.2 0.2 0.4 0.3 0.2 CCC and Other Loans 0.1 0.1 0.3 0.1 0.12.8 3.0 2.7 3.0 2.8 All Other Current Liabilities 1.8 2.1 1.8 2.1 1.9
17.2 18.1 18.8 18.5 17.0 Total Current Liabilities 11.4 12.6 12.7 12.7 11.44.4 5.5 5.5 4.5 4.5 Intermediate Liabilities 2.9 3.8 3.8 3.0 3.0
13.8 14.4 14.6 15.8 14.0 Long Term Liabilities 9.5 9.9 10.0 10.6 9.335.4 37.9 38.9 38.8 35.5 Total Liabilities 23.8 26.3 26.5 26.4 23.764.6 62.1 61.1 61.2 64.5 Net Worth 76.2 73.7 73.5 73.6 76.3
100.0 100.0 100.0 100.0 100.0 Total 100.0 100.0 100.0 100.0 100.0INCOME DATA
100.0 100.0 100.0 100.0 100.0 Value of Farm Production 100.0 100.0 100.0 100.0 100.082.4 79.0 78.3 77.6 81.0 Operating Expenses 82.4 79.0 78.3 77.6 81.014.9 14.2 14.7 13.8 14.3 Depreciation 14.9 14.2 14.7 13.8 14.32.7 6.8 7.1 8.6 4.7 Operating Profit 2.7 6.8 7.1 8.6 4.74.3 4.2 4.4 4.7 4.4 Interest Expense 4.3 4.2 4.4 4.7 4.4
-1.6 2.6 2.7 3.9 0.3 NFI from Operations -1.6 2.6 2.7 3.9 0.3FARM DATA
741 1,226 1,712 3,139 1,201 Tillable Acres 741 1,226 1,712 3,139 1,2010.23 0.19 0.18 0.17 0.23 Tenure 0.23 0.19 0.18 0.17 0.23
RATIOSPROFITABILITY
1.8 2.7 3.0 2.6 2.0 1.0 1.8 1.9 2.0 1.2-1.3 -0.5 0.6 -0.6 -1.1 Return on Farm Assets % -0.7 -0.3 0.4 -0.4 -0.6-5.6 -3.9 -3.9 -4.0 -5.1 -3.4 -2.4 -2.3 -2.5 -3.00.8 2.2 2.6 2.1 1.3 0.5 1.2 1.6 1.3 0.7
-4.6 -2.2 -1.2 -3.7 -4.1 Return on Farm Equity % -1.9 -1.4 -0.5 -1.7 -1.8-16.8 -12.5 -14.0 -13.6 -16.0 -6.4 -5.7 -4.6 -5.0 -6.0
6.6 10.3 10.8 10.5 7.3 6.6 10.3 10.8 10.5 7.3-4.7 -1.4 2.3 -1.8 -3.6 Profit Margin Ratio % -4.7 -1.4 2.3 -1.8 -3.6
-18.5 -13.0 -14.1 -12.9 -18.7 -18.5 -13.0 -14.1 -12.9 -18.7LIQUIDITY
5.99 4.90 3.98 4.41 5.49 6.11 4.86 4.02 4.42 5.661.95 1.87 2.03 1.95 2.03 Current 1.96 1.90 2.03 1.97 2.071.09 1.12 1.16 1.10 1.11 1.10 1.12 1.22 1.13 1.138.27 6.43 5.33 6.02 8.19 11.07 7.95 7.84 7.30 10.593.10 2.82 2.74 2.89 3.13 Current plus Intermediate 3.99 3.53 3.41 3.62 4.051.75 1.66 1.74 1.59 1.78 2.37 2.22 2.27 2.11 2.365.54 6.45 7.67 6.51 5.40 5.54 6.45 7.67 6.51 5.40
12.53 12.91 13.32 11.85 12.31 Debt Servicing Ratio % 12.53 12.91 13.32 11.85 12.3121.17 18.73 19.93 19.23 20.24 21.17 18.73 19.93 19.23 20.24
SOLVENCY and COVERAGE11.1 15.7 23.4 18.9 11.6 7.4 10.7 15.0 14.0 7.943.3 52.6 53.1 17.4 12.0 Debt/Equity % 25.1 30.8 29.6 12.3 7.397.5 115.6 122.1 -6.2 -56.8 54.9 63.6 64.4 -6.2 -56.811.3 15.2 20.4 17.4 12.0 6.9 10.1 13.1 12.3 7.331.9 36.9 35.6 35.7 31.9 Debt/Assets % 20.1 23.7 22.8 23.7 20.152.2 54.8 55.5 54.9 52.5 35.4 39.0 39.2 37.2 35.7
10.76 10.30 7.82 10.69 11.80 10.76 10.30 7.82 10.69 11.802.39 2.23 2.38 2.25 2.34 Interest Coverage 2.39 2.23 2.38 2.25 2.34
-0.80 -0.46 -0.02 -0.06 -0.57 -0.80 -0.46 -0.02 -0.06 -0.57FINANCIAL EFFICIENCY
0.40 0.43 0.42 0.47 0.42 0.28 0.30 0.31 0.34 0.290.28 0.30 0.32 0.32 0.29 Asset Turnover 0.18 0.20 0.19 0.22 0.180.20 0.22 0.22 0.22 0.20 0.11 0.14 0.13 0.12 0.1170.6 68.2 68.0 65.2 69.1 70.6 68.2 68.0 65.2 69.179.6 78.1 77.6 78.2 79.0 Operating Expense Ratio 79.6 78.1 77.6 78.2 79.090.1 88.7 86.9 86.8 89.9 90.1 88.7 86.9 86.8 89.99.3 9.5 10.5 8.9 9.1 9.3 9.5 10.5 8.9 9.1
13.0 13.4 14.0 12.7 13.0 Depreciation Expense Ratio 13.0 13.4 14.0 12.7 13.019.0 18.3 18.3 17.2 18.5 19.0 18.3 18.3 17.2 18.50.9 1.0 1.7 1.2 1.0 0.9 1.0 1.7 1.2 1.02.8 3.2 3.2 3.0 3.0 Interest Expense Ratio 2.8 3.2 3.2 3.0 3.06.0 5.9 6.3 5.7 6.0 6.0 5.9 6.3 5.7 6.0
14.1 14.3 15.0 15.8 14.6 14.1 14.3 15.0 15.8 14.63.6 3.9 5.1 4.3 3.7 NFI From Operations Ratio 3.6 3.9 5.1 4.3 3.7
-9.4 -7.3 -6.1 -5.5 -8.9 -9.4 -7.3 -6.1 -5.5 -8.9ABSOLUTE MEASURES-$ (means)
1,911,896 2,836,371 3,492,474 4,392,374 2,474,099 Assets 3,066,545 4,284,185 5,367,877 7,065,520 3,937,400590,665 945,748 1,231,342 1,717,969 828,575 Liabilities 590,665 945,748 1,231,342 1,717,969 828,575
1,321,232 1,890,624 2,261,132 2,674,405 1,645,523 Net Worth 2,475,880 3,338,437 4,136,536 5,347,551 3,108,825391,076 645,593 853,388 1,131,951 556,713 Value of Farm Production 391,076 645,593 853,388 1,131,951 556,71317,051 28,539 38,159 52,472 25,028 Interest Expense 17,051 28,539 38,159 52,472 25,0284,652 16,815 26,686 33,251 12,547 Net Farm Income 4,652 16,815 26,686 33,251 12,547
Table 14. Modified Cost vs. Market Value Comparison of Financial Measures - 2015
Modified Cost Market ValueGrain Farms Grain Farms
Source: FBFM Data

2014Upper Median Lower Producer Upper Median Lower
Quartile Quartile Characteristics Quartile Quartile
1.14 0.62 0.22 All Producers 1.27 0.58 0.10
Farm Revenue (value of farm production, ($000))1.72 0.81 0.21 $40 to $250 1.96 0.88 0.141.28 0.73 0.24 $251 to $500 1.30 0.60 0.111.01 0.55 0.22 $501 to $750 1.11 0.49 0.080.93 0.51 0.19 $751 to $1,000 0.95 0.44 0.040.84 0.52 0.20 greater than $1,000 0.80 0.45 0.09
Farm Type0.93 0.49 0.26 Hog farms 1.26 0.50 0.031.15 0.63 0.23 Grain farms 1.29 0.60 0.110.37 0.22 0.04 Dairy Farms 0.41 0.15 -0.041.24 0.75 0.37 Beef Farms 3.53 1.09 0.38
Age0.72 0.37 0.11 Less than 30 years 0.73 0.35 0.000.76 0.37 0.10 30 to 39 0.68 0.27 -0.030.86 0.44 0.10 40 to 49 0.88 0.40 -0.020.93 0.55 0.19 50 to 59 1.09 0.48 0.041.59 0.87 0.41 60 and over 1.75 0.88 0.31
Tenure (acres owned/acres operated)1.02 0.52 0.14 less than 10% 1.07 0.46 0.031.01 0.59 0.21 11% to 25% 1.11 0.50 0.081.24 0.71 0.34 26% to 50% 1.41 0.78 0.261.45 0.71 0.25 51% to 75% 1.66 0.84 0.222.08 1.12 0.51 greater than 75% 2.11 1.22 0.45
Table 15. Working Capital to VFP across select producer characteristics, 2014-15.2015
Source: FBFM Data

Upper Median Lower Producer Upper Median Lower Quartile Quartile Characteristics Quartile Quartile
3.97 1.48 0.31 All Producers 1.85 0.42 -0.64
Farm Revenue (value of farm production, ($000))11.33 1.17 -0.37 $40 to $250 4.47 0.32 -1.544.54 1.35 0.34 $251 to $500 2.07 0.25 -0.773.50 1.52 0.29 $501 to $750 1.48 0.28 -0.563.19 1.19 0.22 $751 to $1,000 1.65 0.58 -0.053.86 1.80 0.88 greater than $1,000 1.65 0.84 0.04
Farm Type6.48 3.36 1.52 Hog farms 0.66 -0.74 -3.033.86 1.38 0.28 Grain farms 1.90 0.44 -0.586.87 3.56 1.64 Dairy Farms 1.84 0.33 -1.224.89 3.52 1.95 Beef Farms 0.24 -2.12 -4.78
Tenure (acres owned/acres operated)4.20 1.53 0.16 less than 10% 2.01 0.34 -0.873.49 1.35 0.25 11% to 25% 1.46 0.37 -0.373.39 1.49 0.53 26% to 50% 1.82 0.54 -0.553.99 1.42 0.51 51% to 75% 1.63 0.57 -0.31
999.99 2.51 0.86 greater than 75% 16.11 1.01 0.06
Table 16. Term Debt and Capital Lease Ratio across select producer characteristics, 2014-2015.20152014
Source: FBFM Data

$0
$100
$200
$300
$400
$500
$600
$700
$800
$900
$0
$500,000
$1,000,000
$1,500,000
$2,000,000
$2,500,000
$3,000,000
0 1,000 2,000 3,000 4,000 5,000 6,000 7,000
Tota
l Mac
hine
ry V
alue
Total Acres Farmed
Average Machinery ValuesFBFM Grain Farms
Machinery Value per Acre
Total machinery value
Machinery value per acre
Source: FBFM Data 2015
Source: FBFM Data