Financial and Economic Analyses of Biogas- to-Energy ...
55
Financial and Economic Analyses of Biogas- to-Energy Projects in Brazil Karina Johnson Lassner ADVISORS Dr. Robert Conrad and Dr. Prasad Kasibhatla
Transcript of Financial and Economic Analyses of Biogas- to-Energy ...

Financial and Economic Analyses of Biogas-to-Energy Projects in Brazil
Karina Johnson Lassner
ADVISORS
Dr. Robert Conrad and Dr. Prasad Kasibhatla

1
Table of Contents
1. Introduction …………………………………………………………………………………….……. 2
a. Purpose of Study .…………………………………………………………………………. 2
b. Methods Employed .……………………………………………………………………… 3
2. Energy Use in Brazil and Energy-Related CO2 Emissions …………………….. 3
3. Alegria Wastewater Treatment Plant ………………………………………………….. 7
4. Biogas-to-Energy Project Alternatives ………………………………………………… 8
a. Green Electricity Project ……………………………………………………………… 8
b. Renewable Natural Gas Project …………………………………………….……. 12
5. Financial and Economic Perspectives ………………………………………….…….. 15
6. Biogas-to-Energy Project General Assumptions ………………………………... 16
a. Macro-Economic Assumptions ……………………………………………........... 16
b. Green Electricity Project Assumptions ………………………………………... 20
c. Renewable Natural Gas Project Assumptions ………………………….…... 22
7. Financial Analysis ……………………………………………………………………….….…... 24
a. Green Electricity Project …………………………………………….……….….…... 24
b. Renewable Natural Gas Project ……………………………………...……….…... 29
8. Economic Analysis ……………………………………..………….......................................... 35
a. Green Electricity Project …………..………..………….......................................... 35
b. Renewable Natural Gas Project ..…………........................................................ 39
9. Sensitivity Analysis ..…………........................................................................................... 43
a. Green Electricity Project ...................................................................................... 43
b. Renewable Natural Gas Project ......................................................................... 45
10. Emissions Reductions ....................................................................................................... 46
a. Green Electricity Project ...................................................................................... 47
b. Renewable Natural Gas Project ......................................................................... 49
11. Conclusions ............................................................................................................................. 51
12. References ............................................................................................................................. .. 52

2
1. INTRODUCTION
The Alegria Wastewater Treatment Plant is one of the largest wastewater treatment
plants (WWTPs) in Brazil. It is owned by the Companhia Estadual de Aguas e
Esgotos (CEDAE), the state agency that manages and treats most of the sewage
water in Rio.
Sewage at the WWTP is treated through several different processes, including
sedimentation tanks and anaerobic reactors. A byproduct of sewage treatment via
anaerobic digestion is biogas. After it is processed to required standards of purity,
biogas becomes a renewable fuel for electricity generation or a substitute for
natural gas. Currently, Alegria WWTP flares the biogas produced in the anaerobic
reactors. In doing so, the WWTP is incurring operational costs and wasting a
valuable source of energy. However, looking into the future, Alegria WWTP intends
to use the energy stored in the biogas to generate electricity or natural gas.
1.A. PURPOSE OF STUDY
This study aimed to analyze what is the best use of the WWTP’s biogas from both
the financial and economic perspectives. A discounted cash flow (DCF) analysis was
used to compare the net befits of a biogas-to-electricity project (Green Electricity
Project) and a biogas-to-renewable natural gas project (Renewable Natural Gas
Project). The DCF method provides an objective basis for evaluating and selecting
investment projects because both the magnitude and timing of expected cash flows
in each period of a project’s life are incorporated into the analysis.
The two project alternatives were compared based on net present value (NPV)
calculated from both the financial (private) and economic (social) perspectives. The
financial analysis consisted in comparing revenue and expenses recorded by the
concerned economic agents in each project alternative and in working out the
corresponding financial return ratios. The economic analysis, however, aimed at

3
identifying and comparing economic and social benefits accruing to the Brazilian
economy as a whole.
1.B. METHODS EMPLOYED
The methods used in this study included on-site data collection, literature review
and interviews with industry specialists. On-site data collection included gathering
technical information about the biogas purification system, such as its components
and efficiency, and generators. Literature review was performed for information on
Brazilian macro-economic indicators and commodity prices. Lastly, interviews with
industry specialists were conducted to collect information on equipment and
operation and maintenance costs for both biogas-to-energy projects.
Results from the study showed that both projects have high and positive NPV.
However, the RNG project generated larger benefits for both the private investor
and the economy as a whole. With regards to the environmental benefits, the
emissions reductions obtained through the implementation of an RNG project were
also higher than for a green electricity project.
The following sections provide in depth analyses of the methods used to evaluate
the biogas-to-energy project alternatives. However, before evaluating Alegria
WWTP’s alternatives, some background on the current energy-use scenario in Brazil
is presented to understand the urgent need for more renewable energy projects in
Brazil.
2. ENERGY USE IN BRAZIL AND ENERGY-RELATED CO2 EMISSIONS
According to the United States Energy Information Administration (EIA), Brazil is
the ninth largest energy consumer in the world and the third largest in the Western
Hemisphere, behind the United States and Canada. Total primary energy
4
consumption in Brazil has increased by almost a third over the last decade, due, in
part, to sustained economic growth (EIA, 2011).
Brazil has also significantly increased its total domestic energy production,
particularly in oil and ethanol production. Recent discoveries of large offshore, pre-
salt oil deposits could transform Brazil into one of the largest oil producers in the
world.
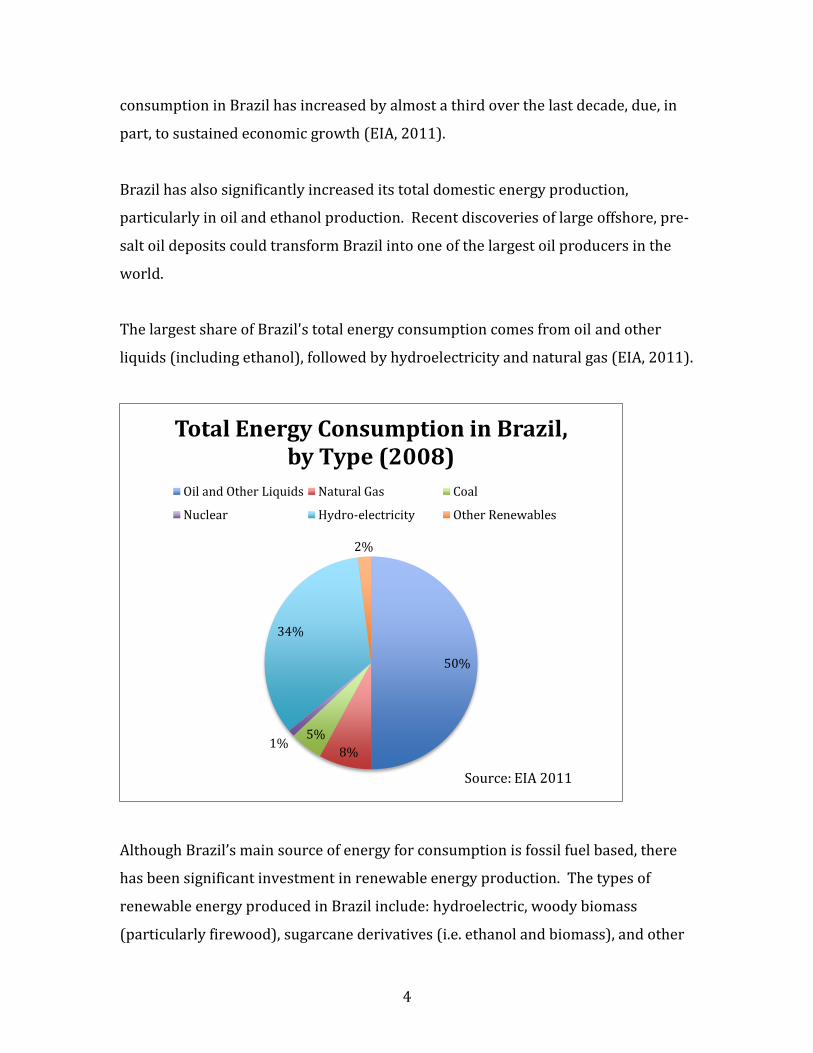
The largest share of Brazil's total energy consumption comes from oil and other
liquids (including ethanol), followed by hydroelectricity and natural gas (EIA, 2011).
Although Brazil’s main source of energy for consumption is fossil fuel based, there
has been significant investment in renewable energy production. The types of
renewable energy produced in Brazil include: hydroelectric, woody biomass
(particularly firewood), sugarcane derivatives (i.e. ethanol and biomass), and other
50%
8%
5%1%
34%
2%
Total Energy Consumption in Brazil, by Type (2008)
Oil and Other Liquids Natural Gas Coal
Nuclear Hydro-electricity Other Renewables
Source: EIA 2011

5
renewables (i.e. wind and biodiesel). As shown in the graph below, renewable
energy production has increased about 3% between 2002 and 2008. The non-
renewable energy sources shown in the graph below include: petroleum, natural
gas, steam coal, metallurgical coal, and uranium (U308).
The reduction in renewable energy production between 2008 and 2009 is mainly
due to a reduction in energy from firewood (2.2% reduction), hydroelectric power
(0.5% reduction), and ethanol (0.2% reduction). The 2% increase in non-renewable
energy is from an increase in crude and shale oil production. The cause of this
increase was the start of operation of four production units. Furthermore, three
other operating units had their production rates increased (EPE BEN, 2010).
However, it can be seen that the general trend shows an increase in renewable
energy production and a decrease in non-renewable energy production.
The development of the Brazilian economy has had a significant impact on energy-
related carbon dioxide (CO2) emissions. According to the EIA, Brazil’s energy-
related CO2 emissions has increased from 377 million metric tons in 2006 to 420
40.0%
42.0%
44.0%
46.0%
48.0%
50.0%
52.0%
54.0%
56.0%
1999 2001 2003 2005 2007 2009
Year
Primary Energy Production
Non-Renewable Energy
Renewable Energy
Source: EPE BEN 2010

6
million metric tons in 2009. This represents an 11% increase in energy-related CO2
emissions. As can be seen in the graph below, per–capita energy-related CO2
emissions have also increased about 9% between 2005 and 2009 (EIA, 2011).
China’s and India’s per-capita emissions have increased by 37% and 27%,
respectively. The US and Canada have reduced their per-capita emissions by 13%
and 16%, respectively.
Options to decrease energy-related per-capita CO2 emissions in Brazil include
increasing the amount of renewable energy that is produced and consumed in the
country. Electricity generated from renewable sources such as biogas provides
benefits from displacing electricity generated from non-renewable sources.
Renewable natural gas (RNG) is another source of clean fuel that can displace fossil
fuel derived natural gas, gasoline or diesel. When RNG is used in place of these fuels
to power motor vehicles, it produces major reductions in CO2 emissions. Developing
0
5
10
15
20
25
United States
Canada Brazil Russia India China
Me
tric
To
ns
of
CO
2 p
er
Ca
pit
a
Per Capita Carbon Dioxide Emissions from the Consumption of Energy
2005
2006
2007
2008
2009
Source: EIA 2011

7
a biogas-to-energy project for the Alegria WWTP will thus provide high
environmental benefits by reducing overall CO2 emissions.
3. ALEGRIA WASTEWATER TREATMENT PLANT
The Alegria WWTP serves about 1.5 million people and treats up to 57 million
gallons per day (MGD) of municipal wastewater. Sewage at the WWTP is treated
through several different processes, including sedimentation tanks and anaerobic
reactors. These processes can be seen in Figure 1 below.
Figure 1. Alegria WWTP
A byproduct of sewage treatment is an activated sludge that is then treated in
anaerobic reactors. The decomposition of sludge in the anaerobic reactor produces
a biogas that is composed of mainly carbon dioxide (CO2) and methane (CH4). By
law, WWTPs are not allowed to vent this biogas into the atmosphere because of its
high greenhouse gas content. As a result, WWTPs flare the biogas as this process
transforms most of the CH4 into CO2. This in turn reduces the 100-year Global
Warming Potential by a factor of 24 and makes WWTPs in compliance with
environmental regulations.

8
Several wastewater treatment plants in the United States have begun to use the
biogas produced in the anaerobic reactors to generate electricity or renewable
natural gas. Some examples of WWTPs that generate electricity include the
Columbia Boulevard Wastewater Treatment Plant in Oregon and the Essex Junction
Wastewater Treatment Facility in Vermont. At the Columbia Boulevard plant, about
half of the biogas is consumed by two 850 kilowatt internal combustion generators
which can create about 1.7 megawatts of electricity combined (River Network,
2010). The Essex Junction WWT Facility uses methane from anaerobic reactors to
fuel two 30-kW micro-turbines (Northeast CHP Application Center, 2011). The city
of Escondido in California has partnered with Southern California Gas and Co. to
develop a renewable energy project that will purify wastewater biogas so that is
meets state standards for natural gas delivered to homes and businesses (The City
of Escondido, 2011).
Technologies used to generate electricity and RNG from biogas have become more
robust, and the costs associated with these technologies have decreased. As a result,
generation of electricity or RNG at Alegria WWTP has become a cost-efficient
alternative for the treatment of biogas at the WWTP.
4. BIOGAS-TO-ENERGY PROJECT ALTERNATIVES
In this section, a detailed description of the processes involved in the biogas-to-
electricity project and biogas-to-RNG project is provided.
4.A. GREEN ELECTRICITY PROJECT
The green electricity project includes purifying about 8,000 cubic meter per day
(m3/ day) of biogas to serve as fuel for a generation plant with a capacity of 252 kW.
The green electricity would be sold to the grid at a price that is determined by

9
renewable electricity auction–market prices. A process flow diagram for the green
electricity project can be seen in Figure 2 below.
Figure 2. Green Electricity Process Flow Diagram
Flare
Purification System
252 kW Generator
Electricity
Biogas
Anaerobic Reactors
CEDAE Substation

10
Mechanical Systems
The first step in green electricity generation includes passing the biogas through a
purification system. This purification system can be seen in Figure 3 below.
Figure 3. Biogas Purification System
For electricity generation, the biogas only goes through steps 1 and 2. Step 1
includes passing the biogas through filters that remove hydrogen sulfide (H2S).
Step 2 includes removing water in the biogas before it is sent to the generator. The
rest of the purification system can be used for RNG generation. This system can
purify the gas to have 75% methane (CH4) for electricity generation or up to 97%
CH4 for RNG generation.
11
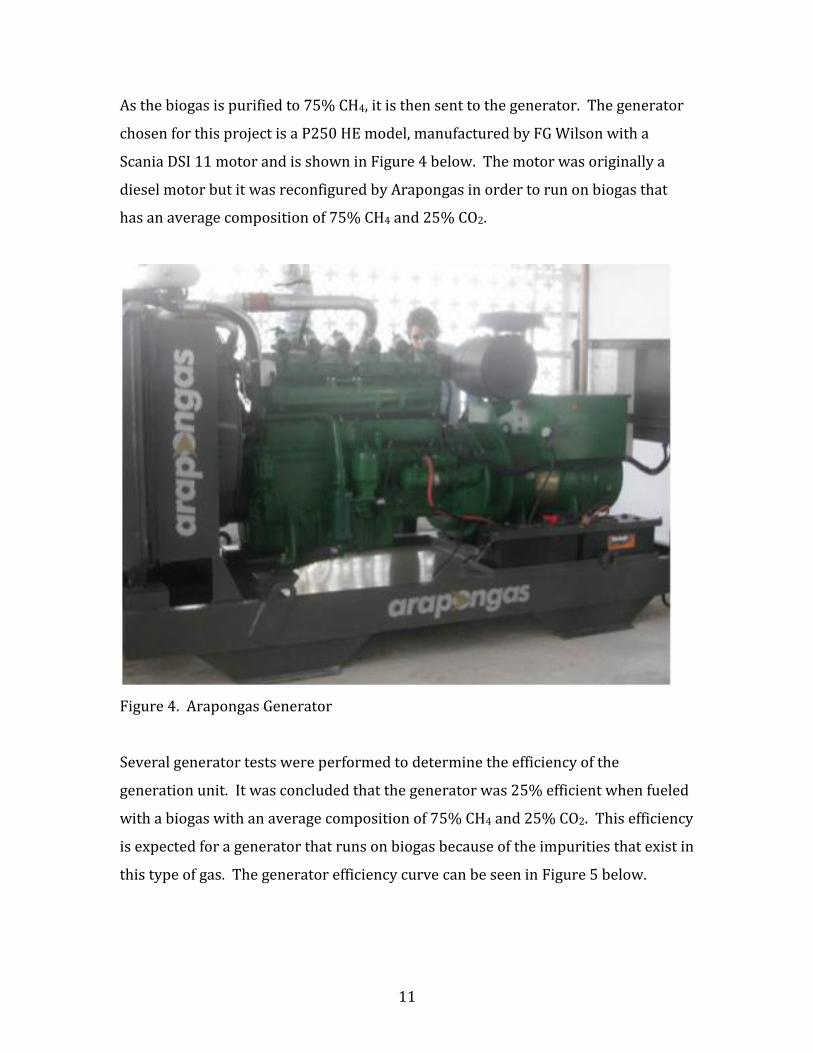
As the biogas is purified to 75% CH4, it is then sent to the generator. The generator
chosen for this project is a P250 HE model, manufactured by FG Wilson with a
Scania DSI 11 motor and is shown in Figure 4 below. The motor was originally a
diesel motor but it was reconfigured by Arapongas in order to run on biogas that
has an average composition of 75% CH4 and 25% CO2.
Figure 4. Arapongas Generator
Several generator tests were performed to determine the efficiency of the
generation unit. It was concluded that the generator was 25% efficient when fueled
with a biogas with an average composition of 75% CH4 and 25% CO2. This efficiency
is expected for a generator that runs on biogas because of the impurities that exist in
this type of gas. The generator efficiency curve can be seen in Figure 5 below.

12
Figure 5. Arapongas Generator Efficiency Curve
Given the amount of biogas that can be produced in the anaerobic reactors and the
efficiencies of the generator and purification system, it was determined that the
maximum electricity that could be generated at the WWTP was 252 KW.
4.B. RNG PROJECT
The RNG project includes a purification system capable of purifying about 8,000
m3/ day of biogas as well as compressors with capacity to compress 3,500 m3 of
RNG per day. The RNG would be sold to a natural gas (NG) distributor at the
wholesale price of compressed natural gas who would then transport the
compressed RNG to a local gas station via trucks with high-pressure cylinders. A
process flow diagram for the RNG project can be seen in Figure 6 below.
0%
5%
10%
15%
20%
25%
30%
0 50 100 150 200
Glo
ba
l G
en
era
tor
Eff
icie
ncy
(%
)
KW

13
Figure 6. RNG Project Process Flow Diagram
Mechanical Systems
The first step in RNG generation includes passing the biogas through a purification
system. This purification system is the same system as the one that is used in the
green electricity project.
For RNG generation, the biogas passes through all the stages of the biogas
purification system (stages 1 through 6 as shown in Figure 3). Stage 1 includes
passing the biogas through filters that remove hydrogen sulfide (H2S). Stage 2 is a
drying tower that removes moisture in the biogas. In stage 3, about 30% of CO2 is
Flare
Purification System
Compressed
RNG
Biogas
Anaerobic Reactors
NG Distributor
Compressors

14
removed as well as the residual H2S. Stage 4 includes compressing the biogas to a
pressure of about ten atmospheres (atm). Because this process creates moisture,
stage 5 includes passing the biogas through a compressed-air drying system that
removes residual moisture from this process. Before entering stage 6, the pressure
of the biogas is reduced to six atm. In stage 6, the biogas passes through a pressure
swing adsorption (PSA) filter, where CO2 and residual moisture are removed. At the
end of the purification system, the purified biogas has a concentration of about 97%
CH4 and 3% CO2.
As the biogas is purified to 97% CH4, it is then sent to the natural gas compressor.
The compressor chosen for this project is a 115-1M-SCA model, manufactured by
Aspro (see Figure 7). Two SCA compressors will be purchased for this project in
order to have a back-up compressor.
Figure 7. Aspro Compressor
15
5. FINANCIAL AND ECONOMIC PERSPECTIVES
For a project to be economically viable, it must be financially sustainable, as well as
economically efficient. If a project is not financially sustainable, economic benefits
will not be realized. Hence, when trying to evaluate project alternatives, it is very
important that the analysis be performed from both the financial and economic
perspectives.
In this analysis, financial and economic DCFs were constructed to evaluate ten-year
biogas-to-energy projects. Financial DCFs were used to determine if the wealth of
the private sector increases by the implementation of a biogas-to-energy project. In
financial accounting, costs and benefits are allocated so that there is some matching
in time. The matching of revenues with expenditures is important because the
purpose of the income measure is to determine the change in the value of assets or
stocks.
Economic DCFs, however, were constructed to assess the overall impact of the
project on improving the economic welfare of Brazilian citizens. This analysis uses
shadow prices (willingness to pay and willingness to accept compensation) rather
than prices actually paid or received. The economic analysis differed from the
financial analysis in that costs related to taxes and environmental and operational
licenses were not included. This is because costs related to taxes and licenses
represent a redistribution of benefits from the private investor to the government.
A different discount rate was also used in the economic analysis since the
opportunity cost of obtaining income for the Brazilian economy is different than
that of the Alegria WWTP.

16
6. BIOGAS-TO-ENERGY PROJECT GENERAL ASSUMPTIONS
In this section, general information on the biogas-to-energy project model
assumptions are provided. These include macro-economic assumptions and project
specific assumptions.
6.A. MACRO-ECONOMIC ASSUMPTIONS
In this section, the macro-economic assumptions made in the financial and
economic analysis are described. Assumptions were made because the models
included analyses for ten-year projects.
Inflation
Currently Brazil has an inflation-targeting regime that targets the inflation rate at
5%. Figure 8 below shows inflation rates for four developing economies, including
Brazil, which were presented by the International Monetary Fund in the 2010 World
Economic Outlook (WEO, 2010). As can be seen in the graph, inflation in Brazil was
very high in 2002 but then stabilized around 5% in the following years.

17
Figure 8. IMF WEO Inflation Rates for Emerging Economies
The Brazilian Central Bank (Central Bank) also releases inflation projections per
quarter. Table 1 below presents the Central Bank’s inflation projection as of
September 2010 (Central Bank Inflation Report, 2010).
Table 1. Inflation Projection & Actual Inflation as of September 2010
(Source: Brazilian Central Bank Inflation Report)
Period Projected Scenario (%) Actual Scenario (%) Average Actual (%)
2010QIII 4.7 4.7 4.9
2010QIV 5.0 5.0
2011QI 4.4 4.5
4.6 2011QII 4.4 4.4
2011QIII 4.7 4.7
2011QIV 4.6 4.6
2012QI 4.7 4.6
4.4 2012QII 4.4 4.3
2012QIII 4.4 4.3
18
For this analysis, the average actual inflation rate per annum was used for the first
three years of both projects and the steady state inflationary expectation rate of 5%
was used for the remainder of the analysis.
Growth of Real and Nominal Wages
The Economist Intelligence Unit releases information on the Brazilian workforce via
a monthly country report. The report includes several economic indicators,
including the average real growth of wages between 2002 and 2010 and a forecast
out to 2015. Based on the forecast of average growth of real wages of 1.8% and on
the steady state inflationary expectation rate of 5% presented in a previous section,
the growth rate of nominal wages assumed for this analysis is approximately 7%.
Discount Rate
The private discount rate used in the green electricity financial analysis is the
weighted average cost of capital (WACC) for the Brazilian electricity distribution
market. According to the report “Brazilian Electric Power Market and the Cost of
Capital of Electric Power Companies,” the WACC for the distribution of electricity is
between 11% and 13% (Catapan, 2007). A 12% nominal discount rate is thus used
for the financial analysis of the green electricity project.
The private discount rate used in the RNG financial analysis is 15% based on
conversations with companies in the natural gas distribution industry.
The social discount rate used in the green electricity and RNG economic analyses is
the 3-month London Interbank Offered Rate (LIBOR) rate adjusted for inflation.
Currently the Brazilian Real three months LIBOR rate stands at 8.62% (Trading
Economics: Brazilian Real LIBOR Rate). This rate represents the opportunity cost
for the Brazilian economy.

19
Taxes
Relevant taxes to both the green electricity and RNG projects include: (i) PIS-
Programa de Integração Social (Contribution to the Social Integration Program); (ii)
COFINS- Contribuição para o Financiamento da Seguridade Social (Contribution
Social Security Financing); (iii) CSLL- Contribuição Social Sobre o Lucro Liquido
(Social Contribution on Net Corporate Profits); (iv) IR-Imposto de Renda (Corporate
Income Tax); and (v) ICMS- Imposto sobre Circulação de Mercadorias e Prestação de
Servicos (Taxes on Goods and Services). PIS, COFINS, CSLL and IR are profit taxes
while ICMS is a value-added tax.
Taxes are charged based on assumed net corporate profits. For the green electricity
and the RNG project, it is assumed that corporate net profits are 32%. Based on the
activity level and the assumed profit rate, the following tax rates are used for
calculating IR and CSLL.
Table 2. IR and CSLL Rates (Source: Consultor Fiscal website)
Activity Level
Assumed
Profit Rate IR CSLL
Resale of fuels derived from oil, ethanol and
natural gas 1.60% 0.24% 12%
Merchandise sale-Hospital Services-Real
Estate Activities-Rural Activities 8% 1.20% 12%
Transportation Services 16% 2.40% 12%
General Services 32% 4.80% 12%
PIS and Cofins are charged at 0.65% and 3.0%, respectively (Secretariat of the
Federal Revenue of Brazil, 2011). ICMS is a state tax charged on value of

20
merchandise and services sold. Table 3 below provides a summary of the taxes
based on selling green electricity and RNG.
Table 3. Summary of Taxes for RNG and Green Electricity Projects
Tax Rate used in
Analyses (%) Jurisdiction
PIS 0.65 Union
COFINS 3.0 Union
CSLL 12 Union
IR 4.8 Union
ICMS 12 State
6.B. GREEN ELECTRICITY PROJECT ASSUMPTIONS
In this section, the assumptions made in both the financial and economic analysis of
the green electricity project are described. Assumptions were made because the
models included analyses for ten-year projects.
Operation
The operation of the plant pertains to how many hours the generation unit will be
producing electricity per year. For this analysis, it is assumed that the generation
unit will generate electricity 24 hours a day during 90% of the time every year.
Hence, the generator will operate for 24 hours a day during 329 days per year. The
10% down-time is assumed for maintenance and repairs. During the 10% down-
time, no electricity will be produced and all of the biogas will be flared. No storage
of biogas will be required, as all the biogas will be instantaneously used to generate
electricity.
21
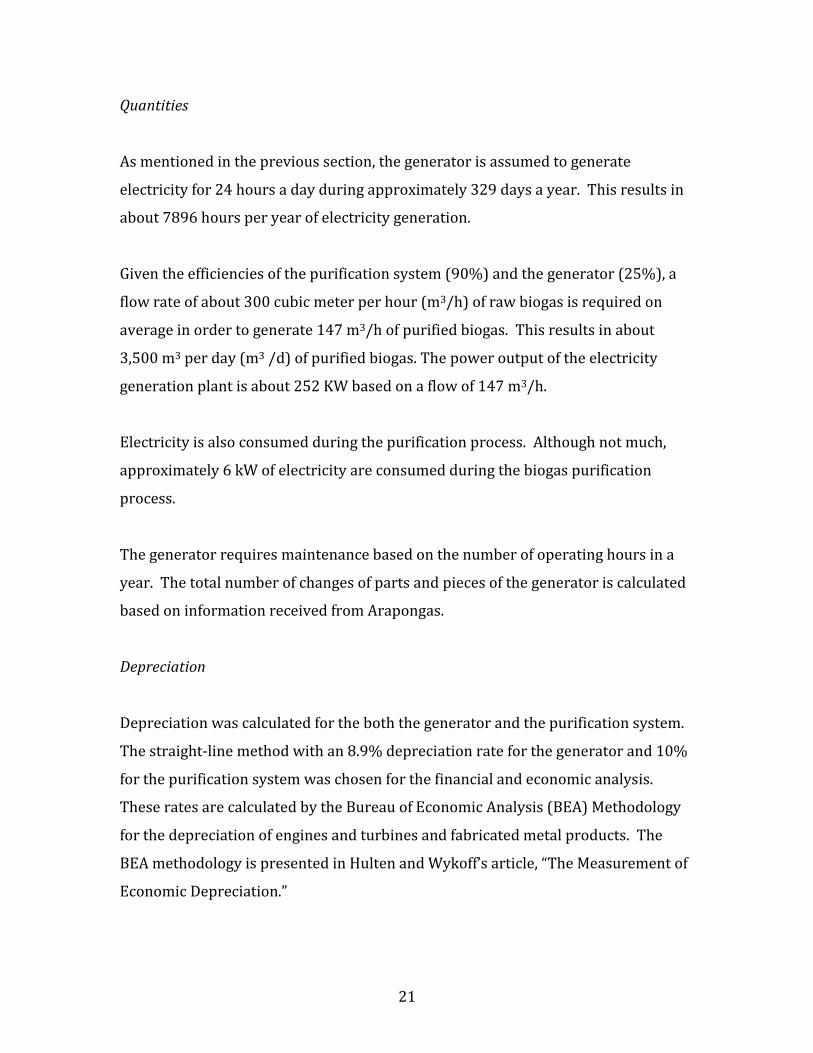
Quantities
As mentioned in the previous section, the generator is assumed to generate
electricity for 24 hours a day during approximately 329 days a year. This results in
about 7896 hours per year of electricity generation.
Given the efficiencies of the purification system (90%) and the generator (25%), a
flow rate of about 300 cubic meter per hour (m3/h) of raw biogas is required on
average in order to generate 147 m3/h of purified biogas. This results in about
3,500 m3 per day (m3 /d) of purified biogas. The power output of the electricity
generation plant is about 252 KW based on a flow of 147 m3/h.
Electricity is also consumed during the purification process. Although not much,
approximately 6 kW of electricity are consumed during the biogas purification
process.
The generator requires maintenance based on the number of operating hours in a
year. The total number of changes of parts and pieces of the generator is calculated
based on information received from Arapongas.
Depreciation
Depreciation was calculated for the both the generator and the purification system.
The straight-line method with an 8.9% depreciation rate for the generator and 10%
for the purification system was chosen for the financial and economic analysis.
These rates are calculated by the Bureau of Economic Analysis (BEA) Methodology
for the depreciation of engines and turbines and fabricated metal products. The
BEA methodology is presented in Hulten and Wykoff’s article, “The Measurement of
Economic Depreciation.”

22
6.C. RNG PROJECT ASSUMPTIONS
In this section, the assumptions made in both the financial and economic analysis of
the RNG project are described. Assumptions were made because the models
included analyses for ten-year projects.
The operation of the plant pertains to how many days the purification system and
the compressor will be online. For this analysis, it is assumed that the systems will
be generating compressed renewable natural gas 90% of the time every year. The
10% down-time is assumed for maintenance and repairs.
The SCA will compress the RNG and will discharge the compressed RNG into high-
pressure cylinders that can be trucked off site. Figure 9 and 10 below shows how
the high-pressure cylinders will be charged and how it will be trucked off site to be
sold to a local gas station.
Figure 9. Charging Cylinders with RNG
23
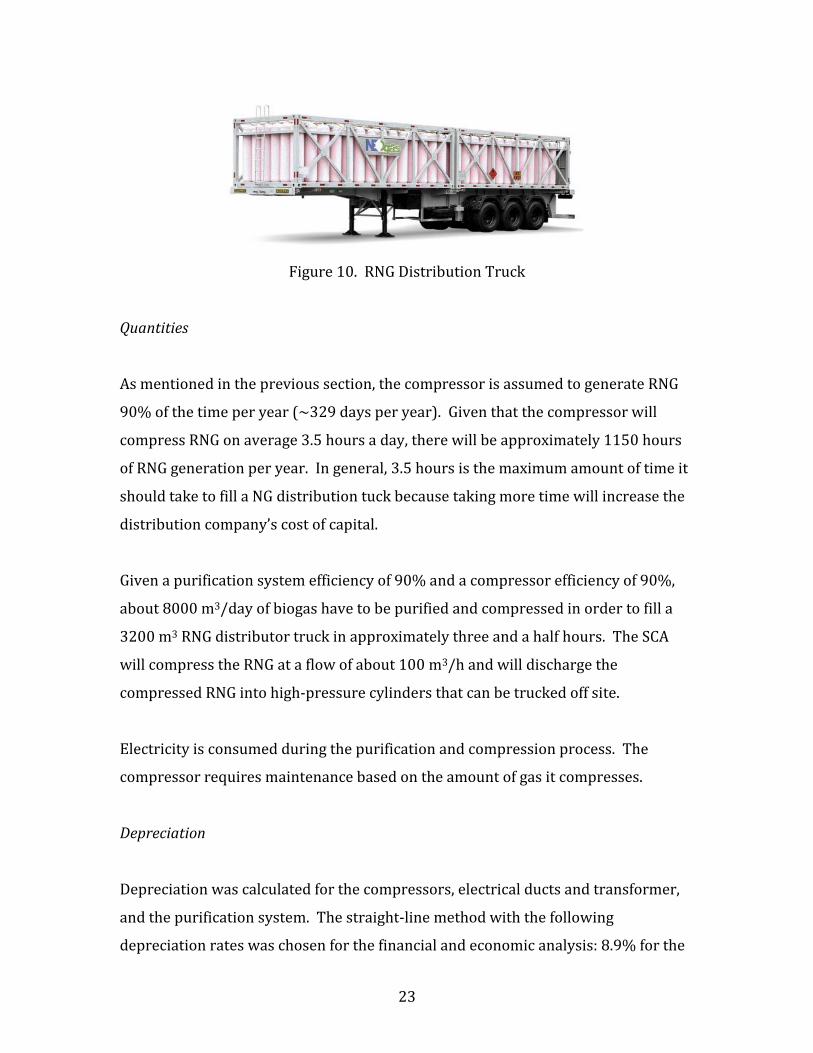
Figure 10. RNG Distribution Truck
Quantities
As mentioned in the previous section, the compressor is assumed to generate RNG
90% of the time per year (~329 days per year). Given that the compressor will
compress RNG on average 3.5 hours a day, there will be approximately 1150 hours
of RNG generation per year. In general, 3.5 hours is the maximum amount of time it
should take to fill a NG distribution tuck because taking more time will increase the
distribution company’s cost of capital.
Given a purification system efficiency of 90% and a compressor efficiency of 90%,
about 8000 m3/day of biogas have to be purified and compressed in order to fill a
3200 m3 RNG distributor truck in approximately three and a half hours. The SCA
will compress the RNG at a flow of about 100 m3/h and will discharge the
compressed RNG into high-pressure cylinders that can be trucked off site.
Electricity is consumed during the purification and compression process. The
compressor requires maintenance based on the amount of gas it compresses.
Depreciation
Depreciation was calculated for the compressors, electrical ducts and transformer,
and the purification system. The straight-line method with the following
depreciation rates was chosen for the financial and economic analysis: 8.9% for the

24
compressor, 9.5% for electrical ducts and transformer, and 10% for the purification
system. These rates are calculated by the Bureau of Economic Analysis (BEA)
Methodology for the depreciation of engines and turbines and fabricated metal
products. The BEA methodology is presented in Hulten and Wykoff’s article, “The
Measurement of Economic Depreciation.”
7. FINANCIAL ANALYSIS
In this section, the costs and revenues related to the green electricity and RNG
projects are described.
7.A. GREEN ELECTRICITY PROJECT
Capital Expenditures (CAPEX)
Capital expenditures include the initial investments on the biogas purification
system, the generator and operating and environmental licenses. The investments
in the generator and purification system are RS170,000 and R$110,000,
respectively. The operating and environmental licenses cost about R$50,000. These
investments are done in 2010, which is year 0 of the project.
Operational Expenditures (OPEX)
Operational expenditures include: (i) operator wages; (ii) generator maintenance;
(iii) maintenance of biogas purification system; (iv) electricity purchased from grid;
and (v) taxes paid on revenues from selling green electricity.
Costs related to operator wages are calculated based on the assumption that only
one employee is required to operate the biogas-to-energy plant. The employee will
ensure that the systems are operating well and will be on site for eight hours a day.
This operator is also responsible for responding to any emergencies that could
25
happen after hours. The operator will not perform maintenance on the generator as
this will be performed by specialized mechanics from Arapongas. A third party will
also perform maintenance of the purification system.
The operator will be paid monthly and will receive an end-of-the-year bonus. The
bonus is typically equal to a monthly paycheck. The operator wage and bonus are
tax-inclusive in both the financial and economic analysis since it is assumed that the
operator is otherwise employed. Operator wages are assumed to grow at the rate of
growth of real wages.
Generator maintenance costs are calculated based on the number of required
repairs and their costs, as provided by the generator manufacturer Arapongas.
Generator maintenance costs are assumed to grow at the rate of inflation.
The maintenance costs associated with the purification system are calculated based
on the number of filter changes per year and its cost. Purification system
maintenance costs are also assumed to grow at the rate of inflation.
Costs related to the purchase of electricity from the grid will vary throughout the
years of the project since these costs are dependent on an electricity price
distribution model. The model was developed by using electricity futures contract
prices determined in the Brazilian electricity auction. The price of electricity supply
from the grid is tax inclusive.
Taxes paid on the green electricity that is sold in the electricity auction include: PIS,
COFINS, CSLL, IR, and ICMS.
A summary of the green electricity total costs can be seen in Table 4 below. As can
be seen, this project has a present value of total costs of about $991,000 at a 12%
discount rate.

26
TABLE 4. GREEN ELECTRICITY FINANCIAL COST ANALYSIS
0 1 2 3 4 5 6 7 8 9 10
Capital Costs (CAPEX)
Investment (R$/year)
Generator 170,000
Purification System 110,000
Licenses 50,000
Total CAPEX (R$/year) 330,000
Operating Costs (OPEX)
Operator Wages (R$/year) 19,500 20,724 22,152 23,679 25,310 27,054 28,918 30,910 33,040 35,317
Generator Maintenance (R$/year)
Total oil & lube 10,643 11,112 11,667 12,251 12,863 13,506 14,182 14,891 15,635 16,417
Total spark plug 6,623 6,914 7,260 7,623 8,004 8,404 8,824 9,265 9,729 10,215
Total filter change 5,814 6,070 6,374 6,692 7,027 7,378 7,747 8,135 8,542 8,969
Total liquid change 1,603 1,674 1,757 1,845 1,937 2,034 2,136 2,243 2,355 2,473
Total air filter maintenance 1,971 2,058 2,161 2,269 2,382 2,501 2,626 2,758 2,895 3,040
Total air filter change 2,260 2,360 2,477 2,601 2,731 2,868 3,011 3,162 3,320 3,486
Total valve adjustment 3,942 4,115 4,321 4,537 4,764 5,002 5,252 5,515 5,791 6,080
Purification System Maint. (R$/year) 20,000 20,880 21,924 23,020 24,171 25,380 26,649 27,981 29,380 30,849
Grid Electricity (R$/year) 5,365 5,732 4,393 3,691 2,988 3,249 2,570 2,570 2,570 2,570
Profit Taxes Green Electricity Sold @ Auction (R$/yr) 9,088 9,488 9,963 10,461 10,984 11,533 12,110 12,715 13,351 14,589
Value-Added Taxes Green Elec. Sold @ Auction
(R$/yr)
11,444 11,947 12,545 13,172 13,831 14,522 15,248 16,011 16,811 18,370
Total OPEX (R$/year) 98,253 103,074 106,994 111,840 116,992 123,432 129,274 136,156 143,419 152,374
Total Costs (R$/year) 330,000 98,253 103,074 106,994 111,840 116,992 123,432 129,274 136,156 143,419 152,374
Discount Rate 1.00 0.89 0.80 0.71 0.64 0.57 0.51 0.45 0.40 0.36 0.32
PV (@12%) 330,000 87,726 82,170 76,156 71,076 66,385 62,535 58,477 54,991 51,718 49,060
Sum PV of Total Costs 990,295

27
Based on the cost schedule presented above and a discount rate of 12%, the average
costs of producing green electricity were calculated. The average costs were
calculated by dividing the present value of total operational expenditures per year
by total kilowatts of electricity generated that year.
TABLE 5. PRESENT VALUE OF GREEN ELECTRICITY AVERAGE COST
0 1 2 3 4 5 6 7 8 9 10
PV of Avg. Cost
(R$/kWh) 0.04 0.04 0.04 0.04 0.03 0.03 0.03 0.03 0.03 0.02
Financial Profit Analysis
The price at which electricity could be sold today in the Brazilian regulated
electricity auction is R$0.15/kWh. This represents the maximum price paid for
green electricity in 2010. Throughout the life of the project, the price at which
electricity can be sold in in an electricity auction will increase with inflation.
An average annualized price of R$0.05/kWh for green electricity was also calculated
by dividing the sum of the present value of total costs by the total production of
electricity in ten years. This price is equivalent to the internal rate of return as it is
the real price that will set the NPV equal to zero.
The net income for the green electricity project was calculated using the two
different prices. Table 6 below presents the sum of the present value of net income
for revenues obtained from selling green electricity in the Brazilian electricity
auction. Table 7 presents the sum of the present value of net income for revenues
obtained from selling green electricity at the average annualized price. As can be
seen in Table 7, the present value of net income is equal to zero when green
electricity is sold at the average annualized price.

28
TABLE 6. NET INCOME FOR GREEN ELECTRICITY SOLD AT ELECTRICITY AUCTION PRICE (FINANCIAL)
0 1 2 3 4 5 6 7 8 9 10
Revenues (R$) (330,000.00) 298,015 311,128 326,684 343,018 360,169 378,178 397,087 416,941 437,788 478,378
Cost (R$) 98,253 103,074 106,994 111,840 116,992 123,432 129,274 136,156 143,419 152,374
Net Income (R$) (330,000.00) 199,762 208,054 219,690 231,178 243,177 254,745 267,813 280,786 294,369 326,003
Discount Rate 1.00 0.89 0.80 0.71 0.64 0.57 0.51 0.45 0.40 0.36 0.32
PV (@12%) (330,000.00) 178,359 165,859 156,371 146,918 137,985 129,062 121,145 113,405 106,152 104,964
Sum PV of Net Income (R$) 1,030,220
TABLE 7. NET INCOME FOR GREEN ELECTRICITY SOLD AT AVERAGE ANNUALIZED PRICE
0 1 2 3 4 5 6 7 8 9 10
Revenues (R$) (330,000.00) 99,030 99,030 99,030 99,030 99,030 99,030 99,030 99,030 99,030 99,030
Cost (R$) 87,726 82,170 76,156 71,076 66,385 62,535 58,477 54,991 51,718 49,060
Net Income (R$) (330,000.00) 11,303 16,859 22,873 27,953 32,645 36,495 40,553 44,039 47,311 49,969
Discount Rate 1.00 1.00 1.00 1.00 1.00 1.00 1.00 1.00 1.00 1.00 1.00
PV (@12%) (330,000.00) 11,303 16,859 22,873 27,953 32,645 36,495 40,553 44,039 47,311 49,969
Sum PV of Net Income (R$) 0

29
7.B. RNG PROJECT
Capital Expenditures (CAPEX)
Capital expenditures include the initial investments on one biogas purification
system, two natural gas compressors, electrical ducts and electric transformer, and
licenses. Two compressors are required in order to have one back-up compressor.
The investments in the compressors and purification system are R$ 679,000 and
R$400,000, respectively. The investment on the electrical ducts and transformer is
R$75,000. The operating and environmental licenses cost about R$50,000. These
investments are done in 2010, which is year 0 of the project.
Operational Expenditures (OPEX)
Operational expenditures include: (i) operator wages; (ii) compressor maintenance;
(iii) maintenance of biogas purification system; (iv) electricity purchased from grid;
and (v) taxes paid on revenues from selling RNG.
Costs related to operator wages are calculated based on the assumption that only
one employee is required to operate the biogas-to-energy plant. The employee will
ensure that the systems are operating well and will be on site for eight hours a day.
During five hours of the day, the operator will be operating the purification system
and the NG compressor. During the rest of the workday, the operator will be in
charge of any other miscellaneous duties that need to be done in the plant. This
operator is also responsible for responding to any emergencies that could happen
after hours. The operator will not perform maintenance on the compressor as this
will be performed by specialized mechanics from Aspro. A third party will also
perform maintenance of the purification system.
The operator will be paid monthly and will receive an end-of-the-year bonus. The
operator wage and bonus are tax-inclusive in both the financial and economic

30
analysis since it is assumed that the operator is otherwise employed. The bonus is
typically equal to a monthly paycheck. Operator wages are assumed to grow at the
rate of growth of real wages.
Aspro, the compressor manufacturer, provides service at a maintenance cost of
R$0.40/m3. Compressor maintenance costs are assumed to grow at the rate of
inflation.
The maintenance costs associated with the purification system are calculated based
on the number of filter changes per year and its cost. Purification system
maintenance costs are also assumed to grow at the rate of inflation.
Costs related to the purchase of electricity from the grid will vary throughout the
years of the project since these costs are dependent on an electricity price
distribution model. The model was developed by using electricity futures contract
prices determined in the Brazilian electricity auction. The price of electricity supply
from the grid is tax inclusive.
Taxes paid on the RNG that is sold to the NG distributor include: PIS, COFINS, CSLL,
IR, and ICMS.
A summary of the RNG project’s total costs can be seen in Table 8 below. As can be
seen, this project has a present value of total costs of about $2,633,000 at a 15%
discount rate.

31
TABLE 8. RNG FINANCIAL COST ANALYSIS
0 1 2 3 4 5 6 7 8 9 10
Capital Costs (CAPEX)
Investment (R$/year)
Compressors 679,000
Electrical ducts, electric transformer 75,000
Purification System 400,000
Licenses 50,000
Total CAPEX (R$/year) 1,204,000
Operating Costs (OPEX)
Operator Wages (R$/year) 15,600 16,580 17,722 18,943 20,248 21,643 23,134 24,728 26,432 28,253
Compressor Maintenance (R$/year) 45,990 48,014 50,414 52,935 55,582 58,361 61,279 64,343 67,560 70,938
Purification System Maint. (R$/year) 68,985 72,020 75,621 79,402 83,373 87,541 91,918 96,514 101,340 106,407
Grid Electricity (R$/year) 68,986 72,022 75,622 79,403 83,373 87,542 91,919 96,515 101,340 106,407
Profit Taxes RNG Sold to Distributor (R$/year) 39,621 41,364 43,432 45,604 47,884 50,279 52,792 55,432 58,204 63,392
Value-Added Taxes RNG Sold to Distributor (R$/year) 49,890 52,085 54,689 57,424 60,295 63,310 66,475 69,799 73,289 79,822
Total OPEX (R$/year) 239,182 249,999 262,812 276,288 290,460 305,366 321,043 337,532 354,876 375,397
Total Costs (R$/year) 1,204,000 239,182 249,999 262,812 276,288 290,460 305,366 321,043 337,532 354,876 375,397
Discount Rate 1.00 0.87 0.76 0.66 0.57 0.50 0.43 0.38 0.33 0.28 0.25
PV (@15%) 1,204,000 207,984 189,035 172,803 157,968 144,410 132,018 120,692 110,340 100,878 92,792
Sum PV of Total Costs 2,632,921

32
Based on the cost schedule presented above and a discount rate of 15%, the present
values of average costs of RNG production were calculated. The average costs were
calculated by dividing total present value of operational expenditures per year by
total cubic meter of RNG generated that year.
TABLE 9. PRESENT VALUE OF RNG AVERAGE COST
0 1 2 3 4 5 6 7 8 9 10
PV of Avg. Cost
(R$/m3) 0.18 0.16 0.15 0.14 0.13 0.11 0.10 0.10 0.09 0.08
Financial Profit Analysis
The maximum price at which RNG could be sold to the NG distributor equals the
price of compressed natural gas (CNG) offered by the state natural gas distribution
company. CNG in the state of Rio de Janeiro is distributed by Companhia Estadual
de Gas (CEG) at a price of R$1.1318/m3. The price of CNG in different states in
Brazil during the month of February 2011 is also presented in the graph below.
Figure 11. CNG Prices in Brazilian Reais for Different CNG Distributors in Brazil
(Source: Neogas)
ALGÁS; 1,3061
CEGÁS; 1,2836
SERGÁS; 1,1652
PBGÁS; 1,1571
CEG; 1,1318
GASMIG; 1,1266
CEG RIO; 1,1132
COPERGÁS; 1,0419
BAHIAGÁS; 0,9169
SCGÁS; 0,9071
SULGÁS; 0,7677
COMPAGÁS; 0,6168
Feb
/20
11

33
An average annualized price of R$0.23/ m3 for RNG was also calculated by dividing
the sum of the present value of total costs by the total production of RNG in ten
years. This price is equivalent to the internal rate of return as it is the real price
that will set the NPV equal to zero.
The net income for the RNG project was calculated using the two different prices.
Table 10 below presents the sum of the present value of net income for revenues
obtained from selling RNG to a NG distributor at the wholesale price of compressed
natural gas. Table 11 presents the sum of the present value of net income for
revenues obtained from selling RNG at the average annualized price. As can be seen,
the present value of net income is equal to zero when RNG is sold at the average
annualized price.

34
TABLE 10. NET INCOME FOR RNG SOLD TO DISTRIBUTOR AT CNG PRICE (FINANCIAL)
0 1 2 3 4 5 6 7 8 9 10
Revenues (R$) (1,204,000)
1,299,218
1,356,383
1,424,202
1,495,412
1,570,183
1,648,692
1,731,127
1,817,683
1,908,567
2,078,686
Cost (R$) 239,182 249,999 262,812 276,288 290,460 305,366 321,043 337,532 354,876 375,397
Net Income (R$) (1,204,000)
1,060,035
1,106,384
1,161,390
1,219,125
1,279,723
1,343,327
1,410,084
1,480,151
1,553,691
1,703,288
Discount Rate 1.00 0.87 0.76 0.66 0.57 0.50 0.43 0.38 0.33 0.28 0.25
PV (@15%) (1,204,000) 921,770 836,585 763,633 697,038 636,249 580,757 530,103 483,864 441,656 421,027
Sum PV of Net Income (R$) 5,108,681
TABLE 11. NET INCOME FOR RNG SOLD TO DISTRIBUTOR AT AVERAGE ANNUALIZED PRICE
0 1 2 3 4 5 6 7 8 9 10
Revenues (R$) (1,204,000) 263,292 263,292 263,292 263,292 263,292 263,292 263,292 263,292 263,292 263,292
Cost (R$) 207,984 189,035 172,803 157,968 144,410 132,018 120,692 110,340 100,878 92,792
Net Income (R$) (1,204,000) 55,308 74,257 90,489 105,324 118,882 131,274 142,600 152,952 162,414 170,500
Discount Rate 1.00 1.00 1.00 1.00 1.00 1.00 1.00 1.00 1.00 1.00 1.00
PV (@15%) (1,204,000) 55,308 74,257 90,489 105,324 118,882 131,274 142,600 152,952 162,414 170,500
Sum PV of Net Income (R$) 0

35
8. ECONOMIC ANALYSIS
In this section, the costs and revenues related to the green electricity and RNG
projects are described.
8.A. GREEN ELECTRICITY PROJECT
Capital Expenditures (CAPEX)
Capital expenditures include the same initial investments that are presented in the
financial cost analysis except costs related to operating and environmental licenses
are excluded. These investments are done in 2010, which is year 0 of the project.
Operational Expenditures (OPEX)
Operational expenditures are the same as in the financial analysis except that taxes
on green electricity sold are not included in the economic analysis.
Costs related to operator wages and machine maintenance are calculated as
presented in the financial cost analysis.
Costs related to the purchase of electricity from the grid vary in the same way as
presented in the financial analysis.
A summary of the green electricity total costs can be seen in Table 12 below. As can
be seen, this project has a present value of total costs of about R$889,000 at an
8.62% discount rate.

36
TABLE 12. GREEN ELECTRICITY ECONOMIC COST ANALYSIS
0 1 2 3 4 5 6 7 8 9 10
Capital Costs (CAPEX)
Investment (R$/year)
Generator 170,000
Purification System 110,000
Total CAPEX (R$/year) 280,000
Operating Costs (OPEX)
Operator Wages (R$/year) 19,500 20,724 22,152 23,679 25,310 27,054 28,918 30,910 33,040 35,317
Generator Maintenance (R$/year)
Total Oil&Lube 10,643 11,112 11,667 12,251 12,863 13,506 14,182 14,891 15,635 16,417
Total spark plug 6,623 6,914 7,260 7,623 8,004 8,404 8,824 9,265 9,729 10,215
Total filter change 5,814 6,070 6,374 6,692 7,027 7,378 7,747 8,135 8,542 8,969
Total liquid change 1,603 1,674 1,757 1,845 1,937 2,034 2,136 2,243 2,355 2,473
Total air filter maintenance 1,971 2,058 2,161 2,269 2,382 2,501 2,626 2,758 2,895 3,040
Total air filter change 2,260 2,360 2,477 2,601 2,731 2,868 3,011 3,162 3,320 3,486
Total valve adjustment 3,942 4,115 4,321 4,537 4,764 5,002 5,252 5,515 5,791 6,080
Purification System Maint. (R$/year) 20,000 20,880 21,924 23,020 24,171 25,380 26,649 27,981 29,380 30,849
Grid Electricity (R$/year) 5,365 5,732 4,393 3,691 2,988 3,249 2,570 2,570 2,570 2,570
Total OPEX (R$/year) 77,721 81,639 84,487 88,208 92,178 97,377 101,916 107,430 113,257 119,416
Total Costs (R$/year) 280,000 77,721 81,639 84,487 88,208 92,178 97,377 101,916 107,430 113,257 119,416
Discount Rate 1.00 0.92 0.85 0.78 0.72 0.66 0.61 0.56 0.52 0.48 0.44
PV (@8.62%) 280,000 71,553 69,195 65,927 63,368 60,965 59,293 57,131 55,443 53,812 52,235
Sum PV of Total Costs 888,922

37
Based on the cost schedule presented above and a discount rate of 8.62%, the
average costs of producing green electricity were calculated. The average costs
were calculated by dividing the present value of total operational expenditures per
year by total kilowatts of electricity generated that year.
TABLE 13. PRESENT VALUE OF GREEN ELECTRICITY AVERAGE COST
0 1 2 3 4 5 6 7 8 9 10
PV of Avg. Cost (R$/kWh) 0.04 0.03 0.03 0.03 0.03 0.03 0.03 0.03 0.03 0.03
Economic Profit Analysis
The price at which electricity could be sold today in the electricity auction is
R$0.15/kWh. This represents the maximum price paid for green electricity in 2010.
Throughout the life of the project, the price at which electricity can be sold in an
electricity auction will increase with inflation.
An average annualized price of R$0.04/kWh for green electricity was also calculated
using the same method as in the financial profit analysis. This price is equivalent to
the internal rate of return as it is the real price that will set the NPV equal to zero.
The net income for the green electricity project was calculated using the two
different prices. Table 14 presents the sum of the present value of net income for
revenues obtained from selling green electricity in an electricity auction. Table 15
presents the sum of the present value of net income for revenues obtained from
selling green electricity at the average annualized price. As can be seen, the present
value of net income is equal to zero when the green electricity is sold at the average
annualized price.

38
TABLE 14. NET INCOME FOR GREEN ELECTRICITY SOLD AT ELECTRICITY AUCTION PRICE (ECONOMIC)
0 1 2 3 4 5 6 7 8 9 10
Revenues (R$) (280,000.00) 298,015 311,128 326,684 343,018 360,169 378,178 397,087 416,941 437,788 478,378
Cost (R$) 77,721 81,639 84,487 88,208 92,178 97,377 101,916 107,430 113,257 119,416
Net Income (R$) (280,000.00) 220,294 229,489 242,197 254,811 267,991 280,800 295,171 309,511 324,531 358,962
Discount Rate 1.00 0.92 0.85 0.78 0.72 0.66 0.61 0.56 0.52 0.48 0.44
PV (@8.62%) (280,000.00) 202,812 194,510 188,990 183,054 177,244 170,977 165,464 159,734 154,194 157,018
Sum PV of Net Income (R$) 1,473,998
TABLE 15. NET INCOME FOR GREEN ELECTRICITY SOLD AT AVERAGE ANNUALIZED PRICE
0 1 2 3 4 5 6 7 8 9 10
Revenues (R$) (280,000.00) 88,892 88,892 88,892 88,892 88,892 88,892 88,892 88,892 88,892 88,892
Cost (R$) - 71,553 69,195 65,927 63,368 60,965 59,293 57,131 55,443 53,812 52,235
Net Income (R$) (280,000.00) 17,339 19,697 22,965 25,525 27,927 29,600 31,761 33,449 35,080 36,657
Discount Rate 1.00 1.00 1.00 1.00 1.00 1.00 1.00 1.00 1.00 1.00 1.00
PV (@8.62%) (280,000.00) 17,339 19,697 22,965 25,525 27,927 29,600 31,761 33,449 35,080 36,657
Sum PV of Net Income (R$) 0
39
8.B. RNG PROJECT
Capital Expenditures (CAPEX)
Capital expenditures include the same initial investments that are presented in the
financial cost analysis except costs related to operating and environmental licenses
are excluded. These investments are done in 2010, which is year 0 of the project.
Operational Expenditures (OPEX)
Operational expenditures are the same as in the financial analysis except that taxes
on RNG sold are not included in the economic analysis.
Costs related to operator wages and machine maintenance are calculated as
presented in the financial cost analysis.
Costs related to the purchase of electricity from the grid vary in the same way as
presented in the financial analysis.
A summary of the RNG total costs can be seen in Table 16 below. As can be seen,
this project has a present value of total costs of about 2,740,000 at a 8.62% discount
rate.

40
TABLE 16. RNG ECONOMIC COST ANALYSIS
0 1 2 3 4 5 6 7 8 9 10
Capital Costs (CAPEX)
Investment (R$/year)
Compressor 679,000
Electrical ducts, electric transformer 75,000
Purification System 400,000
Total CAPEX (R$/year) 1,154,000
Operating Costs (OPEX)
Operator Wages (R$/year) 15,600 16,580 17,722 18,943 20,248 21,643 23,134 24,728 26,432 28,253
Compressor Maintenance (R$/year) 45,990 48,014 50,414 52,935 55,582 58,361 61,279 64,343 67,560 70,938
Purification System Maintenance (R$/year) 68,985 72,020 75,621 79,402 83,373 87,541 91,918 96,514 101,340 106,407
Grid Electricity (R$/year) 68,986 72,022 75,622 79,403 83,373 87,542 91,919 96,515 101,340 106,407
Total OPEX (R$/year) 199,561 208,635 219,380 230,684 242,576 255,087 268,250 282,100 296,672 312,005
Total Costs (R$/year) 1,154,000 199,561 208,635 219,380 230,684 242,576 255,087 268,250 282,100 296,672 312,005
Discount Rate 1.00 0.92 0.85 0.78 0.72 0.66 0.61 0.56 0.52 0.48 0.44
PV (@8.62%) 1,154,000 183,724 176,835 171,186 165,721 160,435 155,321 150,374 145,588 140,958 136,478
Sum PV of Total Costs 2,740,618

41
Based on the cost schedule presented above and a discount rate of 8.62%, the
present values of average costs of RNG production were calculated. The average
costs were calculated by dividing total present value of operational expenditures
per year by total cubic meter of RNG generated that year.
TABLE 17. PRESENT VALUE OF RNG AVERAGE COST (ECONOMIC)
0 1 2 3 4 5 6 7 8 9 10
PV of Avg Cost (R$/m3) 0.16 0.15 0.15 0.14 0.14 0.14 0.13 0.13 0.12 0.12
Economic Profit Analysis
The price at which RNG can be sold to the NG distributor is the same as that
presented in the financial analysis.
An average annualized price of R$0.24/ m3 for RNG was also calculated by dividing
the sum of the present value of total costs by the total production of RNG in ten
years. This price is equivalent to the internal rate of return as it is the real price
that will set the NPV equal to zero.
The net income for the RNG project was calculated using the two different prices.
Table 18 below presents the sum of the present value of net income for revenues
obtained from selling RNG to a NG distributor at the wholesale price of compressed
natural gas. Table 19 presents the sum of the present value of net income for
revenues obtained from selling RNG at the average annualized price. As can be seen,
the present value of net income is equal to zero when RNG is sold at the average
annualized price.

42
TABLE 18. NET INCOME FOR RNG SOLD TO DISTRIBUTOR AT CNG PRICE (ECONOMIC)
0 1 2 3 4 5 6 7 8 9 10
Revenues (R$) (1,154,000)
1,299,218
1,356,383
1,424,202
1,495,412
1,570,183
1,648,692
1,731,127
1,817,683
1,908,567
2,078,686
Cost (R$) - 199,561 208,635 219,380 230,684 242,576 255,087 268,250 282,100 296,672 312,005
Net Income (R$) (1,154,000)
1,099,656
1,147,748
1,204,822
1,264,729
1,327,607
1,393,605
1,462,876
1,535,583
1,611,895
1,766,680
Discount Rate 1.00 0.92 0.85 0.78 0.72 0.66 0.61 0.56 0.52 0.48 0.44
PV (@8.6%) (1,154,000)
1,012,388 972,808 940,142 908,570 878,053 848,557 820,048 792,492 765,858 772,787
Sum PV of Net Income (R$) 7,557,703
TABLE 19. NET INCOME FOR RNG SOLD TO DISTRIBUTOR AT AVERAGE ANNUALIZED PRICE
0 1 2 3 4 5 6 7 8 9 10
Revenues (R$) (1,154,000) 274,062 274,062 274,062 274,062 274,062 274,062 274,062 274,062 274,062 274,062
Cost (R$) - 183,724 176,835 171,186 165,721 160,435 155,321 150,374 145,588 140,958 136,478
Net Income (R$) (1,154,000) 90,338 97,227 102,876 108,341 113,627 118,741 123,688 128,474 133,104 137,583
Discount Rate 1.00 1.00 1.00 1.00 1.00 1.00 1.00 1.00 1.00 1.00 1.00
PV (@15%) (1,154,000) 90,338 97,227 102,876 108,341 113,627 118,741 123,688 128,474 133,104 137,583
Sum PV of Net Income (R$) 0

43
9. SENSITIVITY ANALYSIS
A sensitivity analysis was performed to understand how the variability of input and
output prices and interest rates impact the projects’ NPV.
9.A. GREEN ELECTRICITY PROJECT
A sensitivity analysis was performed to evaluate how the NPV of the green
electricity project varies with a change in grid electricity prices, discount rates, and
in green electricity auction–market prices. Base prices and discount rate were
increased and decreased by 20% in the financial model.
As can be seen from the graph above, an increase or decrease of 20% in grid
electricity prices does not have a large effect on the NPV of the project. This is
because a small amount of electricity is consumed to generate green electricity. A
500,000
600,000
700,000
800,000
900,000
1,000,000
1,100,000
1,200,000
1,300,000
1,400,000
1,500,000
0.5 0.7 0.9 1.1 1.3
Aft
er-
tax
NP
V @
12
% (
R$
)
Proportion of Base Case
Sensitivity AnalysisFinancial Perspective
Grid Electricity Price
Green Electricity Price
Discount Rate

44
change in the green electricity auction–market price or discount rate, however, has
a significant effect on NPV.
The green electricity auction-market price has a large effect on NPV since it has a
direct effect on revenues. If green electricity prices are high, then revenues will be
high as well. A 20% increase in prices causes NPV to rise by 36%. A 20% reduction
in prices causes NPV to decrease by 57%. As prices decrease, revenues will tend to
equal costs.
The variability in the discount rate affects NPV because a smaller discount rate
increases the value of the future cash flows. A larger discount rate, however,
reduces the magnitude of future flows. A 20% increase or decrease in discount
rates causes NPV to reduce or increase by 15%, respectively.
A sensitivity analysis for the economic model was also performed and is presented
in the graph below. As can be seen, the results are very similar to those obtained
with the financial model data.
500,000
700,000
900,000
1,100,000
1,300,000
1,500,000
1,700,000
1,900,000
2,100,000
0.5 0.7 0.9 1.1 1.3
Aft
er-
tax
NP
V @
8.6
% (
R$
)
Proportion of Base Case
Sensitivity AnalysisEconomic Perspective
Grid Electricity Price
Green Electricity Price
Discount Rate

45
9.B. RNG PROJECT
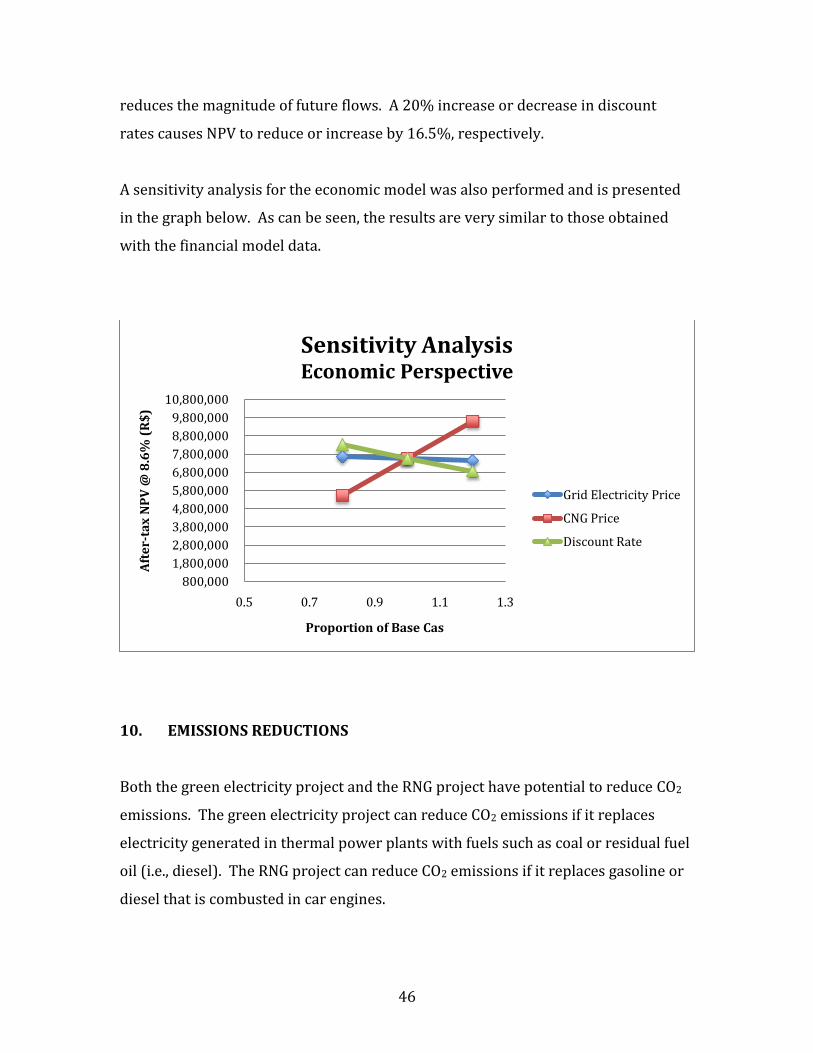
A sensitivity analysis was performed to evaluate how the NPV of the RNG project
varies with a change in grid electricity prices, discount rates, and CNG prices. Base
prices and discount rate were increased and decreased by 20%.
As can be seen from the graph above, an increase or decrease of 20% in grid
electricity prices does not have a large effect on the project NPV. This is because a
small amount of electricity is consumed to generate RNG. A change in the CNG price
or discount rate, however, has a significant effect on NPV.
The CNG price has a large effect on NPV since it has a direct effect on revenues. If
CNG prices are high, then revenues will be high as well. A 20% increase in prices
causes NPV to rise by 29%. A 20% reduction in prices causes NPV to decrease by
41%. As prices decrease, revenues will tend to equal costs.
The variability in the discount rate affects NPV because a smaller discount rate
increases the value of the future cash flows. A larger discount rate, however,
800,000
1,800,000
2,800,000
3,800,000
4,800,000
5,800,000
6,800,000
7,800,000
0.5 0.7 0.9 1.1 1.3Aft
er-
tax
NP
V @
15
% (
R$
)
Proportion of Base Case
Sensitivity AnalysisFinancial Perspective
Grid Electricity Price
CNG Price
Discount Rate
46
reduces the magnitude of future flows. A 20% increase or decrease in discount
rates causes NPV to reduce or increase by 16.5%, respectively.
A sensitivity analysis for the economic model was also performed and is presented
in the graph below. As can be seen, the results are very similar to those obtained
with the financial model data.
10. EMISSIONS REDUCTIONS
Both the green electricity project and the RNG project have potential to reduce CO2
emissions. The green electricity project can reduce CO2 emissions if it replaces
electricity generated in thermal power plants with fuels such as coal or residual fuel
oil (i.e., diesel). The RNG project can reduce CO2 emissions if it replaces gasoline or
diesel that is combusted in car engines.
800,000
1,800,000
2,800,000
3,800,000
4,800,000
5,800,000
6,800,000
7,800,000
8,800,000
9,800,000
10,800,000
0.5 0.7 0.9 1.1 1.3
Aft
er-
tax
NP
V @
8.6
% (
R$
)
Proportion of Base Cas
Sensitivity AnalysisEconomic Perspective
Grid Electricity Price
CNG Price
Discount Rate

47
10.A. GREEN ELECTRICTY PROJECT
The emission reductions from the green electricity project were calculated by
assuming that the 252 kW generator generates electricity for 24 hours a day during
329 days in a year. The fuel used in the generator is assumed to have the same
properties as natural gas that is combusted in stationary sources. The baseline
emissions from combusting natural gas in the green electricity project were
calculated based on the natural gas emission factor of 53 kg CO2/MMBTU (Appendix
H of the instructions to Form EIA-1605) and the energy conversion factor of 1
kWh/3412 BTU. Baseline emissions from the combustion of natural gas in a
thermal power plant are shown in Graph 1 below.
The emissions from the combustion of coal or residual fuel oil were also calculated
and compared to the baseline emissions from generating green electricity. Based on
the coal emission factor of 93 kg CO2/MMBTU (Appendix H of the instructions to
Form EIA-1605) and the energy conversion factor of 1 kWh/3412 BTU, the
emissions from combustion of coal in a thermal power plant were calculated and
can be seen in Graph 1 below.
The emissions from the combustion of diesel were calculated by using the same
method as for the calculation of coal emissions. However, a diesel emission factor of
73 kg CO2/MMBTU (Appendix H of the instructions to Form EIA-1605) was used in
the calculations. A summary of the total CO2 emissions from each source of fuel is
presented in Graph 1.

48
Based on the CO2 emissions analysis presented above, it was determined that
generating green electricity at the Alegria WWTP can help reduce CO2 emissions by
271 metric tons (mt) of CO2/ year (equivalent to a 43% reduction) and 136 mtCO2/
year (equivalent to a 27% reduction) by displacing electricity that would otherwise
be generated with coal or residual fuel oil, respectively.
According to the United States Environmental Protection Agency (EPA) Greenhouse
Gas Equivalencies Calculator, a reduction of 271 mtCO2/ year is equivalent to: (i)
retiring 48 passenger vehicles per year; (ii) avoiding CO2 emissions from
consumption of 572 barrels of oil; and (iii) avoiding CO2 emissions from electricity
use in 30 US homes for one year. Alternatively, a reduction of 136 mtCO2/ year is
equivalent to: (i) retiring 24 passenger vehicles per year; (ii) avoiding CO2 emissions
from consumption of 287 barrels of oil; and (iii) avoiding CO2 emissions from
electricity use in 15 US homes for one year.
-
100
200
300
400
500
600
700
Natural Gas (Baseline)
Coal Residual Fuel Oil
mtC
O2
/y
ea
r
Graph 1. Comparison of CO2 Emissions from Electricity Generation with Different
Fuel Sources

49
10.B. RNG PROJECT
The emissions reductions from the RNG project were calculated by assuming that
3,500 m3/day of RNG is generated during 329 days in a year. Based on the energy
content of Brazilian natural gas of 26.8m3/MMBTU (MME Natural Gas Monthly
Bulletin, 2010) and natural gas emission factor of 53 kg CO2/MMBTU (Appendix H
of the instructions to Form EIA-1605), the emissions from combustion of RNG were
calculated and can be seen in Graph 2 below.
The emissions from the combustion of diesel or gasoline were also calculated and
compared to the RNG emissions. The emissions from the combustion of gasoline
were calculated based on the assumption that 269 vehicles (3,500m3/day * 1
vehicle/13m3) with an average gasoline tank volume of 20 gallons could be replaced
with RNG. The gasoline energy content of 0.115 MMBTU/gal (EV World Energy
Content of Fuels, 2011) and the gasoline emission factor of 53 kg CO2/MMBTU
(Appendix H of the instructions to Form EIA-1605) were also used in the
calculations. According to Appendix H of Form EIA-1605, the emission factor for
gasoline is 71 kg CO2/MMBTU. However, because the gasoline in Brazil has a 25%
blend of ethanol, only three quarters of gasoline emissions are considered in the
calculations.
The emissions from the combustion of diesel were calculated by using the same
method as for the gasoline emissions. However, an energy content of 0.131
MMBTU/gal (EV World Energy Content of Fuels, 2011) and a diesel emission factor
of 73 kg CO2/MMBTU (Appendix H of the instructions to Form EIA-1605) were used
in the calculations. A summary of the total CO2 emissions from each source of fuel is
presented in Graph 2.

50
Based on the CO2 emissions analysis presented above, it was determined that
generating RNG at the Alegria WWTP can help reduce CO2 emissions by 8,558
mtCO2/ year (equivalent to a 79% reduction) and 14,676 mtCO2/ year (equivalent
to a 87% reduction) by displacing gasoline or diesel that would otherwise be
combusted in car engines.
According to the United States EPA Greenhouse Gas Equivalencies Calculator, a
reduction of 8,558 mtCO2/ year is equivalent to: (i) retiring 1,522 passenger
vehicles per year; (ii) avoiding CO2 emissions from consumption of 18,055 barrels of
oil; and (iii) avoiding CO2 emissions from electricity use in 942 US homes for one
year. Alternatively, a reduction of 14,676 mtCO2/ year is equivalent to: (i) retiring
2,611 passenger vehicles per year; (ii) avoiding CO2 emissions from consumption of
30,962 barrels of oil; and (iii) avoiding CO2 emissions from electricity use in 1,616
US homes for one year.
-
2,000
4,000
6,000
8,000
10,000
12,000
14,000
16,000
18,000
RNG (Baseline) Gasoline Diesel
mtC
O2
/y
ea
r
Graph 2. Comparison of CO2 Emissions from Combustion of
Different Fuel Sources

51
11. CONCLUSION
Based on the financial, economic and environmental analysis, it is recommended
that Alegria WWTP invest in an RNG project. The financial and economic analyses
show that the RNG project will have a net present value that is approximately five
times larger than the green electricity project.
The sensitivity analysis also shows that the RNG project will provide higher benefits
to the WWTP than the green electricity project. When the worse-case scenario,
which is when CNG base case prices are reduced by 20%, for the RNG project is
compared to the best-case scenario for the green electricity project, which is when
green electricity auction prices are increased by 20%, the RNG project still has a
much higher NPV than the green electricity project.
With regards to the environmental benefits, the emissions reductions obtained
through the implementation of an RNG project are much higher than for a green
electricity project. By implementing an RNG project the Alegria WWTP will provide
an environmentally and economically sustainable solution for biogas treatment and
will serve as a model for other wastewater treatment plants in Brazil.

52
12. REFERENCES
Aspro do Brasil. http://www.aspro.com/index.php?id_idioma=3 (accessed 8
January 2011).
Brazilian Central Bank. Relatório de Inflação 2010 (Chapter 6).
http://www.bcb.gov.br/htms/relinf/direita.asp?idioma=P&ano=2010&acaoAno=A
BRIR&mes=12&acaoMes=ABRIR (accessed 1 March 2011).
Catapan, E.A.; Catapan, A. Brazilian Electric Power Market and the Cost of Capital of
Electric Power Companies. II International Seminar on Restructuring and Regulation
of the Electricity and Natural Gas Sector, 2007.
http://www.nuca.ie.ufrj.br/gesel/eventos/seminariointernacional/2007/artigos/p
df/edilsonantoniocatapan_osetoreletricobrasileiro.pdf (accessed 2 March 2011).
Consultor Fiscal. A Carga Tributaria no Lucro Presumido.
http://www.consultorfiscal.com.br/frames/assuntos/federais/federais13.htm
(accessed 1 March 2011).
Empresa de Pesquisa Energética (EPE). Balanço Energético Nacional 2010 (BEN).
https://ben.epe.gov.br/BENRelatorioFinal2010.aspx (accessed 19 January 2011).
EVWorld. Energy Content of Fuels. www.evworld.com/library/energy_numbers.pdf
(accessed 1 April 2011).
Hulten, C.R.; Wykoff, F.C. The Measurement of Economic Depreciation. In
Depreciation, Inflation, Taxation.
Ministerio de Minas e Energia (MME). Natural Gas Monthly Bulletin, March 2010.

53
http://www.mme.gov.br/spg/galerias/arquivos/publicacoes/boletim_mensal_aco
mpanhamento_industria_gas_natural/Boletim_Gas_Natural_nr_36_mar_10.pdf
(accessed 5 April 2011).
Neogas do Brasil. http://www.neogas.com.br/ (accessed 8 January 2011).
Northeast Combined Heat and Power Application Center. Essex Junction WWTP: 60
kW CHP Application.
http://www.northeastcleanenergy.org/uploads/EssexJunctionCHPprofile.pdf
(accessed 1 March 2011).
River Network. Wastewater Treatment Plant Generates Clean Energy, Has Room for
Improvement. http://www.rivernetwork.org/blog/7/2010/07/14/wastewater-
treatment-plant-generates-clean-energy-has-room-improvement (accessed 1 March
2011).
Secretariat of the Federal Revenue of Brazil. Taxes.
http://www.receita.fazenda.gov.br/principal/Ingles/SistemaTributarioBR/Taxes.ht
m (accessed 1 March 2011).
The Economist Intelligence Unit. Brazil Country Report, March 2011.
The City of Escondido. SoCalGas, City of Escondido Create Renewable Energy From Sewage. http://www.escondido.org/socalgas-city-of-escondido-create-renewable-energy-from-sewage.aspx (accessed 1 March 2011).
Trading Economics. Brazilian Real LIBOR Rate.
http://www.tradingeconomics.com/economics/libor-rate.aspx?symbol=brl
(accessed 27 March 2011).

54
United States Energy Information Administration (EIA). Country Analysis Brief:
Brazil. http://www.eia.doe.gov/countries/cab.cfm?fips=BR (accessed 5 February
2011).
United States Energy Information Administration (EIA). Instructions for Form EIA-
1605 Voluntary Reporting of Greenhouse Gases, Appendix H: Fuel Emission Factors,
2007.
United States Environmental Protection Agency (EPA) Greenhouse Gas
Equivalencies Calculator. http://www.epa.gov/cleanenergy/energy-
resources/calculator.html (accessed 1 April 2011).
World Economic Outlook (WEO) 2010. Recovery, Risk, and Rebalancing (Figure
1.14)
http://www.imf.org/external/pubs/ft/weo/2010/02/index.htm (accessed 19
January 2011).