Financial Analysis Using Moody’s Ratios Moody’s Rating Definitions Aaa demonstrate the strongest...
54
1 Financial Analysis Using Moody’s Ratios Millersville University of Pennsylvania
-
Upload
trankhuong -
Category
Documents
-
view
220 -
download
1
Transcript of Financial Analysis Using Moody’s Ratios Moody’s Rating Definitions Aaa demonstrate the strongest...

1
Financial AnalysisUsing Moody’s Ratios
Millersville University of Pennsylvania

2
Moody’s Rating Definitions
Aaa demonstrate the strongest creditworthiness.
Aa demonstrate very strong creditworthiness. (PASSHE has an Aa2 rating.)
A represent above-average creditworthiness.
Baa represent average creditworthiness.
Ba demonstrate below-average creditworthiness.
B demonstrate weak creditworthiness.
Caa demonstrate very weak creditworthiness.
Ca demonstrate extremely weak creditworthiness.
C demonstrate the weakest creditworthiness.
Relative to other U.S. municipal or tax-exempt issuers or issues rated:
PASSHE’s rating changed on May 7, 2010, to Aa2 to align with Global Rating Scale (GRS).

3
PASSHEApplications, Acceptances, & Enrollments
0
5,000
10,000
15,000
20,000
25,000
0
20,000
40,000
60,000
80,000
100,000
120,000
96 97 98 99 00 01 02 03 04 05 06 07 08 09 10
Enro
llmen
ts
Appl
icat
ions
& A
ccep
tanc
es
Applications Acceptances Enrollments
First-Time Full-Time Freshmen

4
PASSHESelectivity & Matriculation
0%
10%
20%
30%
40%
50%
60%
70%
80%
96 97 98 99 00 01 02 03 04 05 06 07 08 09 10
Selectivity Matriculation
Selectivity Median Aa2 (2009) = 66.3%Matriculation Median Aa2 (2009) = 39.8%
Selectivity—% of applicants acceptedMatriculation—% of accepted students who enroll

5
PASSHEEducational Expenses Per FTE Student
$0
$2,000
$4,000
$6,000
$8,000
$10,000
$12,000
$14,000
96 97 98 99 00 01 02 03 04 05 06 07 08 09 10
Median Aa2 (2009) = $26,032 Educational expenses = total operating expenses excluding auxiliary expenses
Stronger
Weaker

6
PASSHENet Tuition Per FTE Student
$0
$1,000
$2,000
$3,000
$4,000
$5,000
$6,000
02 03 04 05 06 07 08 09 10
Median Aa2 (2009) = $6,755 Net tuition = tuition and mandatory fees less financial aid
Stronger
Weaker

7
PASSHETotal Tuition Discount
0.0%
5.0%
10.0%
15.0%
20.0%
25.0%
30.0%
35.0%
02 03 04 05 06 07 08 09 10
Median Aa2 (2009) = 29.8% Total tuition discount = % of tuition and mandatory feesprovided by financial aid sources, including federal and state aid
Stronger
Weaker

8
PASSHEUnrestricted Financial Resources to Operations
0%5%
10%15%20%25%30%35%40%45%50%
96 97 98 99 00 01 02 03 04 05 06 07 08 09 10
Median Aa2 (2009) = 22% Unrestricted net assets compared to total annualoperating budget, including auxiliaries
Stronger
Weaker

9
PASSHEExpendable Financial Resources to Operations
0%5%
10%15%20%25%30%35%40%45%50%55%60%
96 97 98 99 00 01 02 03 04 05 06 07 08 09 10
Median Aa2 (2009) = 42% Unrestricted and temporarily restricted net assets compared to total annual operating budget, including auxiliaries and affiliated organizations
Stronger
Weaker

10
PASSHEUnrestricted Financial Resources to Direct Debt
0%10%20%30%40%50%60%70%80%90%
100%110%120%
96 97 98 99 00 01 02 03 04 05 06 07 08 09 10
Median Aa2 (2009) = 49% Net assets compared to outstanding debt
Stronger
Weaker

11
PASSHETotal Financial Resources Per FTE Student
$0$1,000$2,000$3,000$4,000$5,000$6,000$7,000$8,000$9,000
$10,000
96 97 98 99 00 01 02 03 04 05 06 07 08 09 10
Median Aa2 (2009) = $23,460 Unrestricted and restricted net assets of the Systemand affiliated organizations
Stronger
Weaker

12
PASSHEActual Debt Service to Operations
0.0%
1.0%
2.0%
3.0%
4.0%
5.0%
6.0%
7.0%
96 97 98 99 00 01 02 03 04 05 06 07 08 09 10
Median Aa2 (2009) = 3.3% % of total operating budget used for debt service
Stronger
Weaker

13
PASSHEActual Debt Service Coverage
0.0
0.5
1.0
1.5
2.0
2.5
3.0
3.5
4.0
02 03 04 05 06 07 08 09 10
Median Aa2 (2009) = 2.6 Annual revenues less expenses plus depreciation and interest expense divided by debt service
Stronger
Weaker

14
PASSHEAnnual Operating Margin
0%
1%
2%
3%
4%
5%
6%
7%
96 97 98 99 00 01 02 03 04 05 06 07 08 09 10 10
Median Aa2 (2009) = 1.6% Annual revenues less expenses divided by total revenues
Stronger
Weaker With
out A
RR
A Fu
nds
15
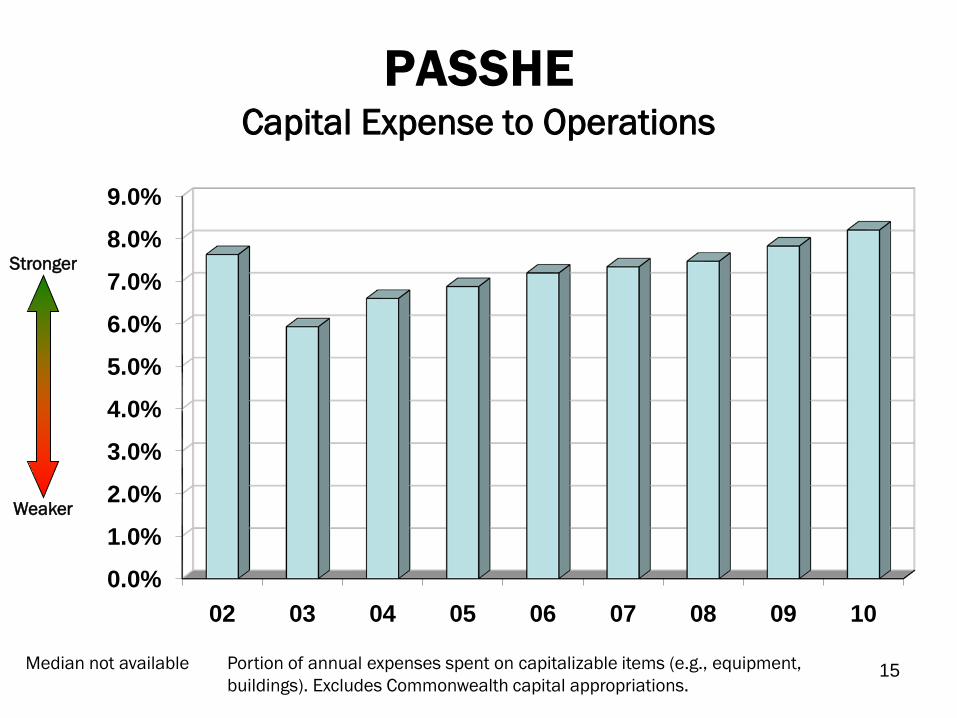
PASSHECapital Expense to Operations
0.0%
1.0%
2.0%
3.0%
4.0%
5.0%
6.0%
7.0%
8.0%
9.0%
02 03 04 05 06 07 08 09 10
Portion of annual expenses spent on capitalizable items (e.g., equipment,buildings). Excludes Commonwealth capital appropriations.
Median not available
Stronger
Weaker
16
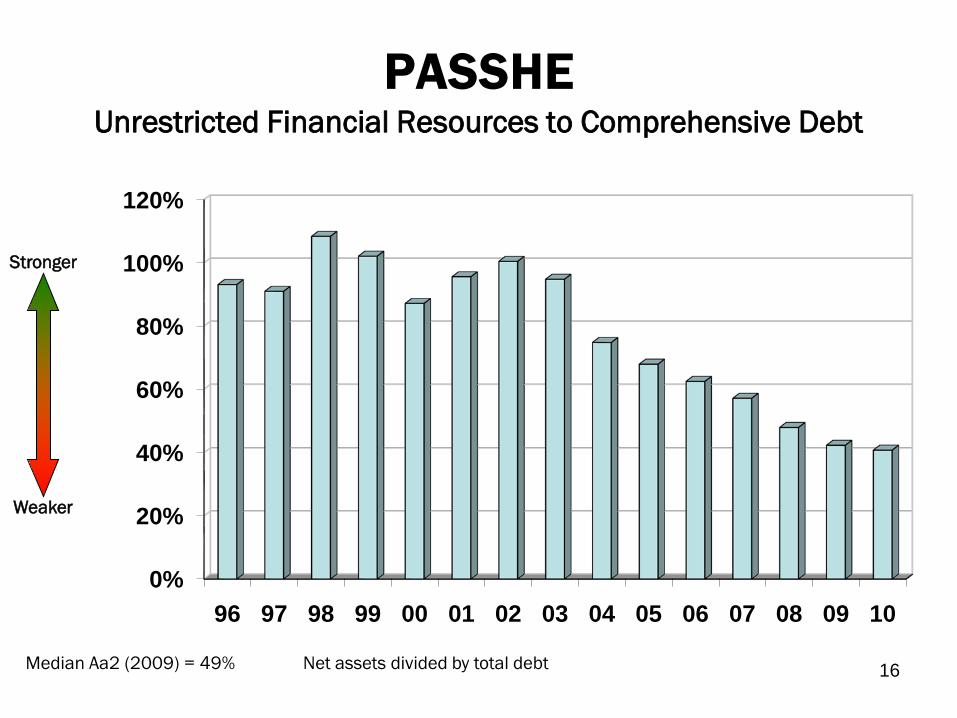
PASSHEUnrestricted Financial Resources to Comprehensive Debt
0%
20%
40%
60%
80%
100%
120%
96 97 98 99 00 01 02 03 04 05 06 07 08 09 10
Median Aa2 (2009) = 49% Net assets divided by total debt
Stronger
Weaker

17
PASSHETotal Financial Resources to Comprehensive Debt
0%
20%
40%
60%
80%
100%
120%
140%
160%
96 97 98 99 00 01 02 03 04 05 06 07 08 09 10
Median Aa2 (2009) = 172% Unrestricted and restricted net assets of the Systemand affiliated organizations divided by total debt
Stronger
Weaker

18
PASSHEComprehensive Debt Per FTE Student
$0
$2,000
$4,000
$6,000
$8,000
$10,000
$12,000
$14,000
$16,000
$18,000
96 97 98 99 00 01 02 03 04 05 06 07 08 09 10
Median Aa2 (2009) = $14,548 Total debt divided by FTE student

19
Selectivity
0%10%20%30%40%50%60%70%80%90%
100%
96 97 98 99 00 01 02 03 04 05 06 07 08 09 10California Millersville ShippensburgSlippery Rock University Average
Median Aa2 (2009) = 66.3% Selectivity—% of applicants accepted
Stronger
Weaker

20
Matriculation
0%5%
10%15%20%25%30%35%40%45%50%55%
96 97 98 99 00 01 02 03 04 05 06 07 08 09 10
California Millersville ShippensburgSlippery Rock University Average
Median Aa2 (2009) = 39.8% Matriculation—% of accepted students who enroll
Stronger
Weaker

21
Educational Expenses Per FTE Student
$0
$2,000
$4,000
$6,000
$8,000
$10,000
$12,000
$14,000
$16,000
96 97 98 99 00 01 02 03 04 05 06 07 08 09 10California Millersville ShippensburgSlippery Rock University Average
Median Aa2 (2009) = $26,032 Educational expenses = total operating expenses excluding auxiliary expenses
Stronger
Weaker

22
Net Tuition Per FTE Student
$0
$1,000
$2,000
$3,000
$4,000
$5,000
$6,000
02 03 04 05 06 07 08 09 10California Millersville ShippensburgSlippery Rock University Average
Median Aa2 (2009) = $6,755 Net tuition = tuition and mandatory fees less financial aid
Stronger
Weaker

23
Total Tuition Discount
0%
5%
10%
15%
20%
25%
30%
35%
40%
02 03 04 05 06 07 08 09 10California Millersville ShippensburgSlippery Rock University Average
Median Aa2 (2009) = 29.8% Total tuition discount = % of tuition and mandatory feesprovided by financial aid sources, including federal and state aid
Stronger
Weaker

24
Unrestricted Financial Resources to Operations
0%5%
10%15%20%25%30%35%40%45%50%
96 97 98 99 00 01 02 03 04 05 06 07 08 09 10California Millersville ShippensburgSlippery Rock University Average
Median Aa2 (2009) = 22% Unrestricted net assets compared to total annualoperating budget, including auxiliaries
Stronger
Weaker

25
Expendable Financial Resources to Operations
0%
10%
20%
30%
40%
50%
60%
70%
80%
96 97 98 99 00 01 02 03 04 05 06 07 08 09 10California Millersville ShippensburgSlippery Rock University Average
Median Aa2 (2009) = 42% Unrestricted & temporarily restricted net assets compared to total annual operating budget, including auxiliaries and affiliated organizations
Stronger
Weaker

26
Unrestricted Financial Resources to Direct Debt
0%
50%
100%
150%
200%
250%
300%
350%
400%
96 97 98 99 00 01 02 03 04 05 06 07 08 09 10
California Millersville ShippensburgSlippery Rock University Average
Median Aa2 (2009) = 49% Net assets compared to outstanding debt
Stronger
Weaker
In 1996, Slippery Rockwas 5,722%

27
Total Financial Resources Per FTE Student
$0
$2,000
$4,000
$6,000
$8,000
$10,000
$12,000
96 97 98 99 00 01 02 03 04 05 06 07 08 09 10
California Millersville ShippensburgSlippery Rock University Average
Median Aa2 (2009) = $23,460 Unrestricted and restricted net assets of the Systemand affiliated organizations
Stronger
Weaker
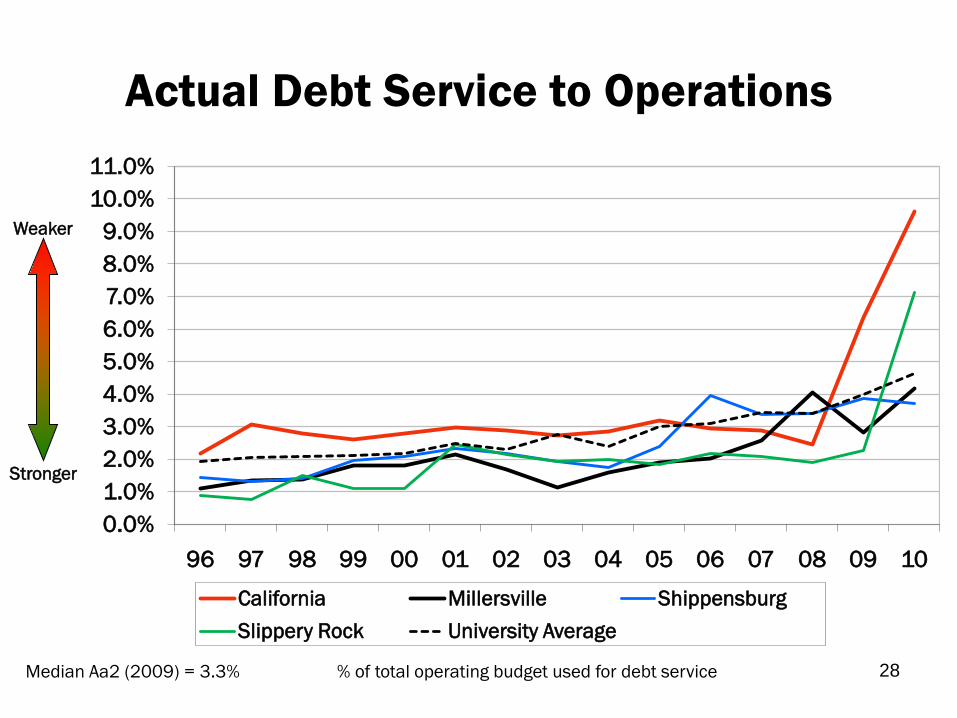
28
Actual Debt Service to Operations
0.0%1.0%2.0%3.0%4.0%5.0%6.0%7.0%8.0%9.0%
10.0%11.0%
96 97 98 99 00 01 02 03 04 05 06 07 08 09 10
California Millersville ShippensburgSlippery Rock University Average
Median Aa2 (2009) = 3.3% % of total operating budget used for debt service
Stronger
Weaker

29
Actual Debt Service Coverage
(1.0)
0.0
1.0
2.0
3.0
4.0
5.0
6.0
7.0
8.0
02 03 04 05 06 07 08 09 10California Millersville ShippensburgSlippery Rock University Average
Median Aa2 (2009) = 2.6 Annual revenues less expenses plus depreciationand interest expense divided by debt service
Stronger
Weaker
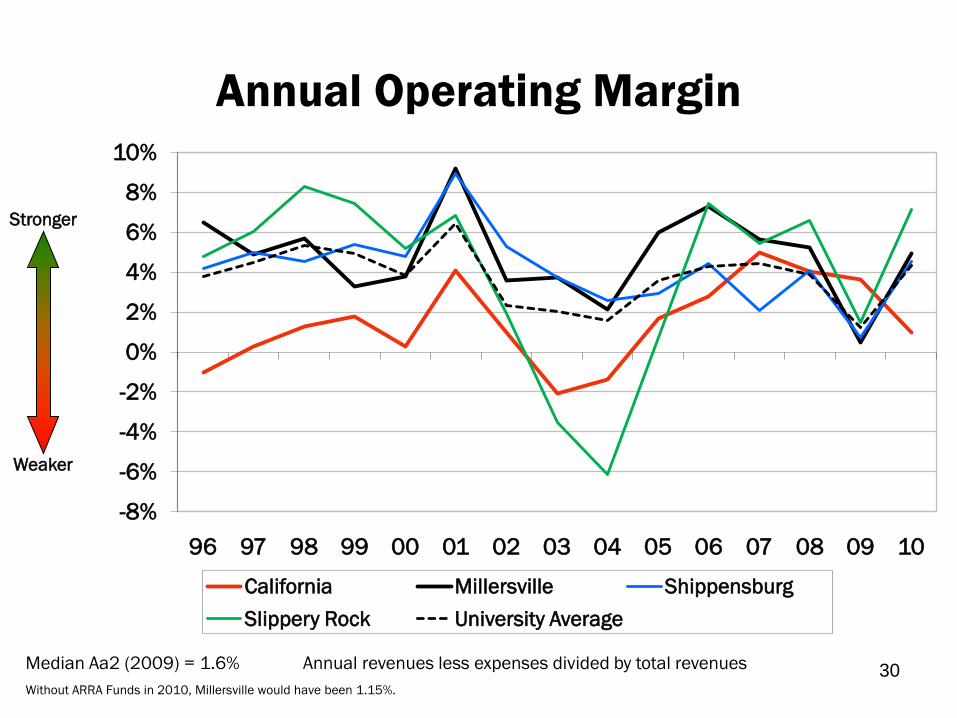
30
Annual Operating Margin
-8%
-6%
-4%
-2%
0%
2%
4%
6%
8%
10%
96 97 98 99 00 01 02 03 04 05 06 07 08 09 10
California Millersville ShippensburgSlippery Rock University Average
Median Aa2 (2009) = 1.6%Without ARRA Funds in 2010, Millersville would have been 1.15%.
Annual revenues less expenses divided by total revenues
Stronger
Weaker

31
Capital Expense to Operations
0%
1%
2%
3%
4%
5%
6%
7%
8%
9%
02 03 04 05 06 07 08 09 10
California Millersville ShippensburgSlippery Rock University Average
Portion of annual expenses spent on capitalizable items (e.g., equipment, buildings). Excludes Commonwealth capital appropriations.
Median not available
Stronger
Weaker

32
Unrestricted Financial Resources to Comprehensive Debt
-50%
0%
50%
100%
150%
200%
250%
300%
350%
400%
96 97 98 99 00 01 02 03 04 05 06 07 08 09 10California Millersville ShippensburgSlippery Rock University Average
Median Aa2 (2009) = 49% Net assets divided by total debtIncludes component’s unrestricted net assets
Stronger
Weaker
In 1996, Slippery Rockwas 5,722%

33
Total Financial Resources to Comprehensive Debt
0%
100%
200%
300%
400%
500%
600%
700%
96 97 98 99 00 01 02 03 04 05 06 07 08 09 10California Millersville ShippensburgSlippery Rock University Average
Median Aa2 (2009) = 172%
Stronger
Weaker
Unrestricted and restricted net assets of the Systemand affiliated organizations divided by total debt
In 1996, Slippery Rockwas 8,714%

34
Comprehensive Debt Per FTE Student
$0
$2,500
$5,000
$7,500
$10,000
$12,500
$15,000
$17,500
$20,000
$22,500
96 97 98 99 00 01 02 03 04 05 06 07 08 09 10California Millersville ShippensburgSlippery Rock University Average
Median Aa2 (2009) = $14,548 Total debt divided by FTE student
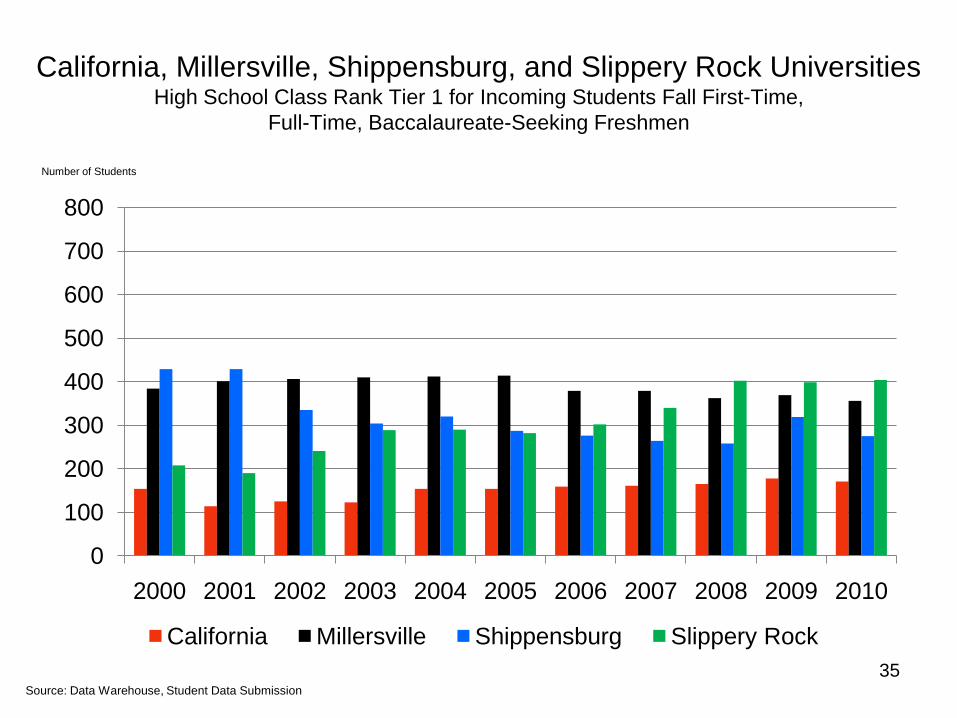
California, Millersville, Shippensburg, and Slippery Rock Universities High School Class Rank Tier 1 for Incoming Students Fall First-Time,
Full-Time, Baccalaureate-Seeking Freshmen
0
100
200
300
400
500
600
700
800
2000 2001 2002 2003 2004 2005 2006 2007 2008 2009 2010
California Millersville Shippensburg Slippery Rock
Number of Students
Source: Data Warehouse, Student Data Submission35

0
100
200
300
400
500
600
700
800
2000 2001 2002 2003 2004 2005 2006 2007 2008 2009 2010
California Millersville Shippensburg Slippery Rock
Source: Data Warehouse, Student Data Submission
California, Millersville, Shippensburg, and Slippery Rock Universities High School Class Rank Tier 2 for Incoming Students Fall First-Time,
Full-Time, Baccalaureate-Seeking Freshmen
36
Number of Students

0
100
200
300
400
500
600
700
800
2000 2001 2002 2003 2004 2005 2006 2007 2008 2009 2010
California Millersville Shippensburg Slippery Rock
Source: Data Warehouse, Student Data Submission
California, Millersville, Shippensburg, and Slippery Rock Universities High School Class Rank Tier 3 for Incoming Students Fall First-Time,
Full-Time, Baccalaureate-Seeking Freshmen
37
Number of Students

0
100
200
300
400
500
600
700
800
2000 2001 2002 2003 2004 2005 2006 2007 2008 2009 2010
California Millersville Shippensburg Slippery Rock
Source: Data Warehouse, Student Data Submission
California, Millersville, Shippensburg, and Slippery Rock Universities High School Class Rank Tier 4 for Incoming Students Fall First-Time,
Full-Time, Baccalaureate-Seeking Freshmen
38
Number of Students

0
100
200
300
400
500
600
700
800
2000 2001 2002 2003 2004 2005 2006 2007 2008 2009 2010
California Millersville Shippensburg Slippery Rock
Source: Data Warehouse, Student Data Submission
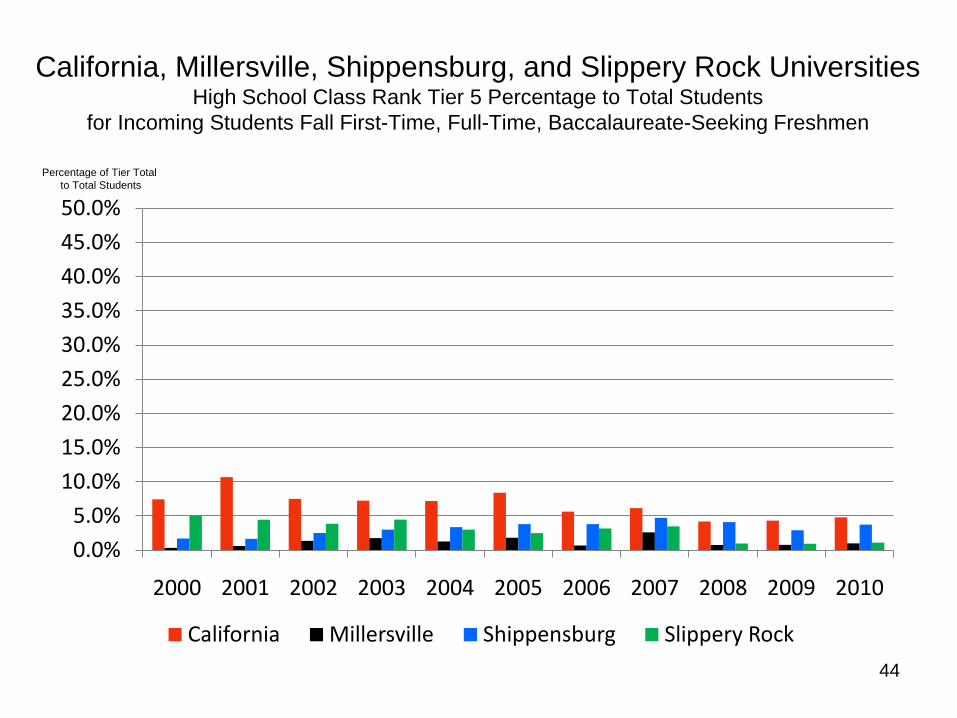
California, Millersville, Shippensburg, and Slippery Rock Universities High School Class Rank Tier 5 for Incoming Students Fall First-Time,
Full-Time, Baccalaureate-Seeking Freshmen
39
Number of Students

California, Millersville, Shippensburg, and Slippery Rock Universities High School Class Rank Tier 1 Percentage to Total Students
for Incoming Students Fall First-Time, Full-Time, Baccalaureate-Seeking Freshmen
0.0%5.0%
10.0%15.0%20.0%25.0%30.0%35.0%40.0%45.0%50.0%
2000 2001 2002 2003 2004 2005 2006 2007 2008 2009 2010
California Millersville Shippensburg Slippery Rock
Percentage of Tier Totalto Total Students
40

0.0%5.0%
10.0%15.0%20.0%25.0%30.0%35.0%40.0%45.0%50.0%
2000 2001 2002 2003 2004 2005 2006 2007 2008 2009 2010
California Millersville Shippensburg Slippery Rock
California, Millersville, Shippensburg, and Slippery Rock Universities High School Class Rank Tier 2 Percentage to Total Students
for Incoming Students Fall First-Time, Full-Time, Baccalaureate-Seeking Freshmen
41
Percentage of Tier Totalto Total Students

0.0%5.0%
10.0%15.0%20.0%25.0%30.0%35.0%40.0%45.0%50.0%
2000 2001 2002 2003 2004 2005 2006 2007 2008 2009 2010
California Millersville Shippensburg Slippery Rock
California, Millersville, Shippensburg, and Slippery Rock Universities High School Class Rank Tier 3 Percentage to Total Students
for Incoming Students Fall First-Time, Full-Time, Baccalaureate-Seeking Freshmen
42
Percentage of Tier Totalto Total Students

0.0%5.0%
10.0%15.0%20.0%25.0%30.0%35.0%40.0%45.0%50.0%
2000 2001 2002 2003 2004 2005 2006 2007 2008 2009 2010
California Millersville Shippensburg Slippery Rock
California, Millersville, Shippensburg, and Slippery Rock Universities High School Class Rank Tier 4 Percentage to Total Students
for Incoming Students Fall First-Time, Full-Time, Baccalaureate-Seeking Freshmen
43
Percentage of Tier Totalto Total Students
0.0%5.0%
10.0%15.0%20.0%25.0%30.0%35.0%40.0%45.0%50.0%
2000 2001 2002 2003 2004 2005 2006 2007 2008 2009 2010
California Millersville Shippensburg Slippery Rock
California, Millersville, Shippensburg, and Slippery Rock Universities High School Class Rank Tier 5 Percentage to Total Students
for Incoming Students Fall First-Time, Full-Time, Baccalaureate-Seeking Freshmen
44
Percentage of Tier Totalto Total Students
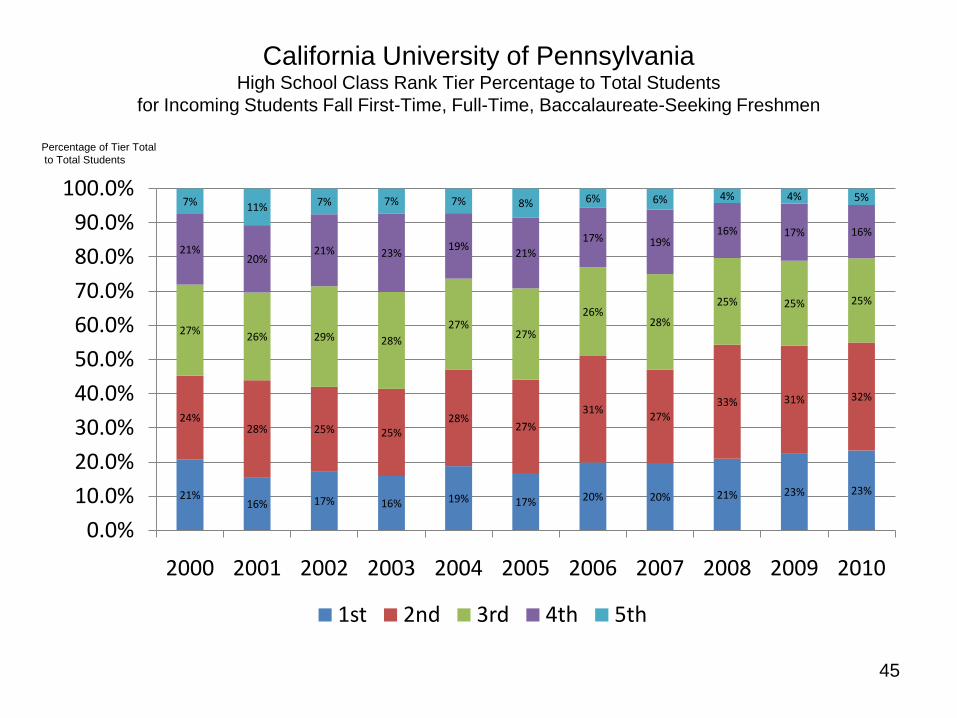
California University of PennsylvaniaHigh School Class Rank Tier Percentage to Total Students
for Incoming Students Fall First-Time, Full-Time, Baccalaureate-Seeking Freshmen
21%16% 17% 16% 19% 17% 20% 20% 21% 23% 23%
24%28% 25% 25%
28%27%
31%27%
33% 31% 32%
27% 26% 29% 28%27%
27%
26%28%
25% 25% 25%
21%20%
21% 23% 19%21%
17% 19%16% 17% 16%
7% 11% 7% 7% 7% 8% 6% 6% 4% 4% 5%
0.0%10.0%20.0%30.0%40.0%50.0%60.0%70.0%80.0%90.0%
100.0%
2000 2001 2002 2003 2004 2005 2006 2007 2008 2009 2010
1st 2nd 3rd 4th 5th
Percentage of Tier Totalto Total Students
45

Millersville University of PennsylvaniaHigh School Class Rank Tier Percentage to Total Students
for Incoming Students Fall First-Time, Full-Time, Baccalaureate-Seeking Freshmen
32% 35% 35% 33% 32% 36% 32% 34% 34% 35% 35%
42%43%
36% 38% 35%36%
38% 33% 36% 34% 33%
20%19%
22% 22% 24% 20% 23%22%
23% 22% 23%
5% 3% 5% 5% 7% 6% 6%9%
7% 8% 8%0% 1% 1% 2% 1% 2% 1% 3% 1% 1% 1%
0.0%10.0%20.0%30.0%40.0%50.0%60.0%70.0%80.0%90.0%
100.0%
2000 2001 2002 2003 2004 2005 2006 2007 2008 2009 2010
1st 2nd 3rd 4th 5th
Percentage of Tier Totalto Total Students
46

Shippensburg University of PennsylvaniaHigh School Class Rank Tier Percentage to Total Students
for Incoming Students Fall First-Time, Full-Time, Baccalaureate-Seeking Freshmen
28% 29%25% 23% 25% 22% 22% 19% 19% 23% 20%
42% 43%
35% 34% 34%33% 31%
29% 29%31%
30%
21% 21%
27% 27% 24%27% 28%
30% 28%
28%29%
7% 5%12% 12% 13% 15% 16% 17% 19%
15%18%
2% 2% 3% 3% 3% 4% 4% 5% 4% 3% 4%
0.0%10.0%20.0%30.0%40.0%50.0%60.0%70.0%80.0%90.0%
100.0%
2000 2001 2002 2003 2004 2005 2006 2007 2008 2009 2010
1st 2nd 3rd 4th 5th
Percentage of Tier Totalto Total Students
47

Slippery Rock University of PennsylvaniaHigh School Class Rank Tier Percentage to Total Students
for Incoming Students Fall First-Time, Full-Time, Baccalaureate-Seeking Freshmen
15% 14%19% 22% 21% 22% 23% 25%
30% 31% 32%
27% 25%
27%28% 34% 34% 33% 31%
36%38% 35%
25%27%
31%28%
27% 27% 27% 27%
24%24% 24%
27% 29%
19% 17%15% 15% 13% 14%
9% 6% 8%5% 4% 4% 4% 3% 2% 3% 3% 1% 1% 1%
0.0%10.0%20.0%30.0%40.0%50.0%60.0%70.0%80.0%90.0%
100.0%
2000 2001 2002 2003 2004 2005 2006 2007 2008 2009 2010
1st 2nd 3rd 4th 5th
Percentage of Tier Totalto Total Students
48

Pennsylvania State System of Higher EducationHigh School Class Rank Quintiles for Incoming Students 2010 Fall First-Time,
Full-Time, Baccalaureate-Seeking Freshmen
UniversityQuintile 1/ # Students
Quintile 2/ # Students
Quintile 3/ # Students
Quintile 4/ # Students
Quintile 5/ # Students
Bloomsburg 2nd/485 1st/518 3rd/447 4th/212 5th/66
California 3rd/171 1st/231 2nd/180 4th/114 5th/35
Cheyney 5th/21 4th/27 2nd/40 1st/52 3rd/31
Clarion 3rd/220 1st/309 2nd/247 4th/199 5th/73
East Stroudsburg 3rd/196 1st/317 2nd/259 4th/130 5th/15
Edinboro 3rd/203 1st/316 2nd/291 4th/159 5th/56
Indiana 4th/459 2nd/625 1st/630 3rd/519 5th/163
Kutztown 4th/251 2nd/414 1st/453 3rd/298 5th/55
Lock Haven 4th/179 1st/312 2nd/293 3rd/180 5th/43
Mansfield 2nd/114 1st/136 3rd/107 4th/65 5th/26
Millersville 1st/356 2nd/340 3rd/235 4th/82 5th/10
Shippensburg 3rd/275 1st/415 2nd/397 4th/249 5th/52
Slippery Rock 2nd/404 1st/451 3rd/310 4th/97 5th/14
West Chester 2nd/504 1st/544 3rd/321 4th/111 5th/26
Source: Data Warehouse, Student Data Submission
49

Pennsylvania State System of Higher EducationHigh School Class Rank Quintiles for Incoming Students 2000 Fall First-Time,
Full-Time, Baccalaureate-Seeking Freshmen
UniversityQuintile 1/ # Students
Quintile 2/ # Students
Quintile 3/ # Students
Quintile 4/ # Students
Quintile 5/ # Students
Bloomsburg 2nd/375 1st/497 3rd/322 4th/109 5th/14
California 3rd/154 2nd/181 1st/197 4th/153 5th/55
Cheyney 5th/39 2nd/58 4th/40 3rd/44 1st/107
Clarion 4th/200 2nd/306 1st/313 3rd/245 5th/95
East Stroudsburg 4th/99 2nd/267 1st/271 3rd/154 5th/51
Edinboro 4th/173 2nd/317 1st/339 3rd/255 5th/103
Indiana 4th/430 2nd/645 1st/680 3rd/509 5th/248
Kutztown 4th/207 2nd/419 1st/512 3rd/350 5th/30
Lock Haven 3rd/158 1st/270 2nd/204 4th/138 5th/49
Mansfield 4th/106 1st/161 1st/161 3rd/111 5th/19
Millersville 2nd/384 1st/502 3rd/242 4th/60 5th/4
Shippensburg 2nd/429 1st/636 3rd/327 4th/107 5th/26
Slippery Rock 4th/208 2nd/364 3rd/345 1st/368 5th/68
West Chester 3rd/366 1st/587 2nd/395 4th/196 5th/28
Source: Data Warehouse, Student Data Submission
50

700
750
800
850
900
950
1,000
1,050
1,100
0
2,000
4,000
6,000
8,000
10,000
12,000
14,000
96 97 98 99 00 01 02 03 04 05 06 07 08 09 10
Applications Acceptances Enrollments SAT Scores
California University of Pennsylvania Student Housing Impact
Applications, Acceptances, & Enrollments (AAE) and SAT Scores
SAT ScoresI II, III IVAAE V
51Source: Data Warehouse, Student Data Submission

700
750
800
850
900
950
1,000
1,050
1,100
0
2,000
4,000
6,000
8,000
10,000
12,000
14,000
96 97 98 99 00 01 02 03 04 05 06 07 08 09 10
Applications Acceptances Enrollments SAT Scores
Millersville University of Pennsylvania Student Housing Impact
Applications, Acceptances, & Enrollments (AAE) and SAT Scores
SAT ScoresAAE
52Source: Data Warehouse, Student Data Submission

700
750
800
850
900
950
1,000
1,050
1,100
0
2,000
4,000
6,000
8,000
10,000
12,000
14,000
96 97 98 99 00 01 02 03 04 05 06 07 08 09 10
Applications Acceptances Enrollments SAT Scores
Shippensburg University of Pennsylvania Student Housing Impact
Applications, Acceptances, & Enrollments (AAE) and SAT Scores
SAT Scores
Phase IV Proposed Opening 2010
AAE
53Source: Data Warehouse, Student Data Submission

700
750
800
850
900
950
1,000
1,050
1,100
0
2,000
4,000
6,000
8,000
10,000
12,000
14,000
96 97 98 99 00 01 02 03 04 05 06 07 08 09 10
Applications Acceptances Enrollments SAT Scores
Slippery Rock University of Pennsylvania Student Housing Impact
Applications, Acceptances, & Enrollments (AAE) and SAT Scores
SAT ScoresAAE
54
I II
Source: Data Warehouse, Student Data Submission