Mountain Goats in the Kicking Horse Canyon, Trans Canada Highway

Sample Analysis -‐ Prepared by Shirley Gee
TransCanada A Financial Analysis
January 2009

Sample Analysis -‐ Prepared by Shirley Gee 2
A look at financial profile of TransCanada as an investment opportunity.
A. Introduction
The goal of this review is to determine whether
TransCanada has a sufficiently strong financial
profile to recommend it as an investment
opportunity. TransCanada’s financial track record,
its prospect for future earnings, and its managerial
acumen were evaluated. The most current annual
report used was in 2007 and was the primary basis
for making this financial assessment. This review is
supported by financial statements going back
three years (i.e., 2004 to 2006) and was used to
assess TransCanada’s financial trends. To
compliment this review, general research was also
performed to determine whether there were
significant activities associated with TransCanada,
which would negatively impact on its financial
standing subsequent to its 2007 annual report.
Finally, comparable corporations were reviewed
to assess TransCanda’s performance in
relationship to others in the same industry. The
two corporations selected for this comparison
were TC Pipelines L.P., which owns and
participates in the management of United States-‐
based pipeline systems in the mid-‐western states,
and Enterprise Products Partners L.P., which
operates in Mid-‐America. Comparative results
between TransCanada and others in the industry
are reflected in Section D. Summary of Findings
using their respective 2007 annual reports.
It should be noted that all figures within the
Tables in this financial assessment are in Canadian
dollars and in $Million units.
A Company Embedded in Mutual Funds in many 401(k)’s

Sample Analysis -‐ Prepared by Shirley Gee 3
A Corporation with a Pipeline reaching from
Canada through United States to
Mexico
B. Overview
TransCanada is a corporation that operates a
pipeline system, which delivers natural gas
throughout North America via its vast pipeline
network and one of the largest providers of gas
storage. TransCanada’s organizational structure
reflects two primary segments; namely, Pipelines
and Energy. The Pipeline segment consists
primarily of Transamerica’s natural gas pipelines
in Canada, the U.S. and Mexico with one oil
pipeline (Keystone Pipeline Project). The Energy
segment includes the Corporation’s power
operations, natural gas storage business and
liquefied natural gas (LNG) projects in Canada and
the U.S. The corporation is expanding their
business into the oil pipeline business creating
another avenue for future growth. Their storage
capability and pipeline assets are the fundamental
basis for their business and the platform from
which they launch ancillary businesses (e.g.,
energy infrastructure projects, alternative energy
initiatives, etc.)
and growing …

Sample Analysis -‐ Prepared by Shirley Gee 4
Assessment of Financial Performance is Critical
C. Financial Performance and Management Assessment
1. General Financial Assessments – Income Statements between the period 2004 and 2007 were reviewed to
determine whether the business had a consistent, positive net income (owner’s equity) over multiple years.
An upward trajectory (i.e., an increase of net income over time) was considered a good indication of
financial health. Balance sheets over the same period were used to assess current and long-‐term assets and
to determine whether such assets were related to their primary business (i.e., pipeline systems or gas
storage). Liabilities were reviewed to assess the corporation’s debt load and to review its existing financial
obligations. Also of interest was the section on Shareholder’s Equity to assess other capital investments
and contributions in addition to net income.
A quick review of total assets and net income revealed the following trends. Total assets had an upward
trend while net income had a downward trend between 2004 and 2007, with a significant drop in net
income in 2006. Under closer examination, it was determined that this drop in net income in 2006 was due
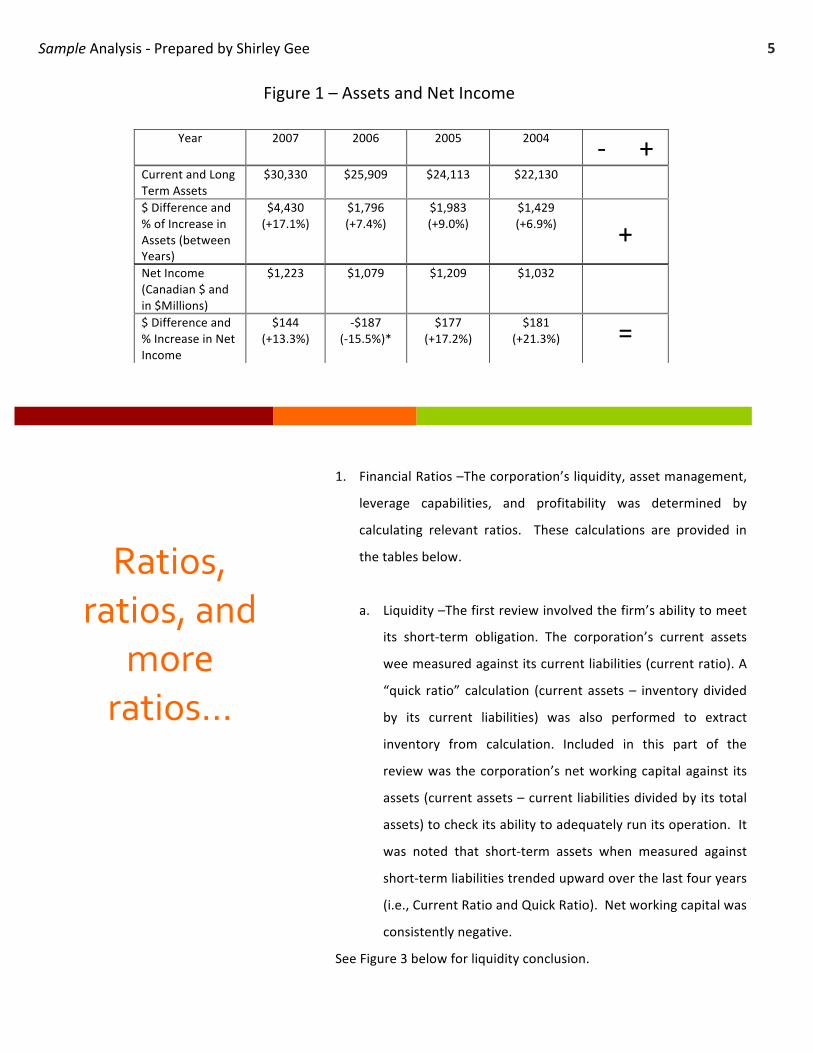
to a major acquisition in 2007 (of ANR Pipelines) by TransCanada. See Figure 1 – Assets and Net Income
Sample Analysis -‐ Prepared by Shirley Gee 5
Year 2007 2006 2005 2004 -‐ + Current and Long Term Assets
$30,330 $25,909 $24,113 $22,130
$ Difference and % of Increase in Assets (between Years)
$4,430 (+17.1%)
$1,796 (+7.4%)
$1,983 (+9.0%)
$1,429 (+6.9%)
+ Net Income (Canadian $ and in $Millions)
$1,223 $1,079 $1,209 $1,032
$ Difference and % Increase in Net Income
$144 (+13.3%)
-‐$187 (-‐15.5%)*
$177 (+17.2%)
$181 (+21.3%) =
Ratios, ratios, and
more ratios…
1. Financial Ratios –The corporation’s liquidity, asset management,
leverage capabilities, and profitability was determined by
calculating relevant ratios. These calculations are provided in
the tables below.
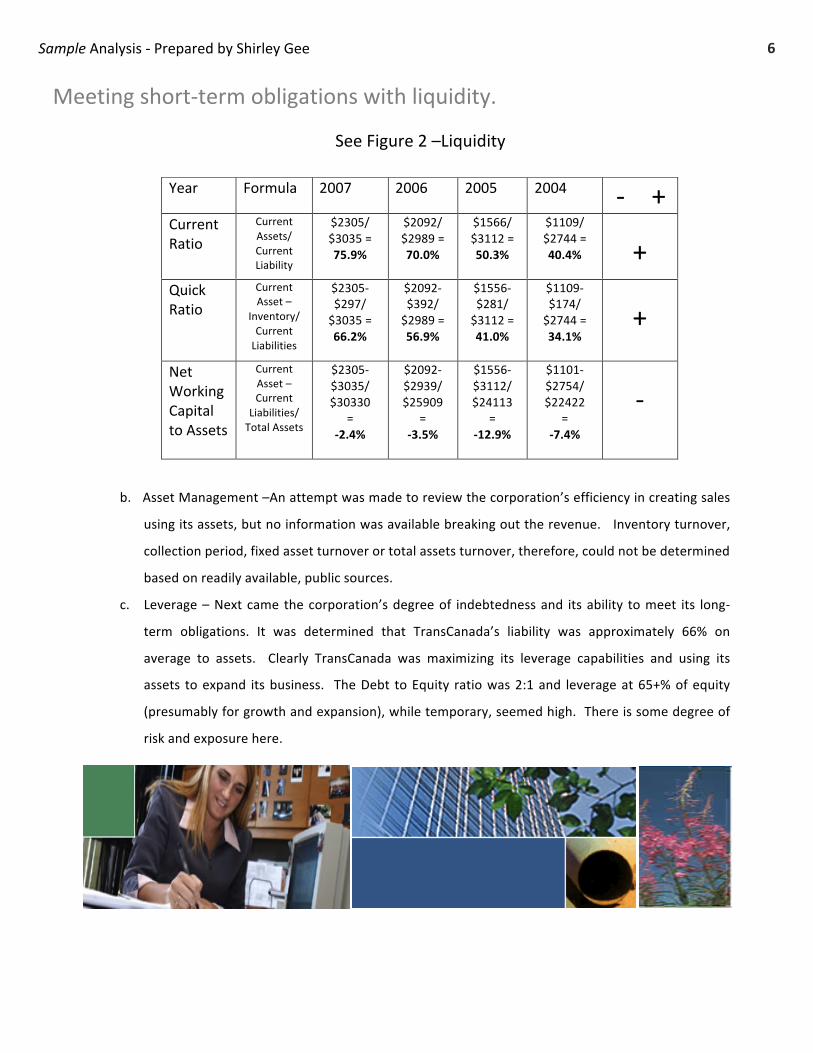
a. Liquidity –The first review involved the firm’s ability to meet
its short-‐term obligation. The corporation’s current assets
wee measured against its current liabilities (current ratio). A
“quick ratio” calculation (current assets – inventory divided
by its current liabilities) was also performed to extract
inventory from calculation. Included in this part of the
review was the corporation’s net working capital against its
assets (current assets – current liabilities divided by its total
assets) to check its ability to adequately run its operation. It
was noted that short-‐term assets when measured against
short-‐term liabilities trended upward over the last four years
(i.e., Current Ratio and Quick Ratio). Net working capital was
consistently negative.
See Figure 3 below for liquidity conclusion.
Figure 1 – Assets and Net Income
Sample Analysis -‐ Prepared by Shirley Gee 6
Meeting short-‐term obligations with liquidity.
Year Formula 2007 2006 2005 2004 -‐ +
Current Ratio
Current Assets/ Current Liability
$2305/ $3035 = 75.9%
$2092/ $2989 = 70.0%
$1566/ $3112 = 50.3%
$1109/ $2744 = 40.4%
+
Quick Ratio
Current Asset –
Inventory/ Current Liabilities
$2305-‐$297/ $3035 = 66.2%
$2092-‐$392/ $2989 = 56.9%
$1556-‐$281/ $3112 = 41.0%
$1109-‐$174/ $2744 = 34.1%
+
Net Working Capital to Assets
Current Asset – Current
Liabilities/ Total Assets
$2305-‐$3035/ $30330
= -‐2.4%
$2092-‐$2939/ $25909
= -‐3.5%
$1556-‐$3112/ $24113
= -‐12.9%
$1101-‐$2754/ $22422
= -‐7.4%
-‐
See Figure 2 –Liquidity
b. Asset Management –An attempt was made to review the corporation’s efficiency in creating sales
using its assets, but no information was available breaking out the revenue. Inventory turnover,
collection period, fixed asset turnover or total assets turnover, therefore, could not be determined
based on readily available, public sources.
c. Leverage – Next came the corporation’s degree of indebtedness and its ability to meet its long-‐
term obligations. It was determined that TransCanada’s liability was approximately 66% on
average to assets. Clearly TransCanada was maximizing its leverage capabilities and using its
assets to expand its business. The Debt to Equity ratio was 2:1 and leverage at 65+% of equity
(presumably for growth and expansion), while temporary, seemed high. There is some degree of
risk and exposure here.
See Figure 3 below for Asset Management and Leverage Conclusions.

Sample Analysis -‐ Prepared by Shirley Gee 7
d. Profitability – The corporation’s profit margin, return on assets and equity,
price/earnings ratio, and market-‐to-‐book ratio were all reviewed to
determine its current financial standing relative to profitability. In spite of a
trend downwards and given current economic conditions, the gross profit
margin seemed good at ~14%. Return on assets was positive each year and
return on equity was solid. Price/earnings was over 15 times each year,
which is good. See Figure 4 below for results.
Figure 4 – Profitability
Year Formula 2007 2006 2005 2004 -‐ + Gross Profit Margin
Net Income/ Revenue
$1223/ $8828 = 13.9%
$1079/ $7520 = 14.3%
$1209/ $6124 = 19.7%
$1032;/ $5497 = 18.8%
+ Return on Assets
Net Income/ Total Assets
$1223/ $30330 = 4.0%
$1079/ $25909 = 4.2%
$1209/ $24113 = 5.0%
$1032/ $22430 = 4.7%
+ Return on Equity
Net Income/ Owner’s Equity
$1223/ $9785 = 12.5%
$1079/ $7701 = 14.0%
$1209/ $7206 = 16.8%
$1032/ $6565 = 15.7%
= Price/ Earnings
Common Stock Price per Share /Earnings Per share
17.5
18.4
14.7
14.0
+
Year Formula 2007 2006 2005 2004 -‐ +
Debt Ratio
Total Liabilities/ Total Assets
$19546/ $30330 = 64.4%
$17453/ $25909 = 67.4%
$16124/ $24113 = 66.9%
$14430/ $22130 = 65.2%
-‐ Debt-‐to-‐Equity Ratio
Total Liabilities/ Owner’s Equity
$19546/ $9785 = 200% 2:1
$17453/ $7701 = 226% 2.3:1
$16124/ $7206 = 224% 2.2:1
$14430/ $6565 = 220% 2.2:1
-‐
See Figure 3 – Asset Management & Leverage
Lorem Ipsum
Leadership is key . . .
3. Assessment of Management
It appears the corporation is making reasonable
decisions regarding the business. The corporation
was sustaining its long-‐term value through its
existing assets by investing in energy infrastructure
projects, which are directly related to its core
business. All of these projects appear to be timed
to come on line around the same time (i.e., in 3
years) and barring any major, unforeseen event,
there should be a jump in revenue, return on assets
and return on equity by 2010 and beyond.
Management is also making decisions to diversify
into “other energy-‐related” projects (e.g., oil) and
“alternative” energy projects (e.g., wind), which
demonstrates a “forward leaning” posture
consistent with market direction (e.g., the Green
Movement). More importantly, the Corporation is
staying within its core business and competency.
Of particular interest was the sections in the
Management’s Discussion and analysis on how they
handled the business risks whether it was supply.
Competition, market prices, weather, plant
availability, execution and capital cost risks, and
power regulations. TransCanada’s management of
these risk seemed both thorough, orderly, and
reasonable. More importantly, it seemed
transparent and designed for comprehensibility, as
compared to the other corporations reviewed
(whether due to administrative inexperience, lack
of comparable resources, absence of available
data, or deliberate omission).
It was noted that the corporation manages 16
pipeline systems and controls 9 of them 100%; 5 of
them 50+%; and 3 of them less than 50%. This
provides for maximum control over the
management of the pipeline network and stability
within the corporation and industry within which it
operates.
It appears that management recognizes that
regulatory decision have a negative impact on
financial returns especially on existing and future
investments. This demonstrates an solid
awareness of the industry and its business
environment. This coupled with the size (large) of
TransCanada and its ability to take advantage of
“economy of scale” makes TransCanada less
Sample Analysis -‐ Prepared by Shirley Gee 9
vulnerable to external forces. As such, TransCanada
is probably more capable of managing regulatory
issues and it arises. In any case, adverse regulatory
decisions impact the industry as a whole; not just
TransCanada so the corporation should not lose its
competitive edge due to it.
Liquidity risk is always a problem, but
management seems to be managing its cash flow
needs pretty well with 5+ years of forecasting,
including provisions to cover both contractual
repayment obligations and long-‐term debt service.
TransCanada’s management capability and
competency seem solid and reasonable.
D. Summary of Findings
1. Financial Assessment
In reviewing the income statements and balance
sheets, I determined that the corporation had a
reasonably strong financial posture. Over a period
of four years, the corporation had a fairly steady
financial profile. It’s debt ratio was a bit high at over
65% of liabilities to assets, but this appears to be due
to the numerous expansion projects which should all
come on line by 2010. The numerous projects,
which either supports their primary business
(pipeline infrastructure expansion or maintenance)
or expands their gas storage business, all seem to
contribute to the profitability of the business which
is modest, but steady.
A review of their liquidity, leverage, and
profitability demonstrates a consistent picture of
reasonable financial health with maximum financial
flexibility. This financial state would enable the
corporation to take advantage of opportunities and
react to market shifts and challenges.
TransCanada’s success appears to be based on
maintaining a strong cash flow position in order to
take advantage of opportunities; its “forward
thinking” corporate culture with respect to energy
needs of customers in next 5-‐10 years; a deliberate
effort to construct infrastructure now to meet those
needs in the future; and a relatively conservative
approach to growth (i.e.., modest, steady growth).
Moreover, the corporation’s commitment to staying
within their core business and competency is wise
and its consistent ability to provide dividends to its
stockholders (even providing buying opportunities
at discounted rate) is a real plus. You always want
to keep the shareholders’ happy.
2. General Observations and Assessments
There were no major or significant findings found
during my general research which would raise
concerns about its dealings within the market.

Sample Analysis -‐ Prepared by Shirley Gee 10
There was no history of financial malfeasance or concerns regarding its corporate culture or managerial
philosophy.
The only critical accounting disclosure and information was in 2004 when the corporation did a re-‐
statement of its income statement and balance sheets to make the Canadian Institute of Chartered
Accountants better align its financial definitions to the International Financial Reporting Standards (IFRS) and
the U.S. GAAP (See 2007 Annual Report Note #2). The financial impact of this particular adjustment was an
increase in retained earnings by $4 million dollars for year ending 2007.
Of interest given a climate of high profile corporations going bankrupt due to questionable accounting
practices was the corporations position with respect to its retirement obligations. A quick review of their asset
retirement obligation as of December 31, 2007 was $88 billion. Settlement of the obligation ranges from 11 to
32 years. Using the 11 years, to be conservative, the corporation would need $8B to cover its retirement
obligations for any given year. With a net worth of $10B as of December 31, 2007, TransCanada could easily
cover its current retirement obligations.
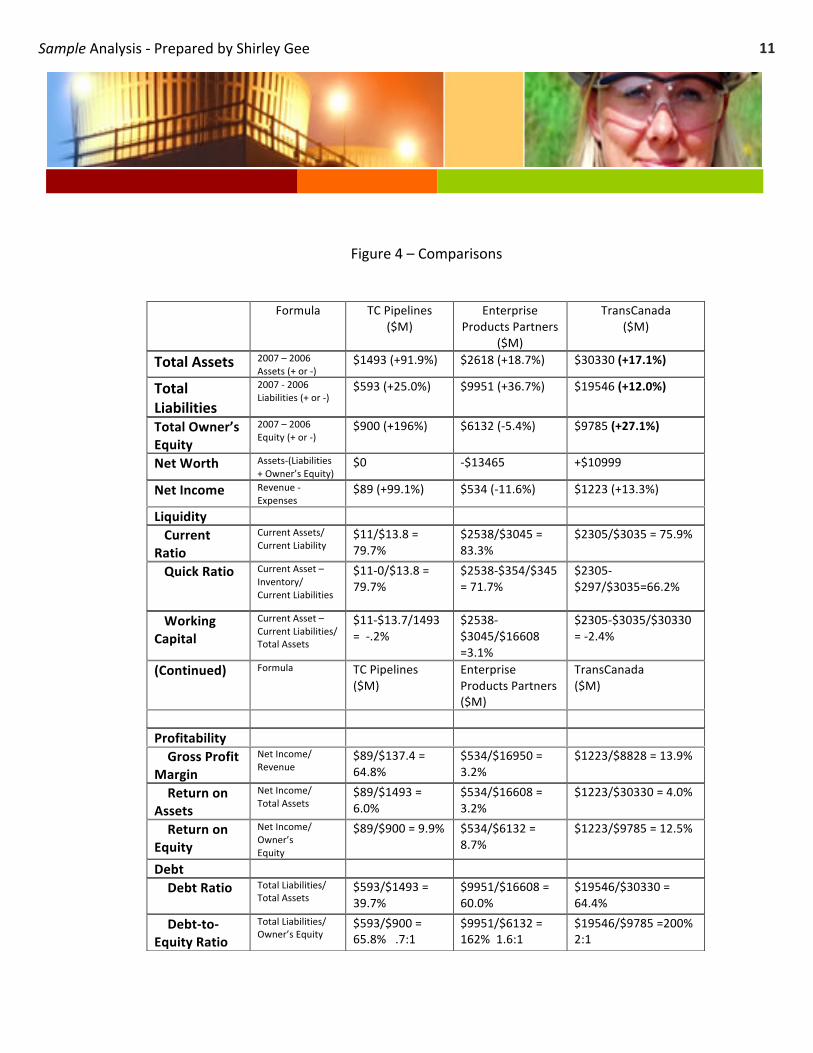
3. Industry Comparison
A review of TC Pipelines L.P. and Enterprise Products Partners L.P. gave a good industry comparison to
TransCanada. The following is the comparative chart. With respect to debt and profitability, TC Pipeline, while
smaller, might be a better buy than TransCanada based on their respective 2007’s performances. A more in-‐
depth analysis of TC Pipeline’s historical trend would be needed, however, before they could be
recommended. TransCanada does not seem particularly out of sync with the industry as a whole. The
following is a comparative table depicting the three corporations side by side.
Sample Analysis -‐ Prepared by Shirley Gee 11
Figure 4 – Comparisons
Formula TC Pipelines ($M)
Enterprise Products Partners
($M)
TransCanada ($M)
Total Assets 2007 – 2006 Assets (+ or -‐)
$1493 (+91.9%) $2618 (+18.7%) $30330 (+17.1%)
Total Liabilities
2007 -‐ 2006 Liabilities (+ or -‐)
$593 (+25.0%) $9951 (+36.7%) $19546 (+12.0%)
Total Owner’s Equity
2007 – 2006 Equity (+ or -‐)
$900 (+196%) $6132 (-‐5.4%) $9785 (+27.1%)
Net Worth Assets-‐(Liabilities + Owner’s Equity)
$0 -‐$13465 +$10999
Net Income Revenue -‐ Expenses
$89 (+99.1%) $534 (-‐11.6%) $1223 (+13.3%)
Liquidity
Current Ratio
Current Assets/ Current Liability
$11/$13.8 = 79.7%
$2538/$3045 = 83.3%
$2305/$3035 = 75.9%
Quick Ratio Current Asset – Inventory/ Current Liabilities
$11-‐0/$13.8 = 79.7%
$2538-‐$354/$345 = 71.7%
$2305-‐$297/$3035=66.2%
Working Capital
Current Asset – Current Liabilities/ Total Assets
$11-‐$13.7/1493 = -‐.2%
$2538-‐$3045/$16608 =3.1%
$2305-‐$3035/$30330 = -‐2.4%
(Continued) Formula TC Pipelines ($M)
Enterprise Products Partners ($M)
TransCanada ($M)
Profitability
Gross Profit Margin
Net Income/ Revenue
$89/$137.4 = 64.8%
$534/$16950 = 3.2%
$1223/$8828 = 13.9%
Return on Assets
Net Income/ Total Assets
$89/$1493 = 6.0%
$534/$16608 = 3.2%
$1223/$30330 = 4.0%
Return on Equity
Net Income/ Owner’s Equity
$89/$900 = 9.9% $534/$6132 = 8.7%
$1223/$9785 = 12.5%
Debt
Debt Ratio
Total Liabilities/ Total Assets
$593/$1493 = 39.7%
$9951/$16608 = 60.0%
$19546/$30330 = 64.4%
Debt-‐to-‐Equity Ratio
Total Liabilities/ Owner’s Equity
$593/$900 = 65.8% .7:1
$9951/$6132 = 162% 1.6:1
$19546/$9785 =200% 2:1

Sample Analysis -‐ Prepared by Shirley Gee 12
E. Recommendation
All in all and although the debt ratios were a bit high, I would still affirmatively recommend this corporation
due to its strong and steady financial posture and its consistent return on assets and equity over a sustained
period of time. Their regular dividend payouts over the last 5+ years shows a sustained ability to manage
operations for the benefit of stockholders. Their current projects indicate expansion opportunities (i.e., in oil,
wind, coal fire electric power, and additional pipeline acquisition and storage facilities), which should provide for
continual return on assets and equity well into the foreseeable future. The corporation’s move towards
alternative, renewable energy is in keeping with the direction of the market from all indications and
demonstrates an awareness of opportunities and the need to position itself to maximize leverage of its assets.
Finally, as compared to others in industry, it’s a very solid corporation with a positive net worth, manageable debt
ratio and good return on assets and equity. It’s a Buy!