
Unit C04 - Setting up accounting software to manage accounting ...

Copyright © 2011 Pearson Prentice Hall. All rights reserved.
Financial Analysis: Sizing up Firm Performance
Chapter 4

Copyright © 2011 Pearson Prentice Hall. All rights reserved. 4-2
Slide Contents
• Learning Objectives
• Principles Used in this Chapter
1.Why Do We Analyze Financial Statements
2.Common Size Statements – Standardizing Financial Information
3.Using Financial Ratios
4.Selecting a Performance Benchmark
5.The Limitations of Ratio Analysis

Copyright © 2011 Pearson Prentice Hall. All rights reserved. 4-3
Learning Objectives
1. Explain what we can learn by analyzing a firm’s financial statements.
2. Use common size financial statements as a tool of financial analysis.
3. Calculate and use a comprehensive set of financial ratios to evaluate a company’s performance.
4. Select an appropriate benchmark for use in performing a financial ratio analysis.
5. Describe the limitations of financial ratio analysis.

Copyright © 2011 Pearson Prentice Hall. All rights reserved.
4.1 Why Do We Analyze Financial Statements?

Copyright © 2011 Pearson Prentice Hall. All rights reserved. 4-5
Why Do We Analyze Financial Statements?
• A firm’s financial statements can be analyzed internally (by employees, managers) and externally (by bankers, investors, customers, and other interested parties).

Copyright © 2011 Pearson Prentice Hall. All rights reserved. 4-6
Why Do We Analyze Financial Statements? (cont.)
• An internal financial analysis might be done:
– To evaluate the performance of employees and determine their pay raises and bonuses.
– To compare the financial performance of the firm’s different divisions.
– To prepare financial projections, such as those associated with the launch of a new product.
– To evaluate the firm’s financial performance in light of its competitors and determine how the firm might improve its operations.

Copyright © 2011 Pearson Prentice Hall. All rights reserved. 4-7
Why Do We Analyze Financial Statements? (cont.)
• A variety of firms and individuals that have an economic interest might also undertake an external financial analysis:
– Banks and other lenders deciding whether to loan money to the firm.
– Suppliers who are considering whether to grant credit to the firm.
– Credit-rating agencies trying to determine the firm’s creditworthiness.
– Professional analysts who work for investment companies considering investing in the firm or advising others about investing.
– Individual investors deciding whether to invest in the firm.

Copyright © 2011 Pearson Prentice Hall. All rights reserved.
4.2 Common Size Statements – Standardizing Financial Information

Copyright © 2011 Pearson Prentice Hall. All rights reserved. 4-9
Common Size Statements – Standardizing Financial Information
• A common size financial statement is a standardized version of a financial statement in which all entries are presented in percentages.
• A common size financial statement helps to compare entries in a firm’s financial statements, even if the firms are not of equal size.

Copyright © 2011 Pearson Prentice Hall. All rights reserved. 4-10
Common Size Statements – Standardizing Financial Information (cont.)
• How to prepare a common size financial statement?
– For a common size income statement, divide each entry in the income statement by the company’s sales.
– For a common size balance sheet, divide each entry in the balance sheet by the firm’s total assets.

Copyright © 2011 Pearson Prentice Hall. All rights reserved. 4-11
Common Size Income Statement (H. J. Boswell, Inc.)

Copyright © 2011 Pearson Prentice Hall. All rights reserved. 4-12
Table 4-1 Observations
• Table 4-1 is created by dividing each entry in the income statement found in Table 3-1 by firm sales for 2010.
– Cost of goods sold make up 75% of the firm’s sales resulting in a gross profit of 25%.
– Selling expenses account for about 3% of sales. Income taxes account for 4.1% of the firm’s sales.
– After accounting for all expenses, the firm generates net income of 7.6% of firm’s sales.

Copyright © 2011 Pearson Prentice Hall. All rights reserved. 4-13
Common Size Balance Sheet (H. J. Boswell, Inc.)

Copyright © 2011 Pearson Prentice Hall. All rights reserved. 4-14
Table 4-2 Observations
• Table 4-2 is created by dividing each entry in the balance sheet found in Table 3-2 by total assets for the year.
– Total current assets increased by 5.6% in 2010 while total current liabilities declined by 2%.
– Long-term debt account for 39.2% of firm’s assets, showing a decline of 1.7%.
– Retained earnings increased by 5.8% in 2010.

Copyright © 2011 Pearson Prentice Hall. All rights reserved.
4.3 Using Financial Ratios

Copyright © 2011 Pearson Prentice Hall. All rights reserved. 4-16
Using Financial Ratios
• Financial ratios provide a second method for standardizing the financial information on the income statement and balance sheet.
• A ratio by itself may have no meaning. Hence, a given ratio is compared to: (a) ratios from previous years; or (b) ratios of other firms in the same industry.
• If the differences in the ratios are significant, more in-depth analysis must be done.

Copyright © 2011 Pearson Prentice Hall. All rights reserved. 4-17
Using Financial Ratios (cont.)
Question Category of Ratios Used
1. How liquid is the firm? Will it be able to pay its bills as they become due?
Liquidity ratios
2. How has the firm financed the purchase of its assets?
Capital structure ratios
3. How efficient has the firm’s management been in utilizing it assets to generate sales?
Asset management efficiency ratios
4. Has the firm earned adequate returns on its investments?
Profitability ratios
5. Are the firm’s managers creating value for shareholders?
Market value ratios

Copyright © 2011 Pearson Prentice Hall. All rights reserved.
Liquidity Ratios

Copyright © 2011 Pearson Prentice Hall. All rights reserved. 4-19
Liquidity Ratios
• Liquidity ratios address a basic question: How liquid is the firm?
• A firm is financially liquid if it is able to pay its bills on time. We can analyze a firm’s liquidity from two perspectives:
– Overall or general firm liquidity
– Liquidity of specific current asset accounts

Copyright © 2011 Pearson Prentice Hall. All rights reserved. 4-20
Liquidity Ratios (cont.)
• Overall liquidity is analyzed by comparing the firm’s current assets to the firm’s current liabilities.
• Liquidity of specific assets is analyzed by examining the timeliness in which the firm’s primary liquid assets – accounts receivable and inventories – are converted into cash.

Copyright © 2011 Pearson Prentice Hall. All rights reserved. 4-21
Liquidity Ratios: Current Ratio
• The overall liquidity of a firm is analyzed by computing the current ratio and acid-test ratio.
• Current Ratio: Current Ratio compares a firm’s current (liquid) assets to its current (short-term) liabilities.

Copyright © 2011 Pearson Prentice Hall. All rights reserved. 4-22
Liquidity Ratios: Current Ratio (cont.)
• The text computes the current ratio for H.J. Boswell, Inc. for 2010.
• What is the current ratio for 2009?

Copyright © 2011 Pearson Prentice Hall. All rights reserved. 4-23
Liquidity Ratios: Current Ratio (cont.)
• Current Ratio = $477 ÷ 292.5 = 1.63 times
The firm had $1.63 in current assets for every $1 it owed in current liability.
The current ratio improved in 2010 to 2.23 times as the current assets increased significantly in 2010.

Copyright © 2011 Pearson Prentice Hall. All rights reserved. 4-24
Liquidity Ratios: Quick Ratio
• The overall liquidity of a firm is also analyzed by computing the Acid-Test (Quick) Ratio. This ratio excludes the inventory from current assets as inventory may not always be very liquid.

Copyright © 2011 Pearson Prentice Hall. All rights reserved. 4-25
Liquidity Ratios: Quick Ratio (cont.)
• Quick Ratio = ($477-$299.50) ÷ ($292.50)
= 0.63 times
• The firm is clearly less liquid using quick ratio as the firm has only $0.63 in current assets (less inventory) to cover $1 in current liabilities.
• The quick ratio improved in 2010 to 0.94 times largely due to an increase in current assets.
Copyright © 2011 Pearson Prentice Hall. All rights reserved. 4-26
Liquidity Ratios: Individual Asset Categories
• We can also measure the liquidity of the firm by examining the liquidity of individual current asset accounts, including accounts receivable and inventories.
• We can assess the liquidity of the firm by measuring how long it takes the firm to convert its accounts receivables and inventories into cash.

Copyright © 2011 Pearson Prentice Hall. All rights reserved. 4-27
Liquidity Ratios: Accounts Receivable
• Average Collection Period measures the number of days it takes the firm to collects its receivables.

Copyright © 2011 Pearson Prentice Hall. All rights reserved. 4-28
Liquidity Ratios: Accounts Receivable (cont.)
• The text computes the average collection period for H.J. Boswell, Inc. for 2010.
• What will be the average collection period for 2009 if we assume that the annual credit sales were $2,500 million in 2009?

Copyright © 2011 Pearson Prentice Hall. All rights reserved. 4-29
Liquidity Ratios: Accounts Receivable (cont.)
• Daily Credit Sales
– = $2,500 million ÷ 365 days = $6.85 million
• Average Collection Period
= Accounts Receivable ÷ Daily Credit Sales
= $139.5m ÷ $6.85m = 20.37 days
• The firm collects its accounts receivable in 20.37 days.

Copyright © 2011 Pearson Prentice Hall. All rights reserved. 4-30
Liquidity Ratios: Accounts Receivable Turnover Ratio
• Accounts Receivable Turnover Ratio measures how many times accounts receivable are “rolled over” during a year.

Copyright © 2011 Pearson Prentice Hall. All rights reserved. 4-31
Liquidity Ratios: Accounts Receivable Turnover Ratio (cont.)
• Accounts Receivable Turnover
= $2,500 million ÷ $139.50
= 17.92 times
• The firm’s accounts receivable were turning over at 17.92 times per year.

Copyright © 2011 Pearson Prentice Hall. All rights reserved. 4-32
Liquidity Ratios: Inventory Turnover Ratio
• Inventory turnover ratio measures how many times the company turns over its inventory during the year. Shorter inventory cycles lead to greater liquidity since the items in inventory are converted to cash more quickly.

Copyright © 2011 Pearson Prentice Hall. All rights reserved. 4-33
Liquidity Ratios: Inventory Turnover Ratio (cont.)
• Inventory Turnover Ratio
= $1,980 ÷ $229.50
= 8.63 times
• The firm turned over its inventory 8.63 times per year.

Copyright © 2011 Pearson Prentice Hall. All rights reserved. 4-34
Liquidity Ratios: Days’ Sales in Inventory
• We can express the inventory turnover ratio in terms of the number of days the inventory sits unsold on the firm’s shelves.
• Days’ Sales in Inventory
= 365÷ inventory turnover ratio
= 365 ÷ 8.63 = 42.29 days
• The firm, on average, holds it inventory for about 42 days.

Copyright © 2011 Pearson Prentice Hall. All rights reserved. 4-35
Can a Firm Have Too Much Liquidity?
• A high investment in liquid assets will enable the firm to repay its current liabilities in a timely manner.
• However, an excessive investments in liquid assets can prove to be costly as liquid assets (such as cash) generate minimal return.

Copyright © 2011 Pearson Prentice Hall. All rights reserved.
Capital Structure Ratios

Copyright © 2011 Pearson Prentice Hall. All rights reserved. 4-37
Capital Structure Ratios
• Capital structure refers to the way a firm finances its assets.
• Capital structure ratios address the important question: How has the firm financed the purchase of its assets?
• We will use two ratios, debt ratio and times interest earned ratio, to answer the question.

Copyright © 2011 Pearson Prentice Hall. All rights reserved. 4-38
Capital Structure Ratios (cont.)
• Debt ratio measures the proportion of the firm’s assets that are financed by borrowing or debt financing.

Copyright © 2011 Pearson Prentice Hall. All rights reserved. 4-39
Capital Structure Ratios (cont.)
• Debt Ratio
– = $1,012.50 million ÷ $1,764 million
– = 57.40%
• The firm financed 57.39% of its assets with debt.

Copyright © 2011 Pearson Prentice Hall. All rights reserved. 4-40
Capital Structure Ratios (cont.)
• Times Interest Earned Ratio measures the ability of the firm to service its debt or repay the interest on debt.
– We use EBIT or operating income as interest expense is paid before a firm pays its taxes.

Copyright © 2011 Pearson Prentice Hall. All rights reserved. 4-41
Capital Structure Ratios (cont.)
• The text computes the times interest earned ratio for H.J. Boswell, Inc. for 2010.
• What will be the times interest earned ratio for 2009 if we assume interest expense of $65 million and EBIT of $350 million?

Copyright © 2011 Pearson Prentice Hall. All rights reserved. 4-42
Capital Structure Ratios (cont.)
• Times Interest Earned
= $350 million ÷ $65 million = 5.38 times
• Thus the firm can pay its total interest expense 5.38 times.

Copyright © 2011 Pearson Prentice Hall. All rights reserved.
Asset Management Efficiency Ratios

Copyright © 2011 Pearson Prentice Hall. All rights reserved. 4-44
Asset Management Efficiency Ratios
• Asset management efficiency ratios measure a firm’s effectiveness in utilizing its assets to generate sales.
• They are commonly referred to as turnover ratios as they reflect the number of times a particular asset account balance turns over during a year.

Copyright © 2011 Pearson Prentice Hall. All rights reserved. 4-45
Asset Management Efficiency Ratios (cont.)
• Total Asset Turnover Ratio represents the amount of sales generated per dollar invested in firm’s assets.

Copyright © 2011 Pearson Prentice Hall. All rights reserved. 4-46
Asset Management Efficiency Ratios (cont.)
• Fixed asset turnover ratio measures firm’s efficiency in utilizing its fixed assets (such as property, plant and equipment).

Copyright © 2011 Pearson Prentice Hall. All rights reserved. 4-47
Asset Management Efficiency Ratios (cont.)
• We could similarly compute the turnover ratio for other assets.
• We had earlier computed the receivables turnover and inventory turnover, which measured firm effectiveness in managing its investments in accounts receivables and inventories.

Copyright © 2011 Pearson Prentice Hall. All rights reserved. 4-48
Asset Management Efficiency Ratios (cont.)
• The following grid summarizes the efficiency of Boswell’s management in utilizing its assets to generate sales in 2010.
Turnover
Ratio Boswell Peer Group Assessment
Total Assets 1.37 1.15 Good
Fixed Assets
2.03 1.75 Good
Receivables 16.67 14.60 Good
Inventory 5.36 7.0 Poor

Copyright © 2011 Pearson Prentice Hall. All rights reserved.
Profitability Ratios

Copyright © 2011 Pearson Prentice Hall. All rights reserved. 4-50
Profitability Ratios
• Profitability ratios address a very fundamental question: Has the firm earned adequate returns on its investments?
• We answer this question by analyzing the firm’s profit margin, which predict the ability of the firm to control its expenses, and the firm’s rate of return on investments.

Copyright © 2011 Pearson Prentice Hall. All rights reserved. 4-51
Profitability Ratios (cont.)
• Gross profit margin shows how well the firm’s management controls its expenses to generate profits.

Copyright © 2011 Pearson Prentice Hall. All rights reserved. 4-52
Profitability Ratios (cont.)
• Gross Profit Margin
– = $650 million ÷ $2,500 million = 26%
• The firm spent $0.74 for cost of goods sold for each dollar of sales. Thus, $0.26 out of each dollar of sales goes to gross profits.
Copyright © 2011 Pearson Prentice Hall. All rights reserved. 4-53
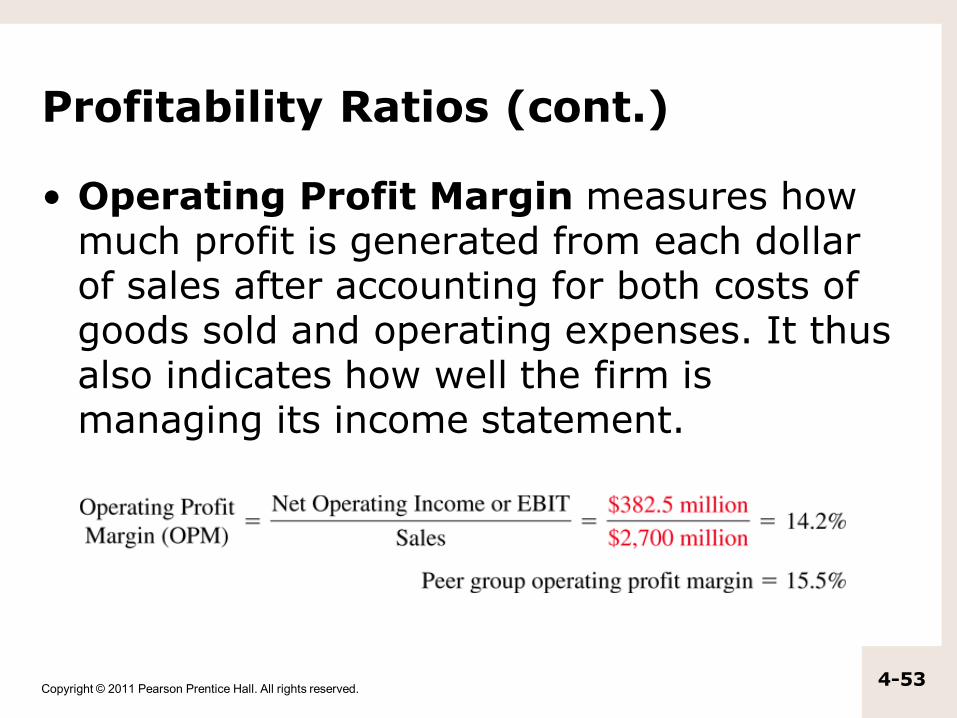
Profitability Ratios (cont.)
• Operating Profit Margin measures how much profit is generated from each dollar of sales after accounting for both costs of goods sold and operating expenses. It thus also indicates how well the firm is managing its income statement.

Copyright © 2011 Pearson Prentice Hall. All rights reserved. 4-54
Profitability Ratios (cont.)
• Net Profit Margin measures how much income is generated from each dollar of sales after adjusting for all expenses (including income taxes).
•

Copyright © 2011 Pearson Prentice Hall. All rights reserved. 4-55
Profitability Ratios (cont.)
• Net Profit Margin
– = $217.75 million ÷ $2,500 million = 8.71%
• The firm generated $0.087 for each dollar of sales after all expenses (including income taxes) were accounted for.

Copyright © 2011 Pearson Prentice Hall. All rights reserved. 4-56
Profitability Ratios (cont.)
• Operating Return on Assets ratio is the summary measure of operating profitability, which takes into account both the management’s success in controlling expenses, contributing to profit margins, and its efficient use of assets to generate sales.

Copyright © 2011 Pearson Prentice Hall. All rights reserved. 4-57
Is the Firm Providing a Reasonable Return on the Owner’s Investment?
• A firm’s net income consists of earnings that is available for distribution to the firm’s shareholders. Return on Equity ratio measures the accounting return on the common stockholders’ investment.

Copyright © 2011 Pearson Prentice Hall. All rights reserved. 4-58
Is the Firm Providing a Reasonable Return on the Owner’s Investment (cont.)
• Return on Equity
– = $217.75 million ÷ $751.50 million = 28.98%
• Thus the shareholders earned 28.97% on their investments.

Copyright © 2011 Pearson Prentice Hall. All rights reserved. 4-59
Using the DuPont Method for Decomposing the ROE ratio
• DuPont method analyzes the firm’s ROE by decomposing it into three parts: profitability, efficiency and an equity multiplier.
– ROE = Profitability × Efficiency × Equity Multiplier
• Equity multiplier captures the effect of the firm’s use of debt financing on its return on equity. The equity multiplier increases in value as the firm uses more debt.

Copyright © 2011 Pearson Prentice Hall. All rights reserved. 4-60
Using the DuPont Method for Decomposing the ROE ratio (cont.)
• ROE = Profitability × Efficiency × Equity Multiplier
• ROE = Net Profit Margin × Total Asset Turnover Ratio × 1/(1-debt ratio)

Copyright © 2011 Pearson Prentice Hall. All rights reserved. 4-61
Using the DuPont Method for Decomposing the ROE ratio (cont.)
• The following table shows why Boswell’s return on equity was higher than its peers.
Return on Equity
Net Profit
Margin
Total Asset
Turnover
Equity Multiplier
H. J. Boswell, Inc.
22.5% 7.6% 1.37 2.16
Peer Group
18.0% 10.2% 1.15 1.54

Copyright © 2011 Pearson Prentice Hall. All rights reserved.
Market Value Ratios

Copyright © 2011 Pearson Prentice Hall. All rights reserved. 4-63
Market Value Ratios
• Market value ratios address the question, how are the firm’s shares valued in the stock market?
• Two market value ratios are:
– Price-Earnings Ratio
– Market-to-Book Ratio

Copyright © 2011 Pearson Prentice Hall. All rights reserved. 4-64
Market Value Ratios (cont.)
• Price-Earnings (PE) Ratio indicates how much investors are currently willing to pay for $1 of reported earnings.

Copyright © 2011 Pearson Prentice Hall. All rights reserved. 4-65
Market Value Ratios (cont.)
• Market-to-Book Ratio measures the relationship between the market value and the accumulated investment in the firm’s equity.

Copyright © 2011 Pearson Prentice Hall. All rights reserved.
4.4 Selecting a Performance Benchmark

Copyright © 2011 Pearson Prentice Hall. All rights reserved. 4-67
Selecting a Performance Benchmark
• There are two types of benchmarks that are commonly used:
– Trend Analysis – involves comparing a firm’s financial statements over time.
– Peer Group Comparisons – involves comparing the subject firm’s financial statements with those of similar, or “peer” firms. The benchmark for peer groups typically consists of firms from the same industry or industry average financial ratios.

Copyright © 2011 Pearson Prentice Hall. All rights reserved. 4-68
Trend Analysis

Copyright © 2011 Pearson Prentice Hall. All rights reserved. 4-69
Financial Analysis of the Gap, Inc., June 2009

Copyright © 2011 Pearson Prentice Hall. All rights reserved.
4.5 The Limitations of Ratio Analysis

Copyright © 2011 Pearson Prentice Hall. All rights reserved. 4-71
The Limitations of Ratio Analysis
1. Picking an industry benchmark can sometimes be difficult.
2. Published peer-group or industry averages are not always representative of the firm being analyzed.
3. An industry average is not necessarily a desirable target or norm.

Copyright © 2011 Pearson Prentice Hall. All rights reserved. 4-72
The Limitations of Ratio Analysis (cont.)
4. Accounting practices differ widely among firms.
5. Many firms experience seasonal changes in their operations.
6. Financial ratios offer only clues (signs). We need to analyze the numbers in order to fully understand the ratios.
7. The results of financial analysis are dependent
on the quality of the financial statements.

Copyright © 2011 Pearson Prentice Hall. All rights reserved. 4-73
Summary
Question Category of Ratios Used
1. How liquid is the firm? Will it be able to pay its bills as they become due?
Liquidity ratios (Quick Ratio, Inventory Turnover Ratios etc.)
2. How has the firm financed the purchase of its assets?
Capital structure ratios (Debt Ratio, Times Interest Earned Ratio)
3. How efficient has the firm’s management been in utilizing it assets to generate sales?
Asset management efficiency ratios (Inventories, Recievable etc.)
4. Has the firm earned adequate returns on its investments?
Profitability ratios (Margin Ratios, Return on … Ratios)
5. Are the firm’s managers creating value for shareholders?
Market value ratios (P/E, Market to Book Value Ratios)


![C04 wireless telecommunication-systems[1]](https://static.fdocuments.us/doc/165x107/5581ebb4d8b42a67508b493e/c04-wireless-telecommunication-systems1.jpg)


