Financial Analysis of the Grameen Bank - Wikispacesof...An Analysis of the Financial ... (MFIs) in...
22
An Analysis of the Financial Strategies of Grameen Bank Jess Lampe and Sagar Dedhia 7/23/2009
Transcript of Financial Analysis of the Grameen Bank - Wikispacesof...An Analysis of the Financial ... (MFIs) in...

An Analysis of the Financial
Strategies of Grameen Bank
Jess Lampe and Sagar Dedhia
7/23/2009

P a g e | 2
Contents
Introduction ..................................................................................................................................... 3
Increased Savings Deposits: A Changing Funding Profile ............................................................. 5
Increased Fixed-Deposits: Deployment of Capital ......................................................................... 7
Comparison with Other MFI Strategies .......................................................................................... 8
Rationale for Grameen’s Financing Strategy ................................................................................ 11
Rationale for Grameen’s Investment Strategy .............................................................................. 12
Impact of Grameen’s Strategy on Capital Adequacy ................................................................... 16
Recommendations to Improve Profitability and Capital Adequacy ............................................. 19
Conclusion .................................................................................................................................... 21
Bibliography ................................................................................................................................. 22

P a g e | 3
Introduction
Grameen Bank led by Prof. Muhammad Yunus has proven that poverty stricken borrowers can be
relied on to pay back loans even when they have no collateral. This was a revelation to banks,
governments, and development organizations around the world which, for the longest time, did not
believe it was possible to lend to the poor.
To reward poor borrowers for their integrity, Grameen Bank has offered generous interest rates
on loans and savings. Grameen offers loans at 10% flat rate interest (effective interest rate of 20%) and
roughly 8.5-10.4% on savings deposits. The spread is more favorable to borrowers than the spread offered
by most other Microfinance Institutions (MFIs) in Bangladesh. Other MFIs offer lending rates closer to
12.5% flat rate (25% effective interest) and savings rates from 4.0-6.0% (S.F. Ahmed and Co., 2009).
Essentially, other MFIs are charging borrowers more for lending money and are paying the borrowers less
for the use of their money.
While offering these generous terms to borrowers, Grameen has made two prominent changes
visible in Grameen’s financial statements between 2002 and 2008:
1. Grameen accepted an increased amount of savings deposits from members (28% CAGR1 over
2003-08) and started accepting deposits from non-members in 2003 to finance its bank operations
(55% CAGR over 2003-08)
2. Grameen has been increasing fixed deposit investments in commercial banks in Bangladesh to
take advantage of higher interest rates on high-value fixed deposits (40% CAGR over 2003-08).
It has done this instead of disbursing the capital as loans. In comparison, Grameen’s loan
portfolio grew at a high CAGR of 22% over 2003-08; but this was much slower than its growth
rate in fixed deposits.
Table 1: Grameen Balance Sheet Analysis 2003 and 2008
In Taka billion 2003 Percentage of
Total Assets
2008 Percentage of
Total Assets
CAGR
2003-08
Loan Portfolio 16.1 59% 44.4 54% 22.0%
Fixed Deposits in Banks 5.3 20% 28.5 34% 40.0%
Member Deposits 10.1 37% 35.1 42% 28.2%
Non-Member Deposits 3.3 12% 29.5 36% 55.0%
Total Assets 27.1 82.8 25.0%
Source: Grameen Bank Audited Financial Statements
1 CAGR – Compounded Annual Growth Rate

P a g e | 4
These financing and investment decisions impact the capital adequacy ratios of the bank. In
recent years, the bank’s capital ratio to risk-weighted assets has been declining in recent years. This
suggests that Grameen is increasing its portfolio of risky assets faster than it is increasing capital. To
avoid this, Grameen should strive to earn and maintain profits.
In this paper, we will elaborate on what the increase in savings deposits and fixed-deposit
investments means for Grameen Bank today and in the future. We will explain how Grameen is pursuing
this strategy while other MFIs in Bangladesh are not. We will then explore the possible reasons behind
increasing financing from deposits as well as increasing investment in fixed-deposits and analyze its
impact on capital adequacy ratios. It will be shown that there are a variety of good reasons for increasing
savings deposits. However, the increase in fixed-deposits suggests a more mature market for microfinance
that will pose challenges for maintaining profits in the future. Ultimately, we will argue that these changes
have impacted Grameen’s capital adequacy and may require Grameen new strategies to improve capital
adequacy.

P a g e | 5
Increased Savings Deposits: A Changing
Funding Profile
Since the implementation of the Grameen Generalised System, Grameen has increased the
amount of savings deposits from members and non-members. These increases were the result of two
decisions made by the bank beginning in the mid-nineties. The first decision was to eliminate foreign
donations. In his book Banker to the Poor, Prof. Muhammad Yunus clearly lays out his aversion to
accepting donor money from foreign organizations such as the World Bank because of the degree to
which these foreign actors attempt to shape the operations of Grameen (Yunus, Banker to the Poor, p.
144). For most of its existence, the Grameen Bank financed its operations through borrower deposits,
loans from international organizations and banks, and from donations. Seeking greater independence from
the influence of foreign donors, Grameen stopped requesting donor money in 1995. The year 1998
marked the last year when Grameen received donor money (Yunus, Microcredit: Banking With the Poor
Without Collateral, 2006, p. 3). Since then, Grameen has relied almost entirely on borrower deposits and
local loans.
The second decision was to increase emphasis on non-member savings. In 2000, Grameen
incorporated a variety of new savings products targeted at members (i.e. borrowers) as well as non-
members (Wahab, 2003, p. 6). These products included the Grameen Pension Scheme as well as longer
term deposits such as the Double-in-7-years deposit scheme.
As Grameen abandoned foreign money and relied more on member and non-member savings, the
amount of deposits with the bank grew. The amount of total deposits increased from Tk 9.8 billion to Tk
68.3 billion2 between 2002 and 2008, representing an almost six-fold increase. However, over the same
time period, debt from other sources and equity remained relatively constant, as can be seen in Chart 1.
These changes resulted in Grameen funding itself more and more from depositor money only.
Chart 1: Grameen’s Historical Funding Profile
Source: Grameen Bank Audited Financial Statements
2 1 USD = 68 taka. All values pulled from the audited financial statements of the Grameen Bank from 2002 through 2008. Copies
are available online at www.grameen.com or in the annual reports.
-
5,000
10,000
15,000
20,000
25,000
30,000
35,000
2002 2003 2004 2005 2006 2007 2008
In million
Taka
Borrowings from Banks Member Deposits

P a g e | 6
A traditional retail bank accepts savings deposits from consumers to finance its operations. The
bank pays depositors for the right to use money by promising an interest payment. The bank then takes
the money it has acquired in savings accounts and lends the money to others. Borrowers are charged
interest rates on their loans that are higher than the interest rates on savings deposits. The difference
between the two interest rates, commonly referred to as a spread, is used to cover the operating expenses
of the bank.
Most MFIs do not function like traditional banks in that they rely on grants or low interest loans
from development agencies to lower the cost of borrowing. Now, without donor money, Grameen Bank is
attempting to survive on this spread between interest income and interest expense. Grameen borrows
money from members and non-members and promises interest rates ranging from 8.5% to 10.4%.
Without donations, Grameen needs to ensure that its money lending generates several percentage points
more than 10.5% in order to cover the cost of lending as well as any additional operational costs.

P a g e | 7
Increased Fixed-Deposits: Deployment of
Capital
In addition to increasing savings deposits, Grameen Bank also increased its investment in fixed
deposit accounts at Bangladeshi Banks between 2002 and 2008. During the period, the amount of total
investments grew from Tk 4.0 billion to Tk 28.7 billion, representing a six-fold increase.
Chart 2: Allocation towards Loans & Advances and Investments in FDs
Source: Grameen Bank Audited Financial Statements
With a current loan balance of Tk 45.5 billion and investments totaling Tk 28.7 billion, Grameen
is essentially investing 63 cents in banks for every $1 it lends to the poor. In 2002 the rate was closer to
46 cents. This is a much higher ratio than comparable MFIs and even some western banks. The table
below compares the investment-to-lending ratio of the Grameen Bank in 2007 with the rates of other
banks. As can be seen below, Grameen invests more per dollar-lent than its primary competitor MFIs and
more than many US Banks.
Table 2: 2007 Savings Deposits/Money Lent at Major Microfinance and American Banks
Grameen ASA BRAC Bank of
America
Wells
Fargo
Capital
One
Washington
Mutual
US
Bancorp
Financial
Service
Group
65% 6% 0% 64% 32% 32% 18% 22% 10%
Source: Audited financial statements in annual reports from all organizations.
0%
10%
20%
30%
40%
50%
60%
70%
80%
90%
100%
-
5,000
10,000
15,000
20,000
25,000
30,000
35,000
40,000
45,000
50,000
2002 2003 2004 2005 2006 2007 2008
Loans and Advances Investments in FDs
Growth in Loans Growth in FDs
P a g e | 8
Comparison with Other MFI Strategies
Grameen’s strategy of taking non-member deposits and investing heavily in local banks is not
currently being employed by other microfinance groups in Bangladesh. This is largely because Grameen
holds “Special Bank” status in Bangladesh, allowing Grameen to take deposits from non-borrowers.
Other MFIs without Special Bank status are only allowed to accept deposits from members. Without the
ability to leverage deposits and invest in fixed-deposits, Grameen’s main competitors in Bangladesh,
ASA and BRAC stay sustainable by lowering operating costs, offering lower interest rates to savers, and
charging higher interest rates to borrowers3. The largest difference in Grameen compared to ASA and
BRAC is the interest rates offered on savings and charged on loans. The Grameen Bank offers 10% flat
rate interest loans to its borrowers while BRAC and ASA offer closer to 12%. At the same time, BRAC
and ASA paying savings depositors much lower interest rates, roughly around 5%. Grameen, meanwhile,
offers 8.5% on savings deposits and around 10.5% for fixed deposit.
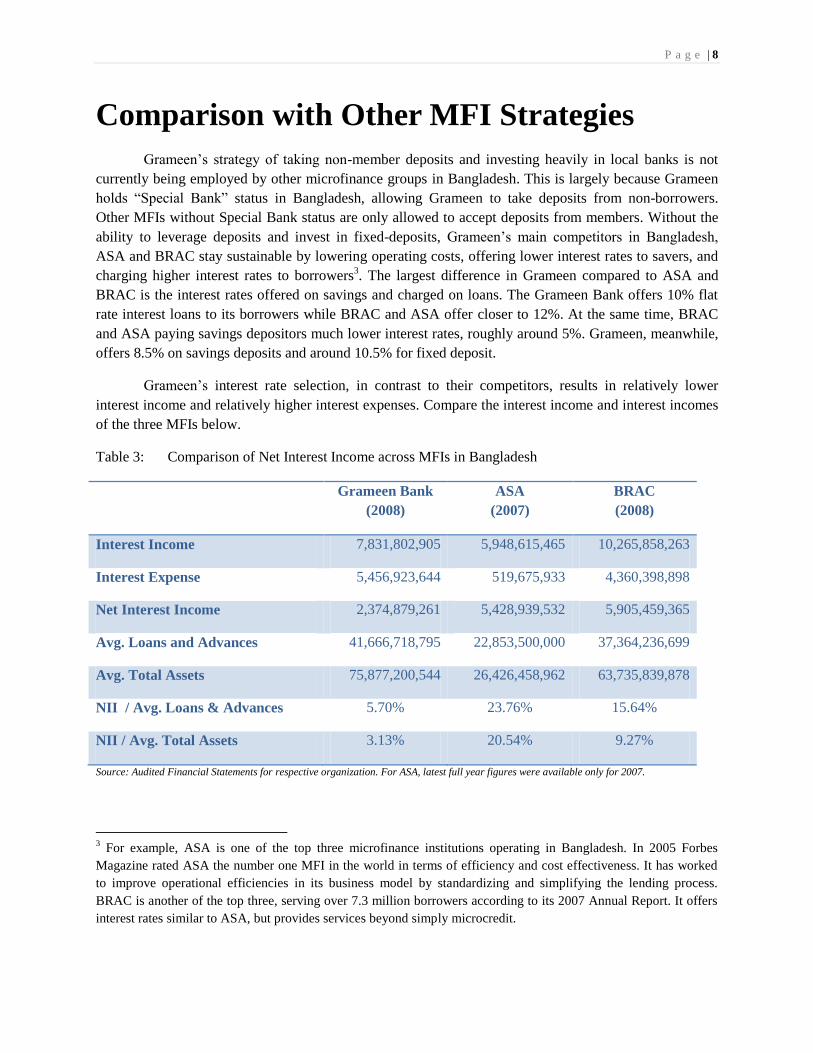
Grameen’s interest rate selection, in contrast to their competitors, results in relatively lower
interest income and relatively higher interest expenses. Compare the interest income and interest incomes
of the three MFIs below.
Table 3: Comparison of Net Interest Income across MFIs in Bangladesh
Grameen Bank
(2008)
ASA
(2007)
BRAC
(2008)
Interest Income 7,831,802,905 5,948,615,465 10,265,858,263
Interest Expense 5,456,923,644 519,675,933 4,360,398,898
Net Interest Income 2,374,879,261 5,428,939,532 5,905,459,365
Avg. Loans and Advances 41,666,718,795 22,853,500,000 37,364,236,699
Avg. Total Assets 75,877,200,544 26,426,458,962 63,735,839,878
NII / Avg. Loans & Advances 5.70% 23.76% 15.64%
NII / Avg. Total Assets 3.13% 20.54% 9.27%
Source: Audited Financial Statements for respective organization. For ASA, latest full year figures were available only for 2007.
3 For example, ASA is one of the top three microfinance institutions operating in Bangladesh. In 2005 Forbes
Magazine rated ASA the number one MFI in the world in terms of efficiency and cost effectiveness. It has worked
to improve operational efficiencies in its business model by standardizing and simplifying the lending process.
BRAC is another of the top three, serving over 7.3 million borrowers according to its 2007 Annual Report. It offers
interest rates similar to ASA, but provides services beyond simply microcredit.

P a g e | 9
Even though Grameen is lending more to its borrowers than BRAC and ASA, its interest income
is much lower than that of BRAC and only slightly higher than that of ASA. To an extent, this can be
attributed to that fact that Grameen charges a lower interest rate to borrowers compared to BRAC and
ASA.
Simultaneously, Grameen’s interest expense is significantly higher than that of BRAC and ASA.
In recent years, Grameen has increasingly tapped member and non-member deposits by offering high
deposit rates.
The above table also shows Net Interest Income as a percentage of Average Loan and Advances
and Average Total Assets. ASA’s lower base of assets and a relatively higher value of net interest income
give it the highest ratios. However, Grameen Bank’s lower net interest income and a huge balance sheet
result in much lower ratios.
The below chart shows Grameen’s dependence on deposits compared to its competitors.
Chart 3: Comparison of the funding composition for Grameen, ASA, and BRAC 2007
Source: Audited Financial Statements of respective organization
In 2007 Grameen Bank had deposits and other funds in excess of Tk 51 bn. This amount alone
was greater than the total value of the liabilities and equity of ASA and BRAC, valued at Tk 28.8 bn and
Tk 42.3 bn respectively. Grameen’s efforts to fund operations more through member and non-member
deposits has resulted in the organization taking on significantly more deposits than other MFIs in
Bangladesh.
If this is an effort to function more like a traditional bank, Grameen has achieved its objective and
more with regards to raising funds through deposits; in fact, the bank has even taken on more deposits
relative to total assets than some of the western banks.
-
10,000
20,000
30,000
40,000
50,000
60,000
70,000
80,000
Grameen 2007 ASA 2007 BRAC 2007
In millions TakaEquity Debt Deposits

P a g e | 10
Chart 4: Savings Deposits as a Percentage of Total Assets
Source: Audited Financial Statements of respective organization
0%
10%
20%
30%
40%
50%
60%
70%
80%
90%
Grameen Bank
2007
ASA 2007 BRAC 2007 IDF 2007 Bank of
America 2007
Wells Fargo
2008
Washington
Mutual 2006

P a g e | 11
Rationale for Grameen’s Financing Strategy
Grameen’s financing does assist the organization in achieving many of its stated objectives
through deposits of borrowers and domestic non-borrowers. First, it allows the Grameen Bank to remain
independent of foreign donations and foreign lenders. In interviews with officials at the Grameen Bank
and other MFIs, there is a general consensus that foreign donations and money have downsides. MFIs that
are dependent on donor money must listen and react to the whims of donors and lenders. As such, they
may not be able to run the MFI in a way that bests suits the interest of the poor.
Borrowing locally also allows the MFI to avoid foreign currency exposure risk. MFIs that do
borrow from foreign sources suffer gains or losses related to currency fluctuations if the loan terms
require repayment in a foreign currency. For example, let us say that a Bangladeshi MFI borrows money
from a foreign source in US dollars at 0% interest and promises to repay the loan in a year. If the value of
the US dollar increases 5% relative to the Bangladeshi Taka during the course of the year, then the
effective rate that the MFI will pay will be 5%. By borrowing locally, the MFIs avoid this currency
exposure.
Most importantly, the Grameen Bank’s interest rate spread allows the poor borrowers to keep
more of their money. With lower interest rates on the loans, the borrowers are able to keep more of their
profits. With higher interest rates on savings, members earn a greater return on their investments. The
strategy allows more money to go to the poorest of society.

P a g e | 12
Rationale for Grameen’s Investment Strategy
Grameen’s decision to deploy capital towards investments in fixed deposits rather than issuing
new loans begs the question “Why?”4 If Grameen is a bank with the stated objective of providing more
loans to the poor, why not use this money to provide more loans? Why does Grameen place a substantial
amount in fixed deposits? The following theories could explain the decision:
1. Expansion is a Slow Process: If it takes time to find a market for new lending, Grameen could be
placing money in investments until new opportunities open up. If this is the case, one would expect
the amount of investments to decrease and new loans to increase as soon as new borrowers are
identified.
Can new borrowers be identified? It is possible. Grameen does not yet have permission from the
Bangladesh government to provide loans to the poor within the urban areas of Dhaka and other cities
in the country. With Dhaka alone having a population of 12 million people, the area could offer a
couple more million borrowers. Loans provided to these borrowers would easily cover the extra cash
in deposits.
2. Maintain Liquidity: While Grameen may want to provide more loans, loans are not as liquid an asset
as fixed deposit accounts. In the event that Grameen needs cash – for example, the extreme event of a
run on the bank – it would be difficult for Grameen to collect on outstanding loans. Fixed deposits,
however, can simply be closed down and the entire value of the deposit withdrawn (less an
insignificant penalty fee at worst).
3. Market Saturation: It is possible that Grameen is reluctant to invest more money lending to the market
because the target market of reliable borrowers is oversaturated with microfinance loans. The market
is currently served by numerous MFIs. The Bangladesh Microcredit Regulatory Authority Act of
2006 required MFIs to apply for official status with the government by February 26, 2007. 4,236
separate organizations applied for certification and 705 are currently being considered. The
Bangladesh Bank also estimates an overlap rate of 40% of the 30 million outstanding loans in 2006
(Bangladesh Bank).
Some simple math based on population estimates further hints at market saturation of the
Bangladesh microfinance market. In 2008, the combined number of borrowers of Grameen, ASA, and
BRAC was roughly 23.03 million5. This is roughly one-seventh of the total population of 156 million
(CIA the World Factbook, 2009), but it is important to remember that the total population of
Bangladesh is not eligible for microcredit loans. Grameen, BRAC, and ASA borrowers must fulfill
two criteria: be poor and be female. If you limit the population to women and the poor, the
4 It is also important to note how Grameen Bank decides whether to invest in fixed-deposits or to lend more money. No branch
office ever makes this decision directly; they simply issue loans to as many borrowers as they can. At the end of the day, any cash
in excess of a predetermined amount is transferred to the higher offices. The head office is ultimately the one that decides to
invest in fixed deposits. 5 Borrowers estimates from BRAC Annual Report 2008, Grameen Monthly Reports on the Grameen Website, and ASA New
Vision newsletter.

P a g e | 13
microfinance market size in 2009 would be roughly 35 million. Limiting the number even further to
discount women aged 14 and younger and 60 and older, the total market size becomes 17.2 million.
The reported number of 23.03 million borrowers shared between the three major MFIs indicates that
they serve about 1.4 times the current market size6.
4. Operating Costs Associated with Deploying More Loans Make Loans Cost Prohibitive: Even if the
market is not saturated, the costs of setting up new loans may be cost prohibitive. Reaching new
groups of borrowers may require opening new branches and paying new employees. MFI lending is
typically more expensive than traditional banking. Although labor costs are lower than in western
countries, branches can be located far from urban centers. Moreover, loan officers must physically
travel to visit lenders in order to collect. It could be that the cost of setting up new banks is not
worthwhile.
5. Spread on Loans Alone is Not High Enough to Cover Operating Costs: The low interest rate on the
loans and the high interest rate on savings may not create a large enough spread to cover the operating
expenses of the Grameen Bank. Discovering whether or not this is true is difficult from audited
financial statements alone because Grameen’s financing supports two different income generating
activities: lending and investing. One cannot simply subtract investment income from net profit to
determine if lending alone is profitable because some portion of Grameen’s interest expense is
attributed to earning investment income. In order to get a more accurate estimate of the sustainability
of lending, the following steps were taken:
a. Interest income is still included as this income is derived from lending activities.
b. A weighted interest expense was created that takes into account only interest expense
associated with lending. Since a portion of Grameen’s financing supports investments in
fixed deposits, the entire interest expense cannot be used. Income expense multiplied by the
ratio of loans outstanding to total assets7.
c. Total operating expenses and are still used since it is assumed expenses associated with
investment are inconsequential. Investments in fixed-deposits are done at the headquarters of
Grameen and not at the branch level.
d. Loan loss provisions are still included as this is all generated from lending activities.
The below chart shows Grameen Net Profit with the above adjustments
6 Estimates of ratio of women and age based on census data from the Bangladesh Bureau of Statistics 7 The ratio of loans outstanding/total assets is used as an approximation.

P a g e | 14
Chart 5: Net Profit of Grameen Less Income from Investments with Weighted Interest Expense
Source: Grameen Bank Audited Financial Statements
This chart suggests that Grameen is not generating enough money from lending alone to cover
operating and financing expenses and that the bank has come to rely more and more on fixed deposits to
cover expenses.
Relying on income from fixed deposits to cover costs may pose challenges for Grameen going
forward. That is because commercial banks in Bangladesh have recently reduced interest rates on fixed
deposits and may do so again in the future.
Chart 6 provides more information about the trend in short and long-term interest rates over the
past two years. As can be seen, the interest rates at all maturities are significantly lower for the June 2009
period as compared to August 2007. It should be noted that the interest rate curve is upward sloping i.e.
shorter term maturities have lower interest rates compared to longer term maturities.
Chart 6: Bangladesh Bank interest rates trend
Source: Bangladesh Bank Website
(2,000)
(1,500)
(1,000)
(500)
0
500
2001 2002 2003 2004 2005 2006 2007 2008
Millions TakaNet Profit
3.0%
4.5%
6.0%
7.5%
9.0%
10.5%
12.0%
13.5%
15.0%
16.5%
91-day 182-day 364-day 5-year 10-year 15-year 20-year
Jun-09 Dec-08 Jun-08 Dec-07 Aug-07

P a g e | 15
In April 2009, the Central Bank of Bangladesh pressured commercial banks to cap interest
payments at 13% with many banks settling on fixed deposits between 9 and 9.5% (Islam, 2009). Lower
interest rates on fixed-deposits means lower profits for Grameen’s investments. With fixed deposit rates
closer to the cost of borrowing associated with borrower savings deposits, Grameen will not be able to
cover many more additional expenses beyond the cost of borrowing.
The current maturity structure of Grameen suggests that Grameen is not taking full advantage of
the highest interest rates offered by longer term investments. Table 4 compares the maturity structure of
Grameen’s investments in 2003 with 2008. In 2003, more than 20% of its investments were in maturities
over 1 year, whereas currently only 1% of its investments have a maturity of over 1 year. This has now
been replaced by increased investments in the maturities of <3 months (now representing 25% of
portfolio). It may seem that most of the long-medium term investments from 2003 are now maturing (and
therefore the increased level of investments in the near term maturities). However, with just 1% of the
investment in the longer term maturities in 2008, this seems to be a conscious strategy from Grameen’s
perspective to invest more in the near term maturities. This trend does not seem to be favorable for
Grameen given that the interest rates in the shorter maturities are a lot lower than those in the more than 1
year maturity (see Chart 6).
Table 4: Maturity Structure of Investment Portfolio
2003 2008
< 1 month 4% 11%
>1 and <3 months 5% 14%
>3 and <1 year 71% 74%
>1 year and < 5 years 20% 1%
Total value Tk 5.3 billion Tk 28.7 billion
Five theories have been explored for why Grameen is investing in fixed-deposits. The first two
theories would be the best case scenarios for Grameen. Either the current investment decisions are a
temporary necessity before more loans are deployed or a permanent necessity to maintain liquidity. The
other three theories hint at a more challenging future for Grameen Bank. Only the directors of Grameen
can explain the reasons behind their decisions. If the latter three theories are the cause, Grameen will need
to investigate strategies for remaining profitable with higher costs, lower returns on investment, and a
saturated, mature market.

P a g e | 16
Impact of Grameen’s Strategy on Capital
Adequacy
Regardless of the rationale for the strategy, the increase in member and non-member savings
coupled with increased fixed-deposits has made Grameen less solvent than in past years. One of the most
important measures of the solvency and stability of traditional banks is the level of total capital balances
relative to assets. The Total Capital ratio is a comparison of capital with risk-weighted assets, and not
total assets8. Under risk-weighted assets, various assets such as cash, loans, investments, etc. are allotted
different weights based on their level of riskiness with riskier assets receive a higher weighting. This
method is followed under the Basel I and II capital standards. All regulatory institutions require banks
that are under their supervision to report these capital adequacy ratios and maintain them at certain
required levels.
Grameen’s performance in this ratio has declined in recent years. At this time Grameen is not
required to adhere to any strict capital requirements that would mandate a minimum capital ratio.
However, Grameen sets its required capital to risk weighted assets at a minimum of 10%9. Chart 7 shows
Grameen’s Total Capital ratio has declined steadily ever since the bank experienced tremendous growth
in fixed deposits and loans backed by a large increase in non-member deposits. While Grameen’s Total
Capital ratio has not passed the minimum desired capital ratio of 10%, it is likely if annual growth rates of
RWAs and Total Capital continue at their current rate.
Chart 7: Grameen Bank Total Capital Ratio
Source: Grameen Bank Audited Financial Statements
The below chart depicts the annual growth in the values of RWAs and Total Capital. Over 2003-
08, Grameen’s RWAs grew at 23% CAGR per annum, while Total Capital grew only at 12% CAGR.
8 Total Capital Ratio = { Tier 1 Capital (Core Capital) + Tier 2 Capital (Supplementary Capital)} / Risk Weighted Assets
19.30%
16.51%
13.41%14.38%
12.43% 12.02%
5%
10%
15%
20%
2003 2004 2005 2006 2007 2008
Total Capital Ratio
Minimum Desired Capital Ratio
10%

P a g e | 17
Chart 8: Annual Growth in Risk-Weighted Assets and Total Capital
Source: Grameen Bank Audited Financial Statements
If RWAs do continue to grow at a faster rate than total capital, the amount of RWAs will exceed a
threshold and the Total Capital Ratio will drop below 10%.
Keeping the Total Capital Ratio above 10% would require decreasing RWAs or increasing
Capital. Since Grameen is in the business of lending to the poor, decreasing RWAs is unlikely in the
future. This leaves Grameen with the option of increasing Capital. Understanding how to increase capital
requires understanding what constitutes Capital.
Chart 9 provides the composition of Grameen’s Total Capital while Table 4 gives the breakdown
of capital and other reserves in 2008.
Chart 9: Composition of Total Capital
Source: Grameen Bank Audited Financial Statements
22%
33%
26%
15%
21%
5%8%
35%
-1%
17%
-5%
0%
5%
10%
15%
20%
25%
30%
35%
40%
2004 2005 2006 2007 2008
Growth in RWAs Growth in Total Capital
0%
10%
20%
30%
40%
50%
60%
70%
80%
90%
100%
2003 2004 2005 2006 2007 2008
6% 7% 6% 5% 5% 4%
94% 90% 85%82% 79% 74%
0% 4% 8% 12% 15% 20%General Provisions
Retained Surplus
Capital and Other Reserves
Paid up Capital

P a g e | 18
Table 4: Breakdown of Capital and Other Reserves as at December 2008
In million Taka 2008 Addition in 2008 Percentage of Total
Capital Reserve 4,280,410 0 71.7%
General Reserve 1,044,000 716,000 17.5%
Proposed Dividend 107,400 43,800 1.8%
Dividend Equalization Fund 421,854 -244,146 7.1%
Other Reserves 115,773 0 1.9%
TOTAL 5,969,437,278 515,654
Source: Grameen Bank Audited Financial Statements 2008
As seen in the above chart and table, the two major contributors to Capital and Other Reserves are
Capital Reserve and General Reserve. Capital and Other Reserves contribute >70% to total capital from
2003 until 2008. During this time the General Provisions have increased in size over the years.
The Capital Reserve constitutes more than 70% of the total of Capital and Other Reserves
account, and according to the 2008 Notes to Financial Statements, a majority portion of the Capital
Reserve represents revolving funds and grants that are no longer refundable. So, this seems to represent
funds that would permanently remain with Grameen. Most importantly, this means these funds are not
likely to grow.
General Reserve is the other account which Grameen can increase in value in order to solidify its
capital base. The contributions to General Reserve are from apportionments made from Net Profits earned
in any particular year. Growing Capital, therefore, requires that Grameen earn and retain profits year over
year.

P a g e | 19
Recommendations to Improve Profitability
and Capital Adequacy
If Grameen attempts to increase capital in order to maintain and strengthen its capital base it
would have to increasingly contribute to the General Reserve (via its income statement). This requires
greater profitability on the part of the bank.
There are several strategies that would enable Grameen to strengthen its capital ratios, either by
improving profitability or through other means:
1. Decrease dividend payments
Since 2006 Grameen has offered generous dividend payments to shareholders. In the first year
Grameen offered a 100% dividend payment. In subsequent years it lowered to 20% and 30%. While
popular among shareholders, repeated large dividend payments increase Grameen’s cost of capital.
Compare below a hypothetical situation in which Grameen issues sells Tk 100 worth of shares
and issues Tk 100 worth of debt. The interest on the debt will be 17%. In years 1, 2, and 3, Grameen will
offer dividend payments identical to those paid in 2006, 2007, and 2008 (100%, 20%, and 30%). Netting
the values of the cash flows in both cases yields -50. Essentially, the affect of the equity was the
equivalent of a loan with 17% annual interest.
Year 0 Year 1 Year 2 Year 3 Net Value
Loans 100 -17 -17 -117 -50
Equity 100 -100 -20 -30 -50
Grameen must also be wary of paying out additional dividend payments year over year in the
event that it issues new shares. Excessive payments will further drive up the cost of capital.
2. Widen the spread on loans and deposits
This solution would likely be the most controversial for Grameen Bank. For many years Grameen
has prided itself on the more favorable interest rates that it offers to borrowers. However, if the core
business of Grameen is unsustainable, the organization will always encounter problems with profitability.
If Grameen borrows and loans at a loss, it will always require additional sources of income. It will need to
generate enough money to cover the loss associated with lending in addition to any expenses incurred
while pursuing side businesses.
Increasing the spread would require Grameen to either increase the interest rates on loans or
lower the interest on savings deposits. Lowering interest paid on savings may be the least controversial
way of achieving this objective. Grameen could limit the number of high interest savings deposits that it
offers.

P a g e | 20
It is worth noting that an adjustment of interest rates does not indicate a failure of microfinance.
The value of the interest rates does not affect the core tenant of microfinance – that poor people can be
relied on to repay loans.
3. Equity Investments
Interest rates on fixed deposits may have declined, but Grameen may be able to find comparable
returns by taking equity investments in other companies. Grameen Phone famously provided a wonderful
return to Grameen and other Grameen organizations that had shares in the joint venture. While every
equity investment cannot be expected to perform as well, equity investments would offer the potential of
greater returns, in addition to the social benefit of improving industry within Bangladesh.
4. Microenterprise Loans
Since adopting the Grameen Generalised System earlier this decade, Grameen has increased its
focus on providing microenterprise loans. These loans have a much higher average loan value (between
Tk 15,000 – 50,000) compared to the traditional microfinance loan (Tk 5,000).
Grameen’s microenterprise loan portfolio has grown at a CAGR of 113% between June 2002 and
June 2009. Over this period, Grameen has disbursed loans worth Tk 47.5 billion and collected worth Tk
37.5 billion.
The below chart shows the Number of Loans Disbursed and the Average Value of Loans
Disbursed over six month intervals between Dec’02 and Jun’09. As can be seen, the number of loans
disbursed during each such interval has increased from about 110,000 to 250,000 over this period, with a
simultaneous increase in the average value of loans disbursed from about Tk 22,000 to Tk 30,000.
Chart 7: Analysis of Grameen’s Microenterprise Loans
Source: Monthly Reports on Grameen Bank Website
Grameen should continue to focus on these microenterprise loans in order to boost it interest
income and thereby its profitability. However, increase in this loan portfolio will cause a concurrent
increase in Grameen’s RWAs and thereby may affect its capital ratios negatively. Further analysis in this
regard is recommended.
15,000
18,000
21,000
24,000
27,000
30,000
-
50,000
100,000
150,000
200,000
250,000
300,000
Dec
-02
Jun
-03
Dec
-03
Jun
-04
Dec
-04
Jun
-05
Dec
-05
Jun
-06
Dec
-06
Jun
-07
Dec
-07
Jun
-08
Dec
-08
Jun
-09
Number of Loans Disbursed (LHS)

P a g e | 21
5. Paid-up Capital
Issuing new shares to the poor would also help Grameen generate additional capital. The
Ordinance under which Grameen Bank was established restricted Grameen’s authorized capital to Tk 500
million. However, it was only recently, in 2008, that Grameen was able to convince the government that it
required an increase of its authorized capital limit to Tk 3,500 million. This had become imperative
because Grameen had grown its member base from about 2.3 million in 1999 to 7.7 million in 2008.
Grameen provides an option to all its members to purchase shares of Grameen Bank – at a
nominal price of Tk 100 per share. The members also have an option to purchase more than one share if
they so desire. With an authorized capital limit of Tk 500 million, Grameen would have been able to
satisfy the demand for shares of a maximum of 5 million members, a figure that it crossed in 2005. With a
membership of more than 7 million now, Grameen convinced the government to allow an increase in its
authorized capital limit.
Thus, Grameen Bank can now increase its paid-up capital by issuing shares to its new members
or existing members who have not had a chance to participate in the share program. This would also
enable Grameen to shore up its capital based and thereby improve its capital ratios.
Conclusion
Grameen’s capital adequacy ratio indicates that Grameen does not face immediate or impending
solvency trouble, but it does urge caution. Given the maturing market, Grameen’s current strategy will
decrease the capital ratio below the 10% minimum in the coming years. Avoiding this would require
redefining its financing and investing strategies given changing circumstances. It means identifying a
strategy that will allow the bank to maintain sufficient levels of solvency. Several strategies to improve
solvency have been recommended, but the list of solutions is by no means exhaustive. Grameen should
consider the above recommendations while brainstorming other innovative approaches to addressing the
profitability of the bank. Improving profitability will ultimately benefit the poor – Grameen’s
shareholders and customers.
P a g e | 22
Bibliography
ASA. (2008). New Vision October-December 2008. Dhaka.
Bangladesh Bank. (n.d.). Retrieved July 21, 2009, from http://www.bangladesh-bank.org/
Bangladesh Bureau of Statistics. (2007, July 11). Bangladesh Data Sheet. Retrieved July 21, 2009, from
Bangladesh Bureau of Statistics: http://www.bbs.gov.bd/
CIA the World Factbook. (2009, June 26). Retrieved July 21, 2009, from
https://www.cia.gov/library/publications/the-world-factbook/geos/BG.html
Islam, S. (2009, June 21). All Headline News. Retrieved July 21, 2009, from
http://www.allheadlinenews.com/articles/7015558704
Monthly Report Archive. (2009, July 9). Retrieved July 21, 2009, from Grameen Bank:
http://www.grameen-info.org/
Morduch, B. A. (2005). The Economics of Microfinance. Cambridge: The MIT Press.
S.F. Ahmed and Co. (2009, March 17). Independent Auditor Report BRAC 2008. Dhaka, Bangladesh.
Wahab, A. H. (2003). Introduction to Grameen II. Dhaka: Grameen Bank.
Yunus, M. Banker to the Poor.
Yunus, M. (2006). Microcredit: Banking With the Poor Without Collateral. Dhaka: Grameen Bank.