FINANCE - iseg.ulisboa.pt
35
MASTER OF SCIENCE IN FINANCE MASTERS FINAL WORK PROJECT EQUITY RESEARCH: NIKE, INC DAVID TENREIRA DIAS MARQUES SILVA OCTOBER 2019
Transcript of FINANCE - iseg.ulisboa.pt
MASTER OF SCIENCE IN
FINANCE
MASTERS FINAL WORK
PROJECT
EQUITY RESEARCH: NIKE, INC
DAVID TENREIRA DIAS MARQUES SILVA
OCTOBER 2019
MASTER OF SCIENCE IN
FINANCE
MASTERS FINAL WORK
PROJECT
EQUITY RESEARCH: NIKE, INC
DAVID TENREIRA DIAS MARQUES SILVA
SUPERVISOR:
PROFESSORA DOUTORA ANA ISABEL ORTEGA VENÂNCIO
OCTOBER 2019
i
Abstract
This project contains the detailed valuation and the respective estimation of Nike, Inc
intrinsic shares value for the fiscal 2020YE, according to ISEG´s Master in Finance
final work project.
The choice of Nike, Inc comes from my personal interest in footwear and sports
apparel, and mainly from Nike products, which I´ve been using and wearing since my
childhood days. The price target was obtained through an absolute valuation model,
more specifically, the Discounted Cash Flow (DCF) model. In addition, we used the
Relative Valuation approach as a complement method to support the final
recommendations, and the Dividend Discount Model (DDM), with the purpose of
obtaining the price target based on the discount of future dividends, since the company
has an attractive dividend policy for investors, but with the limitation of a conservative
payout ratio, resulted in a sell recommendation and unrealistic price target.
A sensibility analysis was performed in order to complement and support the investing
recommendation. With a price target of $88.66 at fiscal 2020 YE, an upside potential
of 15.23% relative to the price on May 31st 2019, our final recommendation for Nike,
Inc shares is to BUY, taking into consideration the risks that may occur and affect the
company´s performance.
ii
Resumo
Este projeto contém uma avaliação detalhada e respetiva estimativa do valor das
açõoes da Nike, Inc para o final do ano fiscal de 2020, tendo em conta o projeto final
do Mestrado em Finanças do ISEG.
A escolha da empresa Nike, Inc deriva do meu gosto pessoal por ténis e roupa de
desporto, especialmente da marca Nike, que eu tenho vindo a usar desde os meus
tempos de criança. O preço-alvo foi obtido através de um modelo absoluto de
avaliação, mais concretamente, o método do Flow to Equity (FTE). Adicionalmente,
usámos o método de avaliação relativa, de maneira a complementar a decisão do
método anterior e usámos ainda o método de Desconto de Dividendos, com o intuito
de obter um preço-alvo baseado no desconto de dividendos futuros, uma vez que a
empresa tem uma politica de dividendos atraente para os investidores, mas com a
limitação de uma conservadora taxa de pagamento de dividendos, resultou numa
recomendação de venda e um preço-alvo irrealista.
Foi realizada uma análise de sensibilidades de maneira a complementar e dar apoio
à decisão de investimento. Com um preço alvo de $88.66 no FA fiscal de 2020, um
potential de valorização de 15.23% em relação ao preço em 31 de Maio de 2019, a
nossa recomendação final é de compra das ações da Nike, tendo em consideração
os riscos que poderão ocorrer e afetar o desempenho da empresa.
iii
Acknowledgements
The realization of this project was one of my biggest achievements and represented
the end of the most important academic stage that I´ve ever had. I would like to thank
to all the persons that had a relevant role along this journey.
First, to Professor Ana Venâncio for the guidance, time and patience that had for me
during the realization of this project.
Secondly, to my parents that were always supportive and helped me kept motivated.
And Last but not least, to my friends for the support during this journey.
iv
Index
Abstract i
Resumo ii
Acknowledgements iii
Index iv
List of Figures v
List of Tables vi
1. Research Snapshot 1
2. Business Description 2
3. Management and Corporate Governance 5
4. Industry Overview and Competitive Positioning 7
5. Investment Summary 12
6. Valuation 13
7. Financial Analysis 16
8. Investment Risks 17
Appendices 20
Appendix 1: Statement of Financial Position 20
Appendix 2: Income Statement 20
Appendix 3: Common-Size Statement of Financial Position 21
Appendix 4: Common-Size Income Statement 21
Appendix 5: Assumptions for Balance Sheet 22
Appendix 6: Assumptions for Income Statement 22
Appendix 7: Cash Flow Statement 23
Appendix 8: Key Financial Ratios 24
Appendix 9: Net Working Capital 25
Appendix 10: D&A, CAPEX, PP&E and Other Assets 25
References 26
v
List of Figures
Figure 1. Nike Shares Price Movement 1
Figure 2. Sales by Region 2
Figure 3. Sales by Distribution Channel 2
Figure 4. Sales by Product 2
Figure 5. Total Revenues 3
Figure 6. Nike´s EBIT 3
Figure 7. Nike´s EPS 3
Figure 8. Board Overview by Gender 5
Figure 9. Board Overview by Ethnic 5
Figure 10. Board Overview by Age 5
Figure 11. Board Overview by Tenure 5
Figure 12. Types of Shareholders 6
Figure 13. China GDP Growth 7
Figure 14. China Inflation Rate 8
Figure 15. U.S GDP growth 8
Figure 16. U.S Inflation Rate 8
Figure 17. Global GDP Growth 9
Figure 18. Global Inflation rate 9
Figure 19. Consumers by Age 9
Figure 20. Consumers by Income 9
Figure 21. Marketing expenses 10
Figure 22. Porter´s Five Forces 11
Figure 23. Change YoY on total weight of Revenues, by region 12
Figure 24. Total revenues forecasted (M$) 13
Figure 25. Proportion of sales by region in the forecasted period 14
Figure 26. Nike capital expenditures 14
Figure 27. Weighted of equity in the capital structure 15
Figure 28. Dividends (M$) 16
Figure 29. EBIT and Net Income (M$) 16
Figure 30. ROA and ROE (%) 17
Figure 31. Liquidity Ratios 17
Figure 32. Risk Matrix 17
vi
List of Tables
Table 1. Analyst´s Risk Assessment 1
Table 2. Market Profile 1
Table 3. Valuation Output 1
Table 4. Top 10 Institutional Shareholders 6
Table 5. Fiscal 2019 Salary of Named Executive Officers 7
Table 6. SWOT analysis 11
Table 7. Valuation Summary 12
Table 8. DCF Method 13
Table 9. EV/EBITDA Output 15
Table 10. EV/Sales Output 15
Table 11. P/E Output 16
Table 12. DDM Method 16
Table 13. Sensitivity analysis: Perpetuity WACC and Growth Rate 19

1
Nike, Inc: Leveraging the power of Mobile
(YE2020 Price Target of $88.66 (+15.23%); recommendation is to Buy)
We initiate a BUY recommendation for Nike, Inc with a fiscal 2020YE price
target of $88.66 using the Discounted Cash Flow model, implying a 15.23%
upside potential from the May 31st 2019 closing price of $76.94. The relative
valuation through multiples support our recommendation. On the other hand, the
Dividend Discount Model recommends to sell. The potential downside from the
last model arises from the conservative assumption of dividend payout ratio.
Nike is the leading footwear and sports apparel company, with a market share of
35%. As global inflation decreases, CPI levels are rising and purchasing power
has become one of Nike´s main growth driver. The other main growth driver is
the expansion of E-commerce in China.
Nike will grow revenues in all its four regions and increase margins in China. The
company will develop and expand its Digital App in more countries, reinforce
relationships with Chinese retail partners and sponsor China´s top athletes in
order to increase participation in sport and fitness in that region. The
combinations of these strategies with the macroeconomic prospects in U.S,
China and the global outlook, result in total revenues increase at a CAGR of
8.56% between 2019-24F.
The company has a solid financial position, mainly resulted from the overall
increase in demand. Nike is mostly financed with equity (71%) and it has the
ability to generate positive operating cash flows. The combination of these two
factors leave the company with margins to allow investments in manufacturing
capabilities (CAPEX) and to increase its advertising costs, in order to gain more
market share.
The main risk issues of Nike are related to failure in delivering products that
satisfy consumers constant changing preferences, macroeconomic factors that
may lead to a decrease in the purchasing power of consumers, and political
instability, related to trade wars and regulation, that may lead to a slowdown in
production, and a consequent increase in the selling price of products.
1. Research Snapshot
Market Profile
Previous Close $ 93.88
Open price $ 94.20
Volume 1,257,584
52 Week High $ 95.25
52 Week Low $ 66.53
Shares Out (MIL) 1,561.05
Market Cap (MIL) $ 146,551.60
Dividend (Yield %) 0.94
Low Medium High
Valuation YE 2020 TP Potential
DCF $ 88.66 15.23%
Multiples $ 79.45 3.26%
DD Model $ 27.78 -63.90%
Nike, Inc
Buy Medium risk
15 October 2019
U.S
Source: Reuters
Table 1 - Analyst´s Risk Assessment
Table 2 – Market Profile
Source: Author
Source: Author, Reuters Data
Figure 1 – Nike Shares Price Movement
Table 3 – Valuation Output
Source: Author

2
Nike, Inc is an American multinational corporation, founded in 1967 and based
in Oregon, United States of America. Nike is traded in the New York Stock
Exchange (NYSE) with the NKE symbol and its main business activity is the
design, development, marketing and selling of athletic footwear, apparel,
equipment, accessories and services. It is the world´s largest supplier of athletic
shoes and apparel. The company has approximately 76,700 employees
worldwide, including retail and part-time employees and sell its products through
Nike-owned retail stores and through digital platforms. Its portfolio brand consists
of NIKE, Jordan, Hurley and Converse.
Key Brands
NIKE is the main brand and designs athletic footwear and apparel primarily for
athletic use, although a large percentage of products are worn for casual
purposes. Nike does also design shoes and apparel for outdoor activities like golf,
tennis, baseball, soccer, volleyball, bicycling, cheerleading, wrestling, aquatic
activities, hiking and other athletic uses. Regarding equipment, Nike brand sells
a line of performance equipment that includes sport balls, skates, eyewear,
gloves, bats and other equipment designed for sports activities. Nike is also
selling accessories like timepieces and electronic media devices.
Jordan Brand, is responsible for designing, distributing and licensing footwear,
apparel and accessories usually focused on basketball using the Jumpman
trademark, its sales are reported within the respective Nike brand geographic
operating segments.
Converse, a company purchased by Nike on September 4, 2003, is a wholly-
owned subsidiary brand headquartered in Boston, Massachusetts, designs and
distributes athletic and casual footwear, apparel, and accessories under the
Converse, Chuck Taylor, All Star, One Star, Star Chevron and Jack Purcell
trademarks. Converse brand sales are reported on a stand-alone basis.
Hurley International LLC is another wholly-owned subsidiary, headquartered in
Costa Mesa, California and is responsible for designing and distributing a line of
action sports apparel for surfing, skateboarding, snowboarding and youth lifestyle
apparel and footwear under the Hurley trademark. Its sales are included in the
Nike brand´s North America geographic operating segment.
Business Units
Nike brand products are offered in six key categories: Running, Nike Basketball,
the Jordan brand, Football, Training and Sportswear.
Sportswear, Running and the Jordan brand are currently the top-selling footwear
categories while Sportswear, Training and Running are the top-selling apparel
categories and the company expects these categories to keep on leading its
sales.
Although Nike brand offers these six categories, they report its sales by major
product line: Footwear, Apparel and Equipment, which contributed, in 2019,
with 65%, 31% and 4% for the total Nike brand revenues, respectively.
Footwear – In 2019, footwear revenues increased by 12% due to growth in nearly
all key categories, led by Sportswear. Unit sales increased by 8% and a higher
average selling price (ASP) per pair generated 4% of footwear revenue growth.
For this product line the company was supplied by 112 footwear factories located
2. Business Description
Figure 2 – Sales by Region
Source: Author, Company Data
Figure 3 – Sales by Distribution Channel
Source: Author, Company Data
Figure 4 – Sales by Product
Source: Author, Company Data
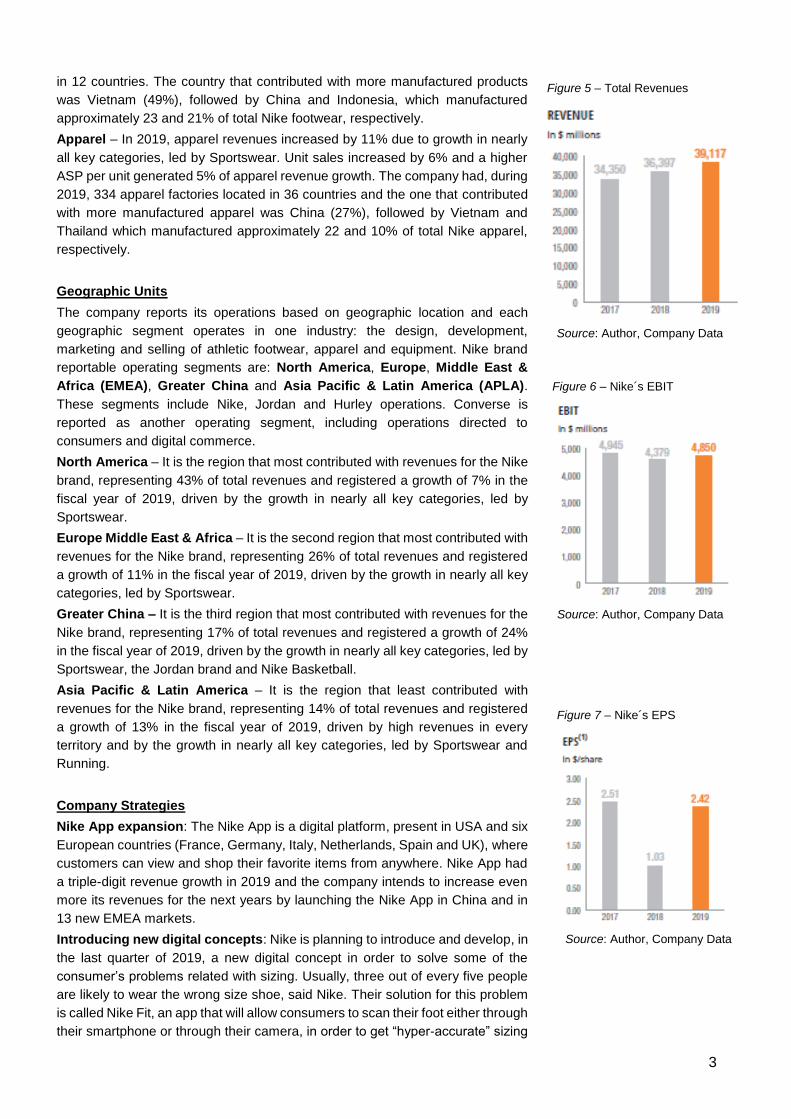
3
in 12 countries. The country that contributed with more manufactured products
was Vietnam (49%), followed by China and Indonesia, which manufactured
approximately 23 and 21% of total Nike footwear, respectively.
Apparel – In 2019, apparel revenues increased by 11% due to growth in nearly
all key categories, led by Sportswear. Unit sales increased by 6% and a higher
ASP per unit generated 5% of apparel revenue growth. The company had, during
2019, 334 apparel factories located in 36 countries and the one that contributed
with more manufactured apparel was China (27%), followed by Vietnam and
Thailand which manufactured approximately 22 and 10% of total Nike apparel,
respectively.
Geographic Units
The company reports its operations based on geographic location and each
geographic segment operates in one industry: the design, development,
marketing and selling of athletic footwear, apparel and equipment. Nike brand
reportable operating segments are: North America, Europe, Middle East &
Africa (EMEA), Greater China and Asia Pacific & Latin America (APLA).
These segments include Nike, Jordan and Hurley operations. Converse is
reported as another operating segment, including operations directed to
consumers and digital commerce.
North America – It is the region that most contributed with revenues for the Nike
brand, representing 43% of total revenues and registered a growth of 7% in the
fiscal year of 2019, driven by the growth in nearly all key categories, led by
Sportswear.
Europe Middle East & Africa – It is the second region that most contributed with
revenues for the Nike brand, representing 26% of total revenues and registered
a growth of 11% in the fiscal year of 2019, driven by the growth in nearly all key
categories, led by Sportswear.
Greater China – It is the third region that most contributed with revenues for the
Nike brand, representing 17% of total revenues and registered a growth of 24%
in the fiscal year of 2019, driven by the growth in nearly all key categories, led by
Sportswear, the Jordan brand and Nike Basketball.
Asia Pacific & Latin America – It is the region that least contributed with
revenues for the Nike brand, representing 14% of total revenues and registered
a growth of 13% in the fiscal year of 2019, driven by high revenues in every
territory and by the growth in nearly all key categories, led by Sportswear and
Running.
Company Strategies
Nike App expansion: The Nike App is a digital platform, present in USA and six
European countries (France, Germany, Italy, Netherlands, Spain and UK), where
customers can view and shop their favorite items from anywhere. Nike App had
a triple-digit revenue growth in 2019 and the company intends to increase even
more its revenues for the next years by launching the Nike App in China and in
13 new EMEA markets.
Introducing new digital concepts: Nike is planning to introduce and develop, in
the last quarter of 2019, a new digital concept in order to solve some of the
consumer’s problems related with sizing. Usually, three out of every five people
are likely to wear the wrong size shoe, said Nike. Their solution for this problem
is called Nike Fit, an app that will allow consumers to scan their foot either through
their smartphone or through their camera, in order to get “hyper-accurate” sizing
Figure 5 – Total Revenues
Source: Author, Company Data
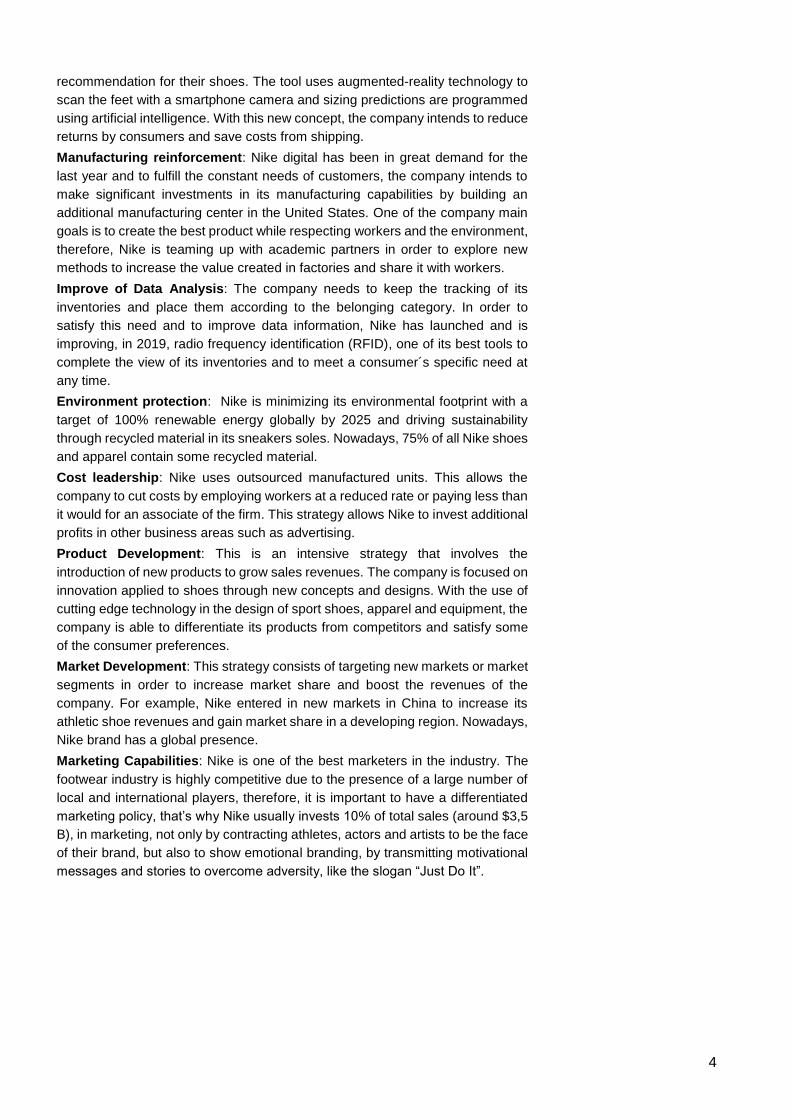
Figure 6 – Nike´s EBIT
Source: Author, Company Data
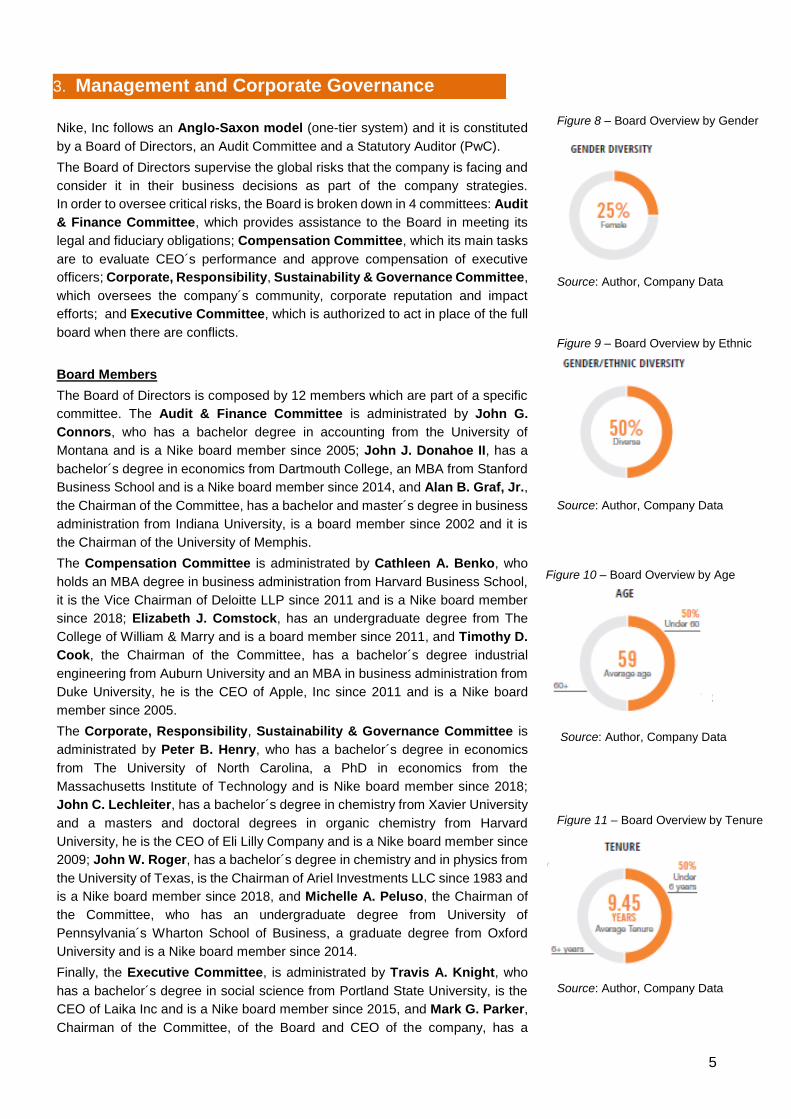
Figure 7 – Nike´s EPS
Source: Author, Company Data
4
recommendation for their shoes. The tool uses augmented-reality technology to
scan the feet with a smartphone camera and sizing predictions are programmed
using artificial intelligence. With this new concept, the company intends to reduce
returns by consumers and save costs from shipping.
Manufacturing reinforcement: Nike digital has been in great demand for the
last year and to fulfill the constant needs of customers, the company intends to
make significant investments in its manufacturing capabilities by building an
additional manufacturing center in the United States. One of the company main
goals is to create the best product while respecting workers and the environment,
therefore, Nike is teaming up with academic partners in order to explore new
methods to increase the value created in factories and share it with workers.
Improve of Data Analysis: The company needs to keep the tracking of its
inventories and place them according to the belonging category. In order to
satisfy this need and to improve data information, Nike has launched and is
improving, in 2019, radio frequency identification (RFID), one of its best tools to
complete the view of its inventories and to meet a consumer´s specific need at
any time.
Environment protection: Nike is minimizing its environmental footprint with a
target of 100% renewable energy globally by 2025 and driving sustainability
through recycled material in its sneakers soles. Nowadays, 75% of all Nike shoes
and apparel contain some recycled material.
Cost leadership: Nike uses outsourced manufactured units. This allows the
company to cut costs by employing workers at a reduced rate or paying less than
it would for an associate of the firm. This strategy allows Nike to invest additional
profits in other business areas such as advertising.
Product Development: This is an intensive strategy that involves the
introduction of new products to grow sales revenues. The company is focused on
innovation applied to shoes through new concepts and designs. With the use of
cutting edge technology in the design of sport shoes, apparel and equipment, the
company is able to differentiate its products from competitors and satisfy some
of the consumer preferences.
Market Development: This strategy consists of targeting new markets or market
segments in order to increase market share and boost the revenues of the
company. For example, Nike entered in new markets in China to increase its
athletic shoe revenues and gain market share in a developing region. Nowadays,
Nike brand has a global presence.
Marketing Capabilities: Nike is one of the best marketers in the industry. The
footwear industry is highly competitive due to the presence of a large number of
local and international players, therefore, it is important to have a differentiated
marketing policy, that’s why Nike usually invests 10% of total sales (around $3,5
B), in marketing, not only by contracting athletes, actors and artists to be the face
of their brand, but also to show emotional branding, by transmitting motivational
messages and stories to overcome adversity, like the slogan “Just Do It”.
5
Nike, Inc follows an Anglo-Saxon model (one-tier system) and it is constituted
by a Board of Directors, an Audit Committee and a Statutory Auditor (PwC).
The Board of Directors supervise the global risks that the company is facing and
consider it in their business decisions as part of the company strategies.
In order to oversee critical risks, the Board is broken down in 4 committees: Audit
& Finance Committee, which provides assistance to the Board in meeting its
legal and fiduciary obligations; Compensation Committee, which its main tasks
are to evaluate CEO´s performance and approve compensation of executive
officers; Corporate, Responsibility, Sustainability & Governance Committee,
which oversees the company´s community, corporate reputation and impact
efforts; and Executive Committee, which is authorized to act in place of the full
board when there are conflicts.
Board Members
The Board of Directors is composed by 12 members which are part of a specific
committee. The Audit & Finance Committee is administrated by John G.
Connors, who has a bachelor degree in accounting from the University of
Montana and is a Nike board member since 2005; John J. Donahoe II, has a
bachelor´s degree in economics from Dartmouth College, an MBA from Stanford
Business School and is a Nike board member since 2014, and Alan B. Graf, Jr.,
the Chairman of the Committee, has a bachelor and master´s degree in business
administration from Indiana University, is a board member since 2002 and it is
the Chairman of the University of Memphis.
The Compensation Committee is administrated by Cathleen A. Benko, who
holds an MBA degree in business administration from Harvard Business School,
it is the Vice Chairman of Deloitte LLP since 2011 and is a Nike board member
since 2018; Elizabeth J. Comstock, has an undergraduate degree from The
College of William & Marry and is a board member since 2011, and Timothy D.
Cook, the Chairman of the Committee, has a bachelor´s degree industrial
engineering from Auburn University and an MBA in business administration from
Duke University, he is the CEO of Apple, Inc since 2011 and is a Nike board
member since 2005.
The Corporate, Responsibility, Sustainability & Governance Committee is
administrated by Peter B. Henry, who has a bachelor´s degree in economics
from The University of North Carolina, a PhD in economics from the
Massachusetts Institute of Technology and is Nike board member since 2018;
John C. Lechleiter, has a bachelor´s degree in chemistry from Xavier University
and a masters and doctoral degrees in organic chemistry from Harvard
University, he is the CEO of Eli Lilly Company and is a Nike board member since
2009; John W. Roger, has a bachelor´s degree in chemistry and in physics from
the University of Texas, is the Chairman of Ariel Investments LLC since 1983 and
is a Nike board member since 2018, and Michelle A. Peluso, the Chairman of
the Committee, who has an undergraduate degree from University of
Pennsylvania´s Wharton School of Business, a graduate degree from Oxford
University and is a Nike board member since 2014.
Finally, the Executive Committee, is administrated by Travis A. Knight, who
has a bachelor´s degree in social science from Portland State University, is the
CEO of Laika Inc and is a Nike board member since 2015, and Mark G. Parker,
Chairman of the Committee, of the Board and CEO of the company, has a
3. Management and Corporate Governance
Figure 8 – Board Overview by Gender
Source: Author, Company Data
Figure 9 – Board Overview by Ethnic
Source: Author, Company Data
Figure 10 – Board Overview by Age
Source: Author, Company Data
Figure 11 – Board Overview by Tenure
Source: Author, Company Data
6
bachelor´s degree in Political Science from Penn State University, is a board
member of Walt Disney Co since 2016 and President/CEO of Nike since 2006.
Shareholder Structure
Nike, Inc shares are divided into two classes: Class B Common Stock and
Class A Common Stock.
Class B Common Stock is listed on the NY Stock Exchange under the symbol
NKE. As of July, 2019, there were 1.253 billion shares, 23,305 holders, each
shareholder is entitled to one vote at the annual meetings and this class elects
three directors.
Class A Common Stock is not publicly traded but each share is convertible into
one share of Class B Common Stock, there were 315 million shares, 13 holders
as of July, 2019, each shareholder is entitled to one vote at the annual meetings
and this class elects nine directors.
The major individual shareholders of Nike are Philip Knight (second largest
individual shareholder), one of Nike´s founders, with 26 million Class A shares
and 19.1 million Class B shares; Travis A. Knight (largest individual
shareholder), Nike founder Phil Knight´s son and current CEO of the company,
as of Q3 2019, he holds 20,273 shares directly, and 291 million Class A Nike
shares through its subsidiaries; Mark Parker, Nike´s Chairman, as of Q3 2019,
he holds nearly 2 million shares, and Trevor Edwards, the fourth largest
individual Nike shareholder, as of Q3 2019, he holds nearly 1.79 million shares.
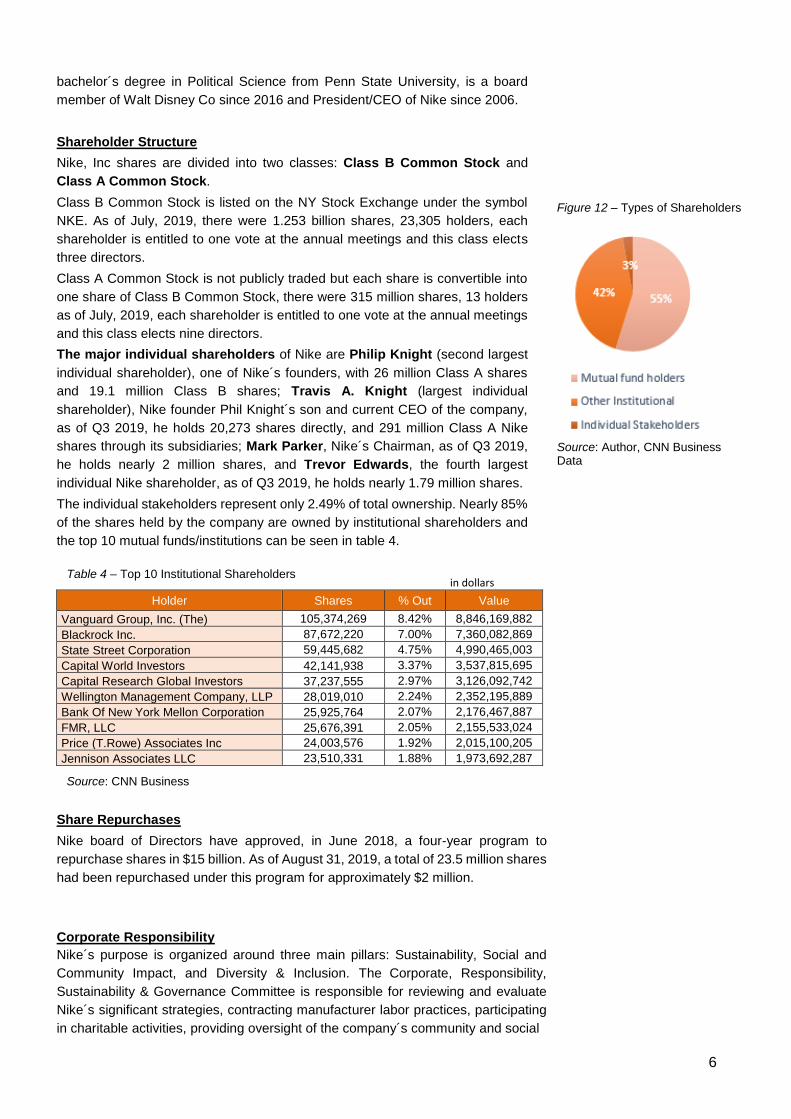
The individual stakeholders represent only 2.49% of total ownership. Nearly 85%
of the shares held by the company are owned by institutional shareholders and
the top 10 mutual funds/institutions can be seen in table 4.
in dollars
Holder Shares % Out Value
Vanguard Group, Inc. (The) 105,374,269 8.42% 8,846,169,882
Blackrock Inc. 87,672,220 7.00% 7,360,082,869
State Street Corporation 59,445,682 4.75% 4,990,465,003
Capital World Investors 42,141,938 3.37% 3,537,815,695
Capital Research Global Investors 37,237,555 2.97% 3,126,092,742
Wellington Management Company, LLP 28,019,010 2.24% 2,352,195,889
Bank Of New York Mellon Corporation 25,925,764 2.07% 2,176,467,887
FMR, LLC 25,676,391 2.05% 2,155,533,024
Price (T.Rowe) Associates Inc 24,003,576 1.92% 2,015,100,205
Jennison Associates LLC 23,510,331 1.88% 1,973,692,287
Share Repurchases
Nike board of Directors have approved, in June 2018, a four-year program to
repurchase shares in $15 billion. As of August 31, 2019, a total of 23.5 million shares
had been repurchased under this program for approximately $2 million.
Corporate Responsibility
Nike´s purpose is organized around three main pillars: Sustainability, Social and
Community Impact, and Diversity & Inclusion. The Corporate, Responsibility,
Sustainability & Governance Committee is responsible for reviewing and evaluate
Nike´s significant strategies, contracting manufacturer labor practices, participating
in charitable activities, providing oversight of the company´s community and social
Source: Author, CNN Business Data
Figure 12 – Types of Shareholders
Table 4 – Top 10 Institutional Shareholders
Source: CNN Business
7
impact efforts, among other duties.
Nike teams focus on sustainability. The company has a Sustainable Business &
Innovation team that connects sustainability and leadership across its business
chain, including innovation and product creation, sourcing, logistic and retail.
The company has sustainability focused teams in the areas of product creation, Nike
Direct, global sourcing & manufacturing, supply chain and brand. These teams report
to the leaders of those areas that end up meeting directly with the SB&I team to
discuss responsibility issues and implement or change sustainability policies.
In 2012, Nike launched the Sustainable Manufacturing and Sourcing Index
(SMSI), a system that combines factory manufacturing and human resource
management with health, safety and the environment. The system considers
environmental and human resource management performance equally weighted
with business metrics, increases transparency to reduce noncompliant practices,
and creates incentives to improve performance and go beyond compliance. The
SMSI has become a very important factor when it comes to factory selection,
encouraging performance improvement, eliminating underperformance in factories,
driving business to those that perform best and protect the rights of workers to create
a safe working environment.
Nike has also launched the Materials Sustainability Index (MSI), an index that
allows the company to choose the best materials from the “healthiest vendors”, by
comparing the environmental footprints of more than 50 million different materials,
supplied by more than 700 vendors. The index considers the chemicals, the energy,
the water and the wastes used when making materials and provides a score for the
materials based on these environmental factors, forming the basis for how the
company measures product sustainability. By using the MSI, Nike teams can choose
materials with lighter environmental footprints and improve the sustainability scores
of products by using better materials, such as cotton that is recycled, or using
materials that required fewer chemicals.
Macroeconomic Environment (Demand & Supply)
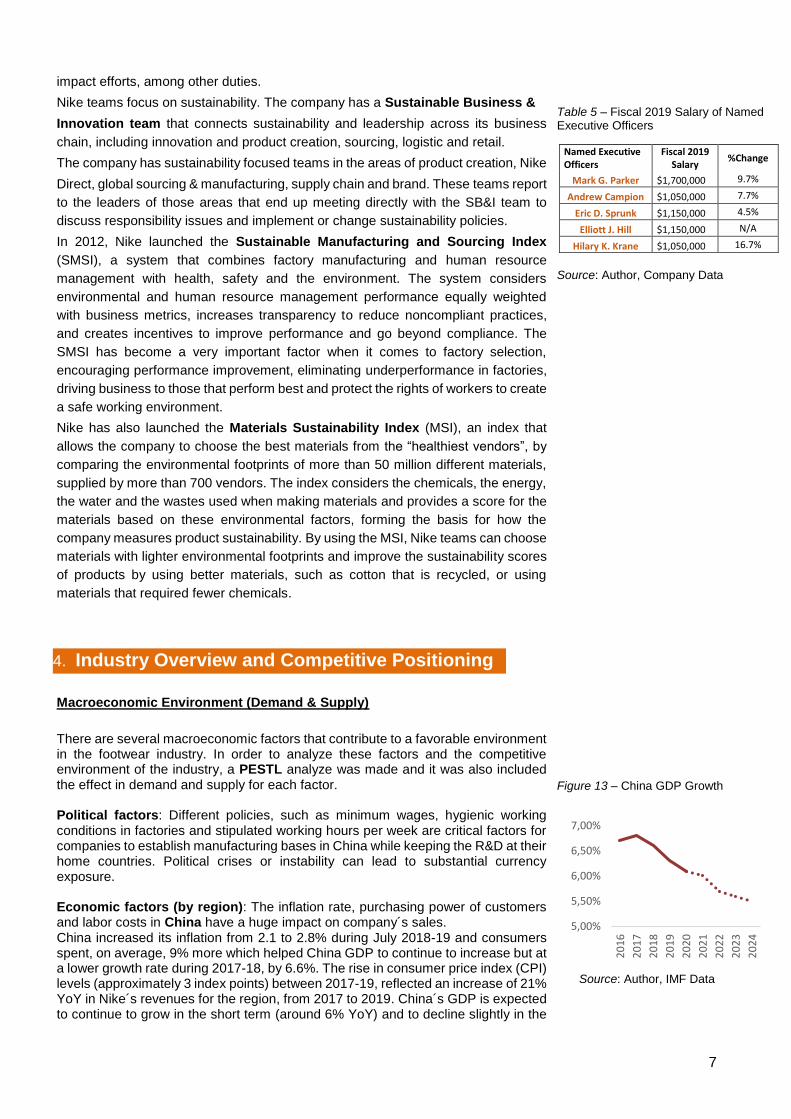
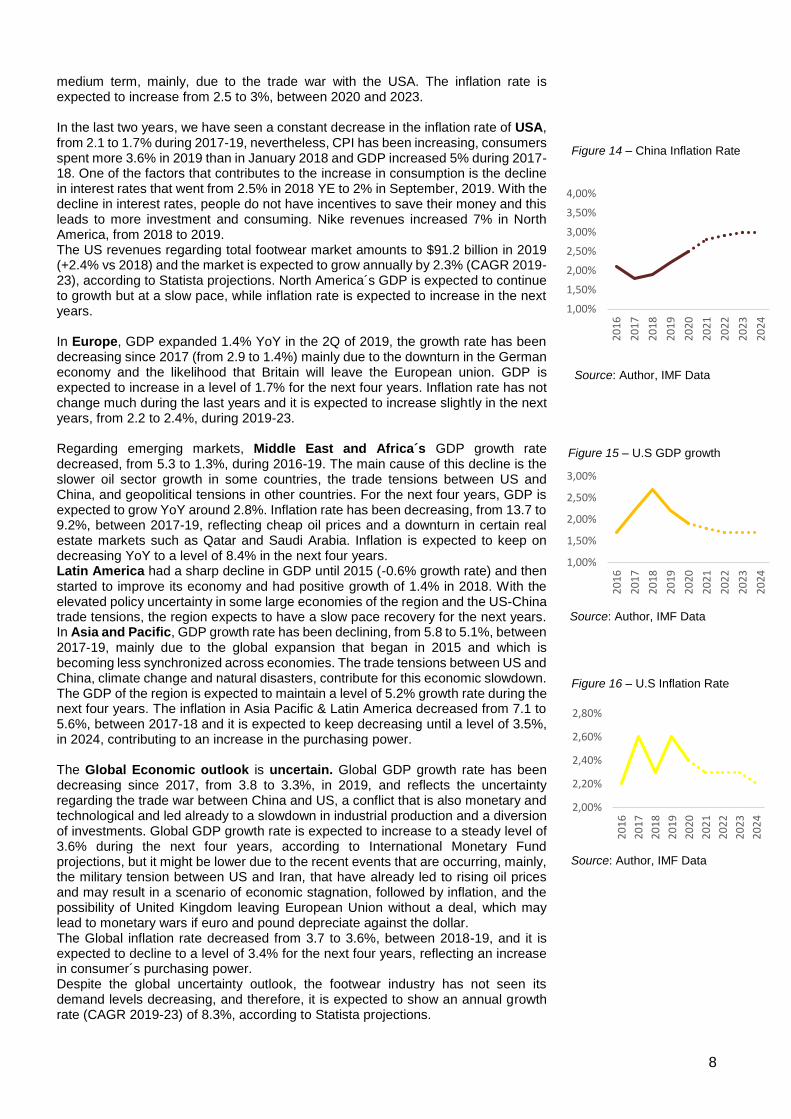
There are several macroeconomic factors that contribute to a favorable environment in the footwear industry. In order to analyze these factors and the competitive environment of the industry, a PESTL analyze was made and it was also included the effect in demand and supply for each factor. Political factors: Different policies, such as minimum wages, hygienic working conditions in factories and stipulated working hours per week are critical factors for companies to establish manufacturing bases in China while keeping the R&D at their home countries. Political crises or instability can lead to substantial currency exposure. Economic factors (by region): The inflation rate, purchasing power of customers and labor costs in China have a huge impact on company´s sales. China increased its inflation from 2.1 to 2.8% during July 2018-19 and consumers spent, on average, 9% more which helped China GDP to continue to increase but at a lower growth rate during 2017-18, by 6.6%. The rise in consumer price index (CPI) levels (approximately 3 index points) between 2017-19, reflected an increase of 21% YoY in Nike´s revenues for the region, from 2017 to 2019. China´s GDP is expected to continue to grow in the short term (around 6% YoY) and to decline slightly in the
Named Executive Officers
Fiscal 2019 Salary
%Change
Mark G. Parker $1,700,000 9.7%
Andrew Campion $1,050,000 7.7%
Eric D. Sprunk $1,150,000 4.5%
Elliott J. Hill $1,150,000 N/A
Hilary K. Krane $1,050,000 16.7%
4. Industry Overview and Competitive Positioning
Table 5 – Fiscal 2019 Salary of Named Executive Officers
Source: Author, Company Data
5,00%
5,50%
6,00%
6,50%
7,00%
20
16
20
17
20
18
20
19
20
20
20
21
20
22
20
23
20
24
Source: Author, IMF Data
Figure 13 – China GDP Growth
8
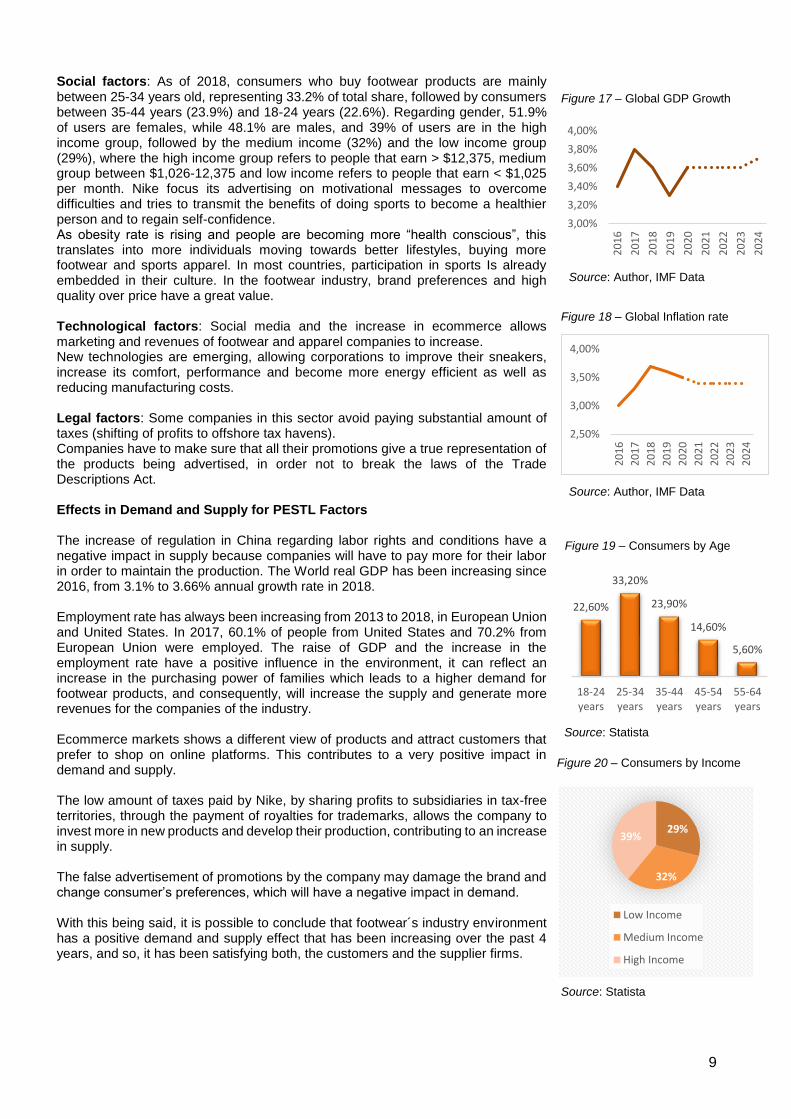
medium term, mainly, due to the trade war with the USA. The inflation rate is expected to increase from 2.5 to 3%, between 2020 and 2023. In the last two years, we have seen a constant decrease in the inflation rate of USA, from 2.1 to 1.7% during 2017-19, nevertheless, CPI has been increasing, consumers spent more 3.6% in 2019 than in January 2018 and GDP increased 5% during 2017-18. One of the factors that contributes to the increase in consumption is the decline in interest rates that went from 2.5% in 2018 YE to 2% in September, 2019. With the decline in interest rates, people do not have incentives to save their money and this leads to more investment and consuming. Nike revenues increased 7% in North America, from 2018 to 2019. The US revenues regarding total footwear market amounts to $91.2 billion in 2019 (+2.4% vs 2018) and the market is expected to grow annually by 2.3% (CAGR 2019-23), according to Statista projections. North America´s GDP is expected to continue to growth but at a slow pace, while inflation rate is expected to increase in the next years. In Europe, GDP expanded 1.4% YoY in the 2Q of 2019, the growth rate has been decreasing since 2017 (from 2.9 to 1.4%) mainly due to the downturn in the German economy and the likelihood that Britain will leave the European union. GDP is expected to increase in a level of 1.7% for the next four years. Inflation rate has not change much during the last years and it is expected to increase slightly in the next years, from 2.2 to 2.4%, during 2019-23. Regarding emerging markets, Middle East and Africa´s GDP growth rate decreased, from 5.3 to 1.3%, during 2016-19. The main cause of this decline is the slower oil sector growth in some countries, the trade tensions between US and China, and geopolitical tensions in other countries. For the next four years, GDP is expected to grow YoY around 2.8%. Inflation rate has been decreasing, from 13.7 to 9.2%, between 2017-19, reflecting cheap oil prices and a downturn in certain real estate markets such as Qatar and Saudi Arabia. Inflation is expected to keep on decreasing YoY to a level of 8.4% in the next four years. Latin America had a sharp decline in GDP until 2015 (-0.6% growth rate) and then started to improve its economy and had positive growth of 1.4% in 2018. With the elevated policy uncertainty in some large economies of the region and the US-China trade tensions, the region expects to have a slow pace recovery for the next years. In Asia and Pacific, GDP growth rate has been declining, from 5.8 to 5.1%, between 2017-19, mainly due to the global expansion that began in 2015 and which is becoming less synchronized across economies. The trade tensions between US and China, climate change and natural disasters, contribute for this economic slowdown. The GDP of the region is expected to maintain a level of 5.2% growth rate during the next four years. The inflation in Asia Pacific & Latin America decreased from 7.1 to 5.6%, between 2017-18 and it is expected to keep decreasing until a level of 3.5%, in 2024, contributing to an increase in the purchasing power. The Global Economic outlook is uncertain. Global GDP growth rate has been decreasing since 2017, from 3.8 to 3.3%, in 2019, and reflects the uncertainty regarding the trade war between China and US, a conflict that is also monetary and technological and led already to a slowdown in industrial production and a diversion of investments. Global GDP growth rate is expected to increase to a steady level of 3.6% during the next four years, according to International Monetary Fund projections, but it might be lower due to the recent events that are occurring, mainly, the military tension between US and Iran, that have already led to rising oil prices and may result in a scenario of economic stagnation, followed by inflation, and the possibility of United Kingdom leaving European Union without a deal, which may lead to monetary wars if euro and pound depreciate against the dollar. The Global inflation rate decreased from 3.7 to 3.6%, between 2018-19, and it is expected to decline to a level of 3.4% for the next four years, reflecting an increase in consumer´s purchasing power. Despite the global uncertainty outlook, the footwear industry has not seen its demand levels decreasing, and therefore, it is expected to show an annual growth rate (CAGR 2019-23) of 8.3%, according to Statista projections.
1,00%
1,50%
2,00%
2,50%
3,00%
3,50%
4,00%
20
16
20
17
20
18
20
19
20
20
20
21
20
22
20
23
20
24
Figure 14 – China Inflation Rate
Source: Author, IMF Data
1,00%
1,50%
2,00%
2,50%
3,00%
20
16
20
17
20
18
20
19
20
20
20
21
20
22
20
23
20
24
Figure 15 – U.S GDP growth
Source: Author, IMF Data
2,00%
2,20%
2,40%
2,60%
2,80%
20
16
20
17
20
18
20
19
20
20
20
21
20
22
20
23
20
24
Figure 16 – U.S Inflation Rate
Source: Author, IMF Data
9
Social factors: As of 2018, consumers who buy footwear products are mainly between 25-34 years old, representing 33.2% of total share, followed by consumers between 35-44 years (23.9%) and 18-24 years (22.6%). Regarding gender, 51.9% of users are females, while 48.1% are males, and 39% of users are in the high income group, followed by the medium income (32%) and the low income group (29%), where the high income group refers to people that earn > $12,375, medium group between $1,026-12,375 and low income refers to people that earn < $1,025 per month. Nike focus its advertising on motivational messages to overcome difficulties and tries to transmit the benefits of doing sports to become a healthier person and to regain self-confidence. As obesity rate is rising and people are becoming more “health conscious”, this translates into more individuals moving towards better lifestyles, buying more footwear and sports apparel. In most countries, participation in sports Is already embedded in their culture. In the footwear industry, brand preferences and high quality over price have a great value. Technological factors: Social media and the increase in ecommerce allows marketing and revenues of footwear and apparel companies to increase. New technologies are emerging, allowing corporations to improve their sneakers, increase its comfort, performance and become more energy efficient as well as reducing manufacturing costs. Legal factors: Some companies in this sector avoid paying substantial amount of taxes (shifting of profits to offshore tax havens). Companies have to make sure that all their promotions give a true representation of the products being advertised, in order not to break the laws of the Trade Descriptions Act. Effects in Demand and Supply for PESTL Factors The increase of regulation in China regarding labor rights and conditions have a negative impact in supply because companies will have to pay more for their labor in order to maintain the production. The World real GDP has been increasing since 2016, from 3.1% to 3.66% annual growth rate in 2018. Employment rate has always been increasing from 2013 to 2018, in European Union and United States. In 2017, 60.1% of people from United States and 70.2% from European Union were employed. The raise of GDP and the increase in the employment rate have a positive influence in the environment, it can reflect an increase in the purchasing power of families which leads to a higher demand for footwear products, and consequently, will increase the supply and generate more revenues for the companies of the industry. Ecommerce markets shows a different view of products and attract customers that prefer to shop on online platforms. This contributes to a very positive impact in demand and supply. The low amount of taxes paid by Nike, by sharing profits to subsidiaries in tax-free territories, through the payment of royalties for trademarks, allows the company to invest more in new products and develop their production, contributing to an increase in supply. The false advertisement of promotions by the company may damage the brand and change consumer’s preferences, which will have a negative impact in demand. With this being said, it is possible to conclude that footwear´s industry environment has a positive demand and supply effect that has been increasing over the past 4 years, and so, it has been satisfying both, the customers and the supplier firms.
3,00%
3,20%
3,40%
3,60%
3,80%
4,00%
20
16
20
17
20
18
20
19
20
20
20
21
20
22
20
23
20
24
Figure 17 – Global GDP Growth
Source: Author, IMF Data
2,50%
3,00%
3,50%
4,00%
20
16
20
17
20
18
20
19
20
20
20
21
20
22
20
23
20
24
Figure 18 – Global Inflation rate
Source: Author, IMF Data
22,60%
33,20%
23,90%
14,60%
5,60%
18-24years
25-34years
35-44years
45-54years
55-64years
Figure 19 – Consumers by Age
Source: Statista
29%
32%
39%
Low Income
Medium Income
High Income
Figure 20 – Consumers by Income
Source: Statista
10
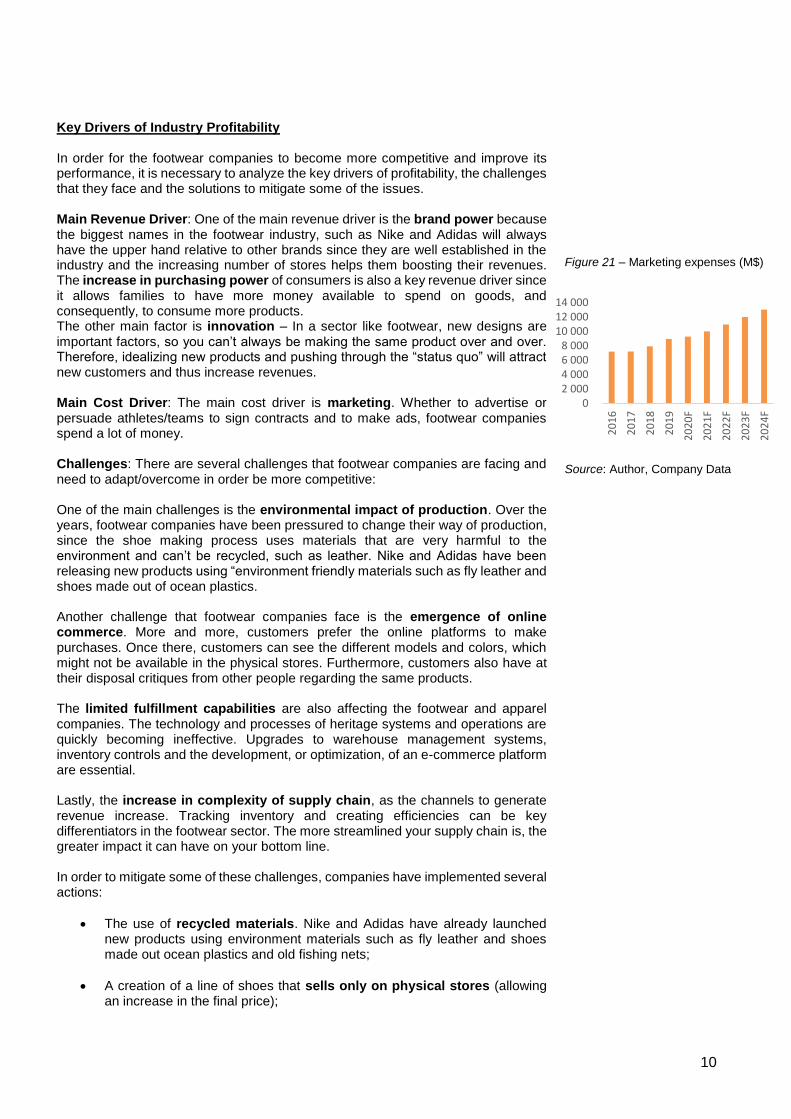
Key Drivers of Industry Profitability In order for the footwear companies to become more competitive and improve its performance, it is necessary to analyze the key drivers of profitability, the challenges that they face and the solutions to mitigate some of the issues. Main Revenue Driver: One of the main revenue driver is the brand power because the biggest names in the footwear industry, such as Nike and Adidas will always have the upper hand relative to other brands since they are well established in the industry and the increasing number of stores helps them boosting their revenues. The increase in purchasing power of consumers is also a key revenue driver since it allows families to have more money available to spend on goods, and consequently, to consume more products. The other main factor is innovation – In a sector like footwear, new designs are important factors, so you can’t always be making the same product over and over. Therefore, idealizing new products and pushing through the “status quo” will attract new customers and thus increase revenues. Main Cost Driver: The main cost driver is marketing. Whether to advertise or persuade athletes/teams to sign contracts and to make ads, footwear companies spend a lot of money. Challenges: There are several challenges that footwear companies are facing and need to adapt/overcome in order be more competitive: One of the main challenges is the environmental impact of production. Over the years, footwear companies have been pressured to change their way of production, since the shoe making process uses materials that are very harmful to the environment and can’t be recycled, such as leather. Nike and Adidas have been releasing new products using “environment friendly materials such as fly leather and shoes made out of ocean plastics. Another challenge that footwear companies face is the emergence of online commerce. More and more, customers prefer the online platforms to make purchases. Once there, customers can see the different models and colors, which might not be available in the physical stores. Furthermore, customers also have at their disposal critiques from other people regarding the same products. The limited fulfillment capabilities are also affecting the footwear and apparel companies. The technology and processes of heritage systems and operations are quickly becoming ineffective. Upgrades to warehouse management systems, inventory controls and the development, or optimization, of an e-commerce platform are essential. Lastly, the increase in complexity of supply chain, as the channels to generate revenue increase. Tracking inventory and creating efficiencies can be key differentiators in the footwear sector. The more streamlined your supply chain is, the greater impact it can have on your bottom line. In order to mitigate some of these challenges, companies have implemented several actions:
The use of recycled materials. Nike and Adidas have already launched new products using environment materials such as fly leather and shoes made out ocean plastics and old fishing nets;
A creation of a line of shoes that sells only on physical stores (allowing an increase in the final price);
02 0004 0006 0008 000
10 00012 00014 000
20
16
20
17
20
18
20
19
20
20
F
20
21
F
20
22
F
20
23
F
20
24
F
Figure 21 – Marketing expenses (M$)
Source: Author, Company Data
11
An upgrade to the warehouse and inventory management systems and the optimization of the online platforms.
Competitive Position
Strengths Weeknesses
- Brand Image
- International Presence
- Distribution Network
- Diversified products
- Innovation
- Online Markets (Nike apps)
- Overdependence of US
Market
- Increasing marketing
expenses
- Dependence of China for
manufacturing
Opportunities Threats
- Mergers and Acquisitions
- International Expansion
- New product lines
- Competitive Pressure
- Fraud Products
- Economic Environment
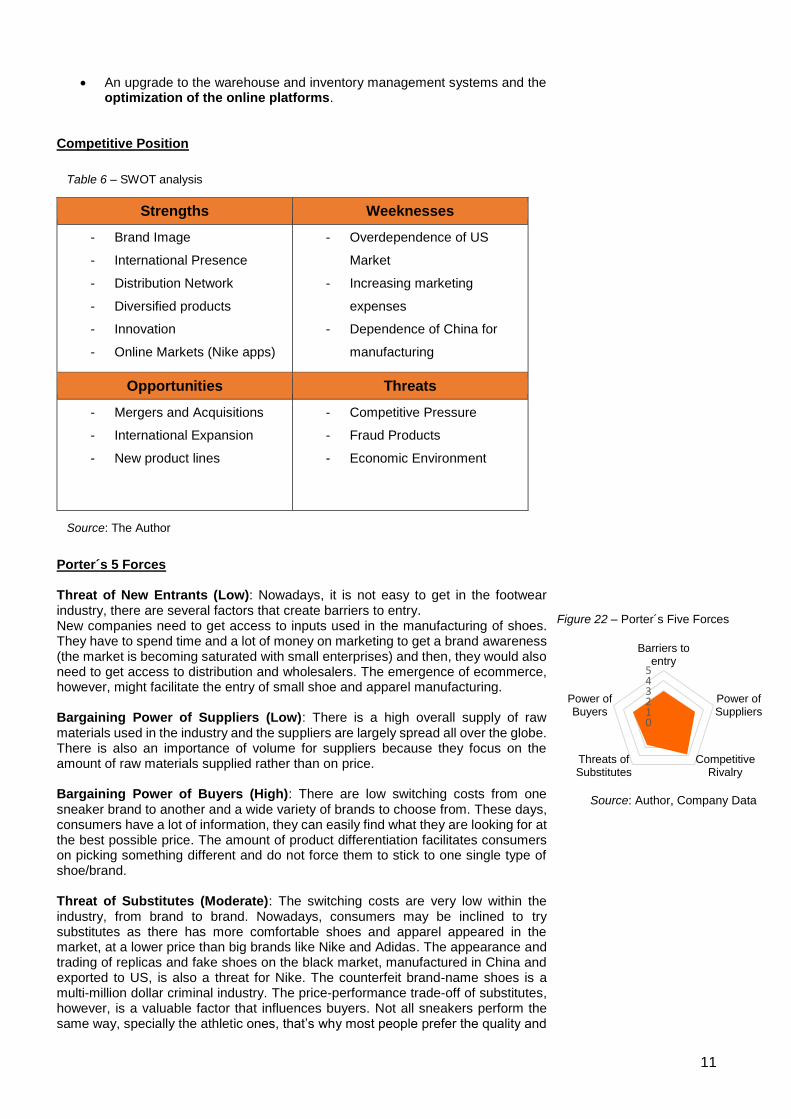
Porter´s 5 Forces Threat of New Entrants (Low): Nowadays, it is not easy to get in the footwear industry, there are several factors that create barriers to entry. New companies need to get access to inputs used in the manufacturing of shoes. They have to spend time and a lot of money on marketing to get a brand awareness (the market is becoming saturated with small enterprises) and then, they would also need to get access to distribution and wholesalers. The emergence of ecommerce, however, might facilitate the entry of small shoe and apparel manufacturing. Bargaining Power of Suppliers (Low): There is a high overall supply of raw materials used in the industry and the suppliers are largely spread all over the globe. There is also an importance of volume for suppliers because they focus on the amount of raw materials supplied rather than on price. Bargaining Power of Buyers (High): There are low switching costs from one sneaker brand to another and a wide variety of brands to choose from. These days, consumers have a lot of information, they can easily find what they are looking for at the best possible price. The amount of product differentiation facilitates consumers on picking something different and do not force them to stick to one single type of shoe/brand. Threat of Substitutes (Moderate): The switching costs are very low within the industry, from brand to brand. Nowadays, consumers may be inclined to try substitutes as there has more comfortable shoes and apparel appeared in the market, at a lower price than big brands like Nike and Adidas. The appearance and trading of replicas and fake shoes on the black market, manufactured in China and exported to US, is also a threat for Nike. The counterfeit brand-name shoes is a multi-million dollar criminal industry. The price-performance trade-off of substitutes, however, is a valuable factor that influences buyers. Not all sneakers perform the same way, specially the athletic ones, that’s why most people prefer the quality and
012345
Barriers toentry
Power ofSuppliers
CompetitiveRivalry
Threats ofSubstitutes
Power ofBuyers
Figure 22 – Porter´s Five Forces
Source: Author, Company Data
Table 6 – SWOT analysis
Source: The Author
12
design of Nike products, the most recognized and wanted brand. Overall, the threat from substitute products is moderate. Competitive Rivalry (High): In the footwear industry, there are a lot of firms competing to be the best in a specific area and there is an emphasis put on non-price competition. The companies are increasing its range of products in order to capture more market share, Nike for example, implemented in 2019 a new core footwear that features Air Max and Zoom Air, investing, therefore, in the creation of hybrid shoes. The marketing and advertising are very important to attract consumers and the brand image/customer loyalty is a huge factor that determines consumer’s preferences. As said before, Nike is known for its strong marketing strategy, the company usually invests 10% of its revenues in marketing. In 2019, marketing expenses amounted to $3.7 billion (+$475 million vs 2016), and Adidas invested, in 2017, $2.8 billion, an increase of $800 million since 2014, reflecting the high level of competition in the sport shoes and apparel industry.
The final recommendation for Nike, Inc stands for BUY, with a price target of
$88.66 and an upside potential of 15.23% relative to the price on May 31st 2019.
The main drivers of Nike´s future prospects are: Purchasing Power and the E-
commerce in China. Despite the global slowdown in economy, GDP is expected
to grow at a steady rate and global inflation is expected to decrease, contributing
to an increase in purchasing power. The region that most contributes for Nike´s
revenues (41%), North America, has been growing over the past few years
despite some political instability, its inflation levels are declining and the
consumer price index is increasing, reflecting higher levels of purchasing power.
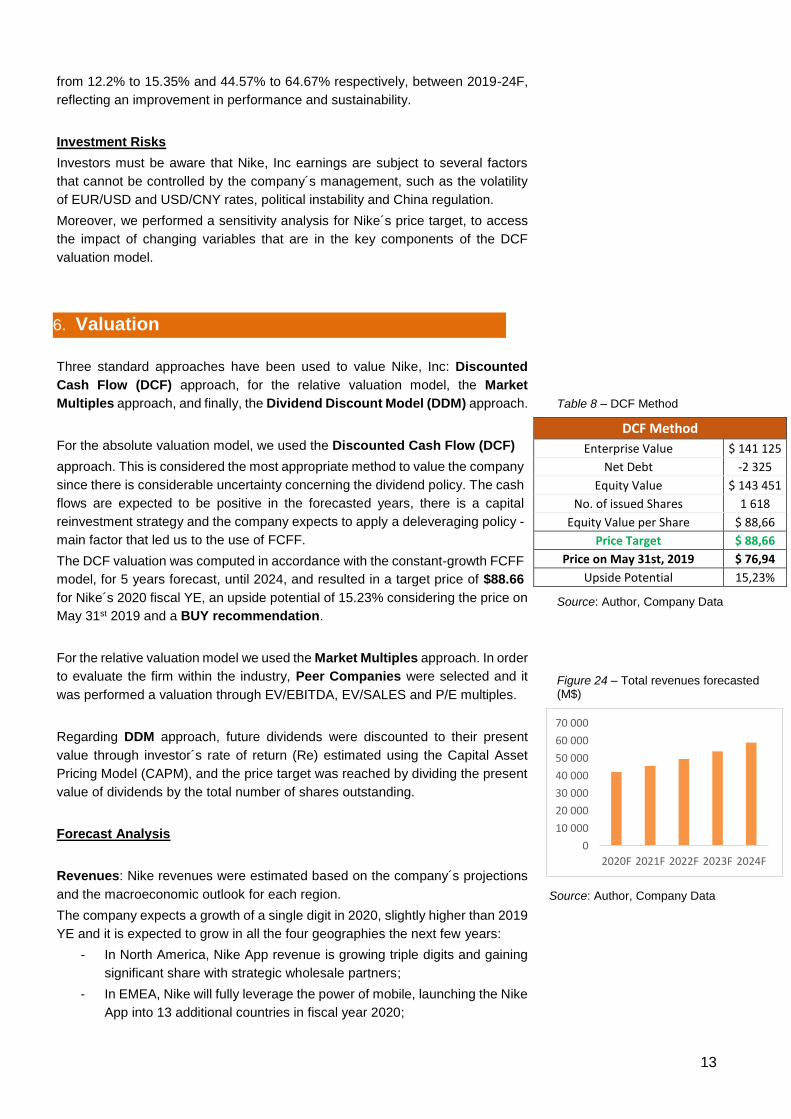
China is increasing its CPI levels and it is the region that has shown the highest
demand over the past three years. This is already reflected in Nike´s revenues.
China is the only region that has always been increasing its weight in the total
company´s revenues, from 11.7% to 15.9%, between 2016-19, and it is expected
to continue this growth over the next years, mainly due to the emerging of E-
commerce and the collaborations of Nike with China´s main retailers (Tmall) and
social media platforms (WeChat).
Valuation Methods
The final price target of $88.66 was computed using the Discounted Cash Flow
model (DCF). The Relative Valuation through Multiples supports the final
recommendation, with an average price target of $79.45 and an upside potential
of 3.3%. Both methods indicate that Nike, Inc stocks are currently undervalued.
Besides the main valuation method (DCF) and the Relative valuation, it was also
computed the Dividend Discount Model, with a target price of $27.78 and a
downside potential of 63.9%, reflecting an unrealistic price and sell
recommendation due to conservative assumption of dividend payout ratio.
Deleveraging strategy and Sustainable Profitability
Since Nike´s short term debt is decreasing and a Japanese note maturing, the
company will increase its weight of equity in the capital structure from 71% to
77%, between 2020-24F, allowing higher margins to invest without the need of
debt financing. The company expects an improve in EBIT Margin and in ROE
5. Investment Summary
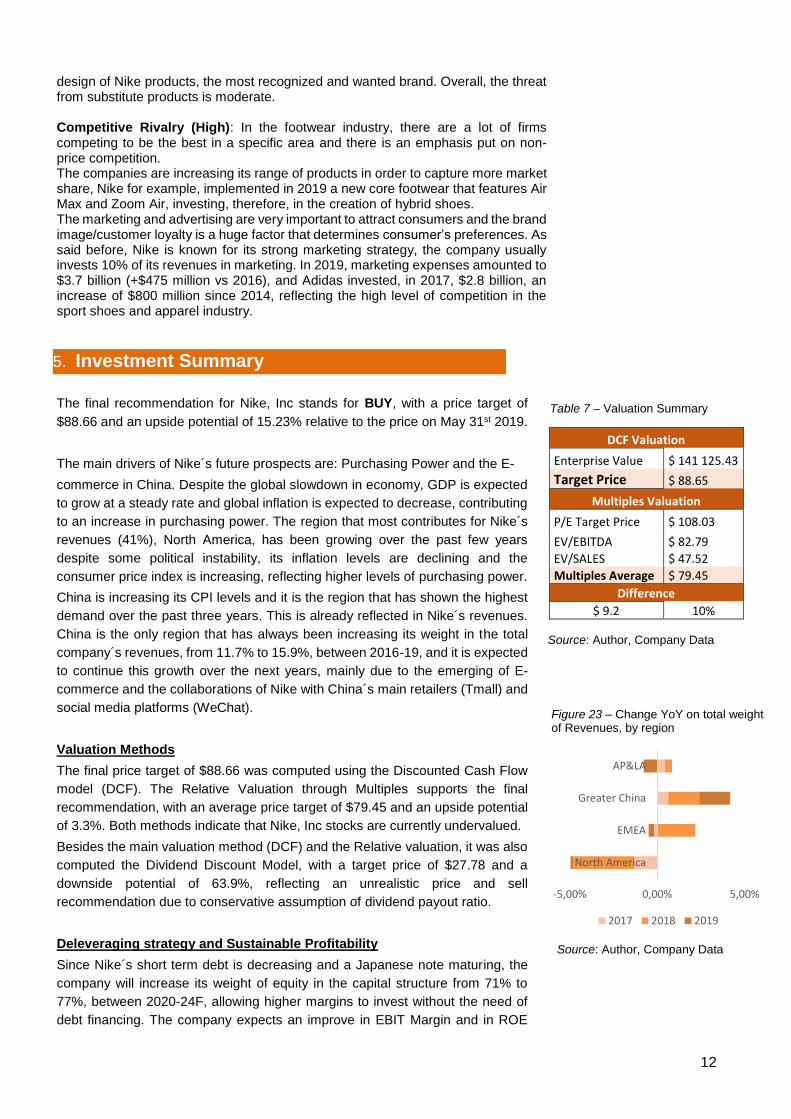
DCF Valuation
Enterprise Value $ 141 125.43
Target Price $ 88.65
Multiples Valuation
P/E Target Price $ 108.03
EV/EBITDA $ 82.79
EV/SALES $ 47.52
Multiples Average $ 79.45
Difference
$ 9.2 10%
-5,00% 0,00% 5,00%
North America
EMEA
Greater China
AP&LA
2017 2018 2019
Table 7 – Valuation Summary
Source: Author, Company Data
Figure 23 – Change YoY on total weight of Revenues, by region
Source: Author, Company Data
13
from 12.2% to 15.35% and 44.57% to 64.67% respectively, between 2019-24F,
reflecting an improvement in performance and sustainability.
Investment Risks
Investors must be aware that Nike, Inc earnings are subject to several factors
that cannot be controlled by the company´s management, such as the volatility
of EUR/USD and USD/CNY rates, political instability and China regulation.
Moreover, we performed a sensitivity analysis for Nike´s price target, to access
the impact of changing variables that are in the key components of the DCF
valuation model.
Three standard approaches have been used to value Nike, Inc: Discounted
Cash Flow (DCF) approach, for the relative valuation model, the Market
Multiples approach, and finally, the Dividend Discount Model (DDM) approach.
For the absolute valuation model, we used the Discounted Cash Flow (DCF)
approach. This is considered the most appropriate method to value the company
since there is considerable uncertainty concerning the dividend policy. The cash
flows are expected to be positive in the forecasted years, there is a capital
reinvestment strategy and the company expects to apply a deleveraging policy -
main factor that led us to the use of FCFF.
The DCF valuation was computed in accordance with the constant-growth FCFF
model, for 5 years forecast, until 2024, and resulted in a target price of $88.66
for Nike´s 2020 fiscal YE, an upside potential of 15.23% considering the price on
May 31st 2019 and a BUY recommendation.
For the relative valuation model we used the Market Multiples approach. In order
to evaluate the firm within the industry, Peer Companies were selected and it
was performed a valuation through EV/EBITDA, EV/SALES and P/E multiples.
Regarding DDM approach, future dividends were discounted to their present
value through investor´s rate of return (Re) estimated using the Capital Asset
Pricing Model (CAPM), and the price target was reached by dividing the present
value of dividends by the total number of shares outstanding.
Forecast Analysis
Revenues: Nike revenues were estimated based on the company´s projections
and the macroeconomic outlook for each region.
The company expects a growth of a single digit in 2020, slightly higher than 2019
YE and it is expected to grow in all the four geographies the next few years:
- In North America, Nike App revenue is growing triple digits and gaining
significant share with strategic wholesale partners;
- In EMEA, Nike will fully leverage the power of mobile, launching the Nike
App into 13 additional countries in fiscal year 2020;
6. Valuation
DCF Method
Enterprise Value $ 141 125
Net Debt -2 325
Equity Value $ 143 451
No. of issued Shares 1 618
Equity Value per Share $ 88,66
Price Target $ 88,66
Price on May 31st, 2019 $ 76,94
Upside Potential 15,23%
Table 8 – DCF Method
Source: Author, Company Data
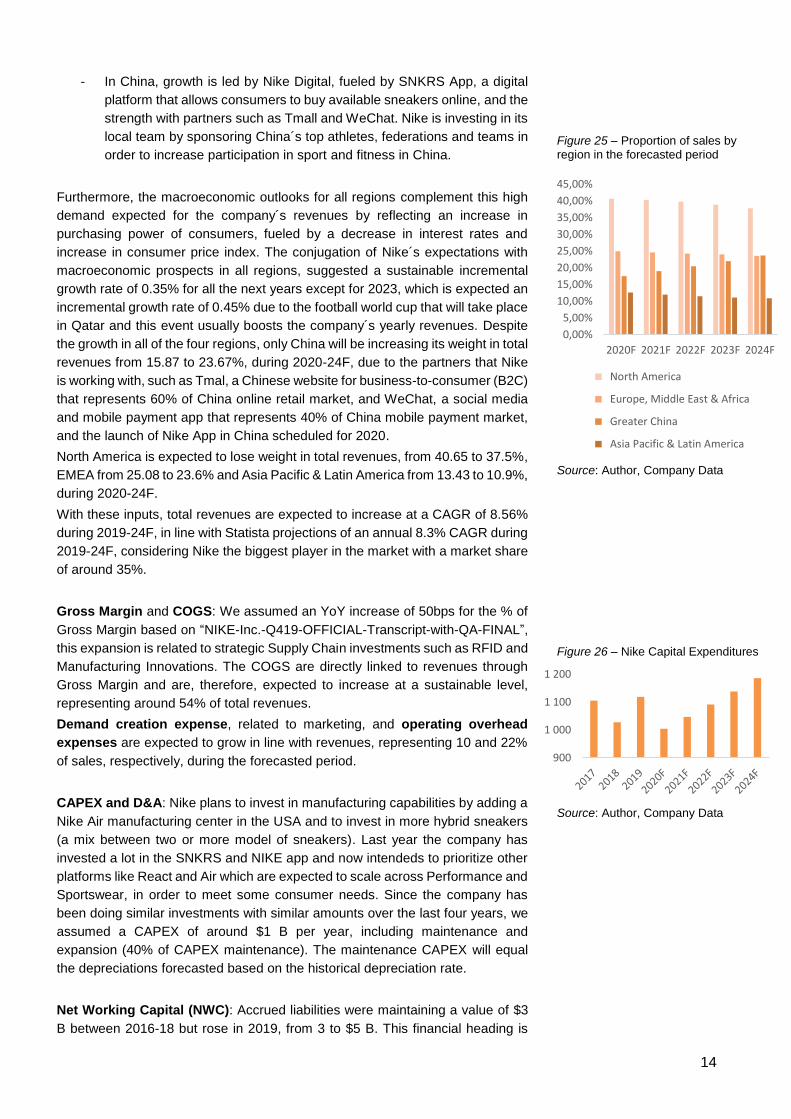
0
10 000
20 000
30 000
40 000
50 000
60 000
70 000
2020F 2021F 2022F 2023F 2024F
Figure 24 – Total revenues forecasted (M$)
Source: Author, Company Data
14
- In China, growth is led by Nike Digital, fueled by SNKRS App, a digital
platform that allows consumers to buy available sneakers online, and the
strength with partners such as Tmall and WeChat. Nike is investing in its
local team by sponsoring China´s top athletes, federations and teams in
order to increase participation in sport and fitness in China.
Furthermore, the macroeconomic outlooks for all regions complement this high
demand expected for the company´s revenues by reflecting an increase in
purchasing power of consumers, fueled by a decrease in interest rates and
increase in consumer price index. The conjugation of Nike´s expectations with
macroeconomic prospects in all regions, suggested a sustainable incremental
growth rate of 0.35% for all the next years except for 2023, which is expected an
incremental growth rate of 0.45% due to the football world cup that will take place
in Qatar and this event usually boosts the company´s yearly revenues. Despite
the growth in all of the four regions, only China will be increasing its weight in total
revenues from 15.87 to 23.67%, during 2020-24F, due to the partners that Nike
is working with, such as Tmal, a Chinese website for business-to-consumer (B2C)
that represents 60% of China online retail market, and WeChat, a social media
and mobile payment app that represents 40% of China mobile payment market,
and the launch of Nike App in China scheduled for 2020.
North America is expected to lose weight in total revenues, from 40.65 to 37.5%,
EMEA from 25.08 to 23.6% and Asia Pacific & Latin America from 13.43 to 10.9%,
during 2020-24F.
With these inputs, total revenues are expected to increase at a CAGR of 8.56%
during 2019-24F, in line with Statista projections of an annual 8.3% CAGR during
2019-24F, considering Nike the biggest player in the market with a market share
of around 35%.
Gross Margin and COGS: We assumed an YoY increase of 50bps for the % of
Gross Margin based on “NIKE-Inc.-Q419-OFFICIAL-Transcript-with-QA-FINAL”,
this expansion is related to strategic Supply Chain investments such as RFID and
Manufacturing Innovations. The COGS are directly linked to revenues through
Gross Margin and are, therefore, expected to increase at a sustainable level,
representing around 54% of total revenues.
Demand creation expense, related to marketing, and operating overhead
expenses are expected to grow in line with revenues, representing 10 and 22%
of sales, respectively, during the forecasted period.
CAPEX and D&A: Nike plans to invest in manufacturing capabilities by adding a
Nike Air manufacturing center in the USA and to invest in more hybrid sneakers
(a mix between two or more model of sneakers). Last year the company has
invested a lot in the SNKRS and NIKE app and now intendeds to prioritize other
platforms like React and Air which are expected to scale across Performance and
Sportswear, in order to meet some consumer needs. Since the company has
been doing similar investments with similar amounts over the last four years, we
assumed a CAPEX of around $1 B per year, including maintenance and
expansion (40% of CAPEX maintenance). The maintenance CAPEX will equal
the depreciations forecasted based on the historical depreciation rate.
Net Working Capital (NWC): Accrued liabilities were maintaining a value of $3
B between 2016-18 but rose in 2019, from 3 to $5 B. This financial heading is
0,00%
5,00%
10,00%
15,00%
20,00%
25,00%
30,00%
35,00%
40,00%
45,00%
2020F 2021F 2022F 2023F 2024F
North America
Europe, Middle East & Africa
Greater China
Asia Pacific & Latin America
Figure 25 – Proportion of sales by region in the forecasted period
Source: Author, Company Data
900
1 000
1 100
1 200
Figure 26 – Nike Capital Expenditures
Source: Author, Company Data

15
expected to grow as percentage of selling and administrative expenses, being
the component with higher weight and leading to a reduction in NWC of 47%,
from 2.2 to $4 B, between 2019-20F. (see appendix 9 for more information).
Debt Structure: Nike´s financial situation is solid, its capital structure is mainly
composed by equity (70%) and the company expects to increase this value to
77% by the end of 2024F.
The short-term debt is not significant, represents only 0.2% of total debt and
based on the company´s annual report of 2019, short-term debt will decrease
until 2022F (from 6 to $0 M) and increase in 2023F (from 0 to $500 M), due to
the need of financing for the world cup. Regarding long-term debt, it is expected
a decrease of 9 M$ from 2019 to 2020F due to a Japanese yen note that will
mature during that period, and it is expected to maintain a value of $3,455 M
during 2020-24F since no more notes will mature until the end of the forecasted
period.
WACC Assumptions: To discount the FCFF, we used the WACC method. The
rate for 2020F is 5.48% and it is rising during 2020-24F to 5.53%. In order to
reach the value of the WACC rate, it was necessary to compute and find
information regarding its inputs:
Rf – Considered a risk free rate of 1.48% (10Y USA Treasury Yield);
βE – It was computed based on the unlevered industry beta of 0.75 provided by
Aswath Damodaran, a Debt to Equity ratio and a Tax rate of 17%;
MRP & CRP – Considered the values provided by Aswath Damoradan, updated
on January 2019, for USA (MRP:5.96% & CRP:0%);
Ke – It was calculated using the Capital Asset Pricing Model (CAPM), generating
a value of 7.19% for 2020F;
Kd – Considered the interest cover ratio, resulting in a cost of debt of 1.41%.
Terminal Value Assumptions: For the terminal value, we followed the
Perpetuity Growth Model approach. It was computed a Perpetuity WACC of
5,7% based on the input rates for the terminal year and a Perpetuity Growth
Rate (g), based on the Stable Growth Model, resulting in a g of 0,57%, lower than
the projected GDP and inflation rates.
Multiples Valuation: In order to obtain the target price by using this method, we
considered these three multiples: EV/EBITDA, EV/Sales and P/E, and seven
Nike peer companies: Puma SE, Adidas AG, Skechers Inc, Wolverine World
Wide Inc, Deckers Outdoor Corp and Under Armour inc.
The peers were used to compute the average for each multiple in order to obtain
the price target for Nike by using the forward valuation for multiples.
Using EV/EBITDA, we obtained a price target of $82.79 for Nike´s 2020 fiscal
YE, representing an upside potential of 7,6% relative to the price on May 31st,
2019.
EV/EBITDA 2020F
EV/EBITDA PEER 16
Nike EBITDA(Fwd Avg) 8 000
Nike EV $ 131 630
Net Debt -2 325
Equity Value $ 133 955
No. of issued Shares 1 618
Equity Value per Share $ 82.79
Price on May 31st, 2020 $ 82.79
Price on May 31st, 2019 $ 76.94
Upside Potential 7,60%
EV/Sales 2020F
EV/Sales PEER 1
Nike Revenues(Fwd Avg) 50 051
Nike EV $ 74 572
Net Debt -2 325
Equity Value $ 76 897
No. of issued Shares 1 618
Equity Value per Share $ 47.53
Price on May 31st, 2020 $ 47.53
Price on May 31st, 2019 $ 76.94
Downside Potential -38,23%
68,00%
69,00%
70,00%
71,00%
72,00%
73,00%
74,00%
75,00%
76,00%
77,00%
78,00%
2020F 2021F 2022F 2023F 2024F
Figure 27 – Weighted of equity in the capital structure
Source: Author, Company Data
Table 9 – EV/EBITDA Output
Source: Author, Reuters
Table 10 – EV/Sales Output
Source: Author, Reuters
16
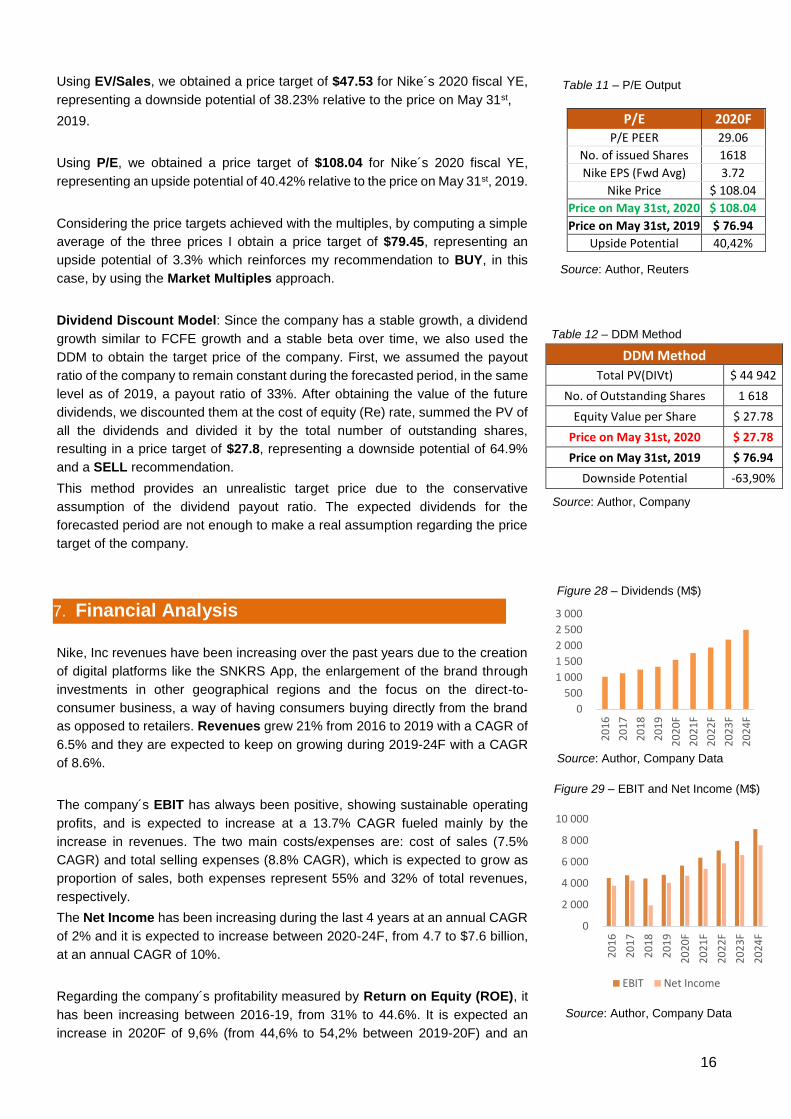
Using EV/Sales, we obtained a price target of $47.53 for Nike´s 2020 fiscal YE,
representing a downside potential of 38.23% relative to the price on May 31st,
2019.
Using P/E, we obtained a price target of $108.04 for Nike´s 2020 fiscal YE,
representing an upside potential of 40.42% relative to the price on May 31st, 2019.
Considering the price targets achieved with the multiples, by computing a simple
average of the three prices I obtain a price target of $79.45, representing an
upside potential of 3.3% which reinforces my recommendation to BUY, in this
case, by using the Market Multiples approach.
Dividend Discount Model: Since the company has a stable growth, a dividend
growth similar to FCFE growth and a stable beta over time, we also used the
DDM to obtain the target price of the company. First, we assumed the payout
ratio of the company to remain constant during the forecasted period, in the same
level as of 2019, a payout ratio of 33%. After obtaining the value of the future
dividends, we discounted them at the cost of equity (Re) rate, summed the PV of
all the dividends and divided it by the total number of outstanding shares,
resulting in a price target of $27.8, representing a downside potential of 64.9%
and a SELL recommendation.
This method provides an unrealistic target price due to the conservative
assumption of the dividend payout ratio. The expected dividends for the
forecasted period are not enough to make a real assumption regarding the price
target of the company.
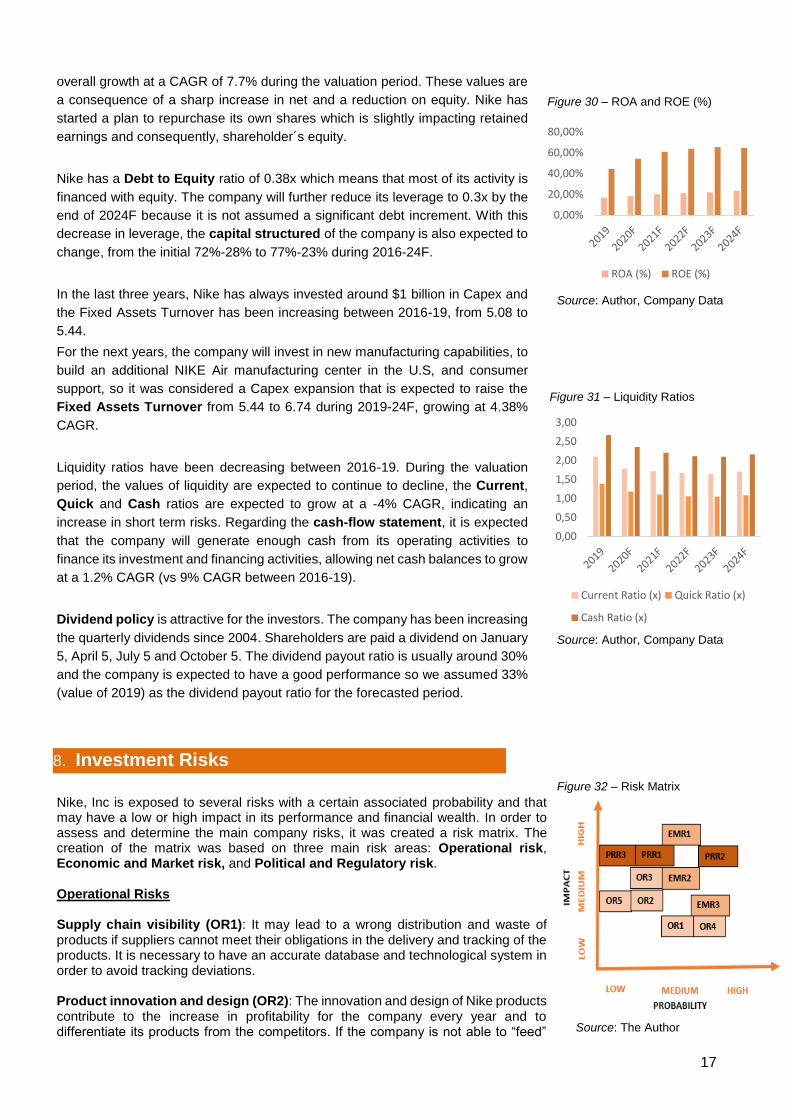
Nike, Inc revenues have been increasing over the past years due to the creation
of digital platforms like the SNKRS App, the enlargement of the brand through
investments in other geographical regions and the focus on the direct-to-
consumer business, a way of having consumers buying directly from the brand
as opposed to retailers. Revenues grew 21% from 2016 to 2019 with a CAGR of
6.5% and they are expected to keep on growing during 2019-24F with a CAGR
of 8.6%.
The company´s EBIT has always been positive, showing sustainable operating
profits, and is expected to increase at a 13.7% CAGR fueled mainly by the
increase in revenues. The two main costs/expenses are: cost of sales (7.5%
CAGR) and total selling expenses (8.8% CAGR), which is expected to grow as
proportion of sales, both expenses represent 55% and 32% of total revenues,
respectively.
The Net Income has been increasing during the last 4 years at an annual CAGR
of 2% and it is expected to increase between 2020-24F, from 4.7 to $7.6 billion,
at an annual CAGR of 10%.
Regarding the company´s profitability measured by Return on Equity (ROE), it
has been increasing between 2016-19, from 31% to 44.6%. It is expected an
increase in 2020F of 9,6% (from 44,6% to 54,2% between 2019-20F) and an
P/E 2020F P/E PEER 29.06
No. of issued Shares 1618
Nike EPS (Fwd Avg) 3.72
Nike Price $ 108.04
Price on May 31st, 2020 $ 108.04
Price on May 31st, 2019 $ 76.94
Upside Potential 40,42%
DDM Method
Total PV(DIVt) $ 44 942
No. of Outstanding Shares 1 618
Equity Value per Share $ 27.78
Price on May 31st, 2020 $ 27.78
Price on May 31st, 2019 $ 76.94
Downside Potential -63,90%
7. Financial Analysis
0
500
1 000
1 500
2 000
2 500
3 0002
01
6
20
17
20
18
20
19
20
20
F
20
21
F
20
22
F
20
23
F
20
24
F
Table 11 – P/E Output
Source: Author, Reuters
Figure 28 – Dividends (M$)
Source: Author, Company
Table 12 – DDM Method
Source: Author, Company Data
Figure 29 – EBIT and Net Income (M$)
Source: Author, Company Data
0
2 000
4 000
6 000
8 000
10 000
20
16
20
17
20
18
20
19
20
20
F
20
21
F
20
22
F
20
23
F
20
24
F
EBIT Net Income
17
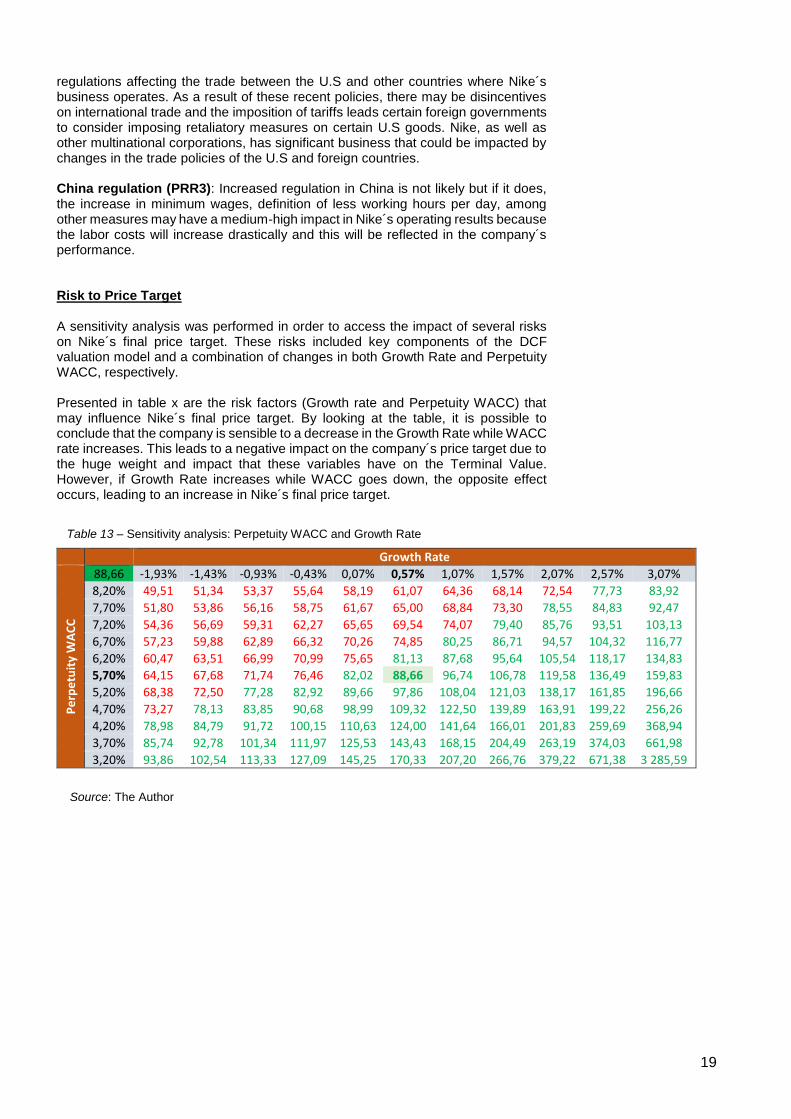
overall growth at a CAGR of 7.7% during the valuation period. These values are
a consequence of a sharp increase in net and a reduction on equity. Nike has
started a plan to repurchase its own shares which is slightly impacting retained
earnings and consequently, shareholder´s equity.
Nike has a Debt to Equity ratio of 0.38x which means that most of its activity is
financed with equity. The company will further reduce its leverage to 0.3x by the
end of 2024F because it is not assumed a significant debt increment. With this
decrease in leverage, the capital structured of the company is also expected to
change, from the initial 72%-28% to 77%-23% during 2016-24F.
In the last three years, Nike has always invested around $1 billion in Capex and
the Fixed Assets Turnover has been increasing between 2016-19, from 5.08 to
5.44.
For the next years, the company will invest in new manufacturing capabilities, to
build an additional NIKE Air manufacturing center in the U.S, and consumer
support, so it was considered a Capex expansion that is expected to raise the
Fixed Assets Turnover from 5.44 to 6.74 during 2019-24F, growing at 4.38%
CAGR.
Liquidity ratios have been decreasing between 2016-19. During the valuation
period, the values of liquidity are expected to continue to decline, the Current,
Quick and Cash ratios are expected to grow at a -4% CAGR, indicating an
increase in short term risks. Regarding the cash-flow statement, it is expected
that the company will generate enough cash from its operating activities to
finance its investment and financing activities, allowing net cash balances to grow
at a 1.2% CAGR (vs 9% CAGR between 2016-19).
Dividend policy is attractive for the investors. The company has been increasing
the quarterly dividends since 2004. Shareholders are paid a dividend on January
5, April 5, July 5 and October 5. The dividend payout ratio is usually around 30%
and the company is expected to have a good performance so we assumed 33%
(value of 2019) as the dividend payout ratio for the forecasted period.
Nike, Inc is exposed to several risks with a certain associated probability and that may have a low or high impact in its performance and financial wealth. In order to assess and determine the main company risks, it was created a risk matrix. The creation of the matrix was based on three main risk areas: Operational risk, Economic and Market risk, and Political and Regulatory risk. Operational Risks Supply chain visibility (OR1): It may lead to a wrong distribution and waste of products if suppliers cannot meet their obligations in the delivery and tracking of the products. It is necessary to have an accurate database and technological system in order to avoid tracking deviations. Product innovation and design (OR2): The innovation and design of Nike products contribute to the increase in profitability for the company every year and to differentiate its products from the competitors. If the company is not able to “feed”
8. Investment Risks
0,00%
20,00%
40,00%
60,00%
80,00%
ROA (%) ROE (%)
Figure 30 – ROA and ROE (%)
Source: Author, Company Data
0,00
0,50
1,00
1,50
2,00
2,50
3,00
Current Ratio (x) Quick Ratio (x)
Cash Ratio (x)
Figure 31 – Liquidity Ratios
Source: Author, Company Data
Figure 32 – Risk Matrix
Source: The Author

18
consumers with the innovative products that they are expecting and fail to meet market expectations, this may lead to a slowdown in revenues, a decline in stock´s price and a negative impact on the brand image. Concentration of manufacturer suppliers (OR3): Nike is supplied by 112 footwear factories that are located in 12 countries. The company does not own any of the footwear manufacturing facilities, relies on independent contract manufacturers to manufacture the products sold. In fiscal year 2019, the aggregate manufacturers accounted for 61% of NIKE brand footwear production. The company´s ability to meet consumer needs, depends on the relationship and supply of products from its independent contract manufacturers. If some of the significant suppliers decide to cut or change terms of the relationships with Nike, the company may not be able to replace products in time to meet customer´s requests and that could consequently lead to a material adverse effect in the company operational results. Ineffective internal controls (OR4): The company´s internal control over financial reporting may not detect misstatements due to its inherent limitations, which include the possibility of human errors. If Nike fails to maintain the adequacy of its internal control or experience difficulties in its implementation, the business and operating results could be adversely affected and the company could fail to meet its financial reporting obligations. Natural disasters (OR5): Extreme weather conditions are not likely to occur and are somewhat mitigated by the diversity of Nike retail stores and manufacturer firms around the world. However, natural disasters such as hurricanes, earthquakes and tsunamis in China or Vietnam could cause a disruption in operations, since those are the two main countries that most contribute with manufactured products. Economic and Market Risks Purchasing power (EMR1): It is the factor that may cause a higher impact if it decreases. Purchasing power of families may decrease due to low salaries or high inflation rates and the consequence of such events is the decrease in demand for footwear products which will affect in a negative way the revenues and profits of the companies in the industry. Leverage and interest rates (EMR2): The increase in leverage and interest rates it is a medium risk factor because it limits the borrowing needs of companies and, consequently, the ability to invest in new products. An interest rate increase policy encourages families to savings and to decrease its consumption, which leads to a decrease in demand by consumers and may lead to a decline in Nike´s revenues. Foreign currency exchange rates (EMR3): Forex rates are likely to have an impact in company’s imports. EUR/CNY and USD/CNY rates increased from 2017 to 2018. This effect was a helpful factor for Nike since the company has headquarters in Europe (Netherlands) and in the US, with production bases in China. With this effect, the company was able to pay less for imports. Political and Regulatory Risks Increase in regulation of taxes (PRR1): Nike is subjected to tax laws in U.S and several foreign jurisdictions. The company uses subsidiaries in tax havens countries to benefit from the lower or inexistent tax rates compared to the U.S. If these countries increase its regulation and tax rates, there will be an impact in the company´s effective tax rate, Nike may lose its tax benefits and this could have a direct negative impact in the company´s profits. Political instability (PRR2): Changes in U.S or international political and regulatory conditions, as well as negative sentiment towards the US as a result of such changes, may adversely affect the company´s business. The U.S president has proposed changes in policies by imposing higher tariffs on Chinese imports into the U.S, economic sanctions on individuals, corporations, and other government
19
regulations affecting the trade between the U.S and other countries where Nike´s business operates. As a result of these recent policies, there may be disincentives on international trade and the imposition of tariffs leads certain foreign governments to consider imposing retaliatory measures on certain U.S goods. Nike, as well as other multinational corporations, has significant business that could be impacted by changes in the trade policies of the U.S and foreign countries. China regulation (PRR3): Increased regulation in China is not likely but if it does, the increase in minimum wages, definition of less working hours per day, among other measures may have a medium-high impact in Nike´s operating results because the labor costs will increase drastically and this will be reflected in the company´s performance. Risk to Price Target A sensitivity analysis was performed in order to access the impact of several risks on Nike´s final price target. These risks included key components of the DCF valuation model and a combination of changes in both Growth Rate and Perpetuity WACC, respectively. Presented in table x are the risk factors (Growth rate and Perpetuity WACC) that may influence Nike´s final price target. By looking at the table, it is possible to conclude that the company is sensible to a decrease in the Growth Rate while WACC rate increases. This leads to a negative impact on the company´s price target due to the huge weight and impact that these variables have on the Terminal Value. However, if Growth Rate increases while WACC goes down, the opposite effect occurs, leading to an increase in Nike´s final price target.
Growth Rate
Pe
rpe
tuit
y W
AC
C
88,66 -1,93% -1,43% -0,93% -0,43% 0,07% 0,57% 1,07% 1,57% 2,07% 2,57% 3,07%
8,20% 49,51 51,34 53,37 55,64 58,19 61,07 64,36 68,14 72,54 77,73 83,92
7,70% 51,80 53,86 56,16 58,75 61,67 65,00 68,84 73,30 78,55 84,83 92,47
7,20% 54,36 56,69 59,31 62,27 65,65 69,54 74,07 79,40 85,76 93,51 103,13
6,70% 57,23 59,88 62,89 66,32 70,26 74,85 80,25 86,71 94,57 104,32 116,77
6,20% 60,47 63,51 66,99 70,99 75,65 81,13 87,68 95,64 105,54 118,17 134,83
5,70% 64,15 67,68 71,74 76,46 82,02 88,66 96,74 106,78 119,58 136,49 159,83
5,20% 68,38 72,50 77,28 82,92 89,66 97,86 108,04 121,03 138,17 161,85 196,66
4,70% 73,27 78,13 83,85 90,68 98,99 109,32 122,50 139,89 163,91 199,22 256,26
4,20% 78,98 84,79 91,72 100,15 110,63 124,00 141,64 166,01 201,83 259,69 368,94
3,70% 85,74 92,78 101,34 111,97 125,53 143,43 168,15 204,49 263,19 374,03 661,98
3,20% 93,86 102,54 113,33 127,09 145,25 170,33 207,20 266,76 379,22 671,38 3 285,59
Table 13 – Sensitivity analysis: Perpetuity WACC and Growth Rate
Source: The Author
1
Appendices
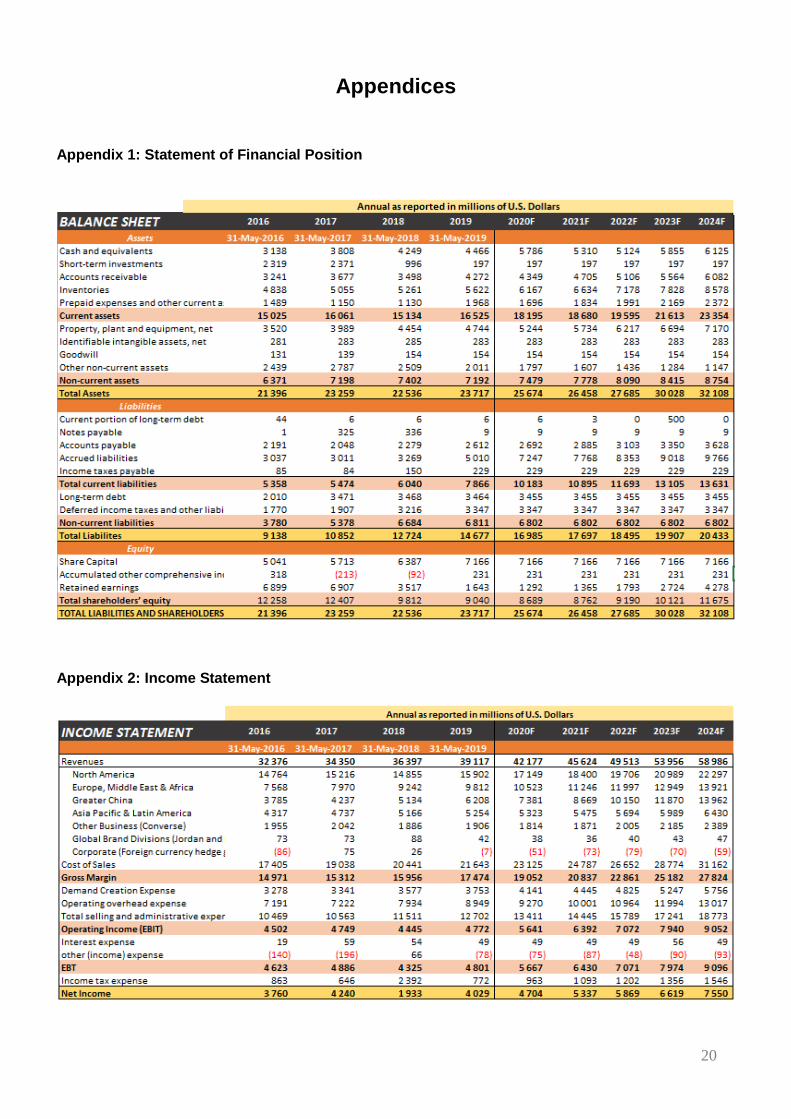
Appendix 1: Statement of Financial Position
Appendix 2: Income Statement
20
2
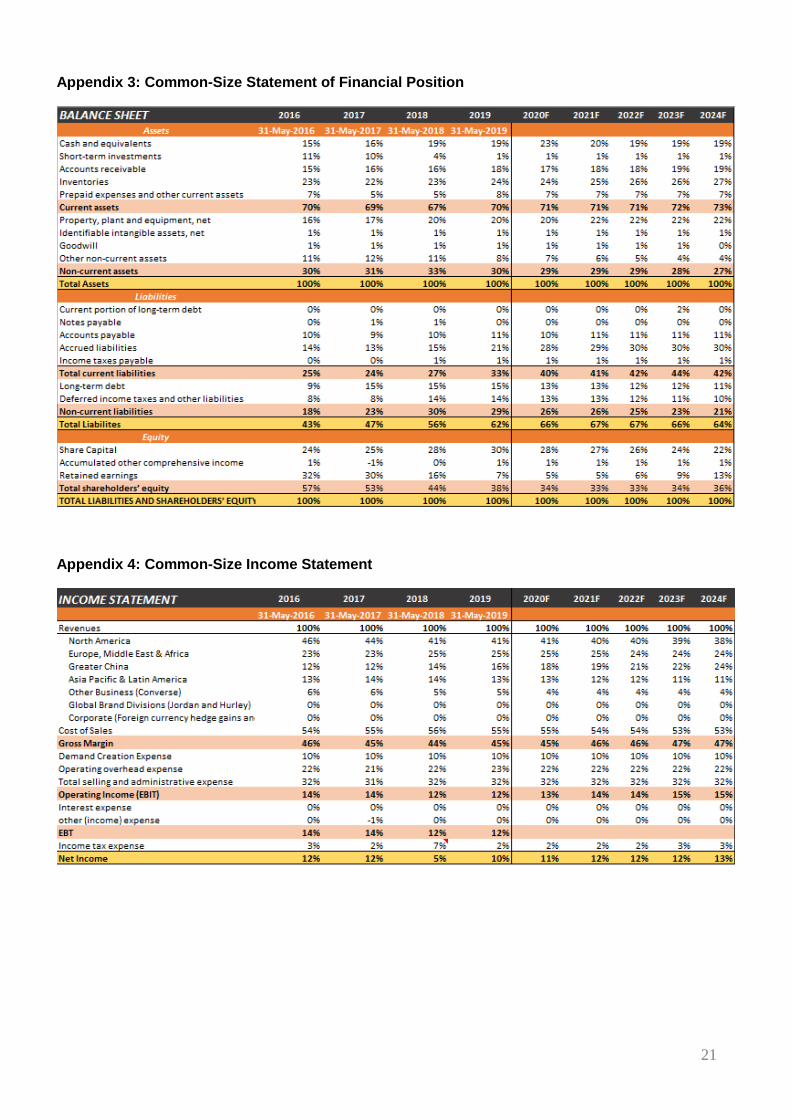
Appendix 3: Common-Size Statement of Financial Position
Appendix 4: Common-Size Income Statement
21
3
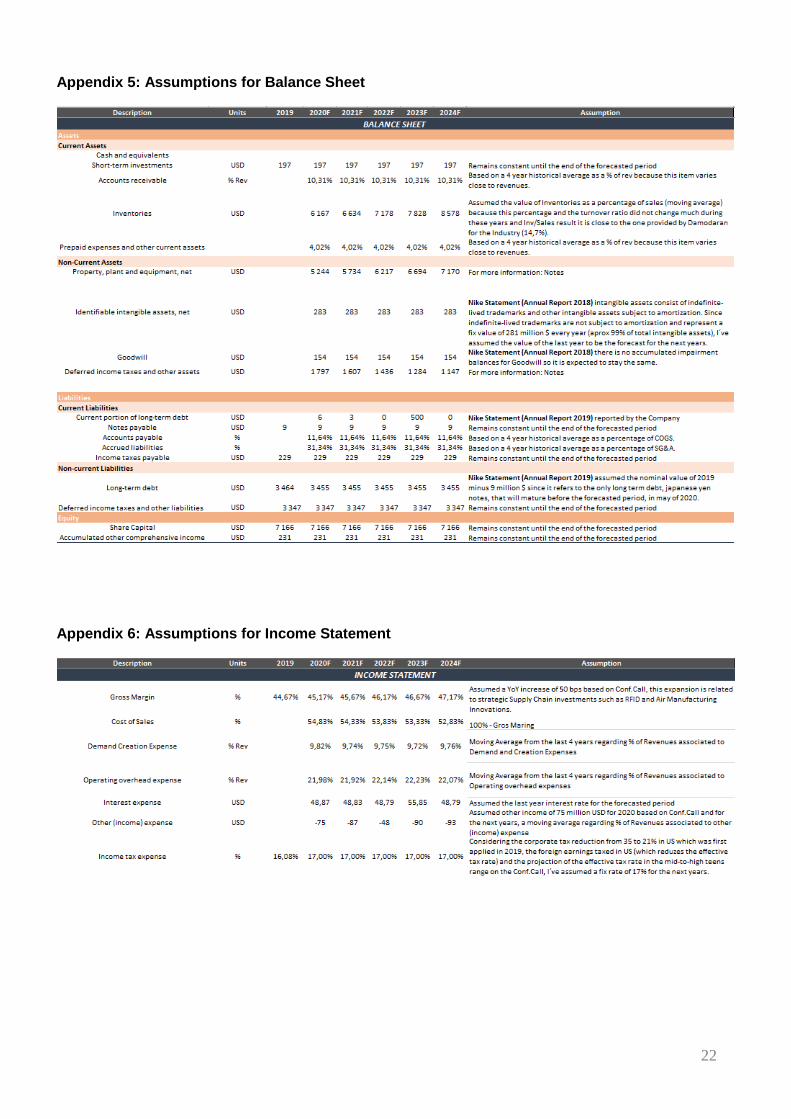
Appendix 5: Assumptions for Balance Sheet
Appendix 6: Assumptions for Income Statement
22
4
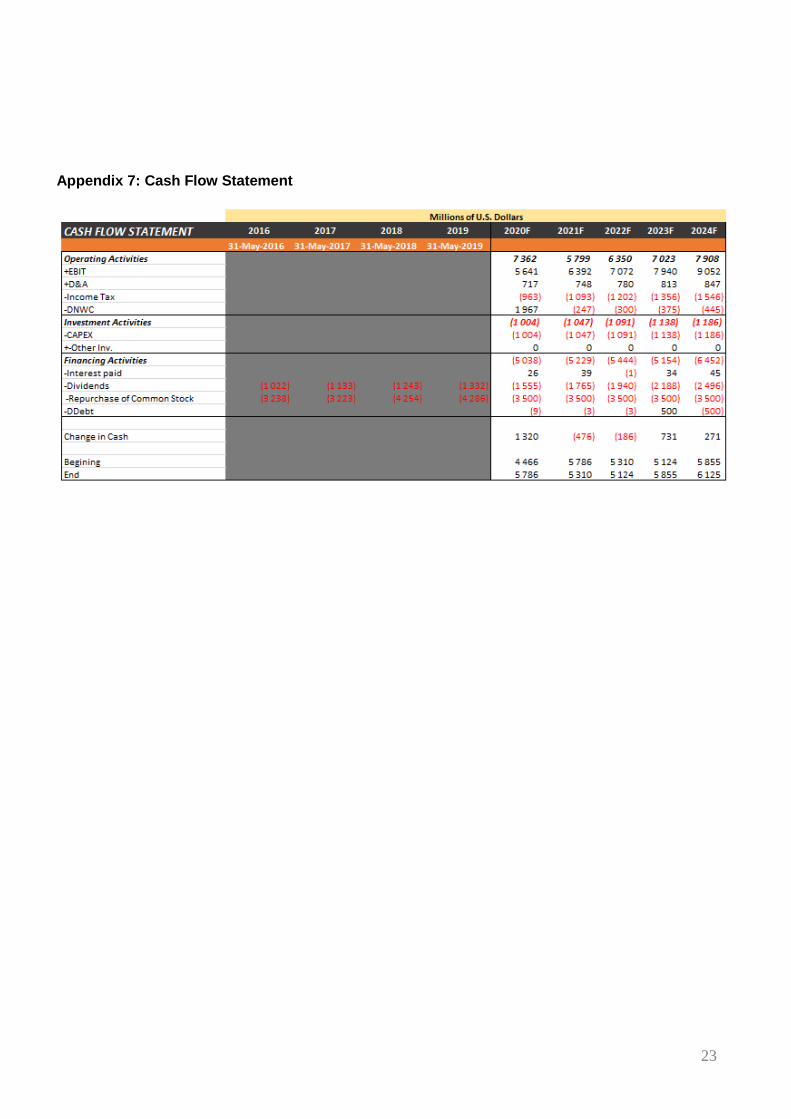
Appendix 7: Cash Flow Statement
23
5
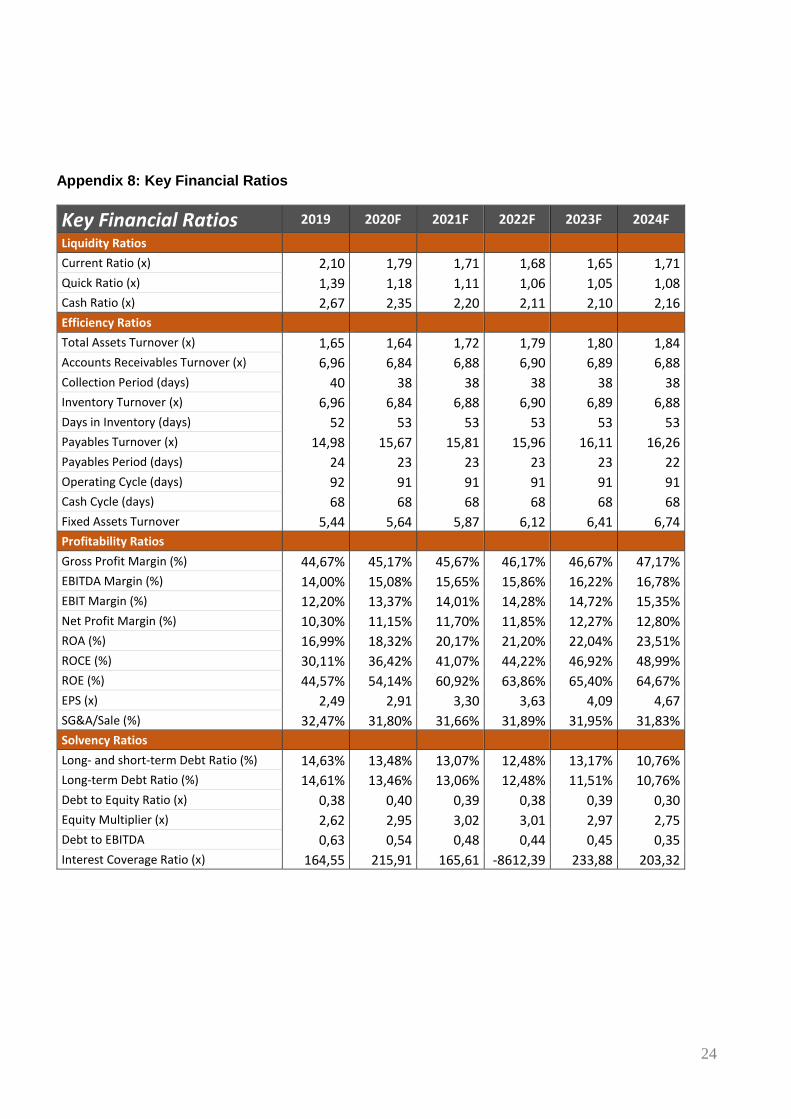
Appendix 8: Key Financial Ratios
Key Financial Ratios 2019 2020F 2021F 2022F 2023F 2024F
Liquidity Ratios
Current Ratio (x) 2,10 1,79 1,71 1,68 1,65 1,71
Quick Ratio (x) 1,39 1,18 1,11 1,06 1,05 1,08
Cash Ratio (x) 2,67 2,35 2,20 2,11 2,10 2,16
Efficiency Ratios
Total Assets Turnover (x) 1,65 1,64 1,72 1,79 1,80 1,84
Accounts Receivables Turnover (x) 6,96 6,84 6,88 6,90 6,89 6,88
Collection Period (days) 40 38 38 38 38 38
Inventory Turnover (x) 6,96 6,84 6,88 6,90 6,89 6,88
Days in Inventory (days) 52 53 53 53 53 53
Payables Turnover (x) 14,98 15,67 15,81 15,96 16,11 16,26
Payables Period (days) 24 23 23 23 23 22
Operating Cycle (days) 92 91 91 91 91 91
Cash Cycle (days) 68 68 68 68 68 68
Fixed Assets Turnover 5,44 5,64 5,87 6,12 6,41 6,74
Profitability Ratios
Gross Profit Margin (%) 44,67% 45,17% 45,67% 46,17% 46,67% 47,17%
EBITDA Margin (%) 14,00% 15,08% 15,65% 15,86% 16,22% 16,78%
EBIT Margin (%) 12,20% 13,37% 14,01% 14,28% 14,72% 15,35%
Net Profit Margin (%) 10,30% 11,15% 11,70% 11,85% 12,27% 12,80%
ROA (%) 16,99% 18,32% 20,17% 21,20% 22,04% 23,51%
ROCE (%) 30,11% 36,42% 41,07% 44,22% 46,92% 48,99%
ROE (%) 44,57% 54,14% 60,92% 63,86% 65,40% 64,67%
EPS (x) 2,49 2,91 3,30 3,63 4,09 4,67
SG&A/Sale (%) 32,47% 31,80% 31,66% 31,89% 31,95% 31,83%
Solvency Ratios
Long- and short-term Debt Ratio (%) 14,63% 13,48% 13,07% 12,48% 13,17% 10,76%
Long-term Debt Ratio (%) 14,61% 13,46% 13,06% 12,48% 11,51% 10,76%
Debt to Equity Ratio (x) 0,38 0,40 0,39 0,38 0,39 0,30
Equity Multiplier (x) 2,62 2,95 3,02 3,01 2,97 2,75
Debt to EBITDA 0,63 0,54 0,48 0,44 0,45 0,35
Interest Coverage Ratio (x) 164,55 215,91 165,61 -8612,39 233,88 203,32
22 24
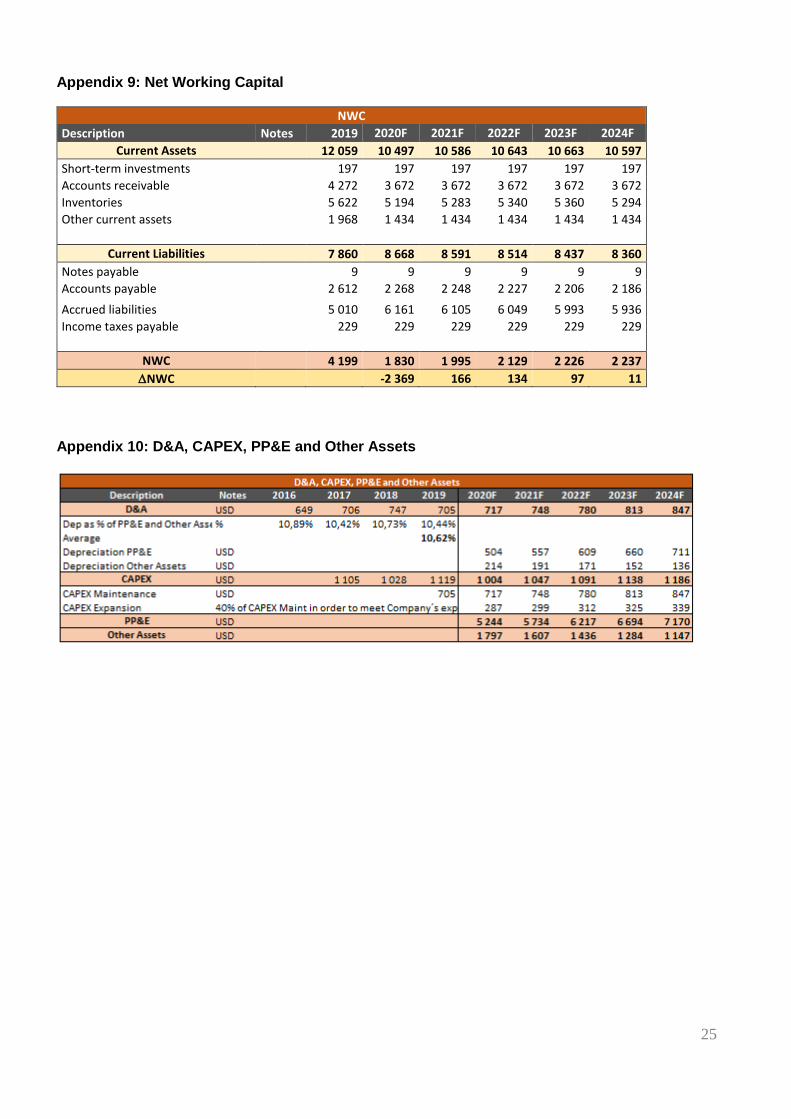
6
Appendix 9: Net Working Capital
NWC
Description Notes 2019 2020F 2021F 2022F 2023F 2024F
Current Assets 12 059 10 497 10 586 10 643 10 663 10 597
Short-term investments 197 197 197 197 197 197
Accounts receivable 4 272 3 672 3 672 3 672 3 672 3 672
Inventories 5 622 5 194 5 283 5 340 5 360 5 294
Other current assets 1 968 1 434 1 434 1 434 1 434 1 434
Current Liabilities 7 860 8 668 8 591 8 514 8 437 8 360
Notes payable 9 9 9 9 9 9
Accounts payable 2 612 2 268 2 248 2 227 2 206 2 186
Accrued liabilities 5 010 6 161 6 105 6 049 5 993 5 936
Income taxes payable 229 229 229 229 229 229
NWC 4 199 1 830 1 995 2 129 2 226 2 237
NWC -2 369 166 134 97 11
Appendix 10: D&A, CAPEX, PP&E and Other Assets
25
7
References
Books
Damodaran, A. (1997). Corporate Finance- Theory and Practice, 1ª Ed. John Wiley & Sons.
Damodaran, A. (2006), Valuation Approaches and Metrics: A Survey of the Theory and Evidance,
Stern School of Business: New York University.
Damodaaran, A. (2012). Investment Valuation: Tools and Techniques for determining the value of any
asset.
Berk, J., Demarzo, P. (2013). Corporate Finance, 3ª Ed. Boston: Pearson.
Investor Relations: Company Consolidated Reports
Nike consolidated annual reports from 2015 to 2019.
NIKE-Inc.-Q419-OFFICIAL-Transcript-with-QA-FINAL (Conference Call from last quarter of 2019)
Databases and Websites
Yahoo Finance: https://finance.yahoo.com/quote/NKE?p=NKE&.tsrc=fin-srch
Damodaran: http://pages.stern.nyu.edu/~adamodar/
IMF World, China and US economic Outlook Database: https://www.imf.org/external/index.htm
Bloomberg and Thomson Reuters Terminal
Statista Database: https://www.statista.com/outlook/250/100/footwear/worldwide
CNN Business Data
26

8
Disclosures and Disclaimer
This report is published for educational purposes by Master students and does not constitute an offer
or a solicitation of an offer to buy or sell any security, nor is it an investment recommendation as
defined by Article 12º A of the Código do Mercado de Valores Mobiliários (Portuguese Securities
Market Code). The students are not registered with Comissão de Mercado de Valores Mobiliários
(CMVM) as financial analysts, financial intermediaries or entities/persons offering any service of
financial intermediation, to which Regulamento (Regulation) 3º/2010 of CMVM would be applicable.
This report was prepared by a Master’s student in Finance at ISEG – Lisbon School of Economics and
Management, exclusively for the Master’s Final Work. The opinions expressed and estimates
contained herein reflect the personal views of the author about the subject company, for which he/she
is sole responsible. Neither ISEG, nor its faculty accepts responsibility whatsoever for the content of
this report or any consequences of its use. The report was supervised by Prof. Victor Barros, who
revised the valuation methodologies and the financial model.
The information set forth herein has been obtained or derived from sources generally available to the
public and believed by the author to be reliable, but the author does not make any representation or
warranty, express or implied, as to its accuracy or completeness. The information is not intended to
be used as the basis of any investment decisions by any person or entity.
Recommendation System
Level of Risk SELL REDUCE HOLD/NEUTRAL BUY STRONG BUY
High Risk 0%≤ >0% & ≤10% >10% & ≤20% >20% & ≤45% >45%
Medium Risk -5%≤ >-5% & ≤5% >5% & ≤15% >15% & ≤30% >30%
Low Risk -10%≤ >-10% & ≤0% >0% & ≤10% >10% & ≤20% >20%