Finance, Facilities, Technology Committee Meeting - Cover ... · Project % Complete Comments 4/2016...
153
Finance, Facilities, Technology Committee Meeting - Cover Letter 1
Transcript of Finance, Facilities, Technology Committee Meeting - Cover ... · Project % Complete Comments 4/2016...

Finance, Facilities, Technology Committee Meeting - Cover Letter
1

Finance, Facilities, Technology Committee Meeting - Directions & Map
2

Board of Trustees
Finance, Facilities & Technology Committee
May 2, 2018, 9:30 am to 12:30 pm Rudman Conference Room, 253 Estabrooke Hall, Orono
AGENDA 9:30 am Technology Items
Review of Projects with a Value of $250,000 or Greater……………………………….. TAB 1 9:45 am Finance Items
FY2019 Proposed Operating & Capital Budget & Student Charges – 2nd reading TAB 2 10:15 am Break 10:30 am Facilities Items
Lease Request (Sigma Phi Epsilon), UM…………...……………............................ TAB 3 Lease Request (USDA), UM………………………..………………………………………………. TAB 4 Full Design Engineering Education and Design Center, UM………………………… TAB 5 Naming Lafayette and Rawcliffe 4-H Science Engineering Center, UM………. TAB 6 Fundraising and Capital Projects – Conflict of Interest Clarification, UM…… TAB 7 Corthell Hall HVAC Upgrades, USM……………..…………………………………………….. TAB 8 Master Plan Acceptance, UMA…………………………………………………………………… TAB 9 Turbine Update, UMPI……………………………………………………………………….......... TAB 10 Capital Project Status Report……………………………………………………………………… TAB 11
Action items within the Committee purview are noted in green.
Items for Committee decisions and recommendations are noted in red.
Note: Times are estimated based upon the anticipated length for presentation or discussion of a particular topic. An
item may be brought up earlier or the order of items changed for effective deliberation of matters before the
Committee.
Finance, Facilities, Technology Committee Meeting - Agenda
3

04/25/2018
AGENDA ITEM SUMMARY
1. NAME OF ITEM: Review of Projects with a Value of $250,000 or Greater
2. INITIATED BY: Karl W. Turner, Chair
3. BOARD INFORMATION: X BOARD ACTION:
4. OUTCOME: BOARD POLICY:
5. BACKGROUND:
Dr. David Demers, Chief Information Officer, will provide information on the followingprojects with a value of $250,000 or greater:
∑ Classrooms for the Future∑ MaineStreet Improvements∑ UMS Wireless Infrastructure∑ HR Upgrade
1Finance, Facilities, Technology Committee Meeting - Review of Projects with a Value of $250,000 or Greater
4

Status Update – April 2018Classrooms for the Future
Overall status: Change from previous report: NoneBudget status: Change from previous report: NoneSchedule status: Change from previous report: None
OverviewThis project will involve renovations to existing classrooms across the entire University of Maine System. The project team will focus on the data obtained during the earlier classroom assessment phase and resulting classroom ratings in order to prioritize work at each campus. The team will also develop standards for equipment in all classrooms. Vendors will be used for the larger renovations and campus services/classroom technology staff will be used for minor renovations and upgrades. Once the rooms have been updated, they will be re-assessed and scored accordingly.
Initiation Date
Sponsor Original Estimated
Completion
Current Estimated
CompletionDate
Estimated Budget
Budget Committed
to date
Budget % Committed
Project % Complete
Comments
4/2016 David Demers
12/2018 12/2018 $4,362,345 $4,183,640 96% 66% Total project budget reflects additional allocation provided Dec. 2017
StatusFacilities and vendor walk-throughs for Summer 2018 upgrades have been completed on the campuses. Equipment and furniture estimates are being finalized, and projects have been setup for UMA, USM and UMaine. Based upon estimates and budgets, projects will be set up for the remaining campuses, and furniture and equipment orders will be placed. All projects will be added to Smartsheet for tracking purposes.
A meeting took place between the project team lead, campus coordinators and project manager to review the role of the campus coordinator and associated responsibilities. A Gantt chart will be used for scheduling classroom work this summer on all the campuses.
BUDGET SUMMARY
Campus Allocation % Committed to Date $$ Not Yet Budgeted % Complete
PROJECT TOTAL $4,362,345 96% $178,705 66%
UMM $195,900 100% -0- 66%
UMF $379,896 100% -0- 82%
UMaine $1,578,220 100% -0- 68%
UMPI $257,276 100% -0- 41%
USM $1,124,080 100% -0- 65%
UMFK $245,768 100% -0- 61%
UMA $581,205 69% $178,705 80%
1.1Finance, Facilities, Technology Committee Meeting - Review of Projects with a Value of $250,000 or Greater
5

Summary by Campus and Classroom ProjectReference: Campus Room Renovations
Campuses Rooms By Project Setup % Complete
UMA Music Arts 124 100%
RRSC 248 & 255 100%
UC Bath/Brunswick 114 100%
UC Norway SoPar 114 & 206 100%
UC Saco 111 100%
UC Ellsworth 2 & 7 100%
UC Rockland 410 & 413 100%
Jewett 124, 180, 189, 190 & 291 100%
UC Rockland 403, 410, 412 48%
Fine Arts 122 48%
Jewett 284, 293, 297 48%
Katz 5, 15, 51 & 53 48%
UMA Bangor 135, 142 48%
UMF Roberts 205 & 207 100%
Ricker Addition 202, 205 100%
Roberts C23 & 131 100%
Ricker Addition 217 100%
Preble 117 100%
Roberts 105, 107, 201, 203 100%
South 115 100%
Education Center 6 & 113 100%
Tech Commons Fusion Center 10%
Roberts 3, 101, 103 10%
UMaine Shibles 202 100%
DPC 105 90%
Neville 101 100%
Estabrook 130, 152 100%
Bennett 215 100%
Dunn 315 & 316 100%
South Stevens 106D 100%
DPC 107, 115, 117 90%
Boardman 116 100%
Boardman 118 100%
1.1Finance, Facilities, Technology Committee Meeting - Review of Projects with a Value of $250,000 or Greater
6

Shibles 217, 313, 316 100%
Nutting 100 100%
Aubert 354 100%
Hitchner 157 100%
Jenness 102, 104, 108 100%
Lengyel 127 100%
Libby 220 100%
Little 110, 120, 202, 206, 220 100%
Lord 200 100%
Colvin 401 100%
Memorial Gym Complex 106 & 110 (ROTC Army) 100%
Merrill 228a 100%
Murray 102 & 106 100%
N Stevens 235 100%
Rogers 206 100%
ROTC Navy 201 90%
ROTC Navy 203 48%
Deering 101c 100%
Barrows 123, 131, 133 100%
Balentine 129 100%
Dunn 1, 44, 401 25%
Barrows 124 25%
Bryand Global 100 25%
Deering 17 25%
North Stevens 235 25%
South Stevens 232-B 25%
Neville 116, 118, 120 10%
Little 212 25%
Aubert 165 10%
Barrows 126 10%
Class of 44 100 10%
Colvin 401 10%
DPC 111 10%
Little 350 10%
Center Stevens 155 10%
1.1Finance, Facilities, Technology Committee Meeting - Review of Projects with a Value of $250,000 or Greater
7

Darling Marine Center Brooke Hall 10%
PAIL Necropsy Lab 10%
UMM Torrey Hall 230, 232, 234 - Phase 1 100%
Torrey Hall 106 100%
Powers 208 & 209 100%
Science 114 100%
Science 102 & 120 100%
Powers Music 10%
Torrey 230, 232 - Phase 2 10%
Reynolds Center 14, Conference 10%
UMFK Powell 123 100%
Cyr 113 100%
Old Model School 11 100%
Cyr 200 & 201 100%
Cyr 113, 200, 201, 203, 204, 205, 209 10%
Nadeau Telecom Room 10%
Powell 123 - Phase 2 10%
UMPI Folsom 206 100%
Houlton 120 & 125 49%
Pullen 113, 212, 216 100%
Folsom 204 & 205 100%
Houlton 110 10%
Folsom 203 10%
Pullen 212, 213, 214, 215 10%
Preble 239 10%
Gentile Athletic 10%
Weidan Training 10%
USM 405 Bailey 98%
John Mitchell 217 100%
Payson Smith 301A 100%
LB 103 75%
Masterson 113 100%
Bailey 320 80%
Bailey 10, S113, 201, 202, 204, 205, 206, 207, 208, S213, S215, 218, S312, S313, 315, L319, 320, L321, C402, C403, C404, 405,
100%
Corthell 112, 211, 212 100%
1.1Finance, Facilities, Technology Committee Meeting - Review of Projects with a Value of $250,000 or Greater
8

John Mitchell 151, 164, 181, 233, 235, 242, 252, 265, 270 48%
LAC 287 100%
LAC 210, 211, 212, 214, 216, 218, 224 100%
LB 208, 209, 241, 302, 303, 310, 326, 327, 402, 403, 410, 424, 425, 502, 503, 509, 510, 523, 524
100%
Payson Smith 1, 41, 42, 44, 200, 201, 202, 203, 204, 205, 206, 207, 208, 209, 211, 303, 304, 306
100%
Wishcamper 103, 113, 417, 419/427 48%
Science 203, 403 48%
Law 506 25%
Payson Smith 42, 44, 201, 206, 304, 306 - Phase 2 25%
Bailey 218, 312, 313, 402 25%
LAC 104 25%
Glickman Library 423/424 25%
Luther Bonney 209 25%
Science 157, 533 25%
Russell 1 and Dance Studio 25%
Masterton G38 25%
*Summary Table Note - Phase 1 refers to Summer 2017 projects and Phase 2 refers to Summer 2018 projects.
Risks
∑ Renovations and improvements to classrooms are limited to summer and school breaks. In addition, vendors need advance notice to schedule larger renovations due to the competitive nature of this work and the lead time for ordering equipment.
∑ Wireless and network infrastructure will not be upgraded in classrooms at UMPI, UMFK and UMF∑ The discovery of asbestos containing materials at USM will lead to more thorough test prior to starting
work in a building. US:IT is working closely with Facilities Capital Planning on a mitigation plan that includes testing and abatement. The need to complete more testing than anticipated and possibly conduct additional abatement poses a risk to both project schedule and cost.
1.1Finance, Facilities, Technology Committee Meeting - Review of Projects with a Value of $250,000 or Greater
9

Status Update - April 2018MaineStreet Improvements
Overall status: Change from previous report: NoneBudget status: Change from previous report: NoneSchedule status: Change from previous report: None
OverviewThis project will engage with faculty and students to find ways to improve their experience working with MaineStreet including bringing MaineStreet functions to mobile platforms, which can subsequently be extended to a variety of uses. We also will engage with decision makers in the One University initiative to discover and understand changes in business process that will need support in MaineStreet. Once these changes have been identified, we will work with affected functional areas to plan, implement, and test the specific MaineStreet changes that are required.
Initiation Date
Sponsor Original Estimated
Completion Date
Current Estimated
CompletionDate
Estimated Budget
Budget Expended
to Date
Project % Complete
Comments
4/2016 John Grover
2019 2019 $2,000,000 $51,734 15%
Status Oracle is putting more effort into making their PeopleSoft product mobile friendly and nearly all student self-service components are mobile friendly in the newest releases of their software. This improved support by Oracle most likely alleviates the need to invest in a product to provide the mobile interface and will allow focus, instead, on accelerating testing and implementation of newer releases of PeopleSoft modules.
During November 2017, Oracle representatives conducted a series of interactive sessions with staff from several administrative offices across the University of Maine system including Student Records & Advising, Financial Aid, Admissions, and Student Financials. In January, Oracle provided an executive summary of their key findings and recommendations to senior US:IT staff. Two of Oracle’s recommendations pertain to ensuring the UMS is fully leveraging the existing capabilities within the PeopleSoft Campus Solutions environment and to explore upgrading Campus Solutions from version 9.0 to 9.2. The link below is to Oracle’s report:
Oracle Health Check Summary
On March 15, Oracle visited the UMaine campus to present their findings to UMS staff who participated in the November Health Check sessions. Following the on-site session, were asked to complete a survey to collect feedback that will factor into Campus Solutions upgrade planning. Results will be compiled during the week of April 16.
The MaineStreet Improvements project team and US:IT Leadership will refer to Oracle’s findings and results of the feedback survey while considering strategies for the Campus Solutions 9.2 upgrade. Additionally, it will evaluate the Oracle roadmap for Student Cloud. Along with providing desired user interface improvements, the Campus Solutions 9.2 upgrade will provide an opportunity to inventory and assess existing customizations with an eye on reducing/eliminating them. This will facilitate a future migration to a more flexible SaaS offering that will better support emerging University needs.
Recently Completed● Oracle Health Check on-site presentation (March 15).
In Progress● US:IT leadership and project team reviewing Oracle’s findings and recommendations.
1.1Finance, Facilities, Technology Committee Meeting - Review of Projects with a Value of $250,000 or Greater
10

Risks● EAB SSC Guide introduces some complexity to manage. We don’t wish to contribute to “app fatigue” on
those campuses implementing Guide, but we have other campuses that are not there yet. Guide will direct the students to web-enabled pages which may be delivered as part of this project. Details and specifications are as yet unknown.
1.1Finance, Facilities, Technology Committee Meeting - Review of Projects with a Value of $250,000 or Greater
11

Status Update April 2018UMS Wireless Infrastructure
Overall status: Change from previous report: NoneBudget status: Change from previous report: NoneSchedule status: Change from previous report: None
OverviewThis project is a wireless technology connectivity Initiative to upgrade wireless service and associated cabling and equipment at all campuses to bring wireless capacity to gigabit speeds to support learning and living spaces.
Initiation Date
Sponsor Original Estimated
Completion Date
Current Estimated
CompletionDate
Estimated Budget
Budget Expended to
Date
Project % Complete
Comments
4/2016 Jeffrey Letourneau
12/2018 12/2018 $12,800,000 $5,830,691.62 ($559,507.55 encumbered)
56%
Status The cabling contractor has not yet been able to complete work in Bailey Hall at USM as Facilities Management Capital Planning is still working on an assessment of potential hazardous materials. In the meantime, work is nearly complete in the C-wing of the Science building and planning is underway for Glickman Library with a plan to begin cabling in May. However, we are awaiting confirmation that there are no asbestos concerns in Glickman before confirming the schedule. Asbestos assessments will be a schedule risk for all future projects at USM.
At UMaine, upgrades have been completed in Little, Murray and Aubert. Class of 1944 and Lengyel are nearly complete and work is underway in Lord Hall. Our resources will be focused on upgrading UMaine Residence Halls this summer. This work is not funded by this project (funded by UMaine Auxiliary Services), but uses the same project resources.
Planning is ongoing for summer work in the Scott Halls at UMF, Dorward and Sennett at UMM, Blake Library at UMFK, and Weiden at UMPI. No work is currently planned for the UMA campuses other than completing some facilities work associated with previous upgrades (such as HVAC installations).
Campus fiber infrastructure upgrades are also being planned for UMPI, UMF, and parts of UM.
BUDGET SUMMARY
Campus Allocation% Budgeted
to Date$$ Not Yet Budgeted
% Expended & Encumbered
to Date
$$ Expended &
Encumbered
$$ Not Yet Expended/
Encumbered
PROJECT TOTAL $12,800,000 95% $587,460 50% $6,390,199 $6,409,801
Equipment in Inventory $762,313
System-wide Services $620,000 100% $0 100% $620,362 -$362
UM - Machias $653,200 100% $0 58% $381,229 $271,971
UM - Farmington $1,674,800 100% $0 89% $1,485,445 $189,355
UMaine $3,189,600 96% $137,150 18% $580,951 $2,608,649
UM - Presque Isle $615,200 84% $97,765 74% $456,619 $158,581
USM $5,017,600 93% $352,525 23% $1,168,724 $3,848,876
UM - Fort Kent $469,600 100% $20 87% $409,665 $59,935
UM - Augusta $560,000 100% $0 94% $524,890 $35,110
(*) = original $11.2M allocation plus reallocation of $980k plus $620K required from contingency funding for system-wide licensing.
1.1Finance, Facilities, Technology Committee Meeting - Review of Projects with a Value of $250,000 or Greater
12

BUILDING SUMMARYComplete1 Installation & Deployment Scheduled / In
Progress2Planning - Not yet Budgeted
University of Maine at AugustaLewistonKatzJewettRandall
EastportCamdenBelfast Civic CenterCollege Center
University of Maine at FarmingtonMantor LibraryDakinBlackMallett
Lockwood PuringtonStone
Summer 2018Scott NorthScott West Scott South
Roberts Learning Center3
University of Maine at Fort KentPowellThe LodgeCrocker
Blake Library (5%) Old Model Sch3
Cyr3
University of Maine at MachiasTorrey Hall / Merrill LibraryReynolds
PowersScienceKilburn
Summer 2018DorwardSennett
University of Maine at Presque IslePark Emerson
MerrimanFolsom-Pullen
Weiden
University of MaineFogler LibraryShiblesBennettRogersJenness
Bryand Global Science BoardmanMurray Hall4
LittleAubert
Begin 0-3 monthsEstabrook Core (40%)Class of 1944 (90%)Lengyel (75%)Lord (30%)Crosby Lab
Begin 3-6 monthsNutting (85%)Fernald (60%)Neville (90%)Barrows (50%)HitchnerBegin 6-9 monthsDonald P Corbett (0%)Winslow(85%)
Colvin HallSculpture BuildingDunn
University of Southern MaineDrawing StudioPrint StudioAcademy Building
Wireless OnlyWishcamper John Mitchell Cen Law Building
Abromson In ProgressBailey (85%)Payson-Smith (15%)Science (75%)Begin 0-3 monthsLuther-BonneyGlickman LibraryMasterton HallWishcamper (wired)JMC (wired)
Begin 3-6 monthsCorthellBrooks DiningCostell ComplexSullivan ComplexBegin 6-9 monthsLewiston-AuburnWoodbury
1 Networks are online and functioning; some testing and close-out paperwork may remain to be done2 Dates are estimated start dates for cable installation & deployment – subject to change3 Insufficient funding to upgrade entire building; minimal upgrades to support Classrooms for the Future or future upgrades4 Partial upgrade due to building limitations
1.1Finance, Facilities, Technology Committee Meeting - Review of Projects with a Value of $250,000 or Greater
13

Risks● Identification of asbestos containing materials (ACBM) at USM in an area that was not anticipated has led
to a higher awareness of and need to test for ACBM. Both the need for increased testing and the probability of higher than anticipated abatement needs will impact both project schedule and cost. The degree of impact will not be known until test results are completed.
● The project team is working closely with the Classrooms for the Future project team to coordinate efforts. Campus decisions to prioritize upgrades in residence halls over classroom buildings may negatively impact the Classrooms for the Future project.
● Many of the buildings require modifications by Facilities Management prior to network installation. The project team is working with each campus to plan this work. Resource availability and scheduling for this work may cause project delays.
● A risk to perceived success is unreasonable stakeholder expectations. Although a ubiquitous system-wide upgrade is needed, this project will only partially meet that need given the constraints of limited resources (schedule, budget, staffing, construction limitations, and coordination with other campus resources).
● Many buildings have network infrastructure that will need to be upgraded before new wireless networks can be installed. In some cases, this may include new fiber installation and/or the need for facility renovations.
● The phased funding approach will necessitate maintaining two separate WiFi networks on most if not all campuses driving up the ongoing operational costs and efforts for US:IT while creating inconsistent wireless service levels building to building on the campuses.
● There are a large number of factors and variables that will affect this project’s timeline. There are other sizeable projects taking place at the same time. Another factor affecting the timeline will be the coordination among involved entities in setting priorities and timing.
1.1Finance, Facilities, Technology Committee Meeting - Review of Projects with a Value of $250,000 or Greater
14

Status Update - April 2018HR 9.2 Upgrade
Overall status: Change from previous report: NoneBudget status: Change from previous report: YesSchedule status: Change from previous report: None
OverviewThis project will upgrade the UMS PeopleSoft (MaineStreet) Human Capital Management (HCM) system from version 9.1 to version 9.2, the HCM PeopleTools from version 8.53 to version 8.55. The upgrade will maintain Oracle compliance and continued support of the system. To expedite and achieve economies of scale, the project will also cover improvements in interfaces and systems that support the Benefits and Payroll Center of Excellence. In addition to the HR application and PeopleTools upgrades, the scope includes transitioning the HR PeopleSoft environments from the legacy Solaris architecture to Linux architecture.
Initiation Date
Sponsor Original Estimated
Completion Date
Current Estimated
CompletionDate
Estimated Budget
Budget Expended
to Date
Project % Complete
Comments
6/2017 David Demers/Mark Schmelz
Spring 2018 Spring 2018 $572,830(Upgrade)
$510,577 67%
$480,000(HR
Enhancements)
$75,800
StatusProject TimelineThe project is on track for completion by the end of Spring 2018. The HR Upgrade project team decided in late March, however, that it was necessary to move the initial go-live date from May 22 to June 11 for the following reasons:
∑ Installation and testing of the upgraded HR application and PeopleTools was dependent on completing the design and build of the new Linux architecture. The PeopleSoft HR environments were the first to be transitioned from Solaris to Linux, so timeline contingency was built into the project plan to offset potential delays. As the project progressed, delays were encountered while building the new architecture. It was determined at the time that the timeline contingencies sufficiently offset the delays and mitigated any risk to the project go-live date.
∑ In early February, preliminary upgrade testing revealed the MaineStreet PeopleSoft Portal was using a version of PeopleTools (v. 8.53) that was not compatible with the HR 9.2 default Fluid navigation. Fluid navigation uses homepages and tiles as the starting point for navigating PeopleSoft rather than the drop-down menus and breadcrumbs used in the Classic navigation. Two options to address the issue were researched:
1. Upgrade the Peoplesoft Portal to a compatible PeopleTools version. This option would also support future work to move the Campus Solutions and Financials modules to the new architecture.
2. Customize the upgraded HR 9.2 application to use the Classic navigation.
Both scenarios would require additional programming time and would increase the project’s original scope.
After consultation with ERPA, Oracle, internal HR/IT resources, and a round of feasibility testing, it was decided that option 1 results in the least risk for the project and the best path forward for future PeopleSoft upgrades and maintenance. It was estimated that a three-week extension of the go-live date is required to allow additional time for adding the Portal PeopleTools upgrade to the project’s scope along with ensuring go-live would not fall within a
1.1Finance, Facilities, Technology Committee Meeting - Review of Projects with a Value of $250,000 or Greater
15

payroll cycle. The go-live extension does not affect HR operations or put any HR-related deadlines at risk. The additional 3 weeks allows time for:
∑ Additional tasks to both IT and HR staff to accomplish the PeopleSoft Portal upgrade.∑ System Integration Testing (SIT) - Testing of the new architecture and connectivity with external vendors
such as Cigna, Hoonuit, TIAA, HireTouch, etc.∑ Full User Acceptance Testing (UAT) which is critical for a successful upgrade.
With the go-live dependency of successful SIT and UAT testing, the project go-live date will be reassessed immediately following UAT.
Project BudgetThe estimated project budget for the HR Upgrade is $572,830 with additional funds earmarked to implement the improvements listed in the “In Progress for Interface and System Improvements” section of this report ($480,000).
As the HR Upgrade project progressed, the following factors resulted in additional unanticipated costs for the HR Upgrade project.
∑ Designing, building, and configuring the new Linux infrastructure took longer than anticipated and we used more of ERPA’s time on that phase than we anticipated.
∑ ERPA expended additional effort while exploring alternatives to address the portal incompatibility issue. ∑ ERPA’s review with the HR functional team of current manual workarounds that might be eliminated by
new capabilities in 9.2, in addition to analysis of the identified improvements, required more of ERPA’s effort than was anticipated. Rather than utilize the funds specifically set aside to implement the improvements, the analysis efforts were funded by the HR Upgrade project budget.
∑ The additional 3 weeks allocated for project go-live will necessitate additional time, engagement and charges from our implementation consultants
Based on current projections, it is anticipated that total anticipated budget gap will be $138,000. With reallocation strategies designed to reduce this gap, including reduction of project management services and reliance on internal resources, we expect a total unmet need of $112,400 which will be addressed with available project contingency funds and other IT-related savings.
Recently Completed∑ Test Move to Production (MTP) #2∑ Completed ERP Analyst’s Testing as a Service (TaaS) of system testing∑ Successfully completed PeopleSoft Portal PeopleTools upgrade in Test environment∑ TaaS performance testing plan∑ Identified vendors for integration testing
In Progress for Upgrade∑ Conduct TaaS performance testing ∑ Vendor integration testing∑ User Acceptance Testing (UAT) planning ∑ Drafting UAT testing scripts∑ Test MTP #3 (for UAT)∑ Go-live checklist preparation∑ Training and communication planning ∑ Retrofitting SQRs, integrations, queries∑ Although it falls outside of the HR Upgrade project, the TIAA plan document required to proceed with
TIAA file feed modifications to support Roth IRA contributions is in final stages of modification.
In Progress for Interfaces and System Improvements∑ Leave of Absence module∑ Comp Time module∑ Automating I-9 form processing∑ Retirement file interface∑ Benefits billing automation∑ Tuition waiver form automation
1.1Finance, Facilities, Technology Committee Meeting - Review of Projects with a Value of $250,000 or Greater
16

∑ Add Pay request automation via component interface∑ POI form automation∑ Personnel Action Form automation∑ Enable Terminations process∑ Roth IRA∑ Current manual workarounds being compared to new capabilities in 9.2 with goal of eliminating manual
tasks
Risks∑ Time Admin fails on Novatime file. It is expected this issue will be resolved prior to the 4/30 UAT testing.∑ There are a number of processes that produce data files that are encrypted and passed to the DMZ for
pickup by users or delivery to 3rd parties. There is still some difficulty in getting this working. A solution is in development and resolution should occur prior the 4/30 UAT testing.
∑ There are a number of Fluid based self-service pages that have not yet been tested. It is expected that testing will go smoothly, but it remains a risk.
∑ A few HR processes that use the Mass Change engine are encountering errors. It is expected that the issues are close to resolution.
∑ Availability of HR and IT resources to complete project tasks in a timely manner. ∑ Potential Incompatibility between 9.2 and existing customizations, interfaces, reports, etc.
1.1Finance, Facilities, Technology Committee Meeting - Review of Projects with a Value of $250,000 or Greater
17

1.1Finance, Facilities, Technology Committee Meeting - Review of Projects with a Value of $250,000 or Greater
18

4/26/2018
1
US:IT PROJECT (>$250,000) REVIEWFinance – Facilities – Technology CommitteeMay 2, 2018
US:IT PROJECT (>$250,000) REVIEW
Classrooms for the Future (Tab 1.1; Page 5)
62% Complete (Feb) 66% Complete (Apr)
Feb AprRemaining $1,672,458.00 $178,704.00Expended $2,689,887.00 $4,183,640.00
$0.00$500,000.00
$1,000,000.00$1,500,000.00$2,000,000.00$2,500,000.00$3,000,000.00$3,500,000.00$4,000,000.00$4,500,000.00$5,000,000.00
Project Budget - $4.362M**
Expended Remaining
**Additional $526K allocated Dec’17
1.2Finance, Facilities, Technology Committee Meeting - Review of Projects with a Value of $250,000 or Greater
19

4/26/2018
2
US:IT PROJECT (>$250,000) REVIEW
Classrooms for the Future (Tab 1.1; Page 5)
2017 & 2018 Classroom Upgrades
US:IT PROJECT (>$250,000) REVIEWClassrooms for the Future (Tab 1.1; Page 5)
Summer ’18 Vendor/Facilities walk‐throughs completed
Equipment orders being finalized
Summer ’18 Classroom Targets (87 Classrooms)
Risks
Timing ‐ Work performed during summer/breaks only
Coordination with Wireless Infrastructure Project
Asbestos testing/abatement considerations at USM
UM 21UMA 18UMF 4UMFK 9
UMM 5UMPI 9USM 21
1.2Finance, Facilities, Technology Committee Meeting - Review of Projects with a Value of $250,000 or Greater
20

4/26/2018
3
US:IT PROJECT (>$250,000) REVIEW
MaineStreet Improvements (Tab 1.1; Page 10)
15% Complete (Feb) 15% Complete (Apr)
Feb AprRemaining $1,948,266.00 $1,948,266.00Expended $51,734.00 $51,734.00
$0.00
$500,000.00
$1,000,000.00
$1,500,000.00
$2,000,000.00
$2,500,000.00
Project Budget - $2.000M
Expended Remaining
US:IT PROJECT (>$250,000) REVIEW MaineStreet Improvements (Tab 1.1; Page 10)
Oracle “Health Check” (Nov’17)
Review of current Campus Solutions environment; participation from functional offices (Registrar, Financial Aid, Admissions)
Recommendations: Focus on leveraging available PeopleSoft features
“Oracle Day” (Mar’18)
Preview/review of available features/functionality in Campus Solutions v 9.2 and beyond
Feedback from participants has identified key features to prioritize for implementation
Currently pre‐planning for accelerated Campus Solutions 9.2 upgrade project
Inventory current catalog of customizations to the platform
Align CS to prepare for re‐implementation or migration for sustainability and adaptability to system‐wide needs
Risks
Coordination of Campus Solutions 9.2 features with EAB SSC‐Guide
Shift focus to available PeopleSoft functionality
1.2Finance, Facilities, Technology Committee Meeting - Review of Projects with a Value of $250,000 or Greater
21

4/26/2018
4
US:IT PROJECT (>$250,000) REVIEW
UMS Wireless Infrastructure (Tab 1.1; Page 12)
51% Complete (Feb) 56% Complete (Apr)
Feb AprRemaining $6,164,656.00 $6,409,802.00Exp/Encumb. $6,635,344.00 $6,390,198.00
$0.00$2,000,000.00$4,000,000.00$6,000,000.00$8,000,000.00
$10,000,000.00$12,000,000.00$14,000,000.00
Project Budget - $12.80M**
Exp/Encumb. Remaining
**Reflects increase of $980K from reallocation Dec’17
US:IT PROJECT (>$250,000) REVIEW
UMS Wireless Infrastructure (Tab 1.1; Page 12)
% Budgeted/% Completed by Campus
1.2Finance, Facilities, Technology Committee Meeting - Review of Projects with a Value of $250,000 or Greater
22

4/26/2018
5
US:IT PROJECT (>$250,000) REVIEWUMS Wireless Infrastructure (Tab 1.1; Page 12)
Remaining Focus for Spring 2018: UM & USM
USM: Bailey Hall*, Glickman*
UM: Lord Hall; planning for Residence Halls (funded by Aux Services)
Risks
*Asbestos ceiling tiles (USM); testing/abatement strategy with Facilities Capital Planning
Stakeholder expectations vs. funding reality
Phased funding will necessitate maintaining parallel wireless networks
US:IT PROJECT (>$250,000) REVIEW
HR Upgrade (Tab 1.1; Page 15)
50% Complete (Feb) 67% Complete (Apr)
HR Upgrade EnhancementsRemaining $62,253.00 $404,200.00Expended $510,577.00 $75,800.00
$0.00$100,000.00$200,000.00$300,000.00$400,000.00$500,000.00$600,000.00$700,000.00
Project Budget - $573K*
Expended Remaining
1.2Finance, Facilities, Technology Committee Meeting - Review of Projects with a Value of $250,000 or Greater
23

4/26/2018
6
US:IT PROJECT (>$250,000) REVIEW HR Upgrade (Tab 1.1; Page 15)
Go‐live pushed from 5/22 to 6/11
Address incompatibility with production PS portal
Ensure full testing
Project Budget has been strained by:
Additional time required to complete deployment of infrastructure
Addressing solutions to incompatibility issues
Extension of project timeline
Project $112K shortfall that will be covered through contingency funds
Risks
Potential issues that may be uncovered through User‐Acceptance Testing
Unknown incompatibilities between HCM 9.2 and current customizations
1.2Finance, Facilities, Technology Committee Meeting - Review of Projects with a Value of $250,000 or Greater
24

AGENDA ITEM SUMMARY
1. NAME OF ITEM: FY2019 Proposed Operating & Capital Budget andStudent Charges – Second Reading
2. INITIATED BY: Karl W. Turner, Chair
3. BOARD INFORMATION: BOARD ACTION: X
4. OUTCOME: BOARD POLICY:Enhance fiscal positioning Policy 701 – Capital Budgets
5. BACKGROUND:
Vice Chancellor Low will present the FY2019 Proposed Operating & Capital Budget and Student Charges for the University of Maine System.
This is the second reading of the budget, and a vote of the Committee will be taken and forwarded to the Board of Trustees at the May 20-21, 2018 meeting.
6. TEXT OF PROPOSED RESOLUTION:
That the Finance, Facilities and Technology Committee forwards this item to the Consent Agenda at the May 20-21, 2018 Board of Trustees meeting for approval of the following resolution:
That the Board of Trustees accepts the recommendations of the Finance, Facilities and Technology Committee and approves the FY2019 Proposed Operating & Capital Budget, Recommended Student Charges, and proposed Transfers from Institutional Reserves.
4/25/2018
2
Finance, Facilities, Technology Committee Meeting - FY2019 Proposed Operating & Capital Budget & Student Charges – 2nd reading
25

1
FY2019PROPOSED OPERATING
BUDGET, CAPITAL BUDGET& STUDENT CHARGES
Second Reading
Finance, Facilities & Technology Meeting
May 2, 2018
2.1
Finance, Facilities, Technology Committee Meeting - FY2019 Proposed Operating & Capital Budget & Student Charges – 2nd reading
26

2
Table of Contents
3-4 Budget Overview5 Budget Stabilization Fund6 Enrollment7 Residence Hall Occupancy8 FY19 Recommended In-State Tuition Rates9 In-State Undergraduate Average Costs
10 Funding Depreciation11 Aging Infrastructure12 Capital Investment from Operations13 MEIF14 Compensation & Benefits15 FY19 Budget Position Changes
16-18 FY19 Proposed Budget 19 Quasi-Independent State Entities 20 Appendix
Page
2.1
Finance, Facilities, Technology Committee Meeting - FY2019 Proposed Operating & Capital Budget & Student Charges – 2nd reading
27

3
FY19 Budget Overview• Budget focus on Board of Trustees priority &
secondary outcomes
• Enrollment Increase– Early College projected credit hour increase of 2.9%
– UMPI estimates 4,200 credit hours in the new CBE program
– UM’s budget reflects a 0.3% enrollment increase with continued growth in out of state enrollments
• In-state, undergraduate tuition & Unified Fee increase at CPI at most campuses – 2.3%
• Utilization of reserve funds– 2 campuses are using campus reserves to balance
in FY19– University Services is utilizing reserves to reduce cost allocation to
campuses
• FY19 appropriation is budget flat per State’s FY2018-2019 biennial budget.
2.1
Finance, Facilities, Technology Committee Meeting - FY2019 Proposed Operating & Capital Budget & Student Charges – 2nd reading
28

4
FY19 Budget Overview
E&G Auxiliary TotalCampus Reserves
Administrative Savings
Budget Stabilization Total
UMaine $ 0 $ 0 $ 0 $ 0 $ 0 $ 0 $ 0
UMA (2,864,084) (86,929) (2,951,013) 2,951,013 - - -
UMF - - - - - - -
UMFK 212,476 (205,843) 6,633 - - - 6,633
UMM - - - - - - -
UMPI (273,066) 273,066 - - - - -
USM (Excl. Law) - - - - - - -
Maine Law (1,193,446) - (1,193,446) 693,446* - - (500,000)
Governance - - - - - - 0
Univ. Svs (525,433) - (525,433) 525,433 - - 0
**Total $(4,643,553) $ (19,706) $(4,663,259) $ 4,169,892 $ 0 $ 0 $ (493,367)
*Maine Law reserves have been exhausted – reflects USM reserve transfer**Does not include $3.3 million in administrative savings set aside for strategic investment
2.1
Finance, Facilities, Technology Committee Meeting - FY2019 Proposed Operating & Capital Budget & Student Charges – 2nd reading
29

5
Budget Stabilization Fund
Balance 7/1/17 $ 11,452,838
Projected
Utilization FY18 FY19
Law School (275,320)
Investment gain/loss TBD -
Subtotal $ (275,320) $ 0
Projected Balance $ 11,177,518
• The Budget Stabilization Fund was created to enable the UMS to smooth the financial impact of adverse markets, economic conditions, and address other financial challenges.
• The Budget Stabilization Fund was established in 2010 and has been built from net investment income that exceeded budget pursuant to the Board of Trustees investment policy.
• The treasurer will only authorize all or a portion of the transfer needed to offset a net unrestricted operating loss for each institution at the close of FY18 and FY19.
2.1
Finance, Facilities, Technology Committee Meeting - FY2019 Proposed Operating & Capital Budget & Student Charges – 2nd reading
30

6
FY15 FY16 FY17 FY18 FY19Budget 113,367 125,394 130,030 143,033 155,164Actual 117,251 124,037 139,015 152,806
10,000
40,000
70,000
100,000
130,000
160,000
Cre
dit H
ours
Out-of-State
Enrollment
• FY19 credit hours are up 2.8% over FY18 actual credit hours.
FY14 FY15 FY16 FY17 FY18 FY19Budget 701,707 686,561 666,253 658,844 670,398 675,777Actual 681,810 665,019 656,867 657,721 657,491
100,000
200,000
300,000
400,000
500,000
600,000
700,000
Cre
dit H
ours
UMS Total Credit Hour Enrollment
FY15 FY16 FY17 FY18 FY19Budget 573,194 540,859 528,814 527,365 520,613Actual 547,768 532,830 518,706 504,685
100,000
200,000
300,000
400,000
500,000
600,000
Cre
dit H
ours
In-State
FY19 Enrollment BudgetBudget: 0.8% above FY18Actual: 2.8% above FY18
Major factors impacting enrollment:
• FY19 out-of-state budgeted represent 23% of the total credit hours.
Early College (included above)
Budget 16,477 18,098Actual 17,585
CBE(included above)
Budget - 4,176Actual TBD
2.1
Finance, Facilities, Technology Committee Meeting - FY2019 Proposed Operating & Capital Budget & Student Charges – 2nd reading
31

7
Budgeted
Residence Hall Occupancy
• UMS FY19 Occupancy Rate is 94% and ranges from 104% at USM to 70% at UMM.
• Residence Hall occupancy has increased slightly at 5 of the 6 campuses with residential operations.
6,428 6,508 6,514 6,555 6,643
5,801 5,967 6,076 6,040 6,228
0
1,000
2,000
3,000
4,000
5,000
6,000
7,000
FY15 FY16 FY17 FY18 FY19
UMS TotalCapacity Residents
Occupancy: 90% 92% 93% 92% 94%
2.1
Finance, Facilities, Technology Committee Meeting - FY2019 Proposed Operating & Capital Budget & Student Charges – 2nd reading
32

8
FY19 Recommended In-State Tuition Rates
FY18Rate/CH
FY19 Proposed Rate/CH
FY 19 Proposed Increases
$ %
UMaine $286 $293 $7 2.4%
UMA $228 $233 $5 2.2%
UMF $268 $274 $6 2.2%
UMFK $228 $233 $5 2.2%
UMM $228 $233 $5 2.2%
UMPI $228 $233 $5 2.2%
USM $262 $271 $9 3.4%
UMaine $429 $439 $10 2.3%
UMF $389 $407 $18 4.6%
USM $393 $407 $14 3.6%
Law $743 $743 $0 0%
Und
ergr
adua
teG
radu
ate
Law
• In-state, undergraduate tuition increase based on CPI (2.3%).
• Additional tuition increases at USM due to partial implementation of the new Unified Budget Pricing Structure.
• UMF increasing graduate tuition rate to equal USM.
2.1
Finance, Facilities, Technology Committee Meeting - FY2019 Proposed Operating & Capital Budget & Student Charges – 2nd reading
33

9
In-State Undergraduate Average Costs
$8,890 $9,153
$1,148 $1,169
$7,482 $7,664$182 2.4%Tuition
FY18 Increase
$ 21 1.8%
$263 3.0%
Mandatory Fees
Room & Board
Total $17,520 $17,986$466 2.9%
• Unified Fee increasing at 5 campuses; no increase at UMFK & UMPI.
• Room rates increasing at 4 campuses; Board rate increasing at 5 campuses.
• Average annual increase is less than $500 for in-state, undergraduate students residing on campus.
FY19
2.1
Finance, Facilities, Technology Committee Meeting - FY2019 Proposed Operating & Capital Budget & Student Charges – 2nd reading
34

10
$30.8
$6.3
$37.1
$18.0
$9.1
$27.1
$0.0
$5.0
$10.0
$15.0
$20.0
$25.0
$30.0
$35.0
$40.0
E&G Auxiliary Total
Funding Depreciation by Fund($ in millions)
Depreciation Budgeted Funding
Funding Depreciation
$3.9 Debt Service
$5.4 Debt Serv.
$3.7 Cap. Invest.
$9.3 Debt Service
$17.8 Capital
Investment$14.1Capital
Investment
• Depreciation expense increased by $1.0M -from $36.1M in FY18 to $37.1M in FY19.
• E&G and Auxiliary budgeted capital investment = $17.8M; an increase of $1.7M (10%).
• Funding through Debt Service has decreased by $1.3M; Capital Investments increased by $1.7M over FY18
• 73% of the total depreciation expense is funded in the FY19 budget – down 1% from the FY18 budget.
2.1
Finance, Facilities, Technology Committee Meeting - FY2019 Proposed Operating & Capital Budget & Student Charges – 2nd reading
35

11
Aging Infrastructure
Significant Growth in % of Buildings Over 50 Years Old
Chart source: Sightlines
2.1
Finance, Facilities, Technology Committee Meeting - FY2019 Proposed Operating & Capital Budget & Student Charges – 2nd reading
36

12
Capital Investments from Operations
• FY19 budgeted transfers from E&G and Auxiliary to Capital Investments total $17.8 million
FacilitiesEquipment &
Vehicles
Projects to be determined during FY19
Capital Reserve Deposit (to be
utilized in FY20 or after)
Total Investment
UMAINE 2,518,489$ 2,076,768$ 2,569,554$ 1,368,313$ 8,533,124$
UMA 943,640 36,679 - - 980,319
UMF 10,000 139,700 992,529 - 1,142,229
UMFK 200,000 20,000 - - 220,000
UMM 6,000 500 - - 6,500
UMPI 210,176 - - 39,824 250,000
USM 1,558,500 264,556 - - 1,823,056
US - 442,300 - 4,387,337 4,829,637
TOTAL 5,446,805$ 2,980,503$ 3,562,083$ 5,795,474$ 17,784,865$
2.1
Finance, Facilities, Technology Committee Meeting - FY2019 Proposed Operating & Capital Budget & Student Charges – 2nd reading
37

13
$13.29M77%
$3.29M19%
MEIF
$250,000 (1%)
$520,500 (3%)A competitive award program for UMA, UMF, UMFK, UMM, UMPI, and the Maine Maritime Academy.
Small Campus Initiative (SCI)
$17.35M
UMaine USM UMM SCI TotalBiotechnology 1,208,714 250,000 1,458,714
Aquaculture & Marine 2,959,909 453,043 250,000 3,662,952
Composite Materials 1,844,246 100,000 1,944,246
Environmental 1,338,169 294,817 1,632,986
Forestry & Agriculture 1,781,062 833,700 2,614,762
Information Technology 1,856,946 672,512 2,529,458
Precision Manufacturing 1,383,284 100,000 1,483,284
Cross Sector 916,864 586,234 1,503,098
Small Campus Initiative 520,500 520,500
Total 13,289,194 3,290,306 250,000 520,500 17,350,000
2.1
Finance, Facilities, Technology Committee Meeting - FY2019 Proposed Operating & Capital Budget & Student Charges – 2nd reading
38

14
Compensation & Benefits
The Employee Benefit Reserve had $9.9 million at the end of FY17. It is recommended that reserve levels for self-insured health benefit programs equal 3 to 6 months of benefit costs. For the UMS, this would be between $17 - $34 million.
72%
28%
E&G Budget
Compensation & Benefits continues to be the single largest cost driver representing 72% of the E&G budget or 66% of the overall unrestricted operating budget.
The FY19 internal benefit is increasing to 53.4% -up from 53% in FY18.
Compensation & Benefits
Employee Benefit Reserve
2.1
Finance, Facilities, Technology Committee Meeting - FY2019 Proposed Operating & Capital Budget & Student Charges – 2nd reading
39

15
FY19 Budget Position Changes
Faculty Salaried Hourly TotalIncreases/
New PositionsReductions/Eliminations
Increases/New Positions
Reductions/Eliminations
Increases/New Positions
Reductions/Eliminations
UMaine 5.0 - 5.0 - 4.8 - 14.8
UMA - - - - - - -
UMF 1.5 (2.0) 1.0 (3.0) 1.4 (0.5) (1.6)
UMFK 2.0 (1.0) 7.0 (1.5) - - 6.5
UMM - (1.0) - - - (0.5) (1.5)
UMPI - - - - - - -
USM 3.0 - 1.5 - - - 4.5
Gov. - - 2.5 (2.0) - - 0.5
Univ Svs - - 1.0 (2.0) 2.0 - 1.0
Total 11.5 (4.0) 18.0 (8.5) 8.2 (1.0) 24.2
2.1
Finance, Facilities, Technology Committee Meeting - FY2019 Proposed Operating & Capital Budget & Student Charges – 2nd reading
40

16
FY19 Proposed Budget: E&G FY18Base
FY19Proposed
$Change
%Change
Revenue: Tuition & Fee Revenue $ 297,511,943 $ 314,176,615 $ 16,664,672 5.6%Tuition Waivers/Scholarships (76,997,718) (84,363,644) (7,365,926) 9.6%State Appropriation 188,920,534 188,920,534 - 0.0%Sales/Services/Other 39,425,367 40,582,731 1,157,364 2.9%Total Revenue 448,860,126 459,316,236 10,456,110 2.3%
Expense: Personnel Expense 334,771,422 342,268,517 7,416,716 2.2%Fuel & Electricity 15,361,545 15,497,893 136,348 0.9%Supplies & Services 30,117,279 31,198,603 1,081,324 3.6%Travel 6,006,600 6,268,354 261,754 4.4%Memberships, Contributions & Sponsorships 1,591,501 1,572,009 (19,492) -1.2%Maintenance & Alterations 10,856,132 11,747,248 891,116 8.2%Interest Expense 1,929,130 1,725,624 (203,506) -10.5%Depreciation 30,728,899 30,787,221 58,322 0.2%Other Expenses & Transfers 32,380,460 32,343,671 (36,789) -0.1%Total Operating Expenses & Transfers 463,742,968 473,409,140 9,666,172 2.1%Operating Increase (Decrease) $ (14,882,842) $ (14,092,905) $ 789,937 -5.3%
Modified Cash Flow: Add back Depreciation 30,728,899 30,787,221 58,322 0.2%
Less Capital Expenditures (8,522,691) (8,818,415) (295,724) 3.5%
Less Capital Reserve Funding (3,917,547) (5,292,300) (1,374,753) 35.1%
Less Debt Service Principal (5,405,171) (3,925,414) 1,479,757 -27.4%Net Change Before Other Adj & Transfers (1,999,352) (1,341,813) 657,539Transfer from/(to) Admin Savings Rsrv (3,301,740) (3,301,740) -Transfer from/(to) Budget Stabilization 275,320 - (275,320)
Net Change Subtotal (5,025,772) (4,643,553) 382,219 Other Strategic Transfers from/(to) Reserves 5,265,875 4,082,963 (1,182,912) Net Change in Cash & Reserve Transfers $ 240,103 $ (560,590) $ (800,693)
2.1
Finance, Facilities, Technology Committee Meeting - FY2019 Proposed Operating & Capital Budget & Student Charges – 2nd reading
41

17
FY19 Proposed Budget: Auxiliary
FY18Base
FY19Proposed
$Change
%Change
Revenue: Tuition & Fee Revenue $ 1,240,000 $ 1,227,714 $ (12,286) -1.0%Dining & Residence Revenue 64,255,855 64,722,671 466,816 0.7%Tuition Waivers/Scholarships (2,130,802) (2,252,044) (121,242) 5.7%Sales/Services/Other 16,678,940 17,267,807 588,867 3.5%Total Revenue 80,043,993 80,966,148 922,155 1.2%
Expense: Personnel Expense 22,098,429 22,431,259 332,830 1.5%Fuel & Electricity 5,997,437 5,078,537 (918,900) -15.3%Supplies & Services 24,820,399 24,728,302 (92,097) -0.4%Travel 129,418 128,380 (1,038) -0.8%Memberships, Contributions & Sponsorships 27,695 20,772 (6,923) -25.0%Maintenance & Alterations 4,200,126 3,902,565 (297,561) -7.1%Interest Expense 3,941,796 3,696,059 (245,737) -6.2%Depreciation 5,400,401 6,255,906 855,505 15.8%Other Expenses & Transfers 9,853,651 11,954,753 2,101,102 21.3%Total Operating Expenses & Transfers 76,469,352 78,196,533 1,727,181 2.3%Operating Increase (Decrease) $ 3,574,641 $ 2,769,615 $ (805,026) -22.5%
Modified Cash Flow:
Add back Depreciation 5,400,401 6,255,906 855,505 15.8%Less Capital Expenditures (2,106,730) (2,168,447) (61,717) 2.9%Less Capital Reserve Funding (1,496,524) (1,505,703) (9,179) 0.6%Less Debt Service Principal (5,182,163) (5,371,077) (188,914) 3.6%Net Change Before Other Adj & Transfers 189,625 (19,706) (209,331) Other Strategic Transfers from/(to) Reserves 45,961 86,929 40,968Net Change in Cash & Reserve Transfers $ 235,586 $ 67,223 $ (168,363)
2.1
Finance, Facilities, Technology Committee Meeting - FY2019 Proposed Operating & Capital Budget & Student Charges – 2nd reading
42

18
FY19 Proposed Budget: E&G and Auxiliary FY18Base
FY19Proposed
$Change
%Change
Revenue: Tuition & Fee Revenue $ 298,751,943 $ 315,404,329 $ 16,652,386 5.6%Dining & Residence Revenue 64,255,855 64,722,671 466,816 0.7%Tuition Waivers/Scholarships (79,128,520) (86,615,688) (7,487,168) 9.5%State Appropriation 188,920,534 188,920,534 - 0.0%Sales/Services/Auxiliary 56,104,307 57,850,538 1,746,231 3.1%Total Revenue 528,904,119 540,282,384 11,378,265 2.2%
Expense: Personnel Expense 356,869,851 364,699,776 7,829,925 2.2%Fuel & Electricity 21,358,982 20,576,430 (782,552) -3.7%Supplies & Services 54,937,678 55,926,905 989,227 1.8%Travel 6,136,018 6,396,734 260,716 4.2%Memberships, Contributions & Sponsorships 1,619,196 1,592,781 (26,415) -1.6%Maintenance & Alterations 15,056,258 15,649,813 593,555 3.9%Interest Expense 5,870,926 5,421,683 (449,243) -7.7%Depreciation 36,129,300 37,043,127 913,827 2.5%Other Expenses & Transfers: 42,234,111 44,298,424 2,064,313 4.9%Total Operating Expenses & Transfers 540,212,320 551,605,673 11,393,353 2.1%Operating Increase (Decrease) $ (11,308,201) $ (11,323,290) $ (15,089) 0.1%
Modified Cash Flow:
Add back Depreciation 36,129,300 37,043,127 913,827 2.5%Less Capital Expenditures (10,629,421) (10,986,862) (357,441) 3.4%Less Capital Reserve Funding (5,414,071) (6,798,003) (1,383,932) 25.6 %Less Debt Service Principal (10,587,334) (9,296,491) 1,290,843 -12.2%Net Change Before Other Adj & Transfers (1,809,727) (1,361,519) 448,208Transfer from/(to) Admin Savings Rsrv (3,301,740) (3,301,740) -Transfer from/(to) Budget Stabilization 275,320 - (275,320)
Net Change Subtotal (4,836,147) (4,663,259) 172,888 Other Strategic Transfers from/(to) Reserves 5,311,836 4,169,892 (1,141,944) Net Change in Cash & Reserve Transfers $ 475,689 $ ( 493,367) $ (969,056)
2.1
Finance, Facilities, Technology Committee Meeting - FY2019 Proposed Operating & Capital Budget & Student Charges – 2nd reading
43

19
• UMS “Use of University funds” policy generally prohibits charitable contributions; Sponsorships which advance the University’s mission are allowed. UMS “Travel & Expense” policy defines what constitutes allowable travel, meals, and entertainment expenses.
Quasi-Independent State Entities Budget Requirement
• Public Law 2011, Chapter 616 mandates:
– Board of Trustees approval of the annual budget for travel, meals, and entertainment costs.
– Board of Trustees approval of the annual budget for contribution expenses – defined by this Public Law as membership dues & fees, gifts, donations, and sponsorships.
– Periodic reporting of the actual travel and contribution costs by the UMS to the Board of Trustees.
– Annual reporting to the Legislature by the UMS of contributions made to persons in the preceding year that were greater than $1,000, and the total contributed to each.
FY19 Budget ($000’s)
FundTravel, Meals, Entertainment
Memberships, Gifts, Donations, & Sponsorships
E&G/Auxiliary $ 6,396 $ 1,593
Restricted/Other 4,773 566
Total $11,169 $ 2,159
E&G/Auxiliary are included in the proposed operating budgets. Restricted/Other includes grants & contracts, MEIF, Coop. Ext, etc. and is not included in the operating budgets.
2.1
Finance, Facilities, Technology Committee Meeting - FY2019 Proposed Operating & Capital Budget & Student Charges – 2nd reading
44

20
Appendix
• Detailed Information by Campus for:— FY19 Enrollment & Residence Hall Occupancy
— FY19 Capital Investments from Operating Budgets
— FY19 Operating Budgets
— FY19 Student Cost Report
2.1
Finance, Facilities, Technology Committee Meeting - FY2019 Proposed Operating & Capital Budget & Student Charges – 2nd reading
45

21
FY15 FY16 FY17 FY18 FY19Budget 209,850 191,907 189,172 182,566 175,892Actual 198,920 193,966 189,378 181,369
0
50,000
100,000
150,000
200,000
Cre
dit H
ours
In-State
Enrollment
FY15 FY16 FY17 FY18 FY19Budget 279,800 274,287 275,508 279,780 283,969Actual 273,568 274,788 280,021 283,210
0
100,000
200,000
300,000Cr
edit
Hour
s
Total Credit Hour Enrollment
FY15 FY16 FY17 FY18 FY19Budget 69,950 82,380 86,336 97,214 108,077Actual 74,648 80,822 90,643 101,841
0
25,000
50,000
75,000
100,000
Cre
dit H
ours
Out-of-State
FY19 Enrollment Budget:Budget: 1.5% above FY18 Actual: 0.3% above FY18
Early College (included above)
Budget 1,213 1,219Actual 1,045
2.1
Finance, Facilities, Technology Committee Meeting - FY2019 Proposed Operating & Capital Budget & Student Charges – 2nd reading
46

22
FY15 FY16 FY17 FY18 FY19Budget 88,879 83,203 85,028 76,802 71,473Actual 85,052 83,624 75,663 68,746
0
20,000
40,000
60,000
80,000
100,000
Cre
dit H
ours
In-State
Enrollment
FY14 FY15 FY16 FY17 FY18 FY19Budget 93,728 91,465 85,969 88,089 80,000 74,183Actual 91,466 88,162 87,073 78,625 72,117
0
20,000
40,000
60,000
80,000
100,000C
redi
t Hou
rs
Total Credit Hour Enrollment
FY15 FY16 FY17 FY18 FY19Budget 2,586 2,766 3,061 3,198 2,710Actual 3,110 2,449 2,962 3,371
0
1,000
2,000
3,000
4,000
5,000
Cre
dit H
ours
Out-of-State
FY19 Enrollment BudgetBudget: 7.3% below FY18Actual: 2.9% above FY18
Early College (included above)
Budget 2,024 3,700Actual 3,340
2.1
Finance, Facilities, Technology Committee Meeting - FY2019 Proposed Operating & Capital Budget & Student Charges – 2nd reading
47

23
FY15 FY16 FY17 FY18 FY19Budget 47,068 44,422 45,235 45,984 47,102Actual 45,239 46,303 45,621 46,101
0
10,000
20,000
30,000
40,000
50,000
60,000
Cre
dit H
ours
In-State
Enrollment
FY15 FY16 FY17 FY18 FY19Budget 55,729 53,525 55,098 55,562 56,859Actual 54,529 55,233 54,528 55,144
0
20,000
40,000
60,000
80,000C
redi
t Hou
rs
Total Credit Hour Enrollment
FY15 FY16 FY17 FY18 FY19Budget 8,661 9,103 9,863 9,578 9,757Actual 9,290 8,930 8,907 9,043
0
4,000
8,000
12,000
Cre
dit H
ours
Out-of-State
FY19 Enrollment BudgetBudget: 2.5% above FY18 Actual: 3.3% above FY18
Early College (included above)
Budget 270 800Actual 240
2.1
Finance, Facilities, Technology Committee Meeting - FY2019 Proposed Operating & Capital Budget & Student Charges – 2nd reading
48

24
FY14 FY15 FY16 FY17 FY18 FY19Budget 21,418 22,218 24,035 24,223 25,295 24,643Actual 22,448 22,478 24,496 26,089 24,071
0
5,000
10,000
15,000
20,000
25,000
30,000
Cre
dit H
ours
In-State
Enrollment
FY15 FY16 FY17 FY18 FY19Budget 26,260 27,997 28,595 30,442 31,269Actual 26,381 29,111 31,766 29,572
0
5,000
10,000
15,000
20,000
25,000
30,000
35,000
40,000
Cre
dit H
ours
Total Credit Hour Enrollment
FY15 FY16 FY17 FY18 FY19Budget 4,042 3,962 4,372 5,147 6,626Actual 3,903 4,615 5,677 5,501
0
1,000
2,000
3,000
4,000
5,000
6,000
Cre
dit H
ours
Out-of-State
FY19 Enrollment BudgetBudget: 2.7% above FY18Actual: 5.7% above FY18
Early College (included above)
Budget 5,250 4,659Actual 4,410
2.1
Finance, Facilities, Technology Committee Meeting - FY2019 Proposed Operating & Capital Budget & Student Charges – 2nd reading
49

25
FY15 FY16 FY17 FY18 FY19Budget 13,385 13,616 12,757 12,062 12,062Actual 13,259 12,497 12,248 12,068
0
6,000
12,000
18,000
Cre
dit H
ours
In-State
Enrollment
FY15 FY16 FY17 FY18 FY19Budget 16,573 16,760 15,398 15,000 15,000Actual 16,125 15,191 15,123 14,067
0
5,000
10,000
15,000
20,000C
redi
t Hou
rs
Total Credit Hour Enrollment
FY14 FY15 FY16 FY17 FY18 FY19Budget 3,648 3,188 3,144 2,641 2,938 2,938Actual 3,214 2,867 2,694 2,875 1,999
0
1,000
2,000
3,000
4,000
Cre
dit H
ours
Out-of-State
FY19 Enrollment BudgetBudget: equals FY18
Actual: 6.6% above FY18
Early College (included above)
Budget 0 0Actual 509
2.1
Finance, Facilities, Technology Committee Meeting - FY2019 Proposed Operating & Capital Budget & Student Charges – 2nd reading
50

26
FY15 FY16 FY17 FY18 FY19Budget 23,812 20,797 21,045 21,978 26,217Actual 21,155 21,467 22,282 22,608
0
5,000
10,000
15,000
20,000
25,000
30,000
Cre
dit H
ours
In-State
Enrollment
FY15 FY16 FY17 FY18 FY19Budget 27,053 24,449 24,602 26,328 30,717Actual 24,232 24,732 25,846 26,979
0
5,000
10,000
15,000
20,000
25,000
30,000
35,000C
redi
t Hou
rs
Total Credit Hour Enrollment
FY15 FY16 FY17 FY18 FY19Budget 3,241 3,652 3,557 4,350 4,500Actual 3,077 3,265 3,564 4,371
0
1,000
2,000
3,000
4,000
5,000
6,000
Cre
dit H
ours
Out-of-State
FY19 Enrollment BudgetBudget: 16.7% above FY18Actual: 13.9% above FY18
Early College (included above)
Budget 3,100 3,100Actual 4,851
CBE(included above)
Budget - 4,176Actual TBD
2.1
Finance, Facilities, Technology Committee Meeting - FY2019 Proposed Operating & Capital Budget & Student Charges – 2nd reading
51

27
FY15 FY16 FY17 FY18 FY19Budget 162,202 157,159 145,544 156,952 157,236Actual 155,905 144,822 142,393 144,420
0
50,000
100,000
150,000
200,000
Cre
dit H
ours
In-State
Enrollment
FY15 FY16 FY17 FY18 FY19Budget 181,569 175,496 163,976 175,754 176,058Actual 174,459 163,428 164,829 169,236
0
50,000
100,000
150,000
200,000
250,000C
redi
t Hou
rs
Total Credit Hour Enrollment
FY15 FY16 FY17 FY18 FY19Budget 19,367 18,337 18,432 18,802 18,822Actual 18,554 18,606 22,436 24,816
0
10,000
20,000
30,000
Cre
dit H
ours
Out-of-State
FY19 Enrollment BudgetBudget: 0.2% above FY18Actual: 3.9% above FY18
Early College (included above)
Budget 4,620 4,620Actual 3,190
2.1
Finance, Facilities, Technology Committee Meeting - FY2019 Proposed Operating & Capital Budget & Student Charges – 2nd reading
52

28
FY15 FY16 FY17 FY18 FY19Budget 5,780 5,720 5,810 5,726 5,888Actual 5,762 5,655 5,032 5,303
0
2,000
4,000
6,000
8,000
Cre
dit H
ours
In-State
Enrollment
FY15 FY16 FY17 FY18 FY19Budget 8,112 7,770 7,578 7,532 7,622Actual 7,564 7,311 6,984 7,167
0
2,000
4,000
6,000
8,000C
redi
t Hou
rs
Total Credit Hour Enrollment
FY15 FY16 FY17 FY18 FY19Budget 2,332 2,050 1,768 1,806 1,734Actual 1,802 1,656 1,952 1,864
0
500
1,000
1,500
2,000
2,500
Cre
dit H
ours
Out-of-State
FY19 Enrollment BudgetBudget: 1.2% above FY18Actual: 6.3% above FY18
2.1
Finance, Facilities, Technology Committee Meeting - FY2019 Proposed Operating & Capital Budget & Student Charges – 2nd reading
53

29Budgeted
Residence Hall Occupancy
3,484 3,580 3,575 3,612 3,608
3,340 3,380 3,364 3,451 3,409
0
1,000
2,000
3,000
4,000
FY15 FY16 FY17 FY18 FY19
Capacity Residents
Occupancy: 96% 94% 94% 96% 94%
2.1
Finance, Facilities, Technology Committee Meeting - FY2019 Proposed Operating & Capital Budget & Student Charges – 2nd reading
54

30Budgeted
989 1,009 1,020 1,030 1,030
835889 886 895 914
0
500
1,000
1,500
FY15 FY16 FY17 FY18 FY19
Capacity Residents
Residence Hall Occupancy
Occupancy: 84% 88% 87% 87% 89%
2.1
Finance, Facilities, Technology Committee Meeting - FY2019 Proposed Operating & Capital Budget & Student Charges – 2nd reading
55

31Budgeted
Residence Hall Occupancy
210 210 210 210231
199 203 203
169190
0
100
200
300
FY15 FY16 FY17 FY18 FY19
Capacity Residents
Occupancy: 95% 97% 97% 80% 82%
2.1
Finance, Facilities, Technology Committee Meeting - FY2019 Proposed Operating & Capital Budget & Student Charges – 2nd reading
56

32Budgeted
Residence Hall Occupancy
322
275 275 275 273
202 210227
175190
0
100
200
300
400
FY15 FY16 FY17 FY18 FY19
Capacity Residents
Occupancy: 63% 76% 83% 64% 70%
2.1
Finance, Facilities, Technology Committee Meeting - FY2019 Proposed Operating & Capital Budget & Student Charges – 2nd reading
57

33Budgeted
Residence Hall Occupancy
324313 313 307 308
226259 269
247
285
0
100
200
300
400
FY15 FY16 FY17 FY18 FY19
Capacity Residents
Occupancy: 70% 83% 86% 80% 93%
2.1
Finance, Facilities, Technology Committee Meeting - FY2019 Proposed Operating & Capital Budget & Student Charges – 2nd reading
58

34Budgeted
1,099 1,121 1,121 1,1211,193
999 1,0261,127 1,103
1,240
0
500
1,000
1,500
FY15 FY16 FY17 FY18 FY19
Capacity Residents
Residence Hall Occupancy
Occupancy: 91% 92% 101% 98% 104%
2.1
Finance, Facilities, Technology Committee Meeting - FY2019 Proposed Operating & Capital Budget & Student Charges – 2nd reading
59

ReportID: STATS3FB TOTAL
Scope Name: ALLBUUROPR FY19 PROPOSED BUDGET
Layout Name: MW_STATS3_FUTBUD_BOT19version Unrestricted E&G
FY18 BASE FY19 BASE CHANGE
297,511,943$ 314,176,615$ 16,664,672$ 5.6%
‐ ‐ ‐ ‐%
(76,997,718) (84,363,644) (7,365,926) 9.6%
220,514,225 229,812,971 9,298,746 4.2%
188,920,534 188,920,534 ‐ 0.0%
12,110,006 12,669,320 559,314 4.6%
4,852,207 5,464,275 612,068 12.6%
22,463,154 22,449,136 (14,018) ‐0.1%
448,860,126 459,316,236 10,456,110 2.3%
Expenses
Personnel 334,771,422 342,268,517 7,497,095 2.2%
15,361,545 15,497,893 136,348 0.9%
Supplies & Services 30,319,468 31,378,058 1,058,590 3.5%
Shared Services (202,189) (179,455) 22,734 ‐11.2%
Travel 6,006,600 6,268,354 261,754 4.4%
1,591,501 1,572,009 (19,492) ‐1.2%
Maintenance & Alterations 10,856,132 11,747,248 891,116 8.2%
1,929,130 1,725,624 (203,506) ‐10.5%
30,728,899 30,787,221 58,322 0.2%
32,380,460 32,343,671 (36,789) ‐0.1%
463,742,968 473,409,140 9,666,172 2.1%
Operating Increase (Decrease) (14,882,842)$ (14,092,905)$ 789,937$ ‐5.3%
Modified Cash Flow
(14,882,842)$ (14,092,905)$ 789,937$ ‐5.3%
30,728,899 30,787,221 58,322 0.2%
(8,522,691) (8,818,415) (295,724) 3.5%
(3,917,547) (5,292,300) (1,374,753) 35.1%
(5,405,171) (3,925,414) 1,479,757 ‐27.4%
Net Change Before Other Adjustments & Transfers (1,999,352) (1,341,813) 657,539
Transfer from/(to) Administrative Savings Rsrv (3,301,740) (3,301,740) ‐
Transfer from/(to) Budget Stabilization 275,320 ‐ (275,320)
(5,025,772) (4,643,553) 382,219
Other Strategic Transfers from/(to) Reserves 5,265,875 4,082,963 (1,182,912)
Net Change in Cash & Reserve Transfers 240,103$ (560,590)$ (800,693)$
Net Student Charges Revenue
Revenues
Tuition & Fee Revenue
Dining & Residence Revenue
Tuition Waivers/Scholarships
Depreciation
State Appropriation
Indirect Cost Recovery
Investment Income/Gifts
Sales/Services/Auxiliary
Total Revenue
Fuel & Electricity
Memberships, Contributions & Sponsorships
Interest
Other Expenses & Transfers
Total Operating Expenses & Transfers
Operating Increase (Decrease)
Add Back Depreciation
Less Capital Expenditures
Less Capital Reserve Funding
Less Debt Service Principal
Net Change Subtotal
2.2
Finance, Facilities, Technology Committee Meeting - FY2019 Proposed Operating & Capital Budget & Student Charges – 2nd reading
60

ReportID: STATS3FB TOTAL
Scope Name: ALLBUUROPR FY19 PROPOSED BUDGET
Layout Name: MW_STATS3_FUTBUD_BOT19version Unrestricted Auxiliary
FY18 BASE FY19 BASE CHANGE
1,240,000$ 1,227,714$ (12,286)$ ‐1.0%
64,255,855 64,722,671 466,816 0.7%
(2,130,802) (2,252,044) (121,242) 5.7%
63,365,053 63,698,341 333,288 0.5%
‐ ‐ ‐ ‐%
‐ ‐ ‐ ‐%
‐ ‐ ‐ ‐%
16,678,940 17,267,807 588,867 3.5%
80,043,993 80,966,148 922,155 1.2%
Expenses
Personnel 22,098,429 22,431,259 332,830 1.5%
5,997,437 5,078,537 (918,900) ‐15.3%
Supplies & Services 24,820,399 24,728,302 (92,097) ‐0.4%
Shared Services ‐ ‐ ‐ ‐%
Travel 129,418 128,380 (1,038) ‐0.8%
27,695 20,772 (6,923) ‐25.0%
Maintenance & Alterations 4,200,126 3,902,565 (297,561) ‐7.1%
3,941,796 3,696,059 (245,737) ‐6.2%
5,400,401 6,255,906 855,505 15.8%
9,853,651 11,954,753 2,101,102 21.3%
76,469,352 78,196,533 1,727,181 2.3%
Operating Increase (Decrease) 3,574,641$ 2,769,615$ (805,026)$ ‐22.5%
Modified Cash Flow
3,574,641$ 2,769,615$ (805,026)$ ‐22.5%
5,400,401 6,255,906 855,505 15.8%
(2,106,730) (2,168,447) (61,717) 2.9%
(1,496,524) (1,505,703) (9,179) 0.6%
(5,182,163) (5,371,077) (188,914) 3.6%
Net Change Before Other Adjustments & Transfers 189,625 (19,706) (209,331)
Transfer from/(to) Administrative Savings Rsrv ‐ ‐ ‐
Transfer from/(to) Budget Stabilization ‐ ‐ ‐
189,625 (19,706) (209,331)
Other Strategic Transfers from/(to) Reserves 45,961 86,929 40,968
Net Change in Cash & Reserve Transfers 235,586$ 67,223$ (168,363)$
Net Student Charges Revenue
Revenues
Tuition & Fee Revenue
Dining & Residence Revenue
Tuition Waivers/Scholarships
Depreciation
State Appropriation
Indirect Cost Recovery
Investment Income/Gifts
Sales/Services/Auxiliary
Total Revenue
Fuel & Electricity
Memberships, Contributions & Sponsorships
Interest
Other Expenses & Transfers
Total Operating Expenses & Transfers
Operating Increase (Decrease)
Add Back Depreciation
Less Capital Expenditures
Less Capital Reserve Funding
Less Debt Service Principal
Net Change Subtotal
2.2
Finance, Facilities, Technology Committee Meeting - FY2019 Proposed Operating & Capital Budget & Student Charges – 2nd reading
61

ReportID: STATS3FB TOTAL
Scope Name: ALLBUUROPR FY19 PROPOSED BUDGET
Layout Name: MW_STATS3_FUTBUD_BOT19versionUnrestricted E&G and Auxiliary
FY18 BASE FY19 BASE CHANGE
298,751,943$ 315,404,329$ 16,652,386$ 5.6%
64,255,855 64,722,671 466,816 0.7%
(79,128,520) (86,615,688) (7,487,168) 9.5%
283,879,278 293,511,312 9,632,034 3.4%
188,920,534 188,920,534 ‐ 0.0%
12,110,006 12,669,320 559,314 4.6%
4,852,207 5,464,275 612,068 12.6%
39,142,094 39,716,943 574,849 1.5%
528,904,119 540,282,384 11,378,265 2.2%
Expenses
Personnel 356,869,851 364,699,776 7,829,925 2.2%
21,358,982 20,576,430 (782,552) ‐3.7%
Supplies & Services 55,139,867 56,106,360 966,493 1.8%
Shared Services (202,189) (179,455) 22,734 ‐11.2%
Travel 6,136,018 6,396,734 260,716 4.2%
1,619,196 1,592,781 (26,415) ‐1.6%
Maintenance & Alterations 15,056,258 15,649,813 593,555 3.9%
5,870,926 5,421,683 (449,243) ‐7.7%
36,129,300 37,043,127 913,827 2.5%
42,234,111 44,298,424 2,064,313 4.9%
540,212,320 551,605,673 11,393,353 2.1%
Operating Increase (Decrease) (11,308,201)$ (11,323,290)$ (15,089)$ 0.1%
Modified Cash Flow
(11,308,201)$ (11,323,290)$ (15,089)$ 0.1%
36,129,300 37,043,127 913,827 2.5%
(10,629,421) (10,986,862) (357,441) 3.4%
(5,414,071) (6,798,003) (1,383,932) 25.6%
(10,587,334) (9,296,491) 1,290,843 ‐12.2%
Net Change Before Other Adjustments & Transfers (1,809,727) (1,361,519) 448,208
Transfer from/(to) Administrative Savings Rsrv (3,301,740) (3,301,740) ‐
Transfer from/(to) Budget Stabilization 275,320 ‐ (275,320)
(4,836,147) (4,663,259) 172,888
Other Strategic Transfers from/(to) Reserves 5,311,836 4,169,892 (1,141,944)
Net Change in Cash & Reserve Transfers 475,689$ (493,367)$ (969,056)$
Net Student Charges Revenue
Revenues
Tuition & Fee Revenue
Dining & Residence Revenue
Tuition Waivers/Scholarships
Depreciation
State Appropriation
Indirect Cost Recovery
Investment Income/Gifts
Sales/Services/Auxiliary
Total Revenue
Fuel & Electricity
Memberships, Contributions & Sponsorships
Interest
Other Expenses & Transfers
Total Operating Expenses & Transfers
Operating Increase (Decrease)
Add Back Depreciation
Less Capital Expenditures
Less Capital Reserve Funding
Less Debt Service Principal
Net Change Subtotal
2.2
Finance, Facilities, Technology Committee Meeting - FY2019 Proposed Operating & Capital Budget & Student Charges – 2nd reading
62

ReportID: STATS3FB GOVERNANCE
Scope Name: UMS08OUEG FY19 PROPOSED BUDGET
Layout Name: MW_STATS3_FUTBUD_BOT19version Unrestricted E&G
FY18 BASE FY19 BASE CHANGE
‐$ ‐$ ‐$ ‐%
‐ ‐ ‐ ‐%
‐ ‐ ‐ ‐%
‐ ‐ ‐ ‐%
4,288,136 4,585,436 297,300 6.9%
‐ ‐ ‐ ‐%
‐ ‐ ‐ ‐%
‐ ‐ ‐ ‐%
4,288,136 4,585,436 297,300 6.9%
Expenses
Personnel 4,253,393 4,099,188 (154,205) ‐3.6%
3,200 3,200 ‐ 0.0%
Supplies & Services 81,710 79,725 (1,985) ‐2.4%
Shared Services 594,738 661,995 67,257 11.3%
Travel 126,250 128,049 1,799 1.4%
22,025 22,255 230 1.0%
Maintenance & Alterations 2,000 2,000 ‐ 0.0%
‐ ‐ ‐ ‐%
‐ ‐ ‐ ‐%
(99,766) (410,976) (311,210) 311.9%
4,983,550 4,585,436 (398,114) ‐8.0%
Operating Increase (Decrease) (695,414)$ ‐$ 695,414$ ‐100.0%
Modified Cash Flow
(695,414)$ ‐$ 695,414$ ‐100.0%
‐ ‐ ‐ ‐%
‐ ‐ ‐ ‐%
‐ ‐ ‐ ‐%
‐ ‐ ‐ ‐%
Net Change Before Other Adjustments & Transfers (695,414) ‐ 695,414
Transfer from/(to) Administrative Savings Rsrv ‐ ‐ ‐
Transfer from/(to) Budget Stabilization ‐ ‐ ‐
(695,414) ‐ 695,414
Other Strategic Transfers from/(to) Reserves 757,499 ‐ (757,499)
Net Change in Cash & Reserve Transfers 62,085$ ‐$ (62,085)$
Less Capital Reserve Funding
Less Debt Service Principal
Net Change Subtotal
Total Operating Expenses & Transfers
Operating Increase (Decrease)
Add Back Depreciation
Less Capital Expenditures
Memberships, Contributions & Sponsorships
Interest
Depreciation
Other Expenses & Transfers
Sales/Services/Auxiliary
Total Revenue
Fuel & Electricity
Net Student Charges Revenue
State Appropriation
Indirect Cost Recovery
Investment Income/Gifts
Revenues
Tuition & Fee Revenue
Dining & Residence Revenue
Tuition Waivers/Scholarships
2.2
Finance, Facilities, Technology Committee Meeting - FY2019 Proposed Operating & Capital Budget & Student Charges – 2nd reading
63

ReportID: STATS3FB UNIVERSITY SERVICES
Scope Name: UMS08G&US FY19 PROPOSED BUDGET
Layout Name: MW_STATS3_FUTBUD_BOT19version Unrestricted E&G
FY18 BASE FY19 BASE CHANGE
‐$ ‐$ ‐$ ‐%
‐ ‐ ‐ ‐%
‐ ‐ ‐ ‐%
‐ ‐ ‐ ‐%
3,801,740 3,801,740 ‐ 0.0%
7,500 189,658 182,158 2428.8%
3,859,317 4,424,337 565,020 14.6%
808,900 676,904 (131,996) ‐16.3%
8,477,457 9,092,639 615,182 7.3%
Expenses
Personnel 34,312,494 34,892,338 579,844 1.7%
10,860 10,910 50 0.5%
Supplies & Services 3,749,787 4,012,099 262,312 7.0%
Shared Services (44,220,841) (45,558,917) (1,338,076) 3.0%
Travel 381,316 399,067 17,751 4.7%
450,960 390,301 (60,659) ‐13.5%
Maintenance & Alterations 3,368,722 4,109,687 740,965 22.0%
30,200 35,702 5,502 18.2%
4,856,617 4,835,520 (21,097) ‐0.4%
2,325,687 3,189,625 863,938 37.1%
5,265,802 6,316,332 1,050,530 20.0%
Operating Increase (Decrease) 3,211,655$ 2,776,307$ (435,348)$ ‐13.6%
Modified Cash Flow
3,211,655$ 2,776,307$ (435,348)$ ‐13.6%
4,856,617 4,835,520 (21,097) ‐0.4%
(1,033,300) (442,300) 591,000 ‐57.2%
(3,067,317) (4,387,337) (1,320,020) 43.0%
(755,000) (5,883) 749,117 ‐99.2%
Net Change Before Other Adjustments & Transfers 3,212,655 2,776,307 (436,348)
Transfer from/(to) Administrative Savings Rsrv (3,301,740) (3,301,740) ‐
Transfer from/(to) Budget Stabilization ‐ ‐ ‐
(89,085) (525,433) (436,348)
Other Strategic Transfers from/(to) Reserves 27,000 525,433 498,433
Net Change in Cash & Reserve Transfers (62,085)$ ‐$ 62,085$
Less Capital Reserve Funding
Less Debt Service Principal
Net Change Subtotal
Total Operating Expenses & Transfers
Operating Increase (Decrease)
Add Back Depreciation
Less Capital Expenditures
Memberships, Contributions & Sponsorships
Interest
Depreciation
Other Expenses & Transfers
Sales/Services/Auxiliary
Total Revenue
Fuel & Electricity
Net Student Charges Revenue
State Appropriation
Indirect Cost Recovery
Investment Income/Gifts
Revenues
Tuition & Fee Revenue
Dining & Residence Revenue
Tuition Waivers/Scholarships
2.2
Finance, Facilities, Technology Committee Meeting - FY2019 Proposed Operating & Capital Budget & Student Charges – 2nd reading
64

ReportID: STATS3FB University of Maine
Scope Name: ALLBUUROPS FY19 PROPOSED BUDGET
Layout Name: MW_STATS3_FUTBUD_BOT19version Unrestricted E&G
FY18 BASE FY19 BASE CHANGE
158,866,957$ 172,126,005$ 13,259,048$ 8.3%
‐ ‐ ‐ ‐%
(49,180,484) (54,516,538) (5,336,054) 10.8%
109,686,473 117,609,467 7,922,994 7.2%
83,854,217 83,459,572 (394,645) ‐0.5%
8,371,276 8,371,276 ‐ 0.0%
912,890 919,938 7,048 0.8%
14,761,765 16,025,902 1,264,137 8.6%
217,586,621 226,386,155 8,799,534 4.0%
Expenses
Personnel 139,454,485 145,789,516 6,335,031 4.5%
9,997,111 10,139,804 142,693 1.4%
Supplies & Services 15,100,807 16,474,228 1,373,421 9.1%
Shared Services 18,255,579 18,747,182 491,603 2.7%
Travel 2,576,762 2,810,175 233,413 9.1%
419,136 421,099 1,963 0.5%
Maintenance & Alterations 4,500,067 4,542,256 42,189 0.9%
667,341 587,460 (79,881) ‐12.0%
14,177,562 13,788,287 (389,275) ‐2.7%
20,828,728 20,608,454 (220,274) ‐1.1%
225,977,578 233,908,461 7,930,883 3.5%
Operating Increase (Decrease) (8,390,957)$ (7,522,306)$ 868,651$ ‐10.4%
Modified Cash Flow
(8,390,957)$ (7,522,306)$ 868,651$ ‐10.4%
14,177,562 13,788,287 (389,275) ‐2.7%
(4,380,108) (5,186,064) (805,956) 18.4%
‐ ‐ ‐ ‐%
(1,406,497) (1,079,917) 326,580 ‐23.2%
Net Change Before Other Adjustments & Transfers ‐ ‐ ‐
Transfer from/(to) Administrative Savings Rsrv ‐ ‐ ‐
Transfer from/(to) Budget Stabilization ‐ ‐ ‐
‐ ‐ ‐
Other Strategic Transfers from/(to) Reserves ‐ ‐ ‐
Net Change in Cash & Reserve Transfers ‐$ ‐$ ‐$
Net Student Charges Revenue
Revenues
Tuition & Fee Revenue
Dining & Residence Revenue
Tuition Waivers/Scholarships
Depreciation
State Appropriation
Indirect Cost Recovery
Investment Income/Gifts
Sales/Services/Auxiliary
Total Revenue
Fuel & Electricity
Memberships, Contributions & Sponsorships
Interest
Other Expenses & Transfers
Total Operating Expenses & Transfers
Operating Increase (Decrease)
Add Back Depreciation
Less Capital Expenditures
Less Capital Reserve Funding
Less Debt Service Principal
Net Change Subtotal
2.2
Finance, Facilities, Technology Committee Meeting - FY2019 Proposed Operating & Capital Budget & Student Charges – 2nd reading
65

ReportID: STATS3FB University of Maine
Scope Name: ALLBUUROPS FY19 PROPOSED BUDGET
Layout Name: MW_STATS3_FUTBUD_BOT19version Unrestricted Auxiliary
FY18 BASE FY19 BASE CHANGE
‐$ ‐$ ‐$ ‐%
39,159,100 39,188,740 29,640 0.1%
(1,179,602) (1,212,967) (33,365) 2.8%
37,979,498 37,975,773 (3,725) 0.0%
‐ ‐ ‐ ‐%
‐ ‐ ‐ ‐%
‐ ‐ ‐ ‐%
12,319,502 13,204,381 884,879 7.2%
50,299,000 51,180,154 881,154 1.8%
Expenses
Personnel 17,178,830 17,581,341 402,511 2.3%
3,685,274 3,731,834 46,560 1.3%
Supplies & Services 13,401,543 13,204,351 (197,192) ‐1.5%
Shared Services ‐ ‐ ‐ ‐%
Travel 104,268 102,455 (1,813) ‐1.7%
20,000 12,061 (7,939) ‐39.7%
Maintenance & Alterations 3,053,403 3,225,576 172,173 5.6%
2,000,586 1,876,652 (123,934) ‐6.2%
3,387,324 3,999,166 611,842 18.1%
5,277,189 5,495,924 218,735 4.1%
48,108,417 49,229,360 1,120,943 2.3%
Operating Increase (Decrease) 2,190,583$ 1,950,794$ (239,789)$ ‐10.9%
Modified Cash Flow
2,190,583$ 1,950,794$ (239,789)$ ‐10.9%
3,387,324 3,999,166 611,842 18.1%
(1,688,152) (1,978,747) (290,595) 17.2%
(1,354,055) (1,368,313) (14,258) 1.1%
(2,535,700) (2,602,900) (67,200) 2.7%
Net Change Before Other Adjustments & Transfers ‐ ‐ ‐
Transfer from/(to) Administrative Savings Rsrv ‐ ‐ ‐
Transfer from/(to) Budget Stabilization ‐ ‐ ‐
‐ ‐ ‐
Other Strategic Transfers from/(to) Reserves ‐ ‐ ‐
Net Change in Cash & Reserve Transfers ‐$ ‐$ ‐$
Net Student Charges Revenue
Revenues
Tuition & Fee Revenue
Dining & Residence Revenue
Tuition Waivers/Scholarships
Depreciation
State Appropriation
Indirect Cost Recovery
Investment Income/Gifts
Sales/Services/Auxiliary
Total Revenue
Fuel & Electricity
Memberships, Contributions & Sponsorships
Interest
Other Expenses & Transfers
Total Operating Expenses & Transfers
Operating Increase (Decrease)
Add Back Depreciation
Less Capital Expenditures
Less Capital Reserve Funding
Less Debt Service Principal
Net Change Subtotal
2.2
Finance, Facilities, Technology Committee Meeting - FY2019 Proposed Operating & Capital Budget & Student Charges – 2nd reading
66

ReportID: STATS3FB University of Maine
Scope Name: ALLBUUROPS FY19 PROPOSED BUDGET
Layout Name: MW_STATS3_FUTBUD_BOT19versionUnrestricted E&G and Auxiliary
FY18 BASE FY19 BASE CHANGE
158,866,957$ 172,126,005$ 13,259,048$ 8.3%
39,159,100 39,188,740 29,640 0.1%
(50,360,086) (55,729,505) (5,369,419) 10.7%
147,665,971 155,585,240 7,919,269 5.4%
83,854,217 83,459,572 (394,645) ‐0.5%
8,371,276 8,371,276 ‐ 0.0%
912,890 919,938 7,048 0.8%
27,081,267 29,230,283 2,149,016 7.9%
267,885,621 277,566,309 9,680,688 3.6%
Expenses
Personnel 156,633,315 163,370,857 6,737,542 4.3%
13,682,385 13,871,638 189,253 1.4%
Supplies & Services 28,502,350 29,678,579 1,176,229 4.1%
Shared Services 18,255,579 18,747,182 491,603 2.7%
Travel 2,681,030 2,912,630 231,600 8.6%
439,136 433,160 (5,976) ‐1.4%
Maintenance & Alterations 7,553,470 7,767,832 214,362 2.8%
2,667,927 2,464,112 (203,815) ‐7.6%
17,564,886 17,787,453 222,567 1.3%
26,105,917 26,104,378 (1,539) 0.0%
274,085,995 283,137,821 9,051,826 3.3%
Operating Increase (Decrease) (6,200,374)$ (5,571,512)$ 628,862$ ‐10.1%
Modified Cash Flow
(6,200,374)$ (5,571,512)$ 628,862$ ‐10.1%
17,564,886 17,787,453 222,567 1.3%
(6,068,260) (7,164,811) (1,096,551) 18.1%
(1,354,055) (1,368,313) (14,258) 1.1%
(3,942,197) (3,682,817) 259,380 ‐6.6%
Net Change Before Other Adjustments & Transfers ‐ ‐ ‐
Transfer from/(to) Administrative Savings Rsrv ‐ ‐ ‐
Transfer from/(to) Budget Stabilization ‐ ‐ ‐
‐ ‐ ‐
Other Strategic Transfers from/(to) Reserves ‐ ‐ ‐
Net Change in Cash & Reserve Transfers ‐$ ‐$ ‐$
Net Student Charges Revenue
Revenues
Tuition & Fee Revenue
Dining & Residence Revenue
Tuition Waivers/Scholarships
Depreciation
State Appropriation
Indirect Cost Recovery
Investment Income/Gifts
Sales/Services/Auxiliary
Total Revenue
Fuel & Electricity
Memberships, Contributions & Sponsorships
Interest
Other Expenses & Transfers
Total Operating Expenses & Transfers
Operating Increase (Decrease)
Add Back Depreciation
Less Capital Expenditures
Less Capital Reserve Funding
Less Debt Service Principal
Net Change Subtotal
2.2
Finance, Facilities, Technology Committee Meeting - FY2019 Proposed Operating & Capital Budget & Student Charges – 2nd reading
67

ReportID: STATS3FB University of Maine at Augusta
Scope Name: ALLBUUROPS FY19 PROPOSED BUDGET
Layout Name: MW_STATS3_FUTBUD_BOT19version Unrestricted E&G
FY18 BASE FY19 BASE CHANGE
22,457,993$ 21,317,704$ (1,140,289)$ ‐5.1%
‐ ‐ ‐ ‐%
(3,150,117) (3,182,057) (31,940) 1.0%
19,307,876 18,135,647 (1,172,229) ‐6.1%
17,193,899 17,415,314 221,415 1.3%
175,000 160,886 (14,114) ‐8.1%
‐ ‐ ‐ ‐%
435,750 380,456 (55,294) ‐12.7%
37,112,525 36,092,303 (1,020,222) ‐2.7%
Expenses
Personnel 26,196,976 26,628,310 431,334 1.6%
825,793 731,723 (94,070) ‐11.4%
Supplies & Services 1,821,257 1,726,782 (94,475) ‐5.2%
Shared Services 4,645,524 4,840,186 194,662 4.2%
Travel 270,407 309,323 38,916 14.4%
81,259 80,316 (943) ‐1.2%
Maintenance & Alterations 464,219 474,493 10,274 2.2%
37,508 30,221 (7,287) ‐19.4%
1,608,500 1,730,680 122,180 7.6%
2,458,436 2,826,337 367,901 15.0%
38,409,879 39,378,371 968,492 2.5%
Operating Increase (Decrease) (1,297,354)$ (3,286,069)$ (1,988,715)$ 153.3%
Modified Cash Flow
(1,297,354)$ (3,286,069)$ (1,988,715)$ 153.3%
1,608,500 1,730,680 122,180 7.6%
(992,227) (980,319) 11,908 ‐1.2%
‐ ‐ ‐ ‐%
(309,747) (328,376) (18,629) 6.0%
Net Change Before Other Adjustments & Transfers (990,828) (2,864,084) (1,873,256)
Transfer from/(to) Administrative Savings Rsrv ‐ ‐ ‐
Transfer from/(to) Budget Stabilization ‐ ‐ ‐
(990,828) (2,864,084) (1,873,256)
Other Strategic Transfers from/(to) Reserves 990,828 2,864,084 1,873,256
Net Change in Cash & Reserve Transfers ‐$ 0$ 0$
Net Student Charges Revenue
Revenues
Tuition & Fee Revenue
Dining & Residence Revenue
Tuition Waivers/Scholarships
Depreciation
State Appropriation
Indirect Cost Recovery
Investment Income/Gifts
Sales/Services/Auxiliary
Total Revenue
Fuel & Electricity
Memberships, Contributions & Sponsorships
Interest
Other Expenses & Transfers
Total Operating Expenses & Transfers
Operating Increase (Decrease)
Add Back Depreciation
Less Capital Expenditures
Less Capital Reserve Funding
Less Debt Service Principal
Net Change Subtotal
2.2
Finance, Facilities, Technology Committee Meeting - FY2019 Proposed Operating & Capital Budget & Student Charges – 2nd reading
68

ReportID: STATS3FB University of Maine at Augusta
Scope Name: ALLBUUROPS FY19 PROPOSED BUDGET
Layout Name: MW_STATS3_FUTBUD_BOT19version Unrestricted Auxiliary
FY18 BASE FY19 BASE CHANGE
‐$ ‐$ ‐$ ‐%
‐ 7,637 7,637 ‐%
‐ ‐ ‐ ‐%
‐ 7,637 7,637 ‐%
‐ ‐ ‐ ‐%
‐ ‐ ‐ ‐%
‐ ‐ ‐ ‐%
1,191,000 1,086,000 (105,000) ‐8.8%
1,191,000 1,093,637 (97,363) ‐8.2%
Expenses
Personnel 285,444 283,552 (1,892) ‐0.7%
1,000 1,000 ‐ 0.0%
Supplies & Services 810,400 750,450 (59,950) ‐7.4%
Shared Services ‐ ‐ ‐ ‐%
Travel 450 450 ‐ 0.0%
900 900 ‐ 0.0%
Maintenance & Alterations 3,500 9,137 5,637 161.1%
1,882 1,468 (414) ‐22.0%
29,670 17,662 (12,008) ‐40.5%
123,040 122,705 (335) ‐0.3%
1,256,286 1,187,324 (68,962) ‐5.5%
Operating Increase (Decrease) (65,286)$ (93,687)$ (28,401)$ 43.5%
Modified Cash Flow
(65,286)$ (93,687)$ (28,401)$ 43.5%
29,670 17,662 (12,008) ‐40.5%
‐ ‐ ‐ ‐%
‐ ‐ ‐ ‐%
(10,345) (10,904) (559) 5.4%
Net Change Before Other Adjustments & Transfers (45,961) (86,929) (40,968)
Transfer from/(to) Administrative Savings Rsrv ‐ ‐ ‐
Transfer from/(to) Budget Stabilization ‐ ‐ ‐
(45,961) (86,929) (40,968)
Other Strategic Transfers from/(to) Reserves 45,961 86,929 40,968
Net Change in Cash & Reserve Transfers ‐$ ‐$ ‐$
Net Student Charges Revenue
Revenues
Tuition & Fee Revenue
Dining & Residence Revenue
Tuition Waivers/Scholarships
Depreciation
State Appropriation
Indirect Cost Recovery
Investment Income/Gifts
Sales/Services/Auxiliary
Total Revenue
Fuel & Electricity
Memberships, Contributions & Sponsorships
Interest
Other Expenses & Transfers
Total Operating Expenses & Transfers
Operating Increase (Decrease)
Add Back Depreciation
Less Capital Expenditures
Less Capital Reserve Funding
Less Debt Service Principal
Net Change Subtotal
2.2
Finance, Facilities, Technology Committee Meeting - FY2019 Proposed Operating & Capital Budget & Student Charges – 2nd reading
69

ReportID: STATS3FB University of Maine at Augusta
Scope Name: ALLBUUROPS FY19 PROPOSED BUDGET
Layout Name: MW_STATS3_FUTBUD_BOT19versionUnrestricted E&G and Auxiliary
FY18 BASE FY19 BASE CHANGE
22,457,993$ 21,317,704$ (1,140,289)$ ‐5.1%
‐ 7,637 7,637 ‐%
(3,150,117) (3,182,057) (31,940) 1.0%
19,307,876 18,143,284 (1,164,592) ‐6.0%
17,193,899 17,415,314 221,415 1.3%
175,000 160,886 (14,114) ‐8.1%
‐ ‐ ‐ ‐%
1,626,750 1,466,456 (160,294) ‐9.9%
38,303,525 37,185,940 (1,117,585) ‐2.9%
Expenses
Personnel 26,482,420 26,911,862 429,442 1.6%
826,793 732,723 (94,070) ‐11.4%
Supplies & Services 2,631,657 2,477,232 (154,425) ‐5.9%
Shared Services 4,645,524 4,840,186 194,662 4.2%
Travel 270,857 309,773 38,916 14.4%
82,159 81,216 (943) ‐1.1%
Maintenance & Alterations 467,719 483,630 15,911 3.4%
39,390 31,689 (7,701) ‐19.6%
1,638,170 1,748,342 110,172 6.7%
2,581,476 2,949,042 367,566 14.2%
39,666,165 40,565,695 899,530 2.3%
Operating Increase (Decrease) (1,362,640)$ (3,379,756)$ (2,017,116)$ 148.0%
Modified Cash Flow
(1,362,640)$ (3,379,756)$ (2,017,116)$ 148.0%
1,638,170 1,748,342 110,172 6.7%
(992,227) (980,319) 11,908 ‐1.2%
‐ ‐ ‐ ‐%
(320,092) (339,280) (19,188) 6.0%
Net Change Before Other Adjustments & Transfers (1,036,789) (2,951,013) (1,914,224)
Transfer from/(to) Administrative Savings Rsrv ‐ ‐ ‐
Transfer from/(to) Budget Stabilization ‐ ‐ ‐
(1,036,789) (2,951,013) (1,914,224)
Other Strategic Transfers from/(to) Reserves 1,036,789 2,951,013 1,914,224
Net Change in Cash & Reserve Transfers ‐$ 0$ 0$
Net Student Charges Revenue
Revenues
Tuition & Fee Revenue
Dining & Residence Revenue
Tuition Waivers/Scholarships
Depreciation
State Appropriation
Indirect Cost Recovery
Investment Income/Gifts
Sales/Services/Auxiliary
Total Revenue
Fuel & Electricity
Memberships, Contributions & Sponsorships
Interest
Other Expenses & Transfers
Total Operating Expenses & Transfers
Operating Increase (Decrease)
Add Back Depreciation
Less Capital Expenditures
Less Capital Reserve Funding
Less Debt Service Principal
Net Change Subtotal
2.2
Finance, Facilities, Technology Committee Meeting - FY2019 Proposed Operating & Capital Budget & Student Charges – 2nd reading
70

ReportID: STATS3FB Univ of Maine at Farmington
Scope Name: ALLBUUROPS FY19 PROPOSED BUDGET
Layout Name: MW_STATS3_FUTBUD_BOT19version Unrestricted E&G
FY18 BASE FY19 BASE CHANGE
20,764,144$ 21,401,214$ 637,070$ 3.1%
‐ ‐ ‐ ‐%
(3,488,511) (4,141,336) (652,825) 18.7%
17,275,633 17,259,878 (15,755) ‐0.1%
12,296,865 12,365,939 69,074 0.6%
200,000 200,000 ‐ 0.0%
‐ ‐ ‐ ‐%
654,310 700,310 46,000 7.0%
30,426,808 30,526,127 99,319 0.3%
Expenses
Personnel 23,687,237 24,033,555 346,318 1.5%
629,360 689,470 60,110 9.6%
Supplies & Services 1,586,322 1,263,278 (323,044) ‐20.4%
Shared Services 3,337,924 3,671,846 333,922 10.0%
Travel 562,259 521,330 (40,929) ‐7.3%
94,665 94,059 (606) ‐0.6%
Maintenance & Alterations 34,522 50,981 16,459 47.7%
213,952 197,746 (16,206) ‐7.6%
1,827,065 1,835,415 8,350 0.5%
(891,879) (1,221,318) (329,439) 36.9%
31,081,427 31,136,362 54,935 0.2%
Operating Increase (Decrease) (654,619)$ (610,235)$ 44,384$ ‐6.8%
Modified Cash Flow
(654,619)$ (610,235)$ 44,384$ ‐6.8%
1,827,065 1,835,415 8,350 0.5%
‐ ‐ ‐ ‐%
(850,230) (884,239) (34,009) 4.0%
(322,216) (340,941) (18,725) 5.8%
Net Change Before Other Adjustments & Transfers ‐ ‐ ‐
Transfer from/(to) Administrative Savings Rsrv ‐ ‐ ‐
Transfer from/(to) Budget Stabilization ‐ ‐ ‐
‐ ‐ ‐
Other Strategic Transfers from/(to) Reserves ‐ ‐ ‐
Net Change in Cash & Reserve Transfers ‐$ ‐$ ‐$
Net Student Charges Revenue
Revenues
Tuition & Fee Revenue
Dining & Residence Revenue
Tuition Waivers/Scholarships
Depreciation
State Appropriation
Indirect Cost Recovery
Investment Income/Gifts
Sales/Services/Auxiliary
Total Revenue
Fuel & Electricity
Memberships, Contributions & Sponsorships
Interest
Other Expenses & Transfers
Total Operating Expenses & Transfers
Operating Increase (Decrease)
Add Back Depreciation
Less Capital Expenditures
Less Capital Reserve Funding
Less Debt Service Principal
Net Change Subtotal
2.2
Finance, Facilities, Technology Committee Meeting - FY2019 Proposed Operating & Capital Budget & Student Charges – 2nd reading
71

ReportID: STATS3FB Univ of Maine at Farmington
Scope Name: ALLBUUROPS FY19 PROPOSED BUDGET
Layout Name: MW_STATS3_FUTBUD_BOT19version Unrestricted Auxiliary
FY18 BASE FY19 BASE CHANGE
‐$ ‐$ ‐$ ‐%
8,998,503 9,037,262 38,759 0.4%
(260,000) (343,237) (83,237) 32.0%
8,738,503 8,694,025 (44,478) ‐0.5%
‐ ‐ ‐ ‐%
‐ ‐ ‐ ‐%
‐ ‐ ‐ ‐%
266,155 278,000 11,845 4.5%
9,004,658 8,972,025 (32,633) ‐0.4%
Expenses
Personnel 1,706,802 1,557,651 (149,151) ‐8.7%
465,540 581,341 115,801 24.9%
Supplies & Services 3,168,472 3,186,685 18,213 0.6%
Shared Services ‐ ‐ ‐ ‐%
Travel 12,125 4,275 (7,850) ‐64.7%
5,595 3,975 (1,620) ‐29.0%
Maintenance & Alterations 57,587 47,457 (10,130) ‐17.6%
448,810 416,531 (32,279) ‐7.2%
461,347 588,187 126,840 27.5%
2,076,809 2,262,520 185,711 8.9%
8,403,087 8,648,622 245,535 2.9%
Operating Increase (Decrease) 601,571$ 323,403$ (278,168)$ ‐46.2%
Modified Cash Flow
601,571$ 323,403$ (278,168)$ ‐46.2%
461,347 588,187 126,840 27.5%
(244,700) (139,700) 105,000 ‐42.9%
(142,469) (118,290) 24,179 ‐17.0%
(627,914) (653,600) (25,686) 4.1%
Net Change Before Other Adjustments & Transfers 47,835 ‐ (47,835)
Transfer from/(to) Administrative Savings Rsrv ‐ ‐ ‐
Transfer from/(to) Budget Stabilization ‐ ‐ ‐
47,835 ‐ (47,835)
Other Strategic Transfers from/(to) Reserves ‐ ‐ ‐
Net Change in Cash & Reserve Transfers 47,835$ ‐$ (47,835)$
Net Student Charges Revenue
Revenues
Tuition & Fee Revenue
Dining & Residence Revenue
Tuition Waivers/Scholarships
Depreciation
State Appropriation
Indirect Cost Recovery
Investment Income/Gifts
Sales/Services/Auxiliary
Total Revenue
Fuel & Electricity
Memberships, Contributions & Sponsorships
Interest
Other Expenses & Transfers
Total Operating Expenses & Transfers
Operating Increase (Decrease)
Add Back Depreciation
Less Capital Expenditures
Less Capital Reserve Funding
Less Debt Service Principal
Net Change Subtotal
2.2
Finance, Facilities, Technology Committee Meeting - FY2019 Proposed Operating & Capital Budget & Student Charges – 2nd reading
72

ReportID: STATS3FB Univ of Maine at Farmington
Scope Name: ALLBUUROPS FY19 PROPOSED BUDGET
Layout Name: MW_STATS3_FUTBUD_BOT19versionUnrestricted E&G and Auxiliary
FY18 BASE FY19 BASE CHANGE
20,764,144$ 21,401,214$ 637,070$ 3.1%
8,998,503 9,037,262 38,759 0.4%
(3,748,511) (4,484,573) (736,062) 19.6%
26,014,136 25,953,903 (60,233) ‐0.2%
12,296,865 12,365,939 69,074 0.6%
200,000 200,000 ‐ 0.0%
‐ ‐ ‐ ‐%
920,465 978,310 57,845 6.3%
39,431,466 39,498,152 66,686 0.2%
Expenses
Personnel 25,394,039 25,591,206 197,167 0.8%
1,094,900 1,270,811 175,911 16.1%
Supplies & Services 4,754,794 4,449,963 (304,831) ‐6.4%
Shared Services 3,337,924 3,671,846 333,922 10.0%
Travel 574,384 525,605 (48,779) ‐8.5%
100,260 98,034 (2,226) ‐2.2%
Maintenance & Alterations 92,109 98,438 6,329 6.9%
662,762 614,277 (48,485) ‐7.3%
2,288,412 2,423,602 135,190 5.9%
1,184,930 1,041,202 (143,728) ‐12.1%
39,484,514 39,784,984 300,470 0.8%
Operating Increase (Decrease) (53,048)$ (286,832)$ (233,784)$ 440.7%
Modified Cash Flow
(53,048)$ (286,832)$ (233,784)$ 440.7%
2,288,412 2,423,602 135,190 5.9%
(244,700) (139,700) 105,000 ‐42.9%
(992,699) (1,002,529) (9,830) 1.0%
(950,130) (994,541) (44,411) 4.7%
Net Change Before Other Adjustments & Transfers 47,835 ‐ (47,835)
Transfer from/(to) Administrative Savings Rsrv ‐ ‐ ‐
Transfer from/(to) Budget Stabilization ‐ ‐ ‐
47,835 ‐ (47,835)
Other Strategic Transfers from/(to) Reserves ‐ ‐ ‐
Net Change in Cash & Reserve Transfers 47,835$ ‐$ (47,835)$
Net Student Charges Revenue
Revenues
Tuition & Fee Revenue
Dining & Residence Revenue
Tuition Waivers/Scholarships
Depreciation
State Appropriation
Indirect Cost Recovery
Investment Income/Gifts
Sales/Services/Auxiliary
Total Revenue
Fuel & Electricity
Memberships, Contributions & Sponsorships
Interest
Other Expenses & Transfers
Total Operating Expenses & Transfers
Operating Increase (Decrease)
Add Back Depreciation
Less Capital Expenditures
Less Capital Reserve Funding
Less Debt Service Principal
Net Change Subtotal
2.2
Finance, Facilities, Technology Committee Meeting - FY2019 Proposed Operating & Capital Budget & Student Charges – 2nd reading
73

ReportID: STATS3FB Univ of Maine at Fort Kent
Scope Name: ALLBUUROPS FY19 PROPOSED BUDGET
Layout Name: MW_STATS3_FUTBUD_BOT19version Unrestricted E&G
FY18 BASE FY19 BASE CHANGE
8,737,323$ 9,381,658$ 644,335$ 7.4%
‐ ‐ ‐ ‐%
(1,530,916) (1,689,014) (158,098) 10.3%
7,206,407 7,692,644 486,237 6.7%
6,513,346 6,871,862 358,516 5.5%
36,230 32,500 (3,730) ‐10.3%
‐ ‐ ‐ ‐%
247,500 226,882 (20,618) ‐8.3%
14,003,483 14,823,888 820,405 5.9%
Expenses
Personnel 8,983,370 9,736,608 753,238 8.4%
447,346 453,246 5,900 1.3%
Supplies & Services 516,305 557,901 41,596 8.1%
Shared Services 1,714,078 1,873,595 159,517 9.3%
Travel 345,310 419,750 74,440 21.6%
60,550 102,270 41,720 68.9%
Maintenance & Alterations 243,640 247,850 4,210 1.7%
40,450 35,206 (5,244) ‐13.0%
668,982 724,561 55,579 8.3%
600,817 619,498 18,681 3.1%
13,620,848 14,770,485 1,149,637 8.4%
Operating Increase (Decrease) 382,635$ 53,403$ (329,232)$ ‐86.0%
Modified Cash Flow
382,635$ 53,403$ (329,232)$ ‐86.0%
668,982 724,561 55,579 8.3%
(220,000) (220,000) ‐ 0.0%
‐ ‐ ‐ ‐%
(326,999) (345,488) (18,489) 5.7%
Net Change Before Other Adjustments & Transfers 504,618 212,476 (292,142)
Transfer from/(to) Administrative Savings Rsrv ‐ ‐ ‐
Transfer from/(to) Budget Stabilization ‐ ‐ ‐
504,618 212,476 (292,142)
Other Strategic Transfers from/(to) Reserves ‐ ‐ ‐
Net Change in Cash & Reserve Transfers 504,618$ 212,476$ (292,142)$
Net Student Charges Revenue
Revenues
Tuition & Fee Revenue
Dining & Residence Revenue
Tuition Waivers/Scholarships
Depreciation
State Appropriation
Indirect Cost Recovery
Investment Income/Gifts
Sales/Services/Auxiliary
Total Revenue
Fuel & Electricity
Memberships, Contributions & Sponsorships
Interest
Other Expenses & Transfers
Total Operating Expenses & Transfers
Operating Increase (Decrease)
Add Back Depreciation
Less Capital Expenditures
Less Capital Reserve Funding
Less Debt Service Principal
Net Change Subtotal
2.2
Finance, Facilities, Technology Committee Meeting - FY2019 Proposed Operating & Capital Budget & Student Charges – 2nd reading
74

ReportID: STATS3FB Univ of Maine at Fort Kent
Scope Name: ALLBUUROPS FY19 PROPOSED BUDGET
Layout Name: MW_STATS3_FUTBUD_BOT19version Unrestricted Auxiliary
FY18 BASE FY19 BASE CHANGE
‐$ ‐$ ‐$ ‐%
1,609,420 1,463,200 (146,220) ‐9.1%
(60,000) (60,000) ‐ 0.0%
1,549,420 1,403,200 (146,220) ‐9.4%
‐ ‐ ‐ ‐%
‐ ‐ ‐ ‐%
‐ ‐ ‐ ‐%
109,100 106,900 (2,200) ‐2.0%
1,658,520 1,510,100 (148,420) ‐8.9%
Expenses
Personnel 315,104 291,006 (24,098) ‐7.6%
179,259 181,100 1,841 1.0%
Supplies & Services 812,817 700,690 (112,127) ‐13.8%
Shared Services ‐ ‐ ‐ ‐%
Travel 3,500 3,500 ‐ 0.0%
200 250 50 25.0%
Maintenance & Alterations 55,270 56,770 1,500 2.7%
218,324 207,200 (11,124) ‐5.1%
217,798 216,543 (1,255) ‐0.6%
60,902 65,427 4,525 7.4%
1,863,174 1,722,486 (140,688) ‐7.6%
Operating Increase (Decrease) (204,654)$ (212,386)$ (7,732)$ 3.8%
Modified Cash Flow
(204,654)$ (212,386)$ (7,732)$ 3.8%
217,798 216,543 (1,255) ‐0.6%
‐ ‐ ‐ ‐%
‐ ‐ ‐ ‐%
(208,826) (210,000) (1,174) 0.6%
Net Change Before Other Adjustments & Transfers (195,682) (205,843) (10,161)
Transfer from/(to) Administrative Savings Rsrv ‐ ‐ ‐
Transfer from/(to) Budget Stabilization ‐ ‐ ‐
(195,682) (205,843) (10,161)
Other Strategic Transfers from/(to) Reserves ‐ ‐ ‐
Net Change in Cash & Reserve Transfers (195,682)$ (205,843)$ (10,161)$
Net Student Charges Revenue
Revenues
Tuition & Fee Revenue
Dining & Residence Revenue
Tuition Waivers/Scholarships
Depreciation
State Appropriation
Indirect Cost Recovery
Investment Income/Gifts
Sales/Services/Auxiliary
Total Revenue
Fuel & Electricity
Memberships, Contributions & Sponsorships
Interest
Other Expenses & Transfers
Total Operating Expenses & Transfers
Operating Increase (Decrease)
Add Back Depreciation
Less Capital Expenditures
Less Capital Reserve Funding
Less Debt Service Principal
Net Change Subtotal
2.2
Finance, Facilities, Technology Committee Meeting - FY2019 Proposed Operating & Capital Budget & Student Charges – 2nd reading
75

ReportID: STATS3FB Univ of Maine at Fort Kent
Scope Name: ALLBUUROPS FY19 PROPOSED BUDGET
Layout Name: MW_STATS3_FUTBUD_BOT19versionUnrestricted E&G and Auxiliary
FY18 BASE FY19 BASE CHANGE
8,737,323$ 9,381,658$ 644,335$ 7.4%
1,609,420 1,463,200 (146,220) ‐9.1%
(1,590,916) (1,749,014) (158,098) 9.9%
8,755,827 9,095,844 340,017 3.9%
6,513,346 6,871,862 358,516 5.5%
36,230 32,500 (3,730) ‐10.3%
‐ ‐ ‐ ‐%
356,600 333,782 (22,818) ‐6.4%
15,662,003 16,333,988 671,985 4.3%
Expenses
Personnel 9,298,474 10,027,614 729,140 7.8%
626,605 634,346 7,741 1.2%
Supplies & Services 1,329,122 1,258,591 (70,531) ‐5.3%
Shared Services 1,714,078 1,873,595 159,517 9.3%
Travel 348,810 423,250 74,440 21.3%
60,750 102,520 41,770 68.8%
Maintenance & Alterations 298,910 304,620 5,710 1.9%
258,774 242,406 (16,368) ‐6.3%
886,780 941,104 54,324 6.1%
661,719 684,925 23,206 3.5%
15,484,022 16,492,971 1,008,949 6.5%
Operating Increase (Decrease) 177,981$ (158,983)$ (336,964)$ ‐189.3%
Modified Cash Flow
177,981$ (158,983)$ (336,964)$ ‐189.3%
886,780 941,104 54,324 6.1%
(220,000) (220,000) ‐ 0.0%
‐ ‐ ‐ ‐%
(535,825) (555,488) (19,663) 3.7%
Net Change Before Other Adjustments & Transfers 308,936 6,633 (302,303)
Transfer from/(to) Administrative Savings Rsrv ‐ ‐ ‐
Transfer from/(to) Budget Stabilization ‐ ‐ ‐
308,936 6,633 (302,303)
Other Strategic Transfers from/(to) Reserves ‐ ‐ ‐
Net Change in Cash & Reserve Transfers 308,936$ 6,633$ (302,303)$
Net Student Charges Revenue
Revenues
Tuition & Fee Revenue
Dining & Residence Revenue
Tuition Waivers/Scholarships
Depreciation
State Appropriation
Indirect Cost Recovery
Investment Income/Gifts
Sales/Services/Auxiliary
Total Revenue
Fuel & Electricity
Memberships, Contributions & Sponsorships
Interest
Other Expenses & Transfers
Total Operating Expenses & Transfers
Operating Increase (Decrease)
Add Back Depreciation
Less Capital Expenditures
Less Capital Reserve Funding
Less Debt Service Principal
Net Change Subtotal
2.2
Finance, Facilities, Technology Committee Meeting - FY2019 Proposed Operating & Capital Budget & Student Charges – 2nd reading
76

ReportID: STATS3FB Univ of Maine at Machias
Scope Name: ALLBUUROPS FY19 PROPOSED BUDGET
Layout Name: MW_STATS3_FUTBUD_BOT19version Unrestricted E&G
FY18 BASE FY19 BASE CHANGE
4,839,337$ 4,621,822$ (217,515)$ ‐4.5%
‐ ‐ ‐ ‐%
(1,468,193) (1,168,193) 300,000 ‐20.4%
3,371,144 3,453,629 82,485 2.4%
5,252,559 5,200,375 (52,184) ‐1.0%
60,000 60,000 ‐ 0.0%
‐ ‐ ‐ ‐%
251,780 298,667 46,887 18.6%
8,935,483 9,012,671 77,188 0.9%
Expenses
Personnel 5,801,316 5,713,591 (87,725) ‐1.5%
341,000 364,200 23,200 6.8%
Supplies & Services 586,710 639,229 52,519 9.0%
Shared Services 1,242,149 1,182,440 (59,709) ‐4.8%
Travel 225,875 245,642 19,767 8.8%
40,725 41,360 635 1.6%
Maintenance & Alterations 113,628 142,804 29,176 25.7%
66,156 60,186 (5,970) ‐9.0%
519,679 493,173 (26,506) ‐5.1%
412,072 511,047 98,975 24.0%
9,349,310 9,393,672 44,362 0.5%
Operating Increase (Decrease) (413,827)$ (381,001)$ 32,826$ ‐7.9%
Modified Cash Flow
(413,827)$ (381,001)$ 32,826$ ‐7.9%
519,679 493,173 (26,506) ‐5.1%
‐ (6,500) (6,500) ‐%
‐ ‐ ‐ ‐%
(105,852) (105,672) 180 ‐0.2%
Net Change Before Other Adjustments & Transfers ‐ ‐ ‐
Transfer from/(to) Administrative Savings Rsrv ‐ ‐ ‐
Transfer from/(to) Budget Stabilization ‐ ‐ ‐
‐ ‐ ‐
Other Strategic Transfers from/(to) Reserves ‐ ‐ ‐
Net Change in Cash & Reserve Transfers ‐$ ‐$ ‐$
Net Student Charges Revenue
Revenues
Tuition & Fee Revenue
Dining & Residence Revenue
Tuition Waivers/Scholarships
Depreciation
State Appropriation
Indirect Cost Recovery
Investment Income/Gifts
Sales/Services/Auxiliary
Total Revenue
Fuel & Electricity
Memberships, Contributions & Sponsorships
Interest
Other Expenses & Transfers
Total Operating Expenses & Transfers
Operating Increase (Decrease)
Add Back Depreciation
Less Capital Expenditures
Less Capital Reserve Funding
Less Debt Service Principal
Net Change Subtotal
2.2
Finance, Facilities, Technology Committee Meeting - FY2019 Proposed Operating & Capital Budget & Student Charges – 2nd reading
77

ReportID: STATS3FB Univ of Maine at Machias
Scope Name: ALLBUUROPS FY19 PROPOSED BUDGET
Layout Name: MW_STATS3_FUTBUD_BOT19version Unrestricted Auxiliary
FY18 BASE FY19 BASE CHANGE
‐$ ‐$ ‐$ ‐%
1,871,238 1,718,766 (152,472) ‐8.1%
(102,000) (62,440) 39,560 ‐38.8%
1,769,238 1,656,326 (112,912) ‐6.4%
‐ ‐ ‐ ‐%
‐ ‐ ‐ ‐%
‐ ‐ ‐ ‐%
80,219 47,500 (32,719) ‐40.8%
1,849,457 1,703,826 (145,631) ‐7.9%
Expenses
Personnel 263,942 240,635 (23,307) ‐8.8%
227,000 203,656 (23,344) ‐10.3%
Supplies & Services 818,942 770,335 (48,607) ‐5.9%
Shared Services ‐ ‐ ‐ ‐%
Travel 2,100 700 (1,400) ‐66.7%
500 100 (400) ‐80.0%
Maintenance & Alterations 124,500 98,475 (26,025) ‐20.9%
98,778 92,975 (5,803) ‐5.9%
200,831 255,919 55,088 27.4%
99,391 79,877 (19,514) ‐19.6%
1,835,984 1,742,672 (93,312) ‐5.1%
Operating Increase (Decrease) 13,473$ (38,846)$ (52,319)$ ‐388.3%
Modified Cash Flow
13,473$ (38,846)$ (52,319)$ ‐388.3%
200,831 255,919 55,088 27.4%
(18,981) ‐ 18,981 ‐100.0%
‐ ‐ ‐ ‐%
(195,323) (217,073) (21,750) 11.1%
Net Change Before Other Adjustments & Transfers ‐ ‐ ‐
Transfer from/(to) Administrative Savings Rsrv ‐ ‐ ‐
Transfer from/(to) Budget Stabilization ‐ ‐ ‐
‐ ‐ ‐
Other Strategic Transfers from/(to) Reserves ‐ ‐ ‐
Net Change in Cash & Reserve Transfers ‐$ ‐$ ‐$
Net Student Charges Revenue
Revenues
Tuition & Fee Revenue
Dining & Residence Revenue
Tuition Waivers/Scholarships
Depreciation
State Appropriation
Indirect Cost Recovery
Investment Income/Gifts
Sales/Services/Auxiliary
Total Revenue
Fuel & Electricity
Memberships, Contributions & Sponsorships
Interest
Other Expenses & Transfers
Total Operating Expenses & Transfers
Operating Increase (Decrease)
Add Back Depreciation
Less Capital Expenditures
Less Capital Reserve Funding
Less Debt Service Principal
Net Change Subtotal
2.2
Finance, Facilities, Technology Committee Meeting - FY2019 Proposed Operating & Capital Budget & Student Charges – 2nd reading
78

ReportID: STATS3FB Univ of Maine at Machias
Scope Name: ALLBUUROPS FY19 PROPOSED BUDGET
Layout Name: MW_STATS3_FUTBUD_BOT19versionUnrestricted E&G and Auxiliary
FY18 BASE FY19 BASE CHANGE
4,839,337$ 4,621,822$ (217,515)$ ‐4.5%
1,871,238 1,718,766 (152,472) ‐8.1%
(1,570,193) (1,230,633) 339,560 ‐21.6%
5,140,382 5,109,955 (30,427) ‐0.6%
5,252,559 5,200,375 (52,184) ‐1.0%
60,000 60,000 ‐ 0.0%
‐ ‐ ‐ ‐%
331,999 346,167 14,168 4.3%
10,784,940 10,716,497 (68,443) ‐0.6%
Expenses
Personnel 6,065,258 5,954,226 (111,032) ‐1.8%
568,000 567,856 (144) 0.0%
Supplies & Services 1,405,652 1,409,564 3,912 0.3%
Shared Services 1,242,149 1,182,440 (59,709) ‐4.8%
Travel 227,975 246,342 18,367 8.1%
41,225 41,460 235 0.6%
Maintenance & Alterations 238,128 241,279 3,151 1.3%
164,934 153,161 (11,773) ‐7.1%
720,510 749,092 28,582 4.0%
511,463 590,924 79,461 15.5%
11,185,294 11,136,344 (48,950) ‐0.4%
Operating Increase (Decrease) (400,354)$ (419,847)$ (19,493)$ 4.9%
Modified Cash Flow
(400,354)$ (419,847)$ (19,493)$ 4.9%
720,510 749,092 28,582 4.0%
(18,981) (6,500) 12,481 ‐65.8%
‐ ‐ ‐ ‐%
(301,175) (322,745) (21,570) 7.2%
Net Change Before Other Adjustments & Transfers ‐ ‐ ‐
Transfer from/(to) Administrative Savings Rsrv ‐ ‐ ‐
Transfer from/(to) Budget Stabilization ‐ ‐ ‐
‐ ‐ ‐
Other Strategic Transfers from/(to) Reserves ‐ ‐ ‐
Net Change in Cash & Reserve Transfers ‐$ ‐$ ‐$
Net Student Charges Revenue
Revenues
Tuition & Fee Revenue
Dining & Residence Revenue
Tuition Waivers/Scholarships
Depreciation
State Appropriation
Indirect Cost Recovery
Investment Income/Gifts
Sales/Services/Auxiliary
Total Revenue
Fuel & Electricity
Memberships, Contributions & Sponsorships
Interest
Other Expenses & Transfers
Total Operating Expenses & Transfers
Operating Increase (Decrease)
Add Back Depreciation
Less Capital Expenditures
Less Capital Reserve Funding
Less Debt Service Principal
Net Change Subtotal
2.2
Finance, Facilities, Technology Committee Meeting - FY2019 Proposed Operating & Capital Budget & Student Charges – 2nd reading
79

ReportID: STATS3FB Univ of Maine at Presque Isle
Scope Name: ALLBUUROPS FY19 PROPOSED BUDGET
Layout Name: MW_STATS3_FUTBUD_BOT19version Unrestricted E&G
FY18 BASE FY19 BASE CHANGE
7,538,281$ 8,779,897$ 1,241,616$ 16.5%
‐ ‐ ‐ ‐%
(1,405,800) (1,778,532) (372,732) 26.5%
6,132,481 7,001,365 868,884 14.2%
7,936,764 7,500,556 (436,208) ‐5.5%
155,000 155,000 ‐ 0.0%
‐ ‐ ‐ ‐%
298,700 518,722 220,022 73.7%
14,522,945 15,175,643 652,698 4.5%
Expenses
Personnel 9,903,502 10,221,332 317,830 3.2%
557,050 557,375 325 0.1%
Supplies & Services 875,432 869,166 (6,266) ‐0.7%
Shared Services 1,930,611 2,083,261 152,650 7.9%
Travel 331,998 366,255 34,257 10.3%
56,191 56,515 324 0.6%
Maintenance & Alterations 289,882 315,734 25,852 8.9%
60,830 74,102 13,272 21.8%
835,290 877,030 41,740 5.0%
622,011 658,827 36,816 5.9%
15,462,797 16,079,597 616,800 4.0%
Operating Increase (Decrease) (939,852)$ (903,954)$ 35,898$ ‐3.8%
Modified Cash Flow
(939,852)$ (903,954)$ 35,898$ ‐3.8%
835,290 877,030 41,740 5.0%
(100,000) (160,176) (60,176) 60.2%
‐ (20,724) (20,724) ‐%
(59,953) (65,242) (5,289) 8.8%
Net Change Before Other Adjustments & Transfers (264,515) (273,066) (8,551)
Transfer from/(to) Administrative Savings Rsrv ‐ ‐ ‐
Transfer from/(to) Budget Stabilization ‐ ‐ ‐
(264,515) (273,066) (8,551)
Other Strategic Transfers from/(to) Reserves ‐ ‐ ‐
Net Change in Cash & Reserve Transfers (264,515)$ (273,066)$ (8,551)$
Net Student Charges Revenue
Revenues
Tuition & Fee Revenue
Dining & Residence Revenue
Tuition Waivers/Scholarships
Depreciation
State Appropriation
Indirect Cost Recovery
Investment Income/Gifts
Sales/Services/Auxiliary
Total Revenue
Fuel & Electricity
Memberships, Contributions & Sponsorships
Interest
Other Expenses & Transfers
Total Operating Expenses & Transfers
Operating Increase (Decrease)
Add Back Depreciation
Less Capital Expenditures
Less Capital Reserve Funding
Less Debt Service Principal
Net Change Subtotal
2.2
Finance, Facilities, Technology Committee Meeting - FY2019 Proposed Operating & Capital Budget & Student Charges – 2nd reading
80

ReportID: STATS3FB Univ of Maine at Presque Isle
Scope Name: ALLBUUROPS FY19 PROPOSED BUDGET
Layout Name: MW_STATS3_FUTBUD_BOT19version Unrestricted Auxiliary
FY18 BASE FY19 BASE CHANGE
‐$ ‐$ ‐$ ‐%
2,240,794 2,270,966 30,172 1.3%
(216,000) (227,600) (11,600) 5.4%
2,024,794 2,043,366 18,572 0.9%
‐ ‐ ‐ ‐%
‐ ‐ ‐ ‐%
‐ ‐ ‐ ‐%
146,700 111,075 (35,625) ‐24.3%
2,171,494 2,154,441 (17,053) ‐0.8%
Expenses
Personnel 216,169 204,843 (11,326) ‐5.2%
403,000 333,000 (70,000) ‐17.4%
Supplies & Services 729,145 850,842 121,697 16.7%
Shared Services ‐ ‐ ‐ ‐%
Travel 375 1,900 1,525 406.7%
‐ 386 386 ‐%
Maintenance & Alterations 305,000 291,500 (13,500) ‐4.4%
‐ 4,720 4,720 ‐%
58,673 61,413 2,740 4.7%
121,243 125,084 3,841 3.2%
1,833,605 1,873,688 40,083 2.2%
Operating Increase (Decrease) 337,889$ 280,753$ (57,136)$ ‐16.9%
Modified Cash Flow
337,889$ 280,753$ (57,136)$ ‐16.9%
58,673 61,413 2,740 4.7%
(132,047) (50,000) 82,047 ‐62.1%
‐ (19,100) (19,100) ‐%
‐ ‐ ‐ ‐%
Net Change Before Other Adjustments & Transfers 264,515 273,066 8,551
Transfer from/(to) Administrative Savings Rsrv ‐ ‐ ‐
Transfer from/(to) Budget Stabilization ‐ ‐ ‐
264,515 273,066 8,551
Other Strategic Transfers from/(to) Reserves ‐ ‐ ‐
Net Change in Cash & Reserve Transfers 264,515$ 273,066$ 8,551$
Net Student Charges Revenue
Revenues
Tuition & Fee Revenue
Dining & Residence Revenue
Tuition Waivers/Scholarships
Depreciation
State Appropriation
Indirect Cost Recovery
Investment Income/Gifts
Sales/Services/Auxiliary
Total Revenue
Fuel & Electricity
Memberships, Contributions & Sponsorships
Interest
Other Expenses & Transfers
Total Operating Expenses & Transfers
Operating Increase (Decrease)
Add Back Depreciation
Less Capital Expenditures
Less Capital Reserve Funding
Less Debt Service Principal
Net Change Subtotal
2.2
Finance, Facilities, Technology Committee Meeting - FY2019 Proposed Operating & Capital Budget & Student Charges – 2nd reading
81

ReportID: STATS3FB Univ of Maine at Presque Isle
Scope Name: ALLBUUROPS FY19 PROPOSED BUDGET
Layout Name: MW_STATS3_FUTBUD_BOT19versionUnrestricted E&G and Auxiliary
FY18 BASE FY19 BASE CHANGE
7,538,281$ 8,779,897$ 1,241,616$ 16.5%
2,240,794 2,270,966 30,172 1.3%
(1,621,800) (2,006,132) (384,332) 23.7%
8,157,275 9,044,731 887,456 10.9%
7,936,764 7,500,556 (436,208) ‐5.5%
155,000 155,000 ‐ 0.0%
‐ ‐ ‐ ‐%
445,400 629,797 184,397 41.4%
16,694,439 17,330,084 635,645 3.8%
Expenses
Personnel 10,119,671 10,426,175 306,504 3.0%
960,050 890,375 (69,675) ‐7.3%
Supplies & Services 1,604,577 1,720,008 115,431 7.2%
Shared Services 1,930,611 2,083,261 152,650 7.9%
Travel 332,373 368,155 35,782 10.8%
56,191 56,901 710 1.3%
Maintenance & Alterations 594,882 607,234 12,352 2.1%
60,830 78,822 17,992 29.6%
893,963 938,443 44,480 5.0%
743,254 783,911 40,657 5.5%
17,296,402 17,953,285 656,883 3.8%
Operating Increase (Decrease) (601,963)$ (623,201)$ (21,238)$ 3.5%
Modified Cash Flow
(601,963)$ (623,201)$ (21,238)$ 3.5%
893,963 938,443 44,480 5.0%
(232,047) (210,176) 21,871 ‐9.4%
‐ (39,824) (39,824) ‐%
(59,953) (65,242) (5,289) 8.8%
Net Change Before Other Adjustments & Transfers ‐ ‐ ‐
Transfer from/(to) Administrative Savings Rsrv ‐ ‐ ‐
Transfer from/(to) Budget Stabilization ‐ ‐ ‐
‐ ‐ ‐
Other Strategic Transfers from/(to) Reserves ‐ ‐ ‐
Net Change in Cash & Reserve Transfers ‐$ ‐$ ‐$
Net Student Charges Revenue
Revenues
Tuition & Fee Revenue
Dining & Residence Revenue
Tuition Waivers/Scholarships
Depreciation
State Appropriation
Indirect Cost Recovery
Investment Income/Gifts
Sales/Services/Auxiliary
Total Revenue
Fuel & Electricity
Memberships, Contributions & Sponsorships
Interest
Other Expenses & Transfers
Total Operating Expenses & Transfers
Operating Increase (Decrease)
Add Back Depreciation
Less Capital Expenditures
Less Capital Reserve Funding
Less Debt Service Principal
Net Change Subtotal
2.2
Finance, Facilities, Technology Committee Meeting - FY2019 Proposed Operating & Capital Budget & Student Charges – 2nd reading
82

ReportID: STATS3FB University of Southern Maine
Scope Name: 06USM&LAW FY19 PROPOSED BUDGET
Layout Name: MW_STATS3_FUTBUD_BOT19version Unrestricted E&G
Fiscal Year: 2019 Excludes Law School
FY18 BASE FY19 BASE CHANGE
68,021,127$ 70,180,235$ 2,159,108$ 3.2%
‐ ‐ ‐ ‐%
(15,473,697) (15,987,974) (514,277) 3.3%
52,547,430 54,192,261 1,644,831 3.1%
47,783,008 47,719,740 (63,268) ‐0.1%
3,105,000 3,500,000 395,000 12.7%
80,000 120,000 40,000 50.0%
5,004,449 3,621,293 (1,383,156) ‐27.6%
108,519,887 109,153,294 633,407 0.6%
Expenses
Personnel 76,793,475 75,649,881 (1,143,594) ‐1.5%
2,549,825 2,547,965 (1,860) ‐0.1%
Supplies & Services 5,722,248 5,519,360 (202,888) ‐3.5%
Shared Services 12,298,049 12,318,957 20,908 0.2%
Travel 1,103,502 1,033,842 (69,660) ‐6.3%
338,990 337,134 (1,856) ‐0.5%
Maintenance & Alterations 1,831,702 1,858,193 26,491 1.4%
812,693 705,001 (107,692) ‐13.3%
6,235,204 6,502,555 267,351 4.3%
6,231,189 5,706,010 (525,179) ‐8.4%
113,916,877 112,178,898 (1,737,979) ‐1.5%
Operating Increase (Decrease) (5,396,990)$ (3,025,604)$ 2,371,386$ ‐43.9%
Modified Cash Flow
(5,396,990)$ (3,025,604)$ 2,371,386$ ‐43.9%
6,235,204 6,502,555 267,351 4.3%
(1,797,056) (1,823,056) (26,000) 1.4%
‐ ‐ ‐ ‐%
(2,118,907) (1,653,895) 465,012 ‐21.9%
Net Change Before Other Adjustments & Transfers (3,077,749) (0) 3,077,749
Transfer from/(to) Administrative Savings Rsrv ‐ ‐ ‐
Transfer from/(to) Budget Stabilization ‐ ‐ ‐
(3,077,749) (0) 3,077,749
Other Strategic Transfers from/(to) Reserves 3,215,228 ‐ (3,215,228)
Net Change in Cash & Reserve Transfers 137,479$ (0)$ (137,479)$
Less Capital Reserve Funding
Less Debt Service Principal
Net Change Subtotal
Total Operating Expenses & Transfers
Operating Increase (Decrease)
Add Back Depreciation
Less Capital Expenditures
Memberships, Contributions & Sponsorships
Interest
Depreciation
Other Expenses & Transfers
Sales/Services/Auxiliary
Total Revenue
Fuel & Electricity
Net Student Charges Revenue
State Appropriation
Indirect Cost Recovery
Investment Income/Gifts
Revenues
Tuition & Fee Revenue
Dining & Residence Revenue
Tuition Waivers/Scholarships
2.2
Finance, Facilities, Technology Committee Meeting - FY2019 Proposed Operating & Capital Budget & Student Charges – 2nd reading
83

ReportID: STATS3FB University of Southern Maine
Scope Name: 06USM&LAW FY19 PROPOSED BUDGET
Layout Name: MW_STATS3_FUTBUD_BOT19version Unrestricted E&G
Fiscal Year: 2019 LAW SCHOOL
FY18 BASE FY19 BASE CHANGE
6,286,781$ 6,368,080$ 81,299$ 1.3%
‐ ‐ ‐ ‐%
(1,300,000) (1,900,000) (600,000) 46.2%
4,986,781 4,468,080 (518,701) ‐10.4%
‐ ‐ ‐ ‐%
‐ ‐ ‐ ‐%
‐ ‐ ‐ ‐%
‐ ‐ ‐ ‐%
4,986,781 4,468,080 (518,701) ‐10.4%
Expenses
Personnel 5,385,174 5,504,198 119,024 2.2%
‐ ‐ ‐ ‐%
Supplies & Services 278,890 236,290 (42,600) ‐15.3%
Shared Services ‐ ‐ ‐ ‐%
Travel 82,921 34,921 (48,000) ‐57.9%
27,000 26,700 (300) ‐1.1%
Maintenance & Alterations 7,750 3,250 (4,500) ‐58.1%
‐ ‐ ‐ ‐%
‐ ‐ ‐ ‐%
(106,835) (143,833) (36,998) 34.6%
5,674,900 5,661,526 (13,374) ‐0.2%
Operating Increase (Decrease) (688,119)$ (1,193,446)$ (505,327)$ 73.4%
Modified Cash Flow
(688,119)$ (1,193,446)$ (505,327)$ 73.4%
‐ ‐ ‐ ‐%
‐ ‐ ‐ ‐%
‐ ‐ ‐ ‐%
‐ ‐ ‐ ‐%
Net Change Before Other Adjustments & Transfers (688,119) (1,193,446) (505,327)
Transfer from/(to) Administrative Savings Rsrv ‐ ‐ ‐
Transfer from/(to) Budget Stabilization 275,320 ‐ (275,320)
(412,799) (1,193,446) (780,647)
Other Strategic Transfers from/(to) Reserves 275,320 693,446 418,126
Net Change in Cash & Reserve Transfers (137,479)$ (500,000)$ (362,521)$
Less Capital Reserve Funding
Less Debt Service Principal
Net Change Subtotal
Total Operating Expenses & Transfers
Operating Increase (Decrease)
Add Back Depreciation
Less Capital Expenditures
Memberships, Contributions & Sponsorships
Interest
Depreciation
Other Expenses & Transfers
Sales/Services/Auxiliary
Total Revenue
Fuel & Electricity
Net Student Charges Revenue
State Appropriation
Indirect Cost Recovery
Investment Income/Gifts
Revenues
Tuition & Fee Revenue
Dining & Residence Revenue
Tuition Waivers/Scholarships
2.2
Finance, Facilities, Technology Committee Meeting - FY2019 Proposed Operating & Capital Budget & Student Charges – 2nd reading
84

ReportID: STATS3FB University of Southern Maine
Scope Name: ALLBUUROPS FY19 PROPOSED BUDGET
Layout Name: MW_STATS3_FUTBUD_BOT19version Unrestricted E&G
FY18 BASE FY19 BASE CHANGE
74,307,908$ 76,548,315$ 2,240,407$ 3.0%
‐ ‐ ‐ ‐%
(16,773,697) (17,887,974) (1,114,277) 6.6%
57,534,211 58,660,341 1,126,130 2.0%
47,783,008 47,719,740 (63,268) ‐0.1%
3,105,000 3,500,000 395,000 12.7%
80,000 120,000 40,000 50.0%
5,004,449 3,621,293 (1,383,156) ‐27.6%
113,506,668 113,621,374 114,706 0.1%
Expenses
Personnel 82,178,649 81,154,079 (1,024,570) ‐1.2%
2,549,825 2,547,965 (1,860) ‐0.1%
Supplies & Services 6,001,138 5,755,650 (245,488) ‐4.1%
Shared Services 12,298,049 12,318,957 20,908 0.2%
Travel 1,186,423 1,068,763 (117,660) ‐9.9%
365,990 363,834 (2,156) ‐0.6%
Maintenance & Alterations 1,839,452 1,861,443 21,991 1.2%
812,693 705,001 (107,692) ‐13.3%
6,235,204 6,502,555 267,351 4.3%
6,124,354 5,562,177 (562,177) ‐9.2%
119,591,777 117,840,424 (1,751,353) ‐1.5%
Operating Increase (Decrease) (6,085,109)$ (4,219,050)$ 1,866,059$ ‐30.7%
Modified Cash Flow
(6,085,109)$ (4,219,050)$ 1,866,059$ ‐30.7%
6,235,204 6,502,555 267,351 4.3%
(1,797,056) (1,823,056) (26,000) 1.4%
‐ ‐ ‐ ‐%
(2,118,907) (1,653,895) 465,012 ‐21.9%
Net Change Before Other Adjustments & Transfers (3,765,868) (1,193,446) 2,572,422
Transfer from/(to) Administrative Savings Rsrv ‐ ‐ ‐
Transfer from/(to) Budget Stabilization 275,320 ‐ (275,320)
(3,490,548) (1,193,446) 2,297,102
Other Strategic Transfers from/(to) Reserves 3,490,548 693,446 (2,797,102)
Net Change in Cash & Reserve Transfers ‐$ (500,000)$ (500,000)$
Net Student Charges Revenue
Revenues
Tuition & Fee Revenue
Dining & Residence Revenue
Tuition Waivers/Scholarships
Depreciation
State Appropriation
Indirect Cost Recovery
Investment Income/Gifts
Sales/Services/Auxiliary
Total Revenue
Fuel & Electricity
Memberships, Contributions & Sponsorships
Interest
Other Expenses & Transfers
Total Operating Expenses & Transfers
Operating Increase (Decrease)
Add Back Depreciation
Less Capital Expenditures
Less Capital Reserve Funding
Less Debt Service Principal
Net Change Subtotal
2.2
Finance, Facilities, Technology Committee Meeting - FY2019 Proposed Operating & Capital Budget & Student Charges – 2nd reading
85

ReportID: STATS3FB University of Southern Maine
Scope Name: ALLBUUROPS FY19 PROPOSED BUDGET
Layout Name: MW_STATS3_FUTBUD_BOT19version Unrestricted Auxiliary
FY18 BASE FY19 BASE CHANGE
1,240,000$ 1,227,714$ (12,286)$ ‐1.0%
10,376,800 11,036,100 659,300 6.4%
(313,200) (345,800) (32,600) 10.4%
11,303,600 11,918,014 614,414 5.4%
‐ ‐ ‐ ‐%
‐ ‐ ‐ ‐%
‐ ‐ ‐ ‐%
2,566,264 2,433,951 (132,313) ‐5.2%
13,869,864 14,351,965 482,101 3.5%
Expenses
Personnel 2,132,138 2,272,231 140,093 6.6%
1,036,364 46,606 (989,758) ‐95.5%
Supplies & Services 5,079,080 5,264,949 185,869 3.7%
Shared Services ‐ ‐ ‐ ‐%
Travel 6,600 15,100 8,500 128.8%
500 3,100 2,600 520.0%
Maintenance & Alterations 600,866 173,650 (427,216) ‐71.1%
1,173,416 1,096,513 (76,903) ‐6.6%
1,044,758 1,117,016 72,258 6.9%
2,095,077 3,803,216 1,708,139 81.5%
13,168,799 13,792,381 623,582 4.7%
Operating Increase (Decrease) 701,065$ 559,584$ (141,481)$ ‐20.2%
Modified Cash Flow
701,065$ 559,584$ (141,481)$ ‐20.2%
1,044,758 1,117,016 72,258 6.9%
(22,850) ‐ 22,850 ‐100.0%
‐ ‐ ‐ ‐%
(1,604,055) (1,676,600) (72,545) 4.5%
Net Change Before Other Adjustments & Transfers 118,918 ‐ (118,918)
Transfer from/(to) Administrative Savings Rsrv ‐ ‐ ‐
Transfer from/(to) Budget Stabilization ‐ ‐ ‐
118,918 ‐ (118,918)
Other Strategic Transfers from/(to) Reserves ‐ ‐ ‐
Net Change in Cash & Reserve Transfers 118,918$ ‐$ (118,918)$
Net Student Charges Revenue
Revenues
Tuition & Fee Revenue
Dining & Residence Revenue
Tuition Waivers/Scholarships
Depreciation
State Appropriation
Indirect Cost Recovery
Investment Income/Gifts
Sales/Services/Auxiliary
Total Revenue
Fuel & Electricity
Memberships, Contributions & Sponsorships
Interest
Other Expenses & Transfers
Total Operating Expenses & Transfers
Operating Increase (Decrease)
Add Back Depreciation
Less Capital Expenditures
Less Capital Reserve Funding
Less Debt Service Principal
Net Change Subtotal
2.2
Finance, Facilities, Technology Committee Meeting - FY2019 Proposed Operating & Capital Budget & Student Charges – 2nd reading
86

ReportID: STATS3FB University of Southern Maine
Scope Name: 06USM&LAW FY19 PROPOSED BUDGET
Layout Name: MW_STATS3_FUTBUD_BOT19versionUnrestricted E&G and Auxiliary
Fiscal Year: 2019 Excludes Law School
FY18 BASE FY19 BASE CHANGE
69,261,127$ 71,407,949$ 2,146,822$ 3.1%
10,376,800 11,036,100 659,300 6.4%
(15,786,897) (16,333,774) (546,877) 3.5%
63,851,030 66,110,275 2,259,245 3.5%
47,783,008 47,719,740 (63,268) ‐0.1%
3,105,000 3,500,000 395,000 12.7%
80,000 120,000 40,000 50.0%
7,570,713 6,055,244 (1,515,469) ‐20.0%
122,389,751 123,505,259 1,115,508 0.9%
Expenses
Personnel 78,925,613 77,922,112 (1,003,501) ‐1.3%
3,586,189 2,594,571 (991,618) ‐27.7%
Supplies & Services 10,801,328 10,784,309 (17,019) ‐0.2%
Shared Services 12,298,049 12,318,957 20,908 0.2%
Travel 1,110,102 1,048,942 (61,160) ‐5.5%
339,490 340,234 744 0.2%
Maintenance & Alterations 2,432,568 2,031,843 (400,725) ‐16.5%
1,986,109 1,801,514 (184,595) ‐9.3%
7,279,962 7,619,571 339,609 4.7%
8,326,266 9,509,226 1,182,960 14.2%
127,085,676 125,971,279 (1,114,397) ‐0.9%
Operating Increase (Decrease) (4,695,925)$ (2,466,020)$ 2,229,905$ ‐47.5%
Modified Cash Flow
(4,695,925)$ (2,466,020)$ 2,229,905$ ‐47.5%
7,279,962 7,619,571 339,609 4.7%
(1,819,906) (1,823,056) (3,150) 0.2%
‐ ‐ ‐ ‐%
(3,722,962) (3,330,495) 392,467 ‐10.5%
Net Change Before Other Adjustments & Transfers (2,958,831) (0) 2,958,831
Transfer from/(to) Administrative Savings Rsrv ‐ ‐ ‐
Transfer from/(to) Budget Stabilization ‐ ‐ ‐
(2,958,831) (0) 2,958,831
Other Strategic Transfers from/(to) Reserves 3,215,228 ‐ (3,215,228)
Net Change in Cash & Reserve Transfers 256,397$ (0)$ (256,397)$
Less Capital Reserve Funding
Less Debt Service Principal
Net Change Subtotal
Total Operating Expenses & Transfers
Operating Increase (Decrease)
Add Back Depreciation
Less Capital Expenditures
Memberships, Contributions & Sponsorships
Interest
Depreciation
Other Expenses & Transfers
Sales/Services/Auxiliary
Total Revenue
Fuel & Electricity
Net Student Charges Revenue
State Appropriation
Indirect Cost Recovery
Investment Income/Gifts
Revenues
Tuition & Fee Revenue
Dining & Residence Revenue
Tuition Waivers/Scholarships
2.2
Finance, Facilities, Technology Committee Meeting - FY2019 Proposed Operating & Capital Budget & Student Charges – 2nd reading
87

ReportID: STATS3FB University of Southern Maine
Scope Name: ALLBUUROPS FY19 PROPOSED BUDGET
Layout Name: MW_STATS3_FUTBUD_BOT19versionUnrestricted E&G and Auxiliary
FY18 BASE FY19 BASE CHANGE
75,547,908$ 77,776,029$ 2,228,121$ 2.9%
10,376,800 11,036,100 659,300 6.4%
(17,086,897) (18,233,774) (1,146,877) 6.7%
68,837,811 70,578,355 1,740,544 2.5%
47,783,008 47,719,740 (63,268) ‐0.1%
3,105,000 3,500,000 395,000 12.7%
80,000 120,000 40,000 50.0%
7,570,713 6,055,244 (1,515,469) ‐20.0%
127,376,532 127,973,339 596,807 0.5%
Expenses
Personnel 84,310,787 83,426,310 (884,477) ‐1.0%
3,586,189 2,594,571 (991,618) ‐27.7%
Supplies & Services 11,080,218 11,020,599 (59,619) ‐0.5%
Shared Services 12,298,049 12,318,957 20,908 0.2%
Travel 1,193,023 1,083,863 (109,160) ‐9.1%
366,490 366,934 444 0.1%
Maintenance & Alterations 2,440,318 2,035,093 (405,225) ‐16.6%
1,986,109 1,801,514 (184,595) ‐9.3%
7,279,962 7,619,571 339,609 4.7%
8,219,431 9,365,393 1,145,962 13.9%
132,760,576 131,632,805 (1,127,771) ‐0.8%
Operating Increase (Decrease) (5,384,044)$ (3,659,466)$ 1,724,578$ ‐32.0%
Modified Cash Flow
(5,384,044)$ (3,659,466)$ 1,724,578$ ‐32.0%
7,279,962 7,619,571 339,609 4.7%
(1,819,906) (1,823,056) (3,150) 0.2%
‐ ‐ ‐ ‐%
(3,722,962) (3,330,495) 392,467 ‐10.5%
Net Change Before Other Adjustments & Transfers (3,646,950) (1,193,446) 2,453,504
Transfer from/(to) Administrative Savings Rsrv ‐ ‐ ‐
Transfer from/(to) Budget Stabilization 275,320 ‐ (275,320)
(3,371,630) (1,193,446) 2,178,184
Other Strategic Transfers from/(to) Reserves 3,490,548 693,446 (2,797,102)
Net Change in Cash & Reserve Transfers 118,918$ (500,000)$ (618,918)$
Net Student Charges Revenue
Revenues
Tuition & Fee Revenue
Dining & Residence Revenue
Tuition Waivers/Scholarships
Depreciation
State Appropriation
Indirect Cost Recovery
Investment Income/Gifts
Sales/Services/Auxiliary
Total Revenue
Fuel & Electricity
Memberships, Contributions & Sponsorships
Interest
Other Expenses & Transfers
Total Operating Expenses & Transfers
Operating Increase (Decrease)
Add Back Depreciation
Less Capital Expenditures
Less Capital Reserve Funding
Less Debt Service Principal
Net Change Subtotal
2.2
Finance, Facilities, Technology Committee Meeting - FY2019 Proposed Operating & Capital Budget & Student Charges – 2nd reading
88

E&G AUXILIARY TOTAL
COLLEGE AVE-491-B, PEST MGT 491B College Ave - 4H Science Center 125,000$ -$ VARIOUS PROJECTS Annual Funded Depreciation ######### -TAUNTON BAY MARINE HATCHERY FKA EDA HATCHERY AND BUSINESS INCUBATOR BLDG FKA AQUACULTURE BLDGCCAR-Hatchery Roof Replacement 450,000.00 -VARIOUS BUILDINGS Classroom P&P projects 100,000.00 -HITCHNER HALL Hitchner Lab 263 Renovaiton 50,000.00 -UMAINE CAMPUS Paving Maintenance 150,000.00 -ANDROSCOGGIN HALL Androscoggin Hall Renovation - 270,000BALENTINE HALL Balentine Renovations - 104,989HILLTOP COMMONS Hilltop Commons Flooring - 75,000HILLTOP COMMONS Hilltop Commons Roof - 450,000KNOX HALL Knox Hall Renovation - 130,000WELLS COMMONS Wells Commons Generator - 525,000ALFOND ARENA Alfond Arena FD 48,500.00 -MEMORIAL GYM COMPLEX Memorial Gym FD 140,000.00 -VEHICLES - 486,010 63,032EQUIPMENT - 1,167,000 360,726CAPITAL RESERVE FUNDING - - 1,368,313
5,186,064$ 3,347,060$ 8,533,124$ okay
8,533,124Agrees to nVision Report
E&G AUXILIARY TOTAL
ART/ARCHITECTURE BLDG Art Building Brick Veneer and Panels 25,000$ -$ UMA CAMPUS Augusta Campus Exterior Lighting 10,000 -UMA CAMPUS Augusta Campus Replace interior LED lighting 10,000 -
UMA
FY19 E&G and Auxiliary Operations - Capital Investments
PROJECT DESCRIPTIONFY19 Budget
UMaine
TOTAL
FY19 E&G and Auxiliary Operations - Capital Investments
PROJECT DESCRIPTIONFY19 Budget
2.3
Finance, Facilities, Technology Committee Meeting - FY2019 Proposed Operating & Capital Budget & Student Charges – 2nd reading
89

UMA CAMPUS Bangor Campus Exterior Lighting Replacement 10,000 -UMA CAMPUS Bangor campus interior lighting improvements 15,000 -RANDALL STUDENT TECH CTR Bookstore space in RSC - Repurpose 213,640 -UMA CAMPUS Classroom Equipment Upgrades 75,000 -FINE ARTS BLDG Fine Arts Bldg Roof Replacement 100,000 -BD KATZ LIBRARY Katz Classrooms - Ceiling Replacement 10,000 -BD KATZ LIBRARY Katz Recording Studio Update 35,000 -UMA CAMPUS Main Entrance Signs 20,000 -FITNESS CENTER Repair Gymnasium Floor 20,000 -FITNESS CENTER Replace Bleachers 100,000 -ROBINSON HALL Replace Exterior Doors 60,000 -FITNESS CENTER Replace Underground Utility Lines 65,000 -UMA CAMPUS Sign & Wayfinding Initiative 100,000 -UMA CAMPUS Videoconference Equipment Upgrades 35,000 -RANDALL STUDENT TECH CTR Videoconference Technology Installation - RSTC 40,000EQUIPMENT - 36,679 -
980,319$ -$ 980,319$ okay
980319Agrees to nVision Report
E&G AUXILIARY TOTAL
PURINGTON HALL Purington Hall ADA Code Review -$ 10,000$ VARIOUS PROJECTS Annual Funded Depreciation 884,239 108,290EQUIPMENT - 115,000VEHICLES - 24,700
884,239$ 257,990$ 1,142,229$ OKAY
1142229Agrees to nVision Report
UMF
TOTAL
FY19 E&G and Auxiliary Operations - Capital Investments
PROJECT DESCRIPTIONFY19 Budget
TOTAL
FY19 E&G and Auxiliary Operations - Capital Investments
PROJECT DESCRIPTIONFY19 Budget
2.3
Finance, Facilities, Technology Committee Meeting - FY2019 Proposed Operating & Capital Budget & Student Charges – 2nd reading
90

E&G AUXILIARY TOTAL
NOWLAND HALL Nowland Hall roof replacement 135,000$ -$ UMFK CAMPUS Walkways 65,000 -VEHICLE - 20,000 -
220,000$ -$ 220,000$ OKAY
220000Agrees to nVision Report
E&G AUXILIARY TOTAL
REYNOLDS HEALTH CENTER Nursing Simulation Lab. 6,000$ -$ EQUIPMENT - 500 -
6,500$ -$ 6,500$ OKAY
6500Agrees to nVision Report
E&G AUXILIARY TOTAL
UMPI CAMPUS Campus Access Control 40,976$ -$ UMPI CAMPUS Exterior Lighting Upgrades 40,000 -UMPI CAMPUS Paving Parking Upgrades 50,000 -UMPI CAMPUS Exterior Lighting Upgrades 29,200 -EMERSON HALL Emerson Bathroom Upgrades - 50,000CAPITAL RESERVE FUNDING - 20,724 19,100
180,900$ 69,100$ 250,000$ OKAY
250000Agrees to nVision Report
UMPI
TOTAL
FY19 E&G and Auxiliary Operations - Capital Investments
UMM
TOTAL
FY19 E&G and Auxiliary Operations - Capital Investments
PROJECT DESCRIPTIONFY19 Budget
UMFK
TOTAL
FY19 E&G and Auxiliary Operations - Capital Investments
PROJECT DESCRIPTIONFY19 Budget
PROJECT DESCRIPTION
2.3
Finance, Facilities, Technology Committee Meeting - FY2019 Proposed Operating & Capital Budget & Student Charges – 2nd reading
91

E&G AUXILIARY TOTAL
BAILEY HALL Bailey Hall Fire Alarm and Sprinkler 700,000$ -$ BAILEY HALL Bailey Library Wing Roof Repl 320,000 -BROOKS STUDENT CTR Brooks Fire Alarm Upgrade 45,000 -BROOKS STUDENT CTR Brooks Generator, Transformer, Main Distribution Panel, Transfer Switch348,500 -USM CAMPUS Gorham Underground Util Rep 50,000 -PHILIPPI HALL Philippi Fire Alarm Upgrade 45,000 -USM CAMPUS Portland Underground Util Rep 50,000 -EQUIPMENT - 264,556 -
1,823,056$ -$ 1,823,056$ OKAY
1823056Agrees to nVision Report
E&G AUXILIARY TOTAL
EQUIPMENT - 442,300 -CAPITAL RESERVE FUNDING - 4,387,337 -
4,829,637$ -$ 4,829,637$ OKAY
4829637Agrees to nVision Report
Implementation of IT capital projects (excluding equipment) pending return on investment income
US
TOTAL
USM
TOTAL
FY19 E&G and Auxiliary Operations - Capital Investments
PROJECT DESCRIPTIONFY19 Budget
PROJECT DESCRIPTIONFY19 Budget
2.3
Finance, Facilities, Technology Committee Meeting - FY2019 Proposed Operating & Capital Budget & Student Charges – 2nd reading
92

Annual Report on
May 2, 2018
DRAFT Recommended
STUDENT CHARGES
FY2019
2.4
Finance, Facilities, Technology Committee Meeting - FY2019 Proposed Operating & Capital Budget & Student Charges – 2nd reading
93

HE01(521).doc 4/6/2018
UNIVERSITY OF MAINE SYSTEM
STUDENT CHARGES
FY19
TABLE OF CONTENTS
Total Student Charges ................................................................................................... 1-2
Credit Hour Tuition Rates ............................................................................................ 3-4
Annual Tuition Rates .................................................................................................... 5-6
Annual Mandatory Fees ................................................................................................ 7-8
Annual Tuition and Mandatory Fees ......................................................................... 9-10
Annual Room and Board Charges ..................................................................................11
Annual Comprehensive Student Charges ................................................................ 12-13
Overview of Student Fees ...............................................................................................14
Narrative Description of Mandatory Fees ...................................................................... 15
2.4
Finance, Facilities, Technology Committee Meeting - FY2019 Proposed Operating & Capital Budget & Student Charges – 2nd reading
94

HE01(521).xls 4/6/2018
UNIVERSITY OF MAINE SYSTEM
FY19 TOTAL STUDENT CHARGESTuition & Room
Annual Mandatory Mandatory &I. Undergraduate Tuition Fees Fees1 Board2 Total In-State UM $8,790 $2,380 $11,170 $10,418 $21,588 UMA 6,990 998 7,988 - 7,988 UMF 8,768 898 9,666 9,726 19,392 UMFK 6,990 1,125 8,115 8,120 16,235 UMM 6,990 850 7,840 8,795 16,635 UMPI 6,990 920 7,910 8,406 16,316 USM 8,130 1,010 9,140 9,450 18,590 Average 7,664 1,169 8,833 9,153 17,986
Out-of-State UM $28,590 $2,380 $30,970 $10,418 $41,388 UMA3 16,920 998 17,918 - 17,918 UMF 18,880 898 19,778 9,726 29,504 UMFK 11,190 1,125 12,315 8,120 20,435 UMM 14,250 850 15,100 8,795 23,895 UMPI 11,190 920 12,110 8,406 20,516 USM 21,390 1,010 22,400 9,450 31,850 Average 17,487 1,169 18,656 9,153 27,809
NEBHE UM $14,070 $2,380 $16,450 $10,418 $26,868 UMA 11,190 998 12,188 - 12,188 UMF 14,048 898 14,946 9,726 24,672 UMFK 11,190 1,125 12,315 8,120 20,435 UMM 11,190 850 12,040 8,795 20,835 UMPI 11,190 920 12,110 8,406 20,516 USM 13,020 1,010 14,030 9,450 23,480 Average 12,271 1,169 13,440 9,153 22,593
Canadian UM $14,070 $2,380 $16,450 $10,418 $26,868 UMA 11,190 998 12,188 - 12,188 UMF 14,048 898 14,946 9,726 24,672 UMFK 11,190 1,125 12,315 8,120 20,435 UMM 11,190 850 12,040 8,795 20,835 UMPI 11,190 920 12,110 8,406 20,516 USM 13,020 1,010 14,030 9,450 23,480 Average 12,271 1,169 13,440 9,153 22,593
1Annual tuition & mandatory fees are based on 15 credit hours per semester for two semesters for undergraduate and law students (except UMF based on 16 credit hours per semester beginning in FY07) and 9 credit hours per semester for two semesters for graduate students. 2Rates shown are based on the meal plan and room type with the greatest projected number of students. Several meal plans and room types are available. UMA has no residence or dining halls. 3UMA's out-of-state online annual tuition (at 125% of the in-state rate) is $8,730; mandatory fees $998.
1
2.4
Finance, Facilities, Technology Committee Meeting - FY2019 Proposed Operating & Capital Budget & Student Charges – 2nd reading
95

HE01(521).xls 4/6/2018
FY19 TOTAL STUDENT CHARGESTuition & Room
Annual Mandatory Mandatory &II. Graduate Tuition Fees Fees1 Board2 Subtotal In-State UM $7,902 $1,204 $9,106 $10,418 $19,524 UMF 7,326 350 7,676 9,726 17,402 USM 7,326 540 7,866 9,450 17,316 Average 7,518 698 8,216 9,865 18,081
Out-of-State UM $25,740 $1,204 $26,944 $10,418 $37,362 UMF 10,710 350 11,060 9,726 20,786 USM 19,800 540 20,340 9,450 29,790 Average 18,750 698 19,448 9,865 29,313
NEBHE UM $12,636 $1,204 $13,840 $10,418 $24,258 USM 11,718 540 12,258 9,450 21,708 Average 12,177 872 13,049 9,934 22,983
Canadian UM $12,636 $1,204 $13,840 $10,418 $24,258 USM 11,718 540 12,258 9,450 21,708 Average 12,177 872 13,049 9,934 22,983
III. Law School
In-State $22,290 $1,000 $23,290 $9,450 $32,740
Out-of-State $33,360 $1,000 $34,360 $9,450 $43,810
NEBHE/Canadian $30,420 $1,000 $31,420 $9,450 $40,870
UNIVERSITY OF MAINE SYSTEM
1Annual tuition & mandatory fees are based on 15 credit hours per semester for two semesters for undergraduate and law students (except UMF based on 16 credit hours per semester beginning in FY07) and 9 credit hours per semester for two semesters for graduate students. 2Rates shown are based on the meal plan and room type with the greatest projected number of students. Several meal plans and room types are available. UMA has no residence or dining halls.
2
2.4
Finance, Facilities, Technology Committee Meeting - FY2019 Proposed Operating & Capital Budget & Student Charges – 2nd reading
96
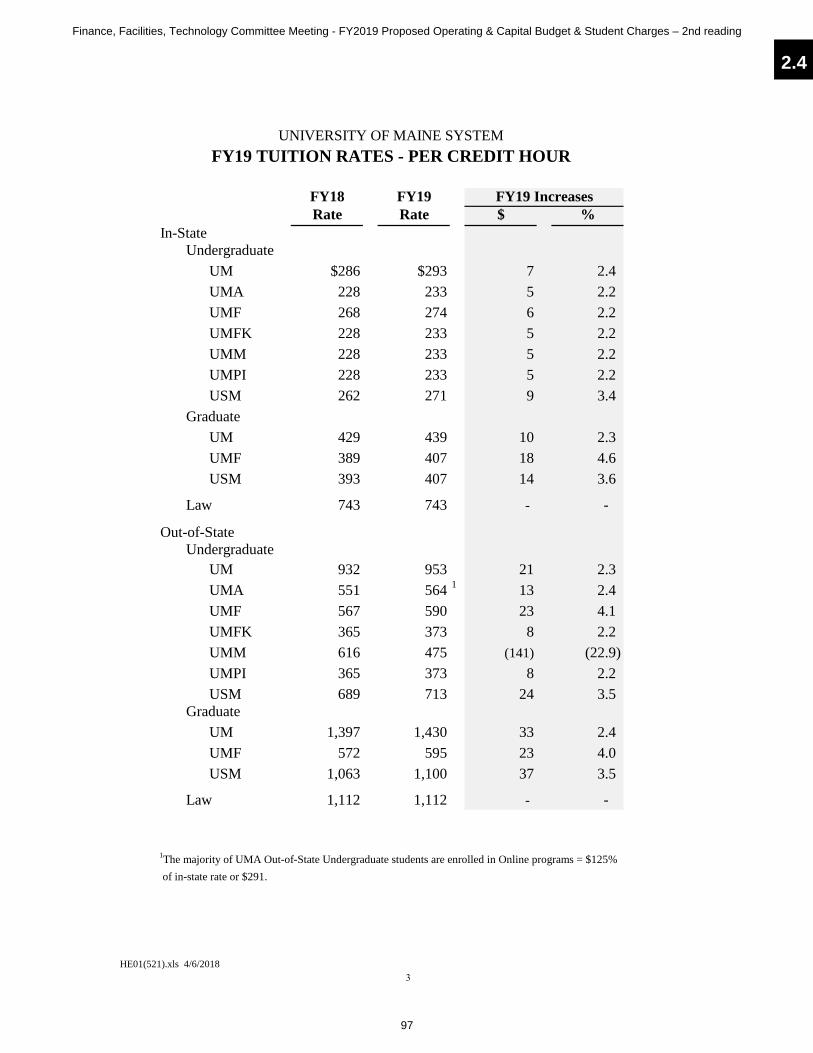
HE01(521).xls 4/6/2018
UNIVERSITY OF MAINE SYSTEMFY19 TUITION RATES - PER CREDIT HOUR
FY18 FY19 FY19 IncreasesRate Rate $ %
In-StateUndergraduate
UM $286 $293 7 2.4 UMA 228 233 5 2.2
UMF 268 274 6 2.2 UMFK 228 233 5 2.2 UMM 228 233 5 2.2 UMPI 228 233 5 2.2 USM 262 271 9 3.4
GraduateUM 429 439 10 2.3 UMF 389 407 18 4.6 USM 393 407 14 3.6
Law 743 743 - -
Out-of-StateUndergraduate
UM 932 953 21 2.3 UMA 551 564 1 13 2.4 UMF 567 590 23 4.1 UMFK 365 373 8 2.2 UMM 616 475 (141) (22.9) UMPI 365 373 8 2.2 USM 689 713 24 3.5
GraduateUM 1,397 1,430 33 2.4 UMF 572 595 23 4.0 USM 1,063 1,100 37 3.5
Law 1,112 1,112 - -
1The majority of UMA Out-of-State Undergraduate students are enrolled in Online programs = $125% of in-state rate or $291.
3
2.4
Finance, Facilities, Technology Committee Meeting - FY2019 Proposed Operating & Capital Budget & Student Charges – 2nd reading
97

HE01(521).xls 4/6/2018
UNIVERSITY OF MAINE SYSTEMFY19 TUITION RATES - PER CREDIT HOUR
FY18 FY19 FY19 IncreasesRate Rate $ %
NEBHEUndergraduate
UM $458 $469 11 2.4UMA 365 373 8 2.2UMF 429 439 10 2.3UMFK 365 373 8 2.2UMM 365 373 8 2.2UMPI 365 373 8 2.2USM 419 434 15 3.6
GraduateUM 686 702 16 2.3USM 629 651 22 3.5
Law 1,014 1,014 - - Canadian
UndergraduateUM 458 469 11 2.4UMA 365 373 8 2.2UMF 429 439 10 2.3UMFK 365 373 8 2.2UMM 372 373 1 0.3UMPI 365 373 8 2.2USM 419 434 15 3.6
GraduateUM 686 702 16 2.3USM 629 651 22 3.5
Law 1,014 1,014 - -
NOTE: In FY18, NEBHE rates are 160% the in-state rate. NEBHE rate can be up to 175% the in-state rate.
4
2.4
Finance, Facilities, Technology Committee Meeting - FY2019 Proposed Operating & Capital Budget & Student Charges – 2nd reading
98

HE01(521).xls 4/6/2018
UNDERGRADUATEIn-State FY15 FY16 FY17 FY18 FY19 $ %
UM $8,370 $8,370 $8,370 $8,580 $8,790 210 2.4 UMA 6,510 6,510 6,510 6,840 6,990 150 2.2 UMF 8,352 8,352 8,352 8,576 8,768 192 2.2 UMFK 6,600 6,600 6,600 6,840 6,990 150 2.2 UMM 6,660 6,660 6,660 6,840 6,990 150 2.2 UMPI 6,600 6,600 6,600 6,840 6,990 150 2.2 USM 7,590 7,590 7,590 7,860 8,130 270 3.4 Average 7,240 7,240 7,240 7,482 7,664 182 2.4
Out-of-StateUM $26,250 $26,640 $27,240 $27,960 $28,590 630 2.3 UMA 15,750 15,750 16,110 16,530 16,920 390 2.4 UMF 17,440 17,440 17,440 18,144 18,880 736 4.1 UMFK 9,900 9,900 10,230 10,950 11,190 240 2.2 UMM 18,480 18,480 18,480 18,480 14,250 (4,230) (22.9) UMPI 9,900 9,900 10,230 10,950 11,190 240 2.2 USM 19,950 19,950 19,950 20,670 21,390 720 3.5 Average 16,810 16,866 17,097 17,669 17,487 (182) (1.0)
NEBHEUM $12,570 $12,570 $12,960 $13,740 $14,070 330 2.4 UMA 9,750 9,750 10,080 10,950 11,190 240 2.2 UMF 12,544 12,544 12,960 13,728 14,048 320 2.3 UMFK 9,900 9,900 10,230 10,950 11,190 240 2.2 UMM 9,990 9,990 10,320 10,950 11,190 240 2.2 UMPI 9,900 9,900 10,230 10,950 11,190 240 2.2 USM 11,400 11,400 11,760 12,570 13,020 450 3.6 Average 10,865 10,865 11,220 11,977 12,271 294 2.5
CanadianUM $12,570 $12,570 $12,960 $13,740 $14,070 330 2.4 UMA 9,750 9,750 10,080 10,950 11,190 240 2.2 UMF 12,544 12,544 12,960 13,728 14,048 320 2.3 UMFK 9,900 9,900 10,230 10,950 11,190 240 2.2 UMM 10,530 10,530 10,530 11,160 11,190 30 0.3 UMPI 9,900 9,900 10,230 10,950 11,190 240 2.2 USM 11,400 11,400 11,760 12,570 13,020 450 3.6 Average 10,942 10,942 11,250 12,007 12,271 264 2.2
NOTE: Based on 15 credit hours per semester for two semesters for undergraduate and law students (except UMF based on 16 credit hours per semester beginning in FY07 & UMFK based on "Block" rate for 12-18 credit hours per semester in FY13 -FY17) and 9 credit hours per semester for two semesters for graduate students.
UNIVERSITY OF MAINE SYSTEMANNUAL TUITION RATES
FY18 to FY19Annual Increase
5
2.4
Finance, Facilities, Technology Committee Meeting - FY2019 Proposed Operating & Capital Budget & Student Charges – 2nd reading
99

HE01(521).xls 4/6/2018
GRADUATE In-State FY15 FY16 FY17 FY18 FY19 $ %
UM $7,524 $7,524 $7,524 $7,722 $7,902 180 2.3 UMF 6,822 6,822 6,822 7,002 7,326 324 4.6 USM 6,840 6,840 6,840 7,074 7,326 252 3.6 Average 7,062 7,062 7,062 7,266 7,518 252 3.5
Out-of-StateUM $23,580 $23,940 $24,498 $25,146 $25,740 594 2.4 UMF 9,900 9,900 9,900 10,296 10,710 414 4.0 USM 18,468 18,468 18,468 19,134 19,800 666 3.5 Average 17,316 17,436 17,622 18,192 18,750 558 3.1
NEBHEUM $11,286 $11,286 $11,664 $12,348 $12,636 288 2.3 USM 10,260 10,260 10,602 11,322 11,718 396 3.5 Average 10,773 10,773 11,133 11,835 12,177 342 2.9
CanadianUM $11,286 $11,286 $11,664 $12,348 $12,636 288 2.3 USM 10,260 10,260 10,602 11,322 11,718 396 3.5 Average 10,773 10,773 11,133 11,835 12,177 342 2.9
LAWIn-State $22,290 $22,290 $22,290 $22,290 $22,290 - - Out-of-State 33,360 33,360 33,360 33,360 33,360 - - NEBHE/Canadian 30,420 30,420 30,420 30,420 30,420 - -
NOTE: Based on 15 credit hours per semester for two semesters for undergraduate and law students (except UMF based on 16 credit hours per semester beginning in FY07 & UMFK based on "Block" rate for 12-18 credit hours per semester in FY13 -FY17) and 9 credit hours per semester for two semesters for graduate students.
FY18 to FY19Annual Increase
UNIVERSITY OF MAINE SYSTEMANNUAL TUITION RATES
6
2.4
Finance, Facilities, Technology Committee Meeting - FY2019 Proposed Operating & Capital Budget & Student Charges – 2nd reading
100

HE01(521).xls 4/6/2018
UNIVERSITY OF MAINE SYSTEMANNUAL MANDATORY FEES1
University Fee Credit Hours FY18 FY19 $ IncreaseUM Graduate Student Activity Fee 1 or More Credit Hours $80.00 $90.00 10.00
Undergraduate Student Activity Fee 6 or More Credit Hours 106.00 106.00 -
Communications Fee 6 or More Credit Hours 30.00 30.00 -
Recreation Center Fee 0 to 5 Credit Hours 162.00 170.00 8.00 6 or More Credit Hours 270.00 284.00 14.00
Unified Fee 0 to 5 Credit Hours 256.00 262.00 6.00 6 to 11 Credit Hours 782.00 800.00 18.00 12 to 15 Credit Hours 1,916.00 1,960.00 44.00 16 or More Credit Hours 1,966.00 2,012.00 46.00
UMA Student Activity Fee Per Credit Hour, up to 14 $2.25 $2.25 - 15 or More Credit Hours 67.50 67.50 -
Unified Fee Per Credit Hour 30.00 31.00 1.00 Unified Fee - University College Per Credit Hour 13.00 13.00 -
UMF Undergraduate Student Activity Fee 1 to 5 1/2 Credit Hours $80.00 $80.00 - 6 to 11 1/2 Credit Hours 120.00 120.00 - 12 or More Credit Hours 160.00 160.00 -
Student Health & Wellness Fee 4 or More Credit Hours 50.00 50.00 -
Unified Fee 6 or less Credit Hours 172.00 176.00 4.00 7 to 11 Credit Hours 342.00 350.00 8.00 12 or More Credit Hours 672.00 688.00 16.00
UMFK Student Activity Fee Per Credit Hour $7.50 $7.50 -
Unified Fee Per Credit Hour 30.00 30.00 -
UMM Student Activity Fee Per Credit Hour, up to 11 $11.00 $11.00 - 12 or More Credit Hours 240.00 240.00 -
Unified Fee Flat Fee + Per Credit Hour 596.00 610.00 14.00
UMPI Student Activity Fee 6 or less Credit Hours $85.00 $85.00 - 7 or More Credit Hours 170.00 170.00 -
Unified Fee - Campus Per Credit Hour 25.00 25.00 - Unified Fee - Outreach Per Credit Hour 20.00 20.00 -
USM Undergraduate Student Activity Fee 1 to 5 Credit Hours $38.00 $38.00 - 6 to 11 Credit Hours 74.00 74.00 - 12 or More Credit Hours 110.00 110.00 -
Law Student Activity Fee 6 or More Credit Hours 100.00 100.00 -
Unified Fee Per Credit Hour 29.00 30.00 1.00 ________________________________1Annual unless listed as per credit hour.
7
2.4
Finance, Facilities, Technology Committee Meeting - FY2019 Proposed Operating & Capital Budget & Student Charges – 2nd reading
101

HE01(521).xls 4/6/2018
Undergraduate FY15 FY16 FY17 FY18 FY19 $ %
UM Communications $30 $30 $30 $30 $30Recreation Center Fee 248 252 270 270 284Unified Fee 1,868 1,868 1,868 1,916 1,960Student Activity 90 90 90 106 106 Total $2,236 $2,240 $2,258 $2,322 $2,380 58 2.5
UMA Unified Fee $870 $870 $870 $900 $930Student Activity 68 68 68 68 68 Total $938 $938 $938 $968 $998 30 3.1
UMF Student Health & Fitness Fee $50 $50 $50 $50 $50Unified Fee 655 655 655 672 688Student Activity 160 160 160 160 160 Total $865 $865 $865 $882 $898 16 1.8
UMFK Unified Fee $750 $750 $750 $900 $900Student Activity 225 225 225 225 225 Total $975 $975 $975 $1,125 $1,125 - -
UMM Unified Fee $580 $580 $580 $596 $610Student Activity 240 240 240 240 240 Total $820 $820 $820 $836 $850 14 1.7
UMPI Unified Fee $540 $540 $540 $750 $750Student Activity 160 160 160 170 170 Total $700 $700 $700 $920 $920 - -
USM Unified Fee $840 $840 $840 $870 $900Student Activity 110 110 110 110 110 Total $950 $950 $950 $980 $1,010 30 3.1
Average $1,069 $1,070 $1,072 $1,148 $1,169 21 1.8Graduate
UM Communications $30 $30 $30 $30 $30Recreation Center Fee 248 252 270 270 284Unified Fee 762 762 762 782 800Student Activity 80 80 80 80 90 Total $1,120 $1,124 $1,142 $1,162 $1,204 42 3.6
UMF Unified Fee $333 $333 $333 $342 $350 8 2.3
USM Unified Fee $504 $504 $504 $522 $540 18 3.4
Average $652 $654 $660 $675 $698 23 3.4Law
USM Unified Fee $840 $840 $840 $870 $900Student Activity 100 100 100 100 100
Average $940 $940 $940 $970 $1,000 30 3.1
NOTE: Based on 15 credit hours per semester for two semesters for undergraduate and law students (except UMF based on 16 credit hours per semester beginning inFY07 & UMFK based on "Block" rate for 12-18 credit hours per semester in FY13 - FY17) and 9 credit hours per semester for two semesters for graduate students.
FY19 Increases
UNIVERSITY OF MAINE SYSTEM
ANNUAL MANDATORY FEES
8
2.4
Finance, Facilities, Technology Committee Meeting - FY2019 Proposed Operating & Capital Budget & Student Charges – 2nd reading
102

HE01(521).xls 4/6/2018
UNDERGRADUATE FY18 FY19In-State Rate Rate $ %
UM $10,902 $11,170 268 2.5 UMA 7,808 7,988 180 2.3 UMF 9,458 9,666 208 2.2 UMFK 7,965 8,115 150 1.9 UMM 7,676 7,840 164 2.1 UMPI 7,760 7,910 150 1.9 USM 8,840 9,140 300 3.4 Average 8,630 8,833 203 2.4
Out-of-StateUM $30,282 $30,970 688 2.3 UMA 17,498 17,918 420 2.4 UMF 19,026 19,778 752 4.0 UMFK 12,075 12,315 240 2.0 UMM 19,316 15,100 (4,216) (21.8) UMPI 11,870 12,110 240 2.0 USM 21,650 22,400 750 3.5 Average 18,817 18,656 (161) (0.9)
NEBHEUM $16,062 $16,450 388 2.4 UMA 11,918 12,188 270 2.3 UMF 14,610 14,946 336 2.3 UMFK 12,075 12,315 240 2.0 UMM 11,786 12,040 254 2.2 UMPI 11,870 12,110 240 2.0 USM 13,550 14,030 480 3.5 Average 13,124 13,440 316 2.4
Canadian UM $16,062 $16,450 388 2.4 UMA 11,918 12,188 270 2.3 UMF 14,610 14,946 336 2.3 UMFK 12,075 12,315 240 2.0 UMM 11,996 12,040 44 0.4 UMPI 11,870 12,110 240 2.0 USM 13,550 14,030 480 3.5 Average 13,154 13,440 286 2.2
UNIVERSITY OF MAINE SYSTEM
ANNUAL TUITION AND MANDATORY FEES
FY19 Increases
9
2.4
Finance, Facilities, Technology Committee Meeting - FY2019 Proposed Operating & Capital Budget & Student Charges – 2nd reading
103

HE01(521).xls 4/6/2018
GRADUATE FY18 FY19In-State Rate Rate $ %
UM $8,884 $9,106 222 2.5 UMF 7,344 7,676 332 4.5 USM 7,596 7,866 270 3.6 Average 7,941 8,216 275 3.5
Out-of-StateUM $26,308 $26,944 636 2.4 UMF 10,638 11,060 422 4.0 USM 19,656 20,340 684 3.5 Average 18,867 19,448 581 3.1
NEBHEUM $13,510 $13,840 330 2.4 USM 11,844 12,258 414 3.5 Average 12,677 13,049 372 2.9
CanadianUM $13,510 $13,840 330 2.4 USM 11,844 12,258 414 3.5 Average 12,677 13,049 372 2.9
LAWIn-State $23,260 $23,290 30 0.1 Out-of-State 34,330 34,360 30 0.1 NEBHE/Canadian 31,390 31,420 30 0.1
FY19 Increases
UNIVERSITY OF MAINE SYSTEM
ANNUAL TUITION AND MANDATORY FEES
10
2.4
Finance, Facilities, Technology Committee Meeting - FY2019 Proposed Operating & Capital Budget & Student Charges – 2nd reading
104

HE01(521).xls 4/6/2018
FY15 FY16 FY17 FY18 FY19 $ %UM $4,858 $5,004 $5,154 $5,270 $5,396 126 2.4 UMF 4,750 4,750 4,892 5,038 5,280 242 4.8 UMFK 4,150 4,250 4,250 4,250 4,250 - - UMM 4,160 4,326 4,326 4,326 4,460 134 3.1 UMPI 4,400 4,488 4,588 2 4,708 4,850 142 3.0 USM 4,700 4,900 5,000 5,000 5,000 - - Average 4,503 4,620 4,702 2 4,765 4,873 108 2.3
FY15 FY16 FY17 FY18 FY19UM $4,438 $4,571 $4,710 $4,875 $5,022 147 3.0 UMF 4,220 4,220 4,220 4,296 4,446 150 3.5 UMFK 3,570 3,660 3,660 3,660 3,870 210 5.7 UMM 4,018 4,160 4,160 4,160 4,335 175 4.2 UMPI 3,456 3,356 2 3,356 3,556 2 3,556 - - USM 4,450 4,500 4,200 4,200 4,450 250 6.0 Average 4,025 4,078 2 4,051 4,125 4,280 155 3.8
FY15 FY16 FY17 FY18 FY19UM $9,296 $9,575 $9,864 $10,145 $10,418 273 2.7 UMF 8,970 8,970 9,112 9,334 9,726 392 4.2 UMFK 7,720 7,910 7,910 7,910 8,120 210 2.7 UMM 8,178 8,486 8,486 8,486 8,795 309 3.6 UMPI 7,856 7,844 7,944 8,264 8,406 142 1.7 USM 9,150 9,400 9,200 9,200 9,450 250 2.7 Average 8,528 8,698 8,753 8,890 9,153 263 3.0
1Rates shown are based on the meal plan and room type with the greatest projected number of students. Several meal plans and room types are available. UMA has no residence or dining halls.2UMPI's FY16 board rate, FY17 room rate and FY18 board rate restated.
BOARD CHARGES
TOTAL ROOM & BOARD CHARGES
UNIVERSITY OF MAINE SYSTEMANNUAL ROOM & BOARD CHARGES1
FY19 IncreasesROOM CHARGES
11
2.4
Finance, Facilities, Technology Committee Meeting - FY2019 Proposed Operating & Capital Budget & Student Charges – 2nd reading
105

HE01(521).xls 4/6/2018
UNDERGRADUATE FY18 FY19In-State Rate Rate $ %
UM $21,047 $21,588 541 2.6 UMA 7,808 7,988 180 2.3 UMF 18,792 19,392 600 3.2 UMFK 15,875 16,235 360 2.3 UMM 16,162 16,635 473 2.9 UMPI 16,024 16,316 292 1.8 USM 18,040 18,590 550 3.0 Average 17,520 17,986 466 2.7
Out-of-StateUM $40,427 $41,388 961 2.4 UMA 17,498 17,918 420 2.4 UMF 28,360 29,504 1,144 4.0 UMFK 19,985 20,435 450 2.3 UMM 27,802 23,895 (3,907) (14.1) UMPI 20,134 20,516 382 1.9 USM 30,850 31,850 1,000 3.2 Average 27,707 27,809 102 0.4
NEBHEUM $26,207 $26,868 661 2.5 UMA 11,918 12,188 270 2.3 UMF 23,944 24,672 728 3.0 UMFK 19,985 20,435 450 2.3 UMM 20,272 20,835 563 2.8 UMPI 20,134 20,516 382 1.9 USM 22,750 23,480 730 3.2 Average 22,015 22,593 578 2.6
Canadian UM $26,207 $26,868 661 2.5 UMA 11,918 12,188 270 2.3 UMF 23,944 24,672 728 3.0 UMFK 19,985 20,435 450 2.3 UMM 20,482 20,835 353 1.7 UMPI 20,134 20,516 382 1.9 USM 22,750 23,480 730 3.2 Average 22,045 22,593 548 2.5
NOTE: Tuition and Fees based on 15 credit hours per semester for two semesters for undergraduate and law students (except UMF based on 16 credit hours per semester beginning in FY07 & UMFK based on "Block" rates for 12-18 hours per semester in FY13 - FY17) and 9 credit hours per semester for two semesters forgraduate students. Room and board rates are based on the meal plan and room type with the greatest projectednumber of students. Several meal plans and room types are available. UMA has no residence or dining halls. The majority of UMA Out-of-State Undergraduate students are enrolled in Online programs = $125%of in-state rate or $291 in FY18.UMPI's FY18 board rate restated.
UNIVERSITY OF MAINE SYSTEM ANNUAL COMPREHENSIVE STUDENT CHARGES
FY19 Increases
(Includes Tuition, Mandatory Fees, Room and Board)
12
2.4
Finance, Facilities, Technology Committee Meeting - FY2019 Proposed Operating & Capital Budget & Student Charges – 2nd reading
106

HE01(521).xls 4/6/2018
GRADUATE FY18 FY19In-State Rate Rate $ %
UM $19,029 $19,524 495 2.6 UMF 16,678 17,402 724 4.3 USM 16,796 17,316 520 3.1 Average 17,501 18,081 580 3.3
Out-of-StateUM $36,453 $37,362 909 2.5 UMF 19,972 20,786 814 4.1 USM 28,856 29,790 934 3.2 Average 28,427 29,313 886 3.1
NEBHEUM $23,655 $24,258 603 2.5 USM 21,044 21,708 664 3.2 Average 22,350 22,983 633 2.8
CanadianUM $23,655 $24,258 603 2.5 USM 21,044 21,708 664 3.2 Average 22,350 22,983 633 2.8
LAWIn-State $32,460 $32,740 280 0.9 Out-of-State 43,530 43,810 280 0.6 NEBHE/Canadian 40,590 40,870 280 0.7
NOTE: Tuition and Fees based on 15 credit hours per semester for two semesters for undergraduate and law students (except UMF based on 16 credit hours per semester beginning in FY07 & UMFK based on "Block" rates for 12-18 hours per semester in FY13 - FY17) and 9 credit hours per semester for two semesters forgraduate students. Room and board rates are based on the meal plan and room type with the greatest projectednumber of students. Several meal plans and room types are available. UMA has no residence or dining halls. The majority of UMA Out-of-State Undergraduate students are enrolled in Online programs = $125%of in-state rate or $285 in FY18.UMPI's FY18 board rate restated.
(Includes Tuition, Mandatory Fees, Room and Board)
FY19 Increases
UNIVERSITY OF MAINE SYSTEM ANNUAL COMPREHENSIVE STUDENT CHARGES
13
2.4
Finance, Facilities, Technology Committee Meeting - FY2019 Proposed Operating & Capital Budget & Student Charges – 2nd reading
107

HE01(521).doc 4/6/2018
UNIVERSITY OF MAINE SYSTEM STUDENT FEES
OVERVIEW
The procedures for establishing student fees throughout the University of Maine System are contained in the Board of Trustees Policy Manual in Section 703 and 704 as follows:
The BOARD OF TRUSTEES will establish those fees that are analogous to tuition, i.e., those that must be paid by all students as a condition of attendance. In addition, changes to the amount of the Student Activity Fee shall be requested by the recognized student governing body at each University and authorized after (a) a referendum approved by the student body, (b) approval of the President and, (c) approval of the Chancellor for presentation and approval by the Board of Trustees. Board approved fees include the Student Activity Fee, the Communications Fee, the Unified Fee, the Recreation Fee and the Student Health & Wellness Fee. The CHANCELLOR will establish those fees impacting services and operations within the System. These include maximum levels for financial service fees (non-negotiable check fees) and fees principally affecting prospective students, such as application fees. The UNIVERSITY PRESIDENTS are responsible to the maximum extent possible for establishing most university-specific fees, which include:
- all course fees - all deposits - all fees for optional university services and activities
Fee changes planned for the fall semester should ordinarily be adopted no later than May; those to
become effective in the spring semester should be adopted by November 15. Universities should establish procedures for timely review of and comment on fee changes. The Chancellor should be informed in advance of the formal adoption of any fee changes.
Adjustments to Student Activity Fees will be considered by the Board at its May meeting in order
to allow sufficient time for student governments to conduct spring referendums on any changes recommended to the fees.
14
2.4
Finance, Facilities, Technology Committee Meeting - FY2019 Proposed Operating & Capital Budget & Student Charges – 2nd reading
108

HE01(521).doc 4/6/2018
UNIVERSITY OF MAINE SYSTEM NARRATIVE DESCRIPTION OF EACH MANDATORY FEE
University
Name Charging Fee Student Activity Fee ALL This is a student approved mandatory fee that is administered by
the students for educational, cultural, social, and recreational purposes. Changes to this fee require the approval of the student body, University President, Chancellor, and Board of Trustees.
Communications Fee UM A student approved mandatory fee that is administered by the
students to support WMEB-FM, the Maine Channel, “The Maine Campus”, and ASAP, a media and internet technologies laboratory.
Unified Fee ALL
This fee is used to cover fixed costs of providing educational services that may not be directly related to the number of credit hours for which a student is enrolled. This fee supports activities such as student services, the operation of facilities such as student and fitness centers, and student-utilized, instruction-related technologies.
Recreation Center Fee UM
This fee is assessed to pay for the construction of the Center and provides students with access to the state-of-the-art facility, including a leisure pool and sauna. Many aerobic classes and other programs and services are also provided for no additional fee.
Student Health & Wellness Fee UMF This fee is charged to students registered for 4 or more credit hours of classes held at UMF. It covers all health center office visits, counseling and fees associated with Mainely Outdoors.
15
2.4
Finance, Facilities, Technology Committee Meeting - FY2019 Proposed Operating & Capital Budget & Student Charges – 2nd reading
109

4/25/2018
AGENDA ITEM SUMMARY
1. NAME OF ITEM: Lease Request, UM
2. INITIATED BY: Karl W. Turner, Chair
3. BOARD INFORMATION: BOARD ACTION: X
4. OUTCOME: BOARD POLICY:Improve student success and completion 802 – Disposition of Real Property
or University as Lessor of Real Prop.
5. BACKGROUND:
The University of Maine System acting through the University of Maine (UM) requests authorization to amend a ground lease with the Maine Alpha Alumni Corporation of Sigma Phi Epsilon (Fraternity). The original lease began September 19, 1968. The amendment will extend the lease for an additional fifty (50) years.
This request is pursuant to Board Policy 802, Disposition of Real Property, which requires Board approval for leases exceeding ten years or $500,000. In this case, the requirement is in regards to the duration and approval by the full Board is required.
The ground lease consists of 2.02 acres in the Town of Orono, Maine. The proposed terms of the lease include a fifty (50) year renewal beginning on the date of execution of the agreement with options for renewal as agreed by both parties. The current renewal would continue to include an annual rent of $1.
The land is being used for the purposes of operating a University recognized fraternity house. The structure located on the land is owned by the Fraternity and subject to the terms of the lease with the University.
6. TEXT OF PROPOSED RESOLUTION:
That the Finance, Facilities and Technology Committee forward this item to the Consent Agenda at the May 20-21, 2018, Board of Trustees meeting for approval of the following resolution:
That the Board of Trustees approves the recommendation of the Finance, Facilities, Technology Committee to authorize the University of Maine System acting through the University of Maine to amend the lease with the Maine Alpha Alumni Corporation of Sigma Phi Epsilon for land located in the town of Orono,
3
Finance, Facilities, Technology Committee Meeting - Lease Request (Sigma Phi Epsilon), UM
110

4/25/2018
Maine, subject to review and approval of all final terms and conditions by the University of Maine System Treasurer and General Counsel.
3
Finance, Facilities, Technology Committee Meeting - Lease Request (Sigma Phi Epsilon), UM
111

4/25/2018
AGENDA ITEM SUMMARY
1. NAME OF ITEM: Lease Request, UM
2. INITIATED BY: Karl W. Turner, Chair
3. BOARD INFORMATION: BOARD ACTION: X
4. OUTCOME: BOARD POLICY:Support Maine through research 802 – Disposition of Real Propertyand economic development or University as Lessor of Real Prop.
5. BACKGROUND:
The University of Maine System acting through the University of Maine (UM) requests authorization to amend a land lease with the USDA (Government). The original lease began July 1, 1968 and was amended four times to increase the amount of leased land. The current amendment extends the terms of the existing lease for two optional ten year renewal periods to be exercised at the option of the Government beyond the current termination date of June 30, 2018.
This request is pursuant to Board Policy 802, Disposition of Real Property, which requires Board approval for leases exceeding ten years or $500,000. In this case the requirement is in regards to the duration and approval by the full Board is required.
The land lease consists of a total of 1.71 acres in the Town of Orono, Maine and 0.872 acres in the Town of Presque Isle, Maine. The proposed terms of the lease include two additional ten year renewal options beginning at the termination of the current lease on June 30, 2018 and with no further consideration required.
The land is being used by the United States Department of Agriculture, Agriculture Research Service to house a soil and water research facility in Orono, and for a soil and water research and storage facility in Presque Isle. When the original lease began fifty years ago, the University did not complete an appraisal of the land, nor has one been done since, thus no information regarding the value of the land is available.
6. TEXT OF PROPOSED RESOLUTION:
That the Finance, Facilities and Technology Committee forward this item to the Consent Agenda at the May 20-21, 2018, Board of Trustees meeting for approval of the following resolution:
That the Board of Trustees approves the recommendation of the Finance, Facilities, Technology Committee to authorize the University of Maine System acting through the University of Maine to amend the lease with the Government for land located in the towns of Orono and Presque Isle, Maine, subject to review
4
Finance, Facilities, Technology Committee Meeting - Lease Request (USDA), UM
112

4/25/2018
and approval of all final terms and conditions by the University of Maine System Treasurer and General Counsel.
4
Finance, Facilities, Technology Committee Meeting - Lease Request (USDA), UM
113
4/25/2018
AGENDA ITEM SUMMARY
1. NAME OF ITEM: Full Design, Engineering Education and Design Center, UM
2. INITIATED BY: Karl W. Turner, Chair
3. BOARD INFORMATION: BOARD ACTION: X
4. OUTCOME: BOARD POLICY:Improve Student Success & Completion 701 – Budgets-Operating & Capital
5. BACKGROUND:
The University of Maine System acting through the University of Maine requests authorization to expend up to an additional $8 million to perform full design, initial relocation and related services for the Engineering Education and Design Center (EEDC) on the Orono campus of the University of Maine.
This request is pursuant to Board Policy 701, requiring Trustee approval for increases to Board approved projects. In this case, the request is to approve and to forward this matter to the consent agenda of the Board of Trustees. Trustees approved a preliminary $1 million for early design of the project in September of 2017. The AIS is attached for reference.
Estimates continue to indicate the project may cost up to $80 million. The project cost is expected to be funded largely by University revenue bonds supported with State debt-service funding approved by the Legislature in late 2017, by privately raised funds and other potential resources as may be identified by the University of Maine Chief Business Officer and University System Treasurer. Through fundraising, over $10 million has been raised toward this project and efforts continue in earnest. This current request is for approval to expend the amount necessary to complete formal design, bid preparation and related work.
Since the prior approval in September 2017, the building committee was formed, the project design team was selected and commenced Conceptual design along with a Site selection process. These phases of the design came to a conclusion in April, 2018 with a final site location at the site of the current Machine Tool Laboratory, and with a conceptual design of an approximately 110,000 square foot building, within the $80 million budget.
The funding for this phase of the work will come from resources to be identified by the University Treasurer and University of Maine Chief Business Officer.
5
Finance, Facilities, Technology Committee Meeting - Full Design Engineering Education and Design Center, UM
114

4/25/2018
6. TEXT OF PROPOSED RESOLUTION:
That the Finance, Facilities and Technology Committee forward this item to the Consent Agenda at the May 20-21, 2018, Board of Trustees meeting for approval of the following resolution:
That the Board of Trustees approves the recommendation of the Finance, Facilities, Technology Committee to authorize the expenditure of up to an additional $8 million, bringing the current approved budget to $9 million to complete full design of the Engineering Education and Design Center at the University of Maine with funding to be identified by the University Treasurer.
5
Finance, Facilities, Technology Committee Meeting - Full Design Engineering Education and Design Center, UM
115

8/28/17 – Revised
AGENDA ITEM SUMMARY
1. NAME OF ITEM: Schematic Design Engineering Education and Design
Center, UM 2. INITIATED BY: Norman L. Fournier, Chair 3. BOARD INFORMATION: BOARD ACTION: X 4. OUTCOME: BOARD POLICY: Improve Student Success & Completion 701 – Budgets-Operating & Capital 5. BACKGROUND:
The University of Maine System acting through the University of Maine requests authorization to expend up to a preliminary $1 million to perform Schematic Design and related services for a new building expected to be known as the Engineering Education and Design Center (EEDC) on the Orono campus of the University of Maine. This request is pursuant to Board policy 701, which requires projects with a total cost of more than $500,000 to be considered by the Board of Trustees or its Finance, Facilities and Technology Committee. The request is also pursuant to Trustee policy prohibiting net increases in space without Trustee authorization. In this case, the request is to approve and to forward this matter to the consent agenda of the Board of Trustees. Early estimates indicate the project may cost approximately $80 million. The cost is expected to be funded largely by University revenue bonds, supported with $5 million in annual debt-service funding recently approved by the Legislature (P.L. 2017, c. 284). Other funding sources will include privately raised funds and other potential resources as may be identified by the University of Maine Chief Business Officer and University System Treasurer. This current request is for approval to expend only the amount necessary to begin formal design and bid preparation work. The engineering program at the University of Maine has been growing for the last fifteen years, increasing 71 percent from 2001 to 2015. Employment of engineers in the State has also been growing and the need for engineers is greater than the available supply. In the last two years, the UMaine College of Engineering has needed to restrict enrollment in select programs due to the lack of sufficient facilities and faculty. The new facility will give UMaine the capacity to increase enrollment in engineering to 3,000 students. The current capacity is 2,000 students.
5.1
Finance, Facilities, Technology Committee Meeting - Full Design Engineering Education and Design Center, UM
116

8/28/17 – Revised
The College of Engineering was identified as one of UMaine’s Signature Areas of Excellence in 2014 and since then the new EEDC has increasingly been a focal point for planning in the College of Engineering and UMaine. This project was identified in the campus long-term capital plan. Funding had not been secured prior to FY2018 for this project so it was not included in the FY2018 capital plan. The exact size, design, programming, timeline, operating costs and other details of the new facility remain to be determined. Also, the specific location of the new building on the Orono campus has not been finalized. However, the building will be the center of undergraduate engineering education, so it is essential that it be located in the heart of the engineering district. The particular location of the building will be among the details to be determined as part of the Schematic Design process. The EEDC will be the heart of undergraduate engineering education at the University of Maine. The focal point is expected to be hands-on, team-based laboratories for senior capstone design projects bringing students from multiple engineering disciplines together to collaborate. Moreover, the intent is to have reconfigurable labs to allow use by several engineering departments and flexible classrooms to enable group learning. There will be informal collaboration spaces for students to work together on projects and assignments as well as specialized classrooms for engineering demonstrations and distance learning. The latter will allow select engineering courses originating at UMaine to be used across the System. The new building will likely house the Department of Mechanical Engineering and the bioengineering portion of the Department of Chemical and Biological Engineering allowing them the space needed to expand their programs. These two programs currently occupy space in Boardman and Jenness Halls. The future of the space they vacate will be assessed for re-utilization. The University may use a traditional design/bid/build construction method for this project but so-called alternative delivery methods are permitted under University practices and will be considered. The funding for this phase of the work will come from resources to be identified by the University Treasurer and University of Maine Chief Business Officer.
5. TEXT OF PROPOSED RESOLUTION: That the Finance, Facilities and Technology Committee forward this item to the Consent Agenda at the September 17-18, 2017, Board of Trustees meeting for approval of the following resolution:
That the Board of Trustees authorizes the expenditure of up to $1 million to begin the Schematic Design of the Engineering Education and Design Center at the University of Maine with funding to be identified by the University Treasurer.
5.1
Finance, Facilities, Technology Committee Meeting - Full Design Engineering Education and Design Center, UM
117

4/25/2018
AGENDA ITEM SUMMARY
1. NAME OF ITEM: Naming, Lafayette and Rawcliffe 4-H Science and EngineeringCenter, UM
2. INITIATED BY: Karl W. Turner, Chair
3. BOARD INFORMATION: BOARD ACTION: X
4. OUTCOME: BOARD POLICY:Increase Enrollment 803 Naming of Physical FacilitiesUniversity workforce engagement
5. BACKGROUND:
The University of Maine System acting through the University of Maine requestsauthorization for the naming of a facility pursuant to Board of Trustee Policy 803.
Policy 803 states, in part: “…The naming of any physical facility in the University of Maine System is reserved to the Board of Trustees. Naming of any other campus area or object is reserved to the President of that University……. Facilities may be named for any individual, living or dead, except for current employees or current members of the Board of Trustees. Other acceptable names include, but are not limited to, geographical designations, functions, or University groups…. Recommendations to the Chancellor and Trustees for names of physical facilities shall be made by the President of a University after consultation with such committees as may be established for this purpose……”
The Policy also states that “facilities may be named for, or on the recommendation of, a major contributor to the cost of the facility. A contribution equivalent to at least 25% of the project cost is suggested for a naming gift for a physical facility” and that naming “gifts may also be made when a donor establishes an endowment whose income is adequate to provide at least 75% of expected annual operating costs (utilities, custodial and maintenance).”
In this case, the proposed name as recommended by the President of the University of Maine, Susan J. Hunter, is the Lafayette and Rawcliffe 4-H Science and Engineering Learning Center.
This facility is located at 491 College Avenue. It is currently occupied by the Cooperative Extension, Pest Management Office. The Pest Management Office will be moving to the University of Maine Cooperative Extension Diagnostic and Research Laboratory this spring. The 491 College Avenue facility will then become a 4-H center for youth engagement in areas of STEM education.
4-H is the largest out-of-school educational program in Maine. Partnerships with local schools and University academic programs through 4-H are occurring across our state.
6
Finance, Facilities, Technology Committee Meeting - Naming Lafayette and Rawcliffe 4-H Science Engineering Center, UM
118

4/25/2018
The naming is part of a $125,000 renovation and is in honor of Danny and Carla Lafayetteand on behalf of their donation of $31,500 in this instance and more than $500,000 in the past to the University.
This renovated facility will provide an excellent location to bring K-12 students to the campus to experience hands-on educational activities with a focus on STEM. The center can serve as a launch point for engagement with academic programs that have a K-12 outreach component such as the RISE Center, the College of Engineering and others.
The location of the facility on College Avenue is very close to campus with available parking. The repurposing of this facility renovation will advance the outreach of 4-H and increase access to campus resources and programs for K-12 students and teachers.
Currently, the facility, which is of wood construction and 3,230 gross square feet, has a Sightlines net asset value of 87%. This investment would be expected to improve that NAV. The renovated facility is expected to open in the fall of 2018.
6. TEXT OF PROPOSED RESOLUTION:
That the Finance, Facilities and Technology Committee forward this item to the Consent Agenda at the May 20-21, 2018, Board of Trustees meeting for approval of the following resolution:
That the Board of Trustees approves the recommendation of the Finance, Facilities, Technology Committee to authorize the University of Maine System acting through the University of Maine to authorize the name of the Lafayette and Rawcliffe 4-H Science and Engineering Learning Center.
6
Finance, Facilities, Technology Committee Meeting - Naming Lafayette and Rawcliffe 4-H Science Engineering Center, UM
119

4/25/2018
AGENDA ITEM SUMMARY
1. NAME OF ITEM: Fund Raising & Capital Projects: Conflict of Interest Clarification
2. INITIATED BY: Karl W. Turner, Chair
3. BOARD INFORMATION: X BOARD ACTION:
4. OUTCOME: BOARD POLICY:
5. BACKGROUND:
As a result of recent fund raising activities related to the Capital Project of the UM Engineering Education & Design Center, the University is clarifying the roles of personnel involved in both fund raising and decisions or approvals related to capital projects. The attached record of understanding was agreed to regarding the current project at UM, and procedures and practices related to these activities are being updated to reflect language regarding these items. The formal policy and practice updates are expected to be in place by year end, with temporary measures in place until then.
7
Finance, Facilities, Technology Committee Meeting - Fundraising and Capital Projects – Conflict of Interest Clarification, UM
120

Record of Understanding 3.22.18
1. Scholarships, donations, or gifts to the University, will not be considered in the
evaluation of responses to solicitations, including capital project related solicitations. This is and will be made clear in the solicitations conducted by the University and will likewise be made clear in any gift agreements entered into by the University.
2. University employees involved in fundraising will not participate in the evaluation,
determination or approval of awards or contracts.
3. University employees involved in evaluating responses to solicitations or approval of awards will ensure that they avoid any involvement with fundraising of those same entities. Should a situation arise where such a conflict occurs, the University employee will disclose it and will recuse themselves from the evaluation and award process.
4. The University as a general practice does not accept donations in kind in connection with
capital construction projects. Requests for exceptions must be reviewed in advance on a case by case basis, and cannot proceed unless approved in advance by the Chief Facilities Management and General Services Officer and University Counsel, or their designees, and depending on the scope and scale of the matter, by the Board of Trustees or its designated committee.
5. In the specific instance of the EEDC, University of Maine President Susan Hunter and
Dean of the College of Engineering Dana Humphrey intend to be involved only with fundraising for the project. They are proactively and explicitly recusing themselves from any consideration, reviews, evaluations, determinations or approvals of design, construction or capital project-related solicitations, bids, or contracts in connection with the EEDC. They seek to avoid absolutely any actual or apparent conflict of interest or of any influence in or over the contracting process.
6. Moreover, to the extent initial design or project-related contracts have been awarded,
President Hunter and Dean Humphrey have confirmed they had not as of March 21, 2018, solicited donations for the EEDC from the entities also involved in seeking the initially available EEDC-related contracts.
7. University of Maine System General Counsel and the Chief Facilities Management and
General Services Officer will collaborate to put such additional practices and protocols in place to carry out this understanding and in particular in connection with the EEDC.
7.1
Finance, Facilities, Technology Committee Meeting - Fundraising and Capital Projects – Conflict of Interest Clarification, UM
121

4/25/2018
AGENDA ITEM SUMMARY
1. NAME OF ITEM: Corthell Hall HVAC Upgrades, USM
2. INITIATED BY: Karl W. Turner, Chair
3. BOARD INFORMATION: BOARD ACTION: X
4. OUTCOME: BOARD POLICY:Increase enrollmentEnhance fiscal positioning Policy 701 – Capital BudgetsImprove student success and completionRelevant academic programming
5. BACKGROUND:
The University of Maine System acting through the University of Southern Maine (USM)requests authorization to expend up to $550,000 in E & G resources for upgrades to the HVAC and temperature control systems that serve Corthell Hall on the Gorham campus.
This request is pursuant to Board Policy 701 Operating and Capital Budgets, requiring advance approval of projects with a total cost of $500,000 or more. This request is within the purview of the Finance, Facilities and Technology committee without further review by the full Board.
Corthell Hall was originally constructed in 1878. An Addition to Corthell to bring it to its present size was built in 1905 with renovations in 1961 and again in 1986. Corthell Hall is a three-story brick and wood structure with a current NAV of 0%. The facility acts as the home of the USM School of Music and is located in the Gorham Campus Historic District. Over sixty public events are held here throughout the year with a total of 7,000 patrons, and about 400 students use the building during both the academic year and summer.
Several major heating, ventilating and air conditioning (HVAC) systems and controls that service Corthell Hall have seen a steady increase of maintenance calls. These systems installed over 30 years ago, combined with the increased maintenance required has led to the determination that these systems have reached the end of their useful life. This project is to upgrade existing underperforming and failing HVAC system components along with new heating and cooling capabilities and improved humidity control for the Concert Hall. The construction will upgrade the building central steam-to-hot water heat exchanger and main circulation pumps and piping, and upgrade the HVAC system serving the Concert Hall to improve humidity control and comfort.
8
Finance, Facilities, Technology Committee Meeting - Corthell Hall HVAC Upgrades, USM
122

4/25/2018
The project will also replace the existing pneumatic control system and air compressor with an electronic DDC system allowing the building to be connected to the existing campus-wide building automation system. The existing pneumatic controls are old, underperforming technology and in need of upgrading to improve building performance and maintenance access.
The project is scheduled to be executed during the summer of 2018 with completion prior to the beginning of the fall semester. The improvements are expected to have a positive impact on operating costs of the facility, and to improve the indoor environment for students, staff, faculty and community patrons who use the building. Corthell Hall has a current renovation age of over 100 years and a calculated need of over $14 million. Since the components being upgraded are part of a major building system these improvements will help improve the Net Asset Value (NAV).
6. TEXT OF PROPOSED RESOLUTION:
That the Board of Trustees, acting through the Finance, Facilities and Technology Committee authorizes the University of Southern Maine to expend up to $550,000 of E&G resources for the improvements of the HVAC system and controls that serviceCorthell Hall at the University of Southern Maine.
8
Finance, Facilities, Technology Committee Meeting - Corthell Hall HVAC Upgrades, USM
123

5/1/2018
AGENDA ITEM SUMMARY
1. NAME OF ITEM: Master Plan Acceptance, UMA
2. INITIATED BY: Karl W. Turner, Chair
3. BOARD INFORMATION: BOARD ACTION: X
4. OUTCOME: BOARD POLICY:Master Planning
5. BACKGROUND:
The Board of Trustees has encouraged all campuses to adopt master plans for their respective physical campuses as part of a series of facility-related recommendations adopted in March 2015. The University of Maine at Augusta initiated a master planning process in the spring of 2016 and completed this process with a final presentation to the Augusta and Bangor campus communities in the summer of 2017.
The master plan is part of a three-tiered planning process which Trustees have directed be undertaken and which requires a master plan, a 5-year capital plan and a 1-year capital work plan be maintained by each University and, taken together, for the System. Six of seven such campus master plans are either completed or in progress, including the plan from UMA which is before the committee here.
The planning process was initiated at UMA during the prior presidential administration and has since been led by President Rebecca Wyke and as submitted reflects President Wyke’s participation. The Plan has been endorsed by the respective Campus Facilities Committees.
The Augusta campus Master Plan was last updated in 1998; the Bangor campus Master Plan was last updated in 2000. UMA is unique in that it operates two campuses and six off-campus Centers, and is entirely non-residential. Harriman and Associates worked with a campus Steering Committee to create a single Facilities Master Plan that proposes future development for both the Augusta and Bangor campuses. UMA’s Off-Campus Centers operate in leased spaces and were not included in the Facilities Master Plan.
According to Sightlines 2017 report, UMA’s overall density factor is the highest within the University of Maine System. This is in part due to the fact the institution is non-residential. UMA’s NAV is 63%, which is the highest in the System and is at the interim benchmark – though not yet the long-term benchmark - which Trustees are seeking to achieve Statewide.
9
Finance, Facilities, Technology Committee Meeting - Master Plan Acceptance, UMA
124

5/1/2018
The Master Plan provides a detailed evaluation of current campus spaces with recommendations for optimizing teaching, administrative, and support spaces throughout each campus using existing facilities to the extent possible, consistent with the UMA Strategic Plan and Board of Trustee directives. As these changes are implemented, UMA’s NAV would improve.
In addition to addressing future development of academic and administrative facilities, the Augusta campus Master Plan provides guidance on potential future development of residence halls on the Augusta campus, should the institution transition from being non-residential to a residential campus. The Board last considered the issue of housing at UMA when its Finance Facilities and Technology Committee supported continued exploration of ideas at its meeting in April 2017.
The Bangor campus Master Plan identifies campus improvements that would help to transform the aesthetic of the former military base into a more traditional college campus by adding campus walks with improved landscaping and new wayfinding and associated signage.
The campus plan describes options that could be implemented on each campus to create a more welcoming campus environment while continuing to use the existing facilities more efficiently.
While the plan includes projects that would increase the campus gross square footage, these projects will only be undertaken commensurate with changes in enrollment and academic program offerings or other revenue generation.
Collectively, the Master Plan provides UMA with a guide for future development for the Augusta and Bangor campuses for the next twenty years. The projected cost to implement all recommendations in the Plan ranges between approximately $72-$92 million dollars.
6. RESOLUTION
That the Finance, Facilities, and Technology Committee forward this item to the Consent Agenda at the May 20-21, 2018 Board of Trustees meeting for approval of the following resolution:
That the Board of Trustees acknowledges the campus master plan from UMA andwithout granting Trustee approval for any specific expenditure or capital project that would otherwise require Trustee consideration, accepts the plan and encourages the University to continue its efforts to maintain and act in accordance with the plan as well as other applicable directives of the Trustees.
9
Finance, Facilities, Technology Committee Meeting - Master Plan Acceptance, UMA
125

9.1
Finance, Facilities, Technology Committee Meeting - Master Plan Acceptance, UMA
126

MASTER PLAN PROCESS P H A S E D A N A L Y S I S A N D D E V E L O P M E N T
S T R A T E G I C G O A L S A N D D R I V E R S
SPACE NEEDS COMPARITIVE ANALYSIS
S Q U A R E F O O T A G E S U M M A R Y
UMA- AUGUSTA RECOMMENDATIONS CAMPUS SHORT & LONG TERM GOALS
OVERVIEW OF FINAL VISION
UMA- BANGOR RECOMMENDATIONS CAMPUS SHORT & LONG TERM GOALS
OVERVIEW OF FINAL VISION
9.1
Finance, Facilities, Technology Committee Meeting - Master Plan Acceptance, UMA
127

1 . URGENT NEEDS (FACIL IT IES)• F A C I L I T I E S I S S U E S
• P R O G R A M E X I G E N C I E S
2 . SHORT-TERM MASTER PLAN 0 -10 YEARS• FACILITES
• PROGRAM
• CAMPUS
3. LONG-RANGE MASTER PLAN 10-20+ YEARS• CAMPUS EXPANSION: CONFERENCE CENTER, ACADEMIC BUILDING,
STUDENT LIFE, ATHLETICS
9.1
Finance, Facilities, Technology Committee Meeting - Master Plan Acceptance, UMA
128

AUGUSTA DRIVERS
CONSOLIDATE CAMPUS
ENHANCE BRAND AND IDENTITY OF CAMPUS
REINFORCE COMMUNITY CONNECTIONS
ESTABLISH ARTS AND MUSIC CLUSTER
ESTABLISH MEETING SPACES
ESTABLISH WELCOME CENTER
IMPROVE PEDESTRIAN EXPERIENCES
IF HOUSING, WHERE?
BANGOR DRIVERS
TRANSFORM AN AD-HOC GROUP OF BUILDINGS
TO FEEL MORE LIKE A CAMPUS
ESTABLISH A CAMPUS IDENTITY BEYOND THE
PROGRAM OFFERINGS
CREATE SOCIAL SPACES INSIDE & OUT
LESSEN IMPACT OF ROADS & NON-UMA
BUILDINGS
CREATE A MORE COLLEGIATE CHARACTER
9.1
Finance, Facilities, Technology Committee Meeting - Master Plan Acceptance, UMA
129

SITELINES COMPARISON
Total SF / Headcount & FTE
RICKES ASSOC. SPACE NEEDS
ANALYSIS
Total Assignable SF / Headcount &
FTE
Analysis by FICM Category
Recommendations Based Upon SF
Required for Specific Types of
Learning (FICM)
9.1
Finance, Facilities, Technology Committee Meeting - Master Plan Acceptance, UMA
130

SQ. FT. REDUCTIONS THROUGH 2016Dow Chapel 11,638 Lincoln Hall 10,804 Augusta Hall 25,600 Caribou Hall Redeploy to UM 5,130 Katahdin Hall 3,100 Schoodic Hall 3,100
Subtotal 59,372
SQ. FT. REDEPLOYMENT TO UMSRobinson Hall 12,240 3rd Floor Lewiston Hall 8,300
Subtotal 20,540
TOTAL SQ. FT. DECREASE 79,912
9.1
Finance, Facilities, Technology Committee Meeting - Master Plan Acceptance, UMA
131

SHORT-TERM:
Address deferred maintenance Increase academic program density around the
Campus Common
Welcome / Enrollment Services Center
Fine Arts
Allied Health
Strategic renovations to meet current program
needs
9.1
Finance, Facilities, Technology Committee Meeting - Master Plan Acceptance, UMA
132

SHORT-TERM: Address deferred maintenance
Increase academic program density
around the Campus Common
Welcome / Enrollment Services
Center
Fine Arts
Allied Health Strategic renovations to meet current program
needs
9.1
Finance, Facilities, Technology Committee Meeting - Master Plan Acceptance, UMA
133

SHORT-TERM: Address deferred maintenance
Increase academic program density around the
Campus Common
Welcome / Enrollment Services Center
Fine Arts
Allied Health
Strategic renovations to meet
current program needs
9.1
Finance, Facilities, Technology Committee Meeting - Master Plan Acceptance, UMA
134

9.1
Finance, Facilities, Technology Committee Meeting - Master Plan Acceptance, UMA
135

LONG-TERM: GROWTH DEPENDENT
Renovations of large existing
campus buildings New building construction init iatives based
upon growth and potential need for residential
program9.1
Finance, Facilities, Technology Committee Meeting - Master Plan Acceptance, UMA
136

LONG-TERM: GROWTH DEPENDENT Renovations of large existing campus buildings
New building construction initiatives
based upon growth and potential
need for residential program 9.1
Finance, Facilities, Technology Committee Meeting - Master Plan Acceptance, UMA
137

9.1
Finance, Facilities, Technology Committee Meeting - Master Plan Acceptance, UMA
138

SHORT-TERM:
Improve campus identity with
pathways, signage, and landscaping Strengthen connection to Eastport Hall from core
campus
Improve relationship of College Center with an
entrance that faces inward instead of toward the
street
Renovate Bangor Hall to create a front door and
Welcome Center
9.1
Finance, Facilities, Technology Committee Meeting - Master Plan Acceptance, UMA
139

SHORT-TERM: Improve campus identity with pathways, signage,
and landscaping
Strengthen connection to Eastport Hall
from core campus Improve relationship of College Center with an
entrance that faces inward instead of toward the
street
Renovate Bangor Hall to create a front door and
Welcome Center
9.1
Finance, Facilities, Technology Committee Meeting - Master Plan Acceptance, UMA
140

SHORT-TERM: Improve campus identity with pathways, signage,
and landscaping
Strengthen connection to Eastport Hall from core
campus
Improve relationship of College Center
with an entrance that faces inward
instead of toward the street Renovate Bangor Hall to create a front door and
Welcome Center
9.1
Finance, Facilities, Technology Committee Meeting - Master Plan Acceptance, UMA
141

SHORT-TERM: Improve campus identity with pathways, signage,
and landscaping
Strengthen connection to Eastport Hall from core
campus
Improve relationship of College Center with an
entrance that faces inward instead of toward the
street
Renovate Bangor Hall to create a front
door and Welcome Center
9.1
Finance, Facilities, Technology Committee Meeting - Master Plan Acceptance, UMA
142

9.1
Finance, Facilities, Technology Committee Meeting - Master Plan Acceptance, UMA
143

LONG-TERM: GROWTH DEPENDENT
Renovations of existing campus
buildings New building construction init iatives based upon
growth and/or programmatic changes 9.1
Finance, Facilities, Technology Committee Meeting - Master Plan Acceptance, UMA
144

LONG-TERM: GROWTH DEPENDENT Renovations of existing campus buildings
New building construction initiatives
based upon growth and/or
programmatic changes 9.1
Finance, Facilities, Technology Committee Meeting - Master Plan Acceptance, UMA
145

9.1
Finance, Facilities, Technology Committee Meeting - Master Plan Acceptance, UMA
146

9.1
Finance, Facilities, Technology Committee Meeting - Master Plan Acceptance, UMA
147

9.1
Finance, Facilities, Technology Committee Meeting - Master Plan Acceptance, UMA
148

4/25/2018
AGENDA ITEM SUMMARY
1. NAME OF ITEM: Turbine Update, UMPI
2. INITIATED BY: Karl W. Turner, Chair
3. BOARD INFORMATION: X BOARD ACTION:
4. OUTCOME: BOARD POLICY:
5. BACKGROUND:
The 600-kilowatt wind turbine, which began operating at the University of Maine atPresque Isle in 2009, suffered a fire and disruption of operations on Sunday, April 1. In addition to the actions taken by the campus to ensure the safety of its community, the turbine blades were further physically secured by 3rd party experts on April 4, 2018. Risk Management and others have been closely involved in following up and assisting the University to determine its options and course of action. The turbine remains out of service at this time. At the time of the disruption, the turbine in its history had generated an estimated 4.7 million kilowatt hours of electricity with an approximate value of $566,615.24 for the campus. Chief Business Officer Ben Shaw will provide an update.
10
Finance, Facilities, Technology Committee Meeting - Turbine Update, UMPI
149

4/25/2018
ITEM SUMMARY
1. NAME OF ITEM: Capital Project Status Report
2. INITIATED BY: Karl W. Turner, Chair
3. BOARD INFORMATION: X BOARD ACTION:
4. OUTCOME: BOARD POLICY:
5. BACKGROUND:
Attached is the Capital Project Status Report for the May 2, 2018 meeting of the Finance, Facilities, and Technology Committee.
The report reflects a total of 20 projects, with one project being removed since the previous report, and one new project added to this report.
The USM Anderson Hall Renewal & Renovations project (6200191, 6100272) has been removed from this report. With a limited timeline for this project, this project was terminated early, with costs coming in under budget. A new project has been added to this report; USM’s Athletic Field Lighting project (6100289).
Six projects will be removed from the following report. They are USM projects Campus Card Access Install (6100271), Gorham Softball Field Improvements (6200181), Brooks Kitchen Exhaust Upgrade (6100245), Costello Field House Floor Replacement (6100280), Science Building Renovations & Build-Out (6100274); and UMM project Science Building Laboratory Upgrade (4100027).
11
Finance, Facilities, Technology Committee Meeting - Capital Project Status Report
150

4/25/2018
0
5
10
15
20
25
30
$0
$10,000,000
$20,000,000
$30,000,000
$40,000,000
$50,000,000
$60,000,000
$70,000,000
Current number and approved costof active major capital facility projects
Total # of BOTapprovedprojects as ofreport date
Total approvedBOT estimatedexpenditures -all funds
Revenue Bonds
State Bonds
Gifts & Endowments
Campus funds
Grants
$0
$10,000,000
$20,000,000
$30,000,000
$40,000,000
$50,000,000
$60,000,000
$70,000,000
Total Approved Funding by Sourcefor Active Major Capital Facility Projects
Grants
Campus funds
Gifts & Endowments
State Bonds
Revenue Bonds
11
Finance, Facilities, Technology Committee Meeting - Capital Project Status Report
151

Capital Project Status ReportBoard Approved Projects
Campus, Project Name (Project ID)Funding Source(s) & each source's
share of expenditures to date Status
Original Estimated
CompletionCurrent Est. Completion
Original Approved Estimate
Current Approved Estimate
% Expended of Current Approved Estimate Prior Actions, Information & Notes
UMAdvanced Structures and Composites Center Expansion/ASCC Equip W2-Thermoplastics Lab/ASCC Equip W2 Tow Carriage (5100316, 5100414, 5100432)
Grants (77%), 2010 State Energy Bond (11%), Gifts (12%)
Project 5100316 is Complete,
Project 5100414 Design in Progress,
Project 5100432 is Design in
Progress
2014 2018 $6,400,000 $10,400,000 90% Board Approved $6.4M in November, 2012. Board approved $1.6M in March 2014. Board approved
increase of $871,000 in March 2015. BOT approved additional $1.5M in May 2016 for equipment
project.
Cooperative Extension Diagnostic & Research Lab (5100387)
2014 State Bond (85%), Campus E&G Funds (10%), Grants (5%)
Construction in Progress
2016 2018 $9,000,000 $9,400,000 92% BOT approved $9M in July, 2015. Board approved increase of $400,000 in July 2017.
Aquatic Animal Health Facility (5100440) Grants (82%), Campus E&G Funds (18%) Construction in Progress
2017 2018 $2,300,000 $2,800,000 7% Board approved $2.3M in January, 2017. Board approved increase of $500,000 (8.6%) in project
cost in November, 2017.Barrow's Hall ESRB Lab Renovations (5100424)
Campus E&G Funds (100%) Construction in Progress
2017 2018 $1,900,000 $1,900,000 57% Board approved $1.9M in March, 2017
Memorial Union Bear's Den Renovations (5100427)
Campus AUX Funds (100%) Construction Complete
2017 2018 $3,600,000 $3,600,000 86% Board approved $3.6M in March, 2017
Darling Marine Center Waterfront Infrastructure (5100459, 5100460, 5100461)
2017 University Bond (100%) Design in Progress
2017 2018 $3,000,000 $3,000,000 0.36% Board approved $3M in July, 2017.
Engineering Education and Design Center (5100458)
Bond (0%), Campus E&G Funds (100%) Design in Progress
2024 2024 $1,000,000 $1,000,000 24% Board approved $1M in September, 2017.
Wells Commons Generator (5100433) Campus Auxiliary Reserves (100%) Construction in Progress
2019 2019 $525,000 $525,000 1% Board approved $525,000 January, 2018.
UMFScience Labs Renovations (Preble & Ricker (2100065, 2100068)
2013 Lab & Class State Bond (100%) Substantially Complete
2014 2018 $1,377,000 $1,377,000 88% Board approved $1.377M in July 2014.
UMFKForestry Geographic Info Sys Tech Labs/Nursing Lab Renov/Teleconf Ctr Upgrades (3100029 3100030 3100031)
2013 Lab & Class State Bond (100%) Substantially Complete
2014 2018 $1,200,000 $1,200,000 99% Board approved $1.2M in May 2014.
UMM*** Science Building Laboratory Upgrades (4100027)
2013 Lab & Class State Bond (100%) Complete 2014 2018 $600,000 $600,000 98% Finance & Facilities Committee Approved $600K in January, 2014.
Compressed Natural Gas Heating Conversion (4100028)
Revenue Bonds (100%) Substantially Complete
2014 2018 $1,800,000 $1,800,000 84% Board approved $1.8M in July 2014.
Card Access Project (4100036, 41000037) Campus E&G Funds (21%), Campus Auxiliary Funds (79%)
Substantially Complete
2018 2018 $571,000 $597,500 65% Board approved $571,000 in July, 2017. Change in project cost to $597,500 (4.6% change) approved by Chancellor in October 2017 per Trustee policy 701.
May 2018 - Board of TrusteesWith Grand Totals and % of Current Approved Estimates
1
11.1
Finance, Facilities, Technology Committee Meeting - Capital Project Status Report
152

Campus, Project Name (Project ID)Funding Source(s) & each source's
share of expenditures to date Status
Original Estimated
CompletionCurrent Est. Completion
Original Approved Estimate
Current Approved Estimate
% Expended of Current Approved Estimate Prior Actions, Information & Notes
USM*** Campus Card Access Install (6100271) Campus E&G Funds (100%) Complete 2017 2018 $700,000 $700,000 83% Board approved $700K in March, 2017.*** Gorham Softball Field Improvements (6200181)
Campus E&G Funds (100%) Complete 2015 2017 $1,500,000 $2,389,000 97% BOT approved $1.5M in July, 2015. Board approved increase to $2.2M in March, 2016.
Change in project cost to $2.389M (8.6% change) approved by Chancellor in January 2017 per Trustee
policy 701.*** Brooks Kitchen Exhaust Upgrade (6100245)
Campus E&G Funds (100%) Complete 2016 2018 $819,000 $893,000 95% Board approved $819,000 in March, 2016. Change in project cost to $893K (9.04% change) approved by Chancellor in March 2017 per Trustee policy
701.*** Costello Field House Floor Replacement (6100280)
Gifts & Endowments (100%) Complete 2017 2017 $900,000 $900,000 91% Board approved $900,000 in November, 2016.
*** Science Building Renovations & Build-Out (6100274)
Campus E&G Funds (100%) Complete 2017 2017 $1,600,000 $1,600,000 75% Board approved $1.6M in January, 2017.
* Athletic Field Lighting (6100289) Campus E&G Funds (100%) Design in Progress
2018 2018 $1,780,000 $1,780,000 1% Board approved $1.78M in March, 2018.
USM Center for the Arts (6100300) Gifts (100%) Pre-Design in Progress
2022 2022 $1,000,000 $1,000,000 0% Board approved $1M in January, 2018.
Explanatory Notes:* Project is new as of this report.** Details of this project include updates since the last report.*** This project has been completed since the last report and is not expected to appear on the next report.
Funding source(s) reflects primary source(s) for project.
Calendar Year unless otherwise noted.
Percentage expended reflects total expended as of March 31, 2018 as a percentage of the current approved project estimate.
2
11.1
Finance, Facilities, Technology Committee Meeting - Capital Project Status Report
153