Finance avenue - De Tijdstatic.tijd.be/finav/2013/nl/Montea.pdfVerzekering 10% Belfius Insurance 10%...
33
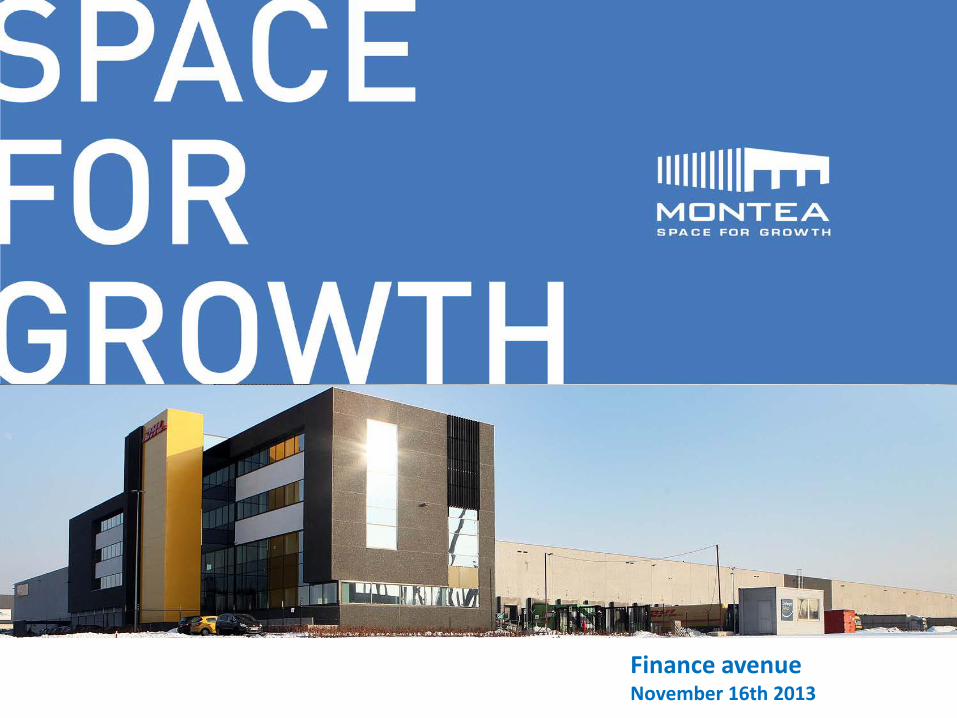
Finance avenue November 16th 2013
Transcript of Finance avenue - De Tijdstatic.tijd.be/finav/2013/nl/Montea.pdfVerzekering 10% Belfius Insurance 10%...
Finance avenue November 16th 2013

Topics
1. Montea
2. Portfolio
3. Highlights of 9 months – year 2013
4. Financial Results 9 months - year 2013
5. Financial structure
6. Conclusion & Outlook 2013
Montea – Space for Growth
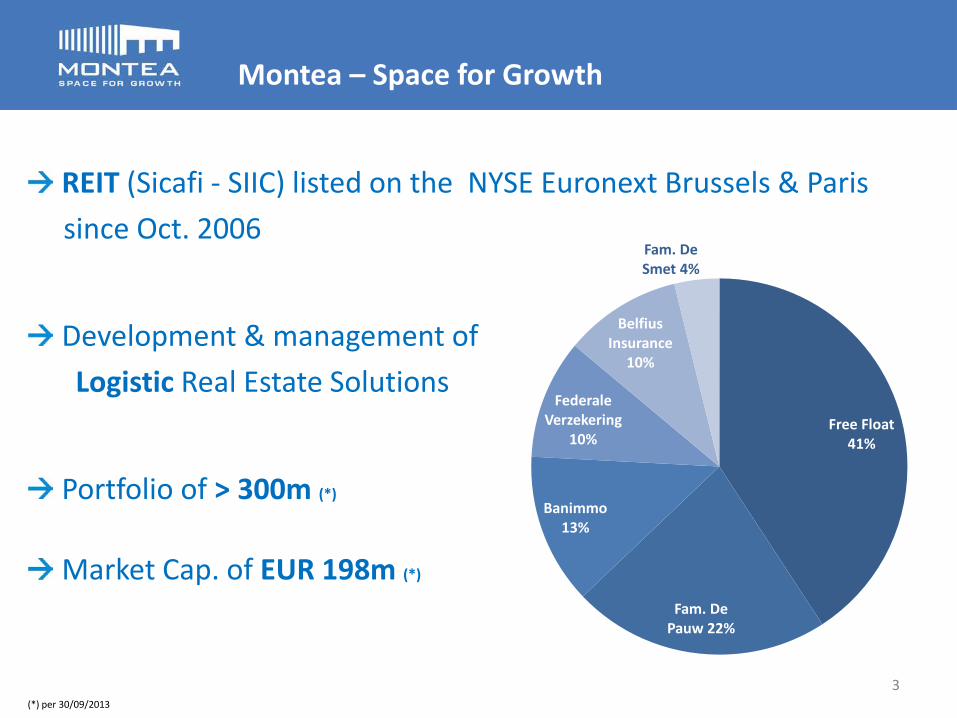
REIT (Sicafi - SIIC) listed on the NYSE Euronext Brussels & Paris since Oct. 2006
Development & management of Logistic Real Estate Solutions
Portfolio of > 300m (*)
Market Cap. of EUR 198m (*)
Free Float 41%
Fam. De Pauw 22%
Banimmo 13%
Federale Verzekering
10%
Belfius Insurance
10%
Fam. De Smet 4%
(*) per 30/09/2013
3

Regulatory Framework of REIT
Belgian REIT status as a “Vastgoedbevak” / “Sicafi” •Listed on the stock exchange with mandatory free float of at least 30%
•Limited in its activities to property investments
•Tax transparency
Low Risk characteristics •Stringent supervision by the supervisory authority (FSMA)
•Portfolio diversification requirements and independent quarterly appraisals
•Restrictions with respect to the use of leverage, min. pay-out
Operating under the defensive umbrella of the respective REIT regime •Belgian REIT “Sicafi” or “Vastgoedbevak”
•French REIT “SIIC” or “Société d’Investissement Immobilier Cotée”
•Dutch REIT “FBI” or Fiscale Belegginsinstelling”
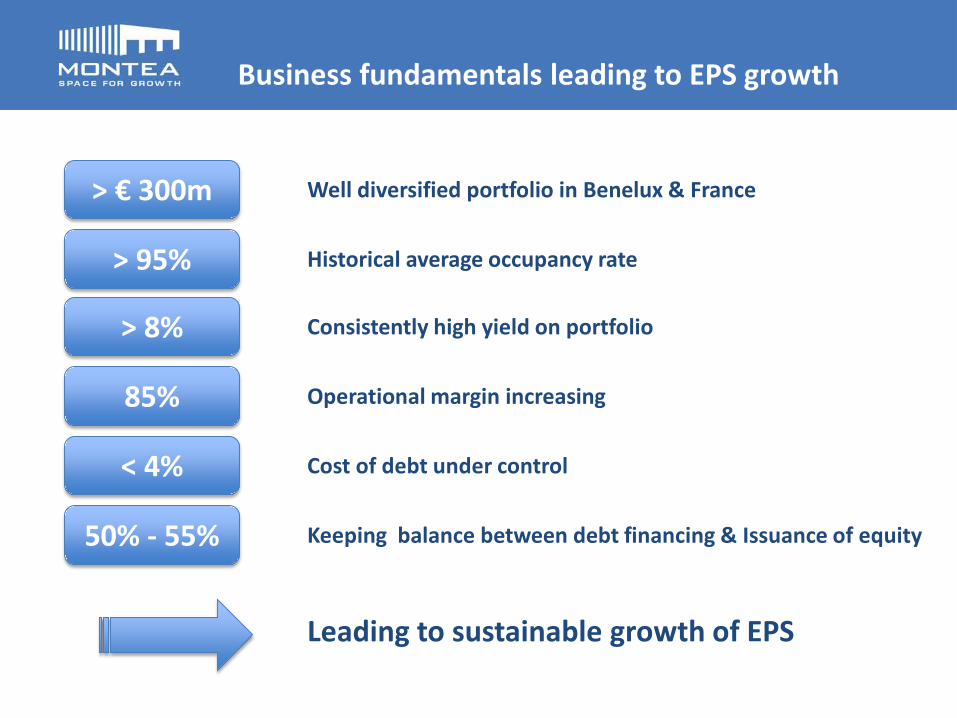
Business fundamentals leading to EPS growth
> € 300m
> 95%
> 8%
85%
< 4%
50% - 55%
Well diversified portfolio in Benelux & France
Historical average occupancy rate
Consistently high yield on portfolio
Operational margin increasing
Cost of debt under control
Keeping balance between debt financing & Issuance of equity
Leading to sustainable growth of EPS

3 Key Words
Warehousing • Land value has a higher share in the total
value than in other asset classes
• Life cycle of warehousing > other asset classes
• Renovation cost < than other RE asset classes
Pure player • Ambition to be best in class through
specialisation (Logistics, Real Estate & Finance)
• Ambition to be top of mind towards other market players (logistic players, brokers ...)
End investor No speculative development: therefore possible business partner for land owners and developers. Long term vision with focus on quality & sustainability (for example Blue Label)
400€/m²
45€/m²
200€/m²
Cost Logistic Development Prime Rent
Cost Land
Cost Development7,5%
2m² land for 1m² logistic development
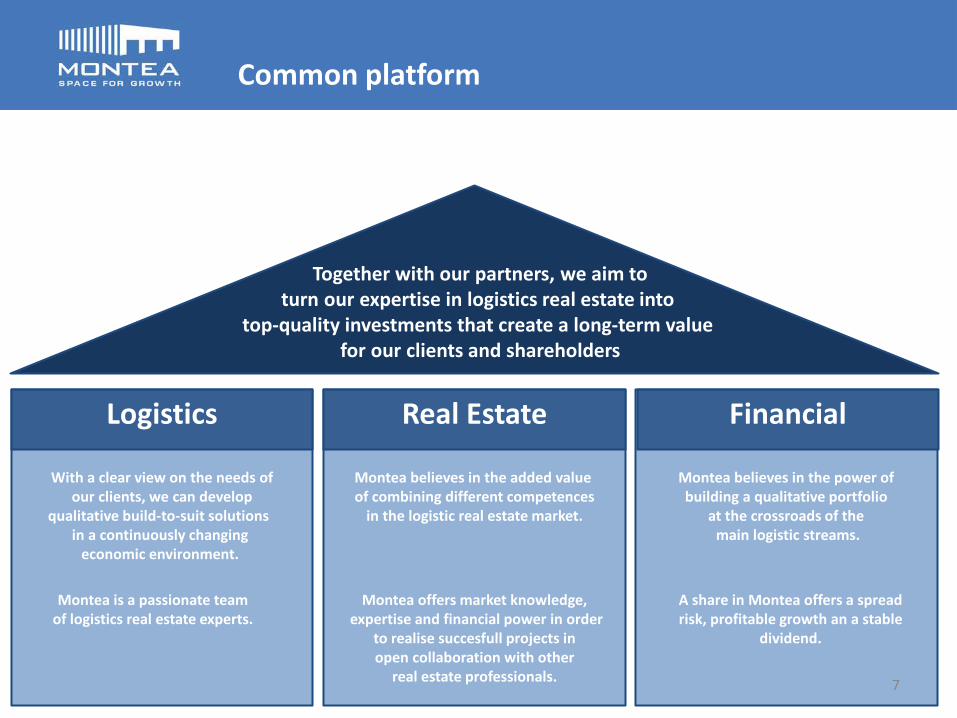
Common platform
Together with our partners, we aim to
turn our expertise in logistics real estate into top-quality investments that create a long-term value
for our clients and shareholders
ddd Logistics
With a clear view on the needs of our clients, we can develop
qualitative build-to-suit solutions in a continuously changing
economic environment.
Montea is a passionate team of logistics real estate experts.
Real Estate
Montea believes in the added value of combining different competences
in the logistic real estate market.
Montea offers market knowledge, expertise and financial power in order
to realise succesfull projects in open collaboration with other
real estate professionals.
Financial
Montea believes in the power of building a qualitative portfolio
at the crossroads of the main logistic streams.
A share in Montea offers a spread risk, profitable growth an a stable
dividend.
7

Management Team
Jo De Wolf Chief Executive Officer
• Active in professional real estate since 1997
• Experience in commercial functions and capital markets at Leasinvest, Extensa (both AvH) and The Brussels Airport Company
Peter Verlinde Chief Financial Officer
• Experience in various financial functions (including stock quoted cy’s)
Peter Demuynck Chief Commercial Officer Belgium
• Active in professional real estate since 1993
• Former Head of Industrial department at Cushman & Wakefield
• Well connected to all major players in Belgian industrial real estate
Jean De Beaufort Director France
• Active in professional real estate since more than 20 years
• Several functions @ CBRE and Jones Lang Lasalle
• Director logistics and light industrial @ Keops
• member of Afilog
Peter Snoeck Chief Operational Officer
• Active in logistic real estate since 30 years
• Co-Founder of Montea Comm. VA
Griet Capelle Chief Development Officer Belgium
• Extended international experience in logistics development management (IIG Group)
8

Topics
1. Montea
2. Portfolio
3. Highlights of 9 months – year 2013
4. Financial Results 9 months – year 2013
5. Financing structure
6. Conclusion & Outlook 2013
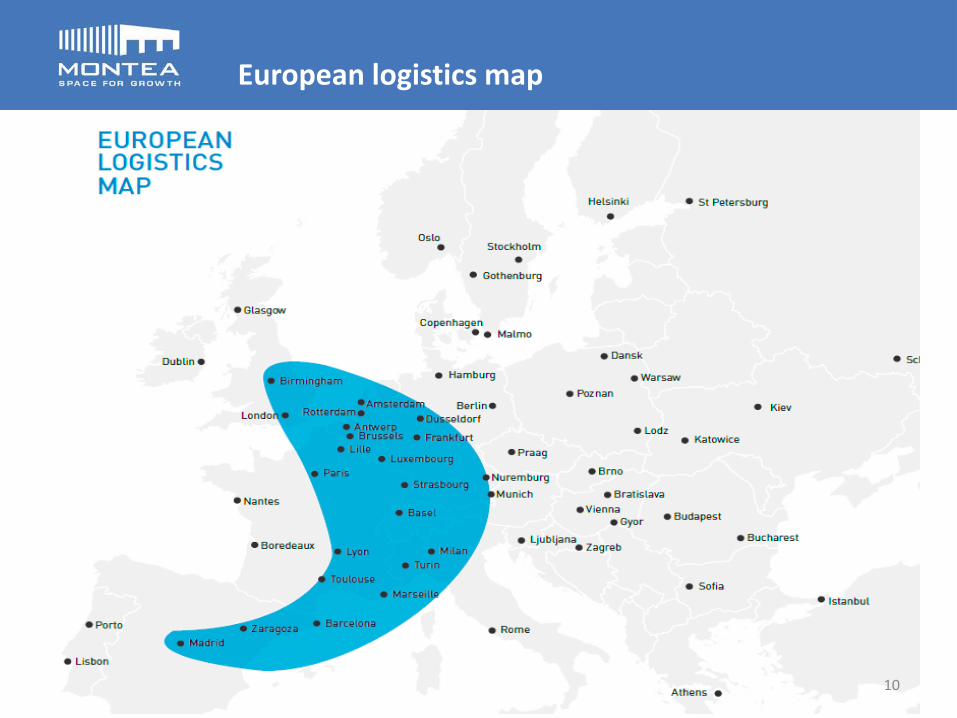
European logistics map
10

Portfolio in Belgium & France …
11
Nr of sites: 18 Fair Value (€m): 180,2 m²: 324.944 Contractual Rent (€m): 13,0 Occupancy rate (*) : 89,1% Yield (**): 7,95%
Nr of sites: 15 Fair Value (€m): 117,5 m²: 218.666 Contractual Rent k€): 10,7 Occupancy rate (*): 100,0% Yield (**): 9,15%
Nr of sites: 33 Fair Value (€m): 297,7 m²: 545.610 Contractual Rent €m): 23,8 Occupancy rate (*) : 93,8% Yield (**): 8,43%
60% 40%
(*) based upon m² (**) when 100% rented

… and entering a new market: The Netherlands
Press Release 09/10/2013
Montea continues to grow with first purchase in the Netherlands
Total area of 36,000m², 24,000m² warehousing / 700m² office space
Investment value of EUR 13.7 million
long-term lease agreement with initial yield of 8.0%
12
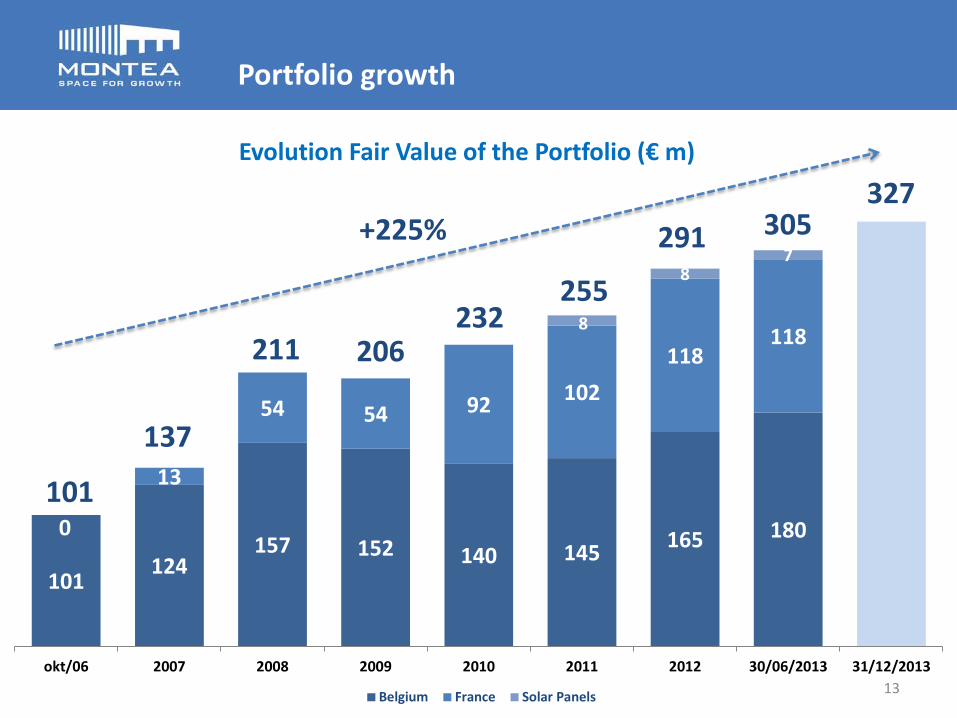
Portfolio growth
101 124
157 152 140 145 165 180 0
13
54 54 92 102 118
118 8
8 7
101
137
211 206 232
255
291 305 327
okt/06 2007 2008 2009 2010 2011 2012 30/06/2013 31/12/2013
Evolution Fair Value of the Portfolio (€ m)
Belgium France Solar Panels
+225%
13

… with declining average age of buildings to an average of 10 years
18,80%
28,67% 33,79%
18,74%
<1998 15j-10j 10j-5j <5j
Aging of Sites (%)
<1998 15j-10j 10j-5j <5j
> 50% of the sites less than 10 years
> 80% of the sites less than 15 years
14
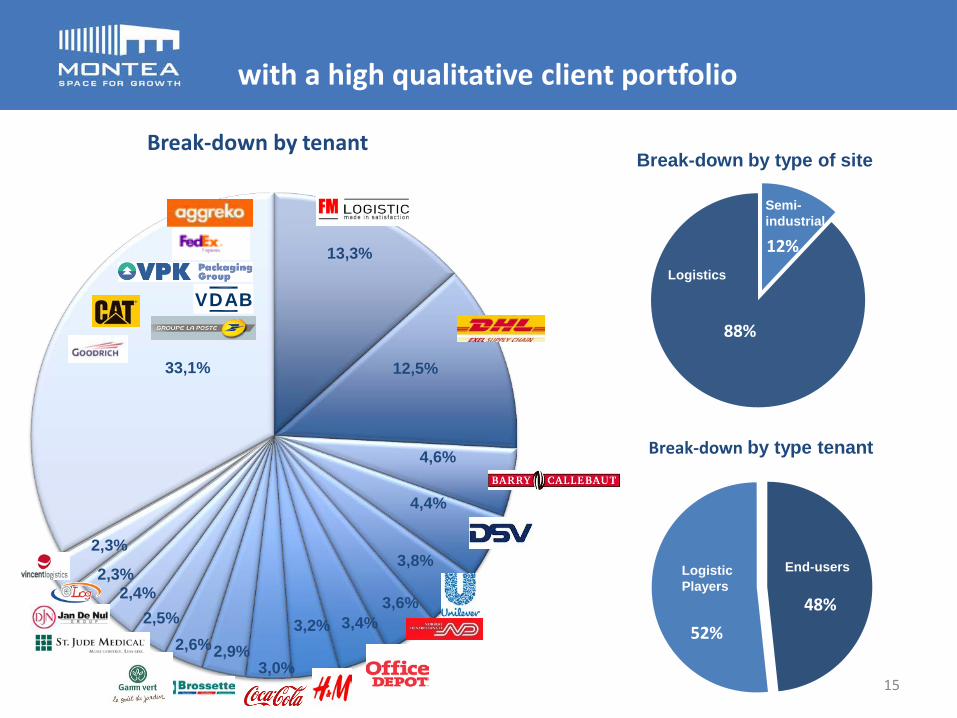
with a high qualitative client portfolio
VDAB
13,3%
4,6%
3,6%
3,8%
3,4%
3,0%
2,5%
2,3%
33,1%
12%
88%
48% 52%
Logistics
End-users Logistic Players
Break-down by type of site
Break-down by type tenant
Break-down by tenant
12,5%
2,3%
15
4,4%
3,2% 2,9% 2,6%
2,4%
Semi- industrial

with occupancy & maturity under control
96,6% 95,6% 92,9%
95,1% 96,5% 96,3% 96,6% 93,8%
94,2%
2007 2008 2009 2010 2011 2012 30/06/2013 30/09/2013 31/12/2013
Long term Target: > 95,0% (1)
(1) At the end of the period based upon m²
(2) Untill first break
4,8
30/09/2013Excl. Solar panels Impact Solar Panels
Long term Target: > 6y (2)
5,2
• Historical occupancy rate > 95%
• Logistics business knows by 3,6,9 contracts
• Increased from 3,5 years in 2010
• Mix between End users & Logistics players
16

Topics
1. Montea
2. Portfolio
3. Highlights of 9 months – year 2013
4. Financial Results 9 months – year 2013
5. Financial structure
6. Conclusion & Outlook 2013
Highlights of the 1st 9 months of 2013
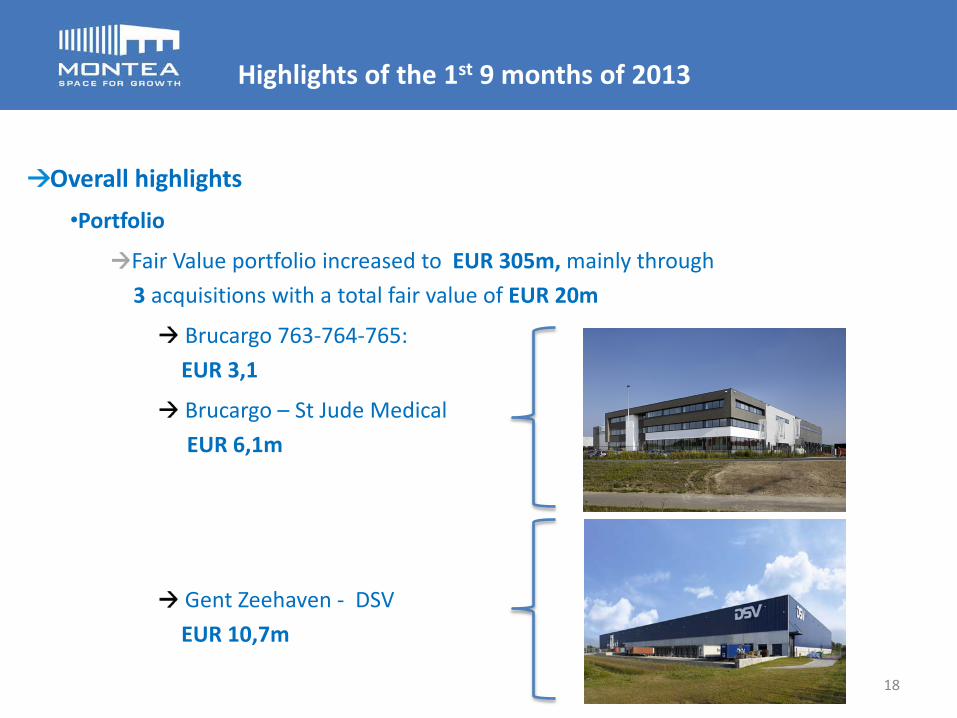
Overall highlights •Portfolio
Fair Value portfolio increased to EUR 305m, mainly through 3 acquisitions with a total fair value of EUR 20m
Brucargo 763-764-765: EUR 3,1
Brucargo – St Jude Medical EUR 6,1m
Gent Zeehaven - DSV EUR 10,7m
18
Highlights of the 1st 9 months of 2013
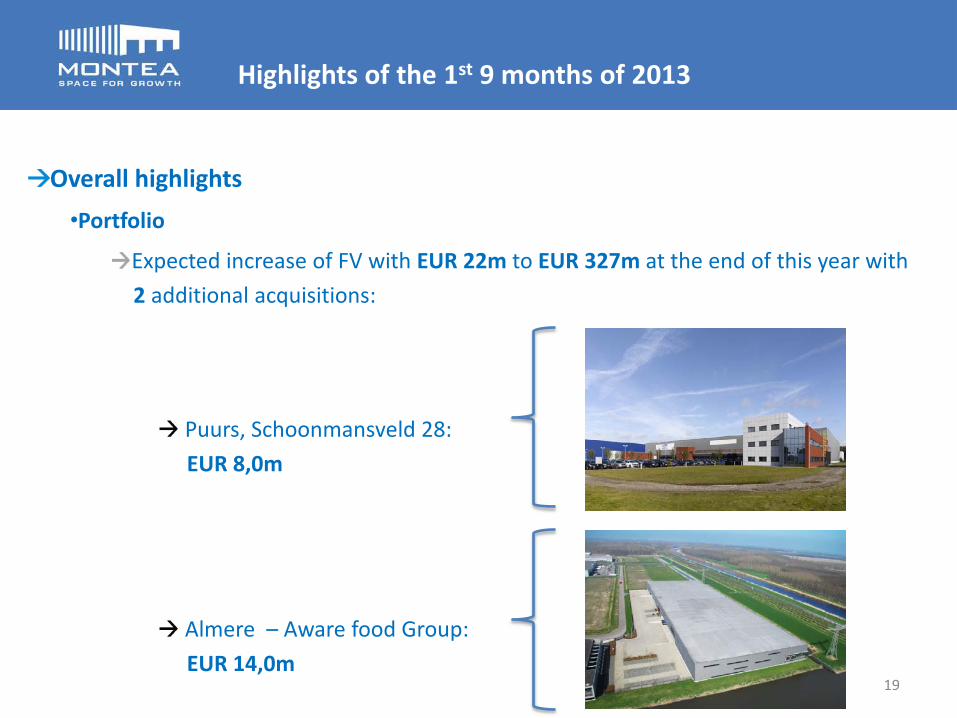
Overall highlights •Portfolio
Expected increase of FV with EUR 22m to EUR 327m at the end of this year with 2 additional acquisitions:
Puurs, Schoonmansveld 28: EUR 8,0m
Almere – Aware food Group: EUR 14,0m
19

Highlights of the 1st 9 months of 2013
Overall highlights •Portfolio
Divestment of Laken (EUR 2,9m)
Occupancy rate of 93,8% - lifetime contracts of 5,2y
•Financial
NCR of EUR 10,07m (EUR 1,53 per share) – growth of 20 % compared to last year
Operational margin of 83,7%
Successful placement of EUR 30m bonds @ 4,107% -> diversification of financing
50% of shareholders choose for the optional dividend EUR 4,1m equity increase
Forecasted NCR of EUR 13,4m (EUR 2,04 per share) growth of 19% compared to last year
•Other
Change in Board of Directors 3 new directors
20
Highlights of the 1st 9 months of 2013
Rental Activity - new rental contracts for > 22,000m²
•100% occupancy rate in Savigny-Le-Têmple due to Rental contract with LPF for a fixed period of 12y and 8m (8,850m²)
•9y contract with Geodis @ Brucargo (6,600m²)
•6y new rental contract with TNT Innight in Mechelen for 6y fix (6,600m²)
21
Highlights of the 1st 9 months of 2013
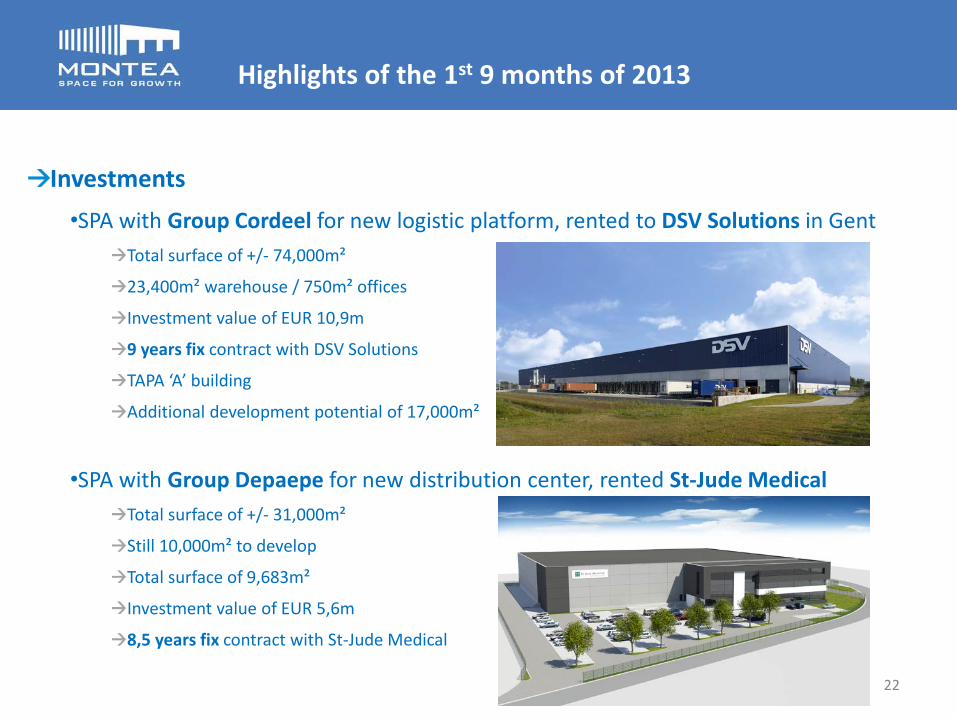
Investments •SPA with Group Cordeel for new logistic platform, rented to DSV Solutions in Gent
Total surface of +/- 74,000m²
23,400m² warehouse / 750m² offices
Investment value of EUR 10,9m
9 years fix contract with DSV Solutions
TAPA ‘A’ building
Additional development potential of 17,000m²
•SPA with Group Depaepe for new distribution center, rented St-Jude Medical Total surface of +/- 31,000m²
Still 10,000m² to develop
Total surface of 9,683m²
Investment value of EUR 5,6m
8,5 years fix contract with St-Jude Medical
22
Highlights of the 1st 9 months of 2013
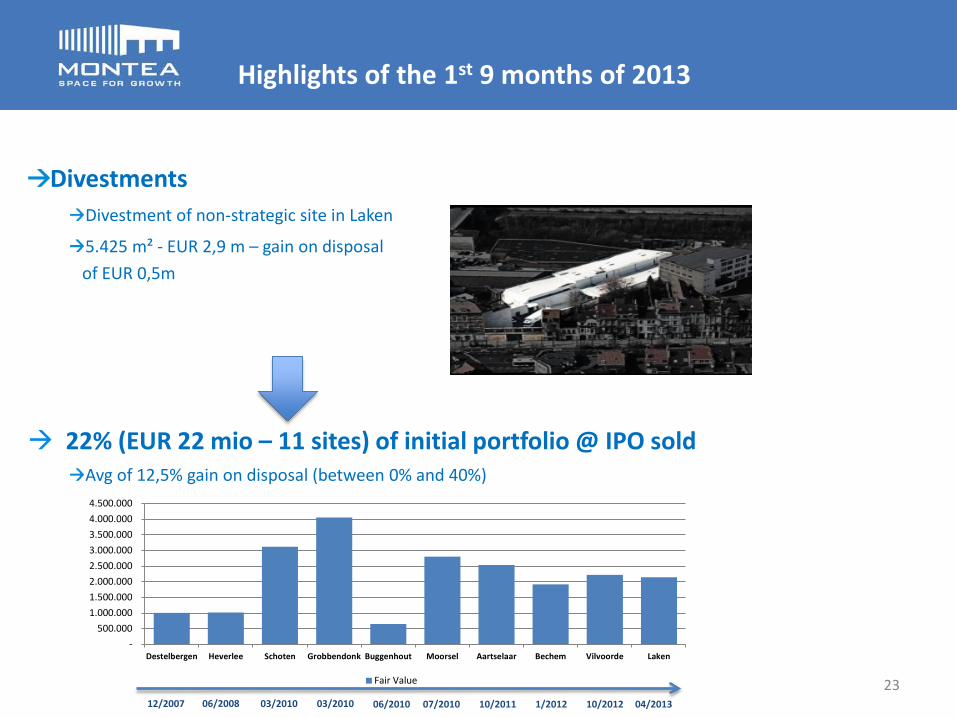
Divestments Divestment of non-strategic site in Laken
5.425 m² - EUR 2,9 m – gain on disposal of EUR 0,5m
22% (EUR 22 mio – 11 sites) of initial portfolio @ IPO sold
Avg of 12,5% gain on disposal (between 0% and 40%)
- 500.000
1.000.000 1.500.000 2.000.000 2.500.000 3.000.000 3.500.000 4.000.000 4.500.000
Destelbergen Heverlee Schoten Grobbendonk Buggenhout Moorsel Aartselaar Bechem Vilvoorde Laken
Fair Value
12/2007 03/2010 06/2008 06/2010 07/2010 10/2011 1/2012 10/2012 04/2013 03/2010
23
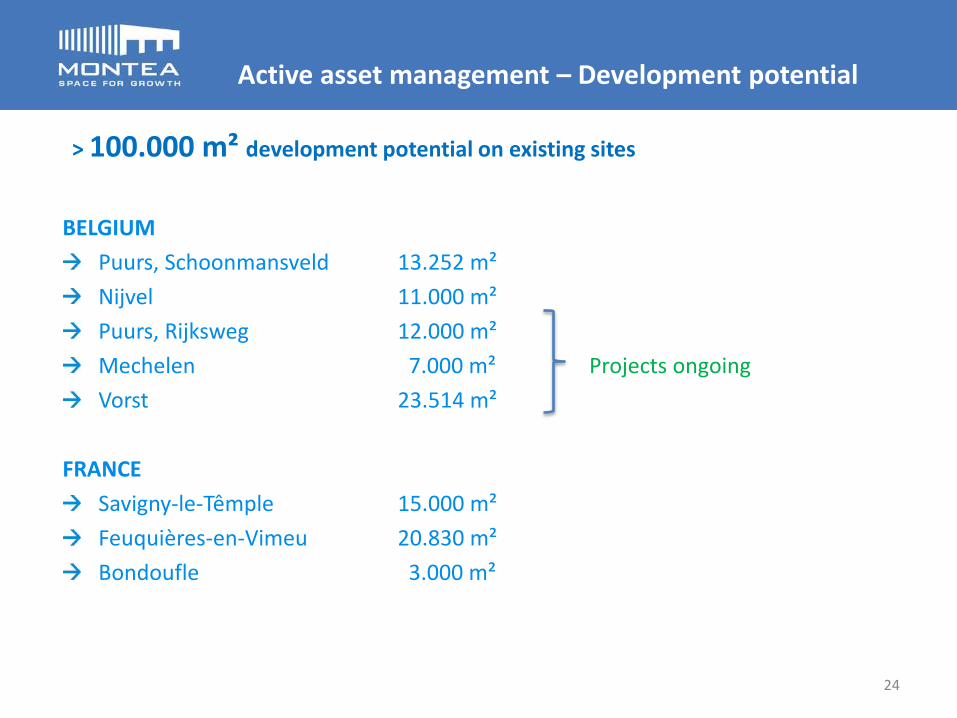
Active asset management – Development potential
BELGIUM
Puurs, Schoonmansveld 13.252 m² Nijvel 11.000 m² Puurs, Rijksweg 12.000 m² Mechelen 7.000 m² Projects ongoing Vorst 23.514 m²
FRANCE
Savigny-le-Têmple 15.000 m² Feuquières-en-Vimeu 20.830 m² Bondoufle 3.000 m²
> 100.000 m² development potential on existing sites
24

Topics
1. Montea
2. Portfolio
3. Highlights of 9 months – year 2013
4. Financial Results 9 months – year 2013
5. Financial structure
6. Conclusion & Outlook 2013

Consolidated Income Statement
+19% Net Rental Result
+17% Operational Margin
+11% Financial Result
+20% NCR +3% NCR / Share
ABBREVIATED CONSOLIDATED 30/09/2013 30/09/2012 PROFIT & LOSS ACCOUNT (EUR) Analytical 9 months 9 months
CURRENT RESULTNET RENTAL RESULT 17.351 14.577
PROPERTY RESULT 17.691 15.149
% compared to net rental result 102,0% 103,9%
TOTAL PROPERTY CHARGES -477 -782
PROPERTY OPERATING RESULT 17.213 14.367
Genera l corporate expenses -2.673 -1.963
Other operating income and expenses -24 2
OPERATING RESULT BEFORE THE PORTFOLIO RESULT 14.516 12.406
% compared to net rental result 83,7% 86,7%
FINANCIAL RESULT -4.417 -3.973
PRE-TAX RESULT (*) 10.100 8.433
Taxes -32 -37
NET CURRENT RESULT 10.068 8.396
per share 1,53 1,51
NON-CURRENT RESULTResult on disposa ls of investment properties 716 79
Resul t on disposa ls of other non-financia l assets 0 0
Changes in fa i r va lue of investment properties -3.571 -4.520
Other portfol io resul t 0 0
PORTFOLIO RESULT -2.855 -4.441
Changes in fa i r va lue of financia l assets and l iabi l i ties 4.723 -6.288 RESULT IN FAIR VALUE OF FINANCIAL ASSETS AND LIABILITIES 4.723 -6.288
NET RESULT 11.936 -2.333
per share 1,81 -0,41 26

Consolidated Balance Sheet
Solar Panels Valorisation done based upon NPV Model
Site of Vilvoorde, sold in July
Total debts of EUR 192,7m of which: • EUR 163,1m financial debts (see financial
structure) • EUR 14,6m neg. Variation of heding
instruments (IAS 39) • EUR 7,5m transitory accounts (mainly
relating to invoiced revenues for future periods)
• EUR 7,5m other debts
CONSOLIDATED 30/06/2013 31/12/2012 BALANCE SHEET (EUR) Conso Conso
NON-CURRENT ASSETS 306.234.847 290.212.151 Intangible assets 113.828 129.520 Investment properties 298.373.799 282.208.783 Other tangible assets 7.710.452 7.837.347 Trade receivables and other non-current assets 36.768 36.502 CURRENT ASSETS 15.019.468 20.492.584 Assets held for sale 0 2.225.000 Trade receivables 8.682.349 6.032.623 Tax receivables and other current assets 975.140 829.921 Cash and cash equivalents 1.920.960 9.063.354 Deferred charges and accrued income 3.441.019 2.341.685 TOTAL ASSETS 321.254.315 310.704.734 TOTAL SHAREHOLDERS' EQUITY 128.515.870 128.146.580 Shareholders' equity attributable to shareholders of the parent company 128.418.212 128.047.535 Minority interests 97.658 99.045 LIABILITIES 192.738.445 182.558.154 Non-current liabilities 176.818.602 140.058.081 Current liabilities 15.919.843 42.500.073 TOTAL SHAREHOLDERS EQUITY AND LIABILITIES 321.254.315 310.704.734
27

Topics
1. Montea
2. Portfolio
3. Highlights of 9 months – year 20132013
4. Financial Results Jun 9 months - 2013
5. Financial structure
6. Conclusion & Outlook 2013
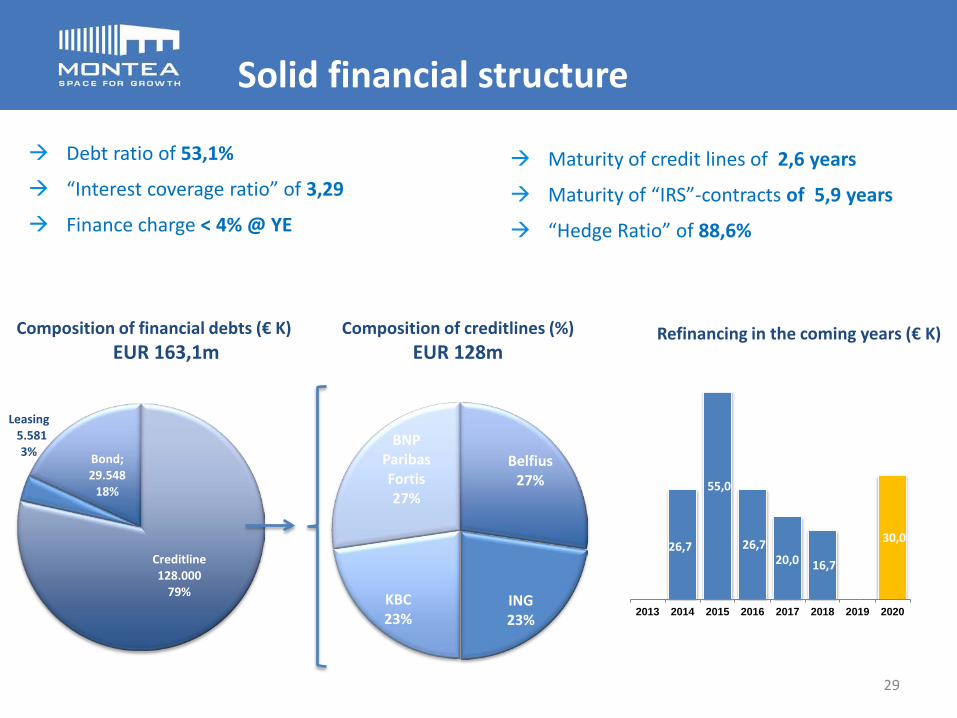
Solid financial structure
Debt ratio of 53,1%
“Interest coverage ratio” of 3,29
Finance charge < 4% @ YE
Creditline128.000
79%
Leasing 5.581
3% Bond; 29.548
18%
Composition of financial debts (€ K) EUR 163,1m
Maturity of credit lines of 2,6 years
Maturity of “IRS”-contracts of 5,9 years
“Hedge Ratio” of 88,6%
26,7
55,0
26,7 20,0 16,7
-
30,0
2013 2014 2015 2016 2017 2018 2019 2020
Refinancing in the coming years (€ K)
Belfius 27%
ING 23%
KBC 23%
BNP Paribas Fortis 27%
Composition of creditlines (%) EUR 128m
29

Topics
1. Montea
2. Portfolio
3. Highlights of 9 months – year 20132013
4. Financial Results 9 months – year 2013
5. Financial structure
6. Conclusion & Outlook 2013

Q3-2013 2012 Q3-2012 2011 2010
Portfolio Value (€m) 305,4 291,5 268,5 254,9 233,0
Occupancy (based upon m²) (%) 93,8 96,3 96,2 96,5 95,1%
Avg. Duration (excl. IAS 39) (y) 5,2 5,6 5,4 5,4 3,5
Yield (%) 8,43 8,25 8,30 8,50% 8,28%
P&L Net Rental Result (€m) 17,4 19,9 14,6 19,3 17,0
Operational Margin (%) 83,7 84,1 86,7 81,5 77,3
Financial Cost (%) 3,72 3,84 4,35 4,59
Net Current Result (€m) 10,07 11,25 8,40 10,24 7,94
Net Current result / share (€) 1,53 2,00 1,49 1,82 1,79
B/S NAV / share (excl. IAS 39) (€) 21,71 22,17 21,58 22,75 23,14
Stock rate (€) 30,08 28,40 27,01 24,52 23,49
Debt Ratio (%) 53,1 51,3 55,3 49,9 47,6
Solid KPI’s
+10%
+14%
+29%
+2%
+15%
+3%
+10%
+10%
+14%
+19%
+20%
+3%
YoY YoY Q3

Evolution of NCR and dividend (€/share)
2,22 2,36
2,08
1,79 1,82
2,00 2,04 1,99 2,09 2,09
1,84 1,84 1,93
2007 2008 2009 2010 2011 2012 2013
Evolution of Net Current Result & Dividend
5,9%
6,8%
8,5%
7,7%
7,5%
6,8%
(1) 1,84 is the add-up of EUR 0,97 per share for the first half of 2010 (before the capital increaese) and EUR 0,87 per share for the 2nd half of 2010 (after the capital increase)
(1)
32

Site Mechelen
“We guarantee a top-quality property portfolio that offers a solid
investment with a diversified risk, profitable growth and a stable
dividend”