Finance and Audit Committee Performance · PDF file · 2017-10-05•Percent of...
9
Board Meeting: October 2017 Data Date: 8/31/17 Safety • Authority Safety Incident Rate • Contractor Safety Incident Rate Cost • Design & Construction Support Cost • Contingency Schedule • Schedule Performance Index (SPI) Quality • Percent of Non-Conformance Reports (NCRs) Resolved Economic Benefits • Disadvantaged/Small/Disabled Veteran/Micro Business Enterprises • All National Targeted Workers • Disadvantaged Workers Finance and Audit Committee Performance Metrics Construction Package 4 Contract No. HSR 14-32 PERFORMANCE METRICS The following performance metrics for Construction Package 4, a design-build project, are intended to give the Authority’s Board of Directors and other key stakeholders a high level overview of the performance of this project. Safety is a top priority and listed first, followed by key metrics for cost, schedule, and quality, as all are fundamental metrics for the management of the project. In addition, and in support of the business aspects of the project, three key metrics are included for economic benefits. The Authority’s management team, both on the project site and at the headquarters in Sacramento, will also review other aspects of the project’s performance. The Authority will track and monitor the trends of these performance metrics to proactively manage the project.
-
Upload
duongkhanh -
Category
Documents
-
view
214 -
download
0
Transcript of Finance and Audit Committee Performance · PDF file · 2017-10-05•Percent of...

Board Meeting: October 2017 Data Date: 8/31/17
Safety
• Authority Safety Incident Rate
• Contractor Safety Incident Rate
Cost
• Design & Construction Support Cost
• Contingency
Schedule
• Schedule Performance Index (SPI)
Quality
• Percent of Non-Conformance Reports (NCRs) Resolved
Economic Benefits
• Disadvantaged/Small/Disabled Veteran/Micro Business Enterprises
• All National Targeted Workers
• Disadvantaged Workers
Finance and Audit Committee Performance Metrics
Construction Package 4
Contract No. HSR 14-32
PE
RF
OR
MA
NC
E M
ET
RIC
S
The following performance metrics for Construction Package 4, a design-build project, are intended to give the Authority’s Board of Directors and other key stakeholders a high level overview of the performance of this project. Safety is a top priority and listed first, followed by key metrics for cost, schedule, and quality, as all are fundamental metrics for the management of the project. In addition, and in support of the business aspects of the project, three key metrics are included for economic benefits. The Authority’s management team, both on the project site and at the headquarters in Sacramento, will also review other aspects of the project’s performance. The Authority will track and monitor the trends of these performance metrics to proactively manage the project.
Finance and Audit Committee Performance Metrics
Construction Package 4
Board Meeting: October 2017 Data Date: 8/31/2017 Contract: HSR 14-32
Data Date: 8/31/17 Page 1 of 8
Performance Metrics
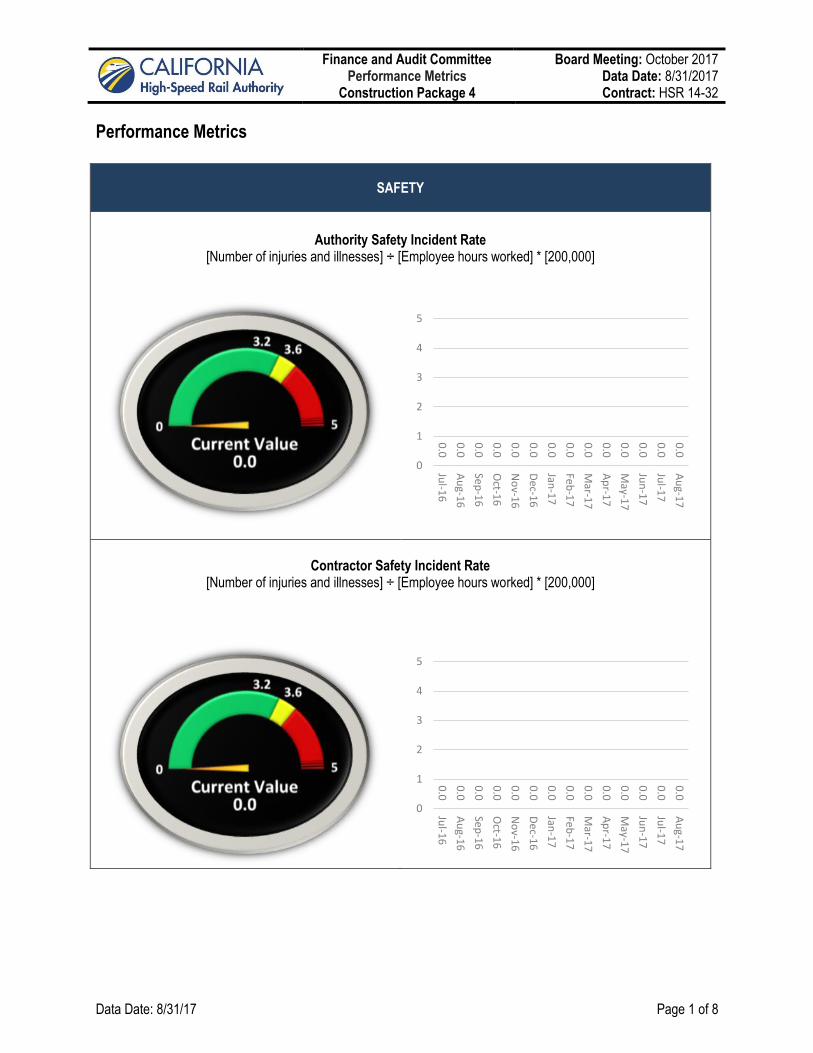
SAFETY
Authority Safety Incident Rate [Number of injuries and illnesses] ÷ [Employee hours worked] * [200,000]
Contractor Safety Incident Rate
[Number of injuries and illnesses] ÷ [Employee hours worked] * [200,000]
0.0
0.0
0.0
0.0
0.0
0.0
0.0
0.0
0.0
0.0
0.0
0.0
0.0
0.0
0
1
2
3
4
5
Jul-1
6
Au
g-16
Sep
-16
Oct-1
6
No
v-16
Dec-1
6
Jan-1
7
Feb
-17
Mar-1
7
Ap
r-17
May-1
7
Jun
-17
Jul-1
7
Au
g-17
0.0
0.0
0.0
0.0
0.0
0.0
0.0
0.0
0.0
0.0
0.0
0.0
0.0
0.0
0
1
2
3
4
5
Jul-1
6
Au
g-16
Sep
-16
Oct-1
6
No
v-16
Dec-1
6
Jan-1
7
Feb
-17
Mar-1
7
Ap
r-17
May-1
7
Jun
-17
Jul-1
7
Au
g-17

Finance and Audit Committee Performance Metrics
Construction Package 4
Board Meeting: October 2017 Data Date: 8/31/2017 Contract: HSR 14-32
Data Date: 8/31/17 Page 2 of 8
COST
Design & Construction Support Cost [Design & Construction Support Cost] ÷ [DB Invoiced to Date Amount]
1. Design & Construction Support Costs (PCM Invoiced to date) = $11,656,053.36 DB Invoiced to date = $59,872,381.99 2. Currently at 19.5%, performance target is < 6%. 3. The Design-Builder production during design has not matched the baseline schedule. As the DB begins
construction in Q4-2017, this value should trend towards the performance target.
COST (Continued)
Contingency [Remaining Contingency Value] ÷ [Remaining Contract Value]
0.0
%
8.9
% 6.2
%
7.1
%
8.3
%
6.7
%
9.5
%
12
.3%
13
.8%
15
.5%
17
.3%
18
.3%
18
.1%
19
.5%
0%
2%
4%
6%
8%
10%
12%
14%
16%
18%
20%
Jul-1
6
Au
g-16
Sep
-16
Oct-1
6
No
v-16
Dec-1
6
Jan-1
7
Feb
-17
Mar-1
7
Ap
r-17
May-1
7
Jun
-17
Jul-1
7
Au
g-17
13
.6%
14
.3%
14
.9%
15
.0%
15
.0%
14
.9%
14
.8%
15
.0%
15
.1%
15
.0%
15
.0%
15
.1%
15
.3%
15
.3%
0%
5%
10%
15%
20%
Jul-1
6
Au
g-16
Sep
-16
Oct-1
6
No
v-16
Dec-1
6
Jan-1
7
Feb
-17
Mar-1
7
Ap
r-17
May-1
7
Jun
-17
Jul-1
7
Au
g-17

Finance and Audit Committee Performance Metrics
Construction Package 4
Board Meeting: October 2017 Data Date: 8/31/2017 Contract: HSR 14-32
Data Date: 8/31/17 Page 3 of 8
SCHEDULE
Schedule Performance Index (SPI) [Earned Value] ÷ [Planned Value]
1. Earned Value = $67,659,110 (Estimate); Planned Value = $159,432,264. 2. Currently at 0.42, performance target is >1.
3. SPI should trend towards 1.0 as Design-Builder submits major design submittals and commence utility relocation and construction work in the 4th quarter.
The SPI figure is based on an earned value estimate through August 2017. Note the Monthly Status Highlight Report will reflect actual contractor’s payment application figure as of June 2017, and not the above shown estimate.
0.5
4
0.8
1
0.8
3
0.8
1
0.8
2
0.8
3
0.7
6
0.7
0
0.6
2
0.5
5
0.4
9
0.4
6
0.4
4
0.4
2
0
0.25
0.5
0.75
1
1.25
1.5
Jul-1
6
Au
g-16
Sep
-16
Oct-1
6
No
v-16
Dec-1
6
Jan-1
7
Feb
-17
Mar-1
7
Ap
r-17
May-1
7
Jun
-17
Jul-1
7
Au
g-17
Finance and Audit Committee Performance Metrics
Construction Package 4
Board Meeting: October 2017 Data Date: 8/31/2017 Contract: HSR 14-32
Data Date: 8/31/17 Page 4 of 8
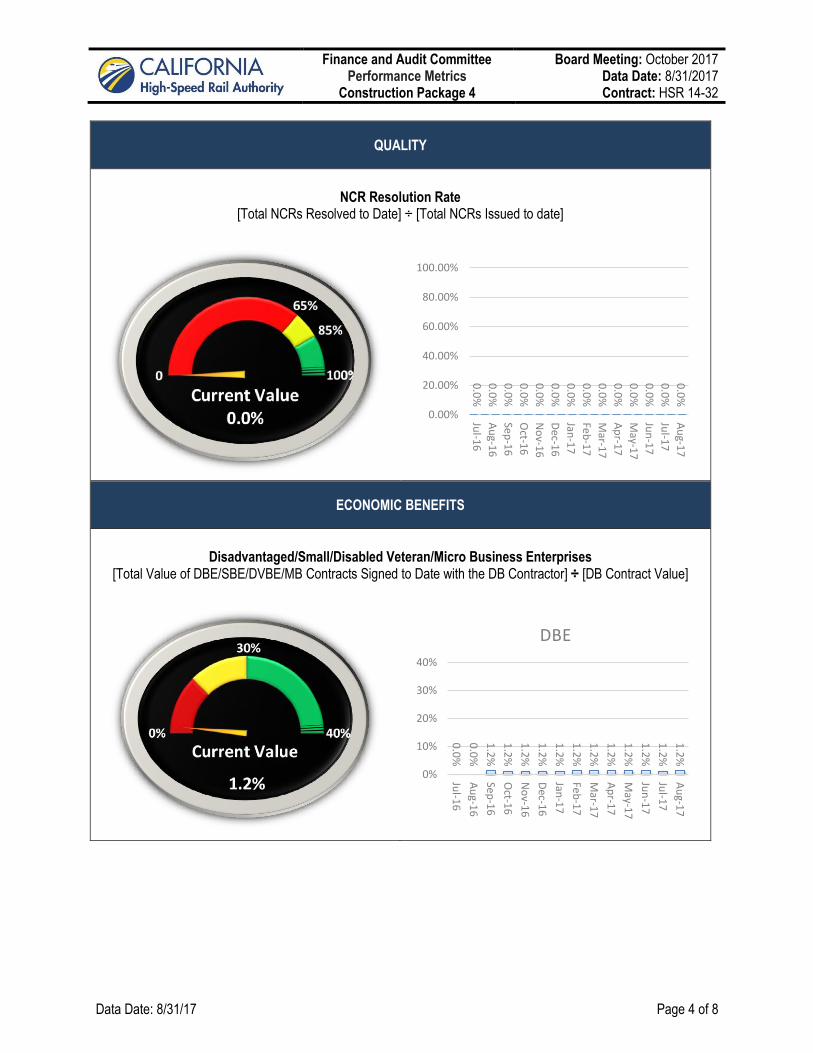
QUALITY
NCR Resolution Rate [Total NCRs Resolved to Date] ÷ [Total NCRs Issued to date]
ECONOMIC BENEFITS
Disadvantaged/Small/Disabled Veteran/Micro Business Enterprises [Total Value of DBE/SBE/DVBE/MB Contracts Signed to Date with the DB Contractor] ÷ [DB Contract Value]
0.0
%
0.0
%
0.0
%
0.0
%
0.0
%
0.0
%
0.0
%
0.0
%
0.0
%
0.0
%
0.0
%
0.0
%
0.0
%
0.0
%
0.00%
20.00%
40.00%
60.00%
80.00%
100.00%
Jul-1
6
Au
g-16
Sep
-16
Oct-1
6
No
v-16
Dec-1
6
Jan-1
7
Feb
-17
Mar-1
7
Ap
r-17
May-1
7
Jun
-17
Jul-1
7
Au
g-17
0.0
%
0.0
%
1.2
%
1.2
%
1.2
%
1.2
%
1.2
%
1.2
%
1.2
%
1.2
%
1.2
%
1.2
%
1.2
%
1.2
%
0%
10%
20%
30%
40%
Jul-1
6
Au
g-16
Sep
-16
Oct-1
6
No
v-16
Dec-1
6
Jan-1
7
Feb
-17
Mar-1
7
Ap
r-17
May-1
7
Jun
-17
Jul-1
7
Au
g-17
DBE
Finance and Audit Committee Performance Metrics
Construction Package 4
Board Meeting: October 2017 Data Date: 8/31/2017 Contract: HSR 14-32
Data Date: 8/31/17 Page 5 of 8
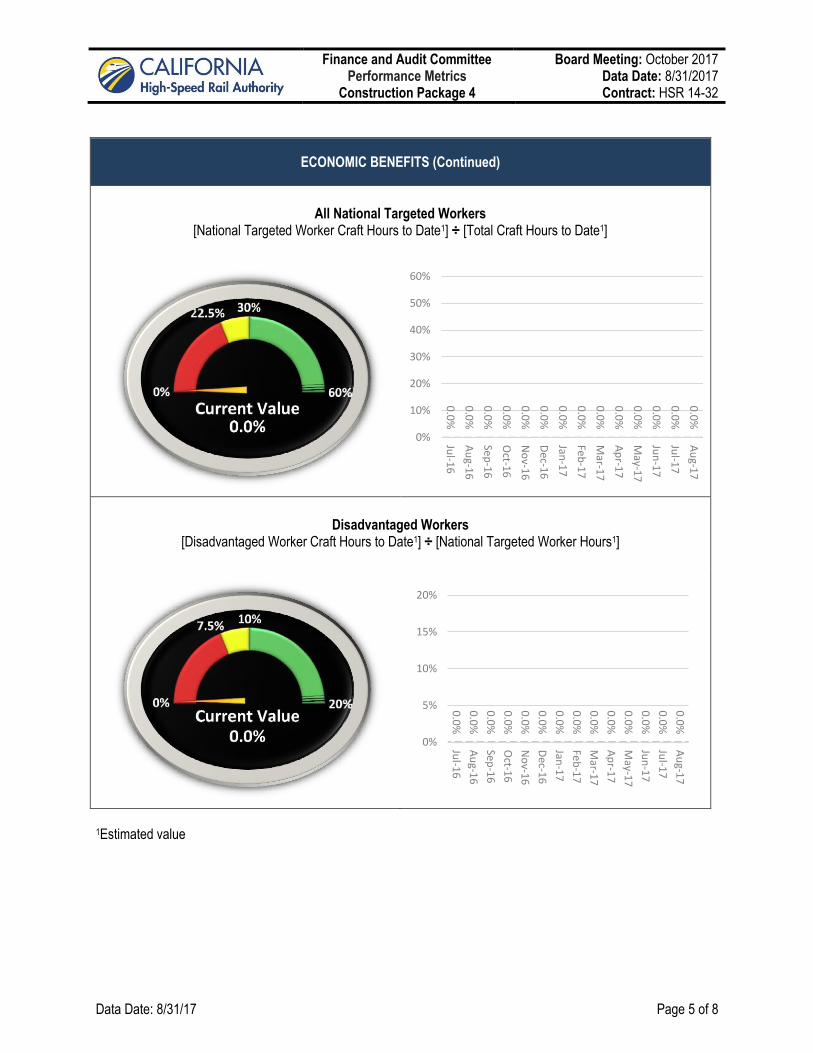
ECONOMIC BENEFITS (Continued)
All National Targeted Workers [National Targeted Worker Craft Hours to Date1] ÷ [Total Craft Hours to Date1]
Disadvantaged Workers [Disadvantaged Worker Craft Hours to Date1] ÷ [National Targeted Worker Hours1]
1Estimated value
0.0
%
0.0
%
0.0
%
0.0
%
0.0
%
0.0
%
0.0
%
0.0
%
0.0
%
0.0
%
0.0
%
0.0
%
0.0
%
0.0
%
0%
10%
20%
30%
40%
50%
60%
Jul-1
6
Au
g-16
Sep
-16
Oct-1
6
No
v-16
Dec-1
6
Jan-1
7
Feb
-17
Mar-1
7
Ap
r-17
May-1
7
Jun
-17
Jul-1
7
Au
g-17
0.0
%
0.0
%
0.0
%
0.0
%
0.0
%
0.0
%
0.0
%
0.0
%
0.0
%
0.0
%
0.0
%
0.0
%
0.0
%
0.0
%
0%
5%
10%
15%
20%
Jul-1
6
Au
g-16
Sep
-16
Oct-1
6
No
v-16
Dec-1
6
Jan-1
7
Feb
-17
Mar-1
7
Ap
r-17
May-1
7
Jun
-17
Jul-1
7
Au
g-17

Finance and Audit Committee Performance Metrics
Construction Package 4
Board Meeting: October 2017 Data Date: 8/31/2017 Contract: HSR 14-32
Data Date: 8/31/17 Page 6 of 8
Performance Metrics – Explanatory Details
Category Description
General Data Period
Description Performance Metrics represent the period up to 8/31/2017
Safety Authority Safety Incident Rate: [Number of injuries and illnesses x 200,000] ÷ [Employee hours worked] *
Description The goal is to contain the incidence rate at ≤ 3.2.
Benchmark: The average incidence rate per the 2012 U.S. Bureau of Labor Statistics, U.S. Department of Labor for heavy and civil engineering construction is 3.2.
Authority (CP 4 Authority and Consultant on-site staff) has zero incidents of recordable injury or illness to date.
The Consultant staff has 65,449.26 hours worked to date. The incidence rate represents the number of nonfatal occupational injuries and illnesses per 100 full-time workers and is calculated as: (N x 200,000) ÷ EH, where N = number of injuries and illnesses EH = total hours worked by all employees during the calendar year 200,000 = base for 100 equivalent full-time workers (working 40 hours per week, 50 weeks per year).
Safety Contractor Safety Incident Rate: [Number of injuries and illnesses x 200,000] ÷ [Employee hours worked]
Description The goal is to contain the incidence rate at ≤ 3.2.
Benchmark: The average incidence rate per the 2012 U.S. Bureau of Labor Statistics, U.S. Department of Labor for heavy and civil engineering construction is 3.2.
Design-Build Contractor (DB) has zero (0) incidents of recordable injury or illness to date.
Design-Build Contractor (DB) has zero construction hours worked to date.
The incidence rate represents the number of nonfatal occupational injuries and illnesses per 100 full-time workers and is calculated as: (N x 200,000) ÷ EH, where N = number of injuries and illnesses EH = total hours worked by all employees during the calendar year 200,000 = base for 100 equivalent full-time workers (working 40 hours per week, 50 weeks per year). (N = 0)
Cost Design & Construction Support Cost: [Design & Construction Support Cost] ÷ [DB Invoiced to Date Amount]
Description The goal is to keep the support cost at ≤ 6%.
Benchmark: Transit Cooperative Research Program (TCRP) Report 138 is an industry resource for understanding soft costs and was sponsored by the FTA. Construction Administration & Management should be in the range of 5% to 6% of construction costs.
The Design & Construction Support Cost encompasses the Project & Construction Management Team (PCM) invoiced to date amount = $11,656,053.36
The DB Invoiced to Date Amount = $ 59,872,381.99

Finance and Audit Committee Performance Metrics
Construction Package 4
Board Meeting: October 2017 Data Date: 8/31/2017 Contract: HSR 14-32
Data Date: 8/31/17 Page 7 of 8
Cost Contingency: [Remaining Contingency Value] ÷ [Remaining Contract Value]
Description The goal is contain the contingency in the range of 10-20%.
Benchmark: As per guidelines by Federal Transit Authority cost for contingency should be in the range of 10% to 20% of construction cost during the 15% - 30% Preliminary Design Report. (Note: The contingency percentage will be adjusted per FTA guidelines as design and construction move forward.)
The Remaining Contingency = [Current Allocated Contingency Amount] – [Executed Change Orders Affecting Contingency] = $2,804,209.51
The Remaining Contract Value = [Revised DB Contract Amount] – [Authority Approved Invoices to Date] = $ 387,178,827.52
Schedule Schedule Performance Index (SPI): Earned Value (EV) ÷ Planned Value (PV)
Description The goal is to achieve SPI ≥ 1, which is same as ≥ 100% when expressed in percent.
Benchmark: As per guidelines by PMI (Project Management Institute, World Wide) the SPI should be ≥ 1 or 100%.
At a value of 100% the Project is forecasted to complete on-time.
EV = Amount invoiced by CRB (For the purpose of this August 2017 report, an estimated value will be used as payment applications for the last five months are pending.)
PV= Planned Value
Planned Value as derived from the Current Baseline Schedule is $159,432,264.58
SPI is 0.42. CRB has not submitted payment applications for July or August 2017, so an estimated “earned value” has been established in these months. See note in SPI box.
Quality Non-Conformance Report Resolution (NCR) Rate: [Total Non-Conformance Reports Resolved to Date] ÷ [Total Non-Conformance Reports Issued to Date]
Description Measures the effective resolution of NCRs based on percentage of NCR corrective actions approved.
The goal is to identify and approve resolution of the NCR as soon as practical.
The target rate is to stay above 85% closed.
This metric is a measure of the resolution rate of non-conforming work issues identified on the project, based on the KPI Standard organization’s Heavy and Civil Engineering Construction definition.
The target rate identified is preliminary and is derived from the professional judgment of multiple construction professionals and NCR data to date. This metric will be measured and trended for refinement throughout the life of the CP 4 project and across multiple High Speed Rail construction packages to develop a performance standard for the High Speed Rail.
Total Non-Conformance Reports Issued to Date: 0
Total Non-Conformance Reports Resolved to Date: 0
Finance and Audit Committee Performance Metrics
Construction Package 4
Board Meeting: October 2017 Data Date: 8/31/2017 Contract: HSR 14-32
Data Date: 8/31/17 Page 8 of 8
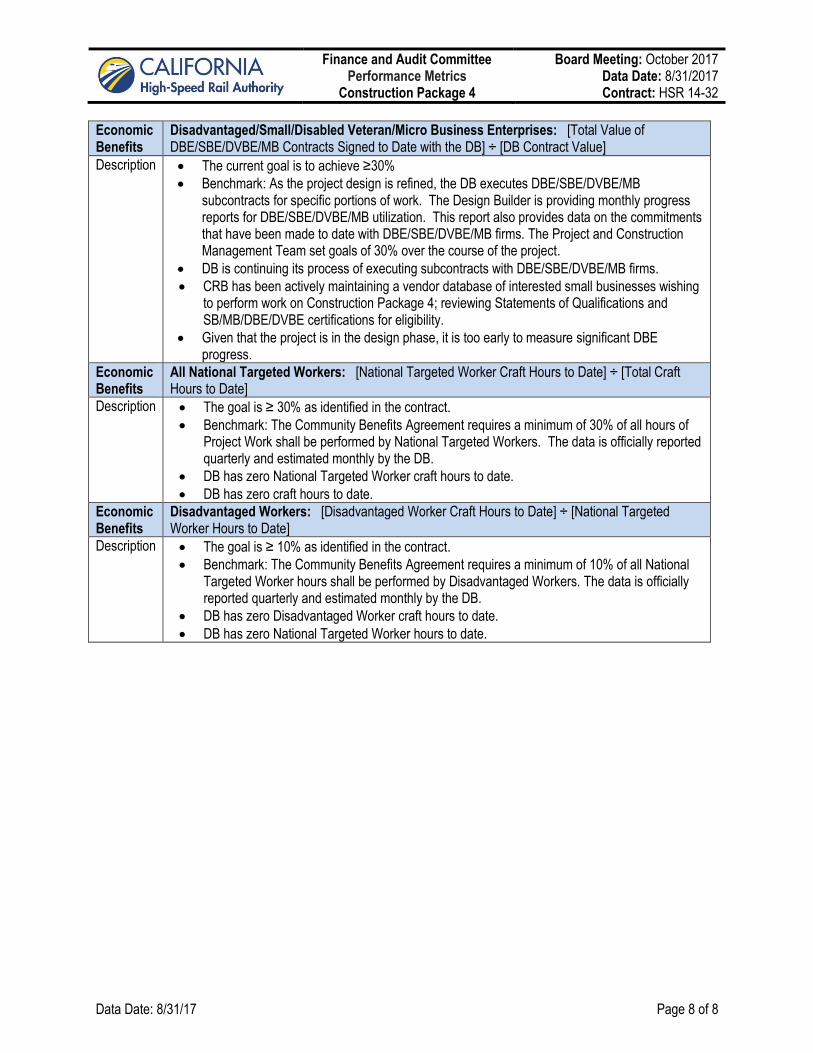
Economic Benefits
Disadvantaged/Small/Disabled Veteran/Micro Business Enterprises: [Total Value of DBE/SBE/DVBE/MB Contracts Signed to Date with the DB] ÷ [DB Contract Value]
Description The current goal is to achieve ≥30%
Benchmark: As the project design is refined, the DB executes DBE/SBE/DVBE/MB subcontracts for specific portions of work. The Design Builder is providing monthly progress reports for DBE/SBE/DVBE/MB utilization. This report also provides data on the commitments that have been made to date with DBE/SBE/DVBE/MB firms. The Project and Construction Management Team set goals of 30% over the course of the project.
DB is continuing its process of executing subcontracts with DBE/SBE/DVBE/MB firms.
CRB has been actively maintaining a vendor database of interested small businesses wishing to perform work on Construction Package 4; reviewing Statements of Qualifications and SB/MB/DBE/DVBE certifications for eligibility.
Given that the project is in the design phase, it is too early to measure significant DBE progress.
Economic Benefits
All National Targeted Workers: [National Targeted Worker Craft Hours to Date] ÷ [Total Craft Hours to Date]
Description The goal is ≥ 30% as identified in the contract.
Benchmark: The Community Benefits Agreement requires a minimum of 30% of all hours of Project Work shall be performed by National Targeted Workers. The data is officially reported quarterly and estimated monthly by the DB.
DB has zero National Targeted Worker craft hours to date.
DB has zero craft hours to date.
Economic Benefits
Disadvantaged Workers: [Disadvantaged Worker Craft Hours to Date] ÷ [National Targeted Worker Hours to Date]
Description The goal is ≥ 10% as identified in the contract.
Benchmark: The Community Benefits Agreement requires a minimum of 10% of all National Targeted Worker hours shall be performed by Disadvantaged Workers. The data is officially reported quarterly and estimated monthly by the DB.
DB has zero Disadvantaged Worker craft hours to date.
DB has zero National Targeted Worker hours to date.