FinalPresentation
23
Weather2020 Haynes Dunn ● Jon Farchmin ● Tyler Haynes ● Alton Phillips ● Sam Simpson
-
Upload
jon-farchmin -
Category
Documents
-
view
63 -
download
0
Transcript of FinalPresentation

Weather2020Haynes Dunn ● Jon Farchmin ● Tyler Haynes ● Alton Phillips ● Sam Simpson
The Essence of Weather2020
The only source capable of producing accurate, long-range forecasts for use by consumers and by business customers.

The 2 Big Problems
• Existing technology is unable to accurately forecast weather events beyond 10 days.• Adverse weather conditions have significant, negative impacts on the
global economy.

The Economic Impact of Bad Weather
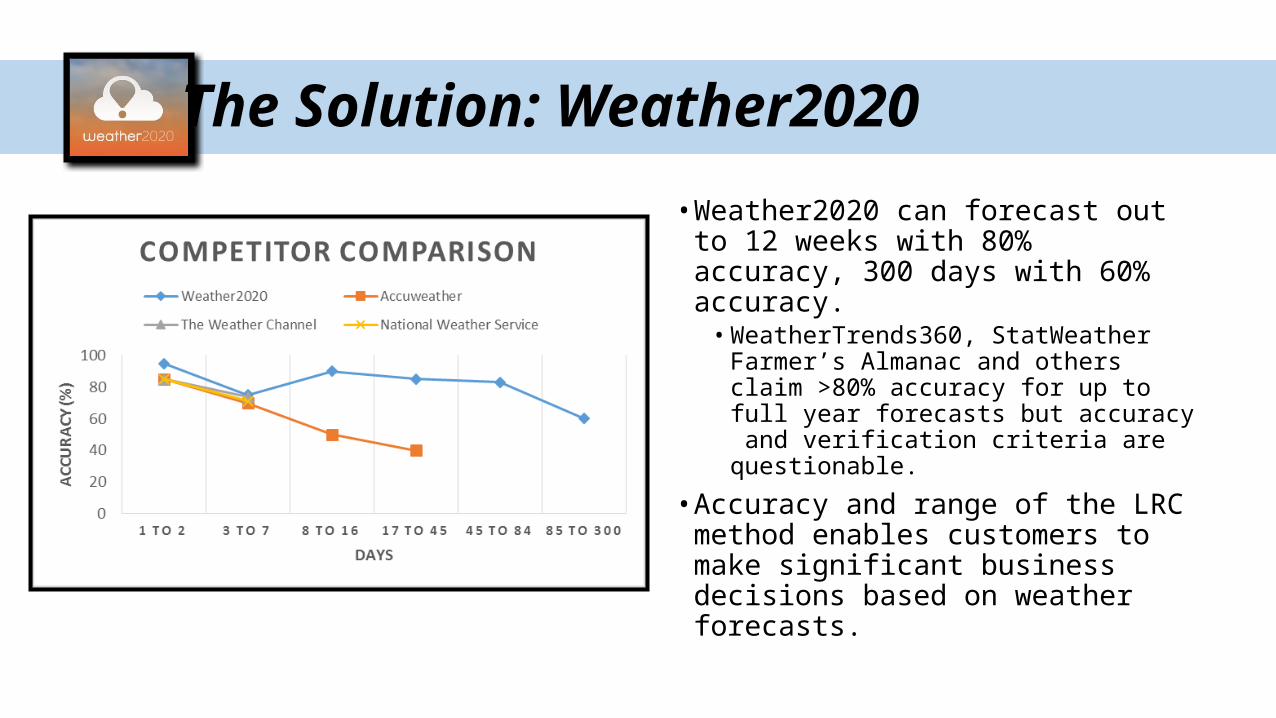
The Solution: Weather2020
• Weather2020 can forecast out to 12 weeks with 80% accuracy, 300 days with 60% accuracy.• WeatherTrends360, StatWeather
Farmer’s Almanac and others claim >80% accuracy for up to full year forecasts but accuracy and verification criteria are questionable.
• Accuracy and range of the LRC method enables customers to make significant business decisions based on weather forecasts.

Who is the Customer?
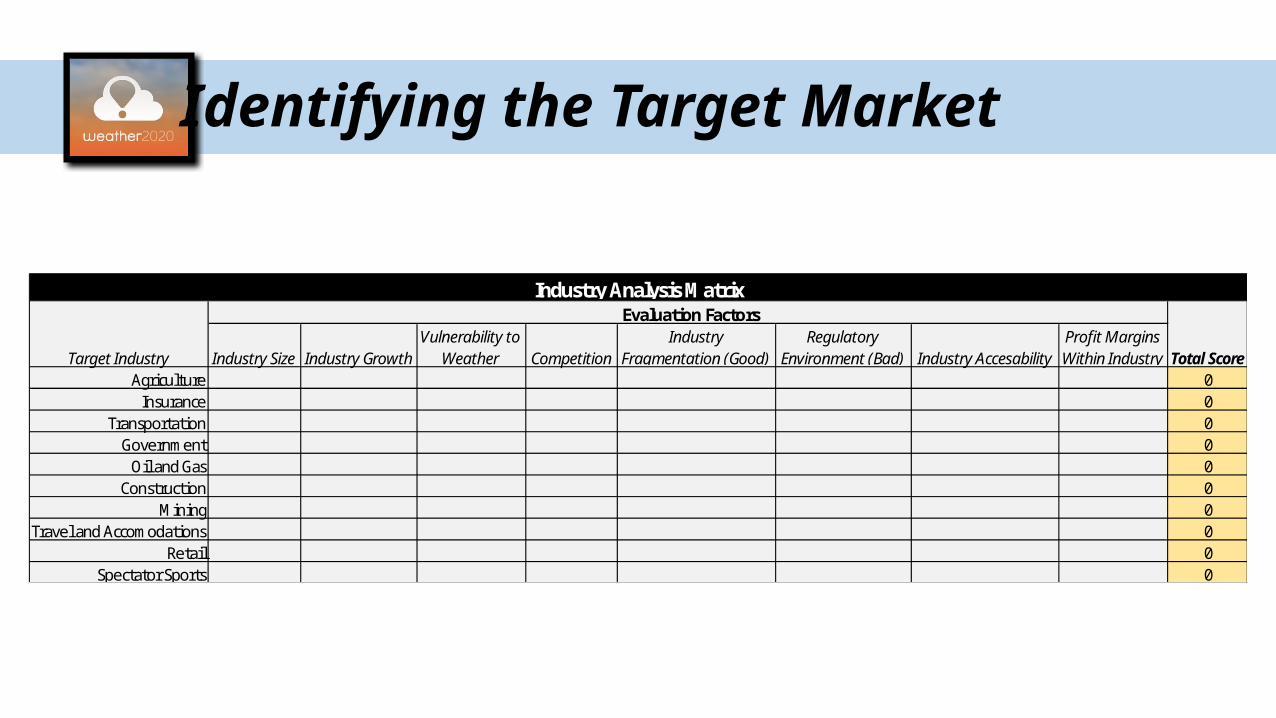
Identifying the Target Market
Target Industry Industry Size Industry GrowthVulnerability to
Weather CompetitionIndustry
Fragmentation (Good)Regulatory
Environment (Bad) Industry AccesabilityProfit Margins Within Industry Total Score
Agriculture 0Insurance 0
Transportation 0Government 0
Oil and Gas 0Construction 0
Mining 0Travel and Accomodations 0
Retail 0Spectator Sports 0
Industry Analysis Matrix Evaluation Factors

Identifying the Target Market
Target Industry Industry Size Industry GrowthVulnerability to
Weather CompetitionIndustry
Fragmentation (Good)Regulatory
Environment (Bad) Industry AccesabilityProfit Margins Within Industry Total Score
Agriculture 3 7 10 10 5 7 9 6 57Insurance 5 5 9 3 8 2 10 4 46
Transportation 2 2 8 7 6 4 8 5 42Government 10 4 3 1 1 1 1 1 22
Oil and Gas 4 10 1 4 3 3 3 7 35Construction 7 3 4 5 9 6 5 9 48
Mining 8 9 2 6 4 5 2 10 46Travel and Accomodations 6 6 5 8 7 8 4 3 47
Retail 9 1 7 2 10 9 6 8 52Spectator Sports 1 8 6 9 2 10 7 2 45
Industry Analysis Matrix Evaluation Factors

• A 200 Billion dollar industry.• Over 2 million farms in the US.
• 97% are family owned.
• 30% of all wheat, corn, and rice on the global market is produced in the US.• Built in sales and distribution channel.
• Crop insurance agents, crop consultants, fertilizer distributors.
• Agriculture is becoming increasingly sophisticated and producers are constantly looking for ways to improve yields and efficiencies.
• While the number of farms has been decreasing in recent years, revenues have been increasing at roughly 3% per year.
• Drought, flood and extreme high and low temperatures can have a significant impact on yields resulting in significant financial loss.
The Agricultural Industry
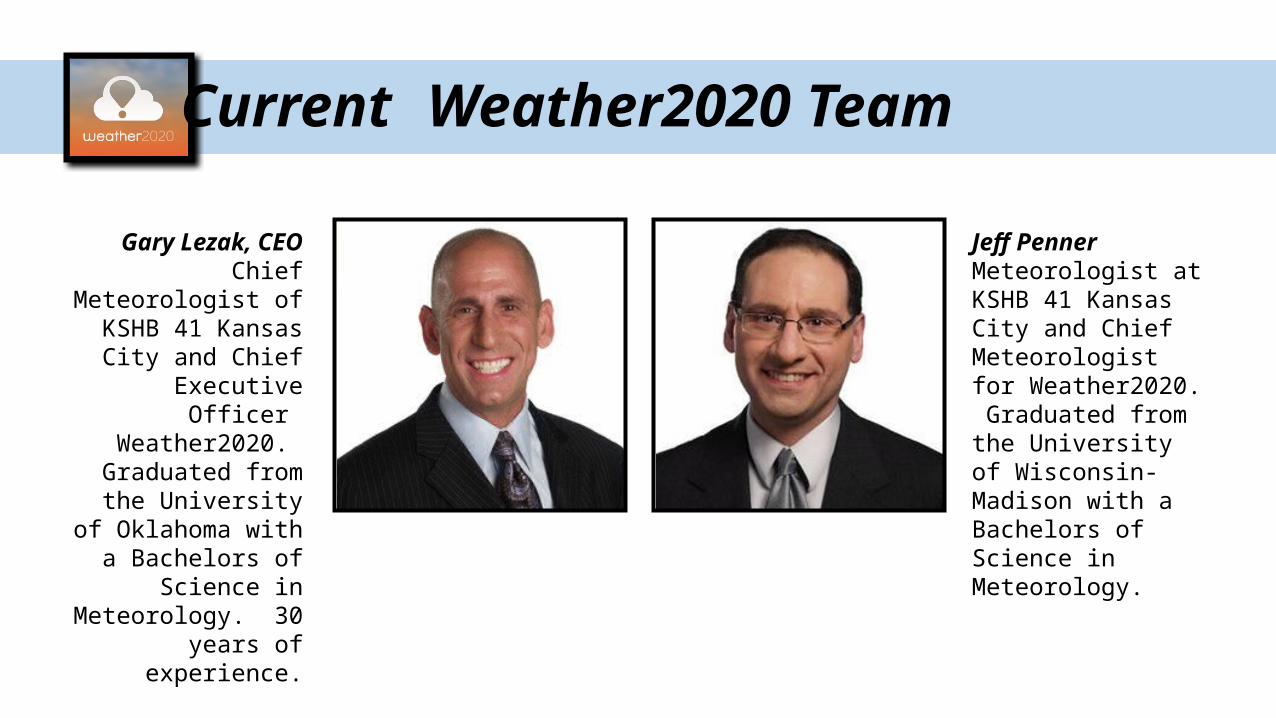
Current Weather2020 Team
Gary Lezak, CEOChief Meteorologist of
KSHB 41 Kansas City and Chief Executive
Officer Weather2020. Graduated from the
University of Oklahoma with a Bachelors of
Science in Meteorology. 30 years of experience.
Jeff PennerMeteorologist at KSHB 41 Kansas City and Chief Meteorologist for Weather2020. Graduated from the University of Wisconsin- Madison with a Bachelors of Science in Meteorology.

Additional Management Proposed
• Bringing in an experienced CEO will:• Add value to Weather2020 • Provide additional creditability to the firm
during the investment seeking process.
• The Chief Development Officer will be responsible for growing and maintaining strong relationships with channel members.
• A team of meteorologists will assist with the forecasting process.
• Customer service representatives will be the main point of contact to customers once they have been acquired by channel members.

• Existing Product Validation:• Super Bowl and Master’s
Tournament Predictions.• High profile, accurate predictions
that contradicted the majority of forecasts.
• Weather2020 has been offering its services to customers for several years.
• Primary/Secondary Research:• Conversations with insurers,
agents, consultants, and equipment providers validated concept within target market.• But, main concern was convincing
consumers of product efficacy.• Proposed 3rd party verification
process to build trust.
Validation of Concept and Product

Business Model Canvas
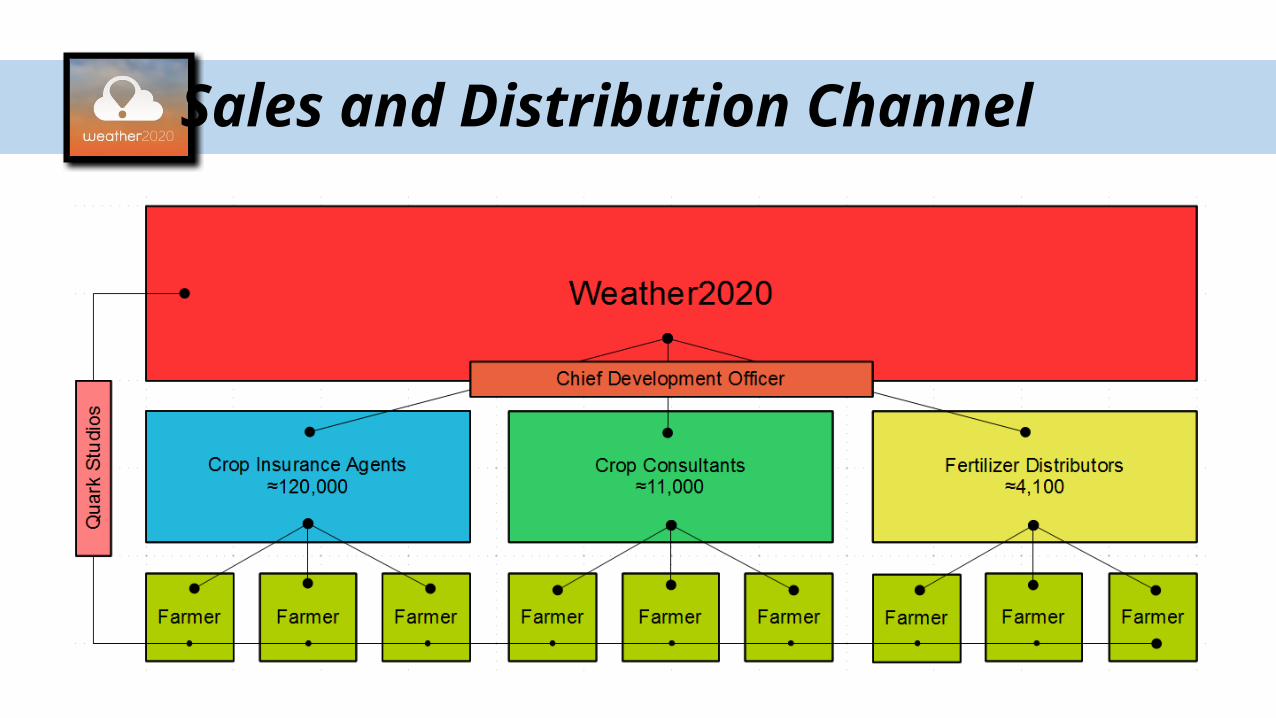
Sales and Distribution Channel

The Customer Buy-In Hurdle
“But the public shouldn’t believe them, because the forecasts aren’t accurate.”
“Forecasting is the art of saying what will happen, and then explaining why it didn’t.”
“It is often said there are two types of forecasts…lucky or wrong!”
“The trouble with weather forecasting is that it’s right too often for us to ignore it and wrong too often for us to rely on it.”
“On cable TV they have a weather channel – 24 hours of weather. We had something like that where I grew up. We called it a window.”
“Like a baseball umpire, a weather forecaster rarely gets credit for getting the call right.”
“Predicting rain is easy. The hard part is predicting when it will rain.”
“How to double the accuracy of a weather forecast, forecast the opposite.”
“Weather forecasting remains an imperfect science.”
“That’s a fact. They’re wrong a lot.”
“There was 100% chance of rain last week and the only water I saw was on the Gatorade table.”

Minimum Viable Product Approach• Customer buy-in problem is an
opportunity to deploy minimum viable product.• Weather2020 currently provides PDF
reports to clientele.• Minimal resources needed to produce
reports.
• Similar reports could be distributed to agricultural clients during the validation process. • As company scales and customers buy
in, product offerings can become more complex

Best Case Scenario: Assume Scaling
Income Statement Distribution
Revenue Pre-Launch Year 1 Year 2 Year 3 Year 4 Year 5Insurance - 816,000 1,632,000 3,264,000 6,528,000 13,056,000 Consultants - 186,660 373,320 746,640 1,493,280 2,613,240 Seed/ Fertilizer - 271,789 543,578 1,087,157 2,174,314 3,805,049
Net Sales - 1,274,449 2,548,898 5,097,797 10,195,594 19,474,289 COGS
# of Meteorologists 5 2 4 5 5 5 Meteorologist 13,333.33 80,000 168,000 220,500 231,525 243,101
Earnings - 1,194,449 2,380,898 4,877,297 9,964,069 19,231,188 Gross Margin (%) - 93.7% 93.4% 95.7% 97.7% 98.8%Operating ExpensesTotal Operating Expenses - (1,059,960) (1,718,908) (2,626,966) (4,321,593) (7,399,237) Taxes - 53,796 264,796 900,133 2,256,990 4,732,780 Net Income - 80,693 397,194 1,350,199 3,385,485 7,099,170 Net Margin - 6% 16% 26% 33% 36%EBITDA - 139,987 664,160 2,252,242 5,644,170 11,833,470 Startup Requirement 490,420

Exit Valuation Metrics: Scaling
2015 2016 2017 2018 2019 Discounted Free Cash Flow
Revenue 1,274,449 2,548,898 5,097,797 10,195,594 19,474,289 Perpetual Discount RateCOGS (80,000) (168,000) (220,500) (231,525) (243,101) Growth Rate 30% 28% 26% 24% 22%
Gross 1,194,449 2,380,898 4,877,297 9,964,069 19,231,188 4% 32,419,172 35,053,875 38,142,524 41,816,779 46,266,008 Operating (1,059,960) (1,718,908) (2,626,966) (4,321,593) (7,399,237) 5% 33,839,309 36,700,412 40,079,076 44,133,846 49,097,002
EBIT 134,489 661,990 2,250,331 5,642,476 11,831,951 6% 35,377,792 38,496,634 42,209,283 46,708,365 52,281,870 D & A 5,498 2,170 1,911 1,694 1,519 7% 37,050,056 40,463,925 44,563,722 49,585,768 55,891,387
EBITDA 139,987 664,160 2,252,242 5,644,170 11,833,470 8% 38,874,344 42,627,944 47,179,765 52,822,847 60,016,550 Taxes 53,796 264,796 900,133 2,256,990 4,732,780 9% 40,872,373 45,019,755 50,103,579 56,491,537 64,776,352
FCF 86,191 399,364 1,352,110 3,387,179 7,100,689
Revenue Multiple EBITDA Multiple
Revenue Revenue Multiple x EBITDA EBITDA Multiple xValue Range 1.00 1.50 2.00 2.50 3.00 Range 2.5 5.0 7.5 10.0 12.5 10,000,000 10,000,000 15,000,000 20,000,000 25,000,000 30,000,000 8,000,000 20,000,000 40,000,000 60,000,000 80,000,000 100,000,000 15,000,000 15,000,000 22,500,000 30,000,000 37,500,000 45,000,000 9,000,000 22,500,000 45,000,000 67,500,000 90,000,000 112,500,000 20,000,000 20,000,000 30,000,000 40,000,000 50,000,000 60,000,000 10,000,000 25,000,000 50,000,000 75,000,000 100,000,000 125,000,000 25,000,000 25,000,000 37,500,000 50,000,000 62,500,000 75,000,000 11,000,000 27,500,000 55,000,000 82,500,000 110,000,000 137,500,000 30,000,000 30,000,000 45,000,000 60,000,000 75,000,000 90,000,000 12,000,000 30,000,000 60,000,000 90,000,000 120,000,000 150,000,000
13,000,000 32,500,000 65,000,000 97,500,000 130,000,000 162,500,000
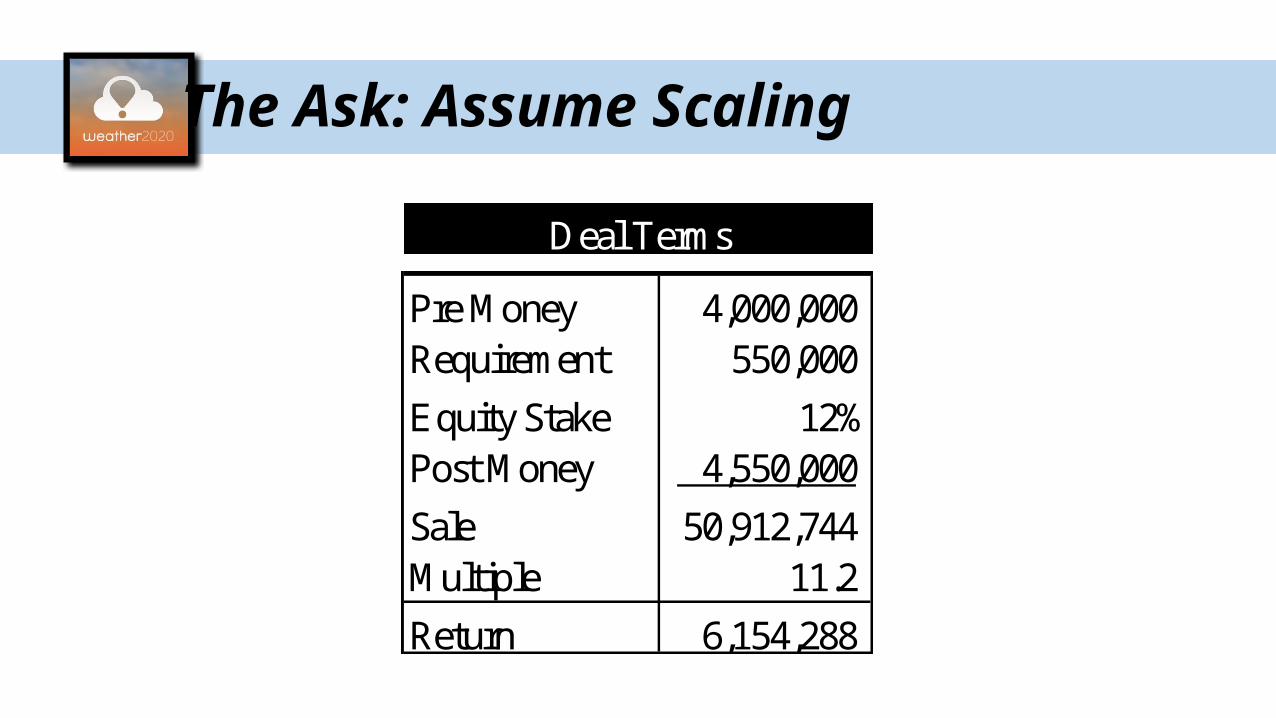
The Ask: Assume Scaling
Deal Terms
Pre Money 4,000,000 Requirement 550,000
Equity Stake 12%Post Money 4,550,000
Sale 50,912,744 Multiple 11.2
Return 6,154,288

Worst Case Scenario: Scaling Not Possible
Income Statement
Revenue Pre-Launch Year 1 Year 2 Year 3 Year 4 Year 5Reports - 714 1,428 2,856 5,712 11,424
Net Sales - 357,000 714,000 1,428,000 2,856,000 5,712,000 COGS
# of Meteorologists - 1 2 3 6 12 Meteorologist 6,667 40,000 84,000 132,300 277,830 583,443
Earnings - 317,000 630,000 1,295,700 2,578,170 5,128,557 Gross Margin (%) - 88.8% 88.2% 90.7% 90.3% 89.8%Operating ExpensesTotal Operating Expenses - (385,324) (581,970) (827,746) (1,354,302) (2,424,815) Net Income - (68,324) 28,818 280,772 734,321 1,622,245 Net Margin - -19% 4% 20% 26% 28%EBITDA - (62,826) 50,200 469,865 1,225,562 2,705,261 Startup Requirement 261,153

Exit Valuation: Scaling Not Possible
2015 2016 2017 2018 2019 Discounted Free Cash Flow
Revenue 357,000 714,000 1,428,000 2,856,000 5,712,000 Perpetual Discount RateCOGS (40,000) (84,000) (132,300) (277,830) (583,443) Growth Rate 30% 28% 26% 24% 22%
Gross 317,000 630,000 1,295,700 2,578,170 5,128,557 4% 7,288,760 7,887,702 8,590,257 9,426,520 10,439,777 Operating (385,324) (581,970) (827,746) (1,354,302) (2,424,815) 5% 7,613,513 8,264,227 9,033,102 9,956,380 11,087,160
EBIT (68,324) 48,030 467,954 1,223,868 2,703,742 6% 7,965,329 8,674,981 9,520,231 10,545,113 11,815,466 D & A 5,498 2,170 1,911 1,694 1,519 7% 8,347,737 9,124,856 10,058,637 11,203,109 12,640,879
EBITDA (62,826) 50,200 469,865 1,225,562 2,705,261 8% 8,764,910 9,619,717 10,656,866 11,943,354 13,584,209 Taxes - 19,212 187,182 489,547 1,081,497 9% 9,221,813 10,166,669 11,325,475 12,782,299 14,672,667
FCF (62,826) 30,988 282,683 736,015 1,623,764
Revenue Multiple EBITDA Multiple
Revenue Revenue Multiple x EBITDA EBITDA Multiple xValue Range 1.00 1.50 2.00 2.50 3.00 Range 2.5 5.0 7.5 10.0 12.5
4,500,000 4,500,000 6,750,000 9,000,000 11,250,000 13,500,000 1,500,000 3,750,000 7,500,000 11,250,000 15,000,000 18,750,000 5,000,000 5,000,000 7,500,000 10,000,000 12,500,000 15,000,000 2,000,000 5,000,000 10,000,000 15,000,000 20,000,000 25,000,000 5,500,000 5,500,000 8,250,000 11,000,000 13,750,000 16,500,000 2,500,000 6,250,000 12,500,000 18,750,000 25,000,000 31,250,000 6,000,000 6,000,000 9,000,000 12,000,000 15,000,000 18,000,000 3,000,000 7,500,000 15,000,000 22,500,000 30,000,000 37,500,000 6,500,000 6,500,000 9,750,000 13,000,000 16,250,000 19,500,000 3,500,000 8,750,000 17,500,000 26,250,000 35,000,000 43,750,000
4,000,000 10,000,000 20,000,000 30,000,000 40,000,000 50,000,000

The Ask: Scaling Not Possible
Deal Terms
Pre Money 2,000,000 Requirement 500,000
Equity Stake 20%Post Money 2,500,000
Sale 13,511,727 Multiple 5.4
Return 2,702,345.50
Thank You