Cognitively Impaired Human, Intelligent Animals, and Legal ...
Does teaching children how to play cognitively
demanding games improve their educational
attainment? Evidence from a Randomised
Controlled Trial of chess instruction in England.
John Jerrim
Lindsey Macmillan
John Micklewright
Mary Sawtell
Meg Wiggins
UCL Institute of Education
May 2017
A number of studies suggest that teaching children how to play chess may have an impact
upon their educational attainment. Yet the strength of this evidence is undermined by
limitations with research design. This paper attempts to overcome these limitations by
presenting evidence from a randomised controlled trial (RCT) involving more than 4,000
children in England. In contrast to much of the existing literature, we find no evidence of an
effect of chess instruction upon children’s mathematics, reading or science test scores. Our
results provide a timely reminder of the need for social scientists to employ robust research
designs.
Key Words: Chess, RCT, educational attainment, England.
The data used in this article can be obtained beginning six months after publication through
three years hence from the Education Endowment Foundation via the UK data achieve.
Author bios: John Jerrim is an Associate Professor in Educational and Social Statistics at
UCL. Lindsey Macmillan is an Associate Professor in Economics at UCL. John Micklewright
is Professor of Economics at UCL. Mary Sawtell is a Research Officer at UCL. Meg Wiggins
is a Senior Research Officer at UCL.
Contact details: John Jerrim ([email protected]) Department of Social Science, UCL
Institute of Education, University College London, 20 Bedford Way London, WC1H 0AL
Acknowledgements: The authors would like to thank the Education Endowment Foundation
for funding this project and Chess in Schools and Communities for their help. They are also
grateful for comments from two reviewers, which have helped to improve this paper in many
ways.
2
1. Introduction
Within the United Kingdom and the United States, there is growing interest in whether
playing “cognitively demanding” games has a positive impact upon young people’s cognitive
development and educational attainment. For instance, recent academic work has suggested
that cognitively demanding digital games and board games can improve young people’s
cognitive ability, visual perception, attention, working memory, executive control, reasoning
and spatial skills, along with overall brain health (Fissler, Kolassa and Schrader 2015). This
has been accompanied by research suggesting that video games such as Portal 2 or Super
Mario 64, and board games such as chess, lead to improved performance in problem solving
and spatial ability tasks, and can even change the function and structure of grey matter within
certain parts of the brain (Kühn et al 2013; Kühn et al 2014; Fissler, Kolassa and Schrader
2015, Shute, Ventura and Ke 2015). It is thought that this will translate into improved
academic outcomes at school, with such possibilities particularly attracting the attention of the
media. For instance, a recent article from the Huffington Post led with a headline “7 ways
video games will help your kids in school”1.
Despite being more than 1,500 years old, chess is a prototypic example of a cognitively
demanding game. It requires concentration, strategy and logical thinking, and for a long time
has been associated with individuals who have higher levels of intelligence and academic
achievement (Frydman and Lynn 1992). But is it that learning how to play chess (and other
cognitively demanding games) has boosted these individuals’ cognitive skills? Or is it rather
that individuals who learn to play cognitively demanding games such as chess have other
favourable characteristics that mean that they also have higher levels of educational
1 See http://www.huffingtonpost.com/kara-loo/7-ways-video-games-help_b_6084990.html

3
attainment? If it is the former, then encouraging young people to play cognitively demanding
games like chess may represent a simple yet effective way for educators to boost young
people’s cognitive achievement. Yet despite a number of studies hinting at a causal link
between learning how to play cognitively demanding games and educational attainment, few
have provided a robust investigation of this issue. The aim of this paper is to provide some
high-quality evidence on this matter. Using chess as an example, we show how the large
effect sizes of chess tuition on attainment reported in the existing literature are not replicated
when a robust research design is used to measure whether there is a lasting effect of learning
how to play this game, when the intervention has been delivered at scale and being played by
children in the real-world.
Our decision to focus upon chess is driven by the fact that a number of previous small-scale
studies have claimed to show a positive association between teaching children how to play
this game and their later achievement on academic tests. This evidence is reviewed in Table 1,
which provides an overview of 24 studies recently included in a meta-analysis investigating
the relationship between chess instruction and children’s academic outcomes (Sala and Gobet
2016). Several studies have reported a strong association between teaching children how to
play chess and their mathematics test scores. The effect sizes reported are mostly positive,
with the final results reporting an average effect size of +0.34 standard deviations. Various
authors of these studies have argued how their findings demonstrate chess to be a ‘valuable
educational tool’ (Aciego et al 2012: 558), that ‘chess training can be a valuable learning aid
that supports acquisition of mathematical abilities’ (Trinchero 2013:2) and that chess is ‘an
effective tool for developing higher order thinking skills’ (Kazemi et al 2012: 372).
These findings may help to explain why an increasing number of educators have shown an
interest in introducing chess instruction into elementary schools. A number of schools in the

4
United States offer chess lessons both within and outside regular school hours. Data from the
2012 Programme for International Student Assessment (PISA) suggests that almost half a
million American 15-year-olds play chess regularly (authors’ calculations). In Armenia,
chess is part of the curriculum for 2nd, 3rd and 4th grade pupils, while Hungary recently
followed suit.2 Venezuela introduced chess lessons into schools as far back as 1989, based
upon a study that suggested chess could increase students’ IQ scores (Ferguson 1995). In this
paper, we present results from a £700,000 study funded by the Department for Education in
England (via the Education Endowment Foundation) to evaluate the impact of chess
instruction upon educational attainment – particularly amongst disadvantaged pupils – within
English elementary schools.
Despite the impressive effect sizes reported in Table 1, most existing studies linking chess
instruction to educational attainment have significant limitations in terms of research design.
First, most research on chess instruction and educational attainment provides evidence of an
association only, and not whether there is a causal effect. Second, most of the studies
previously conducted have either been very small scale (the median sample size of the studies
reported in Table 1 is just 54 children). Third, even amongst the RCTs that have been
conducted, there is some evidence that randomisation may have been compromised (e.g.
Boruch and Romano 2011 reported a non-trivial, statistically significant difference between
treatment and control groups in terms of baseline test-scores). Fourth, even when a
randomised design has been used at a reasonable scale, there have been other significant
threats to validity, particularly surrounding how pupils’ outcomes have been measured at the
end of the intervention. For instance, it was actually the chess tutors who administered the
tests in the study by Boruch and Romano (2011), who note how this is a clear threat to
2 http://www.illawarramercury.com.au/story/3052639/chess-linked-to-academic-achievement/?cs=25

5
validity. Likewise, the outcome test in Trinchero and Sala (2016) was based upon just seven
questions from the PISA test, and were clearly not age appropriate (PISA is a test for 15-year-
old children, yet their sample consisted of elementary school children under the age of 10).
Fifth, all of the existing literature focuses upon the impact of chess on educational attainment
directly after the intervention has finished. Yet what is of greater relevance to policy and
practice is whether teaching children how to play chess has a lasting impact upon their
achievement (i.e. it could be that any immediate impact that is observed simply fades out)3.
These threats to validity are not specific to chess; our reading of the literature is that most
studies into other types of cognitively-demanding games have similar limitations as well.
In this paper, we report the results of a large-scale RCT conducted in England that attempts to
overcome the problems detailed above. As the study uses a randomised design, we are able to
produce a credible estimate of the impact of chess instruction upon children’s educational
attainment. With over 4,000 participants from 100 schools, the trial is both adequately
powered and captures the impact of the programme when implemented across a number of
locations within England. In other words, unlike some psychological experiments, the
intervention has not taken place in a controlled environment, but captures what happens when
chess is taught to children in regular classrooms in the “real world”. We use high-stakes, age
appropriate and externally marked academic tests for schools to measure the effectiveness of
the intervention, meaning our results are unlikely to be influenced by limitations surrounding
the outcome test. Our study focuses upon the impact of chess instruction upon educational
attainment one academic year after the intervention has finished. That is, we concentrate upon
whether there is a lasting effect. This overcomes problems with measuring the impact of
3 Moreover, by testing immediately after the intervention has finished, this could increase the likelihood of
Hawthorne effects.

6
cognitively demanding games generally (and chess interventions specifically) straight after
the programme has finished.
Additional benefits from our design are that all our data have been collected centrally via
children’s administrative records, with almost no attrition. Also, unlike most existing studies,
we also comment upon the likely external validity of our results, and the extent to which they
can be generalised to other settings. In doing so, we believe we provide the most compelling
evidence to date as to whether providing chess instruction to primary school children really
does lead to a significant improvement in their educational achievement.
The paper now proceeds as follows. Section 2 provides further details about the intervention.
A description of the data follows in section 3, with the RCT design described in section 4.
Results are presented in section 5, with a discussion of potential reasons for differences with
the existing literature in section 6. Conclusions follow in section 7.
2. The Chess in Schools and Communities intervention
The intervention was delivered independently of this impact evaluation by the charity Chess
in Schools and Communities (CSC) (www.chessinschools.co.uk/). Although CSC usually
teaches primary school children of all ages how to play chess, this particular study focused
upon pupils in Year 5 (age 9/10).
The CSC programme introduces chess lessons into primary schools as part of the standard
school day, with all children within each class receiving the intervention. This is delivered by
fully trained tutors, and follows a standardised 30-hour curriculum4, consistent with the
“dose” given in the studies reporting a positive effect of chess reviewed in Table 1. Schools
4 Further details can be found at http://www.chessinschools.co.uk/sample_curriculum.htm.
7
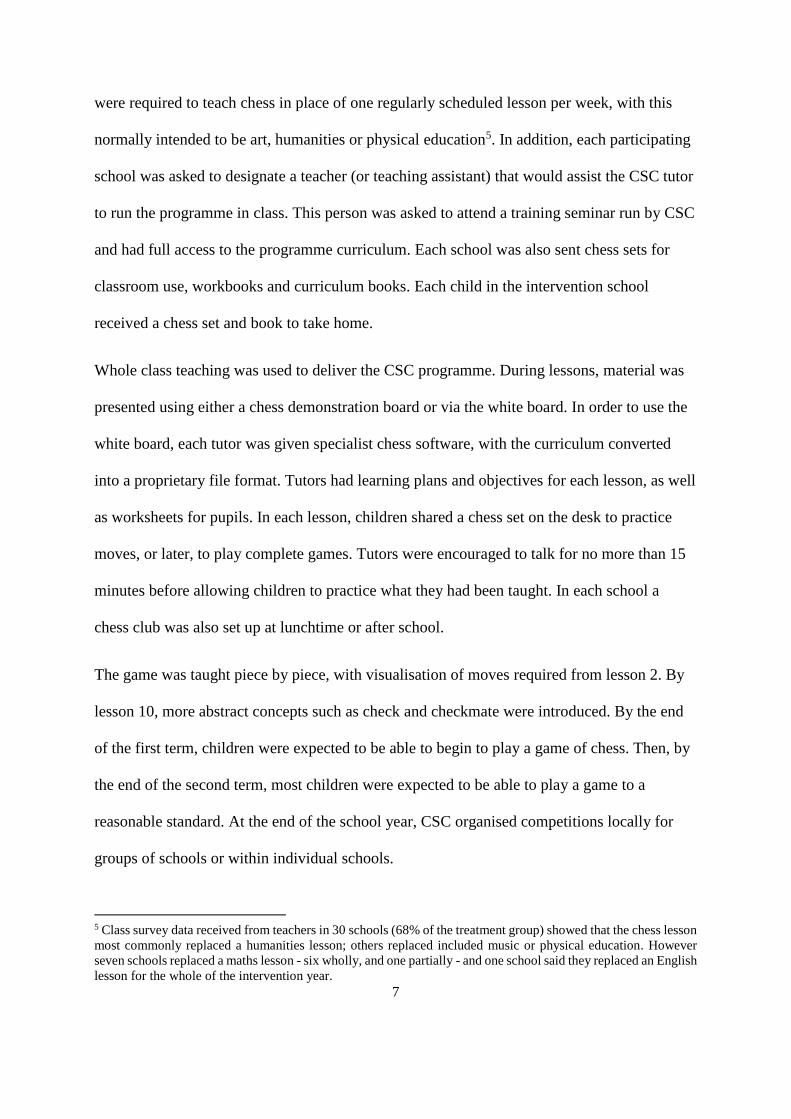
were required to teach chess in place of one regularly scheduled lesson per week, with this
normally intended to be art, humanities or physical education5. In addition, each participating
school was asked to designate a teacher (or teaching assistant) that would assist the CSC tutor
to run the programme in class. This person was asked to attend a training seminar run by CSC
and had full access to the programme curriculum. Each school was also sent chess sets for
classroom use, workbooks and curriculum books. Each child in the intervention school
received a chess set and book to take home.
Whole class teaching was used to deliver the CSC programme. During lessons, material was
presented using either a chess demonstration board or via the white board. In order to use the
white board, each tutor was given specialist chess software, with the curriculum converted
into a proprietary file format. Tutors had learning plans and objectives for each lesson, as well
as worksheets for pupils. In each lesson, children shared a chess set on the desk to practice
moves, or later, to play complete games. Tutors were encouraged to talk for no more than 15
minutes before allowing children to practice what they had been taught. In each school a
chess club was also set up at lunchtime or after school.
The game was taught piece by piece, with visualisation of moves required from lesson 2. By
lesson 10, more abstract concepts such as check and checkmate were introduced. By the end
of the first term, children were expected to be able to begin to play a game of chess. Then, by
the end of the second term, most children were expected to be able to play a game to a
reasonable standard. At the end of the school year, CSC organised competitions locally for
groups of schools or within individual schools.
5 Class survey data received from teachers in 30 schools (68% of the treatment group) showed that the chess lesson
most commonly replaced a humanities lesson; others replaced included music or physical education. However
seven schools replaced a maths lesson - six wholly, and one partially - and one school said they replaced an English
lesson for the whole of the intervention year.
8
A “business as usual” approach was used in control schools. These schools were not allowed
to access the intervention until after the trial had finished and the outcome tests had taken
place.
There are a number of reasons to think that teaching children to play chess will have a
positive impact upon their educational attainment. First, chess might lead to increased logical
thinking and problem solving ability, translating into improvements in mathematics
attainment (Ferguson 1995, Thompson 2003). In addition, being taught how to play chess
may help children to understand and explain complex ideas, promoting their academic
achievement in a range of areas (Ferguson 1995, Dauvergne 2000, Margulies 1992). Chess
may also have a positive effect on children’s non-cognitive skills by improving their levels of
concentration, motivation, perseverance and self-control (Margulies 1992, Dauvergne 2000,
Gobet and Campitelli, 2006).
Several important implications stem from this. Despite much of the existing literature
focusing upon children’s achievement in mathematics, it is clear that there could be wider
impacts across several academic domains. Therefore, while mathematics achievement is the
primary outcome for this evaluation, we also consider the impact of chess instruction upon
children’s reading and science scores. Moreover, quantile regression is also used to
investigate the impact of chess instruction across the distribution of attainment. We also
explore whether the intervention may be particularly effective for certain sub-groups, such as
by gender and for children from low income backgrounds, who tend to have lower-levels of
self-confidence and more behavioural problems than other groups (Blanden et al. 2007).
These sub-groups were specified in advance in our pre-trial analysis plan.

9
3. Data
Overview
Our data are from a clustered randomised controlled trial (RCT) of the CSC programme in
England. The trial was pre-registered at the independent ISRCTN website with a fully pre-
specified analysis plan.6 It was conducted during the 2013/14 academic year, and involved a
total of 4,009 pupils from 100 primary schools (50 treatment and 50 control). This sample
size was chosen in order for us to be able to detect an effect of least 0.20 standard deviations,
consistent with the impact other studies of chess have found (see Table 1). Full details of the
power calculations are provided online (see Appendix A). In England, pupils attend primary
school from age 5 to 11, spending the first three years working towards Key Stage 1
assessments, taken at the end of Year 2 (age 6/7). Then, for the next four years (from age 7 to
11) children work towards Key Stage 2 assessments taken at the end of Year 6 (at age 10/11).
Key Stage 2 assessments are external tests, used by schools and regulators to track individual-
level and school-level performance. This is the main outcome in this work, while Key Stage 1
tests are used as baseline controls to improve statistical power. Data for both tests are
available from administrative records, the National Pupil Database (NPD), for all pupils in
state schools. We standardise the test scores to mean 0 and standard deviation 1, with our
results therefore presented as z-scores.
All Year 5 (age 9/10) pupils within treatment schools were taught using the CSC approach.
Control schools were asked to proceed with ‘business as usual’, meaning they would not
6 See http://controlled-trials.com/ISRCTN33648117 and
http://educationendowmentfoundation.org.uk/library/chess-in-schools-protocol/
10
introduce chess lessons into their school curriculum during the trial period, and would
otherwise operate as they had in previous years.
Recruitment
A total of 11 Local Education Authorities (LEA) in England were purposefully selected by
CSC where they had capacity to deliver the intervention. These were Hackney, Hammersmith
and Fulham, Newham, and Southwark in Inner London together with Bristol, Leeds,
Liverpool, Middlesbrough, Sefton (Merseyside), Sheffield and Tameside (Manchester).
To enable us to produce a well-defined population for the charity to sample from, we began
by considering all primary schools within these 11 LEAs. We excluded private schools and
those state schools already receiving the CSC programme. As the trial funders were
particularly interested in the potential impact of chess instruction upon children from low
income backgrounds, we further restricted the population of interest to schools with a high
proportion of pupils who were eligible for Free School Meals (FSM). This is a benefit for
low-income families and is a measure of socio-economic disadvantage often used in the UK.
Specifically, at least 37 percent of children in the school had to have been eligible to receive
FSM in the last six years.7 The population of interest was therefore defined as Year 5 state
school pupils within the selected LEAs in England, who attended a school with a high
proportion of disadvantaged pupils, and whose school were not currently enrolled in the CSC
programme.
After setting these criteria, the population of interest included a total of 442 schools. CSC
were then asked to recruit 100 of these schools. CSC sent all 442 schools an information
7 The cut-off of 37 percent was chosen in order for the population of interest to include approximately 450
schools which the CSC charity could then recruit from.
11
pack. Those that agreed to take part in the trial completed a consent form to participate in the
study and to allow access to NPD data prior to randomisation. 100 schools were recruited into
the trial (akin to a response rate of 23 percent).
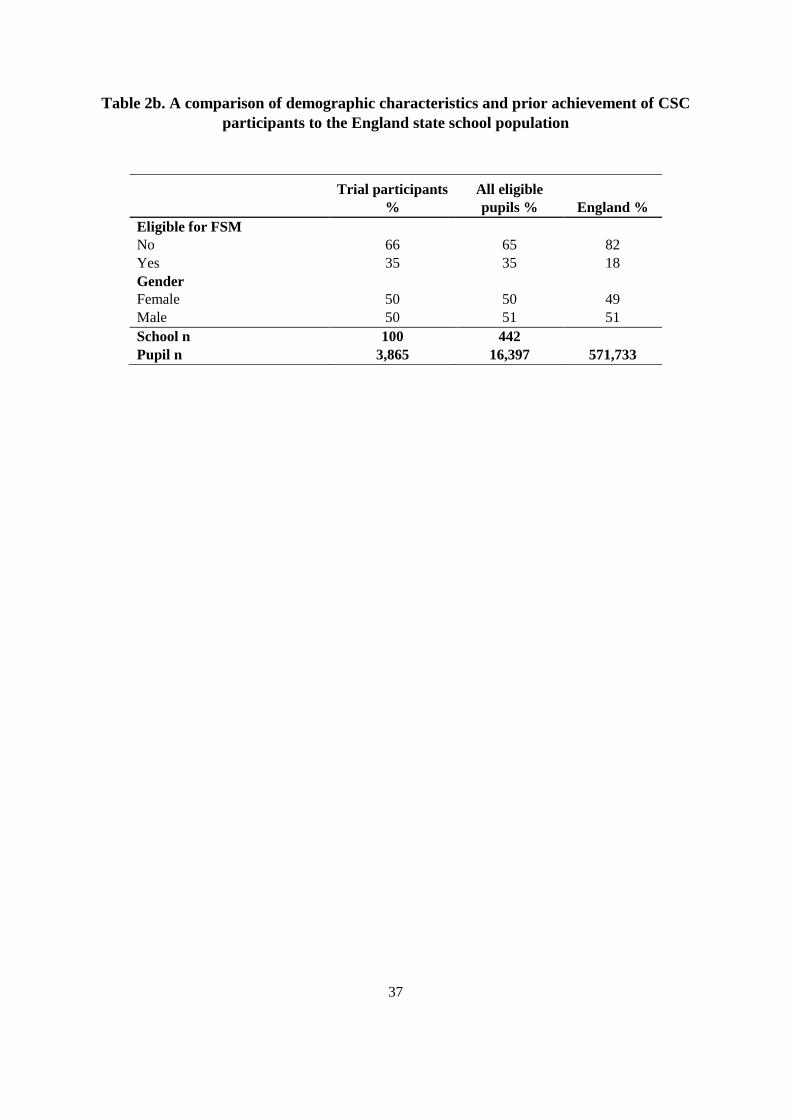
How does the sample of pupils from the 100 participating schools compare to children in the
population of 442 eligible schools in terms of observable characteristics? And how does this
compare to the state school population of England as a whole? Tables 2a and 2b provide some
insight into these issues and thus the likely external validity of the trial.
<< Table 2a >>
<< Table 2b >>
The percentage of children reaching each Key Stage 1 performance level is very similar
across the ‘trial participants’ and ‘eligible’ samples. For instance, in mathematics 12% of
pupils achieved at level 1, approximately 20% at level 2C, 30% at level 2b, 24% at level 2A
and 12% at level 3. This holds true across both the ‘participants’ and ‘all eligible pupil’
groups. Similar findings hold for Key Stage 1 reading, writing and science test scores. Indeed,
standardised Key Stage 1 average point scores differ by less than 0.01 standard deviations
between the trial participants and all pupils who were eligible for the intervention. In terms of
other demographic characteristics, there are slightly fewer children with English as an
Additional Language (EAL) amongst trial participants (34%) than in the eligible population
(37%). London is over-represented compared to the LEAs from outside the capital – in total
51% of trial participants come from the four London LEAs compared to 39% of all eligible
pupils. However, with this exception, differences between all children who were eligible to
receive the intervention and participating pupils are small in terms of magnitude. Overall,
Table 2a and Table 2b suggest that the sample of schools/children recruited to participate in

12
the trial was broadly representative of the population that the study was designed to represent.
The external validity of the trial, judged in this way, seems to be high.
Yet, given the sample design, Tables 2a and 2b also illustrate how there are more low
achievers and more children from low income backgrounds enrolled in the trial sample and in
the trial’s target population than in England as a whole. Hence we cannot say that the schools
recruited into the study are typical of all schools/pupils in England. Rather, they are
somewhat lower achieving and more socio-economically disadvantaged.
Attrition and crossover / non-compliance
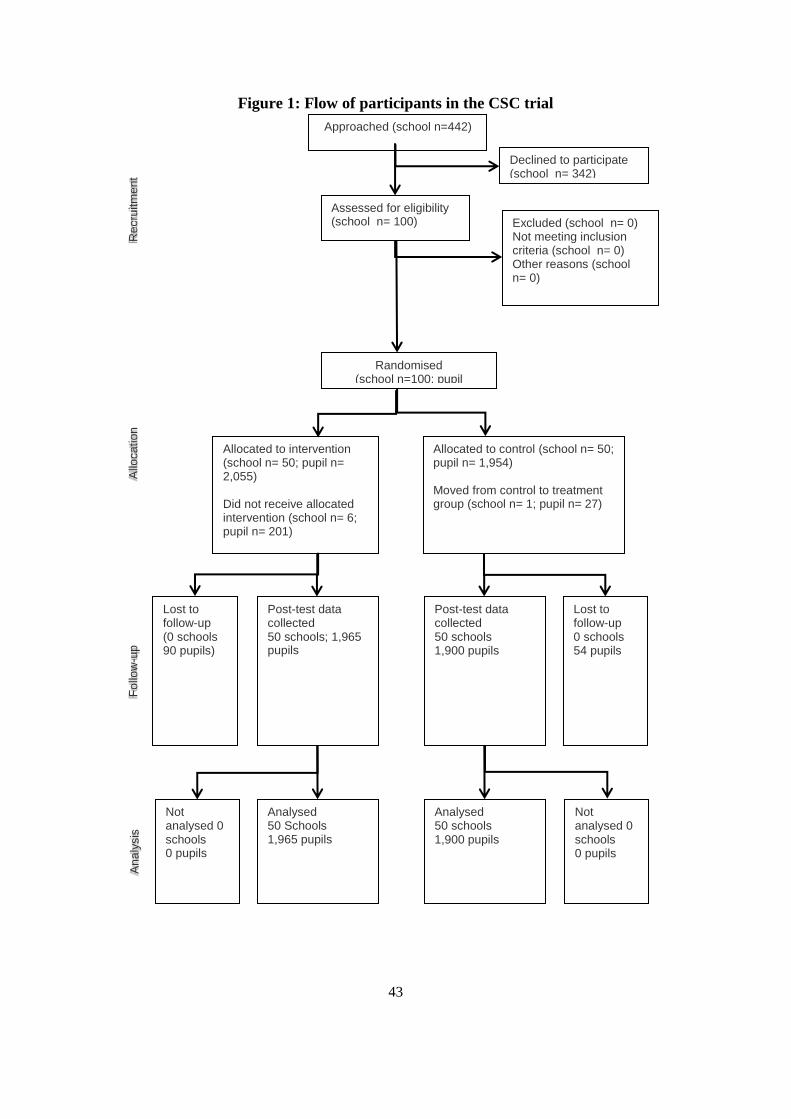
Figure 1 traces schools and their pupils from recruitment into the trial through to the final
analysis. A total of 100 schools with 4,009 pupils were initially recruited to the take part.
These schools were separated into ten strata defined by historical achievement in national
examinations and the proportion of pupils eligible for free school meals. Half of the schools
within each stratum were then randomly allocated to receive the CSC programme, while the
other half were randomly allocated to the control group. This resulted in 50 schools
(containing 2,055 pupils) receiving the CSC treatment and 50 schools (containing 1,954
pupils) acting as the ‘business as usual’ controls. Post-randomisation, six out of the 50
treatment schools (containing 201 pupils) dropped out of the CSC programme before the
intervention had begun. Moreover, one school was unwilling to accept their random
allocation to the control group, and delivered chess lessons to its 54 pupils. Hence there was a
small amount of non-compliance, though at a level that is unlikely to significantly affect the
key conclusions drawn from the trial. (See the results section for further details).
<< Figure 1 >>

13
All schools and pupils initially enrolled into the study have been tracked via the NPD.
Consequently, missing post-test data due to attrition from the study is extremely low.
Specifically, for the 4,009 children initially enrolled, Key Stage 2 mathematics scores (the
primary post-test outcome) are available for 3,865 (97 percent) pupils. Hence, even the small
number of schools/pupils who did not comply with their initial random allocation can be
included in the final analysis on an Intention-To-Treat (ITT) or Local Average Treatment
Effect (LATE) basis (see below for further details).
Implementation and fidelity
In addition to the quantitative impact evaluation, a complementary process evaluation was
also conducted. Full details can be found in Jerrim et al (2015).
On the whole, the CSC programme was successfully implemented and well-received within
the intervention schools. Teachers were positive about many aspects of the programme, while
children reported high levels of enjoyment with respect to the chess lessons. For instance, 92
percent of pupils said they liked the chess lessons ‘a little’ or ‘a lot’, with only 8 percent
reporting that they did not like them. This is further supported by the fact that many children
were continuing to play chess seven months after the intervention had finished. In particular,
around 40 percent of pupils in intervention schools reported playing up to three games of
chess per month, and 28 percent playing at least once a week.
In support of theories as to why chess may improve attainment, such as the theory of change
(see Jerrim et al 2015), most teachers thought that the chess lessons had boosted children’s
self-confidence, levels of concentration and their ability to think critically. A good proportion
of teachers also believed that this would translate into a tangible impact upon children’s
educational achievement. With respect to mathematics, around half of responding teachers
14
thought that the programme would have some positive benefit for children’s achievement,
while around a quarter of teachers thought the impact would be large.
There were a few departures from the intended delivery of the intervention within some
schools. First, due to a slight delay to the start of the intervention, only one-third of schools
received the full 30 hours of chess lessons, with the vast majority receiving between 25 and
29 hours instead (which is still around the median number of hours received within trials
included in the Sala and Gobet 2016 meta-analysis). Second, although most schools removed
an art or humanities lesson to make room for the chess lessons as intended, seven intervention
schools substituted chess for one of their weekly mathematics lessons. In the sub-sections that
follow, we have tested the robustness of all our estimates to excluding these schools from the
analysis, and find that this leads to little change in our substantive results. Finally, although
all regular class teachers were expected to attend a one-day training session about the CSC
programme, only around one-in-three took up this opportunity. Consequently, some class
teachers may have been less prepared at the start of the intervention than they could have
been8.
In summary, the overall implementation of the CSC programme was generally quite good,
though with some discrepancies in terms of total contact time, the lesson substituted, and the
training the regular class teacher received. Schools, teachers and pupils were nevertheless
typically engaged and enthusiastic about the programme, with many reporting being able to
see the positive benefits of it.
Outcome measures
8 In our analysis, we investigated whether the intervention was more effective in schools where the class teacher
attended the training session. There was no evidence that this was the case.
15
The tests used as outcome measures were selected by us after discussion with the trial funders
(the Education Endowment Foundation) and CSC. It was decided that the primary outcome of
the trial would be children’s scores on their Key Stage 2 mathematics exam. This has a
number of advantages over measures that have previously been used to evaluate the impact of
chess upon children’s achievement. First, it is a ‘high-stakes’ examination for schools which
is externally marked and moderated by individuals who have no vested interest in the results
of the trial. This is in stark contrast to existing trials that almost exclusively rely on low-stakes
tests, in some cases delivered by the Chess tutors (e.g. Romano 2011). Second, we are able to
draw this information directly from the NPD, meaning our study is almost completely free
from missing data. Finally, this test took place one year after the CSC intervention had
finished. We see this as an important strength of this measure, as it means our focus is upon
lasting effects of chess instruction on children’s educational attainment. This is in contrast to
the existing literature, which has almost exclusively concentrated on measuring effects
directly after a chess-related intervention has finished.
We also consider children’s outcomes in their Key Stage 2 (age 11) English tests and science
level. While children’s English and mathematics outcomes are based upon performance in an
externally marked national examination, science scores are based upon their teacher’s
judgement.
Balance at baseline
Table 3 compares the characteristics of children in treatment and control schools before the
CSC intervention took place. The distribution of pre-test (Key Stage 1) reading, writing and
mathematics scores is very similar across the treatment and control groups, with differences at
any given level typically just one or two percentage points and not statistically significant at

16
even the 10% level. There are also broadly similar proportions of boys and girls in the two
arms of the trial. There are slightly more children eligible for FSM in the control group (36
percent) than in the treatment group (33 percent) but this difference is not statistically
significant (p = 0.25). Overall, this suggests that the sample is well-balanced in terms of both
prior academic achievement and children’s demographic characteristics.
<< Table 3 >>
4. Methods
Overall effectiveness
Our primary analysis is conducted on an ‘intention-to-treat’ (ITT) basis. Specifically, the
impact of the programme is estimated via the following OLS regression model:
𝑌𝑖𝑗𝑃𝑜𝑠𝑡 = 𝛼 + 𝛽. 𝑇𝑟𝑒𝑎𝑡𝑗 + 𝛾. 𝑌𝑖𝑗
𝑃𝑟𝑒 + 𝛿. 𝐶𝑖𝑗 + 휀𝑖𝑗 (1)
where:
𝑌𝑝𝑜𝑠𝑡 = child i in school j’s post-trial (Key stage 2) score
𝑌𝑝𝑟𝑒 = child i in school j’s baseline (Key stage 1) test score
Treat = a binary variable indicating whether the child was enrolled in a school assigned to the
treatment or control group (0 = control; 1 = treatment).
C = baseline (pre-treatment) controls for other pupil characteristics (gender and FSM).
ԑ = error term
i = child i
j = school j

17
To allow for the fact that the programme was a school level intervention and that there is
clustering of pupils within schools, all reported standard errors are estimated using the Huber-
White adjustment, clustered at the school-level. The coefficient of interest from equation (1)
is 𝛽. This measures the impact of the CSC programme on children’s Key Stage 2 (post-test)
scores. In the results section that follows, we also provide results using the simple difference
in mean scores between treatment and control groups.
Alternative estimates adjusting for non-compliance
As noted above, this RCT was subject to a small amount of non-compliance. Specifically, six
schools and 201 pupils (out of a total of 50 school and 1,965 pupils) moved from the
treatment to control condition post-randomisation. Moreover, one control school containing
54 pupils managed to partially gain access to the treatment. To test the robustness of our ITT
results, we also present “Local Average Treatment Effect” (LATE) estimates. This is
essentially an instrumental variable (IV) approach, where initial treatment/control allocation
is used as an IV for actual receipt of the intervention. It thereby ‘corrects’ the ITT estimate of
the treatment effect for the non-compliance of some schools.
We implement the LATE analysis via Two-Stage Least Squares (TSLS). A first stage model
is estimated, where treatment receipt is regressed upon initial random allocation:
𝑇𝑟𝑒𝑎𝑡𝑚𝑒𝑛𝑡 𝑅𝑒𝑐𝑒𝑖𝑝𝑡𝑗 = 𝛼1 + 𝛽1. 𝑇𝑟𝑒𝑎𝑡𝑚𝑒𝑛𝑡 𝐴𝑙𝑙𝑜𝑐𝑎𝑡𝑖𝑜𝑛𝑗 + 휀1 (2)
where:
Treatment Receipt = a binary indicator of whether the school actually received the CSC
programme.

18
Treatment Allocation = a binary indicator of whether the school was initially randomly
assigned to receive the programme.
Predicted values of school’s treatment receipt are then generated from Equation 2 (�̂�). These
are then entered into the second stage of the model:
𝑌𝑖𝑗𝑃𝑜𝑠𝑡 = 𝛼2 + 𝛽2. �̂�𝑗 + 휀2 (3)
where:
�̂�𝑗= Predicted values of school’s treatment status based upon the first stage regression model.
The parameter 𝛽2̂ then gives the estimated impact of the CSC programme, accounting for the
small amount of cross-over (non-compliance) between treatment and control groups.
Heterogeneous effects
The model presented in equation (1) has specified a common programme effect; that the
impact of the CSC intervention will be the same across different groups of children and across
different types of school. Yet the impact of the programme may vary between children with
different characteristics (e.g. boys and girls), and between how the intervention was
implemented within schools. We therefore present evidence on possible heterogeneous effects
in two ways. First we investigate whether impacts varied between genders and by FSM
eligibility. Second, we examine possible heterogeneity across the achievement distribution.
While we are unable to directly observe non-cognitive outcome measures, evidence suggests
that children from low income families and those at the bottom of the achievement
distribution tend to have lower concentration and self-esteem (Blanden et al. 2007); skills that
previous literature has suggested may be improved by playing chess. By looking across sub-
groups and across the distribution of achievement, this allows us to test whether the

19
intervention has a larger impact upon pupils that are likely to have more disruptive behaviour,
lower concentration, lower self-esteem and less persistence. Conversely, it may be the case
that chess enables high achieving pupils to build on their logic and critical thinking skills,
improving their performance even further. Such effects would be missed by an investigation
of mean outcomes alone. Therefore, to capture potentially important and interesting effects
away from the mean, we re-estimate equation (1) using quantile regression.
5. Results
Impact of the CSC programme on mathematics attainment
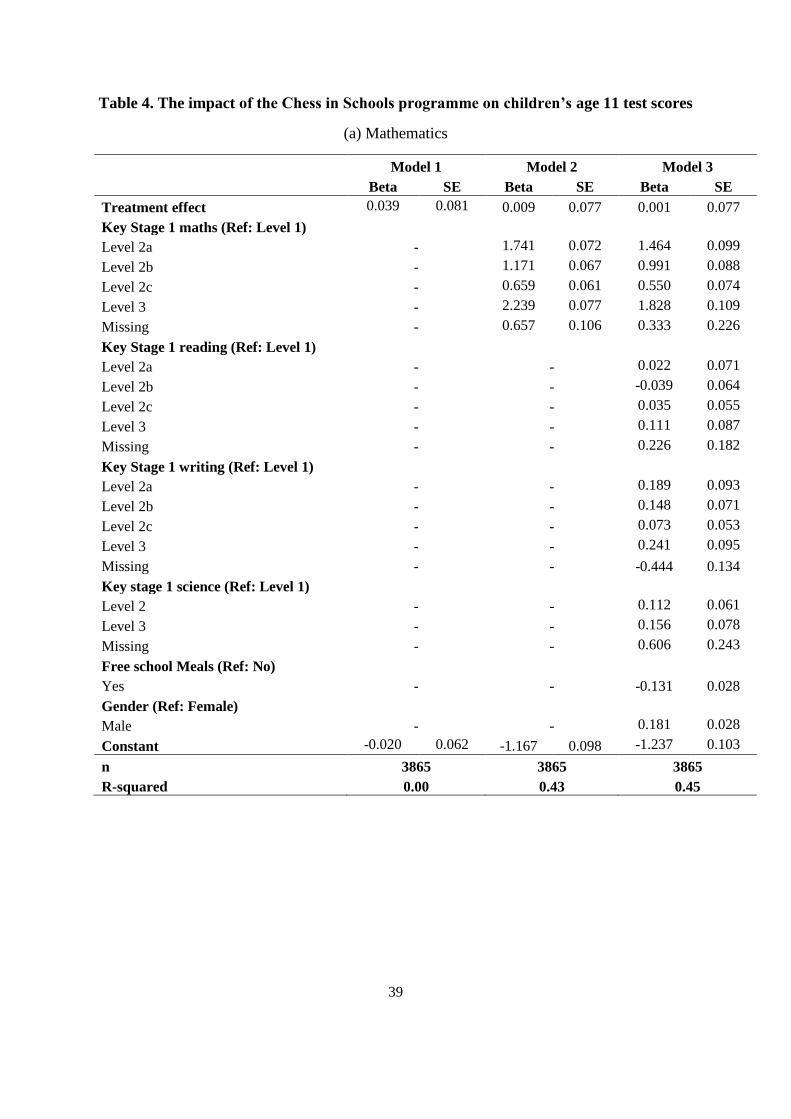
Table 4 presents the ITT estimates of the impact of the CSC programme. Three model
specifications have been estimated: (a) No control variables included (i.e. the simple
difference in mean scores); (b) a single pre-test score controlled; (c) a full-set of controls,
including pre-test scores in mathematics, reading, writing and science, gender and FSM
eligibility. Panel (a) refers to the impact upon overall Key Stage 2 mathematics test scores,
while panel (b) focuses upon the mental arithmetic sub-domain. In both cases, the treatment
effect is essentially zero with a 95 percent confidence interval ranging from approximately
+0.15 to -0.15. In other words, based on an adequately-powered sample, and despite the
reasonably successful implementation of the CSC programme, we find no evidence that this
had any impact upon children’s mathematics skills one year after the intervention.
<< Table 4 >>
The robustness of this result has been tested in a number of ways. First, we have examined
whether the small amount of cross-over between treatment and control groups is likely to
have attenuated our estimate of the CSC treatment effect. There is little evidence that this is
the case. Specifically, the LATE point estimate for Key Stage 2 mathematics scores is 0.001

20
standard deviations, with 95 percent confidence interval running from -0.166 to +0.168.
Second, we have also re-estimated the treatment effect having excluded seven schools that
decided to remove one of their weekly maths lessons in order to make room for the CSC
curriculum. However, this actually led to a slight decline in the estimated impact of the
intervention, with the point estimate turning negative (-0.03 with 95 percent confidence
interval from -0.18 to +0.13). There is hence little evidence to suggest that either the small
amount of non-compliance, or the replacement of mathematics lessons in a minority of
schools, is driving this null result.
Impact upon reading and science attainment
We further consider whether the CSC programme had any effects observed in two other
academic disciplines – reading and science. See Table 4 panel (c) and panel (d). The
estimated impact upon children’s post-test (Key Stage 2) scores was -0.06 standard deviations
in reading (95 percent confidence interval from -0.21 to +0.09) and -0.03 in science (95
percent confidence interval from -0.13 to +0.08). Hence there is no evidence that the CSC
intervention had any impact upon children’s achievement in reading or science.
Heterogeneous effects
Did the CSC programme have a positive effect upon the mathematics attainment of any of our
pre-specified sub-groups? We find no evidence that estimates differ between boys, girls and
children who are eligible for Free School Meals (FSM). The point estimate for boys is
negative (-0.03), with the 95 percent confidence interval from -0.18 to +0.12. Although the
point estimate for girls was positive (+0.03), the effect size was extremely small and
statistically insignificant at conventional thresholds (p = 0.76). Moreover, a formal test of the
gender-by-treatment interaction failed to reject the null hypothesis of an equal treatment effect

21
for boys and girls. For children from low-income (FSM) backgrounds, the point estimate is
essentially zero (+0.01), with the 95 percent confidence interval running from -0.18 to +0.19.
There is thus no evidence that the CSC programme was particularly beneficial for the
mathematics skills of children from socio-economically disadvantaged backgrounds.
It could be that our finding of zero impact upon mean mathematics scores is driven by a large
positive impact upon one group (e.g. low mathematics achievers) and a large negative impact
upon another (e.g. high mathematics achievers). Consequently, we have also produced
quantile regression estimates of the treatment effect at each decile of the post-test (Key Stage
2) distribution. At each decile, the effect size is below 0.05 standard deviations in magnitude
and is never significantly different from zero at even the 10 percent level. Again, this further
strengthens the evidence that teaching primary school children how to play chess has little
lasting impact upon their achievement.
6. Discussion: why might our results differ from the existing literature?
The previous section highlighted a clear difference between our results and the existing
literature in Table 1. We now consider six reasons for this: (1) sample size (2) challenges with
taking the intervention to scale and implementation; (3) the characteristics of the study
population; (4) the length of time between the intervention and testing; (5) the nature of the
testing; (6) the specific nature of the intervention in question.
Sample size issues
As Table 1 illustrates, the sample sizes in most previous studies are extremely small (median
sample size of 54), while our study has been conducted at scale. The existing literature may
therefore contain a number of false positive results.
22
To explore the likelihood of finding false positive findings, we have set up a simulation study,
using data we have collected as part of this RCT. This simulation exercise involved the
following three steps:
Step 1. Randomly sample n observation from the 3,865 pupils included in our final
analysis. Using this sample, the treatment effect is re-estimated9.
Step 2. Repeat step 1 for 1,000 runs of the simulation.
Step 3. Calculate the proportion of the 1,000 runs where the estimated effect size is
greater than 0.2 standard deviations. (We have chosen 0.2 as this is approximately the
figure initially chosen in the power calculations for the study sample size).
The results of this analysis are presented in Figure 2. The horizontal axis plots the selected
sample size (i.e. the ‘n’ used in step 1) while the vertical axis plots the percentage of the 1,000
runs where the effect size was above 0.2 (as calculated in step 3). Vertical lines are also
plotted on this graph to illustrate the median and mean sample sizes for studies in the existing
literature (see Table 1 for further details).
The first key point is that, if we had drawn a sample size around the median of studies in the
existing literature, we would have had around a 25 per cent chance of estimating an effect
above 0.2 standard deviations. Second, the simulation reveals that the sample size needs to be
at least 400 pupils before the false positive rate falls below five percent. This is
complemented by Figure 3, which plots the distribution of estimated effect sizes across all
1,000 simulations for three selected sample sizes (n = 60, 200 and 400). As anticipated, the
distribution is very wide when the sample size is around 60 (the median in the literature), with
9 For simplicity, in this simulation exercise we calculate the treatment effect as the unadjusted difference in mean
mathematics scores between treatment and control groups.

23
effect sizes up to 0.5 not uncommon. In contrast, the distribution begins to become reasonably
tight when the sample size is increased to 400 (dashed red line).
This simulation study therefore highlights a key point; where sample sizes have been so small
in existing studies, it is perhaps unsurprising that some studies have managed to produce
extremely large results.
Challenges with taking chess programs to scale
Related to the point above is the challenge of taking interventions, which may seem to
produce results in a small number of controlled settings, and replicating these at scale. Indeed,
it is always questionable whether studies conducted in such small numbers and in specific
settings produce informative and generalizable evidence that is useful for real-world policy
and practise. Inevitably, implementation quality and fidelity for any educational intervention
is likely to vary across schools when delivered at scale, which could mean different results are
found compared to when a program is tested in a single school.
It is therefore important for us to consider whether there was significant heterogeneity in the
estimated effects depending upon how ‘good’ the chess lessons were. These results are
reported in the online appendix (see Appendix B), with the “quality” of the chess lessons
divided into three separate groups (low, medium and high). Overall, there is no clear evidence
that children who were taught chess by tutors of higher quality achieved significantly better
Key Stage 2 scores.
Consequently, although the challenges with taking such an intervention to scale must be
recognised, we find little evidence that well-delivered (highly enjoyed) chess lessons led to
higher attainment.
24
Characteristics of the study population
The study population in this trial were pupils in schools with a high proportion of
disadvantaged socio-economic pupils with below-average levels of achievement. Although
some previous studies have also focused upon specific groups (e.g. children with visual
impairments, special educational needs, or low socio-economic backgrounds), teaching new
skills to pupils from lower-achieving and lower socio-economic backgrounds nevertheless
raises certain challenges. Indeed, the need to maintain classroom behaviour was flagged as a
key ingredient to successful implementation within the process evaluation.
Did our focus upon children within lower-achieving schools influence our results? We
explore this possibility by considering if there was a differential impact of chess on
attainment across two different measures of school quality (see online Appendix C). In both
cases, we find no evidence of differential impact of chess on attainment. This suggests that
our failure to detect an effect is unlikely to be due to our particular study population or
implementation problems in schools with poorly behaved pupils.
Lessons that chess displaced
There is an opportunity cost to teaching children chess in schools; it replaces either learning
time in another subject or becomes an after school activity (potentially displacing a different
activity). Reporting of exactly what has made way for chess instruction differs across the
existing literature, and is often patchily reported. On many occasions, it is described as “a
regular school lesson” only.
We have investigated whether the effect size varies depending upon the subject the schools
chose to drop (see online Appendix D). We find no evidence of differential impact of the trial
across the subjects that schools chose to drop.

25
Caution is of course required when interpreting these results due to (a) the small sample size
and (b) a lack of a clear counterfactual – we do not know what subjects the control schools
would have dropped had they been assigned to the intervention. Nevertheless, Appendix D
does raise an important point regarding the interpretation of our results; our null findings may
reflect the fact that learning chess has a similar impact upon children’s test scores as the
lesson that it has displaced (rather than learning chess has no impact upon test scores at all).
The nature of the testing
The outcome tests used in existing studies are typically “low-stakes” for pupils and schools
(i.e. they have little riding upon the results). Moreover, in some studies the tests have been
administered and invigilated by the chess tutors (e.g. Romano 2011) or have been very short
and not age appropriate (e.g. Trinchero and Sala 2016; Sala et al 2015)10. In contrast, our
primary outcome is based upon children’s performance in national examinations, which are
high-stakes for schools (they are publicly ranked by the results). These tests are also age
appropriate, externally marked, and are relatively long (testing children’s skills in a number of
different areas).
While we believe that this enhances the validity of our findings relative to much of the
existing literature, it is difficult to know the extent this can explain why we have failed to
detect an effect of the CSC programme. However, it is interesting to recall that the Key Stage
2 science scores we have used in our analysis are somewhat different to the reading and
mathematics scores; while the latter reflect children’s performance in formal examinations,
the former are based upon teachers’ judgements. The fact that we do not find any effect in any
10 Both Trinchero and Sala (2016) and Sala et al (2015) use just seven of the released question from PISA; a test
designed for 15-year-olds that they administered to 8 to 11 year olds. Floor effects, and hence the validity of the
post-test instrument used, are therefore a serious concern.

26
of these three subjects therefore suggests that our null results are unlikely to be entirely due to
the nature of the outcome tests.
Length of time between the intervention and testing
Whereas most existing studies have examined pupils’ outcomes directly at the end of the
intervention, our focus is upon whether there is a sustained effect of chess instruction one year
after the intervention has ended. It is hence possible that there was an initial impact of chess
instruction directly after the intervention has finished, but which has then faded out.
However, existing literature on the fadeout effect suggests that it actually takes many years
for initial impacts to fade away. For instance, after reviewing the evidence for a number of
early childhood interventions, Protzko (2015) noted how ‘the fadeout effect is real, but the
fade is slow and occurs over years’ – and hence cautioning against focusing upon immediate
outcomes only. Likewise, Bailey et al (2017) illustrate how the average effect size across 67
early childhood programmes falls from around 0.2 standard deviations immediately after the
intervention has finished to around 0.1 standard deviations one year later, but does not
completely fade away until up to four years after the intervention has finished.
The existing literature on the fade-out effect therefore suggests it is unlikely that chess had a
large initial impact (of the magnitude claimed in previous studies) which has then completely
disappeared after just one year. Rather, we believe it more likely that any initial impact of
chess instruction upon academic skills is small at best, and is then quickly washed out by
other factors. Specific nature of the intervention in question
The impact of chess instruction upon children’s outcomes may vary depending upon the
nature of the intervention: who delivers the lessons, for how many hours, and the pace at
which children are taught. These factors vary greatly across the literature; some chess

27
interventions were under 20 hours while others were up to 90 hours. Similarly, some
interventions were delivered by specialist chess tutors and others were not.
At 30 hours tuition, the CSC intervention was around the average reported elsewhere in the
literature (see Table 1), and above the 25 hours Sala and Gobert (2016) report as the threshold
above which chess instruction produces substantial effects. In terms of delivery, the CSC
intervention was similar to the only other large scale investigation of chess by Romano
(2011), with lessons delivered to children around the same age as in our trial, with instructors
following a similar standardised curriculum. Therefore, although details of what “teaching
children chess” actually means is only patchily reported within the literature, we do not
believe the specific nature of the CSC intervention to be a major factor leading to the
difference in our results.
Summary
Throughout this section we have offered various reasons why the results from our RCT differ
from previous studies. Pulling these together, we offer the following conclusion. A
combination of small sample sizes, problematic testing instruments and procedures, and
operating in just a handful of controlled settings is likely to have inflated the effect sizes
reported in this literature to unrealistically high levels. Effect sizes of the same magnitude are
unlikely to be reproduced when a valid, important and externally assessed outcome is used,
and when such interventions are delivered in real-world classrooms at scale. Although some
modest effects of chess instruction may still occur directly after the intervention has finished,
these are likely to be washed out in under a year. Consequently, although there may be some
other long-run benefits of learning to play cognitively demanding games such as chess (e.g.
upon children’s social and emotional skills), we urge caution against blindly accepting the

28
conventional wisdom that such games will have a sustained impact upon young people’s
educational achievement.
7. Conclusions
Chess is enjoyed by millions of people worldwide. To be successful, players require high
levels of concentration, to demonstrate logical reasoning and have the ability of think
strategically. It is therefore a prime example of a cognitively demanding game. Such games
are currently receiving a great deal of attention in countries like the United Kingdom and the
United States, due to the potential effect on young people’s academic achievement. Indeed,
many of the skills outlined above, which chess is thought to develop, are also required to
succeed in school – particularly in quantitative disciplines such as mathematics.
A significant body of research has therefore suggested that teaching children how to play
chess has a positive impact upon their educational attainment, with studies implying that this
relationship is causal. Yet the existing evidence base remains limited due to notable
weaknesses in terms of research design. In reality, most existing studies provide correlational
evidence only, typically invoking a strong selection upon observables assumption. Only rarely
has an experimental or quasi-experimental methodology been used. Yet these typically suffer
from difficulties including small sample sizes, measurement of immediate outcomes only,
question-marks over the validity of the outcome tests and potentially compromised
randomisation.
By implementing a large clustered randomised controlled trial (RCT) across primary schools
in England, we attempt to overcome many of the problems that exist with the evidence base
on cognitively demanding games. Our key finding is in direct contrast to the conventional

29
wisdom prevailing within the existing literature. Specifically, we find no evidence of any
lasting impact of chess instruction upon children’s mathematics, reading or science test
scores. This holds true across various sub-groups (boys, girls, children from disadvantaged
socio-economic background) and across the sample as a whole.
This finding should, of course, be interpreted in light of the limitations of our study. First, it is
important to stress that the focus of this trial was children’s academic outcomes only. Yet
chess instruction (and cognitively demanding games more generally) may have a number of
important additional benefits, including potential impacts upon children’s self-confidence and
non-cognitive skills. It may also provide children with a consumption benefit – the enjoyment
of playing. Second, although we have taken steps to investigate the external validity of our
results, we cannot generalise our findings to other geographic areas (e.g. to other countries) or
to different age groups (e.g. younger or older pupils). Further research focused upon these two
areas, using a strong experimental or quasi-experimental design, represent the next important
steps in this line of research.
Despite these limitations, we believe there are at least two wider implications of our findings.
First, there is currently a lot of hype surrounding the impact cognitively demanding games
may have upon young people’s educational achievement, based upon a few relatively small-
scale or correlational studies finding positive results. Chess is a prime example, one where
many perceive there to be a positive benefit, and where (at face value) there seems to be a
reasonable evidence base. However, our analysis has shown that once one scratches below the
surface, and employs a rigorous research design delivered to many pupils at scale, the
foundations behind claims of a large causal impact of such games upon educational
attainment do not appear as strong as has perhaps has previously been suggested.

30
Second, although economists spend much time and effort planning and executing robust
identification strategies, this paper has served as a reminder that this only a necessary (but not
sufficient) condition for determining “what works” in policy and practise. Other elements of
the research design, including the use of valid outcome measures, representative samples,
delivery at scale and the use of longer-term follow-ups are also important. Future research on
cognitively demanding games, whether this be chess, puzzles or video games, will ideally
take these wide range of design issues into account.
Overall, claims that chess instruction has a significant impact upon children’s attainment
have, in our view, stretched the available evidence too far. We believe this is also the case for
many other cognitively demanding games, particularly video games, where there is currently
much interest. This paper has sought to challenge the prevailing view and, in the process, has
highlighted the need for causal statements to be made only when a robust experimental or
quasi-experimental methodology has been used.
31
References
Aciego, Ramon, Lorena Garcia and Moises Betancourt. 2012. ‘The benefits of chess for the
intellectual and social-emotional enrichment in schoolchildren.’ Spanish Journal of
Psychology. 15 (2): 551–559.
Aydin, Mensure. 2015. ‘Examining the impact of chess instruction for the visual impairment
on mathematics.’ Educational Research and Reviews 10(7): 907–911.
Bailey, Drew, Gregg Duncan, Candice Odgers and Winnie Yu. 2017. ‘Persistence and fadeout
in the impacts of child and adolescent interventions.’ Journal of Research on Educational
Effectiveness 10(1):7-39.
David Barrett and Wade Fish. 2011. ‘Our move: using chess to improve math achievement
for students who receive special education services.’ International Journal of Special
Education 26(3): 181-193.
Blanden, Jo., Paul Gregg and Lindsey Macmillan. 2007. ‘Accounting for intergenerational
income persistence: Non-cognitive skills, ability and education.’ The Economic Journal
117(519(: C43-C60.
Boruch, Robert and Barbara Romano. 2011. ‘Does playing chess improve math learning?
Promising (and inexpensive) results from Italy.’ Accessed 11/12/2015 from
http://www.europechesspromotion.org/upload/pagine/doc/SAM_research_synthesis.pdf
Christiaen, J. and Verhofstadt-Denève, L. 1981. ‘Schaken en cognitieve ontwikkeling.’
Nederlands Tijdschrift voor de Psychologie en haar Grensgebieden 36: 561–582.
Dauvergne, Peter. 2000. ‘The Case for Chess as a Tool to Develop Our Children’s Minds’
Unpublished manuscript. Accessed 28/04/16 from
http://www.auschess.org.au/articles/chessmind.htm
DuCette, Joseph. 2009. ‘An evaluation of the chess Challenge program of ASAP/after school
activities Partnerships.’ After School Activities Partnerships, Philadelphia, PA.
Eberhard, Joseph. 2003. ‘The relationship between chess instruction and verbal, quantitative,
and nonverbal reasoning abilities of economically disadvantage students.’ Unpublished
doctoral dissertation.
Ferguson, Robert. 1995. ‘Chess in Education: Research Summary.’ A Review of Key Chess
Research Studies. For the Borough of Manhattan Community College Chess in Education ‘A
Wise Move’ Conference. Accessed 28/04/16 from https://files-
workface.s3.amazonaws.com/d173e0841cd570450aca380e95f509c2/files/aecd0262677f9343
a3f65b5653a198d9ffa925b2ChessInEducation-AWiseMoveConference.pdf
Fissler, Patrick, Iris-Tatjana Kolassa and Claudia Schrader. 2015. ‘Educational games for
brain health: revealing their unexplored potential through a neurocognitive approach.’
Frontiers in Psychology 6:1056. doi: 10.3389/fpsyg.2015.01056

32
Forrest, Dod, Iain Davidson, Janet Shucksmith and Tony Glendinning. 2005. ‘Chess
development in Aberdeen's primary schools: A study of literacy and social capital.’
University of Aberdeen, Aberdeen, Scotland (2005) Retrieved
from www.gov.scot/Resource/Doc/930/0009711.pdf
Fried, Steven and Norbert Ginzburg. Unpublished. ‘The effect of learning to play chess on
cognitive, perceptual and emotional development in children’. Unpublished manuscript.
Frydman, Marcel and Richard Lynn. 1992. ‘The general intelligence and spatial abilities of
gifted young Belgian chess players.’ British Journal of Psychology 83(2): 233-235.
Garcia, Ninfa. 2008. ‘Scholastic chess club participation and the academic achievement of
Hispanic fifth grade students in south Texas.’ Unpublished doctoral dissertation.
Gliga, Fotinica and Petru Iulian Flesner. 2014. ‘Cognitive benefits of chess training in novice
children.’ Procedia – Social and Behavioral Sciences 116:962–967.
Gobet, Fernand and Guillermo Campitelli. 2006. ‘Educational benefits of chess instruction: A
critical review’. In T. Redman (Ed), Chess and education: Selected essays from the
Koltanowski conference (pp. 124-143). Dallas, TX: Chess Program at the University of Texas
at Dallas.
Hong, Saahoon and William Bart. 2007. ‘Cognitive effects of chess instruction on students at
risk for academic failure.’ International Journal of Special Education 22(3): 89–96.
Jerrim, John and Anna Vignoles. 2016. ‘The link between East Asian 'mastery' teaching
methods and English children's mathematics skills’. Economics of Education Review 50(1):
29-44
Jerrim, John, John Micklewright, Lindsey Macmillan, Mary Sawtell and Meg Wiggins. 2015.
‘The impact of the Chess in Schools and Communities programme upon children’s
educational attainment.’ Education Endowment Foundation Research Report. Accessed
18/05/2017 from https://educationendowmentfoundation.org.uk/evaluation/projects
Kazemi, Farhad, Mozafar Yektayar, and Ali Abad. 2012. ‘Investigation the impact of chess
play on developing meta-cognitive ability and math problem-solving power of students at
different levels of education.’ Procedia – Social and Behavioral Sciences 32: 372 – 379.
Kramer, Anne and Sigrun-Heide Filipp. Unpublished. ‘Chess at Tryer-Olewig Primary
School: Summary and the evaluation of the outcomes of the German School Chess
Foundation (short version)’. Unpublished manuscript.
Kühn, S., Gleich, T., Lorenz, R., Lindenberger, U. and Gallinat, J. 2013. ‘Playing Super
Mario induces structural brain plasticity: gray matter changes resulting from training with a
commercial video game.’ Molecular Psychiatry 19(2): 265–271.

33
Kühn, Simone, Robert Lorenz, Tobias Banaschewski, Gareth Barker, Christian Büchel,
Patricia Conrod et al. 2014. ‘Positive association of video game playing with left frontal
cortical thickness in adolescents’. PLoS ONE 9:e91506. 10.1371/journal.pone.0091506.
Margulies, Stuart. 1992. ‘The effect of chess on reading scores: District Nine chess program;
Second year report.’ The American Chess Foundation, New York, NY.
Protzko, John. 2015. ‘The environment in raising early intelligence: A meta-analysis of the
fadeout effect.’ Intelligence 53: 202-210.
Rifner, Philip. 1992. ‘Playing chess: A study of the transfer of problem-solving skills in
students with average and above average intelligence.’ Unpublished doctoral dissertation.
Romano, Barbara. 2011. ‘Does playing chess improve math learning? Promising (and
inexpensive) results from Italy.’ Unpublished doctoral dissertation. Accessed 15/12/2016
from http://www.europechesspromotion.org/upload/pagine/doc/SAM_research_synthesis.pdf
Sala, Giovanni, Alessandra Gorini and Gabriella Pravettoni. 2015. ‘Mathematical problem
solving abilities and chess: An experimental study on young pupils.’ SAGE Open 5(3): 1–9.
Sala, Giovanni and Fernand Gobet. 2016. ‘Do the benefits of chess instruction transfer to
academic and cognitive skills? A meta-analysis’. Educational Research Review 18(1): 46–57.
Sala, Giovanni, Fernand Gobet, Roberto Trinchero and Salvatore Ventura. 2016. ‘Does chess
instruction enhance mathematical ability in children? A three-group design to control for
placebo effects’. Accessed 15/12/2016 from
https://mindmodeling.org/cogsci2016/papers/0344/paper0344.pdf
Sala, Giovanni and Roberto Trinchero 2016. ‘Is meta-cognition the link between chess
training and improvement in mathematics? A study on primary school children.’ Unpublished
manuscript.
Scholz, Markus, Harald Niesch, Olaf Steffen, Baerbel Ernst, Markus Loeffler, Evelin Witruk
and Hans Schwarz. 2008. ‘Impact of chess training on mathematics performance and
concentration ability of children with learning disabilities.’ International Journal of Special
Education 23(3): 138–148.
Shute, Valarie, Matthew Ventura and Fengfeng Ke. 2015. ‘The power of play: The effects of
Portal 2 and Lumosity on cognitive and noncognitive skills.’ Computers and Education 80(1):
58-67.
Sigirtmac, Ayperi. 2012. ‘Does chess training affect conceptual development of six-year-old
children in Turkey?’ Early Child Development and Care 182(6): 797–806.
Thompson, Murray. 2003. ‘Does the playing of chess lead to improved scholastic
achievement?’ Issues in Educational Research 13(2):13-26.
Trinchero, Roberto and Mariella Piscopo. 2007. ‘Gli scacchi, un gioco per crescere.’
Unpublished manuscript.

34
Trinchero, Roberto. 2013. ‘Can chess training improve Pisa scores in mathematics? An
experiment in Italian primary schools.’ Department of Philosophy and Education, University
of Turin working paper. Accessed 18/05/2017 from http://chessedu.org/wp-
content/uploads/chess_improve_pisa.pdf
Trinchero, Roberto and Giovanni Sala. 2016. ‘Can chess training improve Pisa scores in
Mathematics? An experiment in Italian primary schools.’ Eurasia Journal of Mathematics,
Science & Technology Education 12(3): 655–668.
Yap, Kim. 2006. ‘Chess for success evaluation: Final report.’ Northwest Regional
Educational Laboratory, Portland, OR.
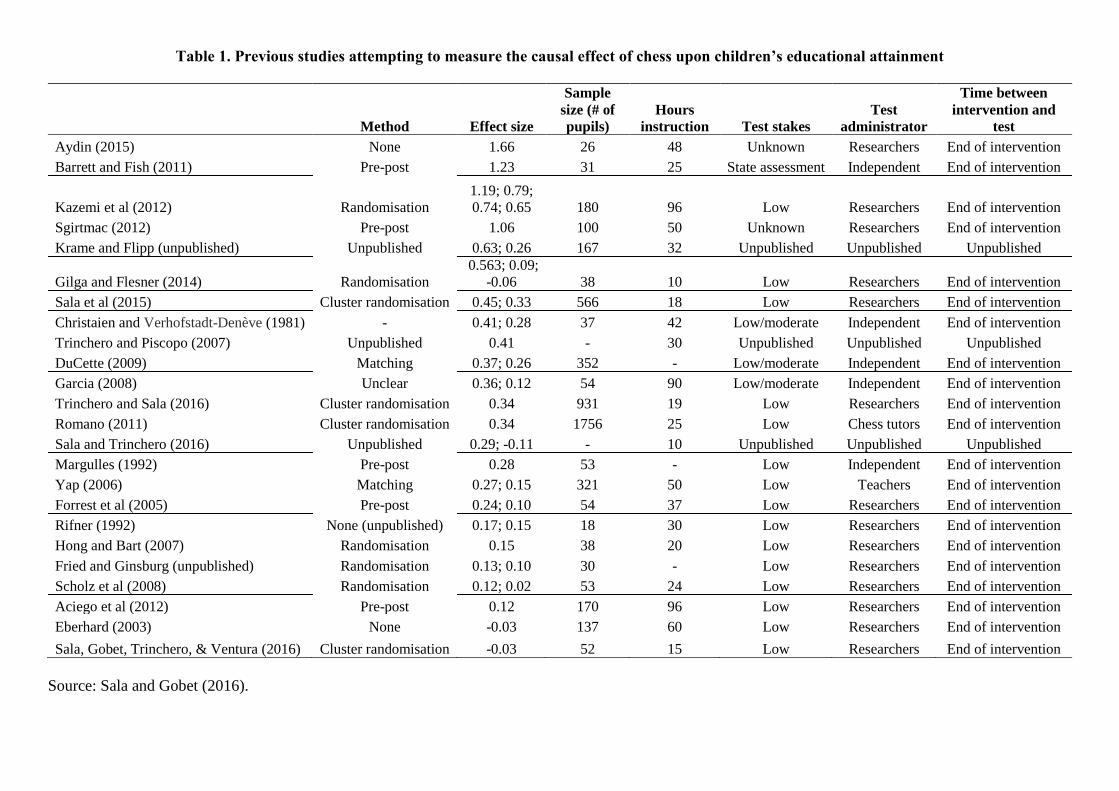
Table 1. Previous studies attempting to measure the causal effect of chess upon children’s educational attainment
Method Effect size
Sample
size (# of
pupils)
Hours
instruction Test stakes
Test
administrator
Time between
intervention and
test
Aydin (2015) None 1.66 26 48 Unknown Researchers End of intervention
Barrett and Fish (2011) Pre-post 1.23 31 25 State assessment Independent End of intervention
Kazemi et al (2012) Randomisation
1.19; 0.79;
0.74; 0.65 180 96 Low Researchers End of intervention
Sgirtmac (2012) Pre-post 1.06 100 50 Unknown Researchers End of intervention
Krame and Flipp (unpublished) Unpublished 0.63; 0.26 167 32 Unpublished Unpublished Unpublished
Gilga and Flesner (2014) Randomisation
0.563; 0.09;
-0.06 38 10 Low Researchers End of intervention
Sala et al (2015) Cluster randomisation 0.45; 0.33 566 18 Low Researchers End of intervention
Christaien and Verhofstadt-Denève (1981) - 0.41; 0.28 37 42 Low/moderate Independent End of intervention
Trinchero and Piscopo (2007) Unpublished 0.41 - 30 Unpublished Unpublished Unpublished
DuCette (2009) Matching 0.37; 0.26 352 - Low/moderate Independent End of intervention
Garcia (2008) Unclear 0.36; 0.12 54 90 Low/moderate Independent End of intervention
Trinchero and Sala (2016) Cluster randomisation 0.34 931 19 Low Researchers End of intervention
Romano (2011) Cluster randomisation 0.34 1756 25 Low Chess tutors End of intervention
Sala and Trinchero (2016) Unpublished 0.29; -0.11 - 10 Unpublished Unpublished Unpublished
Margulles (1992) Pre-post 0.28 53 - Low Independent End of intervention
Yap (2006) Matching 0.27; 0.15 321 50 Low Teachers End of intervention
Forrest et al (2005) Pre-post 0.24; 0.10 54 37 Low Researchers End of intervention
Rifner (1992) None (unpublished) 0.17; 0.15 18 30 Low Researchers End of intervention
Hong and Bart (2007) Randomisation 0.15 38 20 Low Researchers End of intervention
Fried and Ginsburg (unpublished) Randomisation 0.13; 0.10 30 - Low Researchers End of intervention
Scholz et al (2008) Randomisation 0.12; 0.02 53 24 Low Researchers End of intervention
Aciego et al (2012) Pre-post 0.12 170 96 Low Researchers End of intervention
Eberhard (2003) None -0.03 137 60 Low Researchers End of intervention
Sala, Gobet, Trinchero, & Ventura (2016) Cluster randomisation -0.03 52 15 Low Researchers End of intervention
Source: Sala and Gobet (2016).
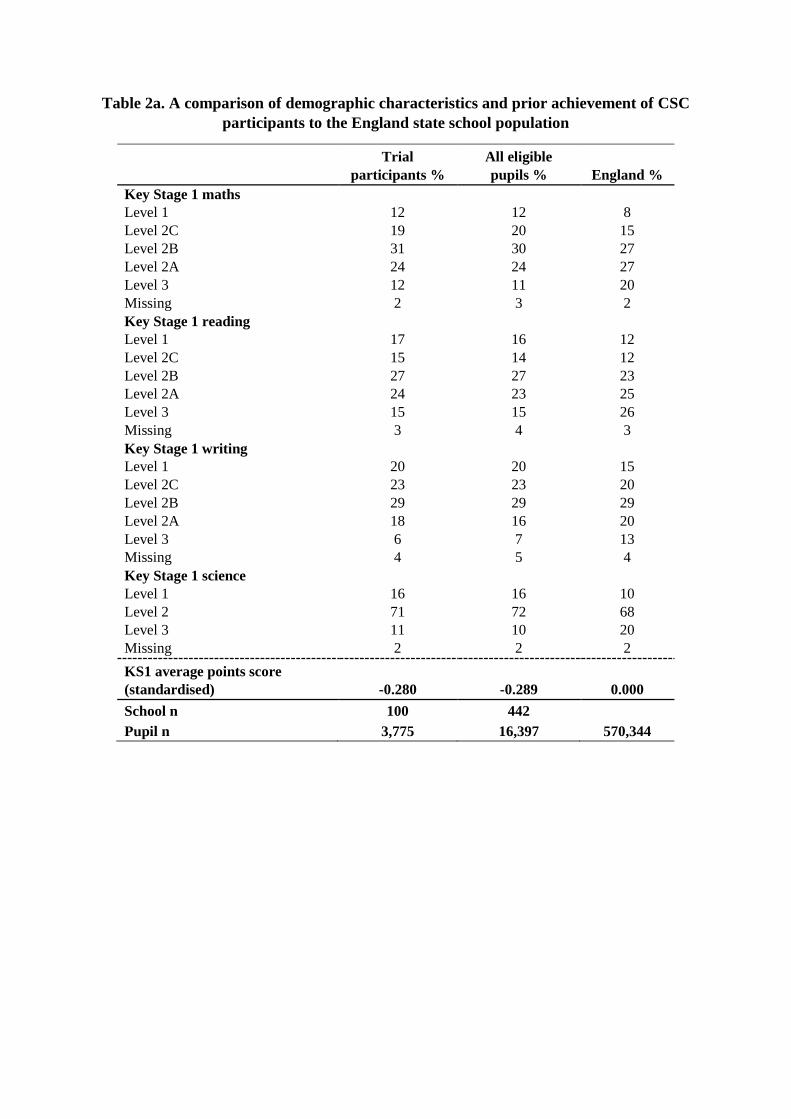
Table 2a. A comparison of demographic characteristics and prior achievement of CSC
participants to the England state school population
Trial
participants %
All eligible
pupils % England %
Key Stage 1 maths Level 1 12 12 8
Level 2C 19 20 15
Level 2B 31 30 27
Level 2A 24 24 27
Level 3 12 11 20
Missing 2 3 2
Key Stage 1 reading Level 1 17 16 12
Level 2C 15 14 12
Level 2B 27 27 23
Level 2A 24 23 25
Level 3 15 15 26
Missing 3 4 3
Key Stage 1 writing Level 1 20 20 15
Level 2C 23 23 20
Level 2B 29 29 29
Level 2A 18 16 20
Level 3 6 7 13
Missing 4 5 4
Key Stage 1 science Level 1 16 16 10
Level 2 71 72 68
Level 3 11 10 20
Missing 2 2 2
KS1 average points score
(standardised) -0.280 -0.289 0.000
School n 100 442
Pupil n 3,775 16,397 570,344
37
Table 2b. A comparison of demographic characteristics and prior achievement of CSC
participants to the England state school population
Trial participants
%
All eligible
pupils % England %
Eligible for FSM No 66 65 82
Yes 35 35 18
Gender Female 50 50 49
Male 50 51 51
School n 100 442
Pupil n 3,865 16,397 571,733

38
Table 3. Balance between treatment and control groups
Intervention
group
Control
group
Difference
(SE)
FSM Eligible 0.33 0.36 0.03 (0.02)
Male 0.51 0.49 0.02 (0.02)
Key Stage 1 maths
Level 1 0.12 0.12 0.00 (0.01)
Level 2C 0.18 0.18 0.00 (0.02)
Level 2B 0.29 0.29 0.00 (0.02)
Level 2A 0.21 0.23 -0.02 (0.02)
Level 3 0.12 0.10 0.02 (0.02)
Missing 0.08 0.08 0.00 (0.01)
Key Stage 1 reading
Level 1 0.16 0.16 0.00 (0.02)
Level 2C 0.14 0.14 0.00 (0.01)
Level 2B 0.25 0.25 0.00 (0.02)
Level 2A 0.21 0.23 -0.02 (0.02)
Level 3 0.15 0.12 0.03 (0.02)
Missing 0.09 0.09 0.00 (0.01)
Key Stage 1 writing
Level 1 0.18 0.19 -0.01 (0.02)
Level 2C 0.21 0.23 -0.02 (0.02)
Level 2B 0.29 0.26 0.03 (0.02)
Level 2A 0.17 0.16 0.00 (0.02)
Level 3 0.06 0.06 0.00 (0.01)
Missing 0.11 0.10 0.01 (0.01)
Key Stage 1 science
Level 1 0.16 0.16 0.00 (0.02)
Level 2 0.68 0.74 -0.06 (0.03)*
Level 3 0.14 0.07 0.07 (0.02)*
Missing 0.02 0.03 -0.01 (0.01)
Key Stage 1 average point
score
Mean 0.02 -0.03 0.05 (0.06)
Notes: Figures refer to the mean of the variables. Figures in parenthesis refer to the standard
errors. * indicates statistically significant difference at the five per cent level
39
Table 4. The impact of the Chess in Schools programme on children’s age 11 test scores
(a) Mathematics
Model 1 Model 2 Model 3
Beta SE Beta SE Beta SE
Treatment effect 0.039 0.081 0.009 0.077 0.001 0.077
Key Stage 1 maths (Ref: Level 1)
Level 2a - 1.741 0.072 1.464 0.099
Level 2b - 1.171 0.067 0.991 0.088
Level 2c - 0.659 0.061 0.550 0.074
Level 3 - 2.239 0.077 1.828 0.109
Missing - 0.657 0.106 0.333 0.226
Key Stage 1 reading (Ref: Level 1)
Level 2a - - 0.022 0.071
Level 2b - - -0.039 0.064
Level 2c - - 0.035 0.055
Level 3 - - 0.111 0.087
Missing - - 0.226 0.182
Key Stage 1 writing (Ref: Level 1)
Level 2a - - 0.189 0.093
Level 2b - - 0.148 0.071
Level 2c - - 0.073 0.053
Level 3 - - 0.241 0.095
Missing - - -0.444 0.134
Key stage 1 science (Ref: Level 1)
Level 2 - - 0.112 0.061
Level 3 - - 0.156 0.078
Missing - - 0.606 0.243
Free school Meals (Ref: No)
Yes - - -0.131 0.028
Gender (Ref: Female)
Male - - 0.181 0.028
Constant -0.020 0.062 -1.167 0.098 -1.237 0.103
n 3865 3865 3865
R-squared 0.00 0.43 0.45

40
(b) Mental arithmetic
Model 1 Model 2 Model 3
Beta SE Beta SE Beta SE
Treatment effect 0.032 0.066 0.004 0.062 -0.003 0.061
Key Stage 1 maths (Ref: Level 1)
Level 2a - 1.784 0.056 1.352 0.075
Level 2b - 1.222 0.055 0.918 0.069
Level 2c - 0.681 0.057 0.504 0.067
Level 3 - 2.177 0.060 1.608 0.080
Missing - 0.686 0.094 0.271 0.217
Key Stage 1 reading (Ref: Level 1)
Level 2a - - 0.157 0.069
Level 2b - - 0.065 0.069
Level 2c - - 0.081 0.058
Level 3 - - 0.230 0.081
Missing - - 0.268 0.178
Key Stage 1 writing (Ref: Level 1)
Level 2a - - 0.218 0.085
Level 2b - - 0.171 0.069
Level 2c - - 0.082 0.061
Level 3 - - 0.271 0.088
Missing - - -0.417 0.175
Key stage 1 science (Ref: Level 1)
Level 2 - - 0.183 0.049
Level 3 - - 0.204 0.067
Missing - - 0.692 0.228
Free school Meals (Ref: No)
Yes - - -0.120 0.028
Gender (Ref: Female)
Male - - 0.234 0.028
Constant -0.016 0.047 -1.188 0.069 -1.341 0.073
n 3867 3867 3867
R-squared 0.00 0.42 0.45

41
(c) Reading
Model 1 Model 2 Model 3
Beta SE Beta SE Beta SE
Treatment effect -0.030 0.078 -0.052 0.073 -0.061 0.074
Key Stage 1 maths (Ref: Level 1)
Level 2a - - 0.643 0.103
Level 2b - - 0.372 0.088
Level 2c - - 0.209 0.072
Level 3 - - 0.758 0.113
Missing - - 0.197 0.228
Key Stage 1 reading (Ref: Level 1)
Level 2a - 1.309 0.062 0.665 0.099
Level 2b - 0.758 0.051 0.332 0.082
Level 2c - 0.423 0.057 0.192 0.068
Level 3 - 1.877 0.067 0.972 0.111
Missing - 0.156 0.095 0.171 0.192
Key Stage 1 writing (Ref: Level 1)
Level 2a - - 0.192 0.103
Level 2b - - 0.167 0.078
Level 2c - - 0.088 0.057
Level 3 - - 0.332 0.107
Missing - - -0.563 0.178
Key stage 1 science (Ref: Level 1)
Level 2 - - 0.038 0.073
Level 3 - - 0.131 0.089
Missing - - 0.596 0.234
Free school Meals (Ref: No)
Yes - - -0.141 0.032
Gender (Ref: Female)
Male - - -0.068 0.027
Constant 0.015 0.063 -0.810 0.085 -0.852 0.104
n 3851 3851 3851
R-squared 0.00 0.37 0.42

42
(d) Science
Model 1 Model 2 Model 3
Beta SE Beta SE Beta SE
Treatment effect 0.007 0.052 -0.059 0.054 -0.027 0.052
Key Stage 1 maths (Ref: Level 1)
Level 2a - - 0.874 0.071
Level 2b - - 0.567 0.062
Level 2c - - 0.437 0.058
Level 3 - - 1.053 0.080
Missing - - -0.075 0.215
Key Stage 1 reading (Ref: Level 1)
Level 2a - - 0.240 0.054
Level 2b - - 0.104 0.055
Level 2c - - 0.078 0.048
Level 3 - - 0.361 0.074
Missing - - 0.068 0.180
Key Stage 1 writing (Ref: Level 1)
Level 2a - - 0.438 0.073
Level 2b - - 0.242 0.053
Level 2c - - 0.132 0.044
Level 3 - - 0.461 0.094
Missing - - -0.424 0.161
Key stage 1 science (Ref: Level 1)
Level 2 - 0.854 0.045 0.067 0.052
Level 3 - 1.721 0.058 0.245 0.071
Missing - -0.174 0.111 0.439 0.222
Free school Meals (Ref: No)
Yes - - -0.156 0.027
Gender (Ref: Female)
Male - - 0.014 0.026
Constant -0.003 0.041 -0.716 0.058 -0.904 0.069
n 3933 3933 3933
R-squared 0.00 0.24 0.41
Notes: Figures refer to the Intention-to-Treat (ITT) estimates. Estimates refer to effect size
(Cohen’s D).
43
Figure 1: Flow of participants in the CSC trial
Re
cru
itm
en
t A
na
lysis
F
ollo
w-u
p
Allo
ca
tion
Assessed for eligibility (school n= 100)
Randomised (school n=100; pupil
n=4,009)
Excluded (school n= 0) Not meeting inclusion criteria (school n= 0) Other reasons (school n= 0)
Allocated to intervention (school n= 50; pupil n= 2,055) Did not receive allocated intervention (school n= 6; pupil n= 201)
Allocated to control (school n= 50; pupil n= 1,954) Moved from control to treatment group (school n= 1; pupil n= 27)
Post-test data collected 50 schools; 1,965 pupils
Post-test data collected 50 schools 1,900 pupils
Analysed 50 Schools 1,965 pupils
Approached (school n=442)
Declined to participate (school n= 342)
Lost to follow-up (0 schools 90 pupils)
Lost to follow-up 0 schools 54 pupils
Not analysed 0 schools 0 pupils
Analysed 50 schools 1,900 pupils
Not analysed 0 schools 0 pupils

44
Figure 2. The percentage of false findings (effect size greater than 0.2) across 1,000
simulation runs, using different sample sizes.
Figure 3. Estimated effect sizes across 1,000 simulations of different sample sizes
0
5
10
15
20
25
30
35
0 100 200 300 400 500 600 700 800
% false positive
Sample size
Mean sample size
Median
sample size
01
23
45
-1 -.5 0 .5 1Estimated effect
n = 60 n = 200
n = 400