FINAL YEAR BBA (H) STUDY PAPER ON · final year bba (h) study paper on “a comparative financial...
48
FINAL YEAR BBA (H) STUDY PAPER ON “A COMPARATIVE FINANCIAL PERFORMANCE ANALYSIS OF TATA STEEL & JINDAL STEEL AND POWER BY MEANS OF RATIOS” SUBMITTED BY: NAME – ABHISHEK SINHA ROLL NO. - 15405015002 SUBHANIL GHOSH 15405015052 SUBHAJIT NAG 15405015051 STREAM – BBA (H) YEAR - 3 rd (THIRD) SEMESTER – 6 th (SIXTH) SESSION – 2015-2018 COLLEGE – DINABANDHU ANDREWS INSTITUTE OF TECHNOLOGY AND MANAGEMENT UNIVERSITY – MAULANA ABUL KALAM AZAD UNIVERSITY OF TECHNOLOGY, WEST BENGAL
Transcript of FINAL YEAR BBA (H) STUDY PAPER ON · final year bba (h) study paper on “a comparative financial...

FINAL YEAR BBA (H) STUDY PAPER ON
“A COMPARATIVE FINANCIAL PERFORMANCE ANALYSIS OF TATA STEEL & JINDAL STEEL AND
POWER BY MEANS OF RATIOS”
SUBMITTED BY:
NAME – ABHISHEK SINHA ROLL NO. - 15405015002
SUBHANIL GHOSH 15405015052
SUBHAJIT NAG 15405015051
STREAM – BBA (H)
YEAR - 3rd (THIRD) SEMESTER – 6th (SIXTH)
SESSION – 2015-2018
COLLEGE – DINABANDHU ANDREWS INSTITUTE OF TECHNOLOGY AND MANAGEMENT
UNIVERSITY – MAULANA ABUL KALAM AZAD UNIVERSITY OF TECHNOLOGY, WEST BENGAL

DECLARATION
I hereby declare that the Project Report entitled “A COMPARATIVE
FINANCIAL PERFORMANCE ANALYSIS OF TATA STEEL & JINDAL STEEL
AND POWER BY MEANS OF RATIOS” submitted by me for the partial
fulfilment of the degree of BBA (H) under the Maulana Abul Kalam Azad
University of Technology, West Bengal is my original work and has not
been submitted earlier to any other university for the fulfilment of the
requirement for any course of study.
I also declare that no chapter of this manuscript in whole or in part has
been incorporated in this report from any earlier work done by others
or by me. However, extracts of any literature which has been used for
this report has been duly acknowledged providing details of such
literature in this references.
NAME – ABHISHEK SINHA ROLL NO. - 15405015002
SUBHANIL GHOSH 15405015052
SUBHAJIT NAG 15405015051

ACKNOWLEDGEMENT
“Acknowledging the debt is not easy for us we are indebted to so many people”.
I take this opportunity in expressing the fact that this project report is the result
of incredible amount of encouragement, co-operation and moral support that I
have received from others.
Words alone cannot express my deep sense of gratitude to “MR. ABHIJIT PAL”,
who provided me an opportunity to do a project on “A COMPARATIVE
FINANCIAL PERFORMANCE ANALYSIS OF TATA STEEL & JINDAL STEEL
AND POWER BY MEANS OF RATIOS”. His valuable guidance & support made
this project work an enlightening educational experience. His consistent support
and co-operation showed the way towards the successful completion of project.
I would like to express my deep sense of gratitude to all the member, who directly
or indirectly helped me during my project work.
3

PREFACE
In any organization, the two important financial statements are the Balance Sheet and Profit &Loss Account of the business. Balance Sheet is a statement of financial position of an enterprise at a particular point of time. Profit & Loss account shows the net profit or net loss of a company for a specified period of time. When these statements of the last few year of any organization are studied and analysed, significant conclusions may be arrived regarding the changes in the financial position, the important policies followed and trends in profit and loss etc. Analysis and interpretation of financial statement has now become an important technique of credit appraisal. The investors, financial experts, management executives and the bankers all analyse these statements. Though the basic technique of appraisal remains the same in all the cases but the approach and the emphasis in the analysis vary. A banker interprets the financial statement so as to evaluate the financial soundness and stability, the liquidity position and the profitability or the earning capacity of borrowing concern. Analysis of financial statements is necessary because it helps in depicting the financial position on the basis of past and current records. Analysis of financial statements helps in making the future decisions and strategies. Therefore it is very necessary for every organization whether it is a financial or manufacturing, to make financial statement and to analyse it.
4

INDEX
Chapter No. PARTICULARS PAGE NO.
Acknowledgement 3
Preface 4
1 Introduction of Steel Industry in India 6-8
2 Objective 9
3 Company Profile 10-20
Tata Steel
Jindal Steel
4 Theoretical Framework 21-29
5 Research Methodology 30-31
6 Data Analysis And Interpretation 32-41
Comparative Analysis Of Tata Steel & Jindal Steel
7 Conclusion 42
8 Recommendation 43
9 Bibliography 44
10 Annexure 45-48
5

INTRODUCTION OF STEEL INDUSTRY IN INDIA
INTRODUCTION
India was the world’s third-largest steel producer in 2016. The growth in the Indian steel sector has been driven by domestic availability of raw materials such as iron ore and cost-effective labour. Consequently, the steel sector has been a major contributor to India’s manufacturing output.
The Indian steel industry is very modern with state-of-the-art steel mills. It has always strived for continuous modernisation and up-gradation of older plants and higher energy efficiency levels.
Indian steel industries are classified into three categories such as major producers, main producers and secondary producers.
MARKET SIZE
India’s crude steel output grew 5.87 per cent year-on-year to 101.227 million tonnes (MT) in CY 2017. Crude steel production during April-December 2017 grew by 4.6 per cent year-on-year to 75.498 MT.
India’s finished steel exports rose 102.1 per cent to 8.24 MT, while imports fell by 36.6 per cent to 7.42 MT in 2016-17. Finished steel exports rose 52.9 per cent in April-December 2017 to 7.606 MT, while imports increased 10.9 per cent to 6.096 MT during the same period.
Total consumption of finished steel grew by 5.2 per cent year-on-year at 64.867 MT during April-December 2017.
6

INVESTMENTS
Steel industry and its associated mining and metallurgy sectors have seen a number of major investments and developments in the recent past.
According to the data released by Department of Industrial Policy and Promotion (DIPP), the Indian metallurgical industries attracted Foreign Direct Investments (FDI) to the tune of US$ 10.419 billion in the period April 2000–September 2017.
Some of the major investments in the Indian steel industry are as follows:
JSW Steel has planned a US$ 4.14 billion capital expenditure programme to increase its overall steel output capacity from 18 million tonnes to 23 million tonnes by 2020.
Rashtriya Ispat Nigam Ltd (RINL) has signed a Memorandum of Understanding (MOU) with Kudremukh Iron Ore Company Ltd for setting up of a 1.2 million ton per annum (MTPA) plant project at Vishakhapatnam.
Tata Steel has decided to increase the capacity of its Kalinganagar integrated steel plant from 3 million tonnes to 8 million tonnes at an investment of US$ 3.64 billion.
GOVERNMENT INITIATIVES
Some of the other recent government initiatives in this sector are as follows:
Government of India’s focus on infrastructure and restarting road projects is aiding the boost in demand for steel. Also, further likely acceleration in rural economy and infrastructure is expected to lead to growth in demand for steel.
7
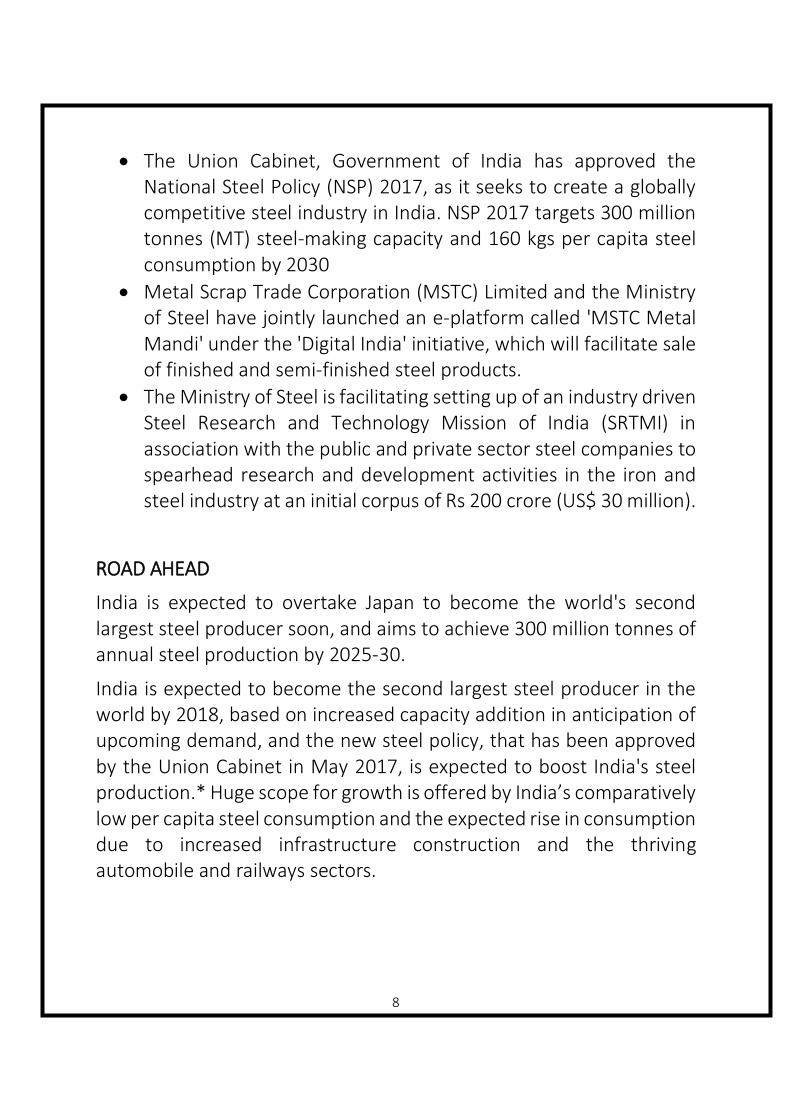
The Union Cabinet, Government of India has approved the National Steel Policy (NSP) 2017, as it seeks to create a globally competitive steel industry in India. NSP 2017 targets 300 million tonnes (MT) steel-making capacity and 160 kgs per capita steel consumption by 2030
Metal Scrap Trade Corporation (MSTC) Limited and the Ministry of Steel have jointly launched an e-platform called 'MSTC Metal Mandi' under the 'Digital India' initiative, which will facilitate sale of finished and semi-finished steel products.
The Ministry of Steel is facilitating setting up of an industry driven Steel Research and Technology Mission of India (SRTMI) in association with the public and private sector steel companies to spearhead research and development activities in the iron and steel industry at an initial corpus of Rs 200 crore (US$ 30 million).
ROAD AHEAD
India is expected to overtake Japan to become the world's second largest steel producer soon, and aims to achieve 300 million tonnes of annual steel production by 2025-30.
India is expected to become the second largest steel producer in the world by 2018, based on increased capacity addition in anticipation of upcoming demand, and the new steel policy, that has been approved by the Union Cabinet in May 2017, is expected to boost India's steel production.* Huge scope for growth is offered by India’s comparatively low per capita steel consumption and the expected rise in consumption due to increased infrastructure construction and the thriving automobile and railways sectors.
8

OBJECTIVES OF STUDY
The present study “A COMPARATIVE FINANCIAL PERFORMANCE ANALYSIS OF
TATA STEEL & JINDAL STEEL AND POWER BY MEANS OF RATIOS.”
Has been designed to achieve the following objectives:-
1. To study the financial position of Tata steel and Jindal steel.
2. in respect of above objective we are trying to judge the financial performance
of Tata steel and Jindal steel.
SCOPE OF THE STUDY
The present study is confined to the two leading units in steel industry namely
JINDAL STEEL LTD and TATA STEEL LTD. The study covers a period of five years
from 2013-14 to 2016-17.
This period is enough to cover both the short and medium terms fluctuations and
to set reliability.
9

10
COMPANY PROFILE
INTRODUCTION
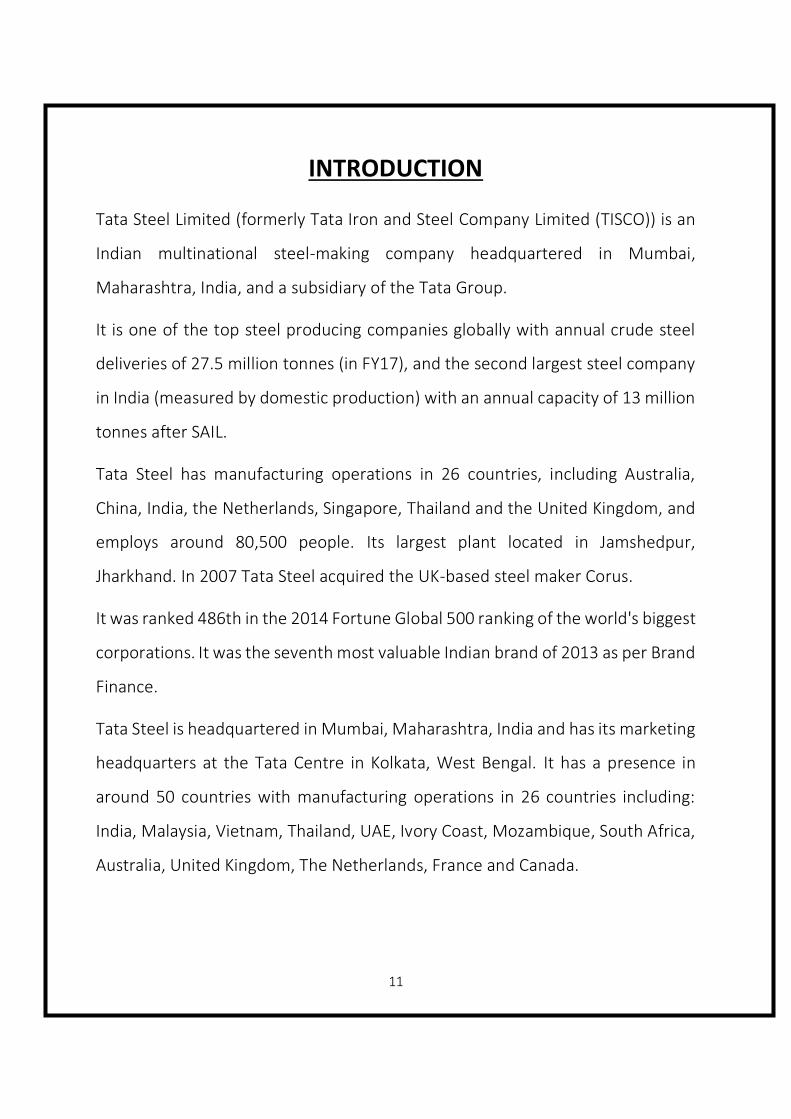
Tata Steel Limited (formerly Tata Iron and Steel Company Limited (TISCO)) is an
Indian multinational steel-making company headquartered in Mumbai,
Maharashtra, India, and a subsidiary of the Tata Group.
It is one of the top steel producing companies globally with annual crude steel
deliveries of 27.5 million tonnes (in FY17), and the second largest steel company
in India (measured by domestic production) with an annual capacity of 13 million
tonnes after SAIL.
Tata Steel has manufacturing operations in 26 countries, including Australia,
China, India, the Netherlands, Singapore, Thailand and the United Kingdom, and
employs around 80,500 people. Its largest plant located in Jamshedpur,
Jharkhand. In 2007 Tata Steel acquired the UK-based steel maker Corus.
It was ranked 486th in the 2014 Fortune Global 500 ranking of the world's biggest
corporations. It was the seventh most valuable Indian brand of 2013 as per Brand
Finance.
Tata Steel is headquartered in Mumbai, Maharashtra, India and has its marketing
headquarters at the Tata Centre in Kolkata, West Bengal. It has a presence in
around 50 countries with manufacturing operations in 26 countries including:
India, Malaysia, Vietnam, Thailand, UAE, Ivory Coast, Mozambique, South Africa,
Australia, United Kingdom, The Netherlands, France and Canada.
11

Tata Steel primarily serves customers in the automotive, construction, consumer
goods, engineering, packaging, lifting and excavating, energy and power,
aerospace, shipbuilding, rail and defence and security sectors.
Tata Iron and Steel Company was founded by Jamshedji Tata and established by
Dorabji Tata on 26 August 1907, as part of his father Jamshetji's Tata Group. By
1939 it operated the largest steel plant in the British Empire. The company
launched a major modernization and expansion program in 1951. Later in 1958,
the program was upgraded to 2 million metric tonnes per annum (MTPA) project.
By 1970, the company employed around 40,000 people at Jamshedpur, with a
further 20,000 in the neighbouring coal mines. In 1971 and 1979, there were
unsuccessful attempts to nationalise the company. In 1990, it started expansion
plan and established its subsidiary Tata Inc. in New York. The company changed
its name from TISCO to Tata Steel in 2005.
Tata Steel on Thursday, 12 February 2015 announced buying three strip product
services centres in Sweden, Finland and Norway from SSAB to strengthen its
offering in Nordic region. The company, however, did not disclose value of the
transactions. In September 2017, ThyssenKrupp in Germany and Tata Steel
announced plans to combine their European steelmaking businesses. The deal
will structure the European assets as ThyssenKrupp Tata Steel, a 50-50 joint
venture. The announcement estimated that the company would be Europe’s
second-largest steelmaker.
12

HERITAGE
Jamsetji Nusserwanji Tata (1839 – 1904)
Ratan Tata (1937)
13
The foundation of what would grow to become the Tata group was laid in 1868 by Jamsetji Nusserwanji Tata – then a 29-year-old who had learned the ropes of business while working in his father’s banking firm – when he established a trading company in Bombay.
A visionary entrepreneur, an avowed nationalist and a committed philanthropist, Jamsetji Tata helped pave the path to industrialisation in India by seeding pioneering businesses in sectors such as steel, energy, textiles and hospitality.
The beginning of the 1990s ushered in plenty of change in Indian business. Economic reforms opened up many sectors, signalling increased competition and the arrival of foreign companies. JRD Tata’s death, in 1993, symbolised the end of an era in more ways than one.
Ratan Tata, who took over as chairman in 1991, guided the Tata group in a fast-changing business environment where old rules did not apply and new realities were taking hold.
Mr Tata retired as Chairman of Tata Sons on December 28, 2012.

Natarajan Chandrasekaran (1963)
Mission Statement: Consistent with the vision and values of the founder
Jamsetji Tata, Tata Steel strives to strengthen India’s industrial base through effective utilization of staff and materials. The means envisaged to achieve this are best technology and high productivity, consistent with modern management practices. Tata Steel recognizes that while honesty and integrity are essential ingredients of a strong and stable enterprise, profitability provides the main spark for economic activity. Overall, the Company seeks to scale the heights of excellence in all it does in an atmosphere free from fear, and thereby reaffirms its faith in democratic values.
14
Natarajan Chandrasekaran (53) is Chairman of the board of Tata Sons, the holding company and promoter of more than 100 Tata operating companies with aggregate annual revenues of more than US $100 billion. He joined the board of Tata Sons in October 2016 and was appointed Chairman in January 2017.
Chandra also chairs the boards of several group operating companies, including Tata Steel, Tata Motors, Tata Power, Indian Hotels and Tata Consultancy Services (TCS) — of which he was chief executive from 2009-17.
His appointment as chairman followed a 30-year business career at TCS, which he joined from university. Chandra rose through the ranks at TCS to become CEO and managing director of the leading global IT solutions and consulting firm.

Products and brands Tata Steel’s products include hot and cold rolled coils and sheets, galvanised
sheets, tubes, wire rods, constructions re-bars, rings and bearings. The products
are targeted at automobiles, white goods, construction and infrastructure
markets. In an effort to de-commoditise steel, the company has introduced
brands like
Tata Wiron (wire rods for farming and fencing segment),
Tata Steelium (cold rolled steel for auto ancillaries and the general
engineering segments),
Tata Shaktee (corrugated galvanised sheets for rural house builder
segments),
Tata Tiscon (re-bars for individual house-builder semi-urban segment)
Tata Pipes (pipes for individual house builder and farming segments),
Tata Bearings (bearings for Original equipment manufacturer and
replacement market) and
Tata Agrico (agricultural equipment for farming and construction
segment).
The company has focused on increasing the sale of its branded products and
the sale of its branded products and the sales of these products as a proportion
of its total sales has shown a constant increase over the last few years.
15

COMPANY PROFILE
16

INTRODUCTION
Jindal Steel and Power Limited (JSPL) is an Indian steel and energy company based
on New Delhi, India. With turnover of approx. US$ 3.3 billion, JSPL is a part of
about US$18 billion diversified Jindal Group conglomerate. JSPL is a leading
player in steel, power, mining, oil and gas and infrastructure in India. The
company produces steel and power through backward integration from its own
captive coal and iron-ore mines.
In terms of tonnage, it is the third largest steel producer in India. The company
manufactures and sells sponge iron, mild steel slabs, Ferro chrome, iron ore, mild
steel, structural, hot rolled plates and coils and coal-based sponge iron plant.
In 1969, O. P. Jindal (1930–2005) started Pipe Unit Jindal India Limited at Hisar,
India. After Jindal's death in 2005, much of his assets were transferred to his wife,
Savitri Jindal. Jindal Group's management was then split among his four sons with
Naveen Jindal as the Chairman of Jindal Steel and Power Limited. His elder
brother, Sajjan Jindal is the head of JSW Group, part of O.P. Jindal Group.
17

HERITAGE OM PRAKASH JINDAL (1930 – 2005)
Shri. Om Prakash Jindal, Founder Chairman of the Jindal Group was born on August 7, 1930, to a farmer in Nalwa village of Hisar district in Haryana. Having interest in technology from a young age, he started his industrial career with a humble bucket-manufacturing unit in Hisar in 1952. In 1964, he commissioned a pipe unit, Jindal India Limited followed by a large factory in 1969 under the name of Jindal Strips Limited.
Shri. Jindal envisioned a self-reliant India in every sector of industry. To fructify this vision, he gathered the latest technical know-how from around the world and strengthened his industrial establishment.
Recognising his outstanding contribution to the Indian steel industry, Shri. O. P. Jindal was conferred the prestigious "Life Time Achievement Award" by the Bengal Chamber of Commerce & Industry in November 2004.
A visionary who is remembered for his business excellence and social responsibilities alike, Shri Jindal believed that without the upliftment of weak and backward sections of the society, a nation can never prosper. Thus, he spent a lot of time in taking steps to alleviate poverty and boost the backward sections of the society.
He was above caste politics and wanted to ensure a rightful place for every individual in politics, regardless of his caste, colour and creed. He firmly believed that all differences could be amicably resolved through meaningful dialogues. With this conviction, he forayed into politics and attained great success there as well. He was elected a Member of the Haryana Legislative Assembly three times and a Member of Parliament in the 11th Lok Sabha, from the Kurukshetra constituency of Haryana, with a landslide victory in 1996. He also served as the Minister of Power, Govt. of Haryana. His multifarious career was tragically cut short with his accidental death on March 31, 2005.
"Where others saw walls, he saw doors" - that is how Shri. Jindal's vision has been expressed. His journey from a humble origin to being a successful industrialist, a philanthropist, a politician and a leader, will be a great source of inspiration for
generations to come.
18

PRODUCTS
Jindal Steel and Power products are energised by the buoyancy of innovation that enables the distinction of being a trailblazer. Customisation is at the core of all our product development and our global technology excellence ensures the best in class offerings for the valued customers. The company's continuous growth and enhanced capabilities stand testimony of the ceaseless drive for excellence.
RAILS The rails can be supplied in a customised finished lengths ranging from 13 meter to 121 meter, a modern flash-butt welding plant equipped to produce up to 484 meter long flash butt welded rail panels is also available. The company has the facility for transporting such long rails to the construction sites. The manufacturing plant is equipped with state-of-the-art facilities that aid continuous on-line inspection and quality control, helping to adhere to specifications laid down by the Indian Railways and other international organisations.
PARALLEL FLANGE BEAMS AND COLUMNS The use of these parallel flange sections in the infrastructure, oil & gas and construction sectors such as refineries, metro rail projects, airports, flyovers, power plants, highways, malls and high rise buildings provides ample proof of its superior product quality, product range and customer service.
PLATES AND COILS The plate-cum-coil mill (steckle mill) of 1 MTPA capacity located at Raigarh, Chhattisgarh produces plates ranging from 8 mm to 120 mm in thickness in widths of 1500 mm to 3500 mm and coils in thickness range of 8 mm to 25 mm in widths of 1500 mm to 2500 mm. The plate mill at Angul, Odisha of 1.5 MTPA capacity produces plates in the thickness range of 5-150 mm with a width of up to 5000 mm. The mill is equipped with latest equipment and technology like MULPIC cooling, online ultrasonic testing, trimming shear, slitting unit to produce plates of high strength and excellent surface finish.
19

ANGLES AND CHANNELS This continuous mill is a first-of-its-kind in India, equipped with advanced rolling mill technology and equipment from Danieli, Italy. These sections are used in infrastructure, industrial construction and light construction segments such as power plants, transmission line towers / telecom line towers, fabrication, bus / truck bodies, electrical towers (SEBs / railways), industrial sheds, commercial and individual houses, portable houses and so on.
TMT REBARS The production of TMT rebars involve a combination of plastic deformation of steel in austenitic stage followed by quenching and further tempering. The process controls at each critical operation ensure uniform properties in each rebar and provides the TMT rebars with a soft ferrite and pearlite fine grained core, a strong and tough tempered marten site layer imparting it with high ductility as well as strength thus making it ideal for high rises, dams, bridges, individual houses and any critical structures where high yield strength is required without compromising on the elongation properties.
WIRE RODS The wire rods come with the promise of high quality and dimensional precision. The latest technology that comes with Morgan mill assures high degree of thermos mechanical properties along with unparalleled dimensional accuracy, providing consistency of mechanical properties within a coil and from coil to coil. Therefore, the wire rods are the material of choice among wire drawers across the country.
SPONGE IRON The company has the world's largest coal-based sponge iron manufacturing facility at Raigarh, Chhattisgarh and stands out as the market leader in coal-based sponge iron industry within India. Efficient backward integration has rendered it as the only sponge iron manufacturer in the country, with its own captive raw material resources and power generation capacity helping the company to monitor both price and quality of its products.
20

THEORITICAL FRAMEWORK
INTRODUCTION
Finance is life blood of the business. The financial management is the study about the process of procuring and judicious use of financial resources is a view to maximize the value of the firm. There by the value of the owners i.e. the example of equity shareholders in a company is maximized. The traditional view of financial management looks into the following function that a finance manager of a business firm will perform.
1. Arrangement of short-term and long-term funds from the financial institutions.
2. Mobilization of funds through financial instruments like equity shares, bond Preference shares, debentures etc.
3. Orientation of finance with the accounting function and compliance of legal provisions relating to funds procurement, use and distribution. With increase in complexity of modern business situation, the role of the financial manager is not just confirmed to procurement of funds, but his area of functioning is extended to judicious and efficient use of funds available to the firm, keeping in view the objectives of the firm and expectations of providers of funds.
Definition:
Financial Management has been defined differently by different scholars.
1. Howard and Upton:- “Financial Management is the application of the planning and control function to the finance functions”
21

RATIO
A ratio is a number expressed in terms of another. It is a fraction whose numerator is the antecedent and denominator is the consequent. A ratio indicates the quantitative relationship between two figures. It may be expressed in different forms like –
1. Pure Ratio 2. Rates 3. Percentage
FINANCIAL RATIO
It is a ratio between two accounting figures or data expressing the relationship between the two. It is an expression of the relation between different relevant accounting variables.
The Financial statements of a business comprise of (1) the Revenue Statement or the Profit & Loss Account and (2) The Balance Sheet. These include a mass of figures which make it difficult to deduce any inference or decision. An accounting ratio is used to gauge the financial solvency and profitability of the business. It is computed from the basic financial statements periodically published by the business and it highlights in arithmetical terms, the relationships that exist between various items from the financial statements.
FINANCIAL RATIO ANALYSIS
It is an analytical tool used for financial analysis. It is a process of determination and interpretation of the numerical relationships between the financial data published by business in periodical statement. It aims at facilitating comparisons with the positions of other business firms as well as of the same business firm over a number of financial periods. It is done mainly for the following groups:
1. The Management – which, for internal use, wants to ascertain the profitability and solvency of the business. The extended areas over which the Management becomes interested are over or under-trading, over or under-investments, over or under-capitalisation and useful credit policy.
2. The outsiders who are interested in the solvency, liquidity and profitability of a business. Outsiders include creditors, debenture holders, employees, Government and useful credit policy.
22

3. Others like Distress Analysts, Credit Rating Agencies and Auditors also used as financial ratios.
IMPORTANCE OF FINANCIAL RATIO ANALYSIS
1. It helps the management to gauge the efficiency of performance and assess the financial health of the business.
2. It is an essential tool for checking the efficiency with which the working capital is being used and managed.
3. Comparative ratio analysis injects trend analysis. The improvement or deterioration of a business is clearly disclosed by ratio analysis.
4. It helps to make financial forecasts. 5. It is an integral part of introduction of standard costing and budgetary
control. 6. Its inherent feature ‘easiness’ is its greatest advantage. Ratio analysis can
be easily made and easily understood. 7. It helps to make inter-firm comparisons, that is, to know the relative
position of a firm vis-à-vis its competitors. 8. The ability of a firm to pay its short debts denotes its liquidity positions.
LIMITATIONS OF RATIO/RATIO ANALYSIS
1. The result expressed by the application of a ratio may be misleading. Accounting data may remain over or understated in financial statements.
2. The ratio becomes misleading where inconsistent methods are applied for valuations of stock, etc.
3. It is difficult to set up any standard or Ideal Ratio as the basis of comparison.
4. The same ratio may bear different interpretations for two separate business or even, for the same business, in separate years.
5. Ratio analysis is mainly based on past performances. So, its application for the future may lead to erroneous decisions.
23

CLASSIFICATION OF ACCOUNTING RATIOS
Accounting Ratios may be classified or grouped in different ways depending on the results or information expected. But the widely used classifications are made as –
1. Classification on the basis of source; and 2. Classification on the basis of purposes or economic aspects or operations of
the firm.
Source wise classification refers to the sources from which the accounting figures used in the ratio have been derived. Such classification may be made as –
A. Balance Sheet Ratios [between accounting figures taken from the Balance sheet]
B. Revenue Statement (Profit & Loss Account) Ratios [between accounting figures taken from the Profit & Loss Account]
C. Mixed Ratios [between accounting figures taken both Profit & Loss Account and Balance Sheet]
Purpose or aspect wise classification refers to the purpose of computing a ratio. It generally involves information about particular economic aspects of the operations of a firm. Such classification may be made to know –
1. Short-term solvency. 2. Long-run solvency. 3. Efficiency / turnovers. 4. Profitability.
This classification may also be called as – ‘on the basis of uses.’
24

BALANCE SHEET RATIOS
1. Current ratio = 𝐶𝑢𝑟𝑟𝑒𝑛𝑡 𝐴𝑠𝑠𝑒𝑡𝑠
𝐶𝑢𝑟𝑟𝑒𝑛𝑡 𝐿𝑖𝑎𝑏𝑖𝑙𝑖𝑡𝑖𝑒𝑠
To be noted that:
(a) This ratio measures the ability of an enterprise to meet its short-term liabilities.
(b) The Standard Ratio is considered as 2:1. It means perfect ability of the business is existing after keeping funds to meet day to day expenses.
2. Quick ratio or Liquid Ratio or Acid Ratio
Quick Ratio = 𝑄𝑢𝑖𝑐𝑘 𝑜𝑟 𝐿𝑖𝑞𝑢𝑖𝑑 𝐴𝑠𝑠𝑒𝑡𝑠
𝑄𝑢𝑖𝑐𝑘 𝐿𝑖𝑎𝑏𝑖𝑙𝑖𝑡𝑖𝑒𝑠
or Current Assets−Inventory−Prepaid Expenses
Current Liabilities−Bank 𝑂𝑣e𝑟𝑑𝑟𝑎𝑓𝑡
To be noted that:
(a) Quick Ratio is used to ascertain the immediate solving of a firm. (b) The minimum desired ratio is 1:1. A firm must have at least one rupee to
pay one rupee of its quick liabilities.
3. Super Quick Ratio = Cash+Bank+Marketable Securities
Quick Liabilities
To be noted that:
(a) It measures the very immediate ability of a firm to meet its quick liabilities. (b) It comes to use in banks and other financial institutions.
25
4. Debt Equity Ratio = 𝐿𝑜𝑛𝑔 𝑡𝑒𝑟𝑚 𝐷𝑒𝑏𝑡𝑠 [𝐸𝑥𝑡𝑒𝑟𝑛𝑎𝑙 𝐸𝑞𝑢𝑖𝑡𝑖𝑒𝑠]
𝑆ℎ𝑎𝑟𝑒ℎ𝑜𝑙𝑑𝑒𝑟′𝑠 𝐹𝑢𝑛𝑑𝑠 [𝐸𝑞𝑢𝑖𝑡𝑦]
To be noted that: (a) This ratio is used to ascertain the respective claims of the outsiders and
the owners like Equity Shareholders within the assets of a firm. (b) If this ratio is high that may indicate – (i) Too much dependence on
outside funds; (ii) Greater financial risks in payment of interests and repayment of the loans taken in due time; (iii) Reduced margin of safety of creditors.
5. Fixed Asset-proprietorship Ratio
Or = 𝐹𝑖𝑥𝑒𝑑 𝐴𝑠𝑠𝑒𝑡𝑠
𝑃𝑟𝑜𝑝𝑟𝑖𝑒𝑡𝑜𝑟′𝑠 𝐹𝑢𝑛𝑑𝑠
Net Block to Proprietorship Ratio To be noted that: (a) This ratio indicates how much of the proprietor’s funds has been
blocked by fixed assets. (b) The result should be less than 1.
6. Current Assets Proprietorship Ratio = 𝐶𝑢𝑟𝑟𝑒𝑛𝑡 𝐴𝑠𝑠𝑒𝑡𝑠
𝑃𝑟𝑜𝑝𝑟𝑖𝑒𝑡𝑜𝑟′𝑠 𝐹𝑢𝑛𝑑𝑠
To be noted that: (a) This ratio indicates how much of the proprietor’s funds have been used
for current-trading of the concern.
7. Capital Gearing Ratio = 𝑆𝑒𝑐𝑢𝑟𝑖𝑡𝑖𝑒𝑠 𝑏𝑒𝑎𝑟𝑖𝑛𝑔 𝑓𝑖𝑥𝑒𝑑 𝑐ℎ𝑎𝑟𝑔𝑒𝑠
𝐸𝑞𝑢𝑖𝑡𝑦 𝑆ℎ𝑎𝑟𝑒ℎ𝑜𝑙𝑑𝑒𝑟′𝑠 𝐹𝑢𝑛𝑑𝑠
To be noted that: (a) Securities bearing fixed charges = Preference Share Capital + Debenture
+ Long-term Debts; AND (b) Equity Shareholder’s Funds = Equity Share Capital + Reserves & Surplus
– Fictitious assets.
26

8. Total Assets to Debt Ratio = 𝑇𝑜𝑡𝑎𝑙 𝐴𝑠𝑠𝑒𝑡𝑠
𝐿𝑜𝑛𝑔−𝑡𝑒𝑟𝑚 𝐷𝑒𝑏𝑡𝑠
To be noted that: (a) Total Assets means Non-Current Assets + Current Assets. But fictitious
assets and Deferred Tax Assets (Advance Payment of Tax) should not be included within total Assets.
(b) Long-term Debts should be including – (i) Long-term borrowings (like Debenture and Bank Loan); (ii) Other Non-Current Liabilities; and (iii) Long-term Provisions.
9. Cash Position Ratio = Cash + Cash Equivalent
Total Assets
Where cash equivalent = Bank Balance + Marketable Securities readily convertible into known amount of cash. To be noted that: (a) It indicates how much (portion) of the total assets is represented by
cash and cash equivalent. (b) If the ratio is high, that indicates availability of sufficient cash to meet
the dues in time.
10. Cash to Current Liabilities Ratio
Or = 𝐶𝑎𝑠ℎ + 𝐶𝑎𝑠ℎ 𝐸𝑞𝑢𝑖𝑣𝑎𝑙𝑒𝑛𝑡
𝐶𝑢𝑟𝑟𝑒𝑛𝑡 𝐿𝑖𝑎𝑏𝑖𝑙𝑖𝑡𝑖𝑒𝑠
Absolute Cash Ratio To be noted that: (a) This ratio shows how much liquid funds are available for paying each
rupee of current liabilities. So, it is a measure of available cash to discharge current liabilities.
27

11. Cash Interval /Cash Defensive Interval= 𝑄𝑢𝑖𝑐𝑘 𝐴𝑠𝑠𝑒𝑡𝑠
𝐴𝑣𝑒𝑟𝑎𝑔𝑒 𝑃𝑟𝑜𝑗𝑒𝑐𝑡𝑒𝑑 𝐷𝑎𝑖𝑙𝑦 𝐶𝑎𝑠ℎ 𝐸𝑥𝑝𝑒𝑛𝑠𝑒𝑠
Where (a) Quick Assets = Cash + Bank + Marketable Securities + Receivables; AND
(b) Projected Daily Cash Expense = 𝐴𝑛𝑛𝑢𝑎𝑙 𝑐𝑎𝑠ℎ 𝑜𝑝𝑒𝑟𝑎𝑡𝑖𝑛𝑔 𝑒𝑥𝑝𝑒𝑛𝑠𝑒𝑠
365
To be noted:
(a) Here ‘Interval’ denotes the time gap during which further cash may not be generated.
(b) The ratio shows how long the normal activities of a concern can be carried on with the available quick assets, even if cash is not generated.
12. Cash Burn Ratio = 365 𝑑𝑎𝑦𝑠 𝑥𝑃𝑟𝑜𝑗𝑒𝑐𝑡𝑒𝑑 𝐶𝑎𝑝𝑖𝑡𝑎𝑙 𝐸𝑥𝑝𝑒𝑛𝑑𝑖𝑡𝑢𝑟𝑒 𝐹𝑜𝑟 𝑆𝑡𝑎𝑟𝑡 𝑢𝑝
𝐶𝑎𝑠ℎ 𝑅𝑎𝑖𝑠𝑒𝑑 𝑓𝑟𝑜𝑚 𝐼𝑛𝑖𝑡𝑖𝑎𝑙 𝐼𝑛𝑣𝑒𝑠𝑡𝑜𝑟𝑠
Or
365 𝑑𝑎𝑦𝑠 𝑥 𝐶𝑎𝑠ℎ 𝑅𝑎𝑖𝑠𝑒𝑑 𝑓𝑟𝑜𝑚 𝐼𝑛𝑖𝑡𝑖𝑎𝑙 𝐼𝑛𝑣𝑒𝑠𝑡𝑜𝑟𝑠
𝑃𝑟𝑜𝑗𝑒𝑐𝑡𝑒𝑑 𝑆𝑡𝑎𝑟𝑡 𝑢𝑝 𝐶𝑎𝑝𝑖𝑡𝑎𝑙 𝐸𝑥𝑝𝑒𝑛𝑑𝑖𝑡𝑢𝑟𝑒
To be noted that:
(a) At the initial or formative stage of a company, its management should know how long the business can run with the limited amount of money it has been able to raise from the initial public offer. In other words, they must know the length of the period till which the company resumes normal earning. This ratio confirms such period of waiting.
(b) Its correct calculation can help to avoid disturbances in normal function or shutdown of the business due to dearth of funds.
28
13. Other Ratios
(a) Debts to Capital Employed = 𝑇𝑜𝑡𝑎𝑙 𝐷𝑒𝑏𝑡𝑠
𝑇𝑜𝑡𝑎𝑙 𝐶𝑎𝑝𝑖𝑡𝑎𝑙 𝐸𝑚𝑝𝑙𝑜𝑦𝑒𝑑
Owners prefer high debts ratio, but creditors like low debt ratio.
(b) Current Assets to Fixed Assets = 𝐶𝑢𝑟𝑟𝑒𝑛𝑡 𝐴𝑠𝑠𝑒𝑡𝑠
𝐹𝑖𝑥𝑒𝑑 𝐴𝑠𝑠𝑒𝑡𝑠
Helps to locate position of storage of stock, trend of collection from
debtors, etc.
(c) Inventory to Working Capital = 𝐼𝑛𝑣𝑒𝑛𝑡𝑜𝑟𝑦
𝑊𝑜𝑟𝑘𝑖𝑛𝑔 𝐶𝑎𝑝𝑖𝑡𝑎𝑙
It shows the portion of working blocked within working capital and
the nature of movement of stock.
29

RESEARCH METHODOLOGY
Research methodology is a way to systematically solve the research problem. It may be understood as a science of studying how research is done scientifically. So, the research methodology not only talks about the research methods but also considers the logic behind the method used in the context of the research study.
1. Research Design
Descriptive research is used in this study because it will ensure the minimization of bias and maximization of reliability of data collected. The researcher had to use fact and information already available through financial statements of earlier years and analyse these to make critical evaluation of the available material. Hence by making the type of the research conducted to be both Descriptive and Analytical in nature.
From the study, the type of data to be collected and the procedure to be used for this purpose were decided.
2. Data Collection
The required data for the study are basically secondary in nature and the data are collected from the audited reports of the company. a) Primary Data:
Primary data are those data, which is originally collected afresh. In this project, Websites and Books has been used for gathering required information.
b) Sources of Data: The sources of data are from the annual reports of the company from the year 2013-2014 to 2016-2017.
30

3. Methods of Data Analysis
The data collected were edited, classified and tabulated for analysis. The analytical tools used in this study. a) Analytical Tool Applied
The study employs the following analytical tools:
Comparative Statement
Graph
Trend Percentage
Ratio Analysis
31

DATA ANALYSIS AND INTERPRETATION A COMPARATIVE FINANCIAL PERFORMANCE ANALYSIS OF TATA STEEL &
JINDAL STEEL AND POWER BY MEANS OF RATIOS
1) Gross Profit Ratio = 𝐺𝑟𝑜𝑠𝑠 𝑃𝑟𝑜𝑓𝑖𝑡
𝑁𝑒𝑡 𝑆𝑎𝑙𝑒𝑠 × 100
Gross profit = Sales – Material Consumed – Manufacturing Expense
TATA STEEL LTD
YEAR 2017 2016 2015 2014 2013
GROSS PROFIT
30,311.98 22,069.54 25,124.13 26,452.33 23,672.23
NET SALES
47,993.02 38,210.34 41,785 41,711.03 38,199.43
GROSS PROFIT RATIO
63.16% 57.76% 60.13% 63.42% 61.97%
JINDAL STEEL
YEAR 2017 2016 2015 2014 2013
GROSS PROFIT
4,659.79 6,921.38 6,040.82 6,853.98 7,235.98
NET SALES 13848.10 12548.39 13390.35 14544.02 14954.70
GROSS PROFIT RATIO
33.65% 55.16% 45.11% 47.13% 48.38%
32

Changes in Gross Profit Ratio
YEAR 2013 & 2014
2013 & 2015
2013 & 2016
2013 & 2017
TATA STEEL LTD
2.34% (Increase)
-2.96% (Decrease)
-6.79% (Decrease)
1.92% (Increase)
JINDAL STEEL
-2.58% (Decrease)
-6.76% (Decrease)
14.01% (Increase)
-30.45% (Decrease)
INTERPRETATION
The above chart shows that in Tata Steel, gross profit ratio is decreasing in 2016 as compared to the year 2015 but in year 2014 & 2017 profit gradually increasing this is due to decrease in cost of sales and in Jindal steel, gross profit ratio is increasing gradually in year 2016 as compared to previous years.
33
0
10
20
30
40
50
60
70
2013 2014 2015 2016 2017
Gross Profit Ratio
TATA STEEL JINDAL STEEL

2) Operating profit Ratio = 𝑂𝑝𝑒𝑟𝑎𝑡𝑖𝑛𝑔 𝑃𝑟𝑜𝑓𝑖𝑡
𝑁𝑒𝑡 𝑆𝑎𝑙𝑒𝑠 × 100
TATA STEEL LTD
YEAR 2017 2016 2015 2014 2013
OPERATING PROFIT
11,875.95 7211.75 10008.80 12,816.90 11,126.24
NET SALES 47993.02 38,210.34 41,785 41,711.03 38,199.43
OPERATING PROFIT RATIO
24.74% 18.87% 23.95% 30.73% 29.13%
JINDAL STEEL
YEAR 2017 2016 2015 2014 2013
OPERATING PROFIT
2,858.19 2,177.24 3,705.68 3,758.86 3,938.45
NET SALES 13,848.10 12,548.39 13,390.35 14,544.03 14,954.70
OPERATING PROFIT RATIO
20.64% 17.35% 27.67% 25.84% 26.33%
34
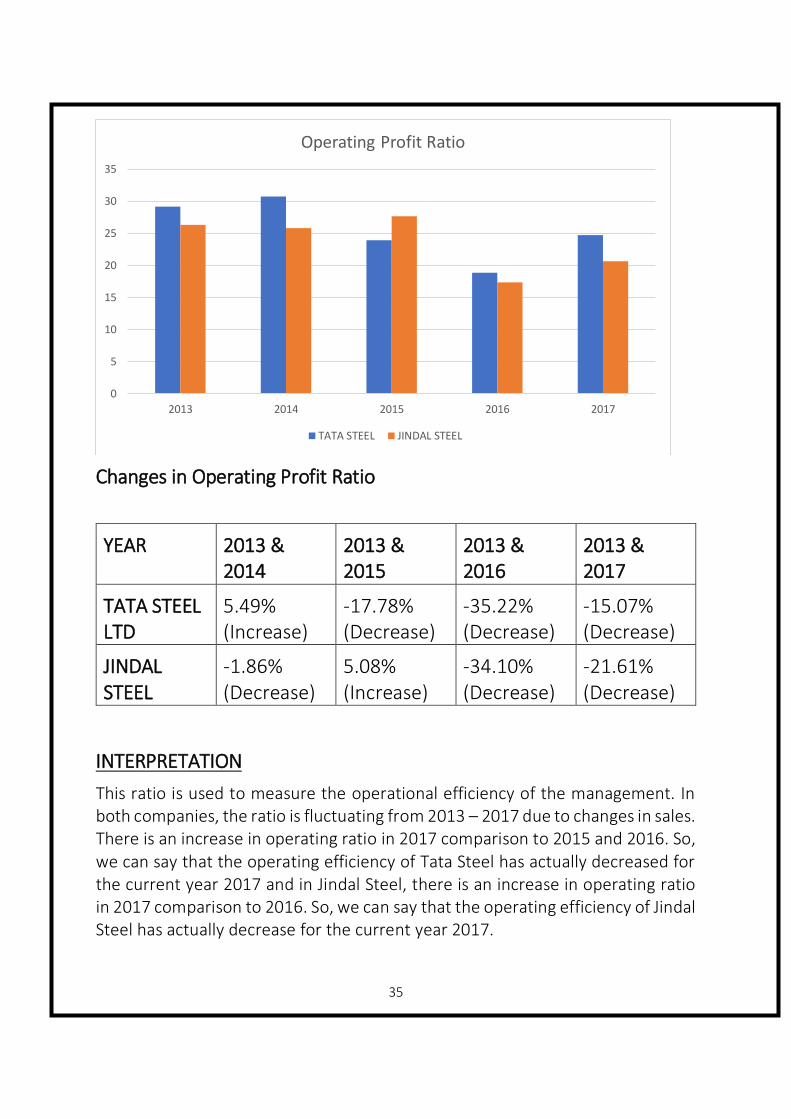
Changes in Operating Profit Ratio
YEAR 2013 & 2014
2013 & 2015
2013 & 2016
2013 & 2017
TATA STEEL LTD
5.49% (Increase)
-17.78% (Decrease)
-35.22% (Decrease)
-15.07% (Decrease)
JINDAL STEEL
-1.86% (Decrease)
5.08% (Increase)
-34.10% (Decrease)
-21.61% (Decrease)
INTERPRETATION
This ratio is used to measure the operational efficiency of the management. In both companies, the ratio is fluctuating from 2013 – 2017 due to changes in sales. There is an increase in operating ratio in 2017 comparison to 2015 and 2016. So, we can say that the operating efficiency of Tata Steel has actually decreased for the current year 2017 and in Jindal Steel, there is an increase in operating ratio in 2017 comparison to 2016. So, we can say that the operating efficiency of Jindal Steel has actually decrease for the current year 2017.
35
0
5
10
15
20
25
30
35
2013 2014 2015 2016 2017
Operating Profit Ratio
TATA STEEL JINDAL STEEL

3) Net Profit Ratio = 𝑃𝑟𝑜𝑓𝑖𝑡 𝐴𝑓𝑡𝑒𝑟 𝑇𝑎𝑥
𝑁𝑒𝑡 𝑆𝑎𝑙𝑒 × 100
TATA STEEL LTD
YEAR 2017 2016 2015 2014 2013
PROFIT AFTER TAX
4147.93 6483.50 4548.27 6553.95 5737.50
NET SALES 47993.02 38,210.34 41,785 41,711.03 38,199.43
NET PROFIT RATIO
8.64% 16.96% 10.88% 15.71% 15.02%
JINDAL STEEL
YEAR 2017 2016 2015 2014 2013
PROFIT AFTER TAX
-986.45 -1018.88 497.09 1291.95 1592.55
NET SALES 13848.10 12548.39 13390.35 14544.02 14954.70
NET PROFIT RATIO
-7.12% (Loss)
-8.12% (Loss)
3.71% 8.88% 10.65%
36

YEAR 2013 & 2014
2013 & 2015
2013 & 2016
2013 & 2017
TATA STEEL LTD
4.59% (Increase)
-27.56% (Decrease)
-12.92% (Decrease)
-42.48% (Decrease)
JINDAL STEEL
-16.62% (Decrease)
-65.16% (Decrease)
-176.24% (Decrease)
-166.85% (Decrease)
INTERPRETATION
We can see that there is a decrease in the Net Profit margin from 2013 to 2017 except in the year 2016. So, we can see that the profitability of Tata Steel has actually decreased in 2017 than of 2016, 2015, 2014 and 2013. And in Jindal Steel, the Net Profit margin is decreasing constantly from 2013 to 2017.
37
-10
-5
0
5
10
15
20
2013 2014 2015 2016 2017
Net Profit Ratio
TATA STEEL JINDAL STEEL

4) Return on Capital Employed = 𝑃𝐵𝐷𝐼𝑇−𝐷𝑒𝑝𝑟𝑒𝑐𝑖𝑎𝑡𝑖𝑜𝑛
𝐶𝑎𝑝𝑖𝑡𝑎𝑙 𝐸𝑚𝑝𝑙𝑜𝑦𝑒𝑑× 100
TATA STEEL LTD
YEAR 2017 2016 2015 2014 2013
PBDIT 12290.41 11102.45 10591.58
13604.54 12028.28
DEPRECIATION 3541.55 1933.11 1997.59 1928.70 1640.38
CAPITAL EMPLOYED
79868.05 101470.51
92874.14
87274.77 81121.19
RETURN ON CAPITAL EMPLOYED
10.95% 9.04% 9.25% 13.38% 12.80%
JINDAL STEEL
YEAR 2017 2016 2015 2014 2013
PBDIT 2867.07 2481.31 4002.12 3905.71 4097.73
DEPRECIATION 2043.65 1492.10 1785.56 1221.44 1048.46
CAPITAL EMPLOYED
45929.54 35356.50 38626.26 35731.24 31849.01
RETURN ON CAPITAL EMPLOYED
1.79% 2.79% 5.74% 7.51% 9.57%
38

YEAR 2013 & 2014
2013 & 2015
2013 & 2016
2013 & 2017
TATA STEEL LTD
4.53% (Increase)
-27.73% (Decrease)
-29.37% (Decrease)
-14.45% (Decrease)
JINDAL STEEL
-21.52% (Decrease)
-40.02% (Decrease)
-70.85% (Decrease)
-81.29% (Decrease)
INTERPRETATION
Return on capital employed measures the efficiency with which investment made by the shareholders. In Tata Steel Ltd, this ratio is fluctuating. In 2013 and 2014, it is increased but next two years, it is decreasing. And in Jindal Steel Ltd, this ratio is decreasing continuously from 2013 to 2017.
39
0
2
4
6
8
10
12
14
16
2013 2014 2015 2016 2017
Return on Capital Employed
TATA STEEL JINDAL STEEL

5) Return on Long Term Fund = 𝑃𝐵𝐷𝐼𝑇−𝐷𝑒𝑝𝑟𝑒𝑐𝑖𝑎𝑡𝑖𝑜𝑛
𝑆𝑒𝑐𝑢𝑟𝑒𝑑 𝐿𝑜𝑎𝑛+𝑈𝑛𝑠𝑒𝑐𝑢𝑟𝑒𝑑 𝐿𝑜𝑎𝑛× 100
TATA STEEL LTD
YEAR 2017 2016 2015 2014 2013
PBDIT 12290.41 11102.45 10591.58 13604.54 12028.28
DEPRECIATION 3541.55 1933.11 1997.59 1928.70 1640.38
SECURED LOAN 4826.77 4613.91 4507.64 4400.55 4311.02
UNSECURED LOAN
25382.27 26379.88 21702.61 21726.23 21600.49
RETURN ON LONG TERM FUND
28.96% 29.58% 32.78% 44.68% 40.08%
JINDAL STEEL
YEAR 2017 2016 2015 2014 2013
PBDIT 2867.07 2481.31 4002.12 3905.71 4097.73
DEPRECIATION 2043.65 1492.10 1785.56 1221.44 1048.46
SECURED LOAN 18860.54 23915.03 17705.89 12707.31 11577.42
UNSECURED LOAN
5302.80 0 8409.16 9959.60 7923.52
RETURN ON LONG TERM FUND
3.41% 4.14% 8.49% 11.84% 15.64%
40

YEAR 2013 & 2014
2013 & 2015
2013 & 2016
2013 & 2017
TATA STEEL LTD
11.47% (Increase)
-18.21% (Decrease)
-26.19% (Decrease)
-27.74% (Decrease)
JINDAL STEEL
-24.29% (Decrease)
-45.72% (Decrease)
-73.53% (Decrease)
-78.19% (Decrease)
INTERPRETATION
Return on long term measures the efficiency with which the investment made by the debenture holders & long term debt is used in the business. In Tata Steel Ltd & Jindal Steel Ltd, this ratio is constantly decreases and it is not good for the company.
41
0
5
10
15
20
25
30
35
40
45
50
2013 2014 2015 2016 2017
Return on Long Term Fund
TATA STEEL JINDAL STEEL
CONCLUSION
The Tata Steel Ltd is in sound solvency position.
The Year 2015, 2016 and 2017 shows the higher loss for both
company.
Gross profit ratio are increased during the period of 2015-2016,
which indicates that firm’s efficient management in
manufacturing and trading operations.
Operating profit ratio are increased during the period of 2016-
2017 and decreased during the period 2014-2016 which indicates
the operating efficiency of both company.
Net profit ratio are decreased during the period of 2013-2017.
Return on capital employed are increased during the period of
2013-2014 and decreased during the period of 2015-2016 in Tata
Steel Ltd. In Jindal Steel Ltd, the ratio is decreasing continuously
from 2013-2017.
Return on long term fund are decreased during the period of
2013-2017 which indicates the investment made by the
debenture holders and long term debt is used in the business.
42

RECOMMENDATION
All operational and related activities should be performed
efficiently and effectively.
Both company have to utilize their capital assets in a proper way
that they have to purchase less capital assets in coming year.
The stability of the Tata Steel Ltd has declined from base year
2015 to current year 2017.
Tata Steel Ltd have sound solvency position but the company
have to avail on the benefit of trading on equity and has to use
cheaper debt capital.
The government intervention in promoting ‘Make in India’ in
public procurement has resulted in Indian companies garnering
over Rs 50 billion in projects.
One of the beneficiaries is Jindal Steel and Power Ltd (JSPL). It had
earlier been kept out of procurement for rails, but is likely to
receive 20 per cent of the tendered volume under the new policy.
The size of the tender is estimated to be around Rs 30 billion, of
which JSPL may receive orders worth Rs 6 billion.
43

BIBLIOGRAPHY
Following books are referred for carrying out the project:-
1. Amitabha Basu, Financial Accounts, Volume – 3, Edition - August-
2017, accounting ratios for financial statement analysis, page –
829 – 835.
2. Annual reports of Tata Steel LTD and Jindal Steel.
Following websites are referred:-
1. https://www.ibef.org/industry/steel.aspx
2. http://www.tatasteel.com/
3. http://www.jindalsteelpower.com/
4. https://www.wikipedia.org/
5. https://money.rediff.com/index.html
6. http://www.business-standard.com/article/companies/make-in-
india-in-public-procurement-companies-bag-rs-50-bn-govt-
contracts-118040301360_1.html
44

ANNEXURE
Balance Sheet of Tata Steel Ltd ………………..in Rs. Cr. ………………..
March '17 March '16 March '15 March '14 March '13
Sources of Funds
Owner's Fund
Equity share capital 971.41 971.41 971.41 971.41 971.41
Share application money - - - - -
Preference share capital - - - - -
Reserve & surplus 48,687.60 69,505.31 65,692.48 60,176.58 54,238.27
Loan funds
Secured loans 4,826.77 4,613.91 4,507.64 4,400.55 4,311.02
Unsecured loans 25,382.27 26,379.88 21,702.61 21,726.23 21,600.49
Total 79,868.05 1,01,470.51 92,874.14 87,274.77 81,121.19
Uses of funds
Fixed assets
Gross block 80,728.28 43,791.68 41,791.52 39,019.72 38,056.28
Less : revaluation reserve
Less : accumulated depreciation 8,161.13 18,363.09 16,543.00 14,753.97 13,181.23
Net Block 72,567.15 25,428.59 25,248.52 24,265.75 24,875.05
Capital work-in-progress 6,163.96 26,982.37 23,036.67 18,509.40 8,722.29
Investments 13,665.71 56,680.59 53,164.32 54,661.80 50,418.80
Net current assets
Current assets, loans & advances 19,068.59 14,116.60 14,227.61 13,603.46 17,860.79
Less: current liabilities & provisions 31,597.36 21,737.64 22,802.98 23,765.64 20,755.74
Total net current assets -12,528.77 -7,621.04 -8,575.37 -10,162.18 -2,894.95
Miscellaneous expenses not written - - - - -
Total 79,868.05 1,01,470.51 92,874.14 87,274.77 81,121.19
Notes:
Book value of unquoted investments 42,249.89 55,564.84 52,088.86 53,615.18 49,434.56
Market value of quoted investments 6,475.22 4,745.79 11,528.97 8,390.72 4,904.96
Contingent liabilities 44,298.52 38,595.95 14,610.35 17,398.71 18,999.02
Number of equity shareoutstanding(Lacs) 9,712.15 9712.15 9712.15 9712.15 9712.15 45

Profit loss account of Tata Steel Ltd ……………..in Rs. Cr. …………….
March' 17 March' 16 March' 15 March' 14 March' 13
Income
Operating income 47,993.02 38,210.34 41,785.00 41,711.03 38,199.43
Expenses
Material consumed 14,800.12 13,259.63 13,956.45 12,486.39 12,017.03
Manufacturing expenses 2,880.92 2,881.17 2,704.42 2,772.31 2,510.17
Personnel expenses 4,605.13 4,324.90 4,601.92 3,673.08 3,608.52
Selling expenses - - - - -
Adminstrative expenses 13,830.90 10,532.89 10,513.41 9,962.35 8,937.47
Expenses capitalised - - - - -
Cost of sales 36,117.07 30,998.59 31,776.20 28,894.13 27,073.19
Operating profit 11,875.95 7,211.75 10,008.80 12,816.90 11,126.24
Other recurring income 414.16 3,890.70 582.78 787.64 902.04
Adjusted PBDIT 12,290.41 11,102.45 10,591.58 13,604.54 12,028.28
Financial expenses 2,688.55 1,460.27 1,975.95 1,820.58 1,876.77
Depreciation 3,541.55 1,933.11 1,997.59 1,928.70 1,640.38
Other write offs - - - - -
Adjusted PBT 6,060.31 7,709.07 6,618.04 9,855.26 8,511.13
Tax charges 1,912.38 1,225.57 2,069.77 3,301.31 2,773.63
Adjusted PAT 4,147.93 6,483.50 4,548.27 6,553.95 5,737.50
Non recurring items -703.38 -1,582.55 1,890.85 -141.76 -674.53
Other non cash adjustments - - - - -
Reported net profit 3,444.55 4,900.95 6,439.12 6,412.19 5,062.97
Earnings before appropriation 13,520.30 38,893.29 35,869.70 31,401.62 26,208.01
Equity dividend 987.42 627.67 623.95 905.02 776.97
Preference dividend - - - - -
Dividend tax 55.65 149.30 153.02 66.19 128.73
Retained earnings 12,477.23 38,116.32 35,092.73 30,430.41 25,302.31
46

Balance sheet of Jindal Steel Ltd ………………..in Rs. Cr. ………………..
March '17 March '16 March '15 March '14 March '13
Sources of Funds
Owner's Fund
Equity share capital 91.5 91.49 91.49 91.49 91.49
Share application money - - - - -
Preference share capital - - - - -
Reserve & surplus 21,674.70 22,974.18 12,419.72 12,972.84 12,254.59
Loan funds
Secured loans 18,860.54 23,915.04 17,705.89 12,707.31 11,577.42
Unsecured loans 5,302.80 - 8,409.16 9,959.60 7,923.52
Total 45,929.54 46,980.71 38,626.26 35,731.24 31,849.01
Uses of funds
Fixed assets
Gross block 45,678.07 45,144.21 34,763.80 24,150.58 18,821.38
Less : revaluation reserve - - - - -
Less : accumulated depreciation 4,202.19 2,120.90 7,548.72 5,891.25 4,665.19
Net Block 41,475.88 43,023.31 27,215.08 18,259.33 14,156.19
Capital work-in-progress 7,529.37 5,685.88 3,563.12 11,663.17 11,483.94
Investments 1,485.25 1,476.94 2,486.96 1,350.52 1,330.72
Net current assets
Current assets, loans & advances 9,626.31 10,410.62 12,905.07 14,876.64 12,839.08
Less: current liabilities & provisions 14,187.27 13,616.04 7,543.97 10,418.42 7,960.92
Total net current assets -4,560.96 -3,205.42 5,361.10 4,458.22 4,878.16
Miscellaneous expenses not written - - - - -
Total 45,929.54 46,980.71 38,626.26 35,731.24 31,849.01
Notes:
Book value of unquoted investments 243.23 232.84 1,828.05 1,691.61 1,330.72
Market value of quoted investments - - 1,108.13 - -
Contingent liabilities 13,849.85 15,629.63 15,057.15 15,349.60 13,356.75
Number of equity shareoutstanding(Lacs) 9,150.24 9,149.04 9,149.04 9,148.86 9,348.34
47

Profit loss account of Jindal Steel Ltd ………………in Rs. Cr. ……………….
Mar' 17 March' 16 March' 15 March' 14 March' 13
Income
Operating income 13,848.10 12,696.44 13,390.35 14,544.02 14,954.70
Expenses
Material consumed 6,844.96 6,926.38 6,085.64 6,763.29 6,780.34
Manufacturing expenses 2,343.35 2,193.76 1,263.89 926.75 939.34
Personnel expenses 531.60 553.82 650.52 552.32 447.89
Selling expenses - - - - -
Adminstrative expenses 1,270.00 581.40 1,684.62 2,542.80 2,848.64
Expenses capitalised - - - - -
Cost of sales 10,989.91 10,255.36 9,684.67 10,785.16 11,016.25
Operating profit 2,858.19 2,441.08 3,705.68 3,758.86 3,938.45
Other recurring income 8.88 23.47 296.44 146.85 159.28
Adjusted PBDIT 2,867.07 2,464.55 4,002.12 3,905.71 4,097.73
Financial expenses 2,280.40 2,646.48 2,048.20 1,083.63 820.77
Depreciation 2,043.65 2,148.14 1,785.56 1,221.44 1,048.46
Other write offs - - - - -
Adjusted PBT -1,456.98 -2,330.07 168.36 1,600.64 2,228.50
Tax charges -470.53 -911.54 -328.73 308.69 635.95
Adjusted PAT -986.45 -1,418.53 497.09 1,291.95 1,592.55
Non recurring items - - -807.77 - -
Other non cash adjustments - - - - -
Reported net profit -986.45 -1,418.53 -310.68 1,291.95 1,592.55
Earnings before appropriation 19,125.99 20,349.98 10,074.50 11,176.66 10,339.60
Equity dividend - - - 136.01 149.57
Preference dividend - - - - -
Dividend tax - - - 1.22 3.32
Retained earnings 19,125.99 20,349.98 10,074.50 11,039.43 10,186.71
48