Final Upper Iowa Mississippi River-Reno Total …March 2020 Upper Iowa River and Mississippi...
106
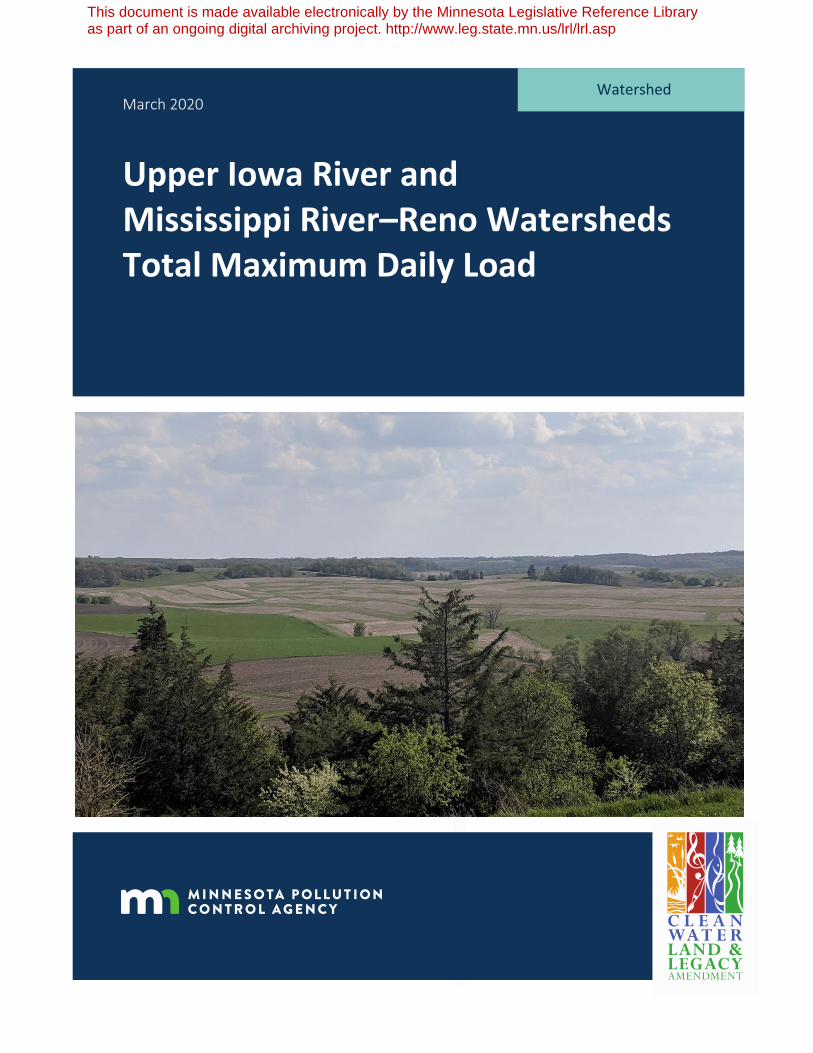
March 2020 Upper Iowa River and Mississippi River–Reno Watersheds Total Maximum Daily Load Watershed This document is made available electronically by the Minnesota Legislative Reference Library as part of an ongoing digital archiving project. http://www.leg.state.mn.us/lrl/lrl.asp
Transcript of Final Upper Iowa Mississippi River-Reno Total …March 2020 Upper Iowa River and Mississippi...
March 2020
Upper Iowa River and Mississippi River–Reno Watersheds Total Maximum Daily Load
Watershed
This document is made available electronically by the Minnesota Legislative Reference Library as part of an ongoing digital archiving project. http://www.leg.state.mn.us/lrl/lrl.asp

Document number: wq-iw9-24e
Authors Andrea Plevan, Tetra Tech
Jennifer Olson, Tetra Tech
Kaitlyn Taylor, Tetra Tech
Ryan Birkemeier, Tetra Tech
Emily Zanon, MPCA
Justin Watkins, MPCA
Cover photo credit: Kaitlyn Taylor, Tetra Tech
The MPCA is reducing printing and mailing costs by using the Internet to distribute reports and
information to wider audience. Visit our website for more information.
The MPCA reports are printed on 100% post-consumer recycled content paper manufactured without
chlorine or chlorine derivatives.

Upper Iowa River and Mississippi River–Reno Watersheds TMDL Report Minnesota Pollution Control Agency
1
Contents Contents .............................................................................................................................................. 1
List of tables ........................................................................................................................................ 3
List of figures ....................................................................................................................................... 4
Abbreviations ...................................................................................................................................... 6
Executive summary .............................................................................................................................. 8
1. Project overview ............................................................................................................................ 9
1.1 Purpose ................................................................................................................................................ 9
1.2 Identification of waterbodies ............................................................................................................ 11
1.3 Priority ranking .................................................................................................................................. 15
2. Applicable water quality standards and numeric water quality targets ........................................ 16
2.1 Designated uses ................................................................................................................................. 16
2.2 Water quality standards .................................................................................................................... 16
3. Watershed and waterbody characterization ................................................................................ 18
3.2 Subwatersheds .................................................................................................................................. 20
3.3 Land use ............................................................................................................................................. 23
3.4 Current/historical water quality ........................................................................................................ 28
3.5 Pollutant source summary ................................................................................................................. 33
3.5.1 E. coli sources ................................................................................................................ 33
3.5.2 TSS sources .................................................................................................................... 47
4. TMDL development approach ...................................................................................................... 51
4.4 Boundary conditions .......................................................................................................................... 53
4.7 E. coli TMDL approach ....................................................................................................................... 54
4.7.1 Loading capacity and percent reductions ...................................................................... 54
4.7.2 Wasteload allocation methodology .............................................................................. 55
4.7.3 Load allocation methodology ........................................................................................ 56
4.8 Total suspended solids TMDL approach ............................................................................................ 56
4.8.1 Loading capacity and percent reductions ...................................................................... 56
4.8.2 Wasteload allocation methodology .............................................................................. 56
5. TMDLs and water quality data summaries ................................................................................... 58
5.1 Mississippi River–Reno Watershed .................................................................................................... 58
5.1.1 Crooked Creek, T102 R4W S27, west line to Bluff Slough (07060001-519) .................. 58
5.1.2 Winnebago Creek, T101 R4W S27, west line to south line (07060001-693) ................. 60
5.2 Upper Iowa River Watershed ............................................................................................................ 64
5.2.1 Upper Iowa River, -92.5901, 43.5985 to Little Iowa River (07060002-550) .................. 64
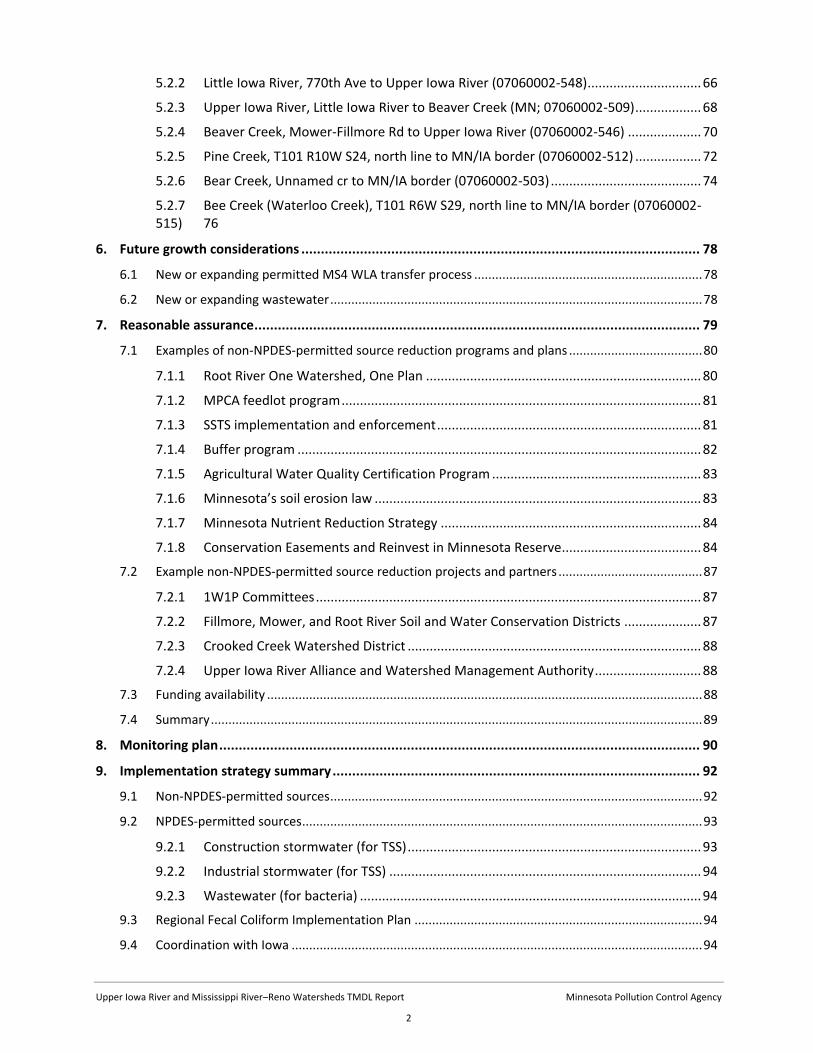
Upper Iowa River and Mississippi River–Reno Watersheds TMDL Report Minnesota Pollution Control Agency
2
5.2.2 Little Iowa River, 770th Ave to Upper Iowa River (07060002-548) ............................... 66
5.2.3 Upper Iowa River, Little Iowa River to Beaver Creek (MN; 07060002-509) .................. 68
5.2.4 Beaver Creek, Mower-Fillmore Rd to Upper Iowa River (07060002-546) .................... 70
5.2.5 Pine Creek, T101 R10W S24, north line to MN/IA border (07060002-512) .................. 72
5.2.6 Bear Creek, Unnamed cr to MN/IA border (07060002-503) ......................................... 74
5.2.7 Bee Creek (Waterloo Creek), T101 R6W S29, north line to MN/IA border (07060002-515) 76
6. Future growth considerations ...................................................................................................... 78
6.1 New or expanding permitted MS4 WLA transfer process ................................................................. 78
6.2 New or expanding wastewater .......................................................................................................... 78
7. Reasonable assurance .................................................................................................................. 79
7.1 Examples of non-NPDES-permitted source reduction programs and plans ...................................... 80
7.1.1 Root River One Watershed, One Plan ........................................................................... 80
7.1.2 MPCA feedlot program .................................................................................................. 81
7.1.3 SSTS implementation and enforcement ........................................................................ 81
7.1.4 Buffer program .............................................................................................................. 82
7.1.5 Agricultural Water Quality Certification Program ......................................................... 83
7.1.6 Minnesota’s soil erosion law ......................................................................................... 83
7.1.7 Minnesota Nutrient Reduction Strategy ....................................................................... 84
7.1.8 Conservation Easements and Reinvest in Minnesota Reserve...................................... 84
7.2 Example non-NPDES-permitted source reduction projects and partners ......................................... 87
7.2.1 1W1P Committees ......................................................................................................... 87
7.2.2 Fillmore, Mower, and Root River Soil and Water Conservation Districts ..................... 87
7.2.3 Crooked Creek Watershed District ................................................................................ 88
7.2.4 Upper Iowa River Alliance and Watershed Management Authority ............................. 88
7.3 Funding availability ............................................................................................................................ 88
7.4 Summary ............................................................................................................................................ 89
8. Monitoring plan ........................................................................................................................... 90
9. Implementation strategy summary .............................................................................................. 92
9.1 Non-NPDES-permitted sources .......................................................................................................... 92
9.2 NPDES-permitted sources .................................................................................................................. 93
9.2.1 Construction stormwater (for TSS) ................................................................................ 93
9.2.2 Industrial stormwater (for TSS) ..................................................................................... 94
9.2.3 Wastewater (for bacteria) ............................................................................................. 94
9.3 Regional Fecal Coliform Implementation Plan .................................................................................. 94
9.4 Coordination with Iowa ..................................................................................................................... 94

Upper Iowa River and Mississippi River–Reno Watersheds TMDL Report Minnesota Pollution Control Agency
3
9.5 Cost .................................................................................................................................................... 95
9.5.1 Implementation cost ..................................................................................................... 95
9.5.2 TSS reduction cost methodology ................................................................................... 95
9.5.3 E. coli reduction cost methodology ............................................................................... 95
9.5.4 Cost references .............................................................................................................. 96
9.6 Adaptive management ...................................................................................................................... 96
10. Public participation ...................................................................................................................... 97
10.1 Public notice ...................................................................................................................................... 97
11. Literature cited ............................................................................................................................ 98
List of tables
Table 1. Impaired waterbodies of Upper Iowa River and Mississippi River – Reno Watersheds. .............. 12
Table 2. Water quality standards for impaired streams ............................................................................. 17
Table 3. Summary of Iowa water quality criteria for E. coli in surface waters designated for primary or
secondary contact recreation (Iowa Department of Natural Resources 2017) .......................................... 17
Table 4. Watershed areas of impaired streams. ......................................................................................... 19
Table 5. Land cover in the impaired watersheds (2017 Cropland Data Layer). .......................................... 23
Table 6. Model reaches used to simulate stream flow in impaired reaches .............................................. 28
Table 7. Summary of water quality data (2008–2017) for impaired reaches ............................................. 31
Table 8. Number of E. coli individual standard exceedances by flow zone. ............................................... 32
Table 9. E. coli production by livestock animal type in non-NPDES-permitted, registered feedlots. ......... 36
Table 10. E. coli production rates of wildlife relative to livestock. ............................................................. 39
Table 11. Estimated ITPHS by county. ........................................................................................................ 40
Table 12. NPDES-permitted CAFOs. ............................................................................................................ 45
Table 13. Summary of E. coli sources. ......................................................................................................... 47
Table 14. TSS loading in Winnebago Creek Watershed (07060001-693) from HSPF model results (Tetra
Tech 2018). .................................................................................................................................................. 50
Table 15. Wastewater wasteload allocations for E. coli. ............................................................................ 56
Table 16. Wastewater wasteload allocation for TSS. ................................................................................. 57
Table 17. Annual summary of E. coli data at Crooked Creek (AUID 07060001-519; April–October). ........ 58
Table 18. Monthly summary of E. coli data at Crooked Creek (AUID 07060001-519; 2008–2017). .......... 59
Table 19. E. coli TMDL summary, Crooked Creek (AUID 07060001-519). .................................................. 60

Upper Iowa River and Mississippi River–Reno Watersheds TMDL Report Minnesota Pollution Control Agency
4
Table 20. Annual summary of E. coli data at Winnebago Creek (AUID 07060001-693; April–October). ... 60
Table 21. Monthly summary of E. coli data at Winnebago Creek (AUID 07060001-693; 2008–2017). ..... 61
Table 22. E. coli TMDL summary, Winnebago Creek (AUID 07060001-693). ............................................. 62
Table 23. Annual summary of TSS data Winnebago Creek (AUID 07060001-693; April–September). ...... 62
Table 24. Monthly summary of TSS data at Winnebago Creek (AUID 07060001-693; 2008–2017). ......... 62
Table 25. TSS TMDL summary, Winnebago Creek (AUID 07060001-693). ................................................. 63
Table 26. Annual summary of E. coli data at Upper Iowa River (AUID 07060002-550; April–October). .... 64
Table 27. Monthly summary of E. coli data at Upper Iowa River (AUID 07060002-550; 2008–2017). ...... 64
Table 28. E. coli TMDL summary, Upper Iowa River (AUID 07060002-550). .............................................. 65
Table 29. E. coli TMDL summary, Little Iowa River (AUID 07060002-548). ................................................ 67
Table 30. Annual summary of E. coli data at Upper Iowa River (AUID 07060002-509; April–October). .... 68
Table 31. Monthly summary of E. coli data at Upper Iowa River (AUID 07060002-509; 2006–2015). ...... 68
Table 32. E. coli TMDL summary, Upper Iowa River (AUID 07060002-509). .............................................. 69
Table 33. Annual summary of E. coli data at Beaver Creek (AUID 07060002-546; April–October). .......... 70
Table 34. Monthly summary of E. coli data at Beaver Creek (AUID 07060002-546; 2008–2017). ............. 70
Table 35. E. coli TMDL summary, Beaver Creek (AUID 07060002-546). ..................................................... 71
Table 36. Annual summary of E. coli data at Bear Creek (AUID 07060002-503; May–October). ............... 74
Table 37. Monthly summary of E. coli data at Bear Creek (AUID 07060002-503; 2008–2017).................. 74
Table 38. E. coli TMDL summary, Bear Creek (AUID 07060002-503). ........................................................ 75
Table 39. Annual summary of E. coli data at Bee Creek (Waterloo Creek) (AUID 07060002-515; April -
October). ..................................................................................................................................................... 76
Table 40. Monthly summary of E. coli data at Bee Creek (Waterloo Creek) (AUID 07060002-515; 2008–
2017). .......................................................................................................................................................... 76
Table 41. E. coli TMDL summary, Bee Creek (Waterloo Creek) (AUID 07060002-515). ............................. 77
Table 42. Preliminary compliance with Minnesota Buffer Law as of January 2019 (BWSR). ..................... 83
Table 43. Conservation lands summary for Fillmore, Houston, and Mower counties (BWSR 2018). ........ 85
List of figures
Figure 1. Upper Iowa River and Mississippi River–Reno Watersheds and impairments addressed in this
report. ......................................................................................................................................................... 10
Figure 2. Tribal lands located in the Mississippi River–Reno Watershed. .................................................. 19
Figure 3. Impairment subwatersheds in the Upper Iowa River Watershed. .............................................. 21

Upper Iowa River and Mississippi River–Reno Watersheds TMDL Report Minnesota Pollution Control Agency
5
Figure 4. Impairment subwatersheds in the Mississippi River–Reno Watershed. ..................................... 22
Figure 5. Land cover in the Upper Iowa River Watershed. ......................................................................... 24
Figure 6. Land cover in the Mississippi River–Reno Watershed. ................................................................ 25
Figure 7. Pre-settlement land cover in the Upper Iowa River Watershed within Minnesota (Marschner’s
presettlement data, obtained from MN Geospatial commons). ................................................................ 26
Figure 8. Pre-settlement land cover in the Mississippi River–Reno Watershed within Minnesota
(Marschner’s presettlement data, obtained from MN Geospatial commons). .......................................... 27
Figure 9. Box plot of E. coli concentration by flow zone for all reaches with E. coli impairments. ............ 32
Figure 10. TSS concentration duration curve for Winnebago Creek. ......................................................... 33
Figure 11. Registered feedlots in impaired watersheds in the Upper Iowa River Watershed. .................. 37
Figure 12. Registered feedlots in impaired watersheds in the Mississippi River–Reno Watershed. ......... 38
Figure 13. NPDES-permitted wastewater facilities in impaired watersheds in Upper Iowa River
Watershed. .................................................................................................................................................. 43
Figure 14. NPDES-permitted wastewater facilities in impaired watersheds in Mississippi River–Reno
Watershed. .................................................................................................................................................. 44
Figure 15. E. coli load duration curve, Crooked Creek (AUID 07060001-519). ........................................... 59
Figure 16. E. coli load duration curve, Winnebago Creek (AUID 07060001-693). ...................................... 61
Figure 17. TSS load duration curve, Winnebago Creek (AUID 07060001-693). .......................................... 63
Figure 18. E. coli load duration curve, Upper Iowa River (AUID 07060002-550). ....................................... 65
Figure 19. E. coli load duration curve, Little Iowa River (AUID 07060002-548). ......................................... 67
Figure 20. E. coli load duration curve, Upper Iowa River (AUID 07060002-509). ....................................... 69
Figure 21. E. coli load duration curve, Beaver Creek (AUID 07060002-546). ............................................. 71
Figure 22. E. coli load duration curve, Pine Creek (AUID 07060002-512). ................................................. 73
Figure 23. E. coli load duration curve, Bear Creek (AUID 07060002-503). ................................................. 75
Figure 24. E. coli load duration curve, Bee Creek (Waterloo Creek) (AUID 07060002-515)....................... 77
Figure 25. Number of BMPs reported as implemented for the Upper Iowa River Watershed from 2004–
2018 (MPCA 2019b). ................................................................................................................................... 81
Figure 26. Number of BMPs reported as implemented in the Mississippi River–Reno Watershed from
2004–2018 (MPCA 2019b). ......................................................................................................................... 81
Figure 27. Reinvest in Minnesota Reserve conservation easements by type. ........................................... 86
Figure 28. Minnesota’s watershed approach. ............................................................................................ 92
Figure 29. General adaptive management process. ................................................................................... 96

Upper Iowa River and Mississippi River–Reno Watersheds TMDL Report Minnesota Pollution Control Agency
6
Abbreviations 1W1P One Watershed, One Plan
AFO animal feeding operation
AU animal unit
AUID assessment unit identification
BMP best management practice
BWSR Board of Water and Soil Resources
CAFO concentrated animal feeding operation
cfu colony forming unit
CREP Conservation Reserve Enhancement Program
CRP Conservation Reserve Program
CWA Clean Water Act
DMR discharge monitoring report
DNR Minnesota Department of Natural Resources
E. coli Escherichia coli
EPA United States Environmental Protection Agency
EQuIS Environmental Quality Information System
HSPF Hydrologic Simulation Program–Fortran
HUC hydrologic unit code
ITPHS imminent threats to public health and safety
LA load allocation
mg/L milligrams per liter
MRR Mississippi River–Reno
MOS margin of safety
MPCA Minnesota Pollution Control Agency
MS4 municipal separate storm sewer system
NPDES National Pollutant Discharge Elimination System
org/100 mL organisms per 100 milliliters
org/day organisms per day
RIM Reinvest in Minnesota
SDS State Disposal System

Upper Iowa River and Mississippi River–Reno Watersheds TMDL Report Minnesota Pollution Control Agency
7
SSTS subsurface sewage treatment systems
SWCD Soil and Water Conservation District
TMDL total maximum daily load
TSS total suspended solids
UIR Upper Iowa River
USGS United State Geological Survey
WLA wasteload allocation
WRAPS Watershed Restoration and Protection Strategy
WRP Wetlands Reserve Program
WWTP wastewater treatment plant

Upper Iowa River and Mississippi River–Reno Watersheds TMDL Report Minnesota Pollution Control Agency
8
Executive summary The Clean Water Act (CWA), Section 303(d) requires total maximum daily loads (TMDLs) to be
completed for surface waters that do not meet applicable water quality standards necessary to support
their designated uses. A TMDL determines the maximum amount of a pollutant a receiving waterbody
can assimilate while still achieving water quality standards and allocates allowable pollutant loads to
various sources needed to meet water quality standards. This TMDL study addresses the impairments in
the Upper Iowa River (UIR) and Mississippi River–Reno (MRR) watersheds in southeast Minnesota. The
causes of impairment in the watershed include high levels of Escherichia coli (E. coli) and total
suspended solids (TSS), affecting aquatic life, aquatic recreation, and limited resource value designated
uses. Ten TMDLs are provided: nine E. coli TMDLs and one TSS TMDL.
Land cover trends shift from west to east in the UIR and MRR watersheds. Cropland (corn, alfalfa, and
soybeans) is most dominant in the UIR Watershed, and forested areas increase in Houston County.
Grassland/pasture and forested areas are more prevalent in the MRR Watershed with some corn,
alfalfa, and soybean in the upland portions of the watershed. Developed land covers are scattered
throughout the project area, with more densely developed areas near the towns of Caledonia, Spring
Grove, Harmony, and several small communities.
Potential sources of pollutants include watershed surface runoff (both regulated and unregulated), near-
channel sources (e.g., channel erosion), municipal wastewater, septic systems and untreated
wastewater, livestock, and wildlife. More specifically, pollutant sources that are likely contributing to
impairments include noncompliant septic systems, livestock, runoff from cropland, and near channel
erosion.
The pollutant load capacity of the impaired streams was determined using load duration curves. These
curves represent the allowable pollutant load at any given flow condition. Water quality data were
compared with the load duration curves to determine load reduction needs. A 10% explicit margin of
safety (MOS) was incorporated into all TMDLs to account for uncertainty. The water quality data, when
taken as a whole, indicate that the majority of E. coli exceedances occur under high and very high flows,
indicating that runoff-driven sources are the primary sources of concern. Load reductions are needed to
address multiple source types. The majority of TSS exceedances also occur during higher flows; load
reductions will need to come primarily from agricultural runoff and near channel erosion.
The implementation strategy highlights an adaptive management process to achieving water quality
standards and restoring beneficial uses. The UIR and MRR watersheds are included in the Root River
One Watershed, One Plan (1W1P) adopted in 2016. Implementation strategies recommended by this
TMDL align with many of the water quality strategies in the Root 1W1P including agricultural runoff
control (e.g., conservation tillage and cover crops); feedlot runoff control; septic system improvements;
stream restoration; pasture management; buffers and filter strips; and urban stormwater runoff control.
Public participation included meetings with watershed stakeholders to present watershed data. The
TMDL study is supported by previous work including the MRR Stressor Identification (SID) Report (MPCA
2018a), UIR Watershed SID Report (MPCA 2018b), UIR, MRR, Mississippi River–La Crescent Watersheds
Monitoring and Assessment Report (MPCA 2018c), and the UIR and MRR Watershed hydrology and
water quality models (Tetra Tech 2018).

Upper Iowa River and Mississippi River–Reno Watersheds TMDL Report Minnesota Pollution Control Agency
9
1. Project overview
1.1 Purpose
The CWA and United States Environmental Protection Agency (EPA) regulations require that TMDLs be
developed for waters that do not support their designated uses. In simple terms, a TMDL study
determines what is needed to attain and maintain water quality standards in waters that are not
currently meeting them. A TMDL study identifies pollutant sources and allocates pollutant loads among
those sources. The total of all allocations, including wasteload allocations (WLAs) for point sources, load
allocations (LAs) for nonpoint sources (including natural background), and the MOS, which is implicitly or
explicitly defined, cannot exceed the maximum allowable pollutant load that will achieve water quality
standards.
This TMDL study addresses aquatic life, aquatic recreation, and limited resource value impairments in
the UIR Watershed (United States Geological Survey [USGS] Hydrologic Unit Code [HUC] 8 07060002),
and the MRR Watershed (HUC8 07060001). The two HUC-8 watersheds cover 1,195 square miles in
southeastern Minnesota and northeastern Iowa (Figure 1); this does not include the portion of the MRR
Watershed that is in Wisconsin. Both watersheds are included in the Root River 1W1P (Root River
Planning Partnership 2016) planning area and share many stakeholders. Additionally, these two
watersheds are on the same watershed monitoring and assessment cycle; the first year of the
Minnesota Pollution Control Agency’s (MPCA’s) intensive watershed monitoring in these two
watersheds began in 2015. The MPCA, therefore, combined TMDLs for these two HUC-8 watersheds into
one report.
The only previously completed TMDL in the Minnesota portions of these watersheds is in the Minnesota
Statewide Mercury TMDL (MPCA 2007a), which addresses the mercury impairment on the Mississippi
River main stem, from the Root River to the Minnesota–Iowa border. This Mississippi River reach also
has an aquatic consumption impairment due to high levels of polychlorinated biphenyls in fish tissue.
These aquatic consumption impairments are not further addressed in this TMDL.

Upper Iowa River and Mississippi River–Reno Watersheds TMDL Report Minnesota Pollution Control Agency
10
Figure 1. Upper Iowa River and Mississippi River–Reno Watersheds and impairments addressed in this report.

Upper Iowa River and Mississippi River–Reno Watersheds TMDL Report Minnesota Pollution Control Agency
11
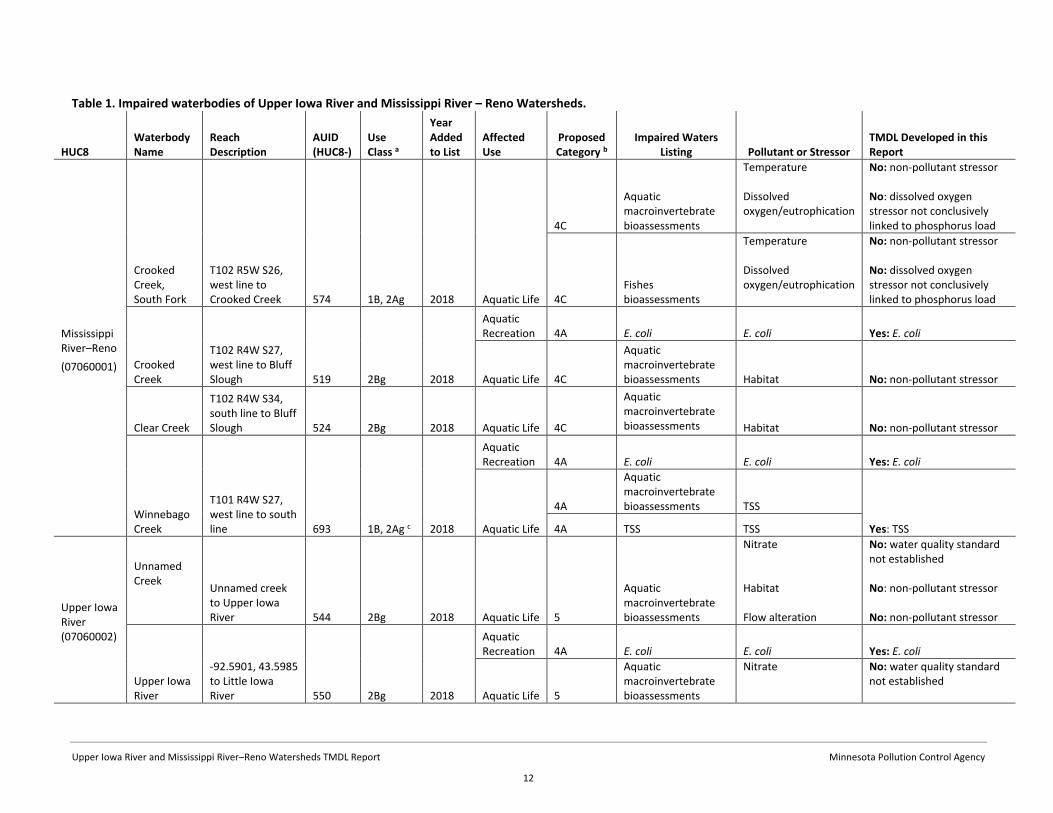
1.2 Identification of waterbodies
There are 15 impaired stream reaches, or assessment units, in the UIR and MRR Watersheds (Table 1,
Figure 1); there are no impaired lakes. The stream impairments affect aquatic life, aquatic recreation,
and/or limited resource value designated uses based on TSS, E. coli, fish bioassessments, or
macroinvertebrate assessments. The concentrations of mercury and PCBs in fish tissue from two UIR
monitoring sites were used to assess aquatic consumption uses; neither site was found to be impaired
(MPCA 2018c).
This TMDL report addresses seven E. coli TMDLs in the UIR Watershed and two E. coli TMDLs and one
TSS TMDL in the MRR Watershed. The remaining impairments are fish and macroinvertebrate
impairments, which were investigated in the SID reports (MPCA 2018a and MPCA 2018b). For biological
impairments, if the identified stressor(s) is a pollutant (e.g., TSS), and if there is a state water quality
standard for that pollutant, a TMDL can be developed. Non-pollutant stressors (e.g., habitat) are not
subject to load quantification and therefore do not require TMDLs. For all but one of the fish and
macroinvertebrate impairments in these two major watersheds, the stressors are either non-pollutant
or are pollutants for which there is no state water quality standard for the relevant use (e.g., nitrate
concentrations to support aquatic life uses). TSS was identified as a stressor to the macroinvertebrates
in Winnebago Creek (07060001-693) and a TSS TMDL was developed. Supporting documentation can be
found in the SID reports (MPCA 2018a and MPCA 2018b). All aquatic life use impairments—not just
those with associated TMDLs—are addressed in the Watershed Restoration and Protection Strategies
(WRAPS) report (see Section 9 for more information on the MPCA’s watershed approach). For example,
streams with biota impairments due to flow alteration do not require TMDLs but may still be a focus of
future restoration work.
For this report, the impairments are listed in tables ordered from upstream to downstream. All stream
assessment unit identifications (AUIDs) begin with the eight-digit HUC for the watershed. The reaches
are identified in this report with the last three digits of the full AUID. For example, AUID 07060001-574
is referred to as reach 574.
Upper Iowa River and Mississippi River–Reno Watersheds TMDL Report Minnesota Pollution Control Agency
12
Table 1. Impaired waterbodies of Upper Iowa River and Mississippi River – Reno Watersheds.
HUC8 Waterbody Name
Reach Description
AUID (HUC8-)
Use Class a
Year Added to List
Affected Use
Proposed Category b
Impaired Waters Listing Pollutant or Stressor
TMDL Developed in this Report
Mississippi River–Reno
(07060001)
Crooked Creek, South Fork
T102 R5W S26, west line to Crooked Creek 574 1B, 2Ag 2018 Aquatic Life
4C
Aquatic macroinvertebrate bioassessments
Temperature Dissolved oxygen/eutrophication
No: non-pollutant stressor No: dissolved oxygen stressor not conclusively linked to phosphorus load
4C Fishes bioassessments
Temperature Dissolved oxygen/eutrophication
No: non-pollutant stressor No: dissolved oxygen stressor not conclusively linked to phosphorus load
Crooked Creek
T102 R4W S27, west line to Bluff Slough 519 2Bg 2018
Aquatic Recreation 4A E. coli E. coli Yes: E. coli
Aquatic Life 4C
Aquatic macroinvertebrate bioassessments Habitat No: non-pollutant stressor
Clear Creek
T102 R4W S34, south line to Bluff Slough 524 2Bg 2018 Aquatic Life 4C
Aquatic macroinvertebrate bioassessments Habitat No: non-pollutant stressor
Winnebago Creek
T101 R4W S27, west line to south line 693 1B, 2Ag c 2018
Aquatic Recreation 4A E. coli E. coli Yes: E. coli
Aquatic Life
4A
Aquatic macroinvertebrate bioassessments TSS
Yes: TSS 4A TSS TSS
Upper Iowa River (07060002)
Unnamed Creek
Unnamed creek to Upper Iowa River 544 2Bg 2018 Aquatic Life 5
Aquatic macroinvertebrate bioassessments
Nitrate Habitat Flow alteration
No: water quality standard not established No: non-pollutant stressor No: non-pollutant stressor
Upper Iowa River
-92.5901, 43.5985 to Little Iowa River 550 2Bg 2018
Aquatic Recreation 4A E. coli E. coli Yes: E. coli
Aquatic Life 5
Aquatic macroinvertebrate bioassessments
Nitrate
No: water quality standard not established

Upper Iowa River and Mississippi River–Reno Watersheds TMDL Report Minnesota Pollution Control Agency
13
HUC8 Waterbody Name
Reach Description
AUID (HUC8-)
Use Class a
Year Added to List
Affected Use
Proposed Category b
Impaired Waters Listing Pollutant or Stressor
TMDL Developed in this Report
Habitat Flow alteration
No: non-pollutant stressor No: non-pollutant stressor
Unnamed Creek
Unnamed creek to Little Iowa River 540 2Bg 2018 Aquatic Life 5
Aquatic macroinvertebrate bioassessments
Nitrate Habitat Flow alteration
No: water quality standard not established No: non-pollutant stressor No: non-pollutant stressor
Little Iowa River
770th Ave to Upper Iowa River 548 2Bg 2018
Aquatic Recreation 4A E. coli E. coli Yes: E. coli
Upper Iowa River (07060002)
Upper Iowa River
Little Iowa River to Beaver Creek (MN) 509 2Bg 2018
Aquatic Recreation 4A E. coli E. coli Yes: E. coli
Unnamed Creek
Unnamed creek to Beaver Creek 537 2Bg 2018 Aquatic Life 5
Aquatic macroinvertebrate bioassessments
Nitrate Habitat Flow alteration
No: water quality standard not established No: non-pollutant stressor No: non-pollutant stressor
Beaver Creek
Mower-Fillmore Rd to Upper Iowa River 546 2Bg 2018
Aquatic Recreation 4A E. coli E. coli Yes: E. coli
Aquatic Life 5
Aquatic macroinvertebrate bioassessments
Nitrate Flow alteration
No: water quality standard not established No: non-pollutant stressor
Deer Creek Unnamed cr to MN/IA border 520 2Bg 2018 Aquatic Life 4C
Fishes bioassessments
Fish passage Flow alteration
No: non-pollutant stressor No: non-pollutant stressor
Pine Creek
T101 R10W S24, north line to MN/IA border 512 7 2018
Limited Resource Value 4A E. coli E. coli Yes: E. coli
Bear Creek Unnamed cr to MN/IA border 503 7 2018
Limited Resource Value 4A E. coli E. coli Yes: E. coli

Upper Iowa River and Mississippi River–Reno Watersheds TMDL Report Minnesota Pollution Control Agency
14
HUC8 Waterbody Name
Reach Description
AUID (HUC8-)
Use Class a
Year Added to List
Affected Use
Proposed Category b
Impaired Waters Listing Pollutant or Stressor
TMDL Developed in this Report
Bee Creek (Waterloo Creek)
T101 R6W S29, north line to MN/IA border 515 1B, 2Ag 2018
Aquatic Recreation 4A E. coli E. coli Yes: E. coli
a. Use classes—1B: domestic consumption (requires moderate treatment); 2Ag: aquatic life and recreation—general cold water habitat (lakes and streams); 2Bg: aquatic life and recreation—general warm water habitat (lakes and streams); 7: limited resource value water.
b. All waters in the watershed are currently classified as category 5 in the 2018 303(d) list. Category 5 indicates an impaired status and no TMDL plan has been completed. Proposed categories are provided for those listings that have now been further assessed and are proposed for recategorization as either 4A or 4C:
Category 4a: A water is placed in Category 4a when all TMDLs needed to result in attainment of all applicable water quality water quality standards have been approved or established by EPA. Category 4c: A water is placed in Category 4c when the state demonstrates that the failure to meet an applicable water quality standard is not caused by a pollutant, but instead is caused by other types of pollution. Segments placed in Category 4c do not require the development of a TMDL.
c. This reach is currently classified as class 2Bg but is undergoing a use class change to class 2Ag.

Upper Iowa River and Mississippi River–Reno Watersheds TMDL Report Minnesota Pollution Control Agency
15
1.3 Priority ranking
The MPCA’s schedule for TMDL completions, as indicated on Minnesota’s Section 303(d) impaired
waters list, reflects Minnesota’s priority ranking of this TMDL. The MPCA has aligned its TMDL priorities
with the watershed approach and WRAPS cycle. The schedule for TMDL completion corresponds to the
WRAPS report completion on the 10-year cycle. The MPCA developed a state plan, Minnesota’s TMDL
Priority Framework Report (MPCA 2015), to meet the needs of the EPA’s national measure (WQ-27)
under EPA's Long-Term Vision for Assessment, Restoration and Protection under the CWA Section
303(d) Program (EPA 2013). As part of these efforts, the MPCA identified water quality impaired
segments that will be addressed by TMDLs by 2022. The UIR Watershed and MRR Watershed waters
addressed by this TMDL are part of the MPCA’s prioritization plan to meet EPA’s national measure.

Upper Iowa River and Mississippi River–Reno Watersheds TMDL Report Minnesota Pollution Control Agency
16
2. Applicable water quality standards and numeric water quality targets
Water quality standards are designed to protect designated uses. The standards consist of the
designated uses, criteria to protect the uses, and other provisions such as antidegradation policies that
protect the waterbody.
2.1 Designated uses
Use classifications are defined in Minn. R. 7050.0140, and water use classifications for individual
waterbodies are provided in Minn. R. 7050.0470, 7050.0425, and 7050.0430. This TMDL report
addresses the waterbodies that do not meet the standards for class 2 and 7 waters. The impaired
streams in this report are classified as class 1B, 2Ag, 2Bg, and/or 7 waters (Table 1); there are no
impairments in these watersheds that are based on violations of class 1 water quality standards.
Class 1B waters are protected for domestic consumption (requires moderate treatment). Class 2Ag
waters are protected for aquatic life and recreation—general cold water habitat (lakes and streams).
Class 2Bg waters are protected for aquatic life and recreation—general warm water habitat. Class 7
waters are limited resource value waters and are protected for aesthetic qualities, secondary body
contact use, and groundwater for use as a potable water supply.
2.2 Water quality standards
Water quality standards for class 1 waters are defined in Minn. R. 7050.0221, standards for class 2
waters are defined in Minn. R. 7050.0222, and standards for class 7 waters are defined in Minn. R.
7050.0227. Water quality standards for E. coli and TSS are presented in Table 2; these standards serve as
targets for the applicable UIR Watershed and MRR Watershed TMDLs.
In Minnesota, E. coli is used as an indicator species of potential waterborne pathogens. There are two
E. coli standards each for class 2 and class 7 waters—one is applied to monthly E. coli geometric mean
concentrations, and the other is applied to individual samples. Exceedances of either E. coli standard in
class 2 or 7 waters indicates that a waterbody does not meet the applicable designated use. The class 2
standard applies from April through October, whereas the class 7 standard applies from May through
October.
Exceedances of the TSS standard in streams indicate that a waterbody does not meet the aquatic life
designated use. Winnebago Creek (07060001-693) in the MRR Watershed is undergoing a use class
change from class 2B to class 2A. The TSS TMDL developed in this report is based on the class 2A
standard.
The impaired streams that cross the Minnesota–Iowa state boundary were evaluated to identify cases
where the standard in a downstream Iowa impairment is more restrictive than the standard in an
upstream Minnesota impairment. The impaired Bear Creek (07060002-503) and Pine Creek (07060002-
512) reaches in the UIR Watershed in Minnesota are class 7, with a geometric mean standard of 630
organisms per 100 milliliters (org/100 mL). Bear Creek flows into an impaired Bear Creek reach in Iowa
(reach 01-UIA-255) that is a class A1 waterbody with a geometric mean standard of 126 org/100 mL

Upper Iowa River and Mississippi River–Reno Watersheds TMDL Report Minnesota Pollution Control Agency
17
(applicable from March 15 through November 15; Table 3). Pine Creek flows into an impaired Pine Creek
reach in Iowa (reach 01-UIA-278) that is a class A1 waterbody from April through October, with a
geometric mean standard of 126 org/100 ml, and a class A2 waterbody from November through March,
with a geometric mean standard of 630 org/100 mL. To protect downstream uses, the TMDL targets for
Bear Creek and Pine Creek in Minnesota are 126 org/100 mL, which is based on the more restrictive
downstream standard in Iowa. Additional information can be found in Sections 3.5.1 and 4.7.2; no
changes are needed to existing wastewater NPDES permits to comply with the more restrictive
standard.
Table 2. Water quality standards for impaired streams
Parameter Stream Class Water Quality Standard Numeric Standard/Target
E. coli
Class 2A and 2B
Not to exceed 126 organisms per 100 milliliters (org/100 mL) as a geometric mean of not less than five samples representative of conditions within any calendar month, nor shall more than 10% of all samples taken during any calendar month individually exceed 1,260 org/100 mL. The standard applies only between April 1 and October 31.
≤ 126 organisms / 100 mL water (monthly geometric mean)
≤ 1,260 organisms / 100 mL water (individual sample)
Class 7
Not to exceed 630 org/100 mL as a geometric mean of not less than five samples representative of conditions within any calendar month, nor shall more than 10% of all samples taken during any calendar month individually exceed 1,260 org/100 mL. The standard applies only between May 1 and October 31.
≤ 630 organisms / 100 mL water (monthly geometric mean) a
≤ 1,260 organisms / 100 mL water (individual sample)
TSS Class 2A
10 mg/L (milligrams per liter); TSS standards for class 2A may be exceeded for no more than 10% of the time. This standard applies April 1 through September 30. ≤ 10 mg/L
a. The only Class 7 segments in the watershed are Bear Creek (07060002-503) and Pine Creek (07060002-512). TMDL targets for these segments are 126 org/100 mL to protect downstream uses in Iowa.
Table 3. Summary of Iowa water quality criteria for E. coli in surface waters designated for primary or secondary contact recreation (Iowa Department of Natural Resources 2017)
Standard Type Class A1: Primary Contact Recreational Use a
Class A2: Secondary Contact Recreational Use a
Geometric Mean (organisms/100 mL) 126 630
Sample Maximum (organisms/100 mL) 235 2,880
a. Criteria apply from March 15–November 15 except year-round for class A2 waters that are also designated for class B(CW1) [coldwater aquatic life] uses.

Upper Iowa River and Mississippi River–Reno Watersheds TMDL Report Minnesota Pollution Control Agency
18
3. Watershed and waterbody characterization This TMDL study addresses the impairments in the UIR and MRR watersheds in southeast Minnesota.
The watersheds of these impairments drain portions of Mower, Fillmore, and Houston counties in
Minnesota. Municipalities in the watersheds include Taopi, Le Roy, Harmony, Spring Grove, Caledonia,
and Brownsville.
The watersheds are in the Driftless Area ecoregion in the east and the Western Corn Belt Plains
ecoregion in the west (Figure 1). The Driftless Area was not impacted during the last glaciation, unlike
much of the rest of the state was, and therefore retains several bluffs and valleys that were leveled by
glaciers elsewhere. The project area is also located within a karst topography area, which is defined by
soluble bedrock known for dry depressions in the ground, sinkholes, springs, underground caves, and a
strong surface and groundwater connection. Cavities formed in karst bedrock provide water storage and
transport and interact with surface waterbodies. For example, water on the land surface may flow via
sinkholes or disappearing streams to karst cavities rather than to streams. Interflow and groundwater
may also discharge to karst cavities, which may receive flow from upstream cavities and discharge to
downstream cavities. Water may also be exchanged between stream reaches and karst cavities.
The UIR Watershed includes the headwaters of the UIR, along with several tributaries. The majority of
the UIR flows through Iowa. The UIR is one of the healthiest rivers in Iowa and is vital to maintaining
northern Iowa’s recreation, tourism, and local economy. It is recognized nationally for its fine fishing and
coldwater species, and is eligible for National Wild and Scenic River designation. In 1964, the Minnesota
Department of Natural Resources (DNR) completed a major habitat improvement project on Bee Creek,
a tributary to the UIR, to support a trout fishery. Bee Creek is classified as an exceptional use class
stream for both fish and macroinvertebrates, is a coldwater stream that supports popular fish for
anglers, and is a designated trout stream that is actively managed by the Minnesota DNR.
The MRR Watershed contains several popular trout fisheries including rainbow trout, brown trout, and
brook trout and offers bluff scenery and habitat for wildlife. The two major drainages addressed in this
report in the MRR Watershed are Crooked Creek and Winnebago Creek.
There are no tribal lands in the UIR Watershed. Portions of the Ho-Chunk Nation are in the MRR
Watershed (Figure 2); however, these tribal lands are not in the TMDL watersheds and therefore are not
affected by the TMDLs in this report.
More information on the watersheds can be found in the UIR, MRR, Mississippi River–La Crescent
Watersheds Monitoring and Assessment Report (MPCA 2018c), MRR SID Report (MPCA 2018a), UIR
Watershed SID Report (MPCA 2018b), UIR and MRR WRAPS Report (Tetra Tech 2019), and the Root
River 1W1P (Root River Planning Partnership 2016).

Upper Iowa River and Mississippi River–Reno Watersheds TMDL Report Minnesota Pollution Control Agency
19
Figure 2. Tribal lands located in the Mississippi River–Reno Watershed.
3.1 Streams
Subwatersheds that drain to impaired streams range from 4,168 to 71,059 acres (Table 4). The
impairments and their subwatersheds are shown in Figure 3 and Figure 4.
Table 4. Watershed areas of impaired streams.
HUC8 Name Waterbody Name AUID Watershed Area (acres) a
Mississippi River–Reno
(07060001)
Crooked Creek 519 40,716
Winnebago Creek 693 38,442
Upper Iowa River
(07060002)
Upper Iowa River 550 23,323
Little Iowa River 548 17,448
Upper Iowa River 509 71,059
Beaver Creek 546 17,062
Pine Creek 512 6,514
Bear Creek 503 6,472
Bee Creek (Waterloo Creek) 515 11,844 a. Watershed area includes all drainage area to the impairment.

Upper Iowa River and Mississippi River–Reno Watersheds TMDL Report Minnesota Pollution Control Agency
20
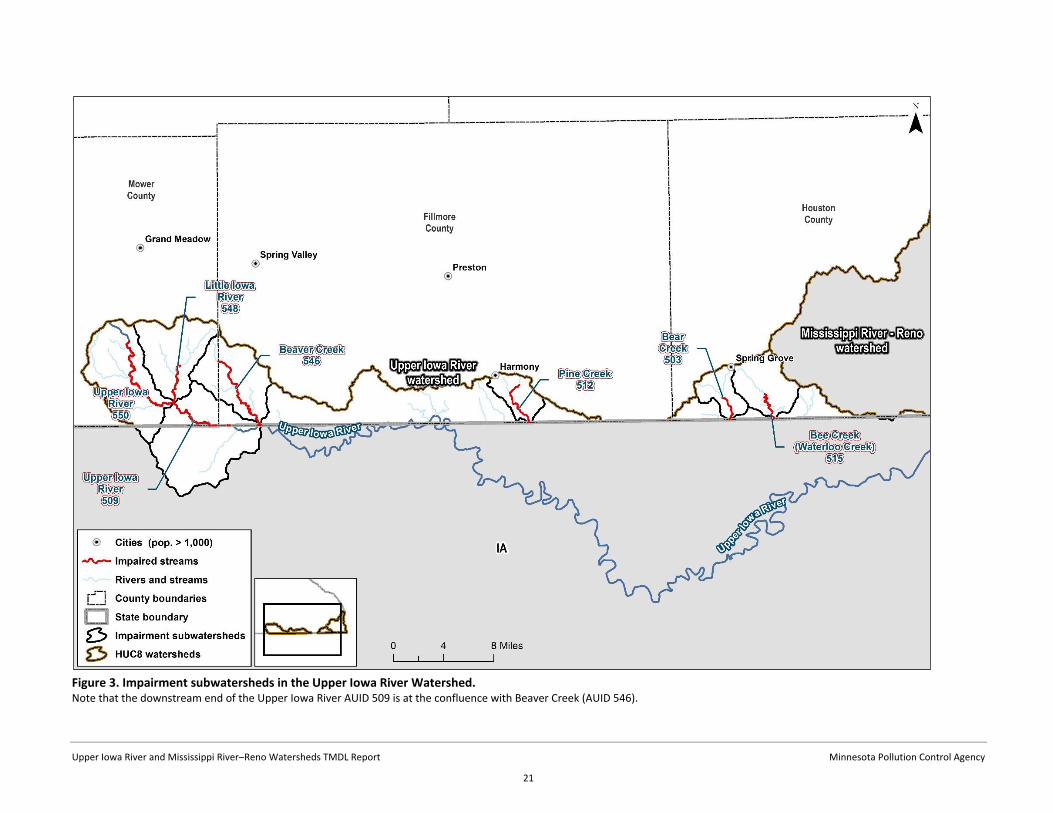
3.2 Subwatersheds
The watershed boundaries of the impaired streams (Figure 3 and Figure 4) were developed using
multiple data sources, starting with watershed delineations from the MPCA’s Hydrologic Simulation
Program–Fortran (HSPF) model application of the UIR and MRR watersheds (Tetra Tech 2018). The
model watershed boundaries are based on USGS HUC-12 watershed boundaries and modified with DNR
Level 7 watershed boundaries or NHDPlus catchments (Version 2.0). Where additional watershed breaks
were needed to define the impairment watersheds, DNR Level 8 and Level 9 watershed boundaries and
the USGS StreamStats program (Version 4.2.1) were used. StreamStats was developed by the USGS as a
web-based geographic information systems application for use in informing water resource planning
and management decisions. The tool allows users to locate gages and define drainage basins to
determine upstream drainage basin area and other useful parameters.
The impaired reach of the UIR from Little Iowa River to Beaver Creek (07060002-509) is not contiguous
within Minnesota. The downstream end of the reach is where Beaver Creek (07060002-546) discharges
into the UIR, which is reflected in the subwatershed boundary for AUID 509 (Figure 3).
Upper Iowa River and Mississippi River–Reno Watersheds TMDL Report Minnesota Pollution Control Agency
21
Figure 3. Impairment subwatersheds in the Upper Iowa River Watershed. Note that the downstream end of the Upper Iowa River AUID 509 is at the confluence with Beaver Creek (AUID 546).

Upper Iowa River and Mississippi River–Reno Watersheds TMDL Report Minnesota Pollution Control Agency
22
Figure 4. Impairment subwatersheds in the Mississippi River–Reno Watershed.
Upper Iowa River and Mississippi River–Reno Watersheds TMDL Report Minnesota Pollution Control Agency
23
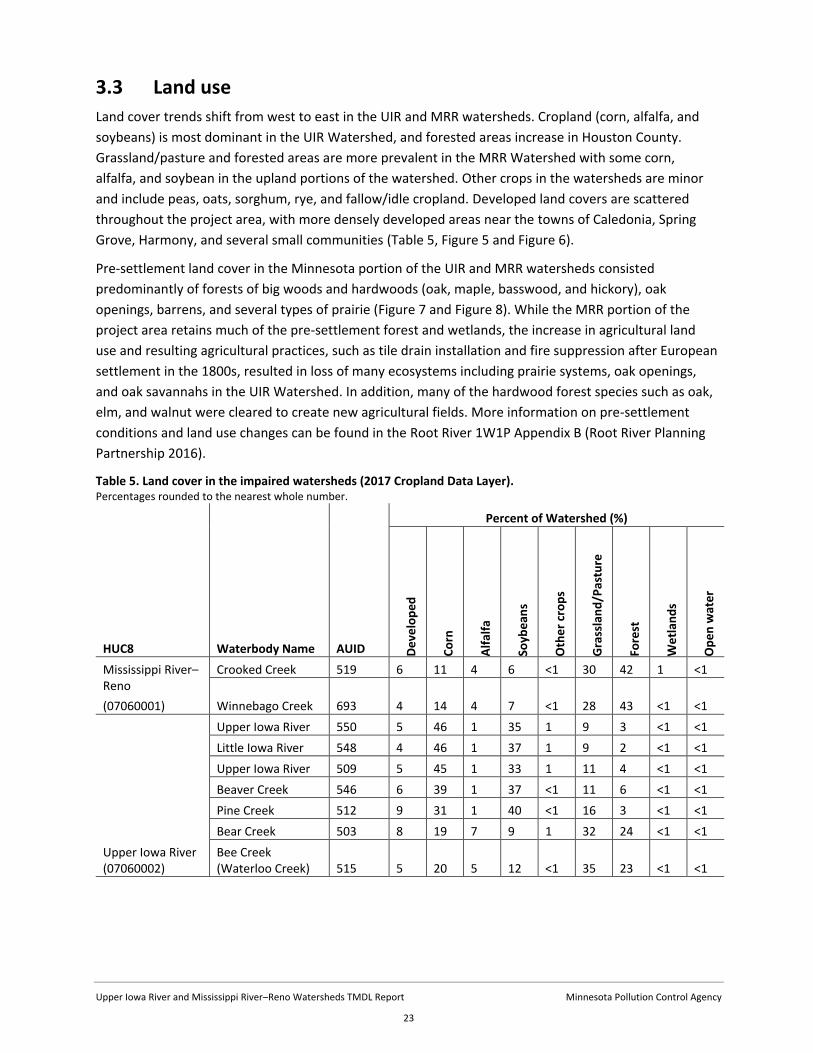
3.3 Land use
Land cover trends shift from west to east in the UIR and MRR watersheds. Cropland (corn, alfalfa, and
soybeans) is most dominant in the UIR Watershed, and forested areas increase in Houston County.
Grassland/pasture and forested areas are more prevalent in the MRR Watershed with some corn,
alfalfa, and soybean in the upland portions of the watershed. Other crops in the watersheds are minor
and include peas, oats, sorghum, rye, and fallow/idle cropland. Developed land covers are scattered
throughout the project area, with more densely developed areas near the towns of Caledonia, Spring
Grove, Harmony, and several small communities (Table 5, Figure 5 and Figure 6).
Pre-settlement land cover in the Minnesota portion of the UIR and MRR watersheds consisted
predominantly of forests of big woods and hardwoods (oak, maple, basswood, and hickory), oak
openings, barrens, and several types of prairie (Figure 7 and Figure 8). While the MRR portion of the
project area retains much of the pre-settlement forest and wetlands, the increase in agricultural land
use and resulting agricultural practices, such as tile drain installation and fire suppression after European
settlement in the 1800s, resulted in loss of many ecosystems including prairie systems, oak openings,
and oak savannahs in the UIR Watershed. In addition, many of the hardwood forest species such as oak,
elm, and walnut were cleared to create new agricultural fields. More information on pre-settlement
conditions and land use changes can be found in the Root River 1W1P Appendix B (Root River Planning
Partnership 2016).
Table 5. Land cover in the impaired watersheds (2017 Cropland Data Layer). Percentages rounded to the nearest whole number.
HUC8 Waterbody Name AUID
Percent of Watershed (%)
De
velo
ped
Co
rn
Alf
alfa
Soyb
ean
s
Oth
er
cro
ps
Gra
ssla
nd
/Pas
ture
Fore
st
We
tlan
ds
Op
en w
ate
r
Mississippi River–Reno
(07060001)
Crooked Creek 519 6 11 4 6 <1 30 42 1 <1
Winnebago Creek 693 4 14 4 7 <1 28 43 <1 <1
Upper Iowa River (07060002)
Upper Iowa River 550 5 46 1 35 1 9 3 <1 <1
Little Iowa River 548 4 46 1 37 1 9 2 <1 <1
Upper Iowa River 509 5 45 1 33 1 11 4 <1 <1
Beaver Creek 546 6 39 1 37 <1 11 6 <1 <1
Pine Creek 512 9 31 1 40 <1 16 3 <1 <1
Bear Creek 503 8 19 7 9 1 32 24 <1 <1
Bee Creek (Waterloo Creek) 515 5 20 5 12 <1 35 23 <1 <1

Upper Iowa River and Mississippi River–Reno Watersheds TMDL Report Minnesota Pollution Control Agency
24
Figure 5. Land cover in the Upper Iowa River Watershed.

Upper Iowa River and Mississippi River–Reno Watersheds TMDL Report Minnesota Pollution Control Agency
25
Figure 6. Land cover in the Mississippi River–Reno Watershed.

Upper Iowa River and Mississippi River–Reno Watersheds TMDL Report Minnesota Pollution Control Agency
26
Figure 7. Pre-settlement land cover in the Upper Iowa River Watershed within Minnesota (Marschner’s presettlement data, obtained from MN Geospatial commons).

Upper Iowa River and Mississippi River–Reno Watersheds TMDL Report Minnesota Pollution Control Agency
27
Figure 8. Pre-settlement land cover in the Mississippi River–Reno Watershed within Minnesota (Marschner’s presettlement data, obtained from MN Geospatial commons).

Upper Iowa River and Mississippi River–Reno Watersheds TMDL Report Minnesota Pollution Control Agency
28
3.4 Current/historical water quality
Flow and water quality data are presented to evaluate the impairments and trends in water quality.
Data from the last 10 years (2008 through 2017) were used in the water quality summary tables. If data
from 2008 through 2017 were not available, data prior to the 10-year time period were evaluated, as
available, to examine trends in water quality. Water quality data from the Environmental Quality
Information System (EQuIS) database were used for the analysis.
The analyses considered the following sources of flow data:
The MPCA provided data from Hydstra, a database that stores the MPCA and DNR stream gaging
data. However, limited data were available, with gage level data available at one site and no
flow data in the watershed.
USGS flow data were downloaded from the USGS National Water Information System. Data
were available at one site on Crooked Creek (site #05387030) for approximately one year.
Daily average flows were simulated with the MPCA’s HSPF model application for the UIR and
MRR watersheds (2018-04-02 version). The simulated flows were calibrated and validated with
data from flow gaging stations, including the UIR at Bluffton, Iowa (USGS site 05387440).
Simulated flows are available at the downstream end of each model reach. The model report
(Tetra Tech 2018) describes the framework and the data that were used to develop the model
and includes information on calibration.
Due to limited flow gage records in the watersheds, simulated flows from the HSPF model were used in
developing the stream TMDLs (Table 6). The HSPF model integrates flow monitoring data and provides
long term, continuous flow estimates. In some cases, HSPF-simulated flows from nearby model reaches
were drainage area-weighted to impaired stream reaches. The drainage area-weighting approach
assigns flow to a given reach based on the proportion of the subwatershed area within the HSPF
catchment. For additional information regarding HSPF modeling, see the summary in Section 3.5.2 or
modeling documentation (Tetra Tech 2018).
Table 6. Model reaches used to simulate stream flow in impaired reaches Reach numbers refer to the Upper Iowa River and Mississippi River–Reno watersheds HSPF model (Tetra Tech 2018). The simulation is from 1995–2015.
Reach Name AUID Model Reach Number
Crooked Creek 519 509
Winnebago Creek 693 502
Upper Iowa River 550 310
Little Iowa River 548 314
Upper Iowa River 509 309
Beaver Creek 546 318
Pine Creek 512 327
Bear Creek 503 330
Bee Creek (Waterloo Creek) 515 331

Upper Iowa River and Mississippi River–Reno Watersheds TMDL Report Minnesota Pollution Control Agency
29
Water quality data from 2008 to 2017 were summarized for the E. coli and TSS impairments. Data were
summarized by year to evaluate trends in long term water quality and by month to evaluate seasonal
variation. The summaries of data by year only consider data taken during the time period that the
standard is in effect (April/May through October for E. coli [for class 2 and class 7 waters, respectively],
and April through September for TSS). Where there are multiple sites along one assessment unit, data
from the sites were combined and summarized together. The frequency of exceedances represents the
percentage of samples that exceed the water quality standard.
Load duration curves are provided for each impaired stream in Section 5: TMDLs and water quality data
summaries. Water quality is often a function of stream flow, and load duration curves are used to
evaluate the relationships between hydrology and water quality. For example, sediment concentrations
typically increase with rising flows as a result of factors such as channel scour from higher velocities.
Other parameters may be more concentrated at low flows and diluted by increased water volumes at
higher flows. The load duration curve approach provides a visual display of the relationship between
stream flow and water quality. Load duration curves were developed as follows:
Develop flow duration curves: Flow duration curves relate mean daily flow to the percent of time those
values have been met or exceeded. For example, an average daily flow at the 50% exceedance value is
the midpoint or median flow value; average daily flow in the reach equals the 50% exceedance value
50% of the time. The curve is divided into flow zones, including very high flows (0% to 10%), high flows
(10% to 40%), mid-range flows (40% to 60%), low flows (60% to 90%), and very low flows (90% to 100%).
Flow duration curves were developed using daily averaged modeled flows (1995 through 2015) from
HSPF modeling (Tetra Tech 2018). Table 6 presents the modeled stream segment number used to
develop the flow duration curve for each impaired segment. Simulated flows from all months (even
those outside of the time period that the standard is in effect) were used to develop the flow duration
curves.
Develop load duration curves: To develop load duration curves, all average daily flows were multiplied
by the water quality standard (i.e., 126 or 630 org/100 mL E. coli and 10 mg/L TSS) and converted to a
daily load to create “continuous” load duration curves that represent the load in the stream when the
stream meets its water quality standard under all flow conditions. Loads calculated from water quality
monitoring data are also plotted on the load duration curve, based on the concentration of the sample
multiplied by the simulated flow on the day that the sample was taken. Two nearby gages (USGS gages
on Crooked Creek [05387030] and the UIR [05387440]) were used to estimate the flow exceedance to
plot water quality samples from 2016 and 2017, which are not simulated in the HSPF model. The flow
exceedance was then used to determine the corresponding HSPF flow (at that flow exceedance) for
which to calculate a load for the water quality sample. Each load calculated from a water quality sample
that plots above the load duration curve represents an exceedance of the water quality target whereas
those that plot below the load duration curve are less than the water quality target.
Water quality summary tables and load duration curves are presented for each impairment in Section 5:
TMDLs and water quality data summaries, and Table 7 summarizes the water quality data.

Upper Iowa River and Mississippi River–Reno Watersheds TMDL Report Minnesota Pollution Control Agency
30
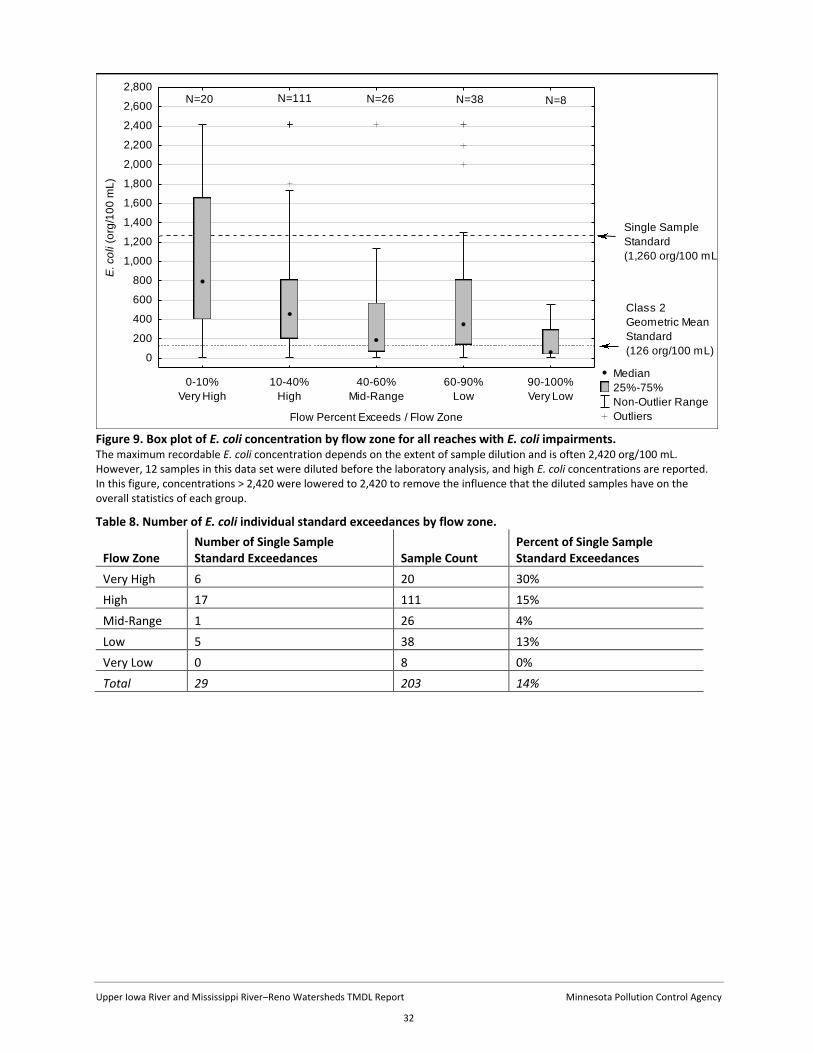
The number of E. coli samples per impaired reach ranges from 15 to 34. The maximum recorded E. coli
concentration per reach ranges from 1,220 to 2,139,392 org/100 mL1. The frequencies of exceedance of
the monthly geometric mean standard range from 67 to 100%, and the frequencies of exceedance of the
individual sample standard range from 0% to 33% (Table 7). Median E. coli concentrations per flow zone
were highest in the two highest flow zones (Figure 9), and a higher percent of observations exceeded
the single sample standard in the very high flow zone (Table 8).
There are 27 TSS samples for Winnebago Creek with a maximum recorded TSS concentration of 98 mg/L.
The frequency of exceedance is 59% (Table 7). TSS concentrations on average are highest under high
flow conditions and decrease with decreasing flow (Figure 109).
1 The maximum recordable value for E. coli concentration in a water sample is often 2,420 org/100 mL. Concentrations that are noted as higher than 2,420 org/100 mL were diluted before sample analysis. There were several samples in the dataset that were substantially higher than 2,420.

Upper Iowa River and Mississippi River–Reno Watersheds TMDL Report Minnesota Pollution Control Agency
31
Table 7. Summary of water quality data (2008–2017) for impaired reaches Summaries include data for months during which the standard applies (see Section 2.2). E. coli units are org/100 mL and TSS units are mg/L. Water quality summary tables are presented for each impairment in Section 5: TMDLs and water quality data summaries.
HUC8 Reach Name (description) AUID
Pol-lutant
Sample Count Mean a
Max-imum b
Number of Exceed-ances of Individual Standard
Frequency of Exceedance c
Mississippi River–Reno (07060001)
Crooked Creek (T102 R4W S27, west line to Bluff Slough) 519 E. coli 15 970 2,723 4 100% / 27%
Winnebago Creek (T101 R4W S27, west line to south line) 693
E. coli 15 499 2,490 2 100% / 13%
TSS 27 21 98 16 59% d
Upper Iowa River (07060002)
Upper Iowa River (-92.5901, 43.5985 to Little Iowa River) 550 E. coli 34 408 4,900 8 83% / 24%
Little Iowa River (770th Ave to Upper Iowa River) 548 E. coli 33 162 3,600 2 80% / 6%
Upper Iowa River (Little Iowa River to Beaver Creek - MN) 509 E. coli 15 250 1,220 0 100% / 0%
Beaver Creek (Mower-Fillmore Rd to Upper Iowa River) 546 E. coli 34 254 1,800 1 83% / 3%
Pine Creek (T101 R10W S24, north line to MN/IA border) 512 E. coli 15 781 ≥ 2,420 1 100% / 7%
Bear Creek (Unnamed cr to MN/IA border) 503 E. coli 15 917 5,172 5 67% / 33%
Bee Creek (Waterloo Creek; T101 R6W S29, north line to MN/IA border) 515 E. coli 27 358
2,139,392 6 67% / 22%
a. Geometric means are provided for E. coli data and arithmetic means are provided for TSS. b. The maximum recordable value for E. coli concentration depends on the extent of sample dilution and is often 2,420
org/100 mL. Concentrations that are noted as 2,420 org/100 mL are likely higher, and the magnitude of the exceedances is not known.
c. For E. coli impairments, the frequencies of exceedance are presented first for the monthly geometric mean standard and second for the individual sample standard. The monthly frequencies of exceedance are calculated as the number of months (aggregated across all years of data) when the monthly standard was exceeded divided by the number of months that have five or more samples.
d. The TSS water quality standard allows for 10% of the samples to exceed the standard concentration (i.e., 10 mg/L for Winnebago Creek) and still be in compliance with the water quality standard.
Upper Iowa River and Mississippi River–Reno Watersheds TMDL Report Minnesota Pollution Control Agency
32
Figure 9. Box plot of E. coli concentration by flow zone for all reaches with E. coli impairments. The maximum recordable E. coli concentration depends on the extent of sample dilution and is often 2,420 org/100 mL. However, 12 samples in this data set were diluted before the laboratory analysis, and high E. coli concentrations are reported. In this figure, concentrations > 2,420 were lowered to 2,420 to remove the influence that the diluted samples have on the overall statistics of each group.
Table 8. Number of E. coli individual standard exceedances by flow zone.
Flow Zone Number of Single Sample Standard Exceedances Sample Count
Percent of Single Sample Standard Exceedances
Very High 6 20 30%
High 17 111 15%
Mid-Range 1 26 4%
Low 5 38 13%
Very Low 0 8 0%
Total 29 203 14%
Median 25%-75% Non-Outlier Range Outliers
0-10%Very High
10-40%High
40-60%Mid-Range
60-90%Low
90-100%Very Low
Flow Percent Exceeds / Flow Zone
0
200
400
600
800
1,000
1,200
1,400
1,600
1,800
2,000
2,200
2,400
2,600
2,800
E. co
li (o
rg/1
00 m
L)
Single SampleStandard(1,260 org/100 mL)
Class 2Geometric MeanStandard(126 org/100 mL)
N=20 N=111 N=26 N=38 N=8

Upper Iowa River and Mississippi River–Reno Watersheds TMDL Report Minnesota Pollution Control Agency
33
Figure 10. TSS concentration duration curve for Winnebago Creek. Note log scale on y-axis.
3.5 Pollutant source summary
Source assessments are used to evaluate the type, magnitude, timing, and location of pollutant loading
to a waterbody. Source assessment methods vary widely with respect to their applicability, ease-of-use,
and acceptability. The purpose of this source assessment is to identify possible sources of E. coli and TSS
in the watersheds of the impaired waterbodies.
Pollutant sources to the impaired waterbodies are evaluated in this report and include National
Pollutant Discharge Elimination System (NPDES)-permitted and non-NPDES permitted or non-point
sources. In this TMDL report, permitted sources of pollution only include those sources that are
regulated through NPDES permits in the impaired watersheds and include permitted stormwater,
wastewater, and NPDES-permitted concentrated animal feeding operations (CAFOs). Non-permitted or
non-point sources include such things as unregulated watershed runoff, septic systems, non-NPDES
permitted animal feeding operations (AFOs) and near channel sources influenced by altered hydrology.
Some of the pollutant loading is from natural background, which is the landscape condition that occurs
outside of human influence (see Section 4.6 for more information). Natural background sources of E. coli
and TSS can include runoff from undisturbed land, wildlife waste, and natural stream development. See
Section 3.3 for information on pre-settlement land cover.
3.5.1 E. coli sources
E. coli sources evaluated in this study are AFOs, wildlife, pets, subsurface sewage treatment systems
(SSTS), natural growth of E. coli, stormwater runoff, and wastewater. E. coli is unlike other pollutants in
that it is a living organism and can multiply and persist in soil and water environments (Ishii et al. 2006,
Chandrasekaran et al. 2015, Sadowsky et al. n.d., and Burns & McDonnell 2017). Use of watershed

Upper Iowa River and Mississippi River–Reno Watersheds TMDL Report Minnesota Pollution Control Agency
34
models for estimating relative contributions of E. coli sources delivered to streams is difficult and
generally has high uncertainty. Thus, a weight of evidence approach was used to determine the likely
primary sources of E. coli, with a focus on the sources that can be effectively reduced with management
practices. The majority of E. coli exceedances occur under very high flows, indicating that runoff-driven
sources are the primary pollutants of concern (Figure 9).
3.5.1.1 Non-NPDES-permitted sources of E. coli
Animal feeding operations
While there are state and county programs and rules for animal agriculture (as described below), in
some circumstances livestock waste can be a source of E. coli to surface waters, such as through failure
of manure containment and runoff from AFOs, direct deposition to surface waters, and manure that is
improperly applied to cropland and subsequent runoff.
Animal waste from non-NPDES-permitted AFOs can be delivered to surface waters from failure of
manure containment, runoff from the AFO itself, or runoff from nearby fields where the manure is
applied. While a full accounting of the fate and transport of manure was not conducted for this project,
a large portion of it is ultimately applied to the land surface and, therefore, this source is of concern.
Minn R. 7020.2225 contains several requirements for land application of manure; however, there are no
explicit requirements for E. coli or bacteria treatment prior to land application. Manure application
practices that inject or incorporate manure pose lower risk to surface waters than surface application
with little or no incorporation. In addition, manure application on frozen/snow covered ground in late
winter months presents a high risk for runoff (Frame et al. 2012).
The primary goal of the state program for AFOs is to ensure that surface waters are not contaminated by
the runoff from feeding facilities, manure storage or stockpiles, and cropland with improperly applied
manure. Counties may be delegated by the MPCA to administer the program for feedlots that are not
under federal (i.e., NPDES) regulation.
In Minnesota, AFOs are required to register with their respective delegated county or the state if they
are 1) an animal feedlot capable of holding 50 or more animal units (AU), or a manure storage area
capable of holding the manure produced by 50 or more AUs outside of shoreland; or 2) an animal
feedlot capable of holding 10 or more AUs, or a manure storage area capable of holding the manure
produced by 10 or more AUs, that is located within shoreland. Further explanation of registration
requirements can be found in Minn. R. 7020.0350. AFOs under 1,000 AUs and those that are not
federally defined as CAFOs do not operate with permits. However, the facilities must operate in
compliance with applicable portions of Minn. R. 7020. The numbers of organisms of E. coli produced per
animal in registered feedlots that are not NPDES-permitted was estimated based on animal type (Table
9). The MPCA Data Desk provided the feedlot locations and numbers and types of animals in registered
feedlots, and the information was supplemented with databases from MPCA feedlot staff (Figure 11 and
Figure 12). E. coli generated by livestock does not necessarily translate into E. coli delivered to waters.
The amount of E. coli to reach surface waters depends on manure management, land application
practices, and other factors.
Some feedlot owners have signed open lot agreements with the MPCA. In an open lot agreement, a
feedlot owner commits to correcting open lot runoff problems. In exchange for this commitment, the

Upper Iowa River and Mississippi River–Reno Watersheds TMDL Report Minnesota Pollution Control Agency
35
open lot agreement provides a flexible time schedule to feedlot owners to correct open lot runoff
problems and a conditional waiver from retroactive enforcement penalties.
Livestock are also part of hobby farms, which are small-scale farms that are not large enough to require
registration but may have small-scale feeding operations and associated manure application or
stockpiles. Livestock are also potential sources of fecal bacteria when direct access is not restricted
and/or where feeding structures are located adjacent to riparian areas.
Further information on livestock and feedlots in the UIR and MRR watersheds, including compliance
information and primary livestock types, is provided in the UIR and MRR WRAPS Report (Tetra Tech
2019).

Upper Iowa River and Mississippi River–Reno Watersheds TMDL Report Minnesota Pollution Control Agency
36
Table 9. E. coli production by livestock animal type in non-NPDES-permitted, registered feedlots. There are no CAFOs that operate without NPDES permits in the impairment watersheds.
HUC8 Waterbody Name AUID (HUC8-)
Percent of E. coli Production (%) a Total E. coli Production Generated from Non-NPDES-Permitted Feedlots (billion colony forming units [cfu]/day) Cattle Poultry Goats/Sheep Horses Pigs
Mississippi River–Reno
(07060001)
Crooked Creek 519 95% 1% 1% < 1% 3% 34,497
Winnebago Creek 693 38% < 1% 4% < 1% 58% 98,661
Upper Iowa River (07060002)
Upper Iowa River 550 10% < 1% < 1% < 1% 90% 78,501
Little Iowa River 548 9% 0% 0% < 1% 91% 43,736
Upper Iowa River
509 (MN) 9% 3% < 1% < 1% 88% 152,433
509 (IA) 0% 0% 0% 0% 100% 78,390
Beaver Creek 546 5% < 1% 4% < 1% 91% 36,004
Pine Creek 512 1% 0% 0% 0% 99% 33,143
Bear Creek 503 88% 1% 5% < 1% 6% 3,500
Bee Creek (Waterloo Creek) b 515 27% < 1% 4% < 1% 69% 48,390
a. Production rates for cattle (2.7 x 10⁹), poultry (1.3 x 10⁸), goats and sheep (9.0 x 10⁹), and pigs (4.5 x 10⁹) are from Metcalf and Eddy (1991). The production rate for horses (2.1 x 10⁸) is from American Society of Agricultural Engineers (1998). The production rates are provided in the literature as fecal coliform organisms produced per animal per day; these rates were converted to E. coli production rates by multiplying by 0.5 (Doyle and Erickson 2006). Production rate units are organisms per day per head.
b. There are no non-NPDES-permitted feedlots within the Iowa portion of this subwatershed. A mink farm located within in the Minnesota portion of the Bee Creek Subwatershed was not included in this table as it produces less than 1% of non-NPDES-permitted E. coli production.

Upper Iowa River and Mississippi River–Reno Watersheds TMDL Report Minnesota Pollution Control Agency
37
Figure 11. Registered feedlots in impaired watersheds in the Upper Iowa River Watershed.

Upper Iowa River and Mississippi River–Reno Watersheds TMDL Report Minnesota Pollution Control Agency
38
Figure 12. Registered feedlots in impaired watersheds in the Mississippi River–Reno Watershed.
Upper Iowa River and Mississippi River–Reno Watersheds TMDL Report Minnesota Pollution Control Agency
39
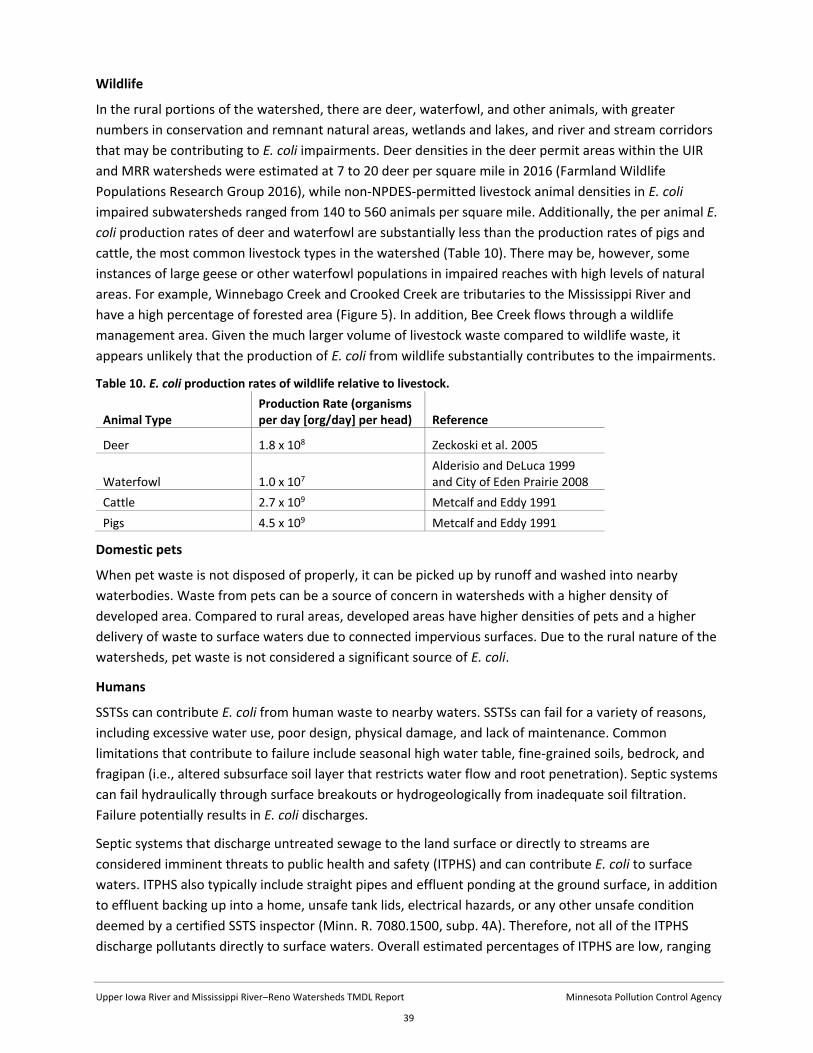
Wildlife
In the rural portions of the watershed, there are deer, waterfowl, and other animals, with greater
numbers in conservation and remnant natural areas, wetlands and lakes, and river and stream corridors
that may be contributing to E. coli impairments. Deer densities in the deer permit areas within the UIR
and MRR watersheds were estimated at 7 to 20 deer per square mile in 2016 (Farmland Wildlife
Populations Research Group 2016), while non-NPDES-permitted livestock animal densities in E. coli
impaired subwatersheds ranged from 140 to 560 animals per square mile. Additionally, the per animal E.
coli production rates of deer and waterfowl are substantially less than the production rates of pigs and
cattle, the most common livestock types in the watershed (Table 10). There may be, however, some
instances of large geese or other waterfowl populations in impaired reaches with high levels of natural
areas. For example, Winnebago Creek and Crooked Creek are tributaries to the Mississippi River and
have a high percentage of forested area (Figure 5). In addition, Bee Creek flows through a wildlife
management area. Given the much larger volume of livestock waste compared to wildlife waste, it
appears unlikely that the production of E. coli from wildlife substantially contributes to the impairments.
Table 10. E. coli production rates of wildlife relative to livestock.
Animal Type Production Rate (organisms per day [org/day] per head) Reference
Deer 1.8 x 10⁸ Zeckoski et al. 2005
Waterfowl 1.0 x 10⁷ Alderisio and DeLuca 1999 and City of Eden Prairie 2008
Cattle 2.7 x 10⁹ Metcalf and Eddy 1991
Pigs 4.5 x 10⁹ Metcalf and Eddy 1991
Domestic pets
When pet waste is not disposed of properly, it can be picked up by runoff and washed into nearby
waterbodies. Waste from pets can be a source of concern in watersheds with a higher density of
developed area. Compared to rural areas, developed areas have higher densities of pets and a higher
delivery of waste to surface waters due to connected impervious surfaces. Due to the rural nature of the
watersheds, pet waste is not considered a significant source of E. coli.
Humans
SSTSs can contribute E. coli from human waste to nearby waters. SSTSs can fail for a variety of reasons,
including excessive water use, poor design, physical damage, and lack of maintenance. Common
limitations that contribute to failure include seasonal high water table, fine-grained soils, bedrock, and
fragipan (i.e., altered subsurface soil layer that restricts water flow and root penetration). Septic systems
can fail hydraulically through surface breakouts or hydrogeologically from inadequate soil filtration.
Failure potentially results in E. coli discharges.
Septic systems that discharge untreated sewage to the land surface or directly to streams are
considered imminent threats to public health and safety (ITPHS) and can contribute E. coli to surface
waters. ITPHS also typically include straight pipes and effluent ponding at the ground surface, in addition
to effluent backing up into a home, unsafe tank lids, electrical hazards, or any other unsafe condition
deemed by a certified SSTS inspector (Minn. R. 7080.1500, subp. 4A). Therefore, not all of the ITPHS
discharge pollutants directly to surface waters. Overall estimated percentages of ITPHS are low, ranging

Upper Iowa River and Mississippi River–Reno Watersheds TMDL Report Minnesota Pollution Control Agency
40
from three to 5% of total systems, and likely do not contribute a significant amount of E. coli to impaired
streams unless they are located near or adjacent to an impaired stream (Table 11).
Septic systems with inadequate soil filtration are considered to be failing to protect groundwater from
pollutants (Minn. R. 7080.1500, subp. 4B). Due to the unique below ground conduits common in karst
areas where groundwater and surface waters are highly connected, SSTSs that are failing to protect
groundwater are also potential sources of E. coli to impaired streams. In Houston and Mower counties,
45 and 40% of SSTSs are estimated to be failing to protect groundwater, respectively (Table 11). Without
location information and knowledge of the specific hydrogeologic conditions at each SSTS drain field,
the extent of these SSTSs as a source of E. coli to impaired streams is unknown.
Table 11. Estimated ITPHS by county. Data from MPCA (2017; direct correspondence with Brandon Montgomery on October 25, 2018). These percentages are reported as estimates by local units of government for planning purposes and general trend analysis. These values may be inflated due to relatively low total SSTS estimated per jurisdiction. Additionally, estimation methods for these figures can vary depending on local unit of government resources available.
County Estimated Percentage ITPHS (%) Estimated Percentage of SSTS Failing to Protect Groundwater (%)
Fillmore 3 5
Houston 5 45
Mower 5 40
As part of the source assessment, information on SSTSs was also requested from Howard County, Iowa,
which contains a portion of the impaired subwatershed 509. According to Iowa Code Chapter 69, SSTS
inspections are 1) conducted upon the transfer of ownership of a property serviced by an SSTS and 2)
after initial installation of an SSTS. Per this code, a system is required to be replaced or updated to meet
current code if it is determined to be failing to ensure effective wastewater treatment or is otherwise
improperly functioning during the inspection. Information on SSTS compliance is not available for the
county; however, it was noted that a “push for new and updated systems” was underway with
seemingly good support (personal communication, Marshall Rogne).
Other human-derived sources of pollutants in the watershed include straight pipe discharges and
earthen pit outhouses. Straight pipe systems are unpermitted and illegal sewage disposal systems that
transport raw or partially treated sewage directly to a lake, stream, drainage system, or the ground
surface. Straight pipe systems are required to be addressed 10 months after discovery (Minn. Stat. §
115.55, subd. 11). Earthen pit outhouses likely exist in the watershed, but their numbers and locations
are unknown and were not quantified. Outhouses, or privies, are legal disposal systems and are
regulated under Minn. R. 7080.2150, subp. 2F, and Minn. R. 7080.2280.
Application of biosolids from wastewater treatment plants (WWTPs) and land application of sewage
sludge from septic tanks could also be potential sources of pollutants. 40 CFR Part 503 establishes
general requirements, pollutant limits, management practices, and operational standards for the
disposal of domestic sewage sludge. Minn. R. ch. 7041 offers additional guidance for pathogen reduction
practices to implement during the application of biosolids.

Upper Iowa River and Mississippi River–Reno Watersheds TMDL Report Minnesota Pollution Control Agency
41
Non-NPDES-permitted stormwater runoff
Stormwater runoff acts as a delivery mechanism of multiple E. coli sources including wildlife, domestic
pets, and humans. Impervious areas (such as roads, driveways, and rooftops) can directly connect the
location where E. coli is deposited on the landscape to points where stormwater runoff carries E. coli
into surface waters. For example, there is a greater likelihood that uncollected pet waste in an urban
area will reach surface waters through stormwater runoff than it would in a rural area with less
impervious surface. Wildlife, such as birds and raccoons, can be another source of E. coli in urban
stormwater runoff (Wu et al. 2011, Jiang et al. 2007).
Natural growth of E. coli
When evaluating sources of E. coli in the UIR and MRR watersheds, it is important to recognize the
natural growth of E. coli in soil and sediment. Research in the last 15 years has found the persistence of
E. coli in soil, beach sand, and sediments throughout the year in the north central United States without
the continuous presence of sewage or mammalian sources. An Alaskan study (Adhikari et al. 2007)
found that total coliform bacteria in soil were able to survive for six months in subfreezing conditions. A
study of cold water streams in southeastern Minnesota completed by the MPCA staff found the
resuspension of E. coli in the stream water column due to stream sediment disturbance. A recent study
near Duluth, Minnesota (Ishii et al. 2010) found that E. coli were able to grow in agricultural field soil. A
study by Chandrasekaran et al. (2015) of ditch sediment in the Seven Mile Creek Watershed in southern
Minnesota found that strains of E. coli had become naturalized to the water−sediment ecosystem.
Survival and growth of fecal coliform has been documented in stormsewer sediment in Michigan
(Marino and Gannon 1991). The growth and persistence of E. coli, which has been studied and
documented in our region and beyond, greatly complicates the clear identification of sources of
pathogens to surface waters. As such, the information provided in this section includes the most likely
sources based on the best available information.
3.5.1.2 NPDES-permitted sources of E. coli
Permitted wastewater
Permitted municipal wastewater is a source of E. coli in the impaired watersheds. Municipal wastewater
is the domestic sewage and wastewater collected and treated by municipalities before being discharged
to waterbodies as municipal wastewater effluent. Municipal wastewater dischargers that operate under
NPDES permits are required to disinfect wastewater to reduce fecal coliform concentrations to 200
organisms/100 mL or less as a monthly geometric mean. This standard is protective to the 126 org/100
mL class 2 water standards. Like E. coli, fecal coliform are an indicator of fecal contamination. The
primary function of a fecal bacteria effluent limit is to assure that the effluent is being adequately
treated and disinfected to assure a complete or near complete kill of fecal bacteria prior to discharge
(MPCA 2007b). Dischargers to class 2 waters are required to disinfect from April 1 through October 31,
and dischargers to class 7 waters are required to disinfect from May 1 through October 31. In addition, if
a facility discharges in a known karst area and has the potential to affect groundwater drinking water,
disinfection is required year-round (Minn. R. 7053.0215, subp.1). Year-round disinfection applies to
Caledonia WWTP, Harmony WWTP, and Spring Grove WWTP. There are no permitted combined sewer
overflows in the impaired watersheds.

Upper Iowa River and Mississippi River–Reno Watersheds TMDL Report Minnesota Pollution Control Agency
42
Monthly geometric means of effluent monitoring data are used to determine compliance with permits.
There are five wastewater dischargers with fecal coliform limits in the impaired watersheds (Figure 13
and Figure 14). Of these facilities, one facility has documented fecal coliform permit exceedances as
provided in discharge monitoring reports (DMRs) for the time period between 2008 and 2017—the
Caledonia WWTP, which is located in the Crooked Creek Watershed (AUID 07060001-519), reported four
exceedances of the monthly geometric mean. These exceedances ranged from 290–600 org/100 mL and
occurred between 2008 and 2015; there were no observed exceedances in 2016 or 2017. There are no
documented exceedances of the in-stream E. coli standard in the receiving impaired reach at the same
time as the wastewater discharge permit exceedances. These exceedances of wastewater fecal coliform
permit limits could lead to exceedances of the in-stream E. coli standard at times. However, because the
wastewater exceedances are infrequent, wastewater is not considered a significant source.

Upper Iowa River and Mississippi River–Reno Watersheds TMDL Report Minnesota Pollution Control Agency
43
Figure 13. NPDES-permitted wastewater facilities in impaired watersheds in Upper Iowa River Watershed.

Upper Iowa River and Mississippi River–Reno Watersheds TMDL Report Minnesota Pollution Control Agency
44
Figure 14. NPDES-permitted wastewater facilities in impaired watersheds in Mississippi River–Reno Watershed.

Upper Iowa River and Mississippi River–Reno Watersheds TMDL Report Minnesota Pollution Control Agency
45
Permitted animal feeding operations (NPDES and SDS)
CAFOs are defined by the EPA based on the number and type of animals. The MPCA currently uses the
federal definition of a CAFO in its permit requirements of animal feedlots along with the definition of an
AU. In Minnesota, the following types of livestock facilities are required to operate under a NPDES
Permit or a state issued State Disposal System (SDS) Permit: a) all federally defined CAFOs that have had
a discharge, some of which are under 1,000 AUs in size; and b) all CAFOs and non-CAFOs that have 1,000
or more AUs.
CAFOs and AFOs with 1,000 or more AUs must be designed to contain all manure and manure
contaminated runoff from precipitation events of less than a 25-year - 24-hour storm event. Having and
complying with an NPDES permit allows some enforcement protection if a facility discharges due to a
25-year 24-hour precipitation event (approximately 5.3” in 24 hours) and the discharge does not
contribute to a water quality impairment. Large CAFOs permitted with an SDS permit or those not
covered by a permit must contain all runoff, regardless of the precipitation event. Therefore, many large
CAFOs in Minnesota have chosen to have a NPDES permit, even if discharges have not occurred in the
past at the facility. A current manure management plan that complies with Minn. R. 7020.2225, and the
respective permit, is required for all CAFOs and AFOs with 1,000 or more AUs.
CAFOs are inspected by the MPCA in accordance with the MPCA NPDES Compliance Monitoring Strategy
approved by the EPA. All CAFOs are inspected by the MPCA on a routine basis with an appropriate mix
of field inspections, offsite monitoring and compliance assistance.
All NPDES-and SDS-permitted feedlots are designed to have zero discharge. Any NPDES/SDS permitted
feedlots located in the UIR or MRR watersheds will be listed in the respective TMDL table (see Section 4)
with a WLA of zero.
In the watersheds of the E. coli impairments, there are seven AFOs that operate under NPDES/SDS
permits (Figure 11, Figure 12, and Table 12). There are no AFOs or CAFOs operating under NPDES/SDS
permits within the MRR Watershed. Due to the requirement of NPDES-permitted AFOs and CAFOs to
completely contain runoff, these facilities are not expected to be significant E. coli contributors.
Table 12. NPDES-permitted CAFOs.
Name Permit Number
Impaired Waterbody Name
Impaired Waterbody AUID
Baarsch Farms LLC – Field MNG440066 Upper Iowa River
07060002-550
07060002-509
Baarsch Farms LLC – Hollyhock MNG440684 Upper Iowa River 07060002-509
Baarsch Farms LLC – Pass MNG440067 Beaver Creek 07060002-546
LeRoy Site MNG441983
Little Iowa River 07060002-548
Upper Iowa River 07060002-509
M & R Pork Farm – Site 1 MNG440541 Upper Iowa River
07060002-550
07060002-509
M & R Pork Farm – Site 2 MNG440541 Upper Iowa River
07060002-550
07060002-509
Wiebke Feedlot LLC – Main Feedlot MNG440906 Bee Creek (Waterloo Creek) 07060002-515

Upper Iowa River and Mississippi River–Reno Watersheds TMDL Report Minnesota Pollution Control Agency
46
3.5.1.3 Summary of E. coli sources
The behavior of fecal bacteria in the environment is complex. Concentrations of fecal bacteria in a
waterbody depend not only on their source but also factors such as weather, flow, and water
temperature. As these factors fluctuate, the concentrations of fecal bacteria in the water may increase
or decrease. Some fecal bacteria can survive and grow in the environment while others tend to die off
with time (Ishii et al. 2006, Chandrasekaran et al. 2015, Sadowsky et al. n.d., and Burns & McDonnell
2017). See Water Quality and Bacteria Frequently Asked Questions (MPCA 2019a) for additional
background information about sources of fecal bacteria. The MPCA uses the E. coli water quality
standard to identify water bodies that may be contaminated with fecal waste. Higher levels of E. coli in
the water may or may not be accompanied by higher levels of pathogens and an increased risk of harm;
varying survival rates of bacteria make it impossible to definitively state when pathogens are present.
Sources in the entire drainage area to each impaired waterbody were considered. The summary of E.
coli sources (Table 133) identifies which source types exist in each impaired watershed and which of the
source types should be a source of concern, based on the following:
Waste from livestock is a source of concern when feedlots are numerous and/or are located
close to surface waterbodies. Non-NPDES-permitted feedlots are typically more of a concern
than CAFOs or NPDES-permitted AFOs because non-NPDES-permitted feedlots are not required
to completely contain runoff.
Waste from wildlife may be a source of E. coli in Crooked Creek and Winnebago Creek due to
their heavily forested watersheds and in Bee Creek because it flows through a wildlife
management area. Any potential contributions from these areas are considered natural.
Non-NPDES-permitted stormwater runoff is considered a likely source of E. coli for streams that
flow through developed areas of cities. Stormwater runoff is considered a potential but less-
likely source of E. coli to streams that do not flow directly through developed areas in their
watershed. If there is minimal developed area in the watershed, stormwater runoff is
considered an unlikely source of E. coli. Waste from pets is considered with stormwater runoff
because waste from this source is delivered to surface waters through stormwater runoff.
Effluent from WWTPs is typically below the E. coli standard and is not considered a significant
source.
ITPHSs do not make up a large percentage of total SSTSs in the impaired watersheds; however,
they should be addressed as they pose a threat to human and environmental health and are a
potential source of E. coli. SSTSs that are failing to protect groundwater make up a larger
percentage of total SSTSs in Mower and Houston counties. Without information on their
location relative to the impaired streams, however, SSTSs that are failing to protect
groundwater are also considered a potential source of E. coli.
The monitoring data indicate that E. coli concentrations increase with flow (Figure 9), suggesting that
runoff driven sources are of most concern. Livestock is the primary source of concern in the majority of
impaired watersheds. In the watersheds with developed areas, stormwater runoff has the potential to
be a primary source.

Upper Iowa River and Mississippi River–Reno Watersheds TMDL Report Minnesota Pollution Control Agency
47
Table 13. Summary of E. coli sources. ● Likely E. coli source; ○ Potential E. coli source; – Unlikely E. coli source
HUC 8 Name
Waterbody Name AUID
Source
Livestock Wildlife Stormwater Runoff
ITPHS and SSTSs that are Failing to Protect Groundwatera
Permitted Wastewater
Mississippi River–Reno (07060001)
Crooked Creek 519 ● ○ b ○ ○
Caledonia WWTP
–
Winnebago Creek 693 ○ ○ b – ○
Eitzen WWTP
–
Upper Iowa River (07060002)
Upper Iowa River 550 ● – – ○ –
Little Iowa River 548 ● – – ○ –
Upper Iowa River 509 ● – ● ○
Le Roy WWTP
–
Beaver Creek 546 ● – – ○ –
Pine Creek 512 ● – ○ ○
Harmony WWTP
–
Bear Creek 503 ● – ○ ○
Spring Grove WWTP
–
Bee Creek (Waterloo Creek) 515 ● ○ b – ○ –
a. Relatively low percentages of SSTSs in the Upper Iowa River and Mississippi River–Reno watersheds are estimated to
be ITPHS. However, until location specific information is known about the ITPHS, they remain a potential source of E.
coli to the impaired streams.
b. Waste from wildlife is identified as a potential source to several impairments due to either heavily forested
watershed areas or flow through a wildlife management area. Any potential contributions from these areas are
considered natural.
3.5.2 TSS sources
Sources of sediment to Winnebago Creek were quantified in the UIR and MRR Watershed HSPF models
(Tetra Tech 2018), along with additional studies. HSPF is a comprehensive model of watershed
hydrology and water quality that allows the integrated simulation of point sources, land and soil
contaminant runoff processes, and in-stream hydraulic and sediment-chemical interactions. The results
provide hourly runoff flow rates, sediment concentrations, and nutrient concentrations, along with
other water quality constituents, at the outlet of any modeled subwatershed. Within each

Upper Iowa River and Mississippi River–Reno Watersheds TMDL Report Minnesota Pollution Control Agency
48
subwatershed, the upland areas are separated into multiple land use categories, and loads generated
from these land cover categories were tabulated from the HSPF model. The model evaluated both
permitted and non-NPDES-permitted sources including watershed runoff, near channel, and wastewater
point sources. Model documentation contains additional details about the model development and
calibration (Tetra Tech 2018).
Flow through the soluble rock formations that make up the karst bedrock is represented in the HSPF
model. Due to its unique below ground conduits, the karst system can be thought of as a second,
parallel network of subsurface stream reaches. The HSPF model setup for the UIR and MRR watersheds
uses a parallel karst reach representation to allow the exchange of water and associated pollutants
between surface and groundwater. Sediment derived from upland areas that are routed to karst reaches
is included in the TSS source summary.
A description of permitted and non-NPDES-permitted sources of sediment is provided below, followed
by the HSPF results for the impaired subwatersheds.
3.5.2.1 Non-NPDES-permitted sources of TSS
Watershed runoff
Watershed runoff sources of sediment are largely the result of sheet, rill, and gully erosion occurring as
water runs off over the land surface. High TSS levels can occur when heavy rains fall on unprotected
soils, dislodging soil particles that are then transported by surface runoff into rivers and streams. First-
order streams, ephemeral streams, and gullies are typically higher up in the watershed and can flow
intermittently, which makes them highly susceptible to disturbance. These sensitive areas have a very
high erosion potential, which can be exacerbated by farming practices, but can also be protected by best
management practices (BMPs) such as grassed waterways.
Agricultural activities such as livestock over-grazing and plowing or tilling crop fields can result in
devegetated, exposed soil that is susceptible to erosion. Land use in the Winnebago Creek
Subwatershed is predominantly forest, cropland and grassland/pasture. These land covers are likely
contributing sediment to watershed runoff.
Near channel sources
Near channel sources of pollutants are those in close proximity to the stream channel, including bluffs,
banks, ravines, and the stream channel itself.
Hydrologic changes in the landscape and altered precipitation patterns driven by climate change can
lead to increased TSS in surface waters. Channelization of waterways and land cover alteration decrease
detention time in the watershed and increase flows. The straightening and ditching of natural rivers
increase the slope of the original watercourse and moves water off the land at a higher velocity in a
shorter amount of time. These changes to the way water moves through a watershed and how it makes
its way into a river can lead to increases in water velocity, scouring of the river channel, and increases
erosion of the riverbanks (Schottler et al. 2014). The MRR SID Report notes that bank erosion was
common in Winnebago Creek and could be a substantial sediment source to the impaired reach (MPCA
2018a).

Upper Iowa River and Mississippi River–Reno Watersheds TMDL Report Minnesota Pollution Control Agency
49
3.5.2.2 Permitted sources of TSS
Permitted stormwater
Permitted stormwater delivers and transports pollutants to surface waters and is generated in the
watershed during precipitation events. The sources of pollutants in stormwater are many, including
decaying vegetation (leaves, grass clippings, etc.), domestic and wild animal waste, soil, deposited
particulates from the air, road salt, and oil and grease from vehicles. Two types of permitted stormwater
exist in the watershed: (1) construction stormwater and (2) industrial stormwater. There are no
permitted Municipal Separate Storm Sewer Systems (MS4) in the watershed.
Construction stormwater is regulated through an NPDES permit. Untreated stormwater that
runs off a construction site often carries sediment to surface waterbodies. Phase II of the
stormwater rules adopted by the EPA requires an NPDES permit for a construction activity that
disturbs one acre or more of soil; a permit is needed for smaller sites if the activity is either part
of a larger development or if the MPCA determines that the activity poses a risk to water
resources. Coverage under the construction stormwater general permit requires sediment and
erosion control measures that reduce stormwater pollution during and after construction
activities. TSS from construction stormwater is inherently incorporated in the watershed runoff
estimates. It is estimated that a small percent of the project area is permitted through the
construction stormwater permit, and construction stormwater is not considered a significant
source.
Industrial stormwater is regulated through an NPDES permit when stormwater discharges have
the potential to come into contact with materials and activities associated with the industrial
activity. TSS loading from industrial stormwater is inherently incorporated in the watershed
runoff estimates. It is estimated that a small percent of the project area is permitted through
the industrial stormwater permit, and industrial stormwater is not considered a significant
source.
Permitted construction and industrial stormwater are not prevalent in the impaired watershed and
therefore are not considered significant sources.
Permitted wastewater
Wastewater from municipal sources is a potential source of sediment to impaired waters—Eitzen WWTP
(Figure 14) is permitted to discharge wastewater in the Winnebago Creek Subwatershed. Eitzen WWTP
is primarily a spray irrigation facility, which is only authorized to discharge in emergency situations when
weather conditions do not allow land application; the facility discharged only three times between 2008
and 2017. Eitzen WWTP’s NPDES permit limits the load and concentration of sediment, as TSS, that the
WWTP may discharge; the concentration limit is 45 mg/L as a calendar monthly average. Although this
concentration is higher than the stream TSS standard of 10 mg/L, the wastewater discharges are
infrequent, and wastewater is not considered a significant source.
There are no permitted industrial wastewater discharges impacting the impaired watersheds.

Upper Iowa River and Mississippi River–Reno Watersheds TMDL Report Minnesota Pollution Control Agency
50
3.5.2.3 Summary of TSS sources
The UIR and MRR watershed HSPF models (Tetra Tech 2018) indicate that watershed runoff from
cropland and grassland/pasture along with near channel sources account for the majority of the TSS
load in Winnebago Creek (Table 1414). Forest contributes 13% of the TSS load but is also a primary land
cover in this watershed (i.e., 33% of the watershed is forested). Point sources contribute negligible loads
to Winnebago Creek. This source assessment is corroborated by the monitoring data—the majority of
TSS exceedances occur during higher flows, indicating that runoff-driven sources such as watershed
runoff and near channel erosion are the primary sources of concern (Figure 10).
Table 14. TSS loading in Winnebago Creek Watershed (07060001-693) from HSPF model results (Tetra Tech 2018).
TSS Source
Land cover area in watershed model (% of watershed) a
Percent of mean annual load (%) b
Cropland runoff 27% 27%
Pasture/grassland runoff 33% 22%
Developed runoff 3% 4%
Forest runoff 36% 13%
Barren land runoff <1% 2%
Near channel c -- 32%
Point sources -- <1 % a. The composition of land cover differs in the model compared to Table 5. The model uses land cover from 2001
whereas Table 5 uses land cover from 2017. b. Percentages (rounded to the nearest integer) were calculated as the average of the annual percent. c. Near channel sources were calculated based on the net deposition and scour for all reaches in the watershed.
A 2012 through 2015 study on erosion and sediment dynamics in the Root River Watershed indicates
that agricultural soil erosion and streambank erosion are substantial sediment sources, with agricultural
soil erosion representing 60% to 70% of overall sediment loading at small watershed scales (Belmont et
al. nd). Results from this research were used in calibration of the HSPF model of the Root River, UIR, and
MRR watersheds. The findings from Belmont et al. are comparable to the source assessment results
derived from the HSPF model. Differences between the HSPF model outputs and findings from Belmont
et al. could be attributed to factors including precipitation intensity/frequency, soil type, slope, upland
transport distance to the stream network, and differences in tillage and manure application practices in
these areas.

Upper Iowa River and Mississippi River–Reno Watersheds TMDL Report Minnesota Pollution Control Agency
51
4. TMDL development approach A TMDL is the total amount of a pollutant that a receiving waterbody can assimilate while still achieving
water quality standards. TMDLs can be expressed in terms of mass per time or by other appropriate
measures. A TMDL for a waterbody that is impaired as a result of excessive loading of a particular
pollutant can be described by the following equation:
TMDL = WLA + LA + MOS
where:
TMDL = total maximum daily load, also known as loading capacity, which is the greatest
pollutant load a waterbody can receive without violating water quality standards.
WLA = wasteload allocation, or the portion of the TMDL allocated to existing or future permitted
point sources of the relevant pollutant.
LA = load allocation, or the portion of the TMDL allocated to existing or future nonpoint sources
of the relevant pollutant.
MOS = margin of safety, or an accounting of uncertainty about the relationship between
pollutant loads and receiving water quality. The MOS can be provided implicitly through
analytical assumptions or explicitly by reserving a portion of the loading capacity (EPA 1999).
This section describes the general approach used to derive the TMDLs and allocations. The allocations
for each of the various sources and parameters are provided in Section 5: TMDLs and water quality data
summaries.
Assimilative loading capacities for the streams were developed using load duration curves. See Section
3.4 for a description of load duration curve development. The load duration curves provide assimilative
loading capacities and show load reductions necessary to meet water quality standards. For any given
flow in the load duration curve, the loading capacity is determined by selecting the point on the load
duration curve that corresponds to the flow exceedance (along the x-axis). Load duration curves were
developed for each impaired reach.
The load duration curve method is based on an analysis that encompasses the cumulative frequency of
historic flow data over a specified period. Because this method uses a long-term record of daily flow
volumes, virtually the full spectrum of allowable loading capacities is represented by the resulting curve.
In the TMDL equation tables in this report (Section 5), only five points on the entire load duration curve
are depicted (the midpoints of the designated flow zones). The entire curve; however, represents the
TMDL and is what is ultimately approved by the EPA.
Additional details on the approaches used to develop the TMDL components are provided in the
following sections.
4.1 Margin of safety
The purpose of the MOS is to account for uncertainty that the allocations will result in attainment of
water quality standards. Section 303(d) of the CWA and EPA’s regulations in 40 CFR 130.7 require that:

Upper Iowa River and Mississippi River–Reno Watersheds TMDL Report Minnesota Pollution Control Agency
52
TMDLs shall be established at levels necessary to attain and maintain the applicable narrative and
numeric water quality standards with seasonal variations and a MOS, which takes into account any
lack of knowledge concerning the relationship between effluent limitations and water quality.
The MOS can either be implicitly incorporated into conservative assumptions used to develop the TMDL
or be added as a separate explicit component of the TMDL (EPA 1991). An explicit MOS of 10% was
included in the TMDLs to account for uncertainty that the pollutant allocations would attain the water
quality targets. The use of an explicit MOS accounts for environmental variability in pollutant loading,
variability in water quality monitoring data, calibration and validation processes of modeling efforts,
uncertainty in modeling outputs, conservative assumptions made during the modeling efforts, and
limitations associated with the drainage area-ratio method used to extrapolate flow data. This MOS is
considered to be sufficient given the robust datasets used and quality of modeling, as described below.
The UIR and MRR watersheds HSPF model is part of the Root River Watershed HSPF model, which was
calibrated and validated using 10 stream flow gaging stations. One of the calibration stations is the UIR
near Bluffton, Iowa (USGS site # 05387440). Mean monthly simulated flows match closely with mean
monthly observed flows at this location, and a close fit was achieved across high to low flows in a
cumulative distribution function plot (see Figure 3-20 and Figure 3-21 in Tetra Tech 2018). The sediment
calibration used 12 sediment monitoring stations in the Root River Watershed (Tetra Tech 2018).
Calibration results indicate that the HSPF model is a valid representation of hydrologic and water quality
conditions in the modeled watersheds. Flow data used to develop the stream TMDLs are derived from
HSPF-simulated daily flow data, and the sediment source assessment is derived from HSPF-simulated
sediment.
4.2 Seasonal variation and critical conditions
The CWA requires that TMDLs take into account critical conditions for flow, loading, and water quality
parameters as part of the analysis of loading capacity. Both seasonal variation and critical conditions are
accounted for through the application of load duration curves. Load duration curves evaluate water
quality conditions across all flow regimes including high flow, which is the runoff condition where
pollutant transport and loading from upland sources tend to be greatest, and low flow, when loading
from wastewater and other direct sources to the waterbodies has the greatest impact. Seasonality is
accounted for by addressing all flow conditions in a given reach. Seasonal variation is also addressed by
the water quality standards’ application during the period when high pollutant concentrations are
expected via storm event runoff. Using this approach, it has been determined that load reductions are
needed for specific flow conditions.
4.3 Baseline year
The monitoring data used to calculate the percent reductions are from 2008 through 2017. Because
projects undertaken recently may take a few years to influence water quality, the baseline year for
crediting load reductions for a given waterbody is 2012, the midpoint of the time period. Any activities
implemented during or after the baseline year that led to a reduction in pollutant loads to the
waterbodies may be considered as progress towards meeting a WLA or LA.

Upper Iowa River and Mississippi River–Reno Watersheds TMDL Report Minnesota Pollution Control Agency
53
4.4 Boundary conditions
A boundary condition allocation is provided for impaired segments that contain a portion of their
watershed in Iowa:
Winnebago Creek (07060001-693)
Upper Iowa River (07060002-550)
Upper Iowa River (07060002-509)
The boundary condition allocation assumes that that water quality standards are being met at the state
line and takes into account the MOS and any applicable wastewater WLAs. Boundary conditions are
calculated using the proportion of the total watershed area in Iowa. The boundary condition allocation is
equal to the percent of the total watershed area in Iowa, multiplied by the loading capacity, minus the
MOS minus wastewater WLAs (where applicable).
4.5 Construction and industrial stormwater WLAs
Construction stormwater is permitted through the Construction Stormwater General Permit
MNR100001, and a single categorical WLA for construction stormwater is provided for TSS impaired
stream Winnebago Creek, located in Houston County. The average annual percent area of Houston
County that is permitted through the construction stormwater permit is 0.019% (Minnesota Stormwater
Manual contributors 2018). The construction stormwater WLA was calculated as the percent area
multiplied by the loading capacity (i.e., TMDL) less the MOS and wastewater WLA. It is assumed that
loads from permitted construction stormwater sites that operate in compliance with their permits are
meeting the WLA.
Industrial stormwater is permitted through the General Permit MNR050000 for Industrial Stormwater
Multi-Sector. A single categorical WLA for industrial stormwater is provided for Winnebago Creek. There
are three permitted industrial stormwater discharges in the Winnebago Creek Watershed associated
with quarry operations and address stormwater from Eitzen Quarry and Shultz Quarry (MNG490087)
and Winnebago Quarry Houston County (MNG490115). Permitted industrial stormwater sources are not
expected to be sources of E. coli and are not provided WLAs. The MPCA’s industrial stormwater permit
does not regulate discharges of E. coli. The permit does not contain E. coli benchmarks; industrial
stormwater permittees are required to sample their stormwater for parameters that more closely match
the potential contribution of pollutants for their industry sector or subsector. For example, recycling
facilities and auto salvage yards are required to sample for TSS, metals, and other pollutants likely
present at these types of facilities.
Permitted industrial activities make up a small portion of the watershed areas, and the industrial
stormwater WLA was set equal to the construction stormwater WLA. It is assumed that loads from
permitted industrial stormwater sites that operate in compliance with the permit are meeting the WLA.
4.6 Natural background consideration
Natural background is defined in both Minnesota rule and statute:
Minn. R. 7050.0150, subp. 4:

Upper Iowa River and Mississippi River–Reno Watersheds TMDL Report Minnesota Pollution Control Agency
54
“Natural causes” means the multiplicity of factors that determine the physical, chemical or biological
conditions that would exist in the absence of measurable impacts from human activity or influence.
The Clean Water Legacy Act (Minn. Stat. § 114D.10, subd. 10) defines natural background as:
… characteristics of the water body resulting from the multiplicity of factors in nature, including
climate and ecosystem dynamics that affect the physical, chemical or biological conditions in a water
body, but does not include measurable and distinguishable pollution that is attributable to human
activity or influence.
Natural background sources of E. coli are inputs that would be expected under natural, undisturbed
conditions. The relationship between bacterial sources and bacterial concentrations found in streams is
complex, involving precipitation and flow, temperature, livestock management practices, wildlife
activities, survival rates, land use practices, and other environmental factors. However, for each
impairment, natural background levels are implicitly incorporated in the water quality standards used by
the MPCA to determine/assess impairment, and therefore natural background is accounted for and
addressed through the MPCA’s waterbody assessment process.
Natural background TSS sources are inputs that would be expected under natural, undisturbed
conditions. Natural background sources can include inputs from natural geologic processes such as soil
loss from stream development and upland erosion of areas not disturbed by human activity;
atmospheric deposition; wildlife; and loading from grassland, forests, and other natural land covers. In
2016, when considering a challenge to the MPCA’s approach to natural background in the Little Rock
Creek TMDL, the Minnesota Court of Appeals held that the MPCA is not required to develop a LA for
natural background independent from other nonpoint sources. In that case, the MPCA gathered and
considered natural background sources but did not assign a separate LA to those sources due to their
marginal impact on Little Rock Creek’s overall water quality. The MPCA followed a similar approach for
this TMDL. The court also held that, as allowed by Minn. R. 7050.0170, background levels can be
predicted based on data from watersheds with similar characteristics.
The TSS standard inherently addresses natural background conditions. Minnesota’s regional TSS
standards are based on reference or least-impacted streams and take into account differing levels of
sediment present in streams and rivers in the many ecoregions across the state, depending on factors
such as topography, soils, and climate (MPCA 2011a).
Based on the MPCA’s waterbody assessment process and the TMDL source assessment exercises, there
is no evidence at this time to suggest that natural background sources are a major driver of any of the
impairments and/or affect the waterbodies’ ability to meet state water quality standards. For all
impairments addressed in this TMDL study, natural background sources are implicitly included in the LA
portion of the TMDL allocation tables, and TMDL reductions should focus on the major anthropogenic
sources identified in the source assessment.
4.7 E. coli TMDL approach
4.7.1 Loading capacity and percent reductions
Loading capacities were developed using load duration curves developed from simulated flows. (See
Section 3.4 for a description of load duration curve development and Section 4 for more background on

Upper Iowa River and Mississippi River–Reno Watersheds TMDL Report Minnesota Pollution Control Agency
55
the load duration curve method). The loading capacity was calculated as flow multiplied by the E. coli
geometric mean standard (126 org/100 mL for class 2 streams and 630 org/100 mL for the class 7
streams). A second E. coli TMDL target of 126 org/100 mL is provided for Bear Creek (07060002-503)
and Pine Creek (07060003-512), which is based on the more restrictive downstream standard in Iowa
(see Section 2.2).
It is assumed that practices that are implemented to meet the geometric mean standard will also
address the individual sample standard (1,260 org/100 mL), and that the individual sample standard will
also be met.
Percent reductions for E. coli TMDLs are provided based on monitored concentration data and the water
quality standard. Ideally, sufficient data would exist to calculate current actual E. coli loads to compare
directly to the TMDLs, which would allow for load reduction projections. However, the amount of data
required for load calculations is much greater than that required for simple impairment assessment. As
such, a load reduction is not provided. Instead, the estimated percent reduction provided for each TMDL
was calculated by comparing the highest observed (monitored) monthly geometric mean concentration
from the months that the standard applies to the geometric mean standard, as a concentration,
(monitored – standard/monitored). Monthly geometric means were used to estimate percent reduction
only if they are based on five or more samples. The estimated percent reductions provide a rough
approximation of the overall reduction needed for the waterbody to meet the TMDL. The percent
reductions should not be construed to mean that each of the separate sources listed in the TMDL table
needs to be reduced by that amount. The percent reduction should be interpreted as a means to
capture the level of effort needed to reduce E. coli concentrations in the watershed. Calculations come
from the best available data and support the conclusion that E. coli sources need to be addressed.
4.7.2 Wasteload allocation methodology
4.7.2.1 Permitted wastewater
The E. coli WLAs for permitted municipal wastewater are based on the E. coli geometric mean standard of 126 organisms per 100 mL and the facility’s average wet weather design flow (

Upper Iowa River and Mississippi River–Reno Watersheds TMDL Report Minnesota Pollution Control Agency
56
Table 155). For WWTPs with controlled discharge, the maximum daily discharge volume for each facility
was used.
Disinfection requirements for each permitted facility are provided in

Upper Iowa River and Mississippi River–Reno Watersheds TMDL Report Minnesota Pollution Control Agency
57
Table 15. Disinfection time periods vary depending on the class of water (e.g., class 2 or 7) and if the
facility discharges to stream in a karst region with a direct connection to groundwater and nearby
drinking water wells. While a facility may be required to disinfect year-round, the WLA only applies to
the water quality standard window. There are no instances when disinfection requirements need to be
changed. It is assumed that if a facility meets the fecal coliform limit of 200 organisms per 100 mL it is
also meeting the E. coli WLA.
All wastewater WLAs for E. coli are listed in the TMDL tables in Section 5 and in

Upper Iowa River and Mississippi River–Reno Watersheds TMDL Report Minnesota Pollution Control Agency
58
Table 155.

Upper Iowa River and Mississippi River–Reno Watersheds TMDL Report Minnesota Pollution Control Agency
59
Table 15. Wastewater wasteload allocations for E. coli.
Facility Permit Number
Design Flow (mgd) a
Disinfection Required under Current Permit
E. coli WLA (billion organisms per day)
Time Period the WLA Applies
Impaired Waterbody Name
Impaired Waterbody AUID
Caledonia WWTP MN0020231 0.57 Jan 1–Dec 31 2.72 Apr 1–Oct 31
Crooked Creek
07060001-519
Eitzen WWTP MN0049531 0.209 Apr 1–Oct 31 0.995 Apr 1–Oct 31 Winnebago Creek
07060001-693
Harmony WWTP MN0022322 0.194 Jan 1–Dec 31 0.93 Jan 1–Dec 31 b Pine Creek
07060002-512
Le Roy WWTP MN0021041 0.912 Apr 1–Oct 31 4.351 Apr 1–Oct 31 Upper Iowa River
07060002-509
Spring Grove WWTP MN0021440 0.378 Jan 1–Dec 31 1.80
Mar 15–
Nov 15 c Bear Creek 07060002-503
a. Average wet weather design flow or maximum daily pond flow, in million gallons per day (mgd). b. Harmony WWTP: The E. coli standard of the downstream impaired reach in Iowa applies from Jan–Dec. c. Spring Grove WWTP: The E. coli standard of the downstream impaired reach in Iowa applies from Mar 15–Nov 15.
4.7.2.2 Permitted animal feeding operations
All NPDES- and SDS-permitted AFOs in the UIR Watershed are designed to have zero discharge, and as
such they do not receive a WLA. All other non-CAFO feedlots and the land application of all manure are
accounted for in the LA. There are no NPDES- or SDS-permitted AFOs in the MRR Watershed.
4.7.3 Load allocation methodology
The LA represents the portion of the loading capacity that is allocated to pollutant loads that are not
permitted through an NPDES permit (e.g., non-NPDES-permitted watershed runoff, ITPHS, and natural
background [see Section 4.6]). The LA for each E. coli TMDL was calculated as the loading capacity minus
the MOS minus the WLAs.
4.8 Total suspended solids TMDL approach
4.8.1 Loading capacity and percent reductions
The loading capacity was calculated as flow multiplied by the TSS standard (10 mg/L). The existing
concentration was calculated as the 90th percentile of observed TSS concentrations from the months
that the standard applies (April through September). The 90th percentile was used because the TSS
standard states that the numeric criterion may be exceeded for no more than 10% of the time. The TSS
water quality standard is included in the TMDL table to provide a comparison for existing conditions.
4.8.2 Wasteload allocation methodology
WLAs are provided for municipal wastewater and permitted construction and industrial stormwater.
4.8.2.1 Wastewater
There is only one wastewater facility, Eitzen WWTP, which is authorized through an NPDES permit to
discharge TSS in the Winnebago Creek Watershed. The Eitzen WWTP is primarily a spray irrigation
facility that is only authorized to discharge in emergency situations, including when weather conditions

Upper Iowa River and Mississippi River–Reno Watersheds TMDL Report Minnesota Pollution Control Agency
60
do not allow land application. The facility discharged three times between 2008 and 2017: June 2008,
July 2013, and September 2016. The TSS WLA is based on the calendar monthly average TSS load limit in
the facility’s NPDES permit (Table 166); the calendar monthly average concentration limit is 45 mg/L TSS.
This concentration limit is higher than the stream water quality standard, which is 10 mg/L TSS. Because
of the infrequency of discharge, Eitzen WWTP is not considered to contribute to TSS impairment in
Winnebago Creek, and the current TSS permit limits are sufficient to protect water quality in Winnebago
Creek. The wastewater WLA for TSS is listed in the TMDL table in Section 5 and in Table 16.
Table 16. Wastewater wasteload allocation for TSS.
Facility Permit Number
Maximum Daily Pond Flow (mgd)
TSS Wasteload Allocation (pounds per day)
Impaired Waterbody Name
Impaired Waterbody AUID
Eitzen WWTP MN0049531 0.209 78 Winnebago Creek 07060001-693
4.8.2.2 Construction and industrial stormwater WLAs
Categorical WLAs are provided for construction and industrial stormwater. See Section 4.5 for more
details.

Upper Iowa River and Mississippi River–Reno Watersheds TMDL Report Minnesota Pollution Control Agency
61
5. TMDLs and water quality data summaries This section provides the water quality summary tables, load duration curves, and TMDL tables for all
the impairments addressed in this report. See Sections 3.4, 3.5, and 4 for an explanation of the data
analyses.
The water quality data, when taken as a whole, indicate that the majority of E. coli exceedances occur
under high and very high flows (Figure 9, Table 8), indicating that runoff-driven sources such as
stormwater runoff and runoff from AFOs are the primary sources of concern. Load reductions are
needed to address multiple source types (see Section 0: Stream E. coli source summary).
The maximum recordable value for E. coli concentration depends on the extent of sample dilution and is
often 2,420 org/100 mL. Concentrations that are noted as 2,420 org/100 mL are likely higher, and the
magnitude of the exceedances is not known.
The majority of TSS exceedances also occur during higher flows (Figure 10); load reductions will need to
come primarily from agricultural runoff and near channel erosion (see Section 3.5.2.3: Summary of TSS
sources).
Loads in the TMDL tables are rounded to two significant digits, except in the case of values greater than
100, which are rounded to the nearest whole number. Percent reductions are rounded to the nearest
whole number.
5.1 Mississippi River–Reno Watershed
5.1.1 Crooked Creek, T102 R4W S27, west line to Bluff Slough (07060001-519)
5.1.1.1 E. coli
Table 17. Annual summary of E. coli data at Crooked Creek (AUID 07060001-519; April–October).
Year
Sample Count
Geometric Mean
(org/100 mL)
Minimum (org/100mL)
Maximum (org/100mL)
Number of Individual Standard
Exceedances
Percent of Individual Standard
Exceedances
2008 0 – – – – –
2009 0 – – – – –
2010 0 – – – – –
2011 0 – – – – –
2012 0 – – – – –
2013 0 – – – – –
2014 0 – – – – –
2015 9 1,080 644 2,723 3 33
2016 6 825 613 1,300 1 17
2017 0 – – – – –
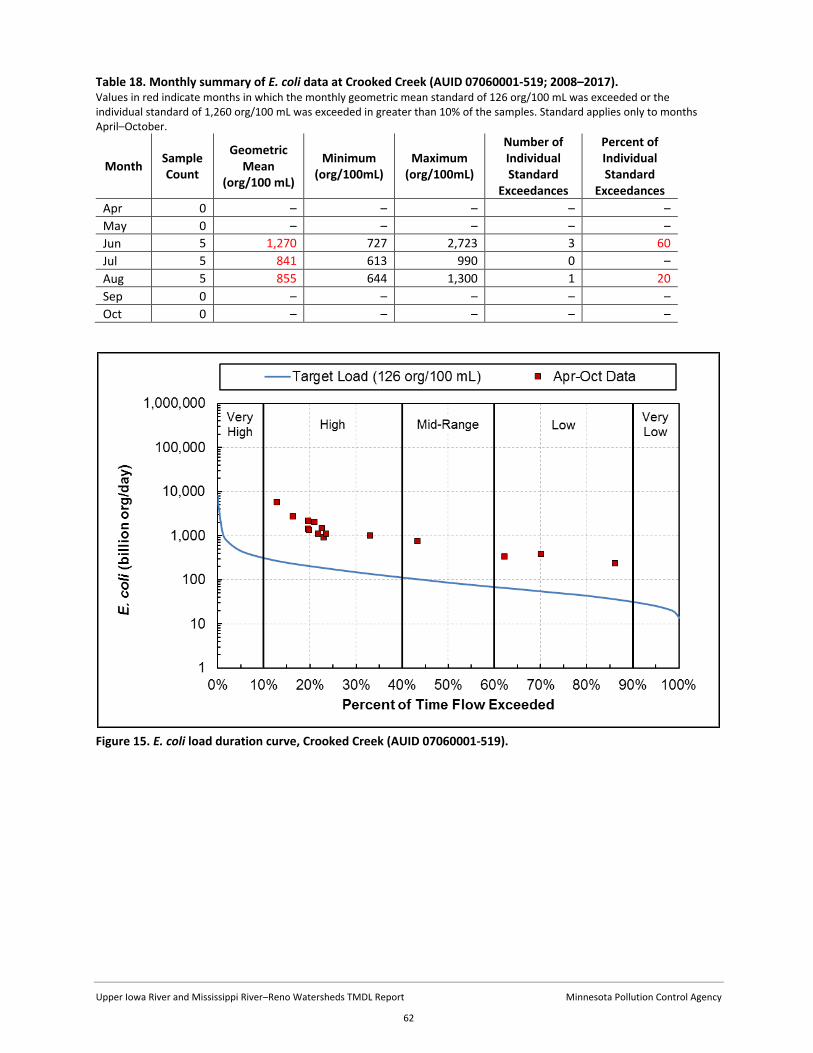
Upper Iowa River and Mississippi River–Reno Watersheds TMDL Report Minnesota Pollution Control Agency
62
Table 18. Monthly summary of E. coli data at Crooked Creek (AUID 07060001-519; 2008–2017). Values in red indicate months in which the monthly geometric mean standard of 126 org/100 mL was exceeded or the individual standard of 1,260 org/100 mL was exceeded in greater than 10% of the samples. Standard applies only to months April–October.
Month Sample Count
Geometric Mean
(org/100 mL)
Minimum (org/100mL)
Maximum (org/100mL)
Number of Individual Standard
Exceedances
Percent of Individual Standard
Exceedances
Apr 0 – – – – –
May 0 – – – – –
Jun 5 1,270 727 2,723 3 60
Jul 5 841 613 990 0 –
Aug 5 855 644 1,300 1 20
Sep 0 – – – – –
Oct 0 – – – – –
Figure 15. E. coli load duration curve, Crooked Creek (AUID 07060001-519).

Upper Iowa River and Mississippi River–Reno Watersheds TMDL Report Minnesota Pollution Control Agency
63
Table 19. E. coli TMDL summary, Crooked Creek (AUID 07060001-519).
303(d) listing year or proposed year: 2018
Baseline year: 2012
Flow zones
TMDL parameter
Very high High Mid-range Low Very low
2,587-101 cfs 100-37 cfs 36-23 cfs 22-11 cfs 10-4.4 cfs
Sources E. coli load (B org/d)
Wasteload Caledonia WWTP (MN0020231)
2.72 2.72 2.72 2.72 2.72
Total WLA 2.7 2.7 2.7 2.7 2.7
Load Total LA 397 152 74 40 20
MOS 45 17 8.5 4.8 2.5
Total load 445 172 85 48 25
Maximum monthly geomean (org/100 mL) 1,270
Overall estimated percent reduction a 90% a. Calculated by comparing the highest observed (monitored) monthly geometric mean concentration from the months that the standard applies to the geometric mean standard, as a concentration, (monitored – standard/monitored). See Section 4.7.1 for more information.
5.1.2 Winnebago Creek, T101 R4W S27, west line to south line (07060001-693)
5.1.2.1 E. coli
Table 20. Annual summary of E. coli data at Winnebago Creek (AUID 07060001-693; April–October).
Year Sample Count
Geometric Mean
(org/100 mL)
Minimum (org/100mL)
Maximum (org/100mL)
Number of Individual Standard
Exceedances
Percent of Individual Standard
Exceedances
2008 0 – – – – –
2009 0 – – – – –
2010 0 – – – – –
2011 0 – – – – –
2012 0 – – – – –
2013 0 – – – – –
2014 0 – – – – –
2015 9 612 261 2,490 2 22
2016 6 368 228 816 0 –
2017 0 – – – – –

Upper Iowa River and Mississippi River–Reno Watersheds TMDL Report Minnesota Pollution Control Agency
64
Table 21. Monthly summary of E. coli data at Winnebago Creek (AUID 07060001-693; 2008–2017). Values in red indicate months in which the monthly geometric mean standard of 126 org/100 mL was exceeded or the individual standard of 1,260 org/100 mL was exceeded in greater than 10% of the samples. Standard applies only to months April–October
Month Sample Count
Geometric Mean
(org/100 mL)
Minimum (org/100mL)
Maximum (org/100mL)
Number of Individual Standard
Exceedances
Percent of Individual Standard
Exceedances
Apr 0 – – – – –
May 0 – – – – –
Jun 5 990 387 2,490 2 40
Jul 5 352 228 637 0 –
Aug 5 358 292 579 0 –
Sep 0 – – – – –
Oct 0 – – – – –
Figure 16. E. coli load duration curve, Winnebago Creek (AUID 07060001-693).

Upper Iowa River and Mississippi River–Reno Watersheds TMDL Report Minnesota Pollution Control Agency
65
Table 22. E. coli TMDL summary, Winnebago Creek (AUID 07060001-693).
303(d) listing year or proposed year: 2018
Baseline year: 2012 Flow zones
TMDL parameter
Very high High Mid-range Low Very low
2,391-89 cfs 88-32 cfs 31-20 cfs 19-8.6 cfs 8.5-3.4 cfs
Sources E. coli load (B org/d)
Boundary Condition at Iowa State Line a 1.6 0.59 0.29 0.16 0.078
Wasteload Eitzen WWTP (MN0049531) 0.995 0.995 0.995 0.995 0.995
Total WLA 1.0 1.0 1.0 1.0 1.0
Load Total LA 355 134 65 36 18
MOS 40 15 7.4 4.1 2.1
Total load 398 151 74 41 21
Maximum monthly geomean (org/100 mL) 990
Overall estimated percent reduction b 87% a. The boundary condition allocation is equal to the percent of the total watershed area in Iowa multiplied by the loading capacity minus the MOS minus wastewater WLAs. b. Calculated by comparing the highest observed (monitored) monthly geometric mean concentration from the months that the standard applies to the geometric mean standard, as a concentration, (monitored – standard/monitored). See Section 4.7.1 for more information.
5.1.2.2 TSS
Table 23. Annual summary of TSS data Winnebago Creek (AUID 07060001-693; April–September). Values in red indicate years in which the individual standard of 10 mg/L was exceeded in greater than 10% of the samples.
Year Sample count
Mean (mg/L) Minimum
(mg/L) Maximum
(mg/L) Number of
exceedances Frequency of exceedances
2008 0 – – – – –
2009 8 21 3 98 4 50%
2010 0 – – – – –
2011 0 – – – – –
2012 0 – – – – –
2013 0 – – – – –
2014 0 – – – – –
2015 10 19 2 42 6 60%
2016 5 28 7 44 3 60%
2017 4 17 9 31 3 75%
Table 24. Monthly summary of TSS data at Winnebago Creek (AUID 07060001-693; 2008–2017). Values in red indicate months in which the individual standard of 10 mg/L was exceeded in greater than 10% of the samples. Standard applies only to months April–September.
Month Sample count
Mean (mg/L)
Minimum (mg/L)
Maximum (mg/L)
Number of exceedances
Frequency of exceedances
Apr 2 38 31 44 2 100%
May 4 28 18 39 4 100%
Jun 7 32 12 98 7 100%
Jul 6 10 6 24 1 17%
Aug 5 8 3 16 1 20%
Sep 3 17 2 42 1 33%
Oct 1 19 19 19 NA NA

Upper Iowa River and Mississippi River–Reno Watersheds TMDL Report Minnesota Pollution Control Agency
66
Figure 17. TSS load duration curve, Winnebago Creek (AUID 07060001-693). Table 25. TSS TMDL summary, Winnebago Creek (AUID 07060001-693).
303(d) listing year or proposed year: 2018
Baseline year: 2012 Flow zones
TMDL parameter
Very high High Mid-range Low Very low
2,391-89 cfs 88-32 cfs 31-20 cfs 19-8.6 cfs 8.5-3.4 cfs
Sources TSS Load (lb/d)
Boundary Condition at Iowa State Line a 27 10 4.7 2.5 1.1
Wasteload
Construction Stormwater 1.2 0.44 0.21 0.11 0.047
Industrial Stormwater 1.2 0.44 0.21 0.11 0.047
Eitzen WWTP (MN0049531) 78 78 78 78 78
Total WLA 80 79 78 78 78
Load Total LA 6,161 2,282 1,081 567 247
MOS 697 263 129 72 36
Total load 6,965 2,634 1,293 720 362
Existing 90th percentile concentration (mg/L) 43
TSS water quality standard (mg/L) 10 Note: Existing TSS concentrations are more than 3 times higher than the water quality standard for Winnebago Creek. Estimated percent reduction to meet the TSS standard (10 mg/L) is approximately 77%. The overall estimated percent reduction needed to meet the TMDL was calculated as the existing concentration minus the TSS standard divided by the existing concentration. This calculation approximates the reduction in concentration needed to meet the standard. The percent reduction does not necessarily apply to each of the sources/allocations individually.
a. The boundary condition allocation is equal to the percent of the total watershed area in Iowa multiplied by the loading capacity minus the MOS minus wastewater WLAs.

Upper Iowa River and Mississippi River–Reno Watersheds TMDL Report Minnesota Pollution Control Agency
67
5.2 Upper Iowa River Watershed
5.2.1 Upper Iowa River, -92.5901, 43.5985 to Little Iowa River (07060002-550)
5.2.1.1 E. coli
Table 26. Annual summary of E. coli data at Upper Iowa River (AUID 07060002-550; April–October).
Year Sample Count
Geometric Mean
(org/100 mL)
Minimum (org/100mL)
Maximum (org/100mL)
Number of Individual Standard
Exceedances
Percent of Individual Standard
Exceedances
2008 7 652 10 3,800 3 43
2009 7 548 10 4,900 3 43
2010 7 355 110 3,300 1 14
2011 6 286 63 780 0 –
2012 7 296 52 1,600 1 14
2013 0 – – – – –
2014 0 – – – – –
2015 0 – – – – –
2016 0 – – – – –
2017 0 – – – – –
Table 27. Monthly summary of E. coli data at Upper Iowa River (AUID 07060002-550; 2008–2017). Values in red indicate months in which the monthly geometric mean standard of 126 org/100 mL was exceeded or the individual standard of 1,260 org/100 mL was exceeded in greater than 10% of the samples. Standard applies only to months April–October.
Month Sample Count
Geometric Mean
(org/100 mL)
Minimum (org/100mL)
Maximum (org/100mL)
Number of Individual Standard
Exceedances
Percent of Individual Standard
Exceedances
Apr 4 a 73 10 500 0 –
May 5 73 10 270 0 –
Jun 5 623 160 1,700 2 40
Jul 5 777 190 3,300 1 20
Aug 5 787 550 1,300 1 20
Sep 5 1,007 490 2,200 2 40
Oct 5 654 85 4,900 2 40 a. Not enough samples to assess compliance with the monthly geometric mean standard.

Upper Iowa River and Mississippi River–Reno Watersheds TMDL Report Minnesota Pollution Control Agency
68
Figure 18. E. coli load duration curve, Upper Iowa River (AUID 07060002-550).
Table 28. E. coli TMDL summary, Upper Iowa River (AUID 07060002-550).
303(d) listing year or proposed year: 2018
Baseline year: 2012 Flow zones
TMDL parameter
Very high High Mid-range Low Very low
1,348-74 cfs 73-26 cfs 25-15 cfs 14-5.4 cfs 5.3-2.0 cfs
Sources E. coli load (B org/d)
Boundary Condition at Iowa State Line a 14 4.7 2.3 1.1 0.48
Total WLA 0 0 0 0 0
Total LA 288 101 50 24 10
MOS 34 12 5.8 2.8 1.2
Total load 336 118 58 28 12
Maximum monthly geomean (org/100 mL) 1,007
Overall estimated percent reduction b 87% a. The boundary condition allocation is equal to the percent of the total watershed area in Iowa multiplied by the loading capacity minus the MOS. b. Calculated by comparing the highest observed (monitored) monthly geometric mean concentration from the months that the standard applies to the geometric mean standard, as a concentration, (monitored – standard/monitored). See Section 4.7.1 for more information.

Upper Iowa River and Mississippi River–Reno Watersheds TMDL Report Minnesota Pollution Control Agency
69
5.2.2 Little Iowa River, 770th Ave to Upper Iowa River (07060002-548)
5.2.2.1 E. coli
Table 28. Annual summary of E. coli data at Little Iowa River (AUID 07060002-548; April–October).
Year Sample Count
Geometric Mean
(org/100 mL)
Minimum (org/100mL)
Maximum (org/100mL)
Number of Individual Standard
Exceedances
Percent of Individual Standard
Exceedances
2008 7 177 60 460 0 –
2009 7 111 20 610 0 –
2010 7 410 30 3,600 2 29
2011 5 247 52 830 0 –
2012 7 63 10 500 0 –
2013 0 – – – – –
2014 0 – – – – –
2015 0 – – – – –
2016 0 – – – – –
2017 0 – – – – –
Table 29. Monthly summary of E. coli data at Little Iowa River (AUID 07060002-548; 2008–2017). Values in red indicate months in which the monthly geometric mean standard of 126 org/100 mL was exceeded or the individual standard of 1,260 org/100 mL was exceeded in greater than 10% of the samples. Standard applies only to months April–October.
Month Sample Count
Geometric Mean
(org/100 mL)
Minimum (org/100mL)
Maximum (org/100mL)
Number of Individual Standard
Exceedances
Percent of Individual Standard
Exceedances
Apr 4 a 49 20 150 0 –
May 5 105 52 500 0 –
Jun 5 406 250 660 0 –
Jul 5 368 31 930 0 –
Aug 5 150 31 1,600 1 20
Sep 5 140 10 3,600 1 20
Oct 4 a 137 31 330 0 – a. Not enough samples to assess compliance with the monthly geometric mean standard.

Upper Iowa River and Mississippi River–Reno Watersheds TMDL Report Minnesota Pollution Control Agency
70
Figure 19. E. coli load duration curve, Little Iowa River (AUID 07060002-548).
Table 29. E. coli TMDL summary, Little Iowa River (AUID 07060002-548).
303(d) listing year or proposed year: 2018
Baseline year: 2012 Flow zones
TMDL parameter
Very high High Mid-range Low Very low
998-54 cfs 53-19 cfs 18-12 cfs 11-4.0 cfs 3.9-1.5 cfs
Sources E. coli load (B org/d)
Wasteload Total WLA 0 0 0 0 0
Load Total LA 221 77 38 18 8.3
MOS 25 8.6 4.2 2.0 0.92
Total load 246 86 42 20 9.2
Maximum monthly geomean (org/100 mL) 406
Overall estimated percent reduction a 69% a. Calculated by comparing the highest observed (monitored) monthly geometric mean concentration from the months that the standard applies to the geometric mean standard, as a concentration, (monitored – standard/monitored). See Section 4.7.1 for more information.

Upper Iowa River and Mississippi River–Reno Watersheds TMDL Report Minnesota Pollution Control Agency
71
5.2.3 Upper Iowa River, Little Iowa River to Beaver Creek (MN; 07060002-509)
5.2.3.1 E. coli
Table 30. Annual summary of E. coli data at Upper Iowa River (AUID 07060002-509; April–October).
Year Sample Count
Geometric Mean
(org/100 mL)
Minimum (org/100mL)
Maximum (org/100mL)
Number of Individual Standard
Exceedances
Percent of Individual Standard
Exceedances
2008 0 – – – – –
2009 0 – – – – –
2010 0 – – – – –
2011 0 – – – – –
2012 0 – – – – –
2013 0 – – – – –
2014 0 – – – – –
2015 9 277 100 1,220 0 –
2016 6 215 134 689 0 –
2017 0 – – – – –
Table 31. Monthly summary of E. coli data at Upper Iowa River (AUID 07060002-509; 2006–2015). Values in red indicate months in which the monthly geometric mean standard of 126 org/100 mL was exceeded or the individual standard of 1,260 org/100 mL was exceeded in greater than 10% of the samples. Standard applies only to months April–October.
Month Sample Count
Geometric Mean
(org/100 mL)
Minimum (org/100mL)
Maximum (org/100mL)
Number of Individual Standard
Exceedances
Percent of Individual Standard
Exceedances
Apr 0 – – – – –
May 0 – – – – –
Jun 5 250 134 1,220 0 –
Jul 5 270 100 689 0 –
Aug 5 233 121 816 0 –
Sep 0 – – – – –
Oct 0 – – – – –

Upper Iowa River and Mississippi River–Reno Watersheds TMDL Report Minnesota Pollution Control Agency
72
Figure 20. E. coli load duration curve, Upper Iowa River (AUID 07060002-509).
Table 32. E. coli TMDL summary, Upper Iowa River (AUID 07060002-509).
303(d) listing year or proposed year: 2018
Baseline year: 2012 Flow zones
TMDL parameter
Very high High Mid-range Low Very low
3,453-195 cfs 194-69 cfs 68-40 cfs 39-16 cfs 15-5.6 cfs
Sources E. coli load (B org/d)
Boundary Condition at Iowa State Line a 254 87 42 20 8.2
Wasteload Le Roy WWTP (MN0021041) 4.351 4. 351 4. 351 4. 351 4. 351
Total WLA 4.4 4.4 4.4 4.4 4.4
Load Total LA 557 192 94 45 18
MOS 91 32 16 7.7 3.4
Total load 906 315 156 77 34
Maximum monthly geomean (org/100 mL) 270
Overall estimated percent reduction b 53% a. The boundary condition allocation is equal to the percent of the total watershed area in Iowa multiplied by the loading capacity minus the MOS minus wastewater WLAs. b. Calculated by comparing the highest observed (monitored) monthly geometric mean concentration from the months that the standard applies to the geometric mean standard, as a concentration, (monitored – standard/monitored). See Section 4.7.1 for more information.

Upper Iowa River and Mississippi River–Reno Watersheds TMDL Report Minnesota Pollution Control Agency
73
5.2.4 Beaver Creek, Mower-Fillmore Rd to Upper Iowa River (07060002-546)
5.2.4.1 E. coli
Table 33. Annual summary of E. coli data at Beaver Creek (AUID 07060002-546; April–October).
Year
Sample Count
Geometric Mean
(org/100 mL)
Minimum (org/100mL)
Maximum (org/100mL)
Number of Individual Standard
Exceedances
Percent of Individual Standard
Exceedances
2008 7 296 20 780 0 –
2009 7 233 30 1,200 0 –
2010 7 331 74 1,800 1 14
2011 6 257 10 1,000 0 –
2012 7 180 74 540 0 –
2013 0 – – – – –
2014 0 – – – – –
2015 0 – – – – –
2016 0 – – – – –
2017 0 – – – – –
Table 34. Monthly summary of E. coli data at Beaver Creek (AUID 07060002-546; 2008–2017). Values in red indicate months in which the monthly geometric mean standard of 126 org/100 mL was exceeded or the individual standard of 1,260 org/100 mL was exceeded in greater than 10% of the samples. Standard applies only to months April–October.
Month Sample Count
Geometric Mean
(org/100 mL)
Minimum (org/100mL)
Maximum (org/100mL)
Number of Individual Standard
Exceedances
Percent of Individual Standard
Exceedances
Apr 4 a 105 30 500 0 –
May 5 51 10 230 0 –
Jun 5 406 200 1,000 0 –
Jul 5 680 400 1,200 0 –
Aug 5 306 84 710 0 –
Sep 5 321 120 1,800 1 20
Oct 5 397 240 760 0 – a. Not enough samples to assess compliance with the monthly geometric mean standard.

Upper Iowa River and Mississippi River–Reno Watersheds TMDL Report Minnesota Pollution Control Agency
74
Figure 21. E. coli load duration curve, Beaver Creek (AUID 07060002-546).
Table 35. E. coli TMDL summary, Beaver Creek (AUID 07060002-546).
303(d) listing year or proposed year: 2018
Baseline year: 2012 Flow zones
TMDL parameter
Very high High Mid-range Low Very low
766-31 cfs 30-11 cfs 10-6.0 cfs 5.9-2.3 cfs 2.2-0.8 cfs
Sources E. coli load (B org/d)
Total WLA 0 0 0 0 0
Total LA 126 43 22 11 4.5
MOS 14 4.8 2.4 1.2 0.50
Total load 140 48 24 12 5.0
Maximum monthly geomean (org/100 mL) 680
Overall estimated percent reduction a 81% a. Calculated by comparing the highest observed (monitored) monthly geometric mean concentration from the months that the standard applies to the geometric mean standard, as a concentration, (monitored – standard/monitored). See Section 4.7.1 for more information.

Upper Iowa River and Mississippi River–Reno Watersheds TMDL Report Minnesota Pollution Control Agency
75
5.2.5 Pine Creek, T101 R10W S24, north line to MN/IA border (07060002-512)
The E. coli TMDL target for Pine Creek (07060002-512), which is a class 7 waterbody, is 126 org/100 mL.
This TMDL target is based on the more restrictive downstream standard in Iowa (see report Section 2.2).
The E. coli data summary tables (37 and 38) use the class 7 Minnesota standard (monthly geometric
mean: 630 org/100 mL and individual sample: 1,260 org/100 mL) to evaluate exceedances of the
standard.
5.2.5.1 E. coli
Table 37. Annual summary of E. coli data at Pine Creek (AUID 07060002-512; May–October).
Year Sample Count
Geometric Mean
(org/100 mL)
Minimum (org/100mL)
Maximum (org/100mL)
Number of Individual Standard
Exceedances
Percent of Individual Standard
Exceedances
2008 0 – – – – –
2009 0 – – – – –
2010 0 – – – – –
2011 0 – – – – –
2012 0 – – – – –
2013 0 – – – – –
2014 0 – – – – –
2015 9 986 712 ≥ 2,420 1 11
2016 6 550 393 1,046 0 –
2017 0 – – – – –
Table 38. Monthly summary of E. coli data at Pine Creek (AUID 07060002-512; 2008–2017). Values in red indicate months in which the monthly geometric mean standard of 630 org/100 mL was exceeded or the individual standard of 1,260 org/100 mL was exceeded in greater than 10% of the samples. Standard applies only to months May–October.
Month Sample Count
Geometric Mean
(org/100 mL)
Minimum (org/100mL)
Maximum (org/100mL)
Number of Individual Standard
Exceedances
Percent of Individual Standard
Exceedances
May 0 – – – – –
Jun 5 651 393 1,220 0 –
Jul 5 736 488 1,046 0 –
Aug 5 993 411 ≥ 2,420 1 20
Sep 0 – – – – –
Oct 0 – – – – –

Upper Iowa River and Mississippi River–Reno Watersheds TMDL Report Minnesota Pollution Control Agency
76
Figure 22. E. coli load duration curve, Pine Creek (AUID 07060002-512). A load duration curve is provided for both the Minnesota class 7 water quality standard (630 org/100 ml) and the more restrictive downstream water quality standard in Iowa (126 org/100 mL). See Section 2.2 for more information. The more restrictive target is used to develop the TMDL table below.
Table 39. E. coli TMDL summary, Pine Creek (AUID 07060002-512).
303(d) listing year or proposed year: 2018
Baseline year: 2012
Water quality target: 126 org/100 mL Flow zones
TMDL parameter
Very high High Mid-range Low Very low
341-21 cfs 20-7.6 cfs 7.5-4.5 cfs 4.4-1.8 cfs 1.7-0.8 cfs
Sources E. coli load (B org/d)
Wasteload Harmony WWTP (MN0022322) 0.93 0.93 0.93 0.93 0.93
Total WLA 0.93 0.93 0.93 0.93 0.93
Load Total LA 83 30 15 7.3 2.8
MOS 9.3 3.4 1.8 0.91 0.42
Total load 93 34 18 9.1 4.2
Maximum monthly geomean (org/100 mL) 993
Overall estimated percent reduction a 87% a. Calculated by comparing the highest observed (monitored) monthly geometric mean concentration from the months that the standard applies to the geometric mean standard, as a concentration, (monitored – standard/monitored). See Section 4.7.1 for more information.

Upper Iowa River and Mississippi River–Reno Watersheds TMDL Report Minnesota Pollution Control Agency
77
5.2.6 Bear Creek, Unnamed cr to MN/IA border (07060002-503)
5.2.6.1 E. coli
The E. coli TMDL target for Bear Creek (07060002-503), which is a class 7 waterbody, is 126 org/100 mL.
This TMDL target is based on the more restrictive downstream standard in Iowa (see report Section 2.2).
The E. coli data summary tables (36 and 37) use the class 7 Minnesota standard (monthly geometric
mean: 630 org/100 mL and individual sample: 1,260 org/100 mL) to evaluate exceedances of the
standard.
Table 36. Annual summary of E. coli data at Bear Creek (AUID 07060002-503; May–October).
Year Sample Count
Geometric Mean
(org/100 mL)
Minimum (org/100mL)
Maximum (org/100mL)
Number of Individual Standard
Exceedances
Percent of Individual Standard
Exceedances
2008 0 – – – – –
2009 0 – – – – –
2010 0 – – – – –
2011 0 – – – – –
2012 0 – – – – –
2013 0 – – – – –
2014 0 – – – – –
2015 9 1,387 411 5,172 5 56
2016 6 494 365 613 0 –
2017 0 – – – – –
Table 37. Monthly summary of E. coli data at Bear Creek (AUID 07060002-503; 2008–2017). Values in red indicate months in which the monthly geometric mean standard of 630 org/100 mL was exceeded or the individual standard of 1,260 org/100 mL was exceeded in greater than 10% of the samples. Standard applies only to months May–October.
Month Sample Count
Geometric Mean
(org/100 mL)
Minimum (org/100mL)
Maximum (org/100mL)
Number of Individual Standard
Exceedances
Percent of Individual Standard
Exceedances
May 0 – – – – –
Jun 5 1,488 461 5,172 3 60
Jul 5 875 517 ≥ 2,420 2 40
Aug 5 593 365 980 0 –
Sep 0 – – – – –
Oct 0 – – – – –

Upper Iowa River and Mississippi River–Reno Watersheds TMDL Report Minnesota Pollution Control Agency
78
Figure 23. E. coli load duration curve, Bear Creek (AUID 07060002-503). A load duration curve is provided for both the Minnesota class 7 water quality standard (630 org/100 ml) and the more restrictive downstream water quality standard in Iowa (126 org/100 mL). See Section 2.2 for more information. The more restrictive target is used to develop the TMDL table below.
Table 38. E. coli TMDL summary, Bear Creek (AUID 07060002-503).
303(d) listing year or proposed year: 2018
Baseline year: 2012
Water quality target: 126 org/100 mL Flow zones
TMDL parameter
Very high High Mid-range Low Very low
450-16 cfs 15-5.7 cfs 5.6-3.5 cfs 3.4-1.7 cfs 1.6-0.6 cfs
Sources E. coli load (B org/d)
Wasteload Spring Grove WWTP (MN0021440)
1.80 1.80 1.80 1.80 1.80
Total WLA 1.8 1.8 1.8 1.8 1.8
Load Total LA 61 22 9.9 4.9 1.7
MOS 7.0 2.6 1.3 0.75 0.39
Total load 70 26 13 7.5 3.9
Maximum monthly geomean (org/100 mL) 1,488
Overall estimated percent reduction a 92% a. Calculated by comparing the highest observed (monitored) monthly geometric mean concentration from the months that the standard applies to the geometric mean standard, as a concentration, (monitored – standard/monitored). See Section 4.7.1 for more information.

Upper Iowa River and Mississippi River–Reno Watersheds TMDL Report Minnesota Pollution Control Agency
79
5.2.7 Bee Creek (Waterloo Creek), T101 R6W S29, north line to MN/IA border
(07060002-515)
5.2.7.1 E. coli
Table 39. Annual summary of E. coli data at Bee Creek (Waterloo Creek) (AUID 07060002-515; April - October).
Year Sample Count
Geometric Mean
(org/100 mL)
Minimum (org/100mL)
Maximum (org/100mL)
Number of Individual Standard
Exceedances
Percent of Individual Standard
Exceedances
2008 0 – – – – –
2009 0 – – – – –
2010 17 998 36 2,139,392 6 35
2011 10 62 10 645 0 –
2012 0 – – – – –
2013 0 – – – – –
2014 0 – – – – –
2015 0 – – – – –
2016 0 – – – – –
2017 0 – – – – –
Table 40. Monthly summary of E. coli data at Bee Creek (Waterloo Creek) (AUID 07060002-515; 2008–2017). Values in red indicate months in which the monthly geometric mean standard of 126 org/100 mL was exceeded or the individual standard of 1,260 org/100 mL was exceeded in greater than 10% of the samples. Standard applies only to months April–October.
Month Sample Count
Geometric Mean
(org/100 mL)
Minimum (org/100mL)
Maximum (org/100mL)
Number of Individual Standard
Exceedances
Percent of Individual Standard
Exceedances
Apr 0 – – – – –
May 3 a 1,023 80 121,716 1 33
Jun 5 104 23 708 0 –
Jul 5 658 42 29,083 2 40
Aug 4 a 53 36 66 0 –
Sep 6 3,728 47 2,139,392 3 50
Oct 4 a 72 10 589 0 – a. Not enough samples to assess compliance with the monthly geometric mean standard.

Upper Iowa River and Mississippi River–Reno Watersheds TMDL Report Minnesota Pollution Control Agency
80
Figure 24. E. coli load duration curve, Bee Creek (Waterloo Creek) (AUID 07060002-515).
Table 41. E. coli TMDL summary, Bee Creek (Waterloo Creek) (AUID 07060002-515).
303(d) listing year or proposed year: 2018
Baseline year: 2012 Flow zones
TMDL parameter
Very high High Mid-range Low Very low
728-20 cfs 19-6.6 cfs 6.5-3.9 cfs 3.8-1.8 cfs 1.7-0.7 cfs
Sources E. coli load (B org/d)
Total WLA 0 0 0 0 0
Total LA 85 29 14 7.3 3.7
MOS 9.4 3.2 1.5 0.81 0.41
Total load 94 32 15 8.1 4.1
Maximum monthly geomean (org/100 mL) 3,728
Overall estimated percent reduction a 97% a. Calculated by comparing the highest observed (monitored) monthly geometric mean concentration from the months that the standard applies to the geometric mean standard, as a concentration, (monitored – standard/monitored). See Section 4.7.1 for more information.

Upper Iowa River and Mississippi River–Reno Watersheds TMDL Report Minnesota Pollution Control Agency
81
6. Future growth considerations Land use in the watersheds is predominantly agricultural and forested, with small cities and towns
dispersed throughout. Fillmore, Mower, and Houston counties are projected to increase in population
by 11%, 22%, and 8%, respectively (Minnesota Forest Resource Council 2014).
6.1 New or expanding permitted MS4 WLA transfer process
Future transfer of watershed runoff loads in this TMDL may be necessary if any of the following
scenarios occur within the project watershed boundaries.
1. One or more non-regulated MS4s become regulated. A transfer must occur from the LA.
2. A new MS4 or other stormwater-related point source is identified and is covered under an NPDES
Permit. In this situation, a transfer must occur from the LA.
Load transfers will be based on methods consistent with those used in setting the allocations in this
TMDL. In cases where WLA is transferred from or to a regulated MS4, the permittees will be notified of
the transfer and have an opportunity to comment.
6.2 New or expanding wastewater
The MPCA, in coordination with the EPA Region 5, developed a streamlined process for setting or
revising WLAs for new or expanding wastewater discharges to waterbodies with an EPA approved TMDL
(described in Section 3.7.1 New and Expanding Discharges in MPCA 2012). This procedure will be used
to update WLAs in approved TMDLs for new or expanding wastewater dischargers whose permitted
effluent limits are at or below the instream target and will ensure that the effluent concentrations will
not exceed applicable water quality standards or surrogate measures. The process for modifying any
and all WLAs will be handled by the MPCA, with input and involvement by the EPA, once a permit
request or reissuance is submitted. The overall process will use the permitting public notice process to
allow for the public and EPA to comment on the permit changes based on the proposed WLA
modification(s). Once any comments or concerns are addressed, and the MPCA determines that the new
or expanded wastewater discharge is consistent with the applicable water quality standards, the permit
will be issued and any updates to the TMDL WLA(s) will be made.
For more information on the overall process, visit the MPCA’s TMDL Policy and Guidance webpage.

Upper Iowa River and Mississippi River–Reno Watersheds TMDL Report Minnesota Pollution Control Agency
82
7. Reasonable assurance A TMDL needs to provide reasonable assurance that water quality targets will be achieved through the
specified combination of point and nonpoint source reductions reflected in the LAs and WLAs,
respectively. According to EPA guidance (EPA 2002):
When a TMDL is developed for waters impaired by both point and nonpoint sources, and the WLA is
based on an assumption that nonpoint-source load reductions will occur ... the TMDL should provide
reasonable assurances that nonpoint source control measures will achieve expected load reductions
in order for the TMDL to be approvable. This information is necessary for the EPA to determine that
the TMDL, including the LA and WLAs, has been established at a level necessary to implement water
quality standards.
In order to address pollutant loading in the UIR and MRR watersheds, already required point source
controls will be effective in improving water quality if accompanied by considerable reductions in
nonpoint source loading. Reasonable assurance for permitted sources such as stormwater, CAFOs, and
wastewater is provided via compliance with their respective NPDES permit programs, as described in
Section 3.5.
Reasonable assurance for non-NPDES-permitted sources discussed in Section 3.5 includes supporting
evidence that there:
are reliable means for addressing pollutant loads (i.e., BMPs and pollution reduction programs)
(see Section 7.1 Non-NPDES-permitted source reduction programs and 7.2 Example non-NPDES-
permitted source reduction projects and partners)
are reliable means for prioritizing and focusing management (see Section 7.1.1 Root River
1W1P)
is a strategy for implementation (see Section 9 Implementation strategy summary and the UIR
and MRR Watershed WRAPS (Tetra Tech 2019)
are available funds to execute projects (see Section 7.3 Funding availability)
is a system of tracking progress and monitoring water quality response (see Sections 8
Monitoring plan and 9.5.1 Adaptive management)
are non-point source reduction projects at multiple scales (see Section 7.2 Example non-NPDES-
permitted source reduction projects and partners)
Reasonable assurance of these six elements is provided by the numerous nonpoint source reduction
programs, local planning efforts, funding sources, and the project implementation efforts of partners
and participating organizations that continue to work towards improving water quality in the UIR and
MRR watersheds as described in the following sections. The goals and objectives for the UIR and MRR
Watershed TMDLs are consistent with state-wide source reduction programs and the Root River 1W1P,
and will be incorporated into the MPCA’s WRAPS report for the watersheds.

Upper Iowa River and Mississippi River–Reno Watersheds TMDL Report Minnesota Pollution Control Agency
83
7.1 Examples of non-NPDES-permitted source reduction programs and plans
Several non-NPDES-permitted reduction programs and plans exist to support implementation of
nonpoint sediment and E. coli reduction BMPs in the UIR and MRR watersheds. These programs identify
BMPs, provide means of focusing BMPs, and support their implementation via state initiatives,
ordinances, and/or provide dedicated funding. The following examples describe large-scale programs
that have proven to be effective and/or will reduce sediment and E. coli loads going forward.
7.1.1 Root River One Watershed, One Plan
Minnesota has a long history of water management by local governments. 1W1P is rooted in this history
and in work initiated by the Minnesota Local Government Water Roundtable (an affiliation of the
Association of Minnesota Counties, Minnesota Association of Watershed Districts, and Minnesota
Association of Soil and Water Conservation Districts [SWCD]). Roundtable members recommended that
the local governments charged with water management responsibility organize and develop focused
implementation plans on a watershed scale.
The recommendation was followed by legislation that authorizes the Board of Water and Soil Resources
(BWSR) to adopt methods to allow comprehensive plans, local water management plans, or watershed
management plans to serve as substitutes for one another or to be replaced with one comprehensive
watershed management plan. This legislation is referred to as “1W1P” (Minn. Stat. §103B.101, subd.
14). Further legislation defining purposes and outlining additional structure for 1W1P, officially known
as the Comprehensive Watershed Management Planning Program (Minn. Stat. § 103B.801), was passed
in May 2015.
BWSR’s vision for 1W1P is to align local water planning on major watershed boundaries with state
strategies towards prioritized, targeted, and measurable implementation plans—the next logical step in
the evolution of water planning in Minnesota and an important component of the reasonable assurance
framework. The Root River 1W1P (Root River Planning Partnership 2016) was finalized in December
2016 and encompasses the UIR and MRR watersheds TMDL project area, in addition to the entire Root
River Watershed to the north. Participants in the Root River 1W1P are able to track BMP
implementation through BWSR’s conservation tracking system eLINK. Practices recorded in eLINK from
2004 through 2017 are provided in Figure 25 for the UIR Watershed and Figure 26 for the MRR
Watershed. This data is accessible through MPCA’s Healthier Watersheds webpage:
https://www.pca.state.mn.us/water/best-management-practices-implemented-watershed.
The 1W1P does not directly address the impaired streams in this TMDL, as they were not listed on the
impaired waters list at the time of 1W1P development. However, the TMDL and WRAPS will be
incorporated into the 1W1P at the five-year review scheduled to occur in 2021.

Upper Iowa River and Mississippi River–Reno Watersheds TMDL Report Minnesota Pollution Control Agency
84
Figure 25. Number of BMPs reported as implemented for the Upper Iowa River Watershed from 2004–2018 (MPCA 2019b).
Figure 26. Number of BMPs reported as implemented in the Mississippi River–Reno Watershed from 2004–2018 (MPCA 2019b).
7.1.2 MPCA feedlot program
The MPCA Feedlot Program implements rules governing the collection, transportation, storage,
processing, and disposal of animal manure and other livestock operation wastes. Minn. R. ch. 7020
regulates feedlots in the state of Minnesota. All feedlots capable of holding 50 or more AUs, or 10 in
shoreland areas, are subject to this rule. A feedlot holding 1,000 or more AUs is permitted in the state of
Minnesota. The focus of the rule is on animal feedlots and manure storage areas that have the greatest
potential for environmental impact.
The Feedlot Program is implemented through a cooperation between MPCA and county governments in
50 counties in the state. The MPCA works with county representatives to provide training, program
oversight, policy and technical support, and formal enforcement support when needed. County feedlot
officers in Fillmore, Houston, and Mower counties administer the feedlot program. The MPCA is
responsible for the CAFOs in these counties.
7.1.3 SSTS implementation and enforcement
SSTS are regulated through Minn. Stat. §§ 115.55 and 115.56. Regulations include:
Minimum technical standards for individual and mid-size SSTS
A framework for local units of government to administer SSTS programs

Upper Iowa River and Mississippi River–Reno Watersheds TMDL Report Minnesota Pollution Control Agency
85
Statewide licensing and certification of SSTS professionals, SSTS product review and registration,
and establishment of the SSTS Advisory Committee
Various ordinances for septic installation, maintenance, and inspection
In 2008, the MPCA amended and adopted rules concerning the governing of SSTS. In 2010, the MPCA
was mandated to appoint a SSTS Implementation and Enforcement Task Force. Members of the task
force include representatives from the Association of Minnesota Counties, Minnesota Association of
Realtors, Minnesota Association of County Planning and Zoning Administrators, and the Minnesota
Onsite Wastewater Association. The group was tasked with:
Developing effective and timely implementation and enforcement methods to reduce the
number of SSTS that are an ITPHS and enforce all violation of the SSTS rules (see MPCA 2011b)
Assisting MPCA in providing counties with enforcement protocols and inspection checklists
Currently, a system is in place in the state such that when a straight pipe system or other ITPHS location
is confirmed, county health departments send notices of non-compliance. Upon doing do, a 10-month
deadline is set for the system to be brought into compliance. All known ITPHS are recorded in a
statewide database by the MPCA. From 2006 to 2017, 742 straight pipes were tracked by the MPCA
statewide. Seven hundred-one of those were abandoned, fixed, or were found not to be a straight pipe
system. There have been 17 Administrative Penalty Orders issued and docketed in court. The remaining
straight pipe systems received a notification of non-compliance and are currently within the 10-month
deadline. The MPCA, through the Clean Water Partnership Loan Program, awarded $2.45 million to local
partners to provide low interest loans for SSTS upgrades in 2016. More information on SSTS financial
assistance can be found on the MPCA’s website.
7.1.4 Buffer program
The Buffer Law signed by Governor Dayton in June 2015 was amended on April 25, 2016, and further
amended by legislation signed by Governor Dayton on May 30, 2017. The Buffer Law requires the
following:
For all public waters, the more restrictive of:
o a 50-foot average width, 30-foot minimum width, continuous buffer of perennially rooted
vegetation, or
o the state shoreland standards and criteria
For public drainage systems established under Minn. Stat. ch. 103E, a 16.5-foot minimum width
continuous buffer
Alternative practices are allowed in place of a perennial buffer in some cases. The amendments enacted
in 2017 clarify the application of the buffer requirement to public waters, provide additional statutory
authority for alternative practices, address concerns over the potential spread of invasive species
through buffer establishment, establish a riparian protection aid program to fund local government
buffer law enforcement and implementation, and allow landowners to be granted a compliance waiver
until July 1, 2018, when they have filed a compliance plan with the SWCD.

Upper Iowa River and Mississippi River–Reno Watersheds TMDL Report Minnesota Pollution Control Agency
86
BWSR provides oversight of the buffer program, which is primarily administered at the local level;
compliance with the Buffer Law in the state is displayed on the state’s Minnesota Buffer Law website.
Table 422 summarizes the level of compliance estimates, as of July 2018, for counties located in the UIR
and MRR watersheds. All counties in the UIR and MRR watersheds were found to have high compliance
rates.
Table 42. Preliminary compliance with Minnesota Buffer Law as of January 2019 (BWSR).
County Preliminary Compliance with MN Buffer Law (%)
Fillmore 95–100
Houston 95–100
Mower 90–94
7.1.5 Agricultural Water Quality Certification Program
The Minnesota Agricultural Water Quality Certification Program is a voluntary opportunity for farmers
and agricultural landowners to take the lead in implementing conservation practices that protect
waters. Those who implement and maintain approved farm management practices are certified and in
turn obtain regulatory certainty for a period of 10 years.
Through this program, certified producers receive:
Regulatory certainty: Certified producers are deemed to be in compliance with any new water
quality rules or laws during the period of certification.
Recognition: Certified producers may use their status to promote their business as protective of
water quality.
Priority for assistance: Producers seeking certification can obtain specially designated technical
and financial assistance to implement practices that promote water quality.
Through this program, the public receives assurance that certified producers are using conservation
practices to protect Minnesota’s lakes, rivers, and streams. As of August 2019, over 500,000 acres on
772 farms have been certified in the state, with many additional acres under review.
7.1.6 Minnesota’s soil erosion law
Minnesota’s soil erosion law is found in Minn. Stat. §§ 103F.401 through 103F.455. The law, which dates
back to 1984, sets forth a strong public policy stating that a person may not cause excessive soil loss.
The law was entirely permissive, however, in that it only encouraged local governments to adopt soil
erosion ordinances and could not be implemented without a local government ordinance. The soil
erosion law was changed in 2015 when a number of revisions were made by the Legislature and
approved by the Governor to broaden its applicability.
Minnesota Laws 2015, regular and first special sessions changed the law by (1) repealing Minn. Stat.
103F.451, “Applicability,” which eliminates the requirement that the law is only applicable with a local
government ordinance; (2) creating specific Administrative Penalty Order authority in Minn. Stat.
103B.101, subd. 12a. for BWSR and counties to enforce the law; and 3) amending Minn. Stat. 103F.421,
“Enforcement,” to remove local enforcement only through civil penalty, and to revise requirements for
state cost-share of conservation practices required to correct excessive soil loss. By definition, excessive

Upper Iowa River and Mississippi River–Reno Watersheds TMDL Report Minnesota Pollution Control Agency
87
soil loss means soil loss that is greater than established soil loss limits or evidenced by sedimentation on
adjoining land or in a body of water. The result of the combined changes now sets forth statewide
regulation of excessive soil loss regardless of whether a local government has a soil loss ordinance
(BWSR 2016).
7.1.7 Minnesota Nutrient Reduction Strategy
The Minnesota Nutrient Reduction Strategy ([NRS] MPCA 2014) calls for activities that support nitrogen
and phosphorus reductions in Minnesota waterbodies and those downstream of the state (e.g., Lake
Winnipeg, Lake Superior, and the Gulf of Mexico). While the strategies outlined in the NRS primarily
target nutrients, many also reduce sediment and/or E. coli loading to surface waters. For example,
agricultural practices such as cover crops target sediment-bound phosphorus by reducing erosion, and
improvements to septic systems reduce nutrient and E. coli loading. The NRS was developed by an
interagency coordination team with help from public input. Fundamental elements of the NRS include:
Defining progress with clear goals
Building on current strategies and success
Prioritizing problems and solutions
Supporting local planning and implementation
Improving tracking and accountability
Included in the strategy discussion are alternatives and tools for consideration by drainage authorities,
information on available tools and approaches for identifying areas of phosphorus and nitrogen loading
and tracking efforts within a watershed, and additional research priorities. The NRS is focused on
incremental progress and provides meaningful and achievable nutrient load reduction milestones that
allow for better understanding of incremental and adaptive progress toward final goals. It has set a
reduction of 45% for both phosphorus and nitrogen in the Mississippi River.
Successful implementation of the NRS will require broad support, coordination, and collaboration
among agencies, academia, local government, landowners and private industry. The MPCA is
implementing a framework to integrate its water quality management programs on a major watershed
scale, a process that includes:
Intensive watershed monitoring
Assessment of watershed health
Development of WRAPS reports
Management of NPDES and other regulatory and assistance programs
This framework and the implementation efforts it calls for will result in nutrient reduction for the basin
as a whole and the major watersheds in the basin.
7.1.8 Conservation Easements and Reinvest in Minnesota Reserve
The Reinvest in Minnesota (RIM) Reserve was created in 1986 through the enactment of the RIM
Resources Act. RIM Reserve is the primary land acquisition program for state-held conservation

Upper Iowa River and Mississippi River–Reno Watersheds TMDL Report Minnesota Pollution Control Agency
88
easements, wetland restoration, and native grassland restoration on private land in Minnesota, and
aims to restore marginal and environmentally sensitive agricultural land to protect soil, water quality,
and fish and wildlife habitat. The program partners with public and private landowners; state, federal,
and local government entities; non-profit organizations; and the citizens of Minnesota. When private
landowners participate, the land is acquired through BWSR on behalf of the state and placed under
permanent easement. The RIM Reserve provides the funds to compensate participating landowners.
Statewide participation in the RIM Reserve program through February 2019 is provided in Figure 27.
In addition, BWSR regularly tracks conservation easements throughout the state. Table 43 provides a
summary of the acres within Fillmore, Houston, and Mower counties that are currently in easements.
Table 43. Conservation lands summary for Fillmore, Houston, and Mower counties (BWSR 2018).
County
Conservation Lands Summary (acres) Cropland Acres
Percent Enrolled CRP CREP RIM
RIM WRP
WRP Total
Fillmore 17,864 308 461 0 0 18,633 350,144 5.3%
Houston 11,027 188 2330 0 208 13,753 147,571 9.3%
Mower 8,666 726 1,325 601 658 11,976 384,388 3.1% CRP: Conservation Reserve Program CREP: Conservation Reserve Enhancement Program RIM: Reinvest in Minnesota WRP: Wetlands Reserve Program
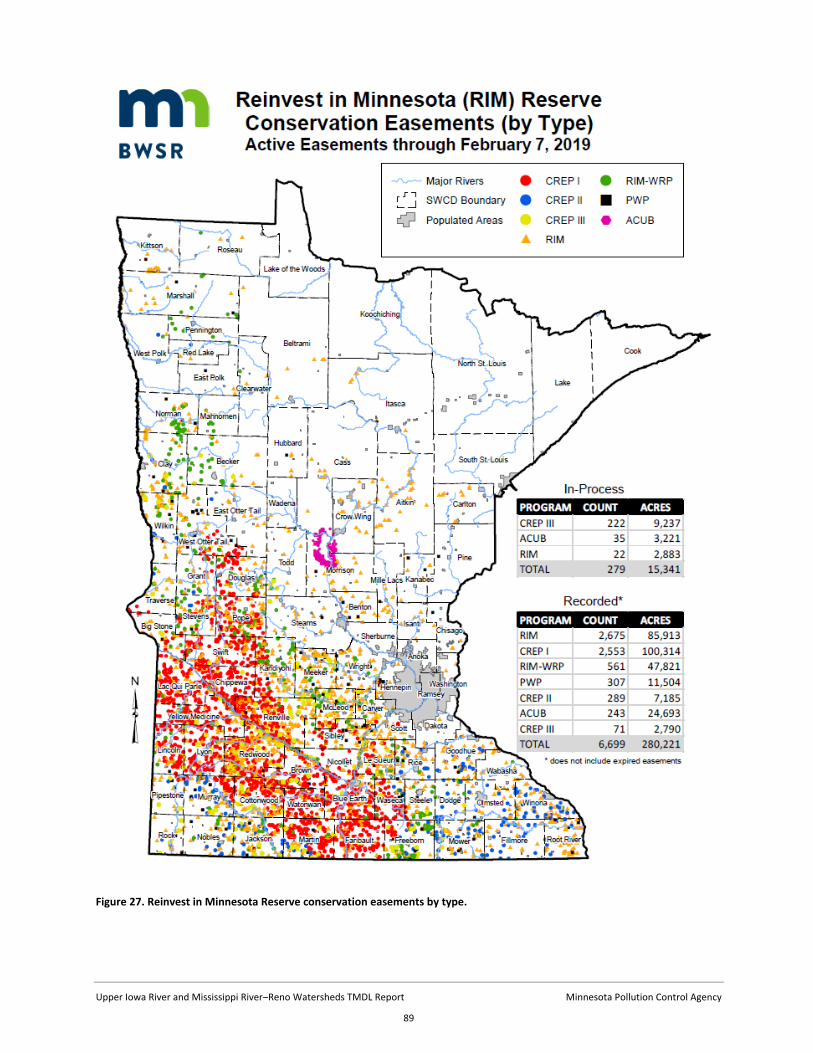
Upper Iowa River and Mississippi River–Reno Watersheds TMDL Report Minnesota Pollution Control Agency
89
Figure 27. Reinvest in Minnesota Reserve conservation easements by type.

Upper Iowa River and Mississippi River–Reno Watersheds TMDL Report Minnesota Pollution Control Agency
90
7.2 Example non-NPDES-permitted source reduction projects and partners
Numerous local partners are active within the project area. In addition to the state-wide programs listed
above, several non-NPDES-permitted source reduction projects that are located in the watershed or
influence the watershed were completed in recent years. The following are examples by participating
organization.
7.2.1 1W1P Committees
To support continued implementation of the Root River 1W1P, the three committees created for the
development of the plan (Advisory, Policy, and Planning Committees) meet on a regular basis to
implement recommendations from the 1W1P. The committees are made up of county and SWCD
representatives, BWSR representatives, community members, and several others. Numerous projects
were identified by these committees for the UIR and MRR watershed portions of the Root River 1W1P.
They include:
Water storage efforts in the Bee Creek Subwatershed
U.S. Fish and Wildlife Service wetland restoration work in the MRR Watershed
Easement acquisitions in Winnebago and Crooked Creek subwatersheds
DNR led geomorphology work in the Crooked and Bee Creek subwatersheds
A planned channel restoration on a Winnebago Creek tributary with support from DNR,
townships, and the county
7.2.2 Fillmore, Mower, and Root River Soil and Water Conservation Districts
Fillmore, Mower, and the Root River (located in Houston County) SWCDs are active partners in the UIR
and MRR watersheds. Their recent work includes but is not limited to:
The Root River Field to Stream Partnership is a water monitoring project in southeast
Minnesota, funded by the Minnesota Clean Water Land and Legacy Amendment. Partners
include Fillmore and Mower SWCDs and the Minnesota Department of Agriculture, the
Minnesota Agricultural Water Resource Center, the Nature Conservancy, Monsanto, and
academic researchers. The partnership was founded in 2009 and conducts intensive surface and
groundwater monitoring at multiple scales in order to provide an assessment of pollution loads
and sources and determine the effectiveness of conservation practices. Since 2016, 90 grassed
waterways, 13 water and sediment control structures, 200 acres of cover crops, 74 acres of
conservation reserve pollinator habitat, and 5,000 feet of new or renovated waterways were
put in place through the project. Edge of field and in-stream monitoring will be used to
determine water quality impacts from these practices.
A buffer compliance plan for Fillmore County checks one third of the county every year for
compliance, completes a random spot check via aerial photos, and conducts on-site reviews on
5% of parcels each year.

Upper Iowa River and Mississippi River–Reno Watersheds TMDL Report Minnesota Pollution Control Agency
91
Fillmore County has a soil loss ordinance in place to sustain the productive capacity of the soil
that requires farming practices to be implemented that reduce soil loss to no more than is
necessary.
Several events are held in the counties:
o Root River SWCD held a soil health field day in April of 2018 in Spring Grove, Minnesota
o Mower SWCD hosted a “Cover Crops 101” workshop in January 2019 and a field day
focused on cover crops in November 2018 for local producers
o Each SWCD hosts annual rain barrel and/or tree sales
o Each SWCD sponsors the Envirothon educational competition event for local junior high
and high school students.
More information on their work can be found on the SWCD websites.
7.2.3 Crooked Creek Watershed District
The Crooked Creek Watershed District plays an active role in the water retention and flood control
efforts in Crooked Creek in addition to other water quality improvement projects. Their work includes
but is not limited to property easements for flood storage and control projects, funding private land
owner projects to stabilize streambanks, and invasive weed control and removal.
7.2.4 Upper Iowa River Alliance and Watershed Management Authority
The UIR Alliance is a nonprofit organization in the Iowa portion of the larger UIR Watershed. Their
mission is to promote, protect, and enhance the UIR, and they work alongside the UIR Watershed
Management Authority, which is composed of representatives from cities, counties, and SWCDs in Iowa.
While outside of Minnesota’s jurisdiction, these Iowa partners have participated in this TMDL project
and efforts have been made to coordinate projects between the two states. These organizations and
their partners have completed a significant amount of work within the UIR Watershed, including the
development of the UIR Watershed Assessment and Management Strategies (The UIR Watershed
Project 2005) and completing a survey to research farmer’s opinions on conservation practices (Sand
2004). More information on these plans, programs, and projects can be found at their homepage.
7.3 Funding availability
Local partner projects listed above demonstrate a reasonable assurance that local partners are capable
of acquiring funding for watershed management projects. Potential state and federal funds available to
the various watershed entities include grants from Clean Water, Land and Legacy funds, EPA’s CWA
Section 319 Grant Program for States and Territories, and various Natural Resources Conservation
Service programs. Because the Root River 1W1P is complete, the watershed planning area that includes
the UIR and MRR watersheds receives “automatic” watershed based implementation funding each
biennium from the Clean Water Fund. The area received over $850,000 in the 2018 - 2019 biennium,
and will receive a similar amount for the 2020 - 2021 biennium. Local sources of funding for counties
and other organizations may include county taxes, levies, and fees. In some cases, these local financial

Upper Iowa River and Mississippi River–Reno Watersheds TMDL Report Minnesota Pollution Control Agency
92
resources provide funding for significant water quality and quantity improvement projects, local grants,
staff, monitoring, and engineering costs.
7.4 Summary
In summary, significant time and resources have been devoted to identifying the best BMPs, providing
means of focusing them in the UIR and MRR watersheds, and supporting their implementation via state
initiatives and dedicated funding. The UIR and MRR WRAPS and TMDLs, and the Root River 1W1P
processes engaged partners to arrive at reasonable examples of BMP combinations that attain pollutant
reduction goals. Minnesota is a leader in watershed planning as well as monitoring and tracking progress
toward water quality goals and pollutant load reductions. Examples cited herein confirm that BMPs and
restoration projects have proven to be effective over time and as stated by the State of Minnesota Court
of Appeals in A15-1622 MCEA vs MPCA and MCES:
We conclude that substantial evidence exists to conclude that voluntary reductions from nonpoint
sources have occurred in the past and can be reasonably expected to occur in the future. The NRS […]
provides substantial evidence of existing state programs designed to achieve reductions in nonpoint
source pollution as evidence that reductions in nonpoint pollution have been achieved and can
reasonably be expected to continue to occur.

Upper Iowa River and Mississippi River–Reno Watersheds TMDL Report Minnesota Pollution Control Agency
93
8. Monitoring plan
This monitoring plan provides an overview of what is expected to occur at many scales in multiple
watersheds in the UIR and MRR watersheds. The designated uses aquatic life, aquatic recreation, and
limited resource value will be the ultimate measures of water quality. Improving these designated uses
depends on many factors, and improvements may not be detected over the next 5 to 10 years.
Consequently, a monitoring plan is needed to track shorter term changes in water quality and land
management. Monitoring is important for several reasons:
Evaluating waterbodies to determine if they are meeting water quality standards and tracking
trends
Assessing potential sources of pollutants
Determining the effectiveness of implementation activities in the watershed
Delisting of waters that are no longer impaired
Monitoring is also a critical component of an adaptive management approach and can be used to help
determine when a change in management is needed. Several types of monitoring will be important to
measuring success. The six basic types of monitoring listed below are based on the EPA’s Protocol for
Developing Sediment TMDLs (EPA 1999).
Baseline monitoring—identifies the environmental condition of the water body to determine if
water quality standards are being met and identify temporal trends in water quality.
Implementation monitoring—tracks implementation of sediment reduction practices such as
through the use of BWSR’s eLink or other tracking mechanisms.
Flow monitoring—is combined with water quality monitoring at the site to allow for the
calculation of pollutant loads.
Effectiveness monitoring—determines whether a practice or combination of practices are
effective in improving water quality.
Trend monitoring—allows the statistical determination of whether water quality conditions are
improving.
Validation monitoring—validates the source analysis and linkage methods in sediment source
tracking to provide additional certainty regarding study findings. For instance, longitudinal
sampling along E. coli impaired streams can identify key sources of E. coli to the reach.
Longitudinal sampling can be paired with a watershed assessment to further identify sources of
E. coli. This assessment could include field evaluation of potential sources, compliance
inspections for septic systems, and feedlot inspections.
There are many monitoring efforts in place to address each of the six basic types of monitoring. Several
key monitoring programs will provide the information to track trends in water quality and evaluate
compliance with TMDLs:
Intensive monitoring and assessment at the HUC8 scale associated with Minnesota’s watershed
approach. This monitoring effort is conducted approximately every 10 years for each HUC-8. An

Upper Iowa River and Mississippi River–Reno Watersheds TMDL Report Minnesota Pollution Control Agency
94
outcome of this monitoring effort is the identification of waters that are impaired (i.e., do not
meet standards and need restoration) and waters in need of protection to prevent impairment.
Over time, condition monitoring can also identify trends in water quality. This helps determine
whether water quality conditions are improving or declining, and it identifies how management
actions are improving the state’s waters overall. The next round of this type of monitoring is
scheduled for 2025 - 2026.
Implementation practice monitoring is conducted by both BWSR (i.e., eLINK) and the United
States Department of Agriculture. Both agencies track the locations of BMP installations. This
data is accessible through MPCA’s Healthier Watersheds webpage:
https://www.pca.state.mn.us/water/best-management-practices-implemented-watershed-
implemented-watershed. In addition, the University of Minnesota Department of Soil, Water,
and Climate and the Iowa State University Department of Agricultural and Biosystems
Engineering are developing a long-term program to systematically collect tillage data and soil
erosion estimates to better analyze trends in tillage adoption and retention.
Discharges from permitted municipal and industrial wastewater sources are reported through
discharge monitoring records (see Section 3.5.1.2); these records are used to evaluate
compliance with NPDES permits. Summaries of discharge monitoring records are available
through the MPCA’s Wastewater Data Browser.

Upper Iowa River and Mississippi River–Reno Watersheds TMDL Report Minnesota Pollution Control Agency
95
9. Implementation strategy summary
Minnesota’s watershed approach to restoring and protecting water quality is based on a major
watershed, or HUC-8, scale. This watershed-level approach begins with intensive watershed monitoring
(which occurs on a 10-year cycle) and culminates in local implementation (Figure 28). A WRAPS report is
produced as part of this approach and addresses restoration of impaired watersheds and protection of
unimpaired waters in each HUC-8 watershed. The WRAPS for each HUC-8 watershed includes elements
such as implementation strategies and timelines for achieving the needed pollutant reductions. These
high-level reports are then used to inform watershed management plans that focus on local priorities
and knowledge to identify prioritized, targeted, and measurable actions and locally based strategies.
These plans further define specific actions, measures, roles, and financing for accomplishing water
resource goals. Implementation activities in the UIR and MRR WRAPS Report will heavily influence and
support implementation of this TMDL. The following sections provide an overview of potential
implementation strategies to address the likely pollutant sources including ITPHSs and septic systems
that are failing to protect groundwater, AFOs, near channel sources, and agricultural runoff. Additional
implementation activities are provided in the UIR and MRR WRAPS report and the Root River 1W1P.
9.1 Non-NPDES-permitted sources
Implementation of the UIR and MRR watersheds TMDL will require numerous BMPs that address likely
non-NPDES-permitted sources of E. coli and sediment. This section provides an overview of example
BMPs that may be used for implementation. The BMPs included in this section are not exhaustive, and
the list may be amended. Likely sources of E. coli to target for implementation are livestock in AFOs and
ITPHS. Sediment sources to target for implementation are near channel sources and runoff from pasture
and grasslands.
10 Year Cycle
Ongoing Local Implementation
Monitoring and Assessment
Water Resource Characterization &
Problem Investigation
Restoration and Protection
Strategy Development
Comprehensive Watershed
Management Plan
The red arrow emphasizes the important connection between state water programs and local water management. Local partners are involved - and often lead - in each stage in this framework.
Connecting state programs with local leadership
Figure 28. Minnesota’s watershed approach.

Upper Iowa River and Mississippi River–Reno Watersheds TMDL Report Minnesota Pollution Control Agency
96
Table48 and Table49 summarize example BMPs that can be implemented to achieve goals of the TMDLs.
The tables are not an exhaustive list of all applicable BMPs and actual implementation may vary.
Descriptions of BMP examples can be found in the Agricultural BMP Handbook for Minnesota (Lenhart
et al. 2017), the Minnesota Stormwater Manual (Minnesota Stormwater Manual contributors 2019a)
and the University of Minnesota Extension’s Onsite Sewage Treatment Program website.
Table 48. Example BMPs for non-NPDES-permitted sources of E. coli in the Upper Iowa River and Mississippi River–Reno Watersheds.
Strategy BMP Examples
Feedlot runoff control and manure management
Feedlot runoff reduction and treatment
Feedlot manure/storage addition
Rainwater diversions at feedlots
Manure incorporation and injection
Pasture management Conventional pasture to prescribed rotational grazing
Livestock access control
Septic system improvements Septic system improvement (maintenance and replacement)
Converting land to perennials Conservation cover perennials
Buffers and filters Riparian buffers and field borders
Urban stormwater runoff control Green infrastructure
Table 49. Example BMPs for non-NPDES-permitted sources of sediment to Winnebago Creek (07060001-693).
Strategy BMP Examples
Pasture management Conventional pasture to prescribed rotational grazing
Livestock access control
Stream banks, bluffs and ravines restored
Stream channel stabilization
Riparian herbaceous cover
Stream habitat improvement and management
9.2 NPDES-permitted sources
Implementation of the UIR and MRR Watersheds TMDLs for NPDES-permitted sources will consist of
permit compliance as explained below.
9.2.1 Construction stormwater (for TSS)
The WLA for stormwater discharges from sites where there is construction activity reflects the number
of construction sites greater than one acre expected to be active in the watershed at any one time, and
the BMPs and other stormwater control measures that should be implemented at the sites to limit the
discharge of pollutants of concern. The BMPs and other stormwater control measures that should be
implemented at construction sites are defined in Minnesota’s NPDES/SDS General Stormwater Permit
for Construction Activity (MNR100001). If a construction site owner/operator obtains coverage under

Upper Iowa River and Mississippi River–Reno Watersheds TMDL Report Minnesota Pollution Control Agency
97
the NPDES/SDS General Stormwater Permit and properly selects, installs, and maintains all BMPs
required under the permit, including those related to impaired waters discharges and any applicable
additional requirements found in Appendix A of the Construction General Permit, the stormwater
discharges would be expected to be consistent with the WLA in this TMDL. Construction activity must
also meet all local government construction stormwater requirements.
9.2.2 Industrial stormwater (for TSS)
The WLA for stormwater discharges from sites where there is industrial activity reflects the number of
sites in the watershed for which NPDES Industrial Stormwater Permit coverage is required, and the
BMPs and other stormwater control measures that should be implemented at the sites to limit the
discharge of pollutants of concern. The BMPs and other stormwater control measures that should be
implemented at the industrial sites are defined in Minnesota’s NPDES/SDS Industrial Stormwater Multi-
Sector General Permit (MNR050000) or NPDES/SDS General Permit for Construction Sand and Gravel,
Rock Quarrying and Hot Mix Asphalt Production facilities (MNG490000). If a facility owner/operator
obtains stormwater coverage under the appropriate NPDES/SDS Permit and properly selects, installs,
and maintains all BMPs required under the permit, the stormwater discharges would be expected to be
consistent with the WLA in this TMDL. Industrial activity must also meet all local government
construction stormwater requirements.
9.2.3 Wastewater (for bacteria)
NPDES permits for municipal and industrial wastewater include effluent limits designed to meet E. coli
water quality standards along with monitoring and reporting requirements to ensure effluent limits are
met. Five municipal wastewater treatment facilities receive E. coli WLAs from this TMDL report. It is
assumed that if a facility meets the fecal coliform limit of 200 organisms per 100 mL (as required by
permit) it is also meeting the E. coli WLA.
9.3 Regional Fecal Coliform Implementation Plan
The Revised Regional Fecal Coliform Implementation Plan (Cannon River Watershed Partnership and
MPCA 2006) was developed following the regional fecal coliform TMDL for the Lower Mississippi River
and Cedar River basins of southeast Minnesota was completed in the early 2000s. The plan provides a
guide for projects and activities to implement in order to address E. coli impaired streams in the
planning area. These projects and activities were included based on regional stakeholder input and can
also be implemented in the UIR and MRR watersheds. The full plan is available on the PCA website,
TMDL project page.
9.4 Coordination with Iowa
Several of the impaired streams addressed in this TMDL are either upstream or downstream of impaired
streams in Iowa. Where a Minnesota impaired reach flows into an impaired reach in Iowa with a more
restrictive standard, the more restrictive downstream standard was used to develop the TMDL to
protect downstream designated uses (see Section 2.2 for more information). In addition, Staff Creek (01-
UIA-288) in Iowa has an E. coli impairment and flows into the UIR E. coli impairment (from Little Iowa
River to Beaver Creek, 07060002-509) in Minnesota. Because Staff Creek has a less stringent water

Upper Iowa River and Mississippi River–Reno Watersheds TMDL Report Minnesota Pollution Control Agency
98
quality standard (monthly geometric mean of 630 org/100 mL) than the Minnesota standard for the UIR
(monthly geometric mean standard of 126 org/100 mL), continued coordination between the MPCA and
the Iowa DNR will support successful implementation of this TMDL.
9.5 Cost
9.5.1 Implementation cost
TMDLs are required to include an overall approximation of implementation costs (Minn. Stat. §
114D.25). The costs to implement the activities outlined in the strategy are approximately $7 to $10
million dollars over the next 20 years. This range reflects the level of uncertainty in the source
assessment and addresses the likely sources identified in Section 3.5. The cost includes increasing local
capacity to oversee implementation in the watershed and the voluntary actions needed to achieve
necessary TMDL reductions. Costs for implementing the TMDL and achieving the required pollutant load
reductions were estimated by developing an implementation scenario with cost effective and practical
options. Actual implementation will likely differ.
The cost of required actions, including compliance with the Minnesota Buffer Law, replacement of ITPHS
systems, and SSTS maintenance, were not considered in the overall cost calculation because their costs
are already accounted for in existing programs. The expected pollutant reductions of these required
actions; however, were accounted for in the implementation scenario to achieve required TMDL
reductions.
9.5.2 TSS reduction cost methodology
Costs for TSS impaired stream Winnebago Creek (07060001-693) were calculated using aerial images
and field level information and recommendations provided in the SID (MPCA 2018a and MPCA 2018b)
and monitoring and assessment (MPCA 2018c) reports. BMPs used in the TSS scenario for Winnebago
Creek include stream restoration of four miles of upstream segment and exclusion fencing for cattle
along the pastureland adjacent to the stream. A cost range of $130,000 to $350,000 per stream mile
was estimated from a review of stream restoration projects in Minnesota.
9.5.3 E. coli reduction cost methodology
Costs to achieve the required E. coli reductions were calculated using the most likely sources (Table 13)
and the overall estimated percent reductions needed to meet each TMDL (Section 5). This cost
assessment accounts for the uncertainty of a qualitative E. coli source assessment. BMPs used in the
E. coli scenario calculation include:
Feedlot BMPs and livestock access control
Green infrastructure (biofiltration)
SSTS maintenance and ITPHS replacement
Feedlot BMPs include buffer strips around feedlots and compost facilities and were applied to all E. coli
impaired subwatersheds. A feedlot BMP cost of $390 per AU was calculated for the impaired
watersheds based on AUs provided by the MPCA and the 2019 EQIP payments for Minnesota. This cost
Upper Iowa River and Mississippi River–Reno Watersheds TMDL Report Minnesota Pollution Control Agency
99
is similar to the costs provided in the Root River TMDL (MPCA 2016). It was assumed that approximately
60% of existing feedlots were already implementing feedlot BMPs and did not need improvements. In
addition to feedlot BMPs, biofiltration practices were applied to the UIR (Little Iowa River to Beaver
Creek, 07060002-509) to address stormwater runoff from Le Roy. Bioretention design criteria were
obtained from the Minnesota Stormwater Manual (Minnesota Stormwater Manual contributors 2019b).
9.5.4 Cost references
BMP costs and removal efficiencies used in cost calculation were predominantly obtained from
Minnesota EQIP dollars for 2019, the Minnesota NRS (MPCA 2014), Minnesota Agricultural BMP
Handbook (Lenhart et al. 2017), and the MPCA BMP Estimator for stormwater BMPs (Minnesota
Stormwater Manual contributors 2019c).
9.6 Adaptive management
The implementation strategy and the
accompanying WRAPS report focus on
adaptive management. An adaptive
management approach is an overall system
of continuous improvements and feedback
loops that allows for changes in the
management strategy if environmental
indicators suggest that the strategy is
inadequate or ineffective. Continued
monitoring and course corrections
responding to monitoring results are the
most appropriate strategy for attaining the
water quality goals established in this
TMDL.
Natural resource management involves a
series of actions and associated feedback loops
that help to inform next steps to achieve overarching goals. In the simplest of terms, adaptive
management is a cyclical process or loop in which actions are implemented, monitored, evaluated,
compared to anticipated progress, and redesigned if needed (Figure 26). In actuality, adaptive
management in natural resource management consists of many of these feedback loops, all of which
can occur at different speeds and durations. These loops or cycles can be large and programmatic in
nature such as Minnesota’s watershed approach, while others can be small and on a scale such as an
individual field (Nelson et al. 2017). As a structured iterative implementation process, adaptive
management offers the flexibility for responsible parties to monitor implementation actions, determine
the success of such actions, and ultimately base management decisions on the measured results of
completed implementation actions and the current state of the system. This process enhances the
understanding and estimation of predicted outcomes and ensures refinement of necessary activities to
better guarantee desirable results. In this way, understanding of the resource can be enhanced over
time and management can be improved (Williams et al. 2009).
Figure 29. General adaptive management process.

Upper Iowa River and Mississippi River–Reno Watersheds TMDL Report Minnesota Pollution Control Agency
100
10. Public participation
10.1 Public notice
Multiple meetings were held with stakeholders throughout the TMDL development process. Throughout
March and April of 2019, the MPCA attended four meeting with local stakeholders in the watersheds.
These meetings provided a summary of the impairment status of streams in the watersheds and the
identified stressors and pollutants impacting those streams. Local stakeholders included SWCD staff and
board advisors from Mower and Houston counties, and Fillmore county staff and township officials.
MPCA also attended a Root River 1W1P Advisory Committee meeting on March 19, 2019, to discuss
TMDL project updates. In attendance were advisory committee members including staff from BWSR,
Fillmore SWCD, Root SWCD, Winona SWCD, The Nature Conservancy, and DNR. On May 15, 2019, two
meetings were held in Mabel, Minnesota with county and SWCD staff to provide an overview of the
TMDL and discuss implementation activities for the TMDL and WRAPS.
An opportunity for public comment on the draft TMDL report was provided via a public notice in the
State Register from December 30, 2019 through January 29, 2020. There was one comment letter
received and responded to as a result of the public comment period.

Upper Iowa River and Mississippi River–Reno Watersheds TMDL Report Minnesota Pollution Control Agency
101
11. Literature cited
Adhikari, H., D.L. Barnes, S. Schiewer, and D.M. White. 2007. Total Coliform Survival Characteristics in
Frozen Soils. Journal of Environmental Engineering 133(12):1098–1105.
Alderisio, K.A. and N. DeLuca. 1999. Seasonal Enumeration of Fecal Coliform Bacteria from the Feces of
Ring-Billed Gulls (Larus Delawarensis) and Canada Geese (Branta Canadensis). Applied and
Environmental Microbiology 65 (12): 5628–30.
American Society of Agricultural Engineers. 1998. ASAE Standards, 45th Edition. Standards, Engineering
Practices, Data.
Belmont, P., T. Dogwiler, and K. Kumarasamy. nd. An Integrated Sediment Budget for the Root River
Watershed, Southeastern Minnesota.
Burns & McDonnell Engineering Company, Inc. 2017. Minnehaha Creek Bacterial Source Identification
Study Draft Report. Prepared for City of Minneapolis, Department of Public Works. Project No.
92897. May 26, 2017.
BWSR (Board of Water and Soil Resources). 2016. Minnesota Excessive Soil Loss Program
Implementation DRAFT Interim Guidance: Excessive Soil Loss Complaints for Agricultural
Activities. April 4, 2016
BWSR (Board of Water and Soil Resources). 2018. Conservation Lands Summary—Statewide. Prepared
08/17/18. Retrieved from https://bwsr.state.mn.us/sites/default/files/2019-
01/CLS_Statewide_Summary_August_2018.pdf, June 11, 2019.
Cannon River Watershed Partnership and MPCA (Minnesota Pollution Control Agency). 2006. Revised
Regional Total Maximum Daily Load Evaluation of Fecal Coliform Bacteria Impairments in the
Lower Mississippi River Basin in Minnesota. Document number wq-iw9-02b.
City of Eden Prairie. 2008. Canada Goose Management Plan. June 11, 2008.
Chandrasekaran, R., M.J. Hamilton, P. Wang, C. Staley, S. Matteson, A. Birr, and M.J. Sadowsky. 2015.
Geographic Isolation of Escherichia coli Genotypes in Sediments and Water of the Seven Mile
Creek—A Constructed Riverine Watershed. Science of the Total Environment 538:78–85.
Doyle, M.P., and M.C. Erickson. 2006. Closing the Door on the Fecal Coliform Assay. Microbe 1 (4): 162–
63.
EPA (U.S. Environmental Protection Agency). 1991. Guidance for Water Quality-based Decisions: The
TMDL Process. EPA-440/4-91-001. U.S. EPA, Office of Water (WH-553), Washington, DC. 62 pp.
EPA (U.S. Environmental Protection Agency). 1999. Protocol for Developing Sediment TMDLs. First
Edition. EPA 841-B-99-004. EPA, Office of Water. Washington, DC. October 1999.
EPA (U.S. Environmental Protection Agency). 2002. National Recommended Water Quality Criteria:
2002. EPA-822-R-02-047. Office of Water. Office of Science and Technology. Washington, D.C.
EPA (U.S. Environmental Protection Agency). 2013. A Long-Term Vision for Assessment, Restoration, and
Protection under the Clean Water Act Section 303(d) Program. December 2013.

Upper Iowa River and Mississippi River–Reno Watersheds TMDL Report Minnesota Pollution Control Agency
102
Farmland Wildlife Populations Research Group. 2016. Monitoring Populations Trends of White-tailed
Deer in Minnesota – 2016.
Frame, D., T. Radatz, and A. Radatz. 2012. Manure Applications on Frozen and/or Snow Covered Ground.
Brief 7 of 9 on Riechers Beef. UW–Extension/UW–Discovery Farms.
Iowa Department of Natural Resources. 2017. Methodology for Iowa’s 2016 Water Quality Assessment,
Listing, and Reporting Pursuant to Sections 305(b) and 303(d) of the Federal Clean Water Act.
Prepared by Iowa Department of Natural Resources: Environmental Services Division, Water
Quality Bureau, Water Quality Monitoring & Assessment Section. March 28, 2017.
Ishii, S., W.B. Ksoll, R.E. Hicks, and M. Sadowsky. 2006. Presence and Growth of Naturalized Escherichia
Coli in Temperate Soils from Lake Superior Watersheds. Applied and Environmental
Microbiology 72: 612–21.
Ishii, S., T. Yan, H. Vu, D.L. Hansen, R.E. Hicks, and M.J. Sadowsky. 2010 “Factors Controlling Long-Term
Survival and Growth of Naturalized Escherichia coli Populations in Temperate Field Soils.”
Microbes and Environments, Vol. 25, No. 1, pp. 8−14, 2010.
Jiang, S.C., W. Chu, B.H. Olson, J. He, S. Choi, J. Zhang, J.Y. Le, and P.B. Gedalanga. 2007. Microbial
Source Tracking in a Small Southern California Urban Watershed Indicates Wild Animals and
Growth as the Source of Fecal Bacteria. Applied Microbiology and Biotechnology 76 (4): 927–34
Lenhart, C., B. Gordon, J. Peterson, W. Eshenaur, L. Gifford, B. Wilson, J. Stamper, L. Krider, and N. Utt.
2017. Agricultural BMP Handbook for Minnesota, 2nd Edition. St. Paul, MN: Minnesota
Department of Agriculture.
Marino, R., and J. Gannon. 1991. Survival of Fecal Coliforms and Fecal Streptococci in Storm Drain
Sediments. Water Research 25(9):1089–1098.
Metcalf and Eddy, Inc. 1991. Wastewater Engineering: Treatment, Disposal, Reuse. 3rd ed. McGraw-Hill,
Inc., New York.
Minnesota Forest Resource Council. 2014. Demographic Data Report: 2nd Generation Southeast
Landscape Plan. Landscape Program Document #LT0214c. Minnesota Forest Resource Council,
St. Paul, Minnesota.
Minnesota Stormwater Manual contributors. 2018. "Construction activity by county," Minnesota
Stormwater Manual,
https://stormwater.pca.state.mn.us/index.php?title=Construction_activity_by_county&oldid=2
2583
Minnesota Stormwater Manual contributors. 2019a. “Green Infrastructure for stormwater
management,” Minnesota Stormwater Manual,
https://stormwater.pca.state.mn.us/index.php?title=Green_Infrastructure_for_stormwater_ma
nagement
Minnesota Stormwater Manual contributors. 2019b. “Design criteria for bioretention,” Minnesota
Stormwater Manual,
https://stormwater.pca.state.mn.us/index.php?title=Design_criteria_for_bioretention

Upper Iowa River and Mississippi River–Reno Watersheds TMDL Report Minnesota Pollution Control Agency
103
Minnesota Stormwater Manual contributors. 2019c. “Guidance and examples for using the MPCA
Estimator,” Minnesota Stormwater Manual,
https://stormwater.pca.state.mn.us/index.php/Guidance_and_examples_for_using_the_MPCA
_Estimator
MPCA (Minnesota Pollution Control Agency). 2007a. Minnesota Statewide Mercury Total Maximum
Daily Load. Document #wq-iw4-01b.
MPCA (Minnesota Pollution Control Agency). 2007b. Statement of Need and Reasonableness, Book III of
III: In the Matter of Proposed Revisions of Minnesota Rules Chapter 7050, Relating to the
Classification and Standards for Waters of the State; The Proposed Addition of a New Rule,
Minnesota Rules Chapter 7053, Relating to Point and Nonpoint Source Treatment Requirements;
and The Repeal of Minn. R. Chapters 7056 and 7065. July 2007.
MPCA (Minnesota Pollution Control Agency). 2011a. Aquatic Life Water Quality Standards Draft
Technical Support Document for Total Suspended Solids (Turbidity). Document number wq-s6-
11.
MPCA (Minnesota Pollution Control Agency). 2011b. Recommendations and Planning for Statewide
Inventories, Inspections of Subsurface Sewage Treatment Systems. Document number lrwq-
wwists-1sy11.
MPCA (Minnesota Pollution Control Agency). 2012. Zumbro Watershed Total Maximum Daily Loads for
Turbidity Impairments. Document number wq-iw9-13e.
MPCA (Minnesota Pollution Control Agency). 2014. The Minnesota Nutrient Reduction Strategy. St. Paul,
MN. Document number wq-s1-80.
MPCA (Minnesota Pollution Control Agency). 2015. Prioritization Plan for Minnesota 303(d) Listings to
Total Maximum Daily Loads. September 2015.
MPCA (Minnesota Pollution Control Agency). 2016. “Root River Watershed Total Maximum Daily Load
Report for Bacteria, Nitrate and Suspended Solids.” Document number wq-iw9-17e. November,
2016.
MPCA (Minnesota Pollution Control Agency). 2018a. Mississippi River Reno Stressor Identification
Report. December 2018. Document number: wq-ws5-0706001a.
MPCA (Minnesota Pollution Control Agency). 2018b. Upper Iowa River Watershed Stressor Identification
Report. September 2018. Document number: wq-ws5-07060002a.
MPCA (Minnesota Pollution Control Agency). 2018c. Upper Iowa River, Mississippi River–Reno,
Mississippi River–La Crescent Watersheds Monitoring and Assessment Report. Minnesota
Pollution Control Agency. Saint Paul, MN. July 2018. Document number wq-ws3-07060002b.
MPCA (Minnesota Pollution Control Agency). 2019a. Water Quality and Bacteria Frequently Asked
Questions. Minnesota Pollution Control Agency. January 2019. Document number wq-s1-93.
MPCA (Minnesota Pollution Control Agency). 2019b. Best Management practices implemented by
watershed. MPCA website accessed June 5, 2019, https://www.pca.state.mn.us/water/best-
management-practices-implemented-watershed.
Upper Iowa River and Mississippi River–Reno Watersheds TMDL Report Minnesota Pollution Control Agency
104
Nelson, P., M.A. Davenport, and T. Kuphal. 2017. Inspiring Action for Nonpoint Source Pollution Control:
A Manual for Water Resource Protection. Freshwater Society, Saint Paul, MN.
https://freshwater.org/wp-content/uploads/2017/03/InspiringAction.pdf
RESPEC. 2017. Documentation of the Best Management Practice Database Available in the Scenario
Application Manager. Draft Topical Report RSI-2742. Prepared for the Minnesota Pollution
Control Agency, Saint Paul, MN. October 2017.
Root River Planning Partnership. 2016. Root River One Watershed, One Plan. Prepared by Houston
Engineering, Inc. December 2016. Available at:
http://www.fillmoreswcd.org/rootRiverWatershed.html
Sadowsky, M., S. Matteson, M. Hamilton, and R. Chandrasekaran. n.d. Growth, Survival, and Genetic
Structure of E. coli Found in Ditch Sediments and Water at the Seven Mile Creek Watershed,
2008-2010. Project report to Minnesota Department of Agriculture.
Sand, R. 2004. Farmer Feedback: Farmer’s Views on Agricultural Conservation Issues in the Upper Iowa
River Watershed. Royce University. Providence, RA.
Schottler, S. P., J. Ulrich, P. Belmont, R. Moore, J. W. Lauer, D. R. Engstrom, and J. E. Almendinger. 2014.
Twentieth Century Agricultural Drainage Creates More Erosive Rivers. Hydrol. Process. 28: 1951–
1961.
Tetra Tech. 2018. Root, Upper Iowa, and Mississippi River–Reno Watershed Model Development.
Prepared for the Minnesota Pollution Control Agency, St. Paul, MN. April 2, 2018.
Tetra Tech. 2019. Draft Upper Iowa River and Mississippi River–Reno Watershed Restoration and
Protection Strategy Report. Prepared for the Minnesota Pollution Control Agency.
The Upper Iowa River Watershed Project. 2005. Upper Iowa River Watershed Assessment Management
Strategies. Prepared by the Upper Iowa River Watershed Project through Northeast Iowa RC&D,
Inc.
Williams, B, R. Szaro, and C. Shapiro. 2009. Adaptive Management: The U.S. Department of the Interior
Technical Guide. Adaptive Management Working Group, U.S. Department of the Interior,
Washington, DC.
Wu, J., P. Rees, and S. Dorner. 2011. Variability of E. coli Density and Sources in an Urban Watershed.
Journal of Water and Health 9 (1): 94.
Zeckoski, R., B. Benham, S. Shah, M. Wolfe, K. Branna, M. Al-Smadi, T. Dillaha, S. Mostaghimi, and D.
Heatwole. 2005. BLSC: A Tool for Bacteria Source Characterization for Watershed Management. Applied
Engineering in Agriculture 21(5): 879-889.