Final Township Testing Nitrate Report: Carver County 2018-2019
56
In accordance with the Americans with Disabilities Act, this information is available in alternative forms of communication upon request by calling 651-201-6000. TTY users can call the Minnesota Relay Service at 711. The MDA is an equal opportunity employer and provider. Final Township Testing Nitrate Report: Carver County 2018-2019 July 2020 Minnesota Department of Agriculture Pesticide and Fertilizer Management Division
Transcript of Final Township Testing Nitrate Report: Carver County 2018-2019

In accordance with the Americans with Disabilities Act, this information is available in alternative forms of communication upon request by calling 651-201-6000. TTY users can call the Minnesota Relay Service at 711.
The MDA is an equal opportunity employer and provider.
Final Township Testing Nitrate Report:
Carver County 2018-2019
July 2020
Minnesota Department of Agriculture
Pesticide and Fertilizer Management Division
2
ACKNOWLEDGEMENTS
MDA PRIMARY AUTHOR
Lauren Bammert and Nikol Ross
MDA CONTRIBUTORS AND REVIEWERS
Kimberly Kaiser, Larry Gunderson, and Jen Schaust
FUNDING
Project dollars provided by the Clean Water Fund (from the Clean Water, Land and Legacy Amendment).

3
TABLE OF CONTENTS
Acknowledgements ....................................................................................................................................... 2
Table of Contents .......................................................................................................................................... 3
List of Figures ................................................................................................................................................ 4
List of Tables ................................................................................................................................................. 5
Executive Summary ....................................................................................................................................... 7
Introduction .................................................................................................................................................. 8
Background ................................................................................................................................................. 10
Township Testing Methods ......................................................................................................................... 13
Initial Results ............................................................................................................................................... 18
Final Results ................................................................................................................................................ 25
Summary ..................................................................................................................................................... 31
References .................................................................................................................................................. 32
Appendix A .................................................................................................................................................. 35
Appendix B .................................................................................................................................................. 37
Appendix C .................................................................................................................................................. 42
Appendix D .................................................................................................................................................. 46
Appendix E .................................................................................................................................................. 47
Appendix F .................................................................................................................................................. 48
Appendix G .................................................................................................................................................. 50
Appendix H .................................................................................................................................................. 51
Appendix I ................................................................................................................................................... 54
Appendix J ................................................................................................................................................... 55
Appendix K .................................................................................................................................................. 56
4
LIST OF FIGURES
Figure 1. Townships Tested in Carver County ............................................................................................... 9
Figure 3. Surficial Geology in Carver County (Bauer, 2009) ........................................................................ 11
Figure 4. Minnesota Vulnerable Townships Tested for Nitrate in Private Wells. ....................................... 13
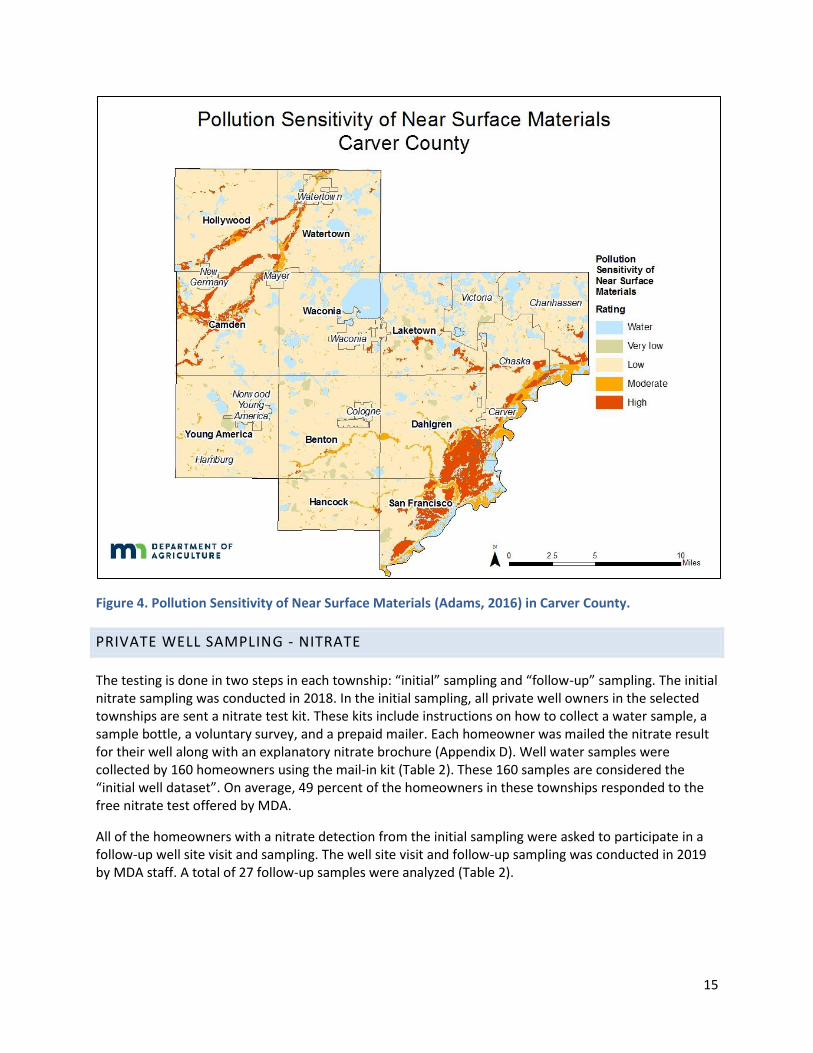
Figure 5. Pollution Sensitivity of Near Surface Materials (Adams, 2016) in Carver County. ...................... 15
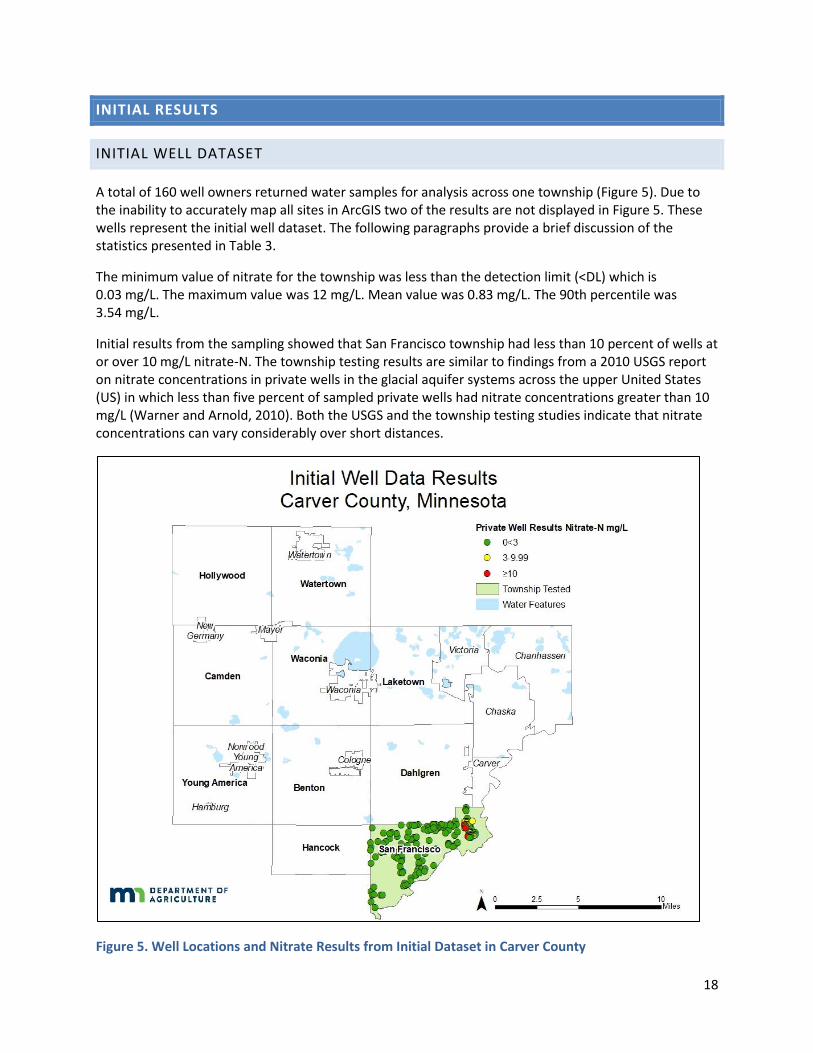
Figure 6. Well Locations and Nitrate Results from Initial Dataset in Carver County .................................. 18
Figure 7. Results of Initial Testing by Township in Carver County .............................................................. 19
Figure 8. Well Locations and Nitrate Results from Final Well Dataset in Carver County ........................... 26
Figure 9. Results of Final Testing by Township in Carver County ............................................................... 27
Figure 10. Feedlot Locations in Carver County (MPCA, 2019a) .................................................................. 39
Figure 11. Fertilizer Spills and Investigations in Carver County (MDA, 2018a) ........................................... 41
Figure 12. Land Cover in Carver County (USDA NASS Cropland Data Layer, 2013) .................................... 42
Figure 13. Active Groundwater Use Permits in Carver County (MDNR, 2018) ........................................... 45
5
LIST OF TABLES
Table 1. Pollution Sensitivity of Near-Surface Materials, (Adams, 2016) ................................................... 14
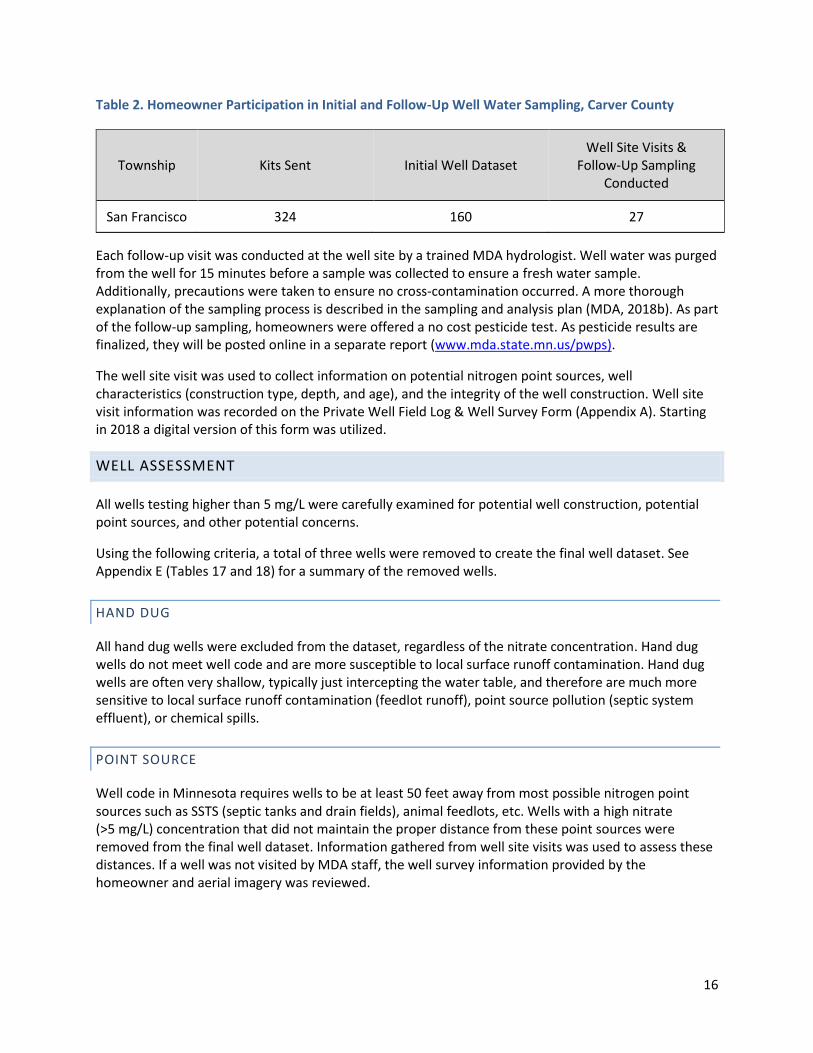
Table 2. Homeowner Participation in Initial and Follow-Up Well Water Sampling, Carver County ........... 16
Table 3. Carver County Township Testing Summary Statistics for Initial Well Dataset .............................. 20
Table 4. Estimated Population with Water Wells Over 10mg/L Nitrate-N, Carver County ........................ 21
Table 5. Nitrate Concentrations within Sampled Groundwater Aquifers ................................................... 23
Table 6. Initial and Final Well Dataset Results, Carver County ................................................................... 25
Table 7. Carver County Township Testing Summary Statistics for Final Well Dataset ............................... 28
Table 8. Township Nitrate Results Related to Vulnerable Geology and Row Crop Production, Carver
County ......................................................................................................................................................... 29
Table 9. Animal Unit Calculations (MPCA, 2017b) ...................................................................................... 38
Table 10. Feedlots and Permitted Animal Unit Capacity, Carver County ................................................... 39
Table 11. Fertilizer Storage Facility Licenses and Abandoned Sites, Carver County................................... 40
Table 12. Spills and Investigations by Chemical Type, Carver County ........................................................ 40
Table 13. Fertilizer Related Spills and Investigations by Township, Carver County ................................... 41
Table 14. Land Cover Data (2013) by Township, Carver County (USDA NASS Cropland Data Layer, 2013)
.................................................................................................................................................................... 43
Table 15. Active Groundwater Use Permits by Township, Carver County ................................................. 44
Table 16. Active Groundwater Use Permits by Aquifer, Carver County ..................................................... 44
Table 17. Reasons Wells Were Removed from the Final Well Dataset by Township, Carver County ........ 47
Table 18. Completed Site Visits for Wells Removed from the Final Well Dataset by Township, Carver
County ......................................................................................................................................................... 47
Table 19. Aquifer Type Distribution of Active Drinking Water Wells in Minnesota Well Index by
Township, Carver County ............................................................................................................................ 49
Table 20. Property Setting for Well Location .............................................................................................. 51
Table 21. Well Construction Type ............................................................................................................... 51
Table 22. Age of Well .................................................................................................................................. 51
6
Table 23. Depth of Well .............................................................................................................................. 51
Table 24. Unique Well ID Known ................................................................................................................ 51
Table 25. Livestock Located on Property .................................................................................................... 51
Table 26. Fertilizer Stored on Property ....................................................................................................... 52
Table 27. Farming on Property ................................................................................................................... 52
Table 28. Distance to an Active or Inactive Feedlot ................................................................................... 52
Table 29. Distance to Septic System ........................................................................................................... 52
Table 30. Distance to an Agricultural Field ................................................................................................. 52
Table 31. Drinking Water Well .................................................................................................................... 52
Table 32. Treatment System Present (Treatment System Used for Drinking Water) ................................ 52
Table 33. Last Tested for Nitrate................................................................................................................. 53
Table 34. Last Nitrate Test Result ............................................................................................................... 53
Table 35. Well Construction Type for Final Well Dataset ........................................................................... 54
Table 36. Well Depth for Final Well Dataset ............................................................................................... 54
Table 37. Year of Well Construction for Final Well Dataset........................................................................ 54
Table 38. Temperature (°C) of Well Water for Final Well Dataset ............................................................. 56
Table 39. pH of Well Water for Final Well Dataset ..................................................................................... 56
Table 40. Specific Conductivity (µS/cm) of Well Water for Final Well Dataset .......................................... 56
Table 41. Dissolved Oxygen (mg/L) of Well Water for Final Well Dataset ................................................. 56

7
EXECUTIVE SUMMARY
Nitrate is a naturally occurring, water soluble molecule that is made up of nitrogen and oxygen. Although nitrate occurs naturally, it can also originate from sources such as fertilizer, animal manure, and human waste. Nitrate is a concern because it can be a risk to human health at elevated levels. The Minnesota Department of Health (MDH) has established a Health Risk Limit (HRL) of 10 mg/L nitrate-N as nitrogen (nitrate-N) for private drinking water wells in Minnesota.
In response to health concerns over nitrate-N in drinking water the Minnesota Department of Agriculture (MDA) developed the Nitrogen Fertilizer Management Plan (NFMP). The NFMP outlines a statewide plan to assess vulnerable areas for nitrate in groundwater known as the Township Testing Program.
The primary goal of the Township Testing Program is to identify areas that have high nitrate concentrations in their groundwater. The program also informs residents about the health risk of their well water. Areas were selected based on historically elevated nitrate conditions, aquifer vulnerability and row crop production. More than 90,000 private well owners have been offered nitrate testing in 344 townships since 2013. This will be one of the largest nitrate testing efforts ever conducted and completed.
In 2018, private wells in the Carver County study area (one township) was sampled for nitrate-N. Samples were collected from private wells using homeowner collection and mail-in methods. These initial samples were collected from 160 wells representing an average response rate of 49 percent of homeowners. Well log information was obtained when available and correlated with nitrate-N results. Initial well dataset results showed that across the study area, 2.5 percent of private wells sampled were at or above the health standard of 10 mg/L for nitrate-N. Based on the initial results, it is estimated that 22 residents could be consuming well water with nitrate-N at or over the HRL.
The MDA completed follow-up sampling and well site visits at 27 wells in 2019. A follow-up sampling was offered to all homeowners with wells that had a detectable nitrate-N result.
A well site visit was conducted to identify wells that were unsuitable for final analysis. The final well dataset is intended to only include private drinking water wells potentially impacted by applied commercial agricultural fertilizer. Therefore, wells that had nitrate-nitrogen results over 5 mg/L were removed from the initial dataset to form the final dataset if a potential non-fertilizer source or well problem was identified, there was insufficient information on the construction or condition of the well, or for other reasons which are outlined in Appendix E. Point sources of nitrogen can include: feedlots, subsurface sewage treatment systems, fertilizer spills, and bulk storage of fertilizer. A total of three (1.9 percent) wells were determined to be unsuitable and were removed from the dataset. The final well dataset had a total of 157 wells.
The final well dataset was analyzed to determine the percentage of wells at or over the HRL of 10 mg/L nitrate-N. When analyzed at the township scale the percent of wells at or over the HRL is 1.9 percent. The township in Carver County did not have more than 10 percent of wells at or over the HRL revealing no significant problems within the county.
8
INTRODUCTION
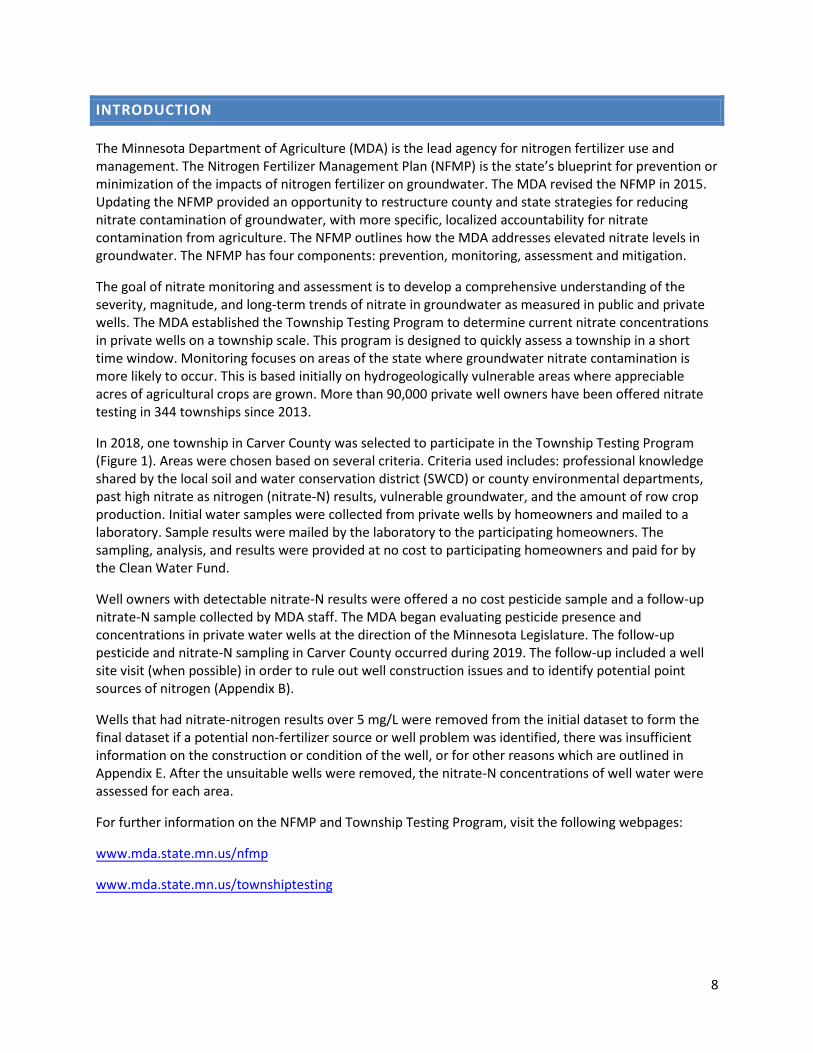
The Minnesota Department of Agriculture (MDA) is the lead agency for nitrogen fertilizer use and management. The Nitrogen Fertilizer Management Plan (NFMP) is the state’s blueprint for prevention or minimization of the impacts of nitrogen fertilizer on groundwater. The MDA revised the NFMP in 2015. Updating the NFMP provided an opportunity to restructure county and state strategies for reducing nitrate contamination of groundwater, with more specific, localized accountability for nitrate contamination from agriculture. The NFMP outlines how the MDA addresses elevated nitrate levels in groundwater. The NFMP has four components: prevention, monitoring, assessment and mitigation.
The goal of nitrate monitoring and assessment is to develop a comprehensive understanding of the severity, magnitude, and long-term trends of nitrate in groundwater as measured in public and private wells. The MDA established the Township Testing Program to determine current nitrate concentrations in private wells on a township scale. This program is designed to quickly assess a township in a short time window. Monitoring focuses on areas of the state where groundwater nitrate contamination is more likely to occur. This is based initially on hydrogeologically vulnerable areas where appreciable acres of agricultural crops are grown. More than 90,000 private well owners have been offered nitrate testing in 344 townships since 2013.
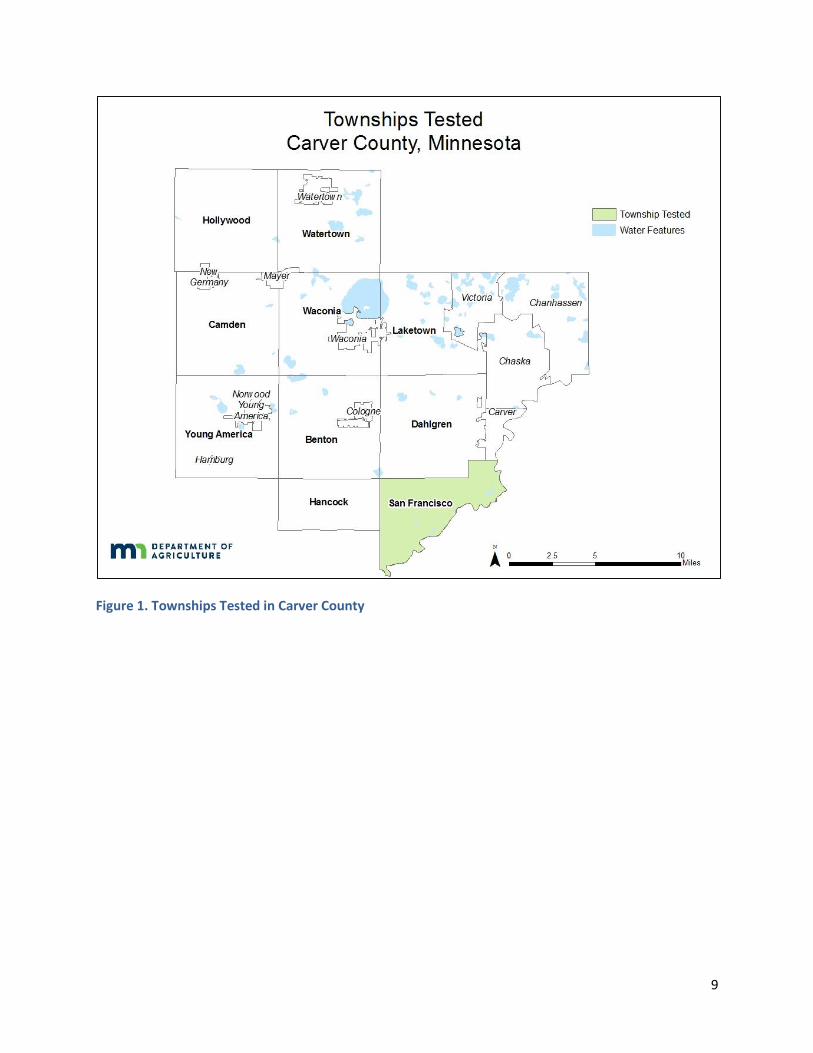
In 2018, one township in Carver County was selected to participate in the Township Testing Program (Figure 1). Areas were chosen based on several criteria. Criteria used includes: professional knowledge shared by the local soil and water conservation district (SWCD) or county environmental departments, past high nitrate as nitrogen (nitrate-N) results, vulnerable groundwater, and the amount of row crop production. Initial water samples were collected from private wells by homeowners and mailed to a laboratory. Sample results were mailed by the laboratory to the participating homeowners. The sampling, analysis, and results were provided at no cost to participating homeowners and paid for by the Clean Water Fund.
Well owners with detectable nitrate-N results were offered a no cost pesticide sample and a follow-up nitrate-N sample collected by MDA staff. The MDA began evaluating pesticide presence and concentrations in private water wells at the direction of the Minnesota Legislature. The follow-up pesticide and nitrate-N sampling in Carver County occurred during 2019. The follow-up included a well site visit (when possible) in order to rule out well construction issues and to identify potential point sources of nitrogen (Appendix B).
Wells that had nitrate-nitrogen results over 5 mg/L were removed from the initial dataset to form the final dataset if a potential non-fertilizer source or well problem was identified, there was insufficient information on the construction or condition of the well, or for other reasons which are outlined in Appendix E. After the unsuitable wells were removed, the nitrate-N concentrations of well water were assessed for each area.
For further information on the NFMP and Township Testing Program, visit the following webpages:
www.mda.state.mn.us/nfmp
www.mda.state.mn.us/townshiptesting
9
Figure 1. Townships Tested in Carver County
10
BACKGROUND
In many rural areas of Minnesota, nitrate is one of the most common contaminants in groundwater, and in some localized areas, a significant number of wells have high nitrate levels.
Nitrate is a naturally occurring, water soluble molecule that is made up of nitrogen and oxygen. Although nitrate occurs naturally, it can also originate from other sources such as fertilizer, animal manure, and human waste. Nitrate is a concern because it can have a negative effect on human health at elevated levels. The United States Environmental Protection Agency has established a drinking water Maximum Contaminant Level (MCL) of 10 mg/L for nitrate-N (US EPA, 2009) in municipal water systems. The Minnesota Department of Health (MDH) has also established a Health Risk Limit (HRL) of 10 mg/L nitrate-N for private drinking water wells in Minnesota.
Nitrogen present in groundwater can be found in the forms of nitrite and nitrate. In the environment, nitrite generally converts to nitrate, which means nitrite occurs very rarely in groundwater. The nitrite concentration is commonly less than the reporting level of 0.01 mg/L, resulting in a negligible contribution to the nitrate plus nitrite concentration (Nolan and Stoner, 2000). Therefore, analytical methods generally combine nitrate plus nitrite together. Measurements of nitrate plus nitrite as nitrogen and measurements of nitrate as nitrogen will hereafter be referred to as “nitrate”.
NITRATE FATE AND TRANSPORT
Nitrate is considered a conservative anion and is highly mobile in many shallow coarse-textured groundwater systems. Once in groundwater, nitrate is often considered very stable and can move large distances from its source. However, in some settings nitrate in groundwater may be converted to nitrogen gas in the absence of oxygen and the presence of organic carbon, through a natural process called denitrification. Denitrification occurs when oxygen levels are depleted and nitrate becomes the primary oxygen source for microorganisms (Dubrovsky et al., 2010). In systems with thin sands and gravel, such as the Quaternary aquifer within Carver County, contaminants such as nitrate can travel quickly leaving little chance for denitrification or other attenuating processes. As a result, the areas in Carver County with thin sand and gravel (Lusardi and Tipping, 2009), and intensive row crop agriculture, are particularly vulnerable to elevated nitrate concentrations.
GEOLOGY AND HYDROGEOLOGY
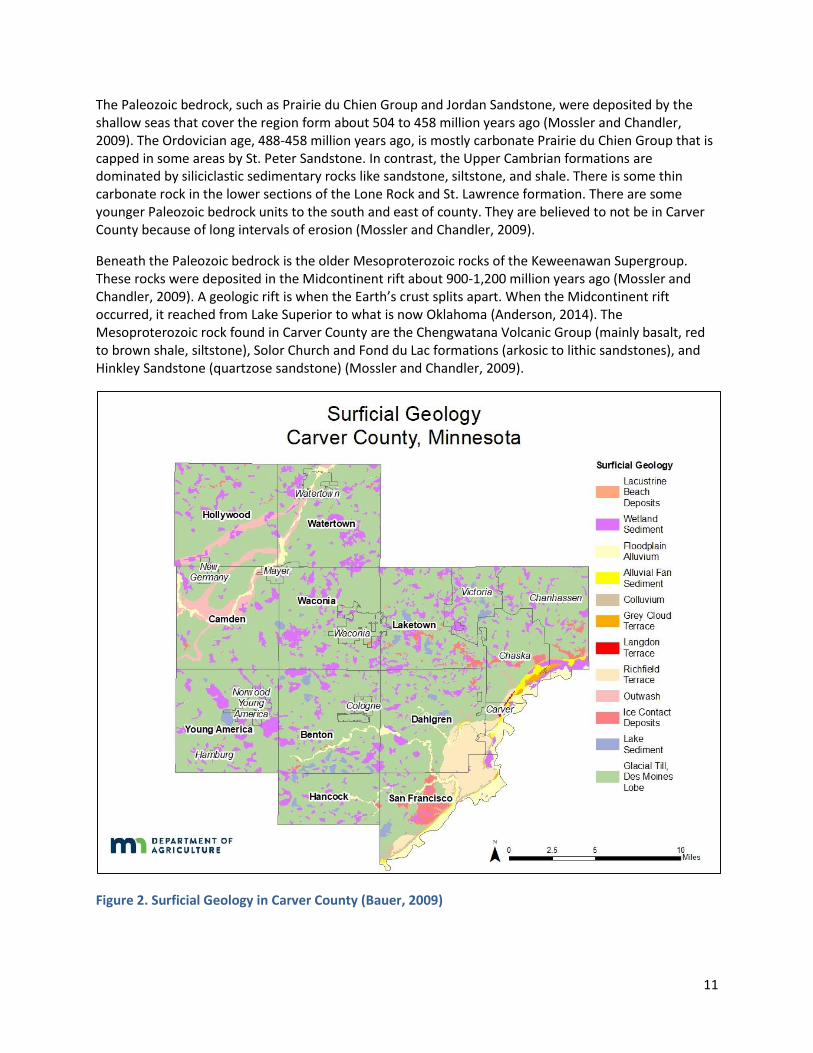
Most of the Quaternary sediment in the Carver County was deposited by the Des Moines Lobe glacier. The Des Moines lobe travelled from the northwest, carrying sediment from North Dakota and Manitoba. The sediment is comprised of distinctive, gray, siliceous shale fragments, with varied amounts of sand, silt, clay, and rocks (Lusardi, 2009). The Quaternary unconsolidated sediments vary in thickness due to the glacier lobe advancing and receding multiple times in the area. The sediment deposited by the melt water from the glaciers form the Quaternary aquifers in Carver county. These aquifers consist of sand and gravel beds. This process of sediment being deposited during advancing and receding glaciers along with deposits of sand and gravel from meltwater, creates a disturbed “layer cake” effect in the sediment stratigraphy (Lusardi and Tipping, 2009). Basically, the glaciers erode older sediment, then the void is either filled in or completely replaced by new sediment. This creates aquifers that are discontinuous throughout the county.
11
The Paleozoic bedrock, such as Prairie du Chien Group and Jordan Sandstone, were deposited by the shallow seas that cover the region form about 504 to 458 million years ago (Mossler and Chandler, 2009). The Ordovician age, 488-458 million years ago, is mostly carbonate Prairie du Chien Group that is capped in some areas by St. Peter Sandstone. In contrast, the Upper Cambrian formations are dominated by siliciclastic sedimentary rocks like sandstone, siltstone, and shale. There is some thin carbonate rock in the lower sections of the Lone Rock and St. Lawrence formation. There are some younger Paleozoic bedrock units to the south and east of county. They are believed to not be in Carver County because of long intervals of erosion (Mossler and Chandler, 2009).
Beneath the Paleozoic bedrock is the older Mesoproterozoic rocks of the Keweenawan Supergroup. These rocks were deposited in the Midcontinent rift about 900-1,200 million years ago (Mossler and Chandler, 2009). A geologic rift is when the Earth’s crust splits apart. When the Midcontinent rift occurred, it reached from Lake Superior to what is now Oklahoma (Anderson, 2014). The Mesoproterozoic rock found in Carver County are the Chengwatana Volcanic Group (mainly basalt, red to brown shale, siltstone), Solor Church and Fond du Lac formations (arkosic to lithic sandstones), and Hinkley Sandstone (quartzose sandstone) (Mossler and Chandler, 2009).
Figure 2. Surficial Geology in Carver County (Bauer, 2009)
12
NITROGEN POINT SOURCES
The focus of the Township Testing Program is to assess nitrogen contamination in groundwater as a result of commercial nitrogen fertilizer applied to cropland. Any wells potentially impacted by point sources were removed from the final well dataset. Potential point sources such as subsurface sewage treatment systems (more commonly known as septic systems), feedlots, fertilizer spills, and bulk storage of fertilizer are considered in this section. Below is a brief overview of these sources in Carver County. Further details are in Appendix B.
SUBSURFACE SEWAGE TREATMENT SYSTEM
Subsurface sewage treatment systems (SSTS) can be a potential source for contaminants in groundwater such as nitrate and fecal material (MDH, 2014). A total of 5,184 SSTS were reported in Carver County for 2018. Over a recent 17-year period (2002-2018), 1,820 construction permits for new, replacement, or repairs for SSTS were issued. Of all the reported septic systems in Carver County, 35 percent are newer than 2002 or have been repaired since 2002 (MPCA, 2019b). When new SSTS’s are installed they are required to be in compliance with the rules at the time of installation. Newer systems meet modern SSTS regulations and must comply with the current well code; which requires a 50 foot horizontal separation from the well (MDH, 2014).
FEEDLOT
Manure produced on a feedlot can be a potential source of nitrogen pollution if improperly stored or spread. In the Carver County study area there are a total of 11 active feedlots. Of these, six (55 percent) are permitted to house more than 100 animal units (AU) and three (27 percent) are permitted to house more than 300 AU (Appendix B; Figure 9). The majority of feedlots in the study area are for beef cattle.
FERTILIZER STORAGE LOCATION
Bulk fertilizer storage locations are potential point sources of nitrogen because they store large concentrations of nitrogen based chemicals. Licenses are required for individuals and companies that store large quantities of fertilizer. The Carver County study area has no fertilizer storage facilities (Appendix B; Table 11).
FERTILIZER SPILLS AND INVESTIGATIONS
There were no historic fertilizer spills and investigations occurred in the Carver County study area (Appendix B; Table 13).

13
TOWNSHIP TESTING METHODS
VULNERABLE TOWNSHIPS
Well water sampling is focused on areas that are considered vulnerable to groundwater contamination by commercial nitrogen fertilizer. Typically, townships and cities are selected for sampling if more than 30 percent of the underlying geology is considered vulnerable and more than 20 percent of the land cover is row crop agriculture. These are not rigid criteria but are instead used as a starting point for creating an initial plan. Additional factors such as previous nitrate results and local knowledge of groundwater conditions were used to prioritize townships for testing. A statewide map of townships that were chosen for testing is shown in Figure 3.
Figure 3. Minnesota Vulnerable Townships Tested for Nitrate in Private Wells.
14
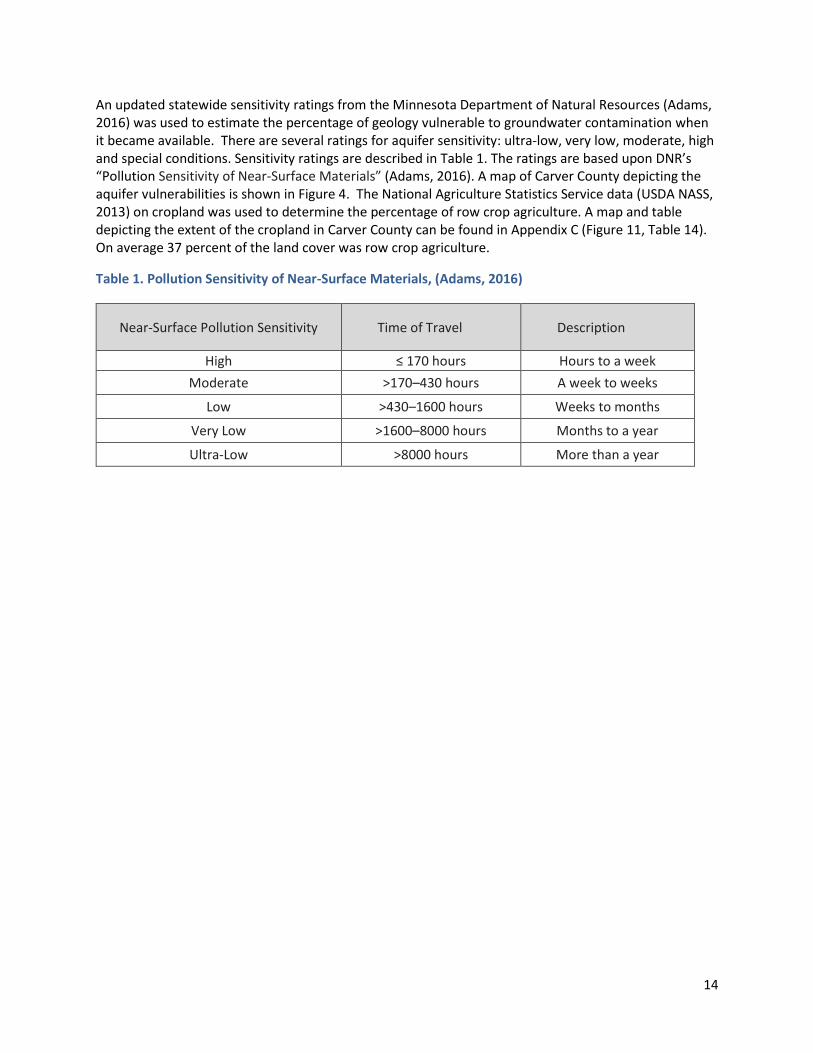
An updated statewide sensitivity ratings from the Minnesota Department of Natural Resources (Adams, 2016) was used to estimate the percentage of geology vulnerable to groundwater contamination when it became available. There are several ratings for aquifer sensitivity: ultra-low, very low, moderate, high and special conditions. Sensitivity ratings are described in Table 1. The ratings are based upon DNR’s “Pollution Sensitivity of Near-Surface Materials” (Adams, 2016). A map of Carver County depicting the aquifer vulnerabilities is shown in Figure 4. The National Agriculture Statistics Service data (USDA NASS, 2013) on cropland was used to determine the percentage of row crop agriculture. A map and table depicting the extent of the cropland in Carver County can be found in Appendix C (Figure 11, Table 14). On average 37 percent of the land cover was row crop agriculture.
Table 1. Pollution Sensitivity of Near-Surface Materials, (Adams, 2016)
Near-Surface Pollution Sensitivity Time of Travel Description
High ≤ 170 hours Hours to a week
Moderate >170–430 hours A week to weeks
Low >430–1600 hours Weeks to months
Very Low >1600–8000 hours Months to a year
Ultra-Low >8000 hours More than a year
15
Figure 4. Pollution Sensitivity of Near Surface Materials (Adams, 2016) in Carver County.
PRIVATE WELL SAMPLING - NITRATE
The testing is done in two steps in each township: “initial” sampling and “follow-up” sampling. The initial nitrate sampling was conducted in 2018. In the initial sampling, all private well owners in the selected townships are sent a nitrate test kit. These kits include instructions on how to collect a water sample, a sample bottle, a voluntary survey, and a prepaid mailer. Each homeowner was mailed the nitrate result for their well along with an explanatory nitrate brochure (Appendix D). Well water samples were collected by 160 homeowners using the mail-in kit (Table 2). These 160 samples are considered the “initial well dataset”. On average, 49 percent of the homeowners in these townships responded to the free nitrate test offered by MDA.
All of the homeowners with a nitrate detection from the initial sampling were asked to participate in a follow-up well site visit and sampling. The well site visit and follow-up sampling was conducted in 2019 by MDA staff. A total of 27 follow-up samples were analyzed (Table 2).
16
Table 2. Homeowner Participation in Initial and Follow-Up Well Water Sampling, Carver County
Township Kits Sent Initial Well Dataset Well Site Visits &
Follow-Up Sampling Conducted
San Francisco 324 160 27
Each follow-up visit was conducted at the well site by a trained MDA hydrologist. Well water was purged from the well for 15 minutes before a sample was collected to ensure a fresh water sample. Additionally, precautions were taken to ensure no cross-contamination occurred. A more thorough explanation of the sampling process is described in the sampling and analysis plan (MDA, 2018b). As part of the follow-up sampling, homeowners were offered a no cost pesticide test. As pesticide results are finalized, they will be posted online in a separate report (www.mda.state.mn.us/pwps).
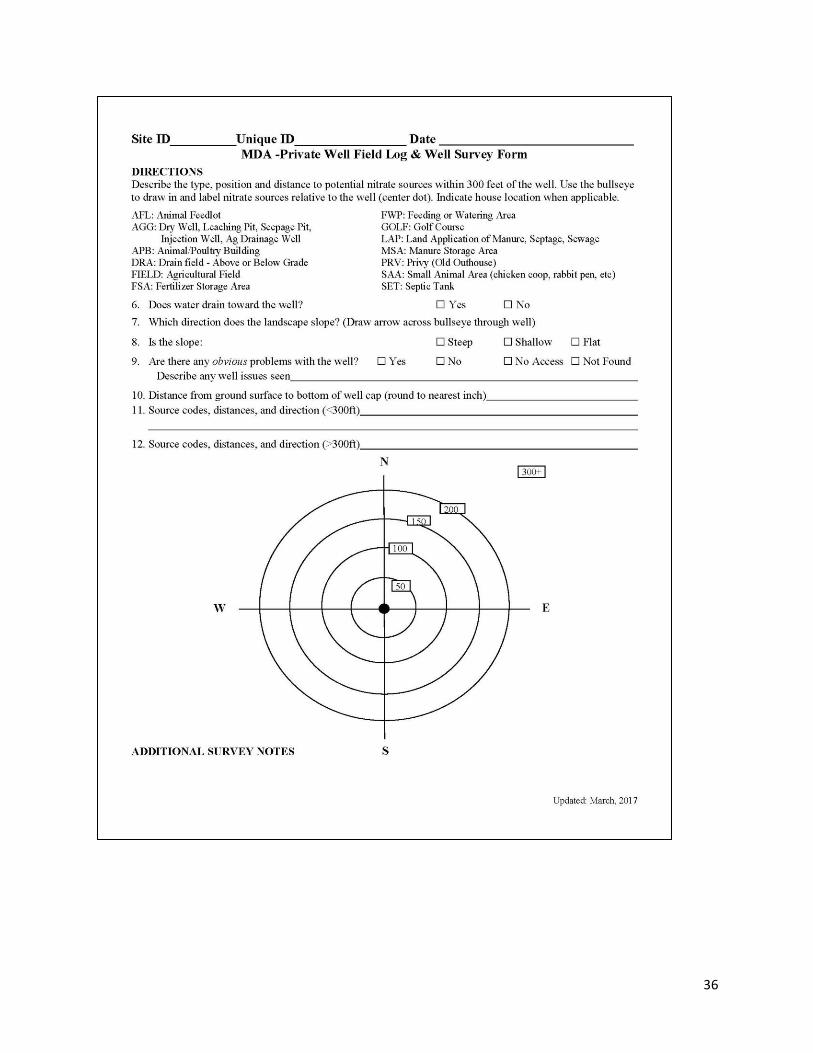
The well site visit was used to collect information on potential nitrogen point sources, well characteristics (construction type, depth, and age), and the integrity of the well construction. Well site visit information was recorded on the Private Well Field Log & Well Survey Form (Appendix A). Starting in 2018 a digital version of this form was utilized.
WELL ASSESSMENT
All wells testing higher than 5 mg/L were carefully examined for potential well construction, potential point sources, and other potential concerns.
Using the following criteria, a total of three wells were removed to create the final well dataset. See Appendix E (Tables 17 and 18) for a summary of the removed wells.
HAND DUG
All hand dug wells were excluded from the dataset, regardless of the nitrate concentration. Hand dug wells do not meet well code and are more susceptible to local surface runoff contamination. Hand dug wells are often very shallow, typically just intercepting the water table, and therefore are much more sensitive to local surface runoff contamination (feedlot runoff), point source pollution (septic system effluent), or chemical spills.
POINT SOURCE
Well code in Minnesota requires wells to be at least 50 feet away from most possible nitrogen point sources such as SSTS (septic tanks and drain fields), animal feedlots, etc. Wells with a high nitrate (>5 mg/L) concentration that did not maintain the proper distance from these point sources were removed from the final well dataset. Information gathered from well site visits was used to assess these distances. If a well was not visited by MDA staff, the well survey information provided by the homeowner and aerial imagery was reviewed.
17
WELL CONSTRUCTION PROBLEM
The well site visits allowed the MDA staff to note the well construction of each well. Some wells had noticeable well construction problems. For instance, wells with a cap missing or a crack in the cap makes the groundwater in that well susceptible to pollution. Other examples include wells buried underground or wells with cracked casing. Wells with significant problems such as these were excluded from the final well dataset.
UNSURE OF WATER SOURCE OR KNOWN NON-DRINKING WATER SOURCE
If the water source of the sample was uncertain, or from an unwanted source, then data pertaining to the sample was removed. For example, these samples include water that may have been collected from an indoor tap with a reverse osmosis system. Water samples that were likely collected from a municipal well were also removed from the dataset. This study examines raw well water not treated water or municipal water.
SITE VISIT COMPLETED - WELL NOT FOUND & CONSTRUCTED BEFORE 1975 OR AGE
UNKNOWN & NO WELL ID
Old wells with no validation on the condition of well construction were removed from the dataset. These wells were installed before the well code was developed in Minnesota (mid-1975), did not have a well log, and MDA staff could not locate the well during a site visit. Additionally, if the age of the well could not be determined it was assumed to be an older well.
NO SITE VISIT & CONSTRUCTED BEFORE 1975 OR AGE UNKNOWN & NO WELL ID
If no site visit was conducted, and the well is an older well (pre-1975), the well would not be used in the final analysis. If the age of the well could not be determined these were again assumed to be older wells.
NO SITE VISIT & INSUFFICIENT DATA & NO WELL ID
Wells that were clearly lacking necessary background information were also removed from the final well dataset. These wells did not have an associated well log, were not visited by MDA staff, and the homeowner did not fill out the initial well survey or the address could not be found.
18
INITIAL RESULTS
INITIAL WELL DATASET
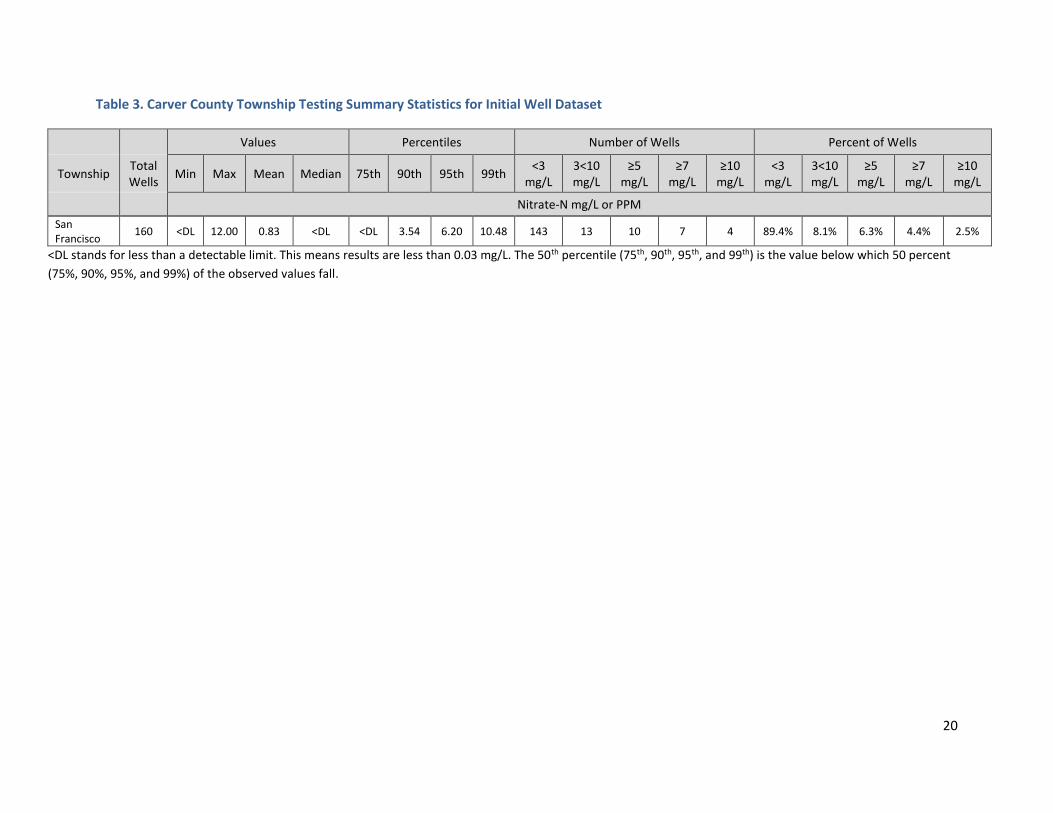
A total of 160 well owners returned water samples for analysis across one township (Figure 5). Due to the inability to accurately map all sites in ArcGIS two of the results are not displayed in Figure 5. These wells represent the initial well dataset. The following paragraphs provide a brief discussion of the statistics presented in Table 3.
The minimum value of nitrate for the township was less than the detection limit (<DL) which is 0.03 mg/L. The maximum value was 12 mg/L. Mean value was 0.83 mg/L. The 90th percentile was 3.54 mg/L.
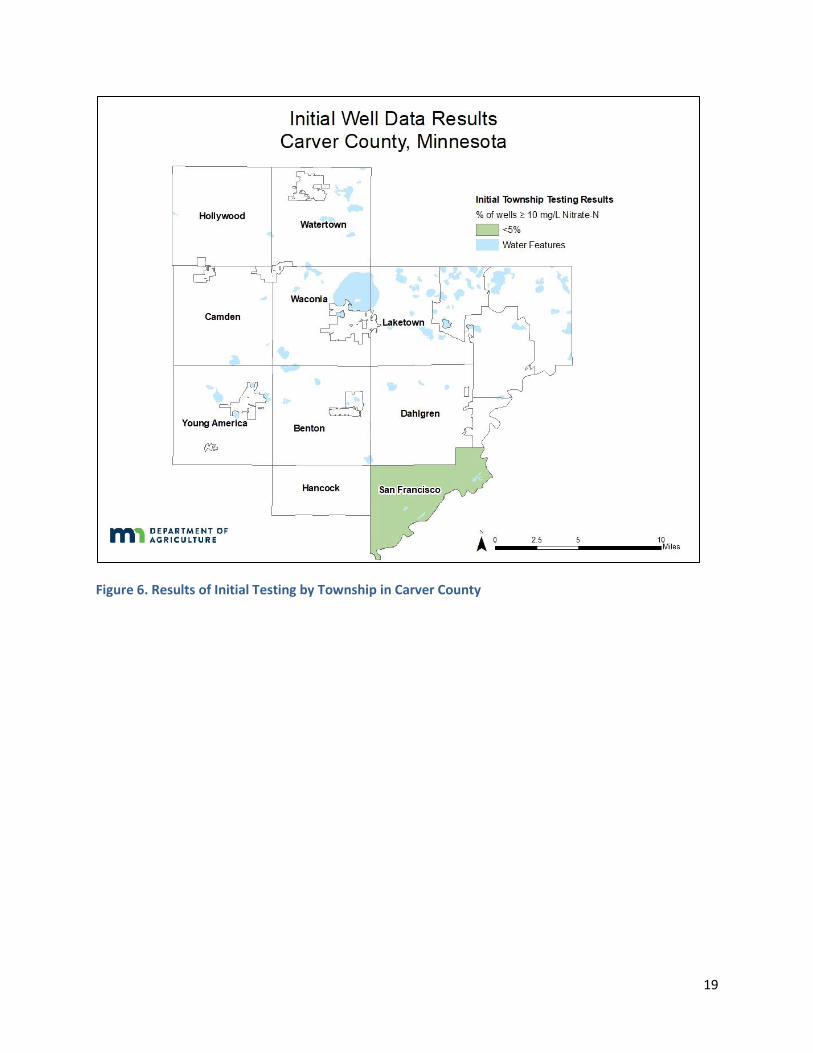
Initial results from the sampling showed that San Francisco township had less than 10 percent of wells at or over 10 mg/L nitrate-N. The township testing results are similar to findings from a 2010 USGS report on nitrate concentrations in private wells in the glacial aquifer systems across the upper United States (US) in which less than five percent of sampled private wells had nitrate concentrations greater than 10 mg/L (Warner and Arnold, 2010). Both the USGS and the township testing studies indicate that nitrate concentrations can vary considerably over short distances.
Figure 5. Well Locations and Nitrate Results from Initial Dataset in Carver County
19
Figure 6. Results of Initial Testing by Township in Carver County
20
Table 3. Carver County Township Testing Summary Statistics for Initial Well Dataset
Values Percentiles Number of Wells Percent of Wells
Township Total Wells
Min Max Mean Median 75th 90th 95th 99th <3
mg/L 3<10 mg/L
≥5 mg/L
≥7 mg/L
≥10 mg/L
<3 mg/L
3<10 mg/L
≥5 mg/L
≥7 mg/L
≥10 mg/L
Nitrate-N mg/L or PPM
San Francisco
160 <DL 12.00 0.83 <DL <DL 3.54 6.20 10.48 143 13 10 7 4 89.4% 8.1% 6.3% 4.4% 2.5%
<DL stands for less than a detectable limit. This means results are less than 0.03 mg/L. The 50th percentile (75th, 90th, 95th, and 99th) is the value below which 50 percent
(75%, 90%, 95%, and 99%) of the observed values fall.
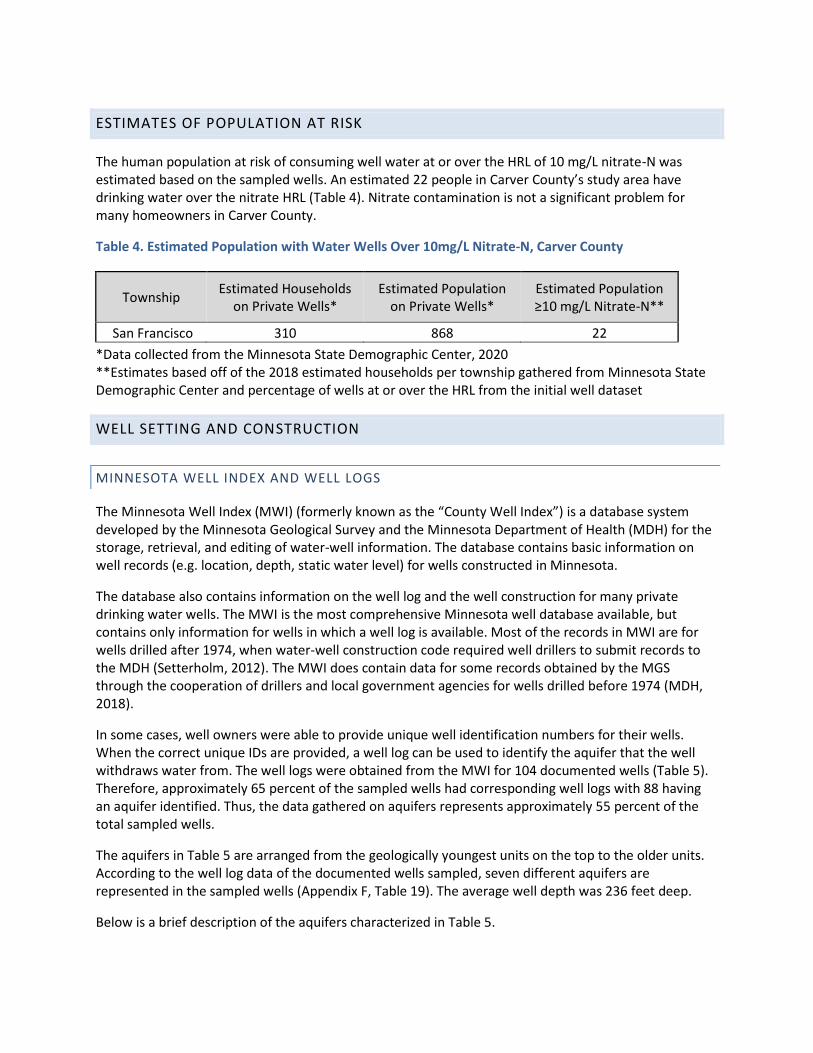
ESTIMATES OF POPULATION AT RISK
The human population at risk of consuming well water at or over the HRL of 10 mg/L nitrate-N was estimated based on the sampled wells. An estimated 22 people in Carver County’s study area have drinking water over the nitrate HRL (Table 4). Nitrate contamination is not a significant problem for many homeowners in Carver County.
Table 4. Estimated Population with Water Wells Over 10mg/L Nitrate-N, Carver County
Township Estimated Households
on Private Wells* Estimated Population
on Private Wells* Estimated Population ≥10 mg/L Nitrate-N**
San Francisco 310 868 22
*Data collected from the Minnesota State Demographic Center, 2020
**Estimates based off of the 2018 estimated households per township gathered from Minnesota State Demographic Center and percentage of wells at or over the HRL from the initial well dataset
WELL SETTING AND CONSTRUCTION
MINNESOTA WELL INDEX AND WELL LOGS
The Minnesota Well Index (MWI) (formerly known as the “County Well Index”) is a database system developed by the Minnesota Geological Survey and the Minnesota Department of Health (MDH) for the storage, retrieval, and editing of water-well information. The database contains basic information on well records (e.g. location, depth, static water level) for wells constructed in Minnesota.
The database also contains information on the well log and the well construction for many private drinking water wells. The MWI is the most comprehensive Minnesota well database available, but contains only information for wells in which a well log is available. Most of the records in MWI are for wells drilled after 1974, when water-well construction code required well drillers to submit records to the MDH (Setterholm, 2012). The MWI does contain data for some records obtained by the MGS through the cooperation of drillers and local government agencies for wells drilled before 1974 (MDH, 2018).
In some cases, well owners were able to provide unique well identification numbers for their wells. When the correct unique IDs are provided, a well log can be used to identify the aquifer that the well withdraws water from. The well logs were obtained from the MWI for 104 documented wells (Table 5). Therefore, approximately 65 percent of the sampled wells had corresponding well logs with 88 having an aquifer identified. Thus, the data gathered on aquifers represents approximately 55 percent of the total sampled wells.
The aquifers in Table 5 are arranged from the geologically youngest units on the top to the older units. According to the well log data of the documented wells sampled, seven different aquifers are represented in the sampled wells (Appendix F, Table 19). The average well depth was 236 feet deep.
Below is a brief description of the aquifers characterized in Table 5.

22
There were three classes of Quaternary aquifers that were utilized by our sampled wells according to the well log data. These aquifers are all comprised of well-sorted sand and gravel deposits (MPCA, 1999).
The Quaternary Water Table (QWTA) are typically only found along drainageways, like the Minnesota River that runs along the eastern boundary of the study area (MPCA, 1999). These are alluvium deposits that were highly impacted by two glacial advancements, the Superior lobe then then Des Moines lobe (MPCA, 1999).
The Quaternary Buried aquifers (QBUA) are similar to the QWTA except that the confining materials (typically clay) are more than 10 feet thick (MPCA, 1999).
Quaternary Buried Artesian aquifers (QBAA) are typically less than 30 feet thick (MPCA,1999).
Tunnel City can vary in thickness from 150 to 180 feet and is comprised of sandstone, siltstone, shale and dolostone. Was formerly called the Franconia Formation (Mossler, 2013)
Wonewoc Sandstone is light gray to yellowish-gray, fine- to coarse-grained, quartzose sandstone. This aquifer is anywhere from 45 to over 70 feet thick (Mossler and Chandler, 2009).
Eau Claire formation is very fine-grained sandstone and siltstone with interbedded grayish-green shale (Mossler and Chandler, 2009).
Mt. Simon Sandstone is fine- to medium-grained sandstone in the upper part of the formation and become coarser as you move towards the lower part of the formation (Mossler and Chandler, 2009).
23
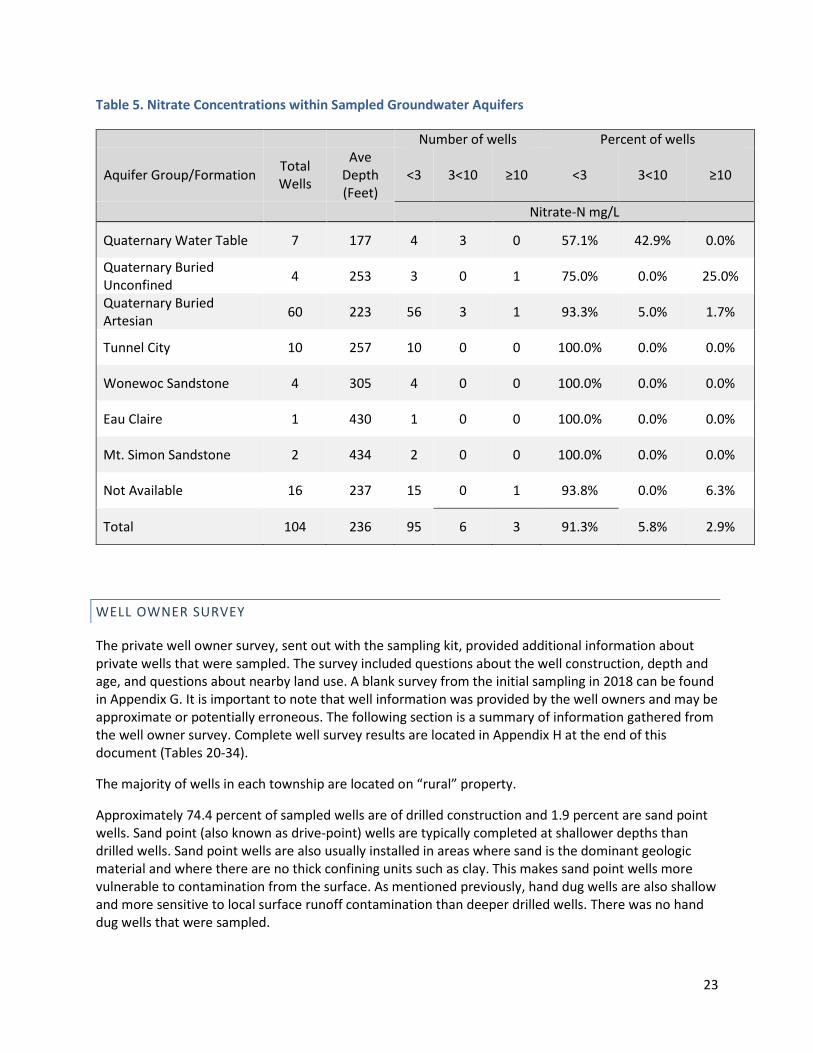
Table 5. Nitrate Concentrations within Sampled Groundwater Aquifers
Number of wells Percent of wells
Aquifer Group/Formation Total Wells
Ave Depth (Feet)
<3 3<10 ≥10 <3 3<10 ≥10
Nitrate-N mg/L
Quaternary Water Table 7 177 4 3 0 57.1% 42.9% 0.0%
Quaternary Buried Unconfined
4 253 3 0 1 75.0% 0.0% 25.0%
Quaternary Buried Artesian
60 223 56 3 1 93.3% 5.0% 1.7%
Tunnel City 10 257 10 0 0 100.0% 0.0% 0.0%
Wonewoc Sandstone 4 305 4 0 0 100.0% 0.0% 0.0%
Eau Claire 1 430 1 0 0 100.0% 0.0% 0.0%
Mt. Simon Sandstone 2 434 2 0 0 100.0% 0.0% 0.0%
Not Available 16 237 15 0 1 93.8% 0.0% 6.3%
Total 104 236 95 6 3 91.3% 5.8% 2.9%
WELL OWNER SURVEY
The private well owner survey, sent out with the sampling kit, provided additional information about private wells that were sampled. The survey included questions about the well construction, depth and age, and questions about nearby land use. A blank survey from the initial sampling in 2018 can be found in Appendix G. It is important to note that well information was provided by the well owners and may be approximate or potentially erroneous. The following section is a summary of information gathered from the well owner survey. Complete well survey results are located in Appendix H at the end of this document (Tables 20-34).
The majority of wells in each township are located on “rural” property.
Approximately 74.4 percent of sampled wells are of drilled construction and 1.9 percent are sand point wells. Sand point (also known as drive-point) wells are typically completed at shallower depths than drilled wells. Sand point wells are also usually installed in areas where sand is the dominant geologic material and where there are no thick confining units such as clay. This makes sand point wells more vulnerable to contamination from the surface. As mentioned previously, hand dug wells are also shallow and more sensitive to local surface runoff contamination than deeper drilled wells. There was no hand dug wells that were sampled.

24
Most of the sampled wells (51.3 percent) are between 100-299 feet deep, and some wells (19.4 percent) are over 300 feet deep. Approximately 26 percent of homeowners did not know or did not respond to this question.
Most of the wells (65.6 percent) had not been tested for nitrate within the last ten years or homeowners were unsure if they had been tested. Approximately one percent of homeowners responded that their well had been tested for nitrate in the last year. Therefore, the results most homeowners receive from this study will provide new information.
POTENTIAL NITRATE SOURCE DISTANCES
The following summary relates to isolation distances of potential point sources and non-point sources of nitrate that may contaminate wells. This information was obtained from the well surveys completed by the homeowner. Complete well survey results are located in Appendix H at the end of this document (Tables 20-34).
• On average, farming takes place on 22.5 percent of the properties.
• Agricultural fields are less than 300 feet from wells at about 36.8 percent of the properties.
• The majority of well owners (81.3 percent) across the one township responded that they do not have livestock (greater than ten head of cattle or other equivalent) on their property.
• The majority of wells (65.0 percent) are over 300 feet from an active or inactive feedlot.
• There was no well owner that indicated they store more than 500 pounds of fertilizer on their property.
• A small minority of wells (1.3 percent) are less than 50 feet away from septic systems.
25
FINAL RESULTS
FINAL WELL DATASET
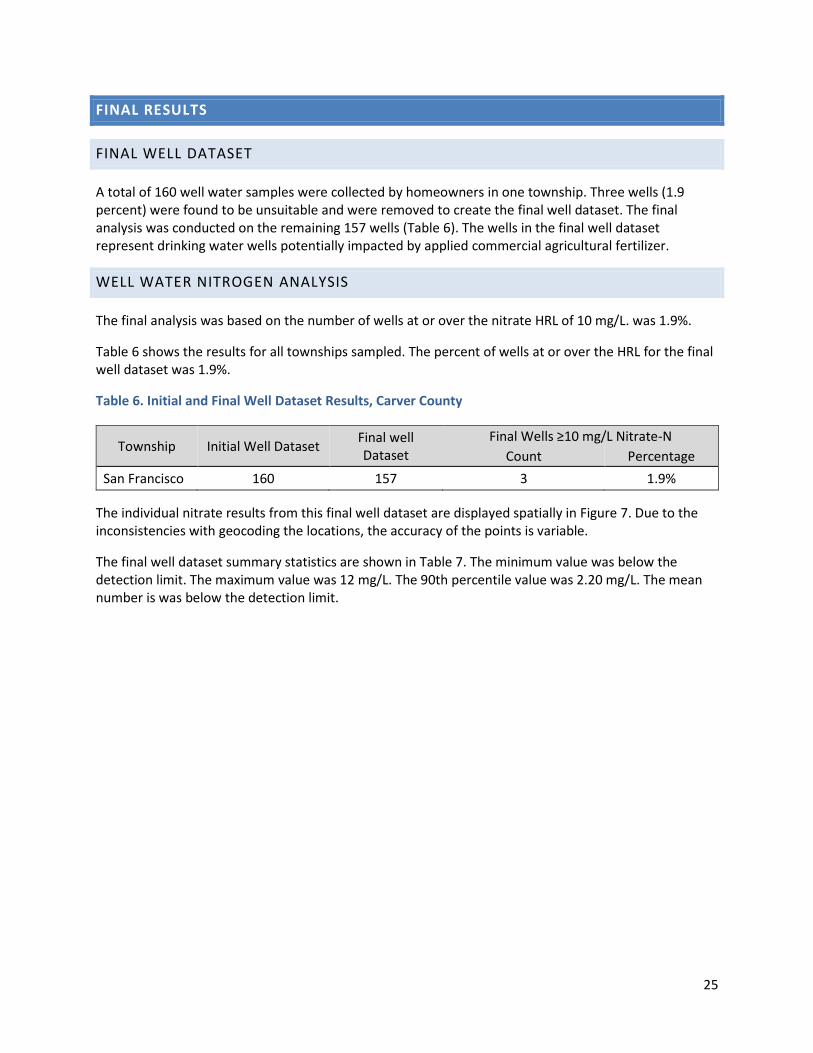
A total of 160 well water samples were collected by homeowners in one township. Three wells (1.9 percent) were found to be unsuitable and were removed to create the final well dataset. The final analysis was conducted on the remaining 157 wells (Table 6). The wells in the final well dataset represent drinking water wells potentially impacted by applied commercial agricultural fertilizer.
WELL WATER NITROGEN ANALYSIS
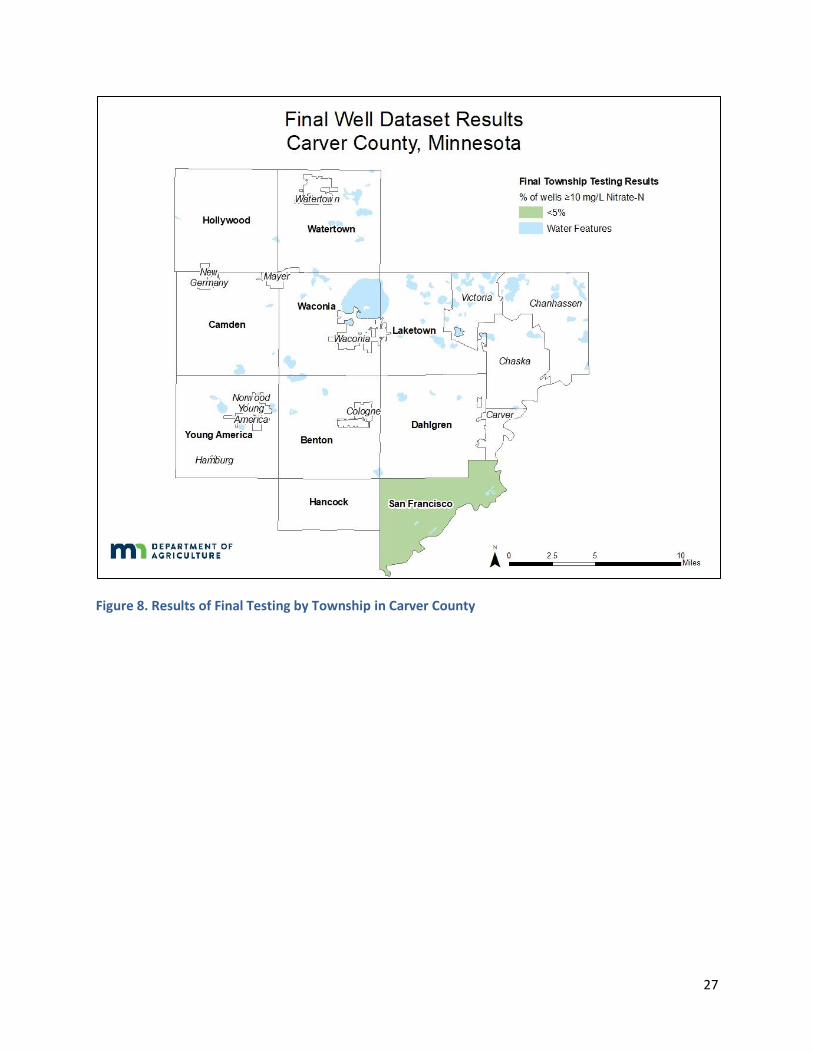
The final analysis was based on the number of wells at or over the nitrate HRL of 10 mg/L. was 1.9%.
Table 6 shows the results for all townships sampled. The percent of wells at or over the HRL for the final well dataset was 1.9%.
Table 6. Initial and Final Well Dataset Results, Carver County
Township Initial Well Dataset Final well Dataset
Final Wells ≥10 mg/L Nitrate-N
Count Percentage
San Francisco 160 157 3 1.9%
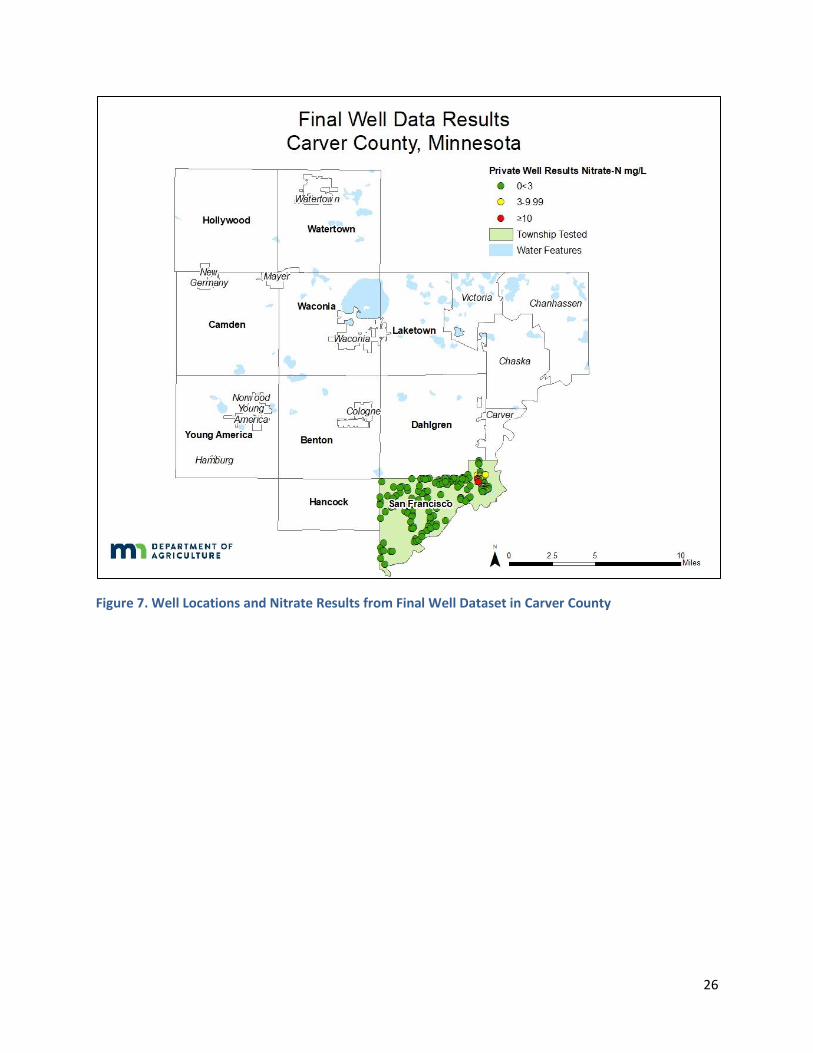
The individual nitrate results from this final well dataset are displayed spatially in Figure 7. Due to the inconsistencies with geocoding the locations, the accuracy of the points is variable.
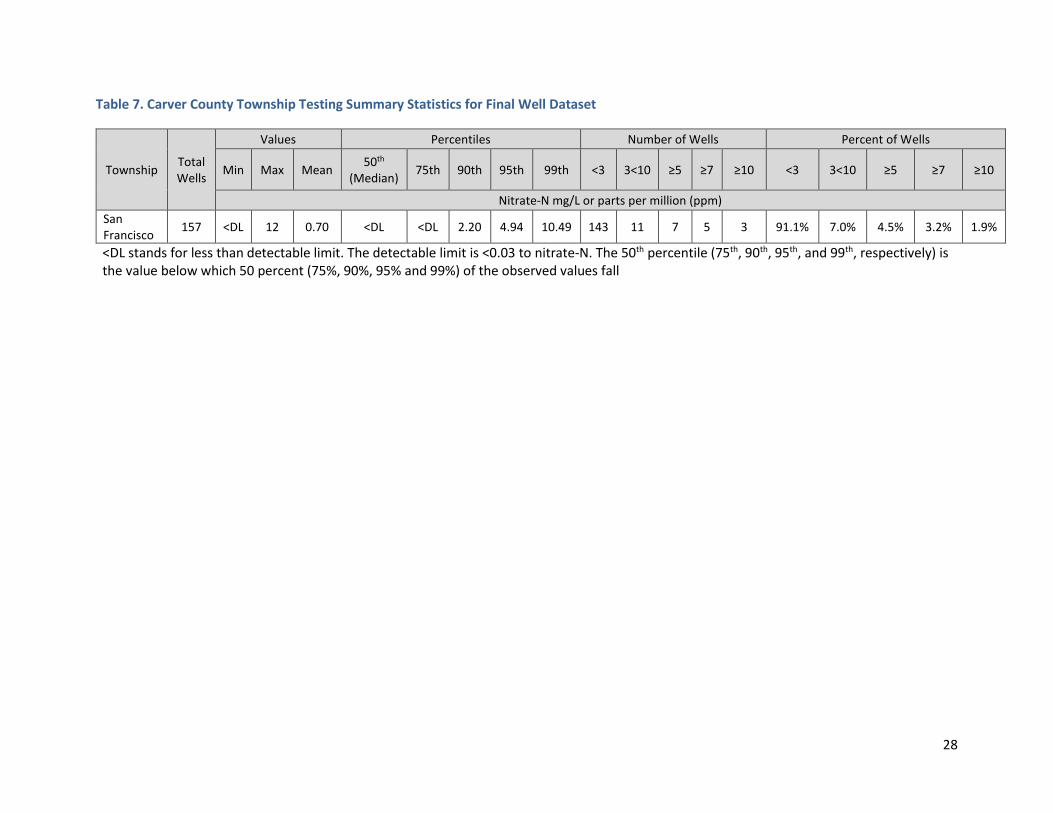
The final well dataset summary statistics are shown in Table 7. The minimum value was below the detection limit. The maximum value was 12 mg/L. The 90th percentile value was 2.20 mg/L. The mean number is was below the detection limit.
26
Figure 7. Well Locations and Nitrate Results from Final Well Dataset in Carver County
27
Figure 8. Results of Final Testing by Township in Carver County
28
Table 7. Carver County Township Testing Summary Statistics for Final Well Dataset
Township Total Wells
Values Percentiles Number of Wells Percent of Wells
Min Max Mean 50th
(Median) 75th 90th 95th 99th <3 3<10 ≥5 ≥7 ≥10 <3 3<10 ≥5 ≥7 ≥10
Nitrate-N mg/L or parts per million (ppm)
San Francisco
157 <DL 12 0.70 <DL <DL 2.20 4.94 10.49 143 11 7 5 3 91.1% 7.0% 4.5% 3.2% 1.9%
<DL stands for less than detectable limit. The detectable limit is <0.03 to nitrate-N. The 50th percentile (75th, 90th, 95th, and 99th, respectively) is the value below which 50 percent (75%, 90%, 95% and 99%) of the observed values fall
29
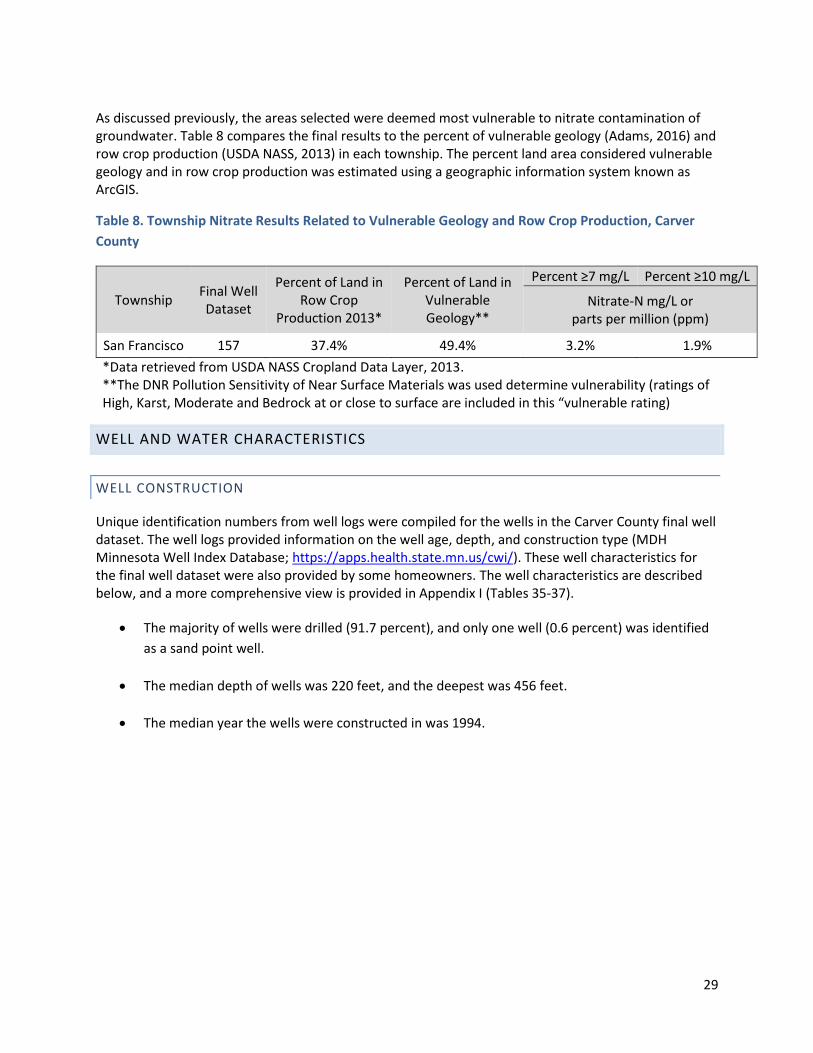
As discussed previously, the areas selected were deemed most vulnerable to nitrate contamination of groundwater. Table 8 compares the final results to the percent of vulnerable geology (Adams, 2016) and row crop production (USDA NASS, 2013) in each township. The percent land area considered vulnerable geology and in row crop production was estimated using a geographic information system known as ArcGIS.
Table 8. Township Nitrate Results Related to Vulnerable Geology and Row Crop Production, Carver
County
Township Final Well Dataset
Percent of Land in Row Crop
Production 2013*
Percent of Land in Vulnerable Geology**
Percent ≥7 mg/L Percent ≥10 mg/L
Nitrate-N mg/L or parts per million (ppm)
San Francisco 157 37.4% 49.4% 3.2% 1.9%
*Data retrieved from USDA NASS Cropland Data Layer, 2013. **The DNR Pollution Sensitivity of Near Surface Materials was used determine vulnerability (ratings of High, Karst, Moderate and Bedrock at or close to surface are included in this “vulnerable rating)
WELL AND WATER CHARACTERISTICS
WELL CONSTRUCTION
Unique identification numbers from well logs were compiled for the wells in the Carver County final well dataset. The well logs provided information on the well age, depth, and construction type (MDH Minnesota Well Index Database; https://apps.health.state.mn.us/cwi/). These well characteristics for the final well dataset were also provided by some homeowners. The well characteristics are described below, and a more comprehensive view is provided in Appendix I (Tables 35-37).
• The majority of wells were drilled (91.7 percent), and only one well (0.6 percent) was identified
as a sand point well.
• The median depth of wells was 220 feet, and the deepest was 456 feet.
• The median year the wells were constructed in was 1994.
30
WELL WATER PARAMETERS
MDA staff conducted the follow-up sampling and well site surveys at 27 wells. 25 follow-up wells are included in the final well dataset. Field measurements of the well water parameters were recorded on the Private Well Field Log & Well Survey Form (Appendix J). Starting in 2018 a digital version of this form was utilized. The measurements included temperature, pH, specific conductivity, and dissolved oxygen. The well was purged for 15 minutes, so that the measurements stabilized, ensuring a fresh sample of water was collected. The stabilized readings for the final well dataset are described below and a more comprehensive view is available in Appendix K (Tables 38-41).
• The temperatures ranged from 10.12 °C to 12.38 °C
• The median specific conductivity was 738 µS/cm, and was as high as 1,114 µS/cm
• The water from the wells had a median pH of 7.51
• The dissolved oxygen readings ranged from 0.12 mg/L to 7.15 mg/L
Water temperature can affect many aspects of water chemistry. Warmer water can facilitate quicker chemical reactions, and dissolve surrounding rocks faster; while cooler water can hold more dissolved gases such as oxygen (USGS, 2016).
Specific conductance is the measure of the ability of a material to conduct an electrical current at 25°C. Thus the more ions present in the water, the higher the specific conductance measurement (Hem, 1985). Rainwater and freshwater range between 2 to 100 µS/cm. Groundwater is between 50 to 50,000 µS/cm (Sanders, 1998).
The United States Environmental Protection Agency has set a secondary pH standard of 6.5-8.5 in drinking water. These are non-mandatory standards that are set for reasons not related to health, such as taste and color (40 C.F.R. §143).
Dissolved oxygen concentrations are important for understanding the fate of nitrate in groundwater. When dissolved oxygen concentrations are low (<0.5 mg/L) (Dubrovsky et al., 2010), bacteria will use electrons on the nitrate molecule to convert nitrate into nitrogen gas (N2). Thus nitrate can be removed from groundwater through the process known as bacterial denitrification (Knowles, 1982).
31
SUMMARY
The focus of this study was to assess nitrate concentrations in groundwater impacted by commercial agricultural fertilizer in the selected township in Carver County. In order to prioritize testing, the MDA looked at townships with significant row crop production and vulnerable geology. Approximately 37 percent of the land cover is row crop agriculture and 23 acres (less than one percent of land cover) of groundwater irrigation in the study area.
One township was sampled covering nearly 15,426 acres. The initial (homeowner collected) nitrate sampling resulted in 160 samples. The 160 households that participated represent approximately 49 percent return rate of homeowner offered sampling kit. The initial well dataset represents private well drinking water regardless of the potential source of nitrate. Well owners with measurable nitrate results were offered a follow-up nitrate sample and a pesticide sample. The MDA visited and collected follow-up samples at 27 wells.
The MDA conducted a nitrogen source assessment and identified wells near potential point sources and wells with poor construction. A total of 3 (1.9 percent) wells were found to be unsuitable and were removed from the final well dataset of 157 wells. The remaining 157 wells were wells believed to be impacted by nitrogen fertilizer and were included in the final well dataset.
In the final well dataset a majority of the wells (91.7 percent) are drilled; less than one percent are sand points. The median depth of the wells is 220 and depths range from 93 to 456 feet.
For the final well dataset, San Francisco township did not have more than 10 percent of wells at or over the nitrate Health Risk Limit of 10 mg/L. The percent of wells at or over the nitrate Health Risk Limit in the township 1.9% percent.
32
REFERENCES
Adams, R. (2016). Pollution sensitivity of near-surface materials: St. Paul, Minnesota Department of
Natural Resources, Minnesota Hydrogeology Atlas Series HG-02, report and plate, accessible at
http://www.dnr.state.mn.us/waters/programs/gw_section/mapping/platesum/mha_ps-
ns.html.
Anderson, R.R., (2014). Introduction to the Midcontinental Rift. Iowa City, IA. Iowa Geological Survey.
Retrieved from: https://www.iihr.uiowa.edu/igs/introduction-to-the-midcontinental-rift/.
Bauer, E.J.. (2009), C-21 Geologic Atlas of Carver County, Minnesota [Part A]. Minnesota Geologic
Survey. Retrieved from http://hdl.handle.net/11299/59648.
Dubrovsky, N., Burow, K.R., Clark, G.M., Gronberg, J.M., Hamilton, P.A.., Hitt, K.J., Mueller, D.K., Munn,
M.D., Nolan, B.T., Puckett, L.J., Rupert, M.G., Short, T.M., Spahr, N.E., Sprague, L.A., & Wilber,
W.G. (2010). The Quality of Our Nation's Water: Nutrients in the Nation's Streams and
Groundwater, 1992-2004 (U.S. Geological Survey Fact Sheet 2010-3078). U.S. Geological Survey.
Retrieved from https://water.usgs.gov/nawqa/nutrients/pubs/circ1350/.
Hem, J.D. (1985). Study and interpretation of the chemical characteristics of natural water. (Water
Supply Paper 2254). Alexandria, VA: U.S. Department of the Interior, Geological Survey.
Hernandez, Jose & A. Schmitt, Michael. (2012). Manure Management in Minnesota. 10.13140/RG.2.2.12053.73447.
Knowles, R. (1982). Denitrification. Microbiol. Rev. 46 (1), 43–70.
Lusardi, Barbara A. (2009). Surficial Geology. St. Paul, MN: Minnesota Department of Natural Resources.
Retrieved from:
https://conservancy.umn.edu/bitstream/handle/11299/59648/pl3_sg%5b1%5d.pdf?sequence=
5&isAllowed=y.
Lusardi, Barbara A. and Tipping, Robert G. (2009). Sand Distribution Model. St. Paul, MN: Minnesota
Department of Natural Resources. Retrieved from:
https://conservancy.umn.edu/bitstream/handle/11299/59648/pl4_qstrat_snddsn%5b1%5d.pdf
?sequence=4&isAllowed=y.
Minnesota Department of Agriculture [MDA]. (2018a). Agricultural Chemical Incidents [Data file].
Retrieved from gisdata.mn.gov/dataset/env-agchem-incidents.
Minnesota Department of Agriculture [MDA]. (2018b). Township Testing Program Sampling and Analysis
Plan. Available Upon Request.
Minnesota Department of Health [MDH], Well Management Section. (2014). Well Owner’s Handbook –
A Consumer’s Guide to Water Wells in Minnesota. St. Paul, MN: Minnesota Department of
Health. Retrieved from
https://www.health.state.mn.us/communities/environment/water/docs/wells/construction/ha
ndbook.pdf.

33
Minnesota Department of Health [MDH]. (2018). Minnesota Well Index. Retrieved from
https://apps.health.state.mn.us/cwi/.
Minnesota Department of Natural Resources [MDNR]. (2017). Minnesota Water Use Data [Data File].
Retrieved from dnr.state.mn.us/waters/watermgmt_section/appropriations/wateruse.html.
Minnesota Department of Natural Resources [MDNR]. (2018). DNR Water Permits. Retrieved from
www.dnr.state.mn.us/permits/water/index.html.
Minnesota Pollution Control Agency [MPCA]. (1999). Baseline Water Quality of Minnesota’s Principal
Aquifers, Twin Cities Metropolitan Region. Retrieved from
https://www.pca.state.mn.us/sites/default/files/metro-rpt.pdf.
Minnesota Pollution Control Agency [MPCA]. (2011). Land Application of Manure: Minimum State
Requirements (wq-f8-11). St. Paul, MN: Minnesota Pollution Control Agency. Retrieved from,
from www.pca.state.mn.us/sites/default/files/wq-f8-11.pdf.
Minnesota Pollution Control Agency [MPCA]. (2013a). Compliance Inspections for Subsurface Sewage
Treatment Systems (SSTS) (wq-wwists4-39). St. Paul, MN: Minnesota Pollution Control Agency.
Retrieved from https://www.pca.state.mn.us/sites/default/files/wq-wwists4-39.pdf.
Minnesota Pollution Control Agency [MPCA]. (2013b). Nitrogen in Minnesota Surface Waters:
Conditions, trends, sources, and reductions (wq-s6-26a). St. Paul, MN: Minnesota Pollution
Control Agency. Retrieved from www.pca.state.mn.us/sites/default/files/wq-s6-26a.pdf.
Minnesota Pollution Control Agency [MPCA]. (2015). State of Minnesota General Animal Feedlots NPDES
Permit (wq-f3-53). St. Paul, MN: Minnesota Pollution Control Agency. Retrieved from
www.pca.state.mn.us/sites/default/files/wq-f3-53.pdf.
Minnesota Pollution Control Agency [MPCA]. (2017a). Feedlot Registration Form (wq-f4-12). St. Paul, MN: Minnesota Pollution Control Agency. Retrieved from www.pca.state.mn.us/quick-links/registration-permits-and-environmental-review.
Minnesota Pollution Control Agency [MPCA]. (2017b). Livestock and the Environment: MPCA Feedlot
Program Overview (wq-f1-01). St. Paul, MN: Minnesota Pollution Control Agency. Retrieved
from www.pca.state.mn.us/sites/default/files/wq-f1-01.pdf.
Minnesota Pollution Control Agency [MPCA]. (2019a). Feedlots in Minnesota [Data file]. St. Paul, MN:
Minnesota Pollution Control Agency. Retrieved from https://gisdata.mn.gov/dataset/env-
feedlots.
Minnesota Pollution Control Agency [MPCA]. (2019b). 2018 SSTS Annual Report, Subsurface Sewage
Treatment Systems in Minnesota. St. Paul, MN: Minnesota Pollution Control Agency. Retrieved
from https://www.pca.state.mn.us/sites/default/files/wq-wwists1-60.pdf
Minnesota State Demographic Center [Minnesota SDC]. (2020). Latest annual estimates of Minnesota
and its cities and townships’ population and households, 2018 [Data file]. Retrieved from
https://mn.gov/admin/demography/data-by-topic/population-data/our-estimates/pop-
finder2.jsp.
34
Minnesota Statutes 2015, section 115.55, subdivision 5.
Mossler, John H. (2013). Bedrock Geology of the Twin Cities Ten-County Metropolitan Area, Minnesota.
St. Paul, MN: University of Minnesota Digital Conservancy. Retrieved from:
https://conservancy.umn.edu/handle/11299/154925.
Mossler, John H. and Chandler, V.W. (2009). Bedrock Geology. St. Paul, MN: Minnesota Department of
Natural Resources. Retrieved from:
https://conservancy.umn.edu/bitstream/handle/11299/59648/pl2_bg%5b1%5d.pdf?sequence=
6&isAllowed=y.
National Secondary Drinking Water Regulations, 40 C.F.R. §143 (2011).
Nolan, B.T., & Stoner, J.D. (2000). Nutrients in Groundwaters of the Conterminous United States, 1992-
95. Environmental Science and Technology, 34(7), 1156-1165. Retrieved from
https://doi.org/10.1021/es9907663.
Sanders, L.L. (1998). A Manual of Field Hydrogeology. Upper Saddle River, NJ: Prentice Hall.
Setterholm, Dale. (2012). Geologic Atlas User’s Guide: Using Geologic Maps and Databases for Resource
Management and Planning. St. Paul, MN: Minnesota Geological Survey. Retrieved from
https://conservancy.umn.edu/handle/11299/166713.
Code of Ordinances Carver County, MN (2019). Chapter 52: Subsurface Sewage Treatment Systems.
United States Environmental Protection Agency [US EPA]. (2009). National primary drinking water
regulations list (EPA 816-F-09-004). Retrieved from www.epa.gov/sites/production/files/2016-
06/documents/npwdr_complete_table.pdf.
United States Geological Survey [USGS]. (2016). Water properties: Temperature. Retrieved from
https://water.usgs.gov/edu/temperature.html.
United States Department of Agriculture National Statistics Service [USDA NASS]. (2013). Cropland Data
Layer, 2013 [Data file]. Retrieved from https://gisdata.mn.gov/dataset/agri-cropland-data-layer-
2013.
Warner, K.L., & Arnold, T.L. (2010). Relations that Affect the Probability and Prediction of Nitrate
Concentration in Private Wells in the Glacial Aquifer System in the United States (Scientific
Investigations Report 2010-5100). Reston, VA: U.S. Geological Survey. Retrieved from
https://pubs.usgs.gov/sir/2010/5100/pdf/sir2010-5100.pdf.

35
APPENDIX A
Well information and Potential Nitrate Source Inventory Form
36
37
APPENDIX B
SUBSURFACE SEWAGE TREATMENT SYSTEM
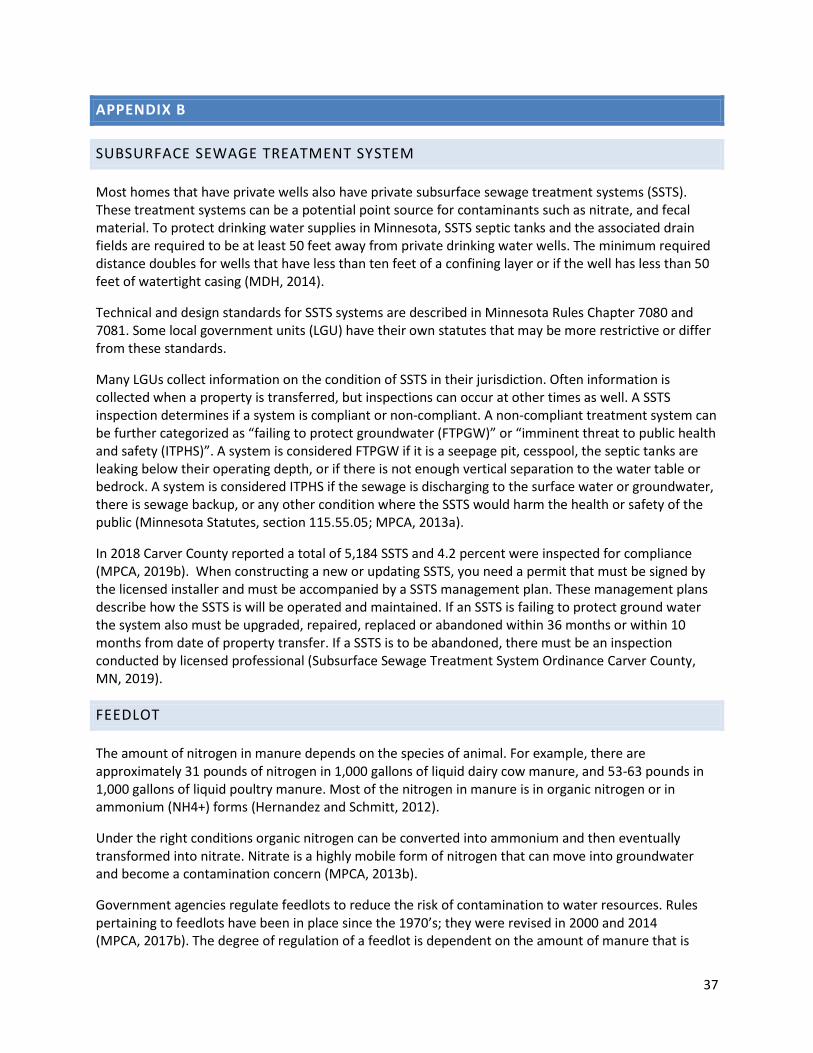
Most homes that have private wells also have private subsurface sewage treatment systems (SSTS). These treatment systems can be a potential point source for contaminants such as nitrate, and fecal material. To protect drinking water supplies in Minnesota, SSTS septic tanks and the associated drain fields are required to be at least 50 feet away from private drinking water wells. The minimum required distance doubles for wells that have less than ten feet of a confining layer or if the well has less than 50 feet of watertight casing (MDH, 2014).
Technical and design standards for SSTS systems are described in Minnesota Rules Chapter 7080 and 7081. Some local government units (LGU) have their own statutes that may be more restrictive or differ from these standards.
Many LGUs collect information on the condition of SSTS in their jurisdiction. Often information is collected when a property is transferred, but inspections can occur at other times as well. A SSTS inspection determines if a system is compliant or non-compliant. A non-compliant treatment system can be further categorized as “failing to protect groundwater (FTPGW)” or “imminent threat to public health and safety (ITPHS)”. A system is considered FTPGW if it is a seepage pit, cesspool, the septic tanks are leaking below their operating depth, or if there is not enough vertical separation to the water table or bedrock. A system is considered ITPHS if the sewage is discharging to the surface water or groundwater, there is sewage backup, or any other condition where the SSTS would harm the health or safety of the public (Minnesota Statutes, section 115.55.05; MPCA, 2013a).
In 2018 Carver County reported a total of 5,184 SSTS and 4.2 percent were inspected for compliance (MPCA, 2019b). When constructing a new or updating SSTS, you need a permit that must be signed by the licensed installer and must be accompanied by a SSTS management plan. These management plans describe how the SSTS is will be operated and maintained. If an SSTS is failing to protect ground water the system also must be upgraded, repaired, replaced or abandoned within 36 months or within 10 months from date of property transfer. If a SSTS is to be abandoned, there must be an inspection conducted by licensed professional (Subsurface Sewage Treatment System Ordinance Carver County, MN, 2019).
FEEDLOT
The amount of nitrogen in manure depends on the species of animal. For example, there are approximately 31 pounds of nitrogen in 1,000 gallons of liquid dairy cow manure, and 53-63 pounds in 1,000 gallons of liquid poultry manure. Most of the nitrogen in manure is in organic nitrogen or in ammonium (NH4+) forms (Hernandez and Schmitt, 2012).
Under the right conditions organic nitrogen can be converted into ammonium and then eventually transformed into nitrate. Nitrate is a highly mobile form of nitrogen that can move into groundwater and become a contamination concern (MPCA, 2013b).
Government agencies regulate feedlots to reduce the risk of contamination to water resources. Rules pertaining to feedlots have been in place since the 1970’s; they were revised in 2000 and 2014 (MPCA, 2017b). The degree of regulation of a feedlot is dependent on the amount of manure that is
38
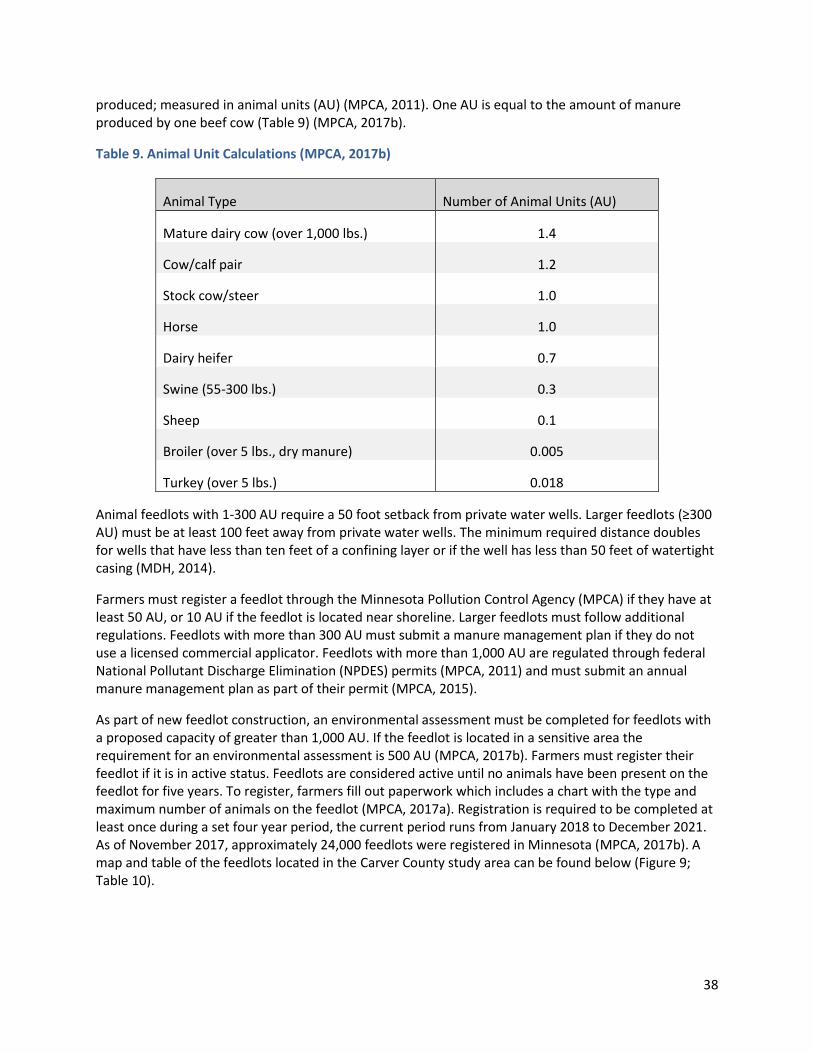
produced; measured in animal units (AU) (MPCA, 2011). One AU is equal to the amount of manure produced by one beef cow (Table 9) (MPCA, 2017b).
Table 9. Animal Unit Calculations (MPCA, 2017b)
Animal Type Number of Animal Units (AU)
Mature dairy cow (over 1,000 lbs.) 1.4
Cow/calf pair 1.2
Stock cow/steer 1.0
Horse 1.0
Dairy heifer 0.7
Swine (55-300 lbs.) 0.3
Sheep 0.1
Broiler (over 5 lbs., dry manure) 0.005
Turkey (over 5 lbs.) 0.018
Animal feedlots with 1-300 AU require a 50 foot setback from private water wells. Larger feedlots (≥300 AU) must be at least 100 feet away from private water wells. The minimum required distance doubles for wells that have less than ten feet of a confining layer or if the well has less than 50 feet of watertight casing (MDH, 2014).
Farmers must register a feedlot through the Minnesota Pollution Control Agency (MPCA) if they have at least 50 AU, or 10 AU if the feedlot is located near shoreline. Larger feedlots must follow additional regulations. Feedlots with more than 300 AU must submit a manure management plan if they do not use a licensed commercial applicator. Feedlots with more than 1,000 AU are regulated through federal National Pollutant Discharge Elimination (NPDES) permits (MPCA, 2011) and must submit an annual manure management plan as part of their permit (MPCA, 2015).
As part of new feedlot construction, an environmental assessment must be completed for feedlots with a proposed capacity of greater than 1,000 AU. If the feedlot is located in a sensitive area the requirement for an environmental assessment is 500 AU (MPCA, 2017b). Farmers must register their feedlot if it is in active status. Feedlots are considered active until no animals have been present on the feedlot for five years. To register, farmers fill out paperwork which includes a chart with the type and maximum number of animals on the feedlot (MPCA, 2017a). Registration is required to be completed at least once during a set four year period, the current period runs from January 2018 to December 2021. As of November 2017, approximately 24,000 feedlots were registered in Minnesota (MPCA, 2017b). A map and table of the feedlots located in the Carver County study area can be found below (Figure 9; Table 10).

39
Table 10. Feedlots and Permitted Animal Unit Capacity, Carver County
Township Total
Feedlots Active
Feedlots Inactive Feedlots
Average AU Permitted* Per Feedlot
Total Permitted*
AU
Total Square Miles
Permitted* AU per
Square Mile
San Francisco 19 11 8 215 2,362 24 98
*Animals permitted may not be the actual animals on site. The total animals permitted is the maximum number of animals that are permitted for a registered feedlot. It is common for feedlots to be have less livestock than permitted.
On average there are 98 AU per square mile (0.15 AU/acre) over the entire study area (Table 10). Manure is often applied to cropland so it is pertinent to look at the AU per cropland acre. In the Carver County study area livestock densities average 0.41 AU per acre of row crops (MPCA, 2019a; USDA NASS, 2013).
Figure 9. Feedlot Locations in Carver County (MPCA, 2019a)

40
FERTILIZER STORAGE LOCATION
MDA tracks licenses for bulk fertilizer storage facilities, anhydrous ammonia, and chemigation sites (Table 11). Abandoned sites are facilities that once housed fertilizer chemicals. These sites are also noted and tracked by the MDA as they are potential contamination sources.
Table 11. Fertilizer Storage Facility Licenses and Abandoned Sites, Carver County
Township Bulk Fertilizer
Storage
Anhydrous Ammonia
Chemigation Sites
Abandoned Sites Total
San Francisco 0 0 0 0 0
Data retrieved from MDA Pesticide and Fertilizer Management Division, 2018; updated March 2018
SPILLS AND INVESTIGATIONS
The MDA is responsible for investigating any fertilizer spills within Minnesota. Figure 10 shows the locations of mapped historic fertilizer spills within the Carver County study area. While other types of spills are recorded, only sites that are potential point sources of nitrogen to the groundwater are reported here (MDA, 2018a).
The MDA tracks several types of incidents. Incident investigations are typically for larger spills. There are none in the study area. Contingency areas are locations that have not been remediated because they were inaccessible or the contaminant could not be removed for some other reason. They are often a part of an incident investigation. There are no contingency areas in this study area. Old emergency incidents were closed prior to March 1st, 2004 (MDA, 2018a), but they can still be a point source. At most of these older sites, the contaminants are unknown and their location may not be precise. There are none in the study area. Small spills and investigations are typically smaller emergency spills such as a truck spilling chemicals. There are none in the study area. It is important to note that while the locations of the incidents described are as accurate as possible, it is an incomplete dataset (MDA, 2018a). A breakdown of chemical type of these incidents can be found in Table 12. A breakdown of the fertilizer specific spills and investigations, by township, can be found in Table 13.
Table 12. Spills and Investigations by Chemical Type, Carver County
Contaminant Incident
Investigations Contingency
Areas Small Spills and Investigations
Old Emergency Incidents
Total
Fertilizer 0 0 0 0 0
Pesticides & Fertilizer
0 0 0 0 0
Anhydrous Ammonia
0 0 0 0 0
Total 0 0 0 0 0

41
Table 13. Fertilizer Related Spills and Investigations by Township, Carver County
Township Incidents and Spills
San Francisco 0
Figure 10. Fertilizer Spills and Investigations in Carver County (MDA, 2018a)
42
APPENDIX C
LAND AND WATER USE
LAND COVER
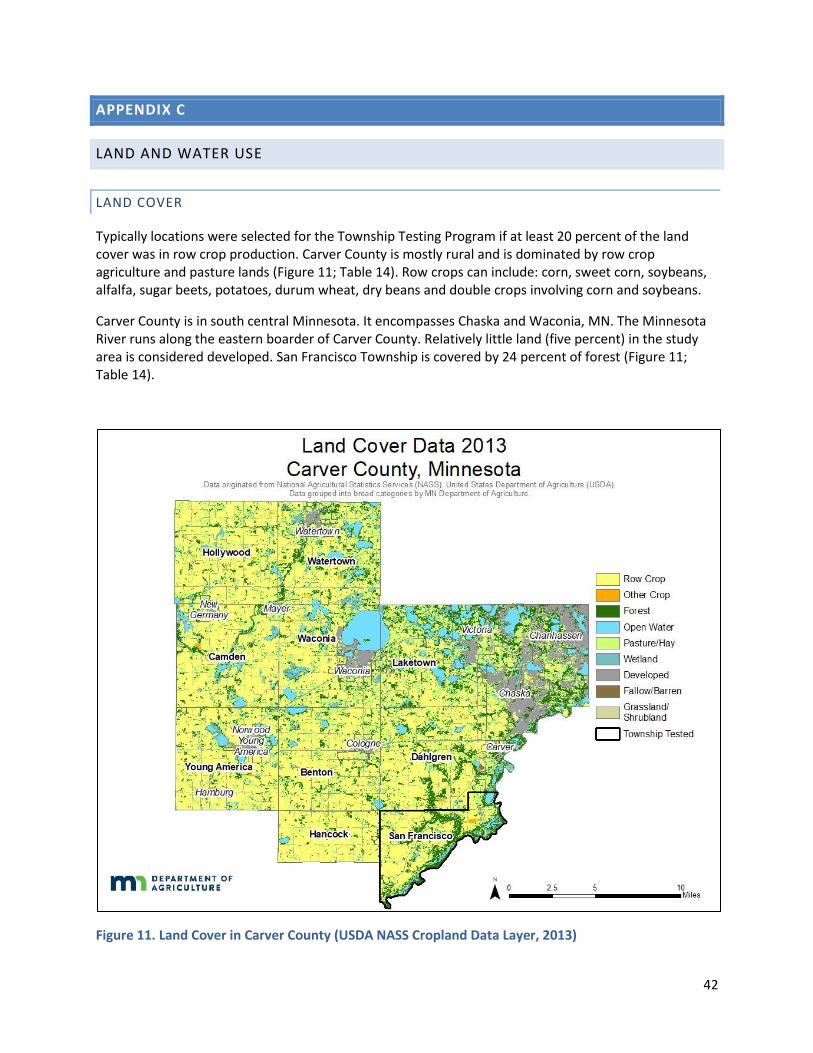
Typically locations were selected for the Township Testing Program if at least 20 percent of the land cover was in row crop production. Carver County is mostly rural and is dominated by row crop agriculture and pasture lands (Figure 11; Table 14). Row crops can include: corn, sweet corn, soybeans, alfalfa, sugar beets, potatoes, durum wheat, dry beans and double crops involving corn and soybeans.
Carver County is in south central Minnesota. It encompasses Chaska and Waconia, MN. The Minnesota River runs along the eastern boarder of Carver County. Relatively little land (five percent) in the study area is considered developed. San Francisco Township is covered by 24 percent of forest (Figure 11; Table 14).
Figure 11. Land Cover in Carver County (USDA NASS Cropland Data Layer, 2013)

43
Table 14. Land Cover Data (2013) by Township, Carver County (USDA NASS Cropland Data Layer, 2013)
Township Total Acres Row Crop
Other Crops
Forest Open Water
Pasture/ Hay
Wetland Developed Fallow/ Barren
Grassland/ Shrubland
San Francisco 15,426 37% 1% 24% 4% 22% 5% 5% 0% 2%
44
WATER USE
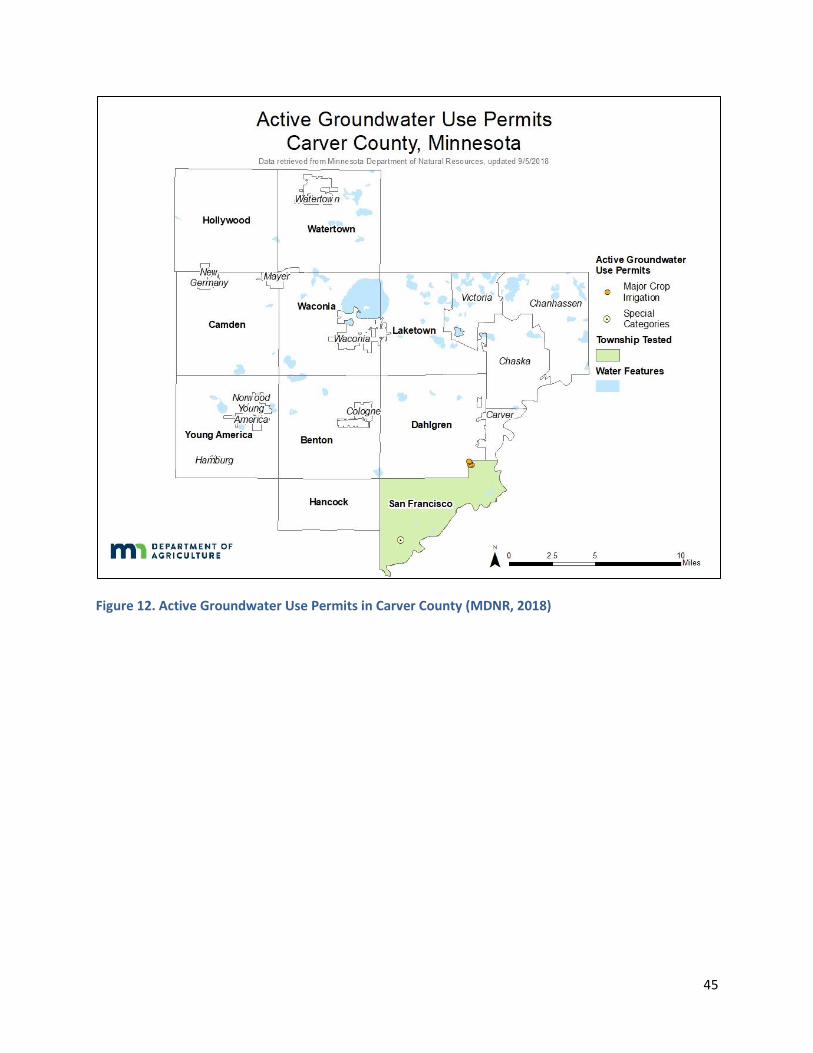
Water use permits are required for wells withdrawing more than 10,000 gallons of water per day or 1,000,000 gallons of water per year (MDNR, 2017). There are a total of 5 active groundwater well permits in the study area, 4 of which are used for major crop irrigation (Figure 12). About 23 acres of cropland are permitted for groundwater irrigation in this area (Table 15). Most permitted wells are withdrawing groundwater from Paleozoic aquifers (Table 16; MDNR, 2018).
Table 15. Active Groundwater Use Permits by Township, Carver County
Township Major Crop Irrigation
Well Permits Average Depth (feet) Acres Permitted
San Francisco 4 263 23
Table 16. Active Groundwater Use Permits by Aquifer, Carver County
Water Use Well Permits Total Average
Depth (feet)
Aquifer
Quaternary Paleozoic Not
Classified
Major Crop Irrigation 4 263 1 2 1
Special Categories* 1 421 0 1 0
Total 5 294 1 3 1
* Special Category displayed in the figure and table are for Livestock Watering.
45
Figure 12. Active Groundwater Use Permits in Carver County (MDNR, 2018)
46
APPENDIX D
47
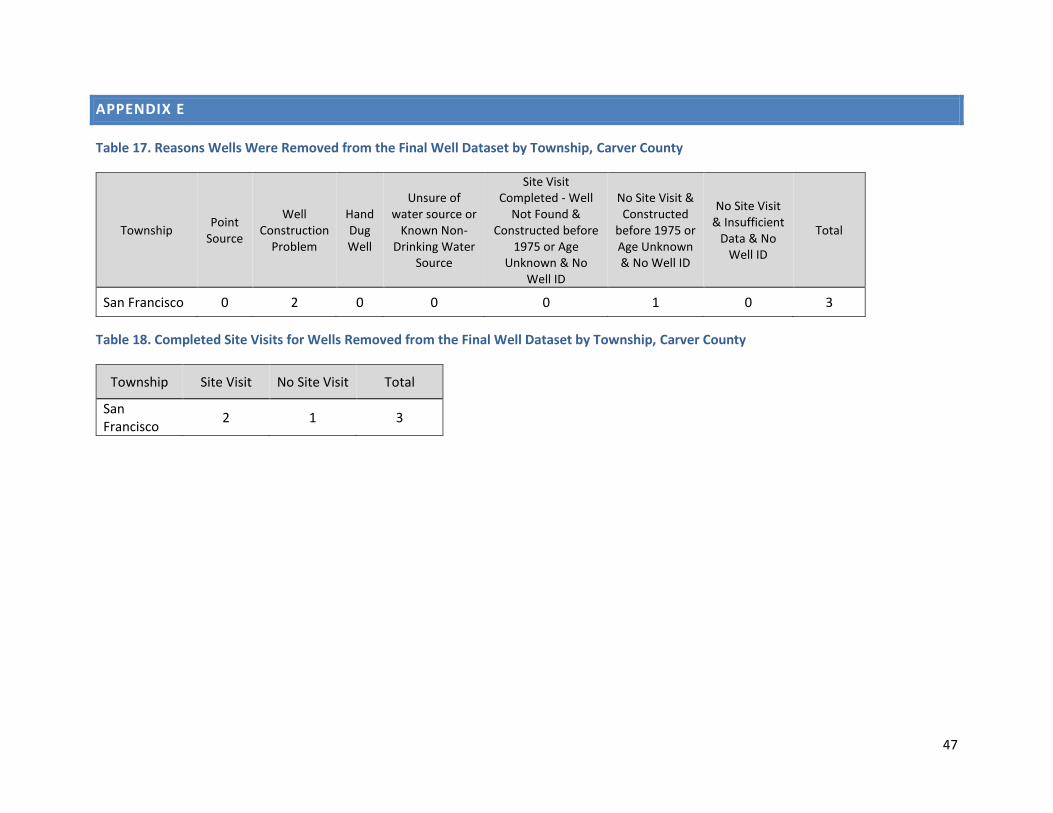
APPENDIX E
Table 17. Reasons Wells Were Removed from the Final Well Dataset by Township, Carver County
Township Point
Source
Well Construction
Problem
Hand Dug Well
Unsure of water source or
Known Non-Drinking Water
Source
Site Visit Completed - Well
Not Found & Constructed before
1975 or Age Unknown & No
Well ID
No Site Visit & Constructed
before 1975 or Age Unknown & No Well ID
No Site Visit & Insufficient
Data & No Well ID
Total
San Francisco 0 2 0 0 0 1 0 3
Table 18. Completed Site Visits for Wells Removed from the Final Well Dataset by Township, Carver County
Township Site Visit No Site Visit Total
San Francisco
2 1 3

48
APPENDIX F
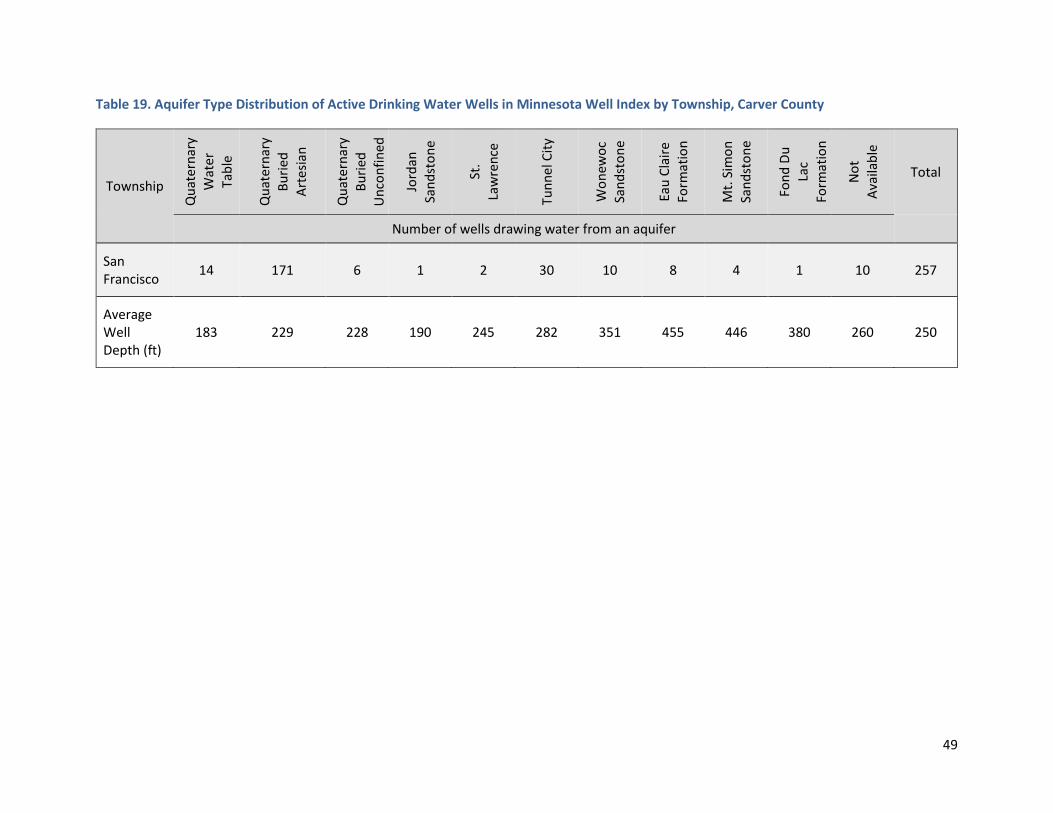
MINNESOTA WELL INDEX
The MWI was used to gather information about the San Francisco township in Carver County. This section includes all documented drinking water wells in the study area, not just wells MDA sampled. Table 19 summarizes the general aquifer types, while the following is a brief summary of the major aquifer types with the average well depth. According to the information from the MWI (MDH, 2018):
In this township, there are 257 documented (have a verified location in the MWI) drinking water wells:
• The majority of wells (66.5 percent) withdraw water from Quaternary Buried Artesian aquifer.
• Two aquifer types (Jordan Sandstone and Fond Du Lac Formation) were poorly represented with only one well withdrawing from both these aquifers.
• The Eau Claire Formation has the deepest average depth of wells.
• Less than two percent of wells were drilled into the Mt. Simon Sandstone and St. Lawrence aquifers.
• Only 14 wells were completed in the Quaternary Water Table aquifer. The average depth of these wells is 183 feet.
• For 10 of the wells, the information on what aquifer the well was completed in is not available. The average depth of these wells is 260 feet.
49
Table 19. Aquifer Type Distribution of Active Drinking Water Wells in Minnesota Well Index by Township, Carver County
Township Q
uat
ern
ary
Wat
er
Tab
le
Qu
ate
rnar
y B
uri
ed
Art
esi
an
Qu
ate
rnar
y B
uri
ed
Un
con
fin
ed
Jord
an
San
dst
on
e
St.
Law
ren
ce
Tun
nel
Cit
y
Wo
new
oc
San
dst
on
e
Eau
Cla
ire
Form
atio
n
Mt.
Sim
on
Sa
nd
sto
ne
Fon
d D
u
Lac
Form
atio
n
No
t A
vaila
ble
Total
Number of wells drawing water from an aquifer
San Francisco
14 171 6 1 2 30 10 8 4 1 10 257
Average Well Depth (ft)
183 229 228 190 245 282 351 455 446 380 260 250

50
APPENDIX G

51
APPENDIX H
Table 20. Property Setting for Well Location
Township Total Country Municipal River home
Lake Home
Sub-division
Other Not
Available
San Francisco 160 71.3% 0.0% 1.3% 0.0% 5.0% 1.9% 20.6%
Table 21. Well Construction Type
Township Total Drilled Sand point Hand dug Not
Available
San Francisco 160 74.4% 1.9% 0.0% 23.8%
Table 22. Age of Well
Township Total 1994 to Present
1985 to 1993
1975 to 1984 Before 1975 Not
Available
San Francisco 160 31.9% 20.6% 13.1% 10.0% 24.4%
Table 23. Depth of Well
Township Total 0-15 feet 16-49 feet 50-99 feet 100-299
feet ≥300 feet
Not Available
San Francisco 160 0.0% 0.0% 3.1% 51.3% 19.4% 26.3%
Table 24. Unique Well ID Known
Township Total No, Unique Well
ID not known Yes, Unique
Well ID known Not Available
San Francisco 160 20.0% 20.0% 60.0%
Table 25. Livestock Located on Property
Township Total No Livestock Yes Livestock Not Available
San Francisco 160 81.3% 1.9% 16.9%
52
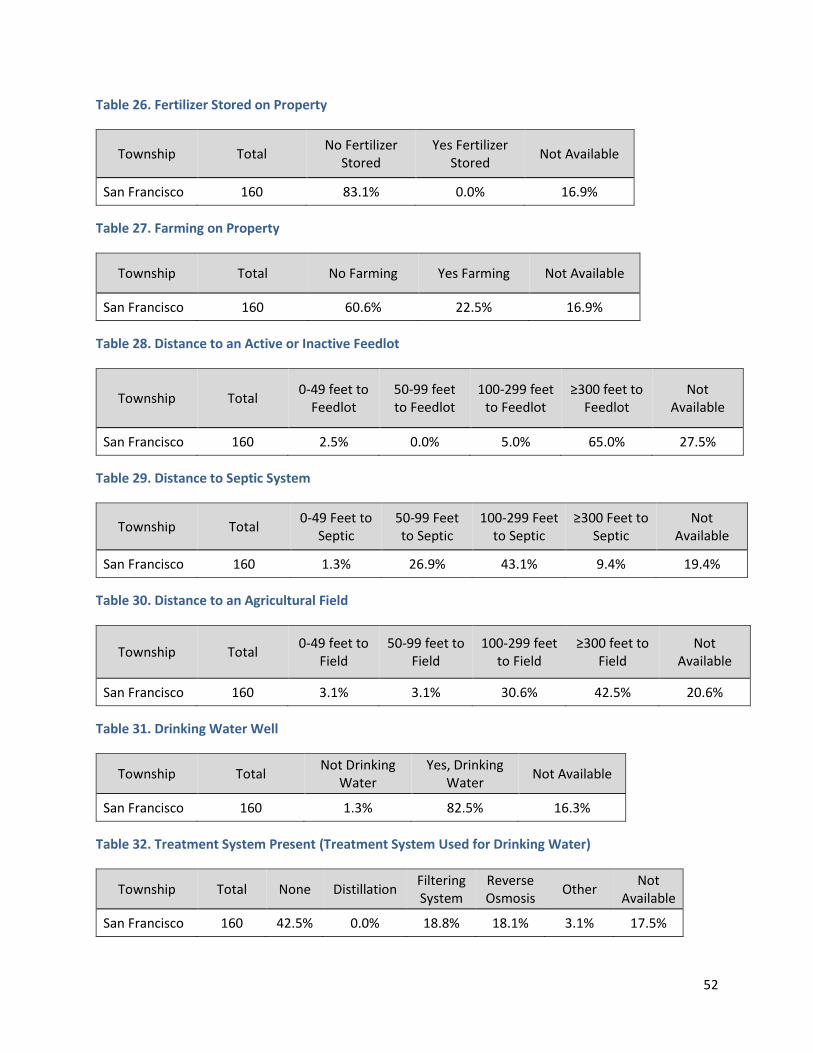
Table 26. Fertilizer Stored on Property
Township Total No Fertilizer
Stored Yes Fertilizer
Stored Not Available
San Francisco 160 83.1% 0.0% 16.9%
Table 27. Farming on Property
Township Total No Farming Yes Farming Not Available
San Francisco 160 60.6% 22.5% 16.9%
Table 28. Distance to an Active or Inactive Feedlot
Township Total 0-49 feet to
Feedlot 50-99 feet to Feedlot
100-299 feet to Feedlot
≥300 feet to Feedlot
Not Available
San Francisco 160 2.5% 0.0% 5.0% 65.0% 27.5%
Table 29. Distance to Septic System
Township Total 0-49 Feet to
Septic 50-99 Feet to Septic
100-299 Feet to Septic
≥300 Feet to Septic
Not Available
San Francisco 160 1.3% 26.9% 43.1% 9.4% 19.4%
Table 30. Distance to an Agricultural Field
Township Total 0-49 feet to
Field 50-99 feet to
Field 100-299 feet
to Field ≥300 feet to
Field Not
Available
San Francisco 160 3.1% 3.1% 30.6% 42.5% 20.6%
Table 31. Drinking Water Well
Township Total Not Drinking
Water Yes, Drinking
Water Not Available
San Francisco 160 1.3% 82.5% 16.3%
Table 32. Treatment System Present (Treatment System Used for Drinking Water)
Township Total None Distillation Filtering System
Reverse Osmosis
Other Not
Available
San Francisco 160 42.5% 0.0% 18.8% 18.1% 3.1% 17.5%
53
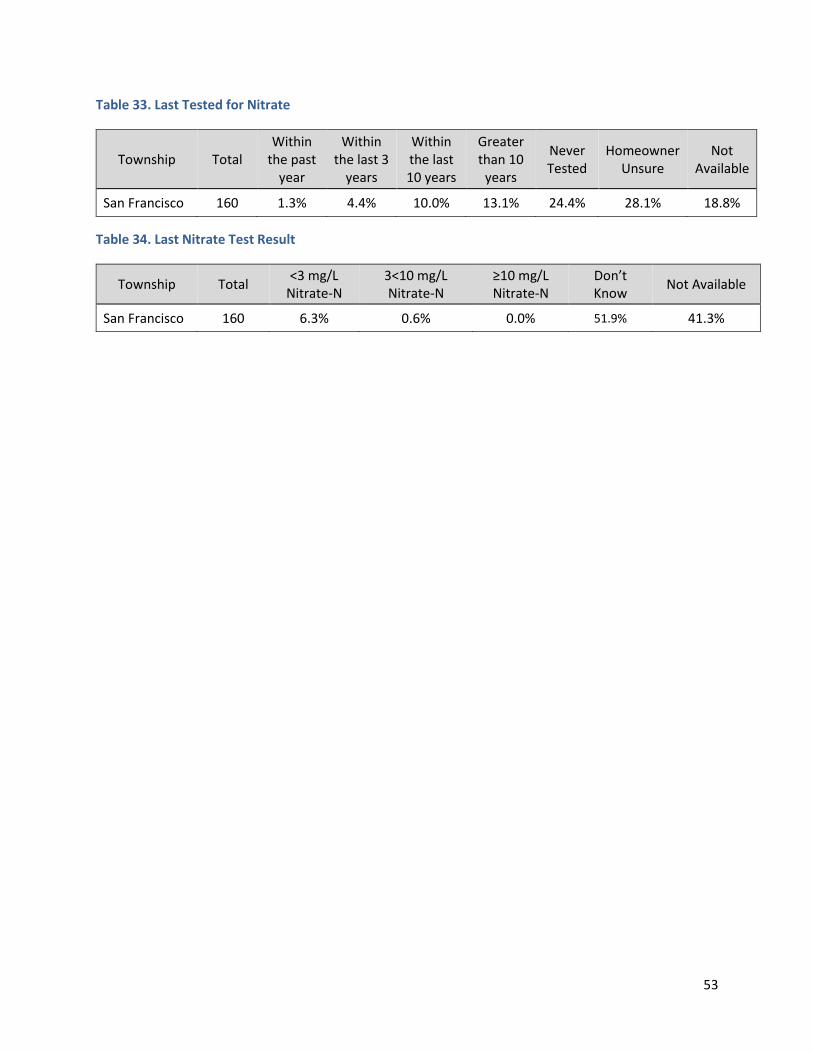
Table 33. Last Tested for Nitrate
Township Total Within
the past year
Within the last 3
years
Within the last 10 years
Greater than 10
years
Never Tested
Homeowner Unsure
Not Available
San Francisco 160 1.3% 4.4% 10.0% 13.1% 24.4% 28.1% 18.8%
Table 34. Last Nitrate Test Result
Township Total <3 mg/L
Nitrate-N 3<10 mg/L Nitrate-N
≥10 mg/L Nitrate-N
Don’t Know
Not Available
San Francisco 160 6.3% 0.6% 0.0% 51.9% 41.3%
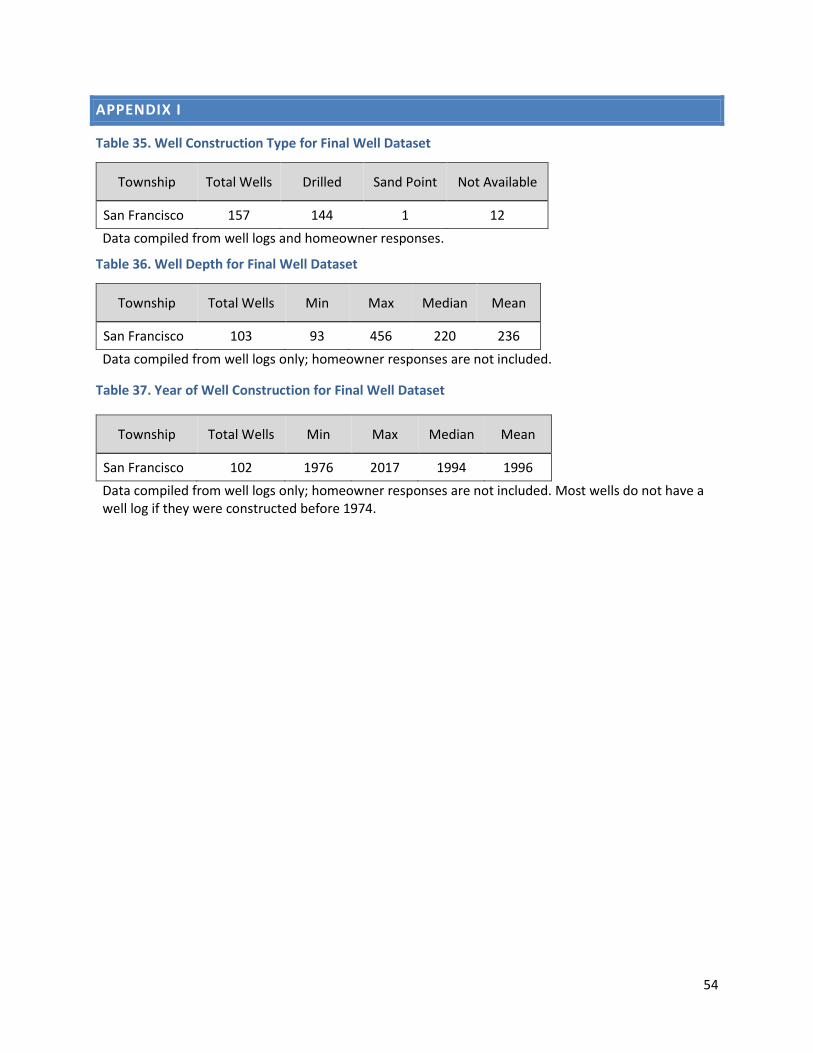
54
APPENDIX I
Table 35. Well Construction Type for Final Well Dataset
Township Total Wells Drilled Sand Point Not Available
San Francisco 157 144 1 12
Data compiled from well logs and homeowner responses.
Table 36. Well Depth for Final Well Dataset
Township Total Wells Min Max Median Mean
San Francisco 103 93 456 220 236
Data compiled from well logs only; homeowner responses are not included.
Table 37. Year of Well Construction for Final Well Dataset
Township Total Wells Min Max Median Mean
San Francisco 102 1976 2017 1994 1996
Data compiled from well logs only; homeowner responses are not included. Most wells do not have a well log if they were constructed before 1974.
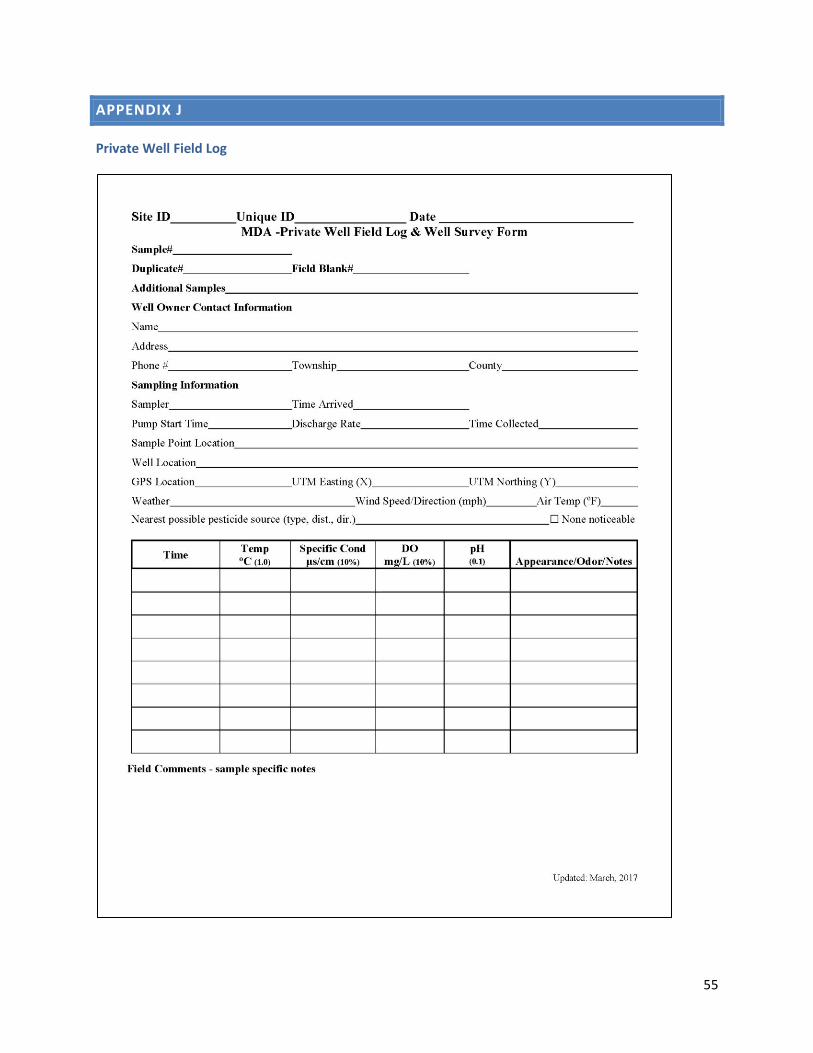
55
APPENDIX J
Private Well Field Log
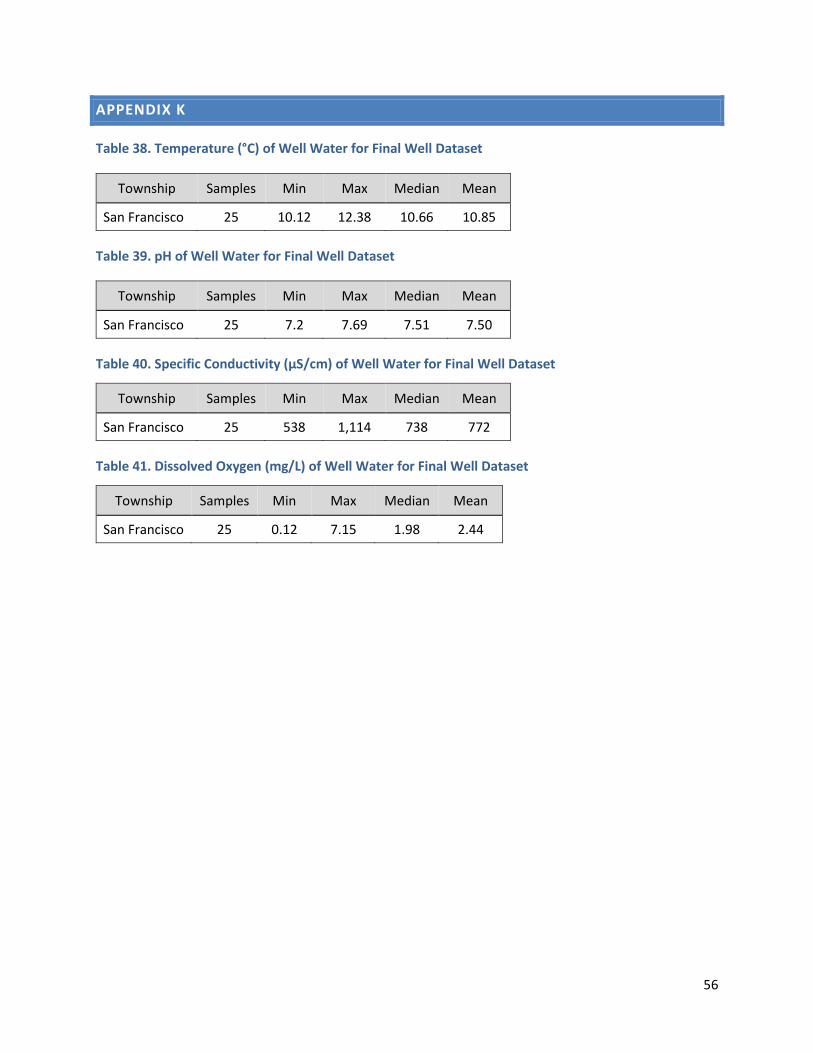
56
APPENDIX K
Table 38. Temperature (°C) of Well Water for Final Well Dataset
Township Samples Min Max Median Mean
San Francisco 25 10.12 12.38 10.66 10.85
Table 39. pH of Well Water for Final Well Dataset
Township Samples Min Max Median Mean
San Francisco 25 7.2 7.69 7.51 7.50
Table 40. Specific Conductivity (µS/cm) of Well Water for Final Well Dataset
Township Samples Min Max Median Mean
San Francisco 25 538 1,114 738 772
Table 41. Dissolved Oxygen (mg/L) of Well Water for Final Well Dataset
Township Samples Min Max Median Mean
San Francisco 25 0.12 7.15 1.98 2.44