Final Thesis Assefa Abebe · EEPD Ethiopian Export Promotion Development FAO Food and Agriculture...
101
MARKET CHAIN ANALYSIS OF HONEY PRODUCTION: IN ATSBI WEMBERTA DISTRICT, EASTERN ZONE OF TIGRAY NATIONAL REGIONAL STATE M.Sc. Thesis ASSEFA ABEBE June 2009 Haramaya University
Transcript of Final Thesis Assefa Abebe · EEPD Ethiopian Export Promotion Development FAO Food and Agriculture...

MARKET CHAIN ANALYSIS OF HONEY PRODUCTION: IN ATSBI
WEMBERTA DISTRICT, EASTERN ZONE OF TIGRAY NATIONAL
REGIONAL STATE
M.Sc. Thesis
ASSEFA ABEBE
June 2009
Haramaya University

ii
MARKET CHAIN ANALYSIS OF HONEY PRODUCTION: IN ATSBI
WEMBERTA DISTRICT, EASTERN ZONE OF TIGRAY NATIONAL
REGIONAL STATE
A Thesis Submitted to College of Agriculture
Department of Agricultural Economics, School of Graduate Studies
HARAMAYA UNIVERSITY
In Partial Fulfillment of the Requirements for the Degree of
MASTER OF SCIENCE IN AGRICULTURE
(AGRICULTURAL ECONOMICS)
By
ASSEFA ABEBE
June 2009
Haramaya University

iii
APPROVAL SHEET
SCHOOL OF GRADUATE STUDIES
HARAMAYA UNIVERSITY
As Thesis research advisors, we here by certify that we have read and evaluated this Thesis
prepared, under our guidance, by Assefa Abebe Geza entitled “Market Chain Analysis of Honey
Production: In Atsbi Wemberta district, Easter Zone of Tigray National Regional State:” We
recommend that it be submitted as fulfilling the thesis requirement.
Berhanu Gebremedhin (PhD) ______________ ___________ Major Advisor Signature Date Dirk Hoekstra (Mr.) _________________ _______ Co-Advisor Signature Date As member of the Board of Examiners of the M.Sc Thesis Open Defense Examination, we
certify that we have read, evaluated the Thesis prepared by Assefa Abebe Geza and examined
the candidate. We recommended that the Thesis be accepted as fulfilling the Thesis requirement
for the Degree of Master of Science in Agriculture (Agricultural Economics).
Wogayehu Bekele (PhD) _______________ ______________
Chair person Signature Date Jema Haji (PhD) _________________ ______________ Internal Examiner Signature Date Kinde Getahun (PhD) ______________ _________________ External Examiner Signature Date

iv
DEDICATION
This piece of work is in memory of my late mother DESTA BARAKI, who had played major
role in nursing and educating me, and who was eager to see my successes, but who passed away
in February 2007 when I was first year graduate student.

v
STATEMENT OF THE AUTHOR
First, I declare that this thesis is my solely work and that all sources of materials used for this
thesis have been duly acknowledged. This thesis has been submitted in partial fulfillment of the
requirements for an advanced M.Sc. degree at the Haramaya University and is deposited at the
University Library to be available to borrowers under rules of the library. I solemnly declare
that this thesis is not submitted to any other institution anywhere for the award of any academic
degree, diploma, or certificate.
Brief quotations from this thesis are allowable without special permission provided that accurate
acknowledgement of source is made. Requests for permission for extended quotation from or
reproduction of this manuscript in whole or in part may be granted by the head of the major
department or the Dean of the School of Graduate Studies when in his or her judgment the
proposed use of the material is in the interests of scholarship. In all other instances, however,
permission must be obtained from the author.
Name: Assefa Abebe Geza Signature: _____________
Place: Haramaya University, Haramaya
Date:

vi
ABBREVIATIONS
BLUE Linear Unbiased Estimator CLR Classical Linear Regression
CC Contingency Coefficient
CSA Central Statistical Authority
DOARD District Office of agriculture and Rural Development
DCSI Dedebit Credit and Saving Institution
EEA Ethiopian Economic Development
EEPD Ethiopian Export Promotion Development
FAO Food and Agriculture Organization
ILRI International Livestock Research Institute
IPMS Improving Productivity for Market Success Ethiopian Farmers’
Project
ITC International Trade Center
Kms Kilometers
KB Koenker Bessett M.a.s.l meters above sea level
MT Metric Tone
NMM Net Marketing Margin
OLS Ordinary Least Squares
RMA Rapid Market Appraisal
TAMPA Tigray Agricultural Marketing Promotion Agency
SCP Structure Conduct performance
SPSS Statistical Package for Social Sciences
TGMM Total Gross Marketing Margin
VIF Variance Inflation Factor

vii
BIOGRAPHICAL SKETCH
The author was born in May 14, 1973 in a Village called Tsehafti near Maichew town, Southern
Zone of Tigray National Regional State. He attended his elementary school at Maichew Primary
and Junior Secondary Schools and his Secondary school at Maichew Senior Secondary School
(currently renamed as Zelealm Desta Junior Secondary School and Tilahun Yigzaw Senior and
Preparatory School respectively). Joined Mekelle DonBosco Technical College in September
1992 completed his Diploma in Machine Technology in June 1995. Then after, he was
employed in Adigrat Addis Pharmaceutical Factory in September 1997 as Junior Machinist
from September 1997-August1999. The author joined Ethiopian Civil Service College in
September 1999 and Graduated with B.A Degree in Economics in August 2002.Working latest
seven years for Tigray National Regional State Bureau of Agriculture and Rural Development
in Cooperative sub-Sector as Monitoring and Evaluation Expert, he joined Haramaya University
in July 2006 to perceive his M.Sc. degree in Agricultural Economics.

viii
ACKNOWLEDGEMENTS
I am deeply grateful and indebted to Dr. Berhanu Gebremedhin (PhD, Scientist-Agricultural
Economist) my major advisor, who devoted his precious time to comment on the research
proposal write up from the very commencement. Successful accomplishment of this research
would have been very difficult without his generous time devotion from the early design of the
questionnaire to the final write-up of the thesis by adding valuable, constructive and ever
teaching comments and thus I am indebted to him for his kind and tireless efforts that enabled
me to finalize this thesis.
Unreserved thanks go to my thesis research Co-Advisor Mr. Derik Hoekstra (ILRI) for his
helpful comments for the betterment of the thesis. Moreover, my especial thank goes to other
members of the IPMS-ILRI namely Muluhiwot and W/ro Berkie Enyew from IPMS head
office, Dr. G/Medhin and Dawit W/mariam from Atsbi Wemberta IPMS-ILRI pilot learning
site staff for their at ease facilitation of all logistical matters. I also wish to convey my heartfelt
thanks to W/ro Bosena Tegegne who had on my achievements.
Finally I extend my gratitude to my family/my wife Alganesh Kahsay, children Helen and
Mulugeta, and kids Arsiema/ for their invaluable sacrifice in every perspective until I returned.

ix
TABLE OF CONTENTS
STATEMENT OF THE AUTHOR v
ABBREVIATIONS vi
BIOGRAPHICAL SKETCH vii
ACKNOWLEDGEMENTS viii
ABSTRACT xvi
1.INTRODUCTION 1
1.1. Background of the Study 1
1.2. Statement of the Problem 3
1.3. Objectives of the study 4
1.4. Scope of the study 4
1.5. Significance of the Study 5
1.6. Limitations of the study 5
1.7. Organization of the study 5
2.1. Basic Concepts and Definitions 6
2.2. Marketing Channels 7
2.3. Marketing Agents 8
2.4. Marketable and Marketed Surplus 9
2.5. Market Structure, Conduct and Performance Analysis (S-C-P) 9
2.5.1. Market structure 10
2.5.2. Market conduct 11

x
2.5.3. Market performance 12
2.6. Market Concentration 13
2.7. Supply and Supply Chains 14
2.7.1. Supply determinants 14
2.8. Honey production and Marketing 15
3. RESEARCH METHODOLOGY 20
3.1. Description of the Study Area 20
3.2. Method of Data collection 22
3.3. Sample Size and Method of Sampling 23
3.4. Method of Data Analysis 24
3.4.1. Market structure 24
3.4.2. Market conduct 25
3.4.3. Market performance 26
3.4.4. Supply function 30
3.4.5. Determinants of marketable supply of honey production in Atsbi Wemberta 31
3.5. Definition of Variables 32
4. RESULTS AND DISSCUSSIONS 37
4.1. Socio-economic Characteristics of Sample Households 37
4.1.1. Household characteristics 37
4.1.2. Honey production characteristics 40
4.1.3. Experience in beekeeping 41
4.1.4. Beekeeping equipments and their sources 42
4.1.5. Honey production 42
4.1.6. Annual income earned by sample respondent from the sale of the commodity 44
4.1.7. Access to services 46
4.1.8. Demographic characteristics of traders 48
4.3. Market Structure 54

xi
4.3.1. Honey marketing participants, their roles and linkages 54
4.3.2. Honey marketing channel 56
4.3.3. Market conduct 60
4.3.4. Performance of the market 61
4.4. Determinants of Honey Market Supply 66
4.4.1. Econometric results of the OLS model 67
5. CONCLUSION AND RECOMMENDATIONS 70
5.1. Conclusion 70
5.2. Recommendations 73
6. REFERENCES 76
7. APPENDICES 82
xii
LIST OF TABLES
1. Production of honey and beeswax (metric tones) in Africa and selected African
Countries in 2005 16
2. Export of honey 1998 – 2003 18
3 .Export of beeswax 1998-2003 19
4. Sample distribution of farmers (honey producers) 23
5. Sample distribution of honey traders’ 24
6. Description of the dependent and independent variables used in the model 35
7. Distribution of sample respondents by age household heads 38
8. Distribution of sample respondents by sex of household heads 39
9. Education status of the household heads 39
10. Honey bee colony holding size of sample farmers 40
11. Distribution of respondents by beekeeping experience 41
12. Distribution of respondents by annual total production obtained from their hives 43
13. Distribution of sample farmers by annual total gross income earned from the sale
of honey 45
14. Proportion of farmers with access to credit, extension service and market information 47
15. Demograhpic characteristics of sample traders 48
16. Financial capital of sampled honey traders 49
17. Beekeeping problems encountered by sample respondents. 50
18. Marketing problems of honey traders 53
19. Amount of honey output supplied (kg) to different market participants by farmers in
2006/07 production year 55
20. Honey traders concentration ratio in the sample markets 59
21. Cost and profitability analysis of honey production for producers 62
22. Cost and profitability analysis of honey collectors 63
xiii
23. Cost and profitability analysis of honey retailers 64
24. Average price of honey at different market levels, 2006/07 65
25. OLS results of determinants of honey market supply 68

xiv
Figure page
Figure 1. Honey marketing channel 57
xv
List of Appendix Tables
Appendix table page
Appendix Table 1. Multicollinerity test with VIF 82
Appendix Table 2 .Contingency Coefficient 82
Appendix Table 3. Average production of honey per box beehives and total
production at the district level for the last four years 83
Appendix Table 4. Quarterly average retail price of honey (Birr/Kg) in different
market centers found in the region from 5/2/2006 to 6/10/2008 83

xvi
MARKET CHAIN ANALYSIS OF HONEY PRODUCTION: IN ATSBI
WEMBERTA DISTRICT, EASTERN ZONE OF TIGRAY NATIONAL
REGIONAL STATE
ABSTRACT
This study was initiated to analyze honey marketing chains particularly in Atsbi Wemberta
District, Eastern Zone of Tigray Region. The focus of the study was, to analyze the structure of
production costs and determine profitability of the production, to analyze the determinants of
honey supply in the study area, identify the major constraints and supply of the commodity to
the market, to evaluate structure-conduct-performance of honey marketing. The data were
generated by individual interview and group discussions using pre-tested semi structured
questionnaires and checklists. This was supplemented by secondary data collected from
different published and unpublished sources. Robust OLS regression econometric model was
used to analyze the determinants of honey marketable supply. The results obtained from this
analysis indicates that education level of the household head, price of honey in 1999 E.C. and
the quantity of honey produced were found to be the most important positively significant
variables influencing honey marketable supply of the District. The channel analysis of the
commodity indicated a very short route. The main market participants for honey marketing of
the District during the survey period were honey collectors, retailers and processors. Besides, a
significant amount of honey produced is channeled directly to consumers from producers
(434%). The honey marketing performance was also measured using marketing margins
complemented with analysis of costs and gross profits generated by different marketing channel
actors. Major problems of the production identified and prioritized by beekeepers in the study
area were drought, pests and diseases of honey bee, lack of beekeeping equipments, death of
colony, marketing problems, and shortage of bee forage and lack of adequate beekeeping skill.
Based on the study results, interventions demanded to raise marketable supply of honey
produced are recommended.

1. INTRODUCTION
1.1. Background of the Study
Africa is blessed with numerous types of wild honeybee (Adjare, 1990). Ethiopia is one of the
countries of the continent which own big honey production potential. Owing to its varied
ecological and climatic conditions, Ethiopia is home to some of the most diverse flora and
fauna in Africa. Its forests and woodlands contain diverse plant species that provide surplus
nectar and pollen to foraging bees (Girma, 1998). Beekeeping is one of the oldest farming
practices in the country. There is an ancient tradition for beekeeping in Ethiopia which
stretches back into the millennia of the country's early history (Girma, 1998). Of all countries
in the world probably no country has a longer tradition of beekeeping than Ethiopia
(Hartmann, 2004). It has been practiced traditionally. Moreover, beekeeping is an appropriate
and well-accepted farming technology and it is best suited to extensive range of ecosystems of
tropical Africa. To date, over 10 million of bee colonies are existing, which include both feral,
and hived ones (Ayalew, 2001).
Ethiopia is the largest honey producer in Africa and 10th largest honey producer all over the
world. Also considerable amount of wax is produced in the country. On a world level,
Ethiopia is fourth in beeswax and tenth in honey production (Girma, 1998). Ethiopia, having
the highest number of bee colonies and surplus honey sources of flora, is the leading producer
of honey and beeswax in Africa. Ethiopia produces around 23.6% and 2.1% of the total Africa
and World’s honey, respectively.
The total honey production of Ethiopia is estimated up to 24000 metric tones; only a small
amount of this is marketed. Besides poor marketing conditions the main reason is that about
80% of the total Ethiopian honey production goes in to the local Tej-preparation, a honey
wine, which consumed as national drink in large quantities (Hartmann, 2004).

2
However, the products obtained from this sub sector are still low as compared to the potential
of the country. Although thousands of tones of honey are produced every year it is usually
poorly managed and unattractive in appearance. Because of this its place in the local market
being taken by imported honey. Moreover, traditional hive honey is of good quality as long as
it is in the hive. Faulty handling, from the time of its harvest until it reaches to market is
responsible for its inferior quality. The type of hives used the methods of removing and
storage of honey play a vital role in the quality of honey (Crane 1970, as cited by Edessa,
2005).
Ethiopia's wide climatic and edaphic variability have endowed this country with diverse and
unique flowering plants, thus making it highly suitable for sustaining a large number of bee
colonies and the long established practice of beekeeping. Nevertheless, the bees and the plants
they depend on, like all renewable natural resources, are constantly under threat from lack of
knowledge and appreciation of these endowments (Girma, 1998).
The principal resource base for beekeeping has, however, become seriously degraded in the
course of time. The potential of the Ethiopian landscape for honey and wax production does
now, certainly only constitutes a small fraction of its former wealth. Moreover, the destruction
of the remaining resource-base can be observed going on at a steadily accelerating pace
(Girma, 1998).
Based on this facts even though Tigray region, particularly Atsbi Wemberta District is
believed to have diversified types of vegetation and cultivated crops and expected to be
potential for beekeeping activities so far there is no compiled and reliable information on
honey production and marketing system in the area. The numbers of beekeepers, bee colonies,
amount of honey, type of beekeeping practiced and marketing constraints were not known.
The District has 18,567 bee colonies (Atsbi Wemberta ARDO, 2008). The entire honey
production in the District is mainly for marketing and about 80-90% of the honey produced is
sold by rich, middle income and poor households (IPMS, 2005). Despite the high honey
production in the study area, there is no ready market attracting beekeepers. Therefore this

3
study was conducted to collect information on potential and constraints of honey production
systems of Atsbi Wemberta district in the Northern part of Ethiopia.
1.2. Statement of the Problem
Recognition of critical role of markets in economic development led to comprehensive market
reforms across a number of developing countries. In spite of these reforms, symptoms of
poorly functioning markets in much of Sub – Saharan Africa are evident in the segmentation
of markets, low investment in the market infrastructure, the persistence of high margins and
of the market thinness and the limited progression toward more complex arrangements (Eleni,
2001)
The major constraint to increasing the welfare of smallholders is their inability to access
markets. Enhancing the ability of poor smallholder farmers to reach markets and actively
engage in them is one of the most pressing development challenges. Remoteness results in
reduced farm-gate prices, returns to labour and capital, and increased input and transaction
costs. This, in turn, reduces incentives to participate in economic transactions and results in
subsistence rather than market-oriented production systems. Sparsely populated rural areas,
and high transport costs are physical barriers to accessing markets; lack of negotiating skills,
lack of collective organizations and lack of market information are other impediments to
market access (Jones, 1972).
An efficient, integrated, and responsive market mechanism, which is, marketed with good
performance, is of crucial importance for optimum allocation of resources in agriculture and
for stimulating farmers to increase output (Jones, 1972; FAO, 1999; Acharya and Agarwal,
1999). Without having convenient marketing conditions, the possible increment in output,
rural incomes and foreign exchange resulting from the introduction of improved production
technologies could not be effective. An improvement in marketing efficiency, thus, attracts
the attention of many countries and viewed as an important national development strategy.
4
Honey production in Atsbi Wemberta district is mainly with seasonality where surplus at
harvest products is the main characteristics. The nature of the product on the one hand and the
lack of organized market system on the other often resulted in low producers’ price. No
studies have been carried out to identify what the marketing systems look like and no
remedial measures were taken so far. This, therefore, demanded a holistic study of the system
in the form of market chain analysis.
Market chain analysis is supposed to be the current approach working in studies of such type
of production and marketing problems. Analysis of the system in terms of honey market
structure, conduct and performance taking in to consideration the product and location
specificity will, therefore, be used to identify the bottlenecks and come up with precise
possible solution. Even though both honey and honey by-products are economical and
socially important, no adequate study has been made in the study area to improve the sector.
This study therefore, has attempted to contribute to filling the information gap by
investigating the honey marketing chains and factors affecting honey supply in Atsbi
Wemberta District.
1.3. Objectives of the study The over all objective of this study was to analyze honey market chains in Atsbi Wemberta
District. The specific objectives were to (1) analyze the structure of production costs and
determine profitability of production (2) analyze the determinants of honey supply in the
study area (3) analyze the market structure, conduct and performance of honey market (4)
identify the major constraints, opportunities of production and supply of the commodity to the
market
1.4. Scope of the study
The area coverage of this study was limited to Atsbi Wemberta District. And it also was
focused on the functioning of the market and relationship among the actors within the

5
marketing chains, transportation, marketing information, finance, institutions involved in
honey marketing and factors affecting supply of honey production in the study area. Different
market levels, role of actors in the channel, and bargaining characteristics of producers,
buying and selling strategies, and trades' behaviors in the whole marketing process were seen.
1.5. Significance of the Study
This study would generate useful information in order to formulate honey marketing
development projects and guidelines for interventions that would improve the efficiency of
honey marketing system. The potential users of this finding would be farmers (producers),
traders, government and non-government organizations, that have an interest to intervene in
honey marketing system. Researchers who want further investigation on honey marketing
would use the result from this study.
1.6. Limitations of the study
The main limitation of this study was mainly related to coverage of the study area. There are a
number of known Districts in honey production in the region. However, the study focused
only in Atsbi Wemberta District due to budgetary and time limitations. The other limitation of
the study was that, this study being the first in the District lack many detail investigations.
1.7. Organization of the study
The first chapter deals with the background, statement of the problem, objectives and
significance of the study. The second chapter consists of the review of the literature.
Methodology is outlined and described in the third chapter. The fourth chapter deals with the
results and discussions. Conclusion and recommendations are presented in the fifth chapter.

6
2. LITERATURE REVIEW
The aim of this chapter is to discuss concepts such as market, marketing, marketable supply,
market chain, market structure, conduct and performance. In relation to these issues, the
chapter highlights about the production and marketing of honey in the World, Africa and
Ethiopia.
2.1. Basic Concepts and Definitions
Marketing is an institution or mechanism which brings together buyers (“demanders”) and
sellers (“suppliers”) of particular goods and services. As a basic definition, marketing is the
process of satisfying human needs by bringing products to people in the proper form and at the
proper time and place. Marketing has an economic value because it gives form, time, and place
utility to products and services. As products definition it is the performance of all the
transactions and services associated with the flow of good from the point of initial production
to the final consumer. As business firm marketing is as a complete management concept
through which the company sells itself as well as its line of product. And from the view point
of society, it is defined as all the process necessary to determine consumers’ physical and
societal needs and to conceptualize and affect their fulfillment (Barson and Norvell, 1983).
The term market has got a variety of meanings. In some cases the market may mean the place
where buying and selling takes place, an area in which a good is sold, a group of people
carrying on buying or selling, or the commodity traded, such as the corn market, or time
market (Larson, 1957).
Marketing involves all activities involved in the production, flow of goods and services from
point of production to consumers. Marketing includes all activities of exchange conducted by
producers and middlemen in exchange for the purpose of satisfying consumer demand. It is
defined as the set of human activities directed at facilitating and consummating exchange. All
business activities facilitating the exchange are included in marketing (Kotler, 2003).

7
Marketing has an intrinsic productive value, in that it adds time, form, place and possession
utilities to products and commodities. Through the technical functions of storage, processing
and transportation, and through exchange, marketing increases consumer satisfaction from
any given quantity of output (Mendoza, 1995).
As expressed by FAO (1997) food and agricultural marketing not only means the movement
of agricultural produce from the farm (where it is produced) to the consumer or manufacturer
but also includes the marketing of production supplies to farmers like fertilizer, pesticide,
chemicals, machinery, animal feed, tools and equipments.
Market chain is the term used to describe the various links that connect all the actors and
transactions involved in the movement of agricultural goods from the producer to the
consumer (CIAT, 2004). Commodity chain is the chain that connects smallholder farmers to
technologies that they need on one side of the chain and to the product markets of the
commodity on the other side (Mazula, 2006).
2.2. Marketing Channels
Formally, marketing channel is a business structure of interdependent organizations that reach
from the point of product origin to the consumer with the purpose of moving products to their
final consumer destination (koler et al., 2003). The analysis of marketing channels is intended
to provide a systematic knowledge of the flow of goods and services from their origin
(producer) to their final destination (consumer). This knowledge is acquired by studying the
“participants” in the process those who perform physical marketing functions in order to
obtain economic benefits. In carrying out the functions, marketing agents achieve both
personal and social goals. They add value to production and in so doing help satisfy consumer
needs. This price also serves as a signal to all the actors in the marketing channel, i.e.
producers, rural assemblers, transporters, wholesalers, and retailers (Mendoza, et al., 1982).

8
2.3. Marketing Agents
Producer: It is first link in the marketing chain analysis of agricultural products. The
producer harvests the products and supply to the second agent. From the movement he/she
decides what to produce, how to produce, how much to produce, when to produce, and where
to sale.
Rural assembler: Some times also called transporter or the trader; he/she is the first link
between producer and other middlemen.
Marketing boards: It is a legalized single government agency charged with the
responsibility of a nation’s total output of a particular commodity.
Wholesaler: He provides the optimum combination of functions and services for different
kinds of retailers, and performs desired distribution functions for different kinds of
processors. Carry a wide range of products that meet almost all the retailers’ requirements and
his emphasis is on a complete line of products and several major brands.
Agents and brokers: They handle individual brands and sell to food chains, general
wholesalers, and institutional markets on a commission or fee basis. Agents and brokers do
not take title to or warehouse the products they sell. They operate under a franchise or
contract agreement. Their duty is to provide a major sales effort for the brands they represent.
Retailers: Middlemen, which includes supper markets and other large scale retailer who
divides up large scale shipments of produce and sell it to consumers in small units. The basic
function they provide is bulk breaking.
Consumer: The last link in the marketing chain. The participants and their respective
functions often overlap. The widest spread combinations are: traders- wholesalers that collect
the commodity and supply it to retailers, wholesalers-retailers (wholesalers that also sell
directly to consumers and wholesalers- exporters).

9
2.4. Marketable and Marketed Surplus
Marketable surplus is the quantity of the produce left out after meeting the farmer’s
consumption and utilization requirements for kind payment and other obligations such as
gifts, donations, charity, etc. Thus, marketable surplus shows the quantity left out for sale in
the market. The marketed surplus shows the quantity actually sold after accounting for losses
and retention by the farmers, if any and adding the previous stock left out for sale (Thakur et
al., 1997). Thus, marketed surplus may be equal to marketable surplus, it may be less if the
entire marketable surplus is not sold out and the farmers retain some stock and if losses are
incurred at the farm or during transit. The importance of marketed and marketable surplus has
greatly increased owning to the recent changes in agricultural technology as well as social
patterns. In order to maintain the balance between demand for and supply of food grains with
the rapid increases in demand due to higher growth population, urbanization, industrialization
and over all economic development accurate knowledge on marketed and marketable surplus
is essential in the process of proper planning for the procurement, distribution, export and
import of agricultural product (Malik et al., 1993).
2.5. Market Structure, Conduct and Performance Analysis (S-C-P)
Since the 1960s, the systematic nature of markets has increasingly been emphasized in
defining means of analyzing their efficiency. The S-C-P approach or industrial organization
school is then developed. The approach has been used in the study of markets in many
countries such as in India by Level and Harris and in West Africa by Jones among others
(Magrath, 1992). The S-C-P approach focuses on the behavior of groups rather than
individual firms, and looks into the influence of the horizontal relationships among these
firms on market performance. Thus, it is suggested that the S-C-P model is preferable to that
model which analyze the productive efficiency of individual marketing enterprises (Magrath,
1992).

10
The most commonly used theoretical frame work (model) is the structure-conduct-
performance model. Social, political, economic and physical environment in different
societies influence the operation of the marketing system (Kohls and Uhl, 1985). The
interrelationship between the factors and their influence on firms’ behavior within the society
will change through time. The implicit goal of public policy has been to protect and promote
setting that approaches the conditions of pure competition. Consistent performance model (S-
C-P), which appears to provide significant part of the theoretical support for the policy
formulation (Kohls and Uhl, 1985; Abbot; 1958).
2.5.1. Market structure
Market structure shows trends in the number and size of firms relative each other and to the
number of consumers and producers in particular time and place (Malhotra, 1996). It explains
about Presence /absence, the levels and nature of entry barriers distribution of market
information and its adequacy in sharpness of prices and quantity compositions and individual
risk (Kohls and Uhl, 1985; abbot; 1958). Conduct explains price policy, advertising policy,
output policy, legal tactics, etc (Abbot, 1958). Performances depend on conduct of sellers and
buyers which intern is strongly influenced by structure of the relevant market. It also shows a
locative efficiency, technical efficiency, equality, innovation etc. (Purcel, 1979).
A commonly used measure of the performance of a marketing system is the marketing margin
or price spread (Abbot et al., 1990). Margin or spread can be useful descriptive statistics it
used to show how the consumer’s expenditure is divided among participants at different levels
of the marketing system. Abbot et al., (1990) defined marketing margin as the difference
between price consumers pay and product and then resell it together with specific charges for
marketing services rendered. The relative share of the different market participants will be
estimated using the marketing margin analysis. The total marketing margin in marketing
system constitutes the marketing costs plus the profit earned. The price that is obtained by
producers, or as the price of collection of marketing services, which the outcome of the
demand for and supply of such services. Marketing services include such items as assembling,

11
grading, storing, processing, packing, distribution, and transportation (Branso and Norvell,
1983). It is made of individual margins obtained by intermediaries who actually assume
ownership of product and then resell it together with specific changes for marketing services
rendered. The relative share of the different market participants will be estimated using the
marketing margin analysis. The total marketing margin in marketing system constitutes the
marketing costs plus the profit earned.
2.5.2. Market conduct
Marketing conduct refers to the patterns of behavior that enterprises follow in adopting or
adjusting to the markets in which they sell or buy (Bain, 1968). Such a definition shows the
analysis of human behavioral patterns that are not readily identifiable, obtainable, or
quantifiable. Thus, in the absence of theoretical frame work for market analysis, there is a
tendency to treat conduct variables in descriptive manner. The specified structure features of
homogeneous product, and free entry and exit require a form of conduct such that each firm
must operate as if in isolation. Market conduct is exceedingly complex, encompassing as it
does virtually all human decision masking within business organizations and, by extension,
household, on top of the market structure, the legal environment and the internal organization
of the business enterprise influence the market conduct (Wolday, 1994).
Bain (1968) names two closely interrelated aspects of market conduct: the manner in which,
the devices and mechanisms by which, the different sellers coordinate their decision and
action, to each other, or succeed in marketing them mutually consistent as they react to
demand for their products in a common market, and the character of pricing policies and
related market policies that the sellers in the industry adopt; assessed in terms of individual or
collective aims or goals that they pursue as they determine their selling prices, their sales
promotion outlays, the designs and qualities of their products and so forth. By examining the
relationship between the factors of the market structure and their setting practice; it may be

12
possible to make some predictions about the consequences of these behavioral patters for
performance.
2.5.3. Market performance
Market performance according to Bain refers to the composite of results that firms in the
market arrive at by pursuing whatever line of conduct they espouse-end results in the
dimensions of price, output, production and selling cost, product design, and so forth
(Wolday, 1994). For firms acting as sellers, these results measure the character of the firm’s
adjustment to the effective demands for their outputs; for firms buying goods, they measure
the quantity of adjustments made by firms to the supply conditions of the goods, they
purchase. There are two main indicators of market performance: Net return and marketing
Margin.
Estimation of net returns and market margins provide indications of an exploitative nature
when returns of buyers are much higher than the fair amount, that is including all marketing
costs and return to management and risk, and when market margins increase not because of
higher real marketing costs but because prices paid to producers are lower. The analysis of
market performance using the industrial organization framework is as follows: Collusive
pricing (market conduct) becomes possible if (i) market concentration is high (market
structure); (ii) entry barriers are high (market structure); and (iii) market information is not
available to all participants (market conduct).
This results in net returns and marketing margins that are much higher than the “fair” amount
(Pomery, 1989). Market performance refers to the impact of structure and conduct as
measured in terms of variables such prices, costs, and volume of output (Bressler and King,
1970). By analyzing the level of marketing margins and their cost components, it is possible
to evaluate the impact of the structure and conduct characteristics on market performance
(Bain, 1968). For most countries, it is generally acknowledged that a distribution system

13
displaying acceptable performance is one that allows technological progress, has the ability to
adopt, innovate, and utilize resources efficiently and to transmit prices that reflect costs
(OECD, 1982). Prices are thus viewed as a stimulus for an efficient allocation of resources.
Hence, desirable market performance is directly related to the competitiveness of an industry
because distortions thereof tend to impede price efficiently.
2.6. Market Concentration
Market concentration refers to the number and size of distribution of buyers and sellers in a
market. The greater the degree of concentration, the higher the possibility of non competitive
character, such as collusion, existing in the market. It is generally believed that higher market
concentration indicates non-competitive behavior and thus inefficiency. Devine et.al. (1984)
“buyer concentration is analogous to seller concentration, and in principle a range of absolute
and relative measure of buyer concentration corresponding to those seller concentration could
be Constructed. However, such measures have not been constructed, to the absence of product
by purchasing firms.” The relationship between concentration and market behavior, and
performance must not, be interpreted in isolation. Other factors such as the firms’ objectives,
barriers to entry and exit, economics of scale, and assumptions about rival firms behavior, will
all relevant in determining the degree of concentration and the relationship between
concentration and behavior and performance (Scherer, 1980).
There are a number of measures of market concentration and the most commonly used is the
market index, which measures the percent of traded volume accounted for by a given number
of participants. Empirical studies in the field of industrial organization suggested certain level
of at which non- competitive behavior of market participant begins in different industries. For
example, Kohls and Uhl (1985) suggests that a four firms concentration ratio (CR4 ), that is,
the market share of the larger four firms, of less than or equal to 33% is generally indicator of
a competitive market structure, while a concentration ratio of 33% to 50% and above 50% may
indicate a weak and strongly oligopolistic market structure, respectively. However, the
concentration ratio of four firms is best regarded as a “rule of thumb,” and there are reasons

14
why high concentration levels may be reasonable in light of small potential volumes of trade
(Gebremeskel et al., 1998).
2.7. Supply and Supply Chains
“A supply chain is a network of organizations that are involved through upstream and
downstream linkages in different process and activities that produce value in the form of
products and services in the hands of the ultimate user” (Christoher, 1998 in: Omta et al.,
2001: 78) An important aspect of supply chain is that they consist of some associated, but
distinct flows. The physical flow of the commodity and the flow of money realized from final
sale back to the producer and all the firms that have been involved in processing and
marketing. The efficiency and effectiveness of a practices and procedures that govern this
latter flow are as important as technical efficiency with which the commodity is produced,
processed and marketed (Westlake, 2005).
Supply is predominantly determined by price of the commodity in question especially when
there are floor and cutting prices imposed by the government or any other responsible body. If
the government imposes a maximum, or ceiling prices on a good, the effect is to cause a
shortage that good and frequently creates a black market (underground market) that rations
that quantity available.
2.7.1. Supply determinants
The most important factors which determine market supply could be divided into economic
factors which include product price, provision of consumer goods, production cost and market
supply costs and political factors which include the level of government intervention (Maro,
1996; cited in Wolday, 1994). One of the expected important variables which influence the
behavior of the market supply of producers is price. If price increases, producers will gain
high revenue and would be motivated to increase the market supply (Wolday, 1994).

15
As Branson and Norvell (1983) stated the model as general statement of a supply functional
relationship that includes the major factors that affecting the supply offer farmers is a
function of (a) price of the commodity to be supplied (b) cost of all the inputs necessary to
produce the commodity (c)net income or profit that could be had from alternative crops (
d)state of technology that affects potential yields ( e)total acreage available ( f) expectations
about future price changes (g) risks to production (weather, insects)Three of the factors
warrant special comment: technology, expectation, and risks. All three have to do with shifts
in the supply curve. Technology is perhaps the major factors influencing supply, which
includes the development of new varieties of plants that give higher yields. It breakthroughs
cause a shift of the supply curve to the right. Expectations about future price changes also
have a strong influence on agricultural production. Most econometric tests of supply response
behavior find that farmers’ expectations about prices are influenced greatly by the present
price and to a lesser degree by that of the previous year. Risk is also significant in shifting the
supply curve. For high- risk crops, prices are necessary to call forth a given level of
production. Prices also show increased variability because production plans are not always
achieved.
2.8. Honey production and Marketing
World production of honey during the 1990s was in excess of 1.2 million metric tones (MT)
per year. Beeswax production was more than 50,000 MT per year. World demand for these
products is substantially in excess of these amounts and is likely to increase even further.
FAO, 2005 data indicated that world trade in honey during the 1990s amounted to more than
300,000 MT per annum with Western Europe and the United States in particular being major
importers at an average price of about US $1500 per MT. World trade in beeswax amounted
to about 10,000 MT per annum with Western Europe accounted for about one half of total
imports with the world price average about US $ 4000 per MT.
In 2004 estimated world production of honey was higher than the medium term average at
1.38 million MT. Beeswax productions was also higher at 60,153 MT (FAO, 2005) In
comparison to these amounts, production in sub Saharan Africa (Africa South of the Sahara

16
but excluding the Republic of South Africa) was 135,375 MT of honey and 14,165 MT of
beeswax, most of which came from a very few countries (Table 1).
Much of African honey production is gathered rather than framed, private sector modern
production with many movable frame hives and inputs such as winter or out of season feeding
and use of disease prevention measures is largely unknown in sub Saharan Africa. The use of
hives with removable top bars has been promoted intermit and often in a not very coordinated
way in some countries by government extension services (Fadare, 2003). Almost all African
honey and beeswax is traditionally which is almost synonymous with inefficiently. The
problem with all these traditional hives is that they engender low output; in Ethiopia, for
example, there were an estimated 4.55 million hives in 2005 (CSA, 2006) which, based on
FAO, 2005 data for National production, is equivalent to 8.85kg honey and 0.95 kg wax per
hive per year, although better beekeepers using long hives can achieve 15 kg per hive per year
in more favorable areas. In addition to low yield traditional hives often have to be destroyed
in the process of extraction.
Table 1. Production of honey and beeswax (metric tones) in Africa and selected African Countries in 2005
Country Honey Beeswax
Angola 23,000 2,000
Burundi 240 45
Cameroon 3,000 287
Central A.R 13,000 690
Chad 960 0
Ethiopia 39,000 4,300
Guinea 600 0
Guinea-Bissau 65 100
Kenya 21,000 2,400
Madagascar 390
Source: FAOstaticallydata,2005

17
Africa production represents only 9.8% of the World production of honey and 23.5% of
beeswax. Exports of honey from sub Saharan Africa countries in 2004 were 184 metric tones
valued at US$ 469,000 whereas in the same year there were imports of 874MT valued at US$
2,708,000. Exports of beeswax from sub Sahara Africa in 2004 were 721MT valued at US$
465,000 but in the same year there imports of 255 MT valued at US$ 224,000 (FAO, 2005).
These amounts of exports and imports are minimal in World trade figures. They show,
however, that African honey is sold on the World market at a price of US$ 2,549 per MT
whereas imports are valued at US$ 3,098 per MT and beeswax is sold at US$ 645 per MT and
bought at US$ 878 per MT. There thus seem to be considerable opportunities not only for
increasing the quantity of African’s major hive products but also for improving their quality.
Total estimated honey production for Ethiopia as indicated by the International Trade Center
(ITC) 1986, ranges from 19,400-21,000 tones per annum between1976-1983. This contributed
23.28% to the total Africa honey production and 2.03% to the total world production in 1976.
This went up to 23.58% and 2.13% for the total Africa and world honey production,
respectively in the year 1983.
Furthermore, there has been an increased production of honey over the period 1984-1994, i.e.,
from 21.480 tones in 1984 to 23, 700 tones in 1994 (Hartman, 2004).The current honey
production is estimated at 24,600 tones per year. The estimated is based on a 65% and 75%
occupational efficiency of 7.5 million traditional hives and 20 thousand framed hives
respectively.
Honey is almost exclusively used (80%) for local consumption, to a very large extent for the
brewing of mead, also called “Tej” (local beverage). Even though honey satisfies local
demand it is so crude that it will not compete in the international market. However, an
average of 3.05 tones per annum has been exported to neighboring countries over the years
1984-1994 (ITC, 1996). As indicated in Table 2, on average between 1998 and 2003, 307.22
tones of honey worth 88,679 Birr has been exported yearly.

18
Table 2. Export of honey 1998 – 2003
Year
Honey (in tones)
Value (in Birr)
1998 1781.10 78,188 1999 100.80 29,245 2000 761.20 221,363 2001 129.00 30,922 2002 333.90 93,269 2003 340.30 79,087
Total
1843.30
532,074
Average
307.22
88,679
Source: Ministry of Trade and Industry, Annual External Trade Statistics; 1999-2003
Another valuable hive product obtained from honeybees is beeswax. It is largely collected
from traditional hives rather than the moveable frame hives. The wax yield from traditional
hives is 8-10 percent of the honey yield, compared to 0.5-2 percent from frame hives. The
annual production of wax is estimated at 3,200 tones. This estimated is without considering
much of the beeswax produced in remote areas where it is usually wasted. Thus, after China,
Mexico and Turkey, Ethiopia is the fourth largest wax producing country with an estimated 3,
000 tones per annum.
With regarding export of beeswax, Ethiopia is one of the biggest wax exporters to the world
market. An average of 270 tones was exported per year over the period 1984-1994 which in
turn generated over ETH Birr 2 million per annum to the national economy. Currently, the
annual turn-over of the apicultural industry varies between 185 and 450 million ETH Birr, of
which only 5 million Birr worth beeswax exported (EEPD, 2006). As indicated in Table 3, the
on average between 1998 and 2003, 37,477.616 tones of beeswax worth 7,321,680.10 Birr the
country has been exported yearly.
19
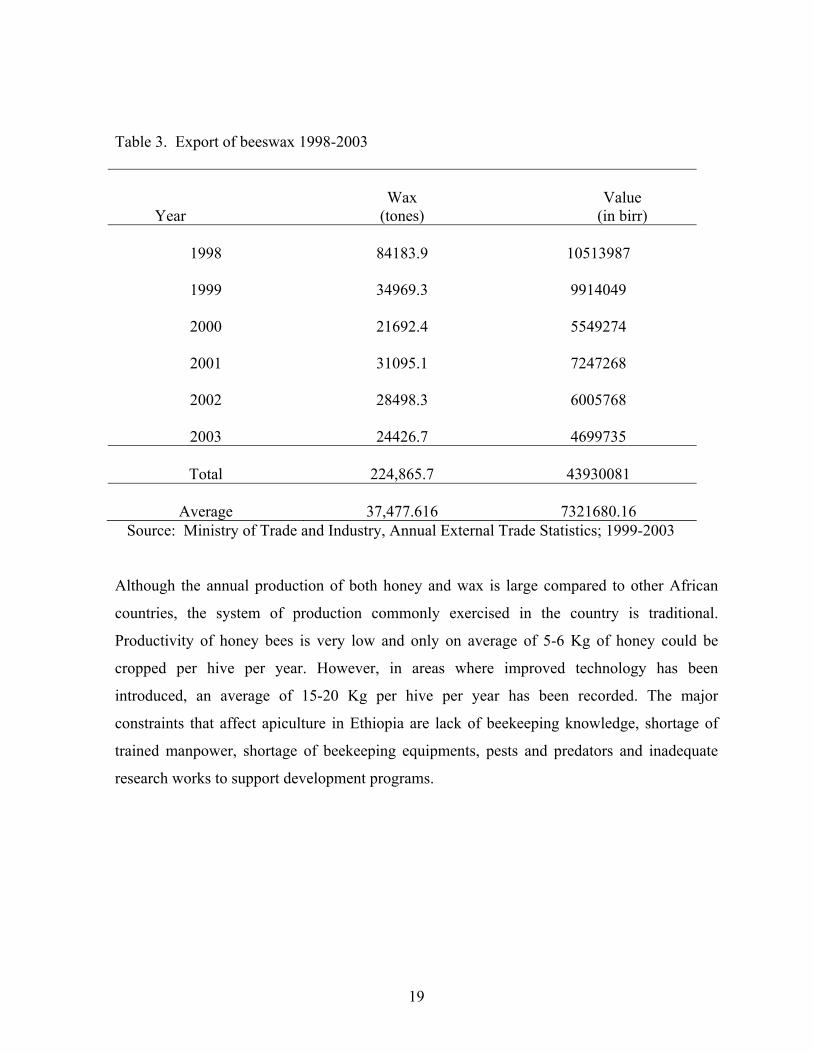
Table 3. Export of beeswax 1998-2003 Year
Wax
(tones)
Value
(in birr)
1998
84183.9
10513987
1999
34969.3
9914049
2000
21692.4
5549274
2001
31095.1
7247268
2002
28498.3
6005768
2003
24426.7
4699735
Total
224,865.7
43930081
Average
37,477.616
7321680.16 Source: Ministry of Trade and Industry, Annual External Trade Statistics; 1999-2003
Although the annual production of both honey and wax is large compared to other African
countries, the system of production commonly exercised in the country is traditional.
Productivity of honey bees is very low and only on average of 5-6 Kg of honey could be
cropped per hive per year. However, in areas where improved technology has been
introduced, an average of 15-20 Kg per hive per year has been recorded. The major
constraints that affect apiculture in Ethiopia are lack of beekeeping knowledge, shortage of
trained manpower, shortage of beekeeping equipments, pests and predators and inadequate
research works to support development programs.

20
3. RESEARCH METHODOLOGY
The study was conducted in Atsbi Wemberta district, one of the pilot Learning Sites of
Improving Productivity and Market Success (IPMS). In this study area, honey has been
identified as one of the major important marketable commodities. Honey production is
increasing in the study area due to the introduction of modern beehives and bee forages
because of area closure.
3.1. Description of the Study Area Atsbi Wemberta district is located about 65km North East of the regional State capital,
Mekelle. There are sixteen Peasant Associations (PAs) and two dwellers associations in the
district with a total of 41,398 household heads (IPMS, 2005). According to the information
from district Agricultural and Rural Development Office (2008), the total population of the
district was 112, 639 of which 55,359 (49.15%) are males and 57,280 (50.85%) are females.
Urban and rural population is 9,609 and 103,030 respectively. Altitude in the area ranges from
918 to 3069 m and 75% of the district is upper highlands (2600 masl or above) and only 25%
is midlands (between1500 and 2600masl). The district has a total area of about 1223 sq km.
The areas of the sixteen PAs ranges from 26.5 sq.km to 209 sq.km. Generally the district has
70% and 30% Dega and Weina Dega weather condition, respectively. The current land use
pattern includes 89,185ha forest and bush land, 13,059.45ha cultivated land, 8,742ha grazing
land and the rest for others (ARDO, 2008).
Atsbi Womberta is one among the districts in the region that border the Afar regional state
shortage of rainfall is a major constraint of agricultural production in the district. Rainfall is
usually intense and short duration. The annual rainfall is between 500mm to 624mm. Hence it
is one of the drought prone districts in the region. The area receives bimodal rainfall belg
(short rains) from November to March and Meher (long rains) from June to September.
According to IPMS (2005), the district is classified into two major farming systems,

21
pulse/livestock system (Barley, Wheat, pluses and small ruminants) and apiculture/livestock
system (livestock and apiculture system). Nine of the sixteen Peasant Associations are under
pulse/livestock system and are found starting from the central southern parts of the district to
the tip north. Barley is the dominant crop in the area followed by wheat and pulses. The
altitude of these PAs in this farming system is mostly around 2600 mals or higher and as
result of this, frost is one of the major production problems in the area. The important
marketable crop commodities in this area are pulses (faba been, field pean and lentils, in the
order). Sheep fattening, dairy apiculture (queen rearing) and horticultural crops are also other
important marketable commodities in the district.
The average household land holding of the area is about 0.5 ha of which about a third of the
land area could cover by the pulses (IPMS, 2005).Temperate fruits (apple, pear and plum) are
also potential fruit crops that could be grown in this farming system. Bee queen rearing is also
important in this farming system while honey production is more important in the
escarpments to the east. The district has a long escarpment of more than 60 km adjacent to the
Afar region. The apiculture/livestock farming system is where altitude is below 2600 masl
and major grown in this area are wheat, teff and barley. There are 7 PAs that belong to this
farming system.
According ARDO (2008), honey production from local hives is on average about
8.4kg/harvest as opposed to the improved hives that can yield 20-35kg/harvest and it is
possible to harvest twice a year. Price of white honey could range from 30 Birr/kg to 45
Birr/kg from the production season (surplus) to deficit season. The population of livestock in
Atsbi Wemberta district is 52,482, 86,006, 12,375, 10,882 heads of cattle, sheep, goats and
equines, respectively. The number of poultry is estimated at about 47,265. Out of the cattle
population, the district has an estimated 16,415 drought oxen. There are 18,567 bee colonies
of which 5,740 are improved box hives. There is also bee forage planting practices in the
study area such as supplementary feeding which includes sugar, barley flour, peas and beans
flour. In both the traditional and modern beehives supplementary feed is provided. In the
study area there is also an extension activity which encourages beekeepers to grow indigenous
bee forage such as (in Tigrigna) “gribiya” (Hypostus ariculata) and “tebeb” (Basium

22
clandiforbium). These plants are herbaceous and have high contribute in to honey production
of the area.
3.2. Method of Data collection
In order to get the over all picture of honey producers, traders, and consumers of the honey
marketing chain in the study area, the study was used both primary and secondary data. The
primary data were collected using two types of questionnaires, one for farmers (honey
producers) and the other for honey traders. The primary data collected from farmers focused
on factors affecting honey market supply, size of output, market information, credit access,
access to market, number of beehives owned, honey production cost, annual return from
honey, extension service, annual income from non-honey source and demographic
characteristics of the household. Moreover, the questionnaire for traders includes type of
business (wholesaler, retailer, assembler, etc.), buying and selling strategies, initial capital,
current working capital, source of working capital, source of market information,
demographic characteristics of the traders and other related data were collected.
Independent questionnaires were designed for both honey producers and traders. Enumerators
who have college diploma working in the district rural area as development agents were
recruited and trained on the techniques of data collection. After they were made aware of the
objective of the study and content of the questionnaires, a pre-test was conducted under the
supervision of the researcher. Some adjustments were made to the questionnaire and the final
data used in the research were collected under continuous supervision to ensure an appropriate
data collection. In addition to the questionnaire, an informal survey in the form of Rapid
Market Appraisal (RMA) technique was employed using checklists for both farmers and
traders to obtain additional supporting information for the study. Secondary data were
collected from different published and unpublished sources, such as government institutions,
the District Office of Agriculture and Rural Development (DOARD), Tigray agricultural
marketing promotion agency (TAMPA), reports, bulletins, and websites were consulted to
generate relevant secondary data on honey production and marketing.

23
3.3. Sample Size and Method of Sampling
The sample frame of the study was the list of households in Atsbi Wemberta District and PAs,
which are found in the district. A two stage sampling procedure was employed to select a
specific honey producer household. First, three potential honey producer PAs from the
District were selected through purposive sampling method. In the second stage, using the
population list of honey producer farmers from sample PAs, the intended sample size was
determined proportionally to population size of honey producer farmers. Then the 120
representative household were randomly selected using systematic random sampling
technique (Table 4).
Table 4. Sample distribution of farmers (honey producers)
Name of PA honey producer Households Sample households
Barkaadisewha 554 40
Hayelom 700 50
Dibabakorea 416 30
Total 1670 120
Source: Survey result, 2008
The sites for the trader’s survey were market towns, which were selected based on the flow of
the honey produce in the study district. Three market towns (Mekelle, Wukro and Atsbi) were
sampled. The sample size of honey traders were fourteen, hence, the number of permanent
honey traders in the main honey marketing channel in the study area were very limited, and
almost all of them were employed in the traders’ survey.

24
Table 5. Sample distribution of honey traders’
Market center
Retailers
Honey collectors
Process/retailer
Total
Mekelle
8
1
9
Wukro
2
2
Atsbi
1
2
3
Source: Survey result, 2008
3.4. Method of Data Analysis
In this study, both descriptive and econometric methods of data analysis were employed.
Descriptive statistics like mean, standard deviation and percentiles have been used to explain
basic characteristics of the channel members besides econometric models. For this study, the
data collected from the sampled producers and traders was first analyzed using descriptive
statistics followed by determinants analysis of honey supply using econometric model.
3.4.1. Market structure
Examining the nature of horizontal relationships between similar enterprises is analogous to
analyzing the structure of the market as defined by the Industrial Organizational School.
Analyzing market structure entails understanding of those characteristics of the organization
of the market influencing the nature of competition and pricing (Scarborough and Kydd,
1992).
Structural characteristics like market concentration, industry maturity, product differentiation,
government participation, barriers to entry and exit, will be some of the basis to be
considered. In this regard, one can categorize markets as perfectly competitive, monopolistic,

25
or oligopolistic (Bain, 1968; cited in Pomeroy and Trinidad, 1995). Among the major
structural characteristics of a market is the degree of concentration, that is, the number of
market participants and their size distribution and the relative ease or difficulty for market
participants to secure an entry into the market (Gebremeskel et al., 1998).
Market Concentration- Market concentration is defined as a number and size distribution of
sellers and buyers in the market. Other factors, such as the firm’s objectives, barriers to entry,
economics of scale, and assumptions about rival firm’s behavior, will all be relevant in
determining the degree of concentration, the relationship between concentration and behavior
and performance (Scherer, 1980).
∑
=i
ii V
VMS (1)
Where MSi = Market share of buyer i.
Vi = Amount of product handled by buyer i.
∑ iV = Total amount of product
∑=
=r
iisC
1
(2)
Where C = concentration ratio handle
Si = percentage share of ith firm
r = number of largest firm for which the ratio is going to be calculated
3.4.2. Market conduct
Market conduct refers to the behavior of firms or the strategies used by the firms in their
pricing, buying and selling activities. There are no agreed up on procedures for analyzing the
element of market conduct. Market conduct defines the conditions which make possible
exploitative relationships between sellers and buyers. This is done via unfair price setting

26
practices which Smith (1985) classified as collusive, predatory, or exclusionary. A systematic
way to detect indication of unfair price setting practices and the condition under which
practices are likely to prevail. Moreover, they cover the following topics:(i) the existence of
formal and informal marketing groups that perpetuate such practice;(ii) formal and informal
producer groups that affect bargaining power; (iii )the distance from the major market and its
impact on prices; and (iv )the feasibility of utilizing alternative market outlets. The questions
also provide an indication of the type of data needed and data collection procedures.
3.4.3. Market performance
Market performance refers to the impact of structure and conduct on prices, costs, and volume
of output (Pomeroy and Trinidad, 1995). Marketing efficiency is essentially the degree of
market performance. It is defined as having the following two major components: (i) the
effectiveness with which a marketing service would be performed and (ii) the effect on the
costs and the method of performing the service on production and consumption. These are the
most important because the satisfaction of the consumer at the lowest possible cost must go
hand in hand with maintenance of a high volume of farm output (Ramakumar, 2001).The two
approaches to measure marketing performance are: marketing margin and the analysis of
market channel efficiency.
Marketing Margin- In a commodity subsystem approach, the institutional analysis is based
on the identification of the marketing channels. This approach includes the analysis of
marketing costs and margins (Mendoza, 1995). A marketing margin can be defined as a
difference between the price paid by consumers and that obtained by producers; or as the
price of a collection of marketing services that is the outcome of the demand for and supply of
such services (Tomek and Robinson, 1990). It measures the share of the final selling price that
is captured by a particular agent in the marketing chain (Mendoza, 1995). It, in its simplest
form, can be defined as the difference between prices paid for a commodity (e.g. bread) by
consumers at a retail level, and prices received by farmers when they sell their commodity
(e.g. wheat) to assemblers or other first handlers. Measured in this form, the margins reflect

27
the amount of services added to a commodity once it leaves the farm and sits on a shelf in a
retail outlet in a form that is acceptable, useful, and appealing to consumers (Goetz and
Weber, 1986).
Marketing margin is most commonly used to refer to the difference between producer and
consumer prices of an equivalent quantity and quality of a commodity. However, it may also
describe price differences between other points in the marketing chain, for example between
producer and wholesale, wholesale and retail, prices (Scarborough and kydd, 1992). The size
of marketing margins is largely dependent upon a combination of; the quality and quantity of
marketing services, and the efficiency with which they are undertaken and priced. The quality
and quantity of marketing services depends on supply and demand of marketing services
and/or the degree of competition in the market place. The costs of service provision depend
on both exogenous and endogenous factors and the efficiency are determined by the extent of
competition between marketing enterprises at each stage.
According to Trotter (1992), the benchmarks to which results of marketing margin to be
compared with are, the assumption of the margin to be equivalent to transfer cost as well as
the constancy of margin per unit of product. Large gross margins may not express high profit
but rather; increased qualities and quantities of service; low labor, capital and management
productivity. Conversely, small gross margins may co-exist with inefficient use of resource;
poor coordination and consumer satisfaction; and disproportionate profit elements. Thus,
higher marketing margins resulting from increased services, including better coordination,
may leave producers and consumers better off, and low margins may be due to low
productivity. Therefore, in using market margin analyses to assess the economic performance
of markets, it is always preferable to deconstruct them in to their cost and return elements
(Scarborough and Kydd, 1992). However, the challenges of data availability on costs usually
create a problem.

28
Tomek and Robinson (1990) also warned that marketing margins provide only one point of
reference in the evaluation of performance and should be compared with measures of profits
earned by marketing firms to determine whether or the margins are excessive. All these
reviewed literatures advised not to exclusively depend on marketing margin for decision
making but to support with other tools. Hence, in this study four parameters are included to
judge an overall market performance. When there are several participants in the marketing
chain, the margin is calculated by finding the price variations at different segments and then
comparing them with the final price to the consumer. Consumer price is the base or common
denominator for all marketing margins (Mendoza, 1995). The relative size of various market
participants’ gross margins can indicate where in the marketing chain value is added and/or
profits are made.
Marketing costs and margin analysis is especially comparison of prices at different levels of
marketing over the same period. Computing the total gross marketing margin (TGMM) is
always related to the final price or the price paid by the end consumer and is expressed in
percentage (Mendoza 1995).
price Consumer
price producerprice ConsumerTGMM )3(100×−
=
It is use full to introduce here the idea of “producer participation”, “producer portion” or
“farmers portion”, or ”producers gross margin” (GMMP) which is the proportion of the price
paid by consumer that belongs to the producer. Producer that act as a middle men also receive
an additional marketing margin.
Consumer theby paid Price
margin gross MarketingConsumer theby paid iceGMMp 100Pr×
−= (4)

29
In marketing chain with only one trader between producer and consumer, the net marketing
margin (NMM) is the percentage over the final price earned by the intermediaries as his/her
net income once his marketing costs are deducted.
100 nsumer by the coPrice paid
CostMarketing inGross margNMM )5(×−
=
Another parameter related to marketing margin is the producer’s share. The producer’s share
is the ratio of producer price (ex-vessel) to consumer price (retail) (Mudiantono, 1990). The
producer’s share can be expressed as
)6P
1P
( MMPPSrr
x −==
Where: PS =the producer’s share
Px = producer price of honey Pr = Consumer price of honey
MM = Marketing margin
The above equation tells us that a higher marketing margin diminishes the producer’s share
and vice-versa. It also provides an indication of welfare distribution among production and
marketing agents. The magnitude of marketing cost depends on factors such as time and place
of marketing, market conditions, and the market channel involved. The marketing will be
composed with marketing service cost and the result will be interpreted. Margins at each stage
will be computed and the share will be compared.

30
3.4.4. Supply function
A number of studies investigated about factors that mainly affect marketable supply of
agricultural commodities. Among others, Wolday (1994) pointed out the major factors that
influenced the marketable supply of teff, maize and wheat at Alaba Siraro district using cross-
sectional data and he investigated the relationship of farm level marketable supply of cereals
to capture the influence of the independent variables on the marketable supply of food grain,
he adopted multiple regression analysis with both dummy and continuous variables as
explanatory variables. In his study, he found out that among the independent variable, access
to market, size of output and family size had affected the marketable supply of food grain at
the district. Another study by Wolelaw (2005) find out the major factors that affect the
marketable supply of rice at Fogera district using multiple linear regression model. He
investigated the relationship between the determinant factors of supply and the marketable
supply of rice and her study revealed that the current price, lagged price, amount of rice
production at farm level and consumption at household level had influenced marketable
supply of rice at the district.
Similar study undertaken by Kinde (2007) indicated that, the major factors that affect
marketable supply of sesame in Metema district by using cross-sectional data with dummy
and continuous explanatory variables. In his study he implemented multiple linear regression
model to identify the relationship between the marketable supply of sesame and the
hypothesized explanatory variables, hence his study acknowledged that amount of sesame
productivity, use of modern inputs, number of language spoken by the household head,
number of oxen owned, sesame area and time of selling of sesame influenced marketable
supply of sesame positively. Another related study by Rehima (2006) identified that the key
factors that affecting marketable supply of red pepper at Alaba and Siltie districts of SNNPRS
using cross-sectional data with both dummy and continuous independent variables. In her
study, she employed Tobit model and came up with the finding that distance to the market,
frequency of contacts with extension agents, quantity of pepper produced and access to

31
market information influenced marketable supply of pepper positively at the district. Recent
studies are commonly using regression models to estimate the supply function. Likewise for
this particular study, Linear multiple Regression model has been fitted to analyze and estimate
supply of honey in Atsbi Wemberta district.
Econometrics Model Specification
Following Green (2003), the multiple linear regression model is specified as Y=f(price, honey
output, access to market information, access to extension services, education level,
experience in beekeeping, sex, access to credit, age, etc…).The econometric model
specification of supply function in matrix notation is estimated by
)7( UXY +=β Where Yi = honey supplied to the market =β a vector of estimated coefficient of the explanatory variables
X= a vector of explanatory variables
Ui = disturbance term
3.4.5. Determinants of marketable supply of honey production in Atsbi Wemberta Tomek and Robinson (1985) suggested that careful definitions of terms are essential. Total
supply in a specific period may depend not only on current production but also on carry over
stocks and imports. It is not possible to include an exhaustive set of variables that could affect
the household level of marketable supply of the product. But, in this particular study, an
attempt was made to estimate determinants of marketable supply of honey production in Atsbi
Wemberta district. In the course of identifying factors influencing honey supply, the main task
is to analyze which factor influences and how? Hence, potential variables which are supposed
to influence the quantity of honey supply need to be explained. Accordingly, the main

32
variables expected to have influence on quantity supply of honey are explained in the
following manner.
3.5. Definition of Variables
3.5.1. Dependent variable
Quantity Supplied (QTSUPP): It is a continuous variable that represents the dependent
variable; the actual supply of honey by individual households to the market, which is
measured in kilograms.
3.5.2. Independent variables: The explanatory variables expected to influence the dependent
variable are the following:
Quantity of honey produced (QTYHP): It is a continuous variable measured in kilograms.
The variable is expected to have positive contribution to the amount of honey supplied to the
market. Farmers who produce more output per box beehives are associated to supply more
honey to the market than those less produce.
Distance to nearest market (DSNMKT): It is a continuous variable and is measured in
kilometers which farmers spend time to sell their product to the market. If the farmer is located in
a village or distant from the market, he is weakly accessible to the market. The closer to the
market the lesser would be the transportation cost and time spent. Therefore, it is hypothesized
that this variable is negatively related to marketable surplus of honey production. A similar study
was conducted by Holloway et al., (1999) milk-market development in the Ethiopian highlands.
His result indicates that distance-to market causes market surplus to decline. Similar issue was
studied by Wolday (1994) on food grain market in the case study of Alaba indicated negative
relationship between distance from the household residence to grain market and volume of
marketed food grain. Further more, study conducted by Abonesh (2005) and Rehima (2006)
indicated similar results.

33
Price of honey in 1999 E.C. (PRICE 99): It is a continuous variable and is measured in Birr
per kilogram. This variable is expected to influence marketable supply positively. When the
price of the product is promising, farmers are motivated to take their produced to the market.
This makes the supply to be directly related to the current market price.
Age of the household head (AGE): Age is demographic variable and is measured in years.
The expected influence of age is assumed positive; it is a proxy measure of farming
experience of household. Aged households are believed to wise and acquire skills in
beekeeping hence produce much and supply more.
Sex of the household head (SEX): This is dummy variable that takes a value of one if the
household head is male and zero otherwise. Both men and women participate in beekeeping
and production of honey. Male households have been observed to have a better tendency than
female household in beekeeping and production and supply of honey due to obstacles such as
lack of capital, and access to credit and extension services. Tshiunza et al., (2000) discussed the
determinants of market production of cooking banana in Nigeria. In their study the male farmers
tended to produce more cooking banana for market than female farmers.
Experience in beekeeping (EXP): This is a continuous variable, it refers to the number of
years the farmer engaged in beekeeping activity and is expected to influence supply of honey
to the market positively. As farmers got more experience in beekeeping, the probability of
increasing production and hence supply would be higher. Moreover, farmers with longer farm
experience will have a cumulative knowledge of the entire farming environment. This in turn
enables them to adopt the use of improved box beehives earlier than farmers with short
beekeeping farm experience.
Access to market information (ACCMIF): This is measured as a dummy variable taking
value of 1 if the producer had access to market information and zero otherwise. It has been
hypothesized that to affect positively marketable honey supply of beekeeping household. The

34
better information farmers had out is likely to supply more honey to the market. The general
idea is that maintaining a competitive advantage requires a sound business plan. Again,
business decisions are based on dynamic information such as consumer needs and market
trends. This requires that an enterprise is managed with due attention to new market
opportunities, changing needs of the consumer and how market trends influence buying
(CIAT, 2004).
Extension service access to honey production (EXACC): This variable is measured as a
dummy variable taking a value of one if the beekeeping household has access to honey
production extension service and zero otherwise. It is expected that extension service widens
the household’s knowledge with regard to the use of improved box beehives technologies and
has positive impact on honey volume of marketable surplus. Farmers that have frequently
contact with DAs (development agents) will have better access to information and could adopt
better technology that would increase their marketable supply of honey.
Education level of the household (EDLHH): It is a continous variable and refers to the formal
schooling of a respondent during the survey period. Those household heads who had formal
education determines the readiness to accept new ideas and innovations, and easy to get supply,
demand and price information and this enhances farmers’ willingness to produce more and
increase volume of sales. Holloway et al., (1999) observed that education and visits by an
extension agent had significant and positive effect on quantity of milk marketed in Ethiopian
highlands.
Access to credit (ACC): Access to credit is measured as a dummy variable taking a value of
one if the household has access to credit and zero otherwise. Among other things, credit
access is assumed to have a positive significant to the marketable supply of honey, because a
farmer who has access to credit service can purchase improved box beehives and hence
increase the production and marketable supply of honey at the district level.

35
Table 6. Description of the dependent and independent variables used in the model Variables used
in the model
Explanation Category Value
QTSUPP Quantity supplied Continuous Kilograms
QTYHP Quantity of honey produced Continuous Kilograms
DSNMKT Distance to nearest market Continuous Kilometers
PRICE99 Price of honey in1999 E.C. Continuous Birr
AGE Age of the household head Continuous Number of years
SEX Sex of the household head Dummy 0=female, 1=male
EXP Experience in beekeeping Continuous Number of years
ACCMIF Access to market information Dummy 0=no, 1=yes
EXACC Extension service Dummy 0=no, 1=yes
EDLHH Education level of the household
head
Continuous Years of schooling
CACC Access to credit Dummy 0=no, 1=yes
When the assumptions of the Classical Linear Regression (CLR) model are despoiled, the
parameter estimates of the OLS model may not be Best Linear Unbiased Estimator (BLUE).
Hence, it is important to check the presence of multicollinearity and heteroscedasticity among
the variables that affect the supply of honey in the study area. Therefore, before fitting
significant variables into the model for analysis, it was necessary to test multicollinearity
problem among continuous variables and check associations among discrete variables, which
seriously affects the parameter estimates. As Gujarati, (2003) pointed out multicolliniarity
refers to a situation where it becomes difficult to identify the separate effect of independent
variables on the dependent variable because there exists strong relationship among them. In
other words, multicollinearity is a situation where explanatory variables are highly correlated.
There are two measures, which suggested testing the existence of multicollinearity. These are
Variance Inflation Factor (VIF) for a continuous variables association and Contingency
Coefficients (CC) for dummy variables association.
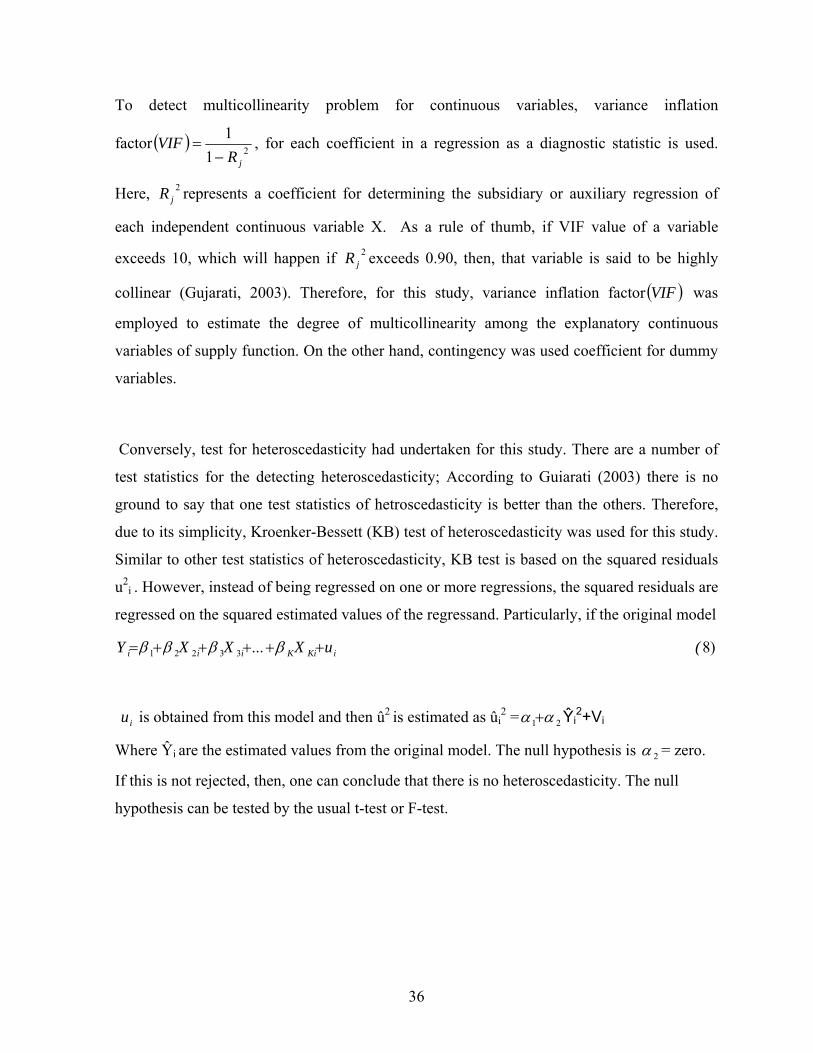
36
To detect multicollinearity problem for continuous variables, variance inflation
factor ( ) 211
jRVIF
−= , for each coefficient in a regression as a diagnostic statistic is used.
Here, 2jR represents a coefficient for determining the subsidiary or auxiliary regression of
each independent continuous variable X. As a rule of thumb, if VIF value of a variable
exceeds 10, which will happen if 2jR exceeds 0.90, then, that variable is said to be highly
collinear (Gujarati, 2003). Therefore, for this study, variance inflation factor ( )VIF was
employed to estimate the degree of multicollinearity among the explanatory continuous
variables of supply function. On the other hand, contingency was used coefficient for dummy
variables.
Conversely, test for heteroscedasticity had undertaken for this study. There are a number of
test statistics for the detecting heteroscedasticity; According to Guiarati (2003) there is no
ground to say that one test statistics of hetroscedasticity is better than the others. Therefore,
due to its simplicity, Kroenker-Bessett (KB) test of heteroscedasticity was used for this study.
Similar to other test statistics of heteroscedasticity, KB test is based on the squared residuals
u2i . However, instead of being regressed on one or more regressions, the squared residuals are
regressed on the squared estimated values of the regressand. Particularly, if the original model
)8...33221 ( uXXXY iKiKiii +++++= ββββ
iu is obtained from this model and then û2 is estimated as ûi
2 = 21 αα + Ŷi2+Vi
Where Ŷi are the estimated values from the original model. The null hypothesis is 2α = zero.
If this is not rejected, then, one can conclude that there is no heteroscedasticity. The null
hypothesis can be tested by the usual t-test or F-test.

37
4. RESULTS AND DISSCUSSIONS
This section presents the results of descriptive and econometric analysis. The descriptive
analysis describes the general characteristics of the sampled farm households and honey
traders, and the honey marketing chains. The econometric analysis is used to identify factors
that affect supply of honey in Atsbi Wemberta district.
4.1. Socio-economic Characteristics of Sample Households
This section provides the profile of the sample respondents with regard to their age, sex,
religion, marital status and education level.
4.1.1. Household characteristics
Almost 100 percent of the respondents were Orthodox Christian. The way people interact
with each other is reflected in their social norms and their culture. About 50 percent of the
households heads were in the age group of 26-44 with an average age of 36.33 and 43.3
percent of the sample respondent were in the age group of 45-62 years with an average age of
52.52 (Table 7). About 7 percent of the household heads lie in the age range of 63-80. The
overall mean age of the respondents was 45.6.

38
Table 7. Distribution of sample respondents by age of household heads Variable category
Barika (n=40)
Hayelom(n=50)
Dibab (n=30)
Total (n=120)
n
%
n
%
n
%
n
%
Age group (in years)
26-44
19
38
24
60
17
56.7
60
50
45-62 17
42.5 22 44 12 43.3 52 43.3
63-80 4
10 4 8 8 6.7
Mean age(years)
45.6
Mean family size(No) 6.03
5.48
5.2
5.6
Source: Survey result, 2008 The average family size of the sample farmers during the survey period was 5.6 persons, with
maximum and minimum family size of nine and two persons, respectively. These figures are
6.03, 5.48, and 5.2 persons for Barikaadisewha, Hayelom and Dibabakoren in that order
(Table 7). Out of the total sampled households in the study area, 96 percent were male-headed
(Table 8). This conforms to the common thinking that beekeeping is men’s job due to labor
requirements. In line with this, Hartmann (2004) reported that in Ethiopia traditionally
beekeeping is men’s job. Regarding the marital status, most of the household heads surveyed
(97 %) were married with only 2.5 percent divorced household head.

39
Table 8. Distribution of sample respondents by sex of household heads
Variable
Barika (n=40) Hayelom (n=50) Dibab (n=30) Total (n=120)
Sex
n % n % n % n %
Male
37
92.5
48
96
30
100
115
95.8
Female
3
7.5
2
4
5
4.2
Source: survey result, 2008
The average number of years of schooling completed was 1.92 years for the respondents.
Among the sampled respondents, about 21 percent were illiterate, while a greater majority
(72.5%) of them can read and write (Table 9). The rest of the respondents attended from
elementary to junior School. More specifically, 4.2 and 2.5 percent of the sample respondents
had attended elementary and junior schools respectively.
Table 9. Education status of the households
Variable category
Barika (n=40) Hayelom(n=50) Dibab (n=30) Total (n=120)
n % n % n % n %
Education
Illiterate
9
22.5
13
26
3
10
25
20.8
Read
&Write
29
72.5
34
68
24
80
87
72.5
1-6 grade
1
2.5
2
4
2
6.7
5
4.2
7-8 grade
1
2.5
2
6.7
3
2.5

40
Source: Survey result, 2008
4.1.2. Honey production characteristics
Honey production is an important source of household income in the region. Atsbi Wemberta
is one of the districts of Trigray Region with high potential for beekeeping development.
According to Atsbi Wemberta BOARD (2008), the district has 18,567 honeybee colonies
making it one of the high potential areas for developing beekeeping in the region as well as in
the country. The annual crude honey produced in 2007/08 per traditional box beehives was
12.77 Kg and that of improved one was 35.75 Kg. The number of honeybee colony holding
size for the production of honey per household by PAs in the sampled three PAs is
summarized in table10. The entire 120 sample farmer’s honeybee colony holding size in the
study area ranges from 1 to 12 box beehives and the majority (62.5%) of sample farm
household owned 1-3 bee colonies during the survey period. While 35 and 2.5 percents of the
sample households honey bee colony holding size was 4-6 and greater than 6, respectively
(Table10).
Table 10. Honey bee colony holding size of sample farmers Variable category
Barika (n=40) Hayelom (n=50)
Dibab (n=30) Total (n=120)
n % n % n % n %
Bee colony holding size
(number)
1-3
27
67.5
31
62
17
56.7
75
62.5
4-6
12 30 18 36 12 40 42 35
> 6 1 2.5 1 2 1 3.3 3 2.5
Mean
3.45
Source: Survey result, 2008

41
In order to improve the quality and quantity of honey produce, the Agricultural and Rural
Development (ARD) Office and different non-governmental organizations have introduced
improved box hives in Atsbi Wemberta. According to the secondary data obtained from the
district Office of Agriculture and Rural Development, out of the total 5740 improved box
beehives found in the district, 1670 or about 30 percent of the improved box beehives was
concentrated in the sampled three PAs at the time of survey.
4.1.3. Experience in beekeeping
The level of beekeeping experience is taken to be the number of years that an individual was
continuously engaged in beekeeping activity. Majority (79%) of the respondents had about 3-
8 years of beekeeping experience (Table 11). The average years of experience for the entire
sample was about 7 years, the minimum and maximum years of experience being 3 and 30
years, respectively. This shows that the activity was introduce or started in the area about
many years ago. Having cumulative knowledge of how to keep bees is a prerequisite to the
ability to obtain process and use information related to the practice.
Table 11. Distribution of respondents by beekeeping experience
Variable category
Barika (n=40)
Hayelom (n=50)
Dibab (n=30)
Total (n=120)
_________________
Experience in bee keeping
n % n % n % n %
3-8 years
26
65
40
80
29
96.7
95
79.2
9-15 years
5
12.5
3
6
1
5.3
9
7.5
16-20 years
8
20
6
12
14
11.7
> 20 years
1
2.5
1
2
2
1.6

42
Source: Survey result, 2008
4.1.4. Beekeeping equipments and their sources During the survey, respondents were found to make use of box beehives that were drawn from
different sources. It was found that all improved box beehives were prepared in private small
and micro enterprise manufacturing centers organized by youth and provided by Agricultural
and Rural development Office of the district and different non- governmental organizations
on credit basis. At the time of survey, the price of one improved box beehives was Birr 664.
When asked to list the equipments they use including their prices and duration, the
respondents mentioned a wide range of accessories, prices and service periods that goes hand
in hand with beekeeping practices. The full ranges of accessories are the following: smokers,
gloves, bee veils, boots, water sprayer, bee brush, queen lauder, knife, honey container, honey
presser, and honey extractor. It was learnt during the survey that, apart from the known basic
hive tools many of the materials are either non-existent or kept by quite few number of
respondents. Particularly, the honey extractor was reserved at the center of the PAs for
demonstration purpose.
4.1.5. Honey production Honey is harvested in the study area from August to December (peak periods) in each year.
Among the total 120 respondents 75 percent of them harvest honey twice within this period of
the year, whereas 25 percent of the sample farmers respond that they harvest once in a year in
the same period. It was reported that any production obtained in the remaining periods of the
year would be left as food for the colony to strengthen it for the next harvest. As indicated in
table 12, the total annual production obtained by sample respondents from 414 improved box
beehives during the survey period was estimated at 11,865 kg.
Mean 6.9

43
Table 12. Distribution of respondents by annual total production obtained from their hives Honey production category
Barika (n=40)
Hayelom
(=50)
Dibab (n=30)
Total
(n=120)
n % n % n % n %
Honey production
25-65
3
7.5
31
62
2
7.7
36
30
66-110
7
17.5
18
36
10
33.3
35
29.2
111-156
28
70
1
2
13
43.3
42
35
157-200
1
2.5
3
10
4
3.3
>200
1
2.5
2
6.7
3
2.5
Total hives
414
Total annual
production (kg)
11865
Mean
production/hives (kg)
28.66
Mean
production/households (kg)
98.89
Source: Survey result, 2008

44
The annual average production of the sample respondents was 98.89 kg in the same year. On
the other hand, average production/improved box beehives was 28.66 kg (Table 12). The
survey result also shows that the production per households ranged from 25 kg to 415 kg, and
about 35 percent of respondents reported that their annual production during the time was
between 111 kg and 156 kg. In the same manner, 30 and 29.2 percent of respondents reported
that their annual production was between 25-65 kg and 66-110 kg, respectively. However,
only few respondents score the highest production (3.3 and 2.5) percent, in that order.
4.1.6. Annual income earned by sample respondent from the sale of the commodity
Atsbi Wemberta honey is used for consumption, not for tej making. During the survey, with
the given size of holding of improved box beehives, the total annual gross income of sample
farmers from the sale of 11,257 kgs of honey output at an average price of 37.35 Birr/kg was
estimated at Birr 420,448.95 (Table 13).

45
Table 13.Distribution of sample farmers by annual total gross income earned from the sale of honey
Income
category
Barika
(n=40)
Hayelom
(n=50)
Dibab
(n=30)
Total
(n=120)
n % n % n % n %
875-1875
26
52
2
6.7
28
23.3
1876-2875
2
5
15
30
7
23.3
24
20
2876-3876
1
2.5
9
18
4
13.3
14
11.7
Income
(in Birr)
3877-4876
6
15
10
33.3
16
13.3
4877-5876
30
75
5
16.7
35
29.2
>5876
1
2.5
2
6.7
3
2.5
Mean income (Birr)
3503.74
Source: Survey result, 2008
The annual gross income of respondents from the sale of honey output in the study area
ranged from Birr 875 to Birr 9720. As shown in Table 13, the maximum proportion (29.2%)
of sample respondents earned an annual gross income of between 4876 to 5876 Birr and about
23.3% of sample households obtained 875-1875 Birr. On the other hand, very few
46
respondents (2.5%) obtained annual income of above 5,876 Birr. Likewise, the mean annul
gross income per sample households during the survey time was about Birr 3504.
4.1.7. Access to services
Access to different services could be essential to improve production and productivity of
smallholder’s farmers. More specifically, access to credit, access to extension contact and
market information, are the most important factors that promote production and marketing of
honey production and thereby increase income of the producer are displayed below in table
14. However, from the total sample households who were asked to know whether they need
credit or not, about 72 percent of the sample households pointed out that they needed credit
for honey production but only 17.4 percent of them had received some amount of Birr (650-
3000 Birr). The reason for the low percentages of respondents who had access to credit
service was because of the high interest rate charged by private lenders (DCSI). Table 14 also
indicate that, even though farmers in the study area need credit to purchase different inputs to
enhance the quantity and quality of the honey production, the short repayment period as well
as the high interest rate of the service was not suitable to the individual respondents.
Moreover, at the time of survey it was understood that, the only private institution that deliver
credit in the district is DCSI.
Apiculture extension service is provided by the district Agriculture and Rural Development
Office. Each sampled PAs has three Development Agents (DAs). As a result, about 83 percent
of the sample respondents had access to extension service to promote the apiculture sector and
thereby increase the quantity and quality of the commodity at farm level (Table 14).
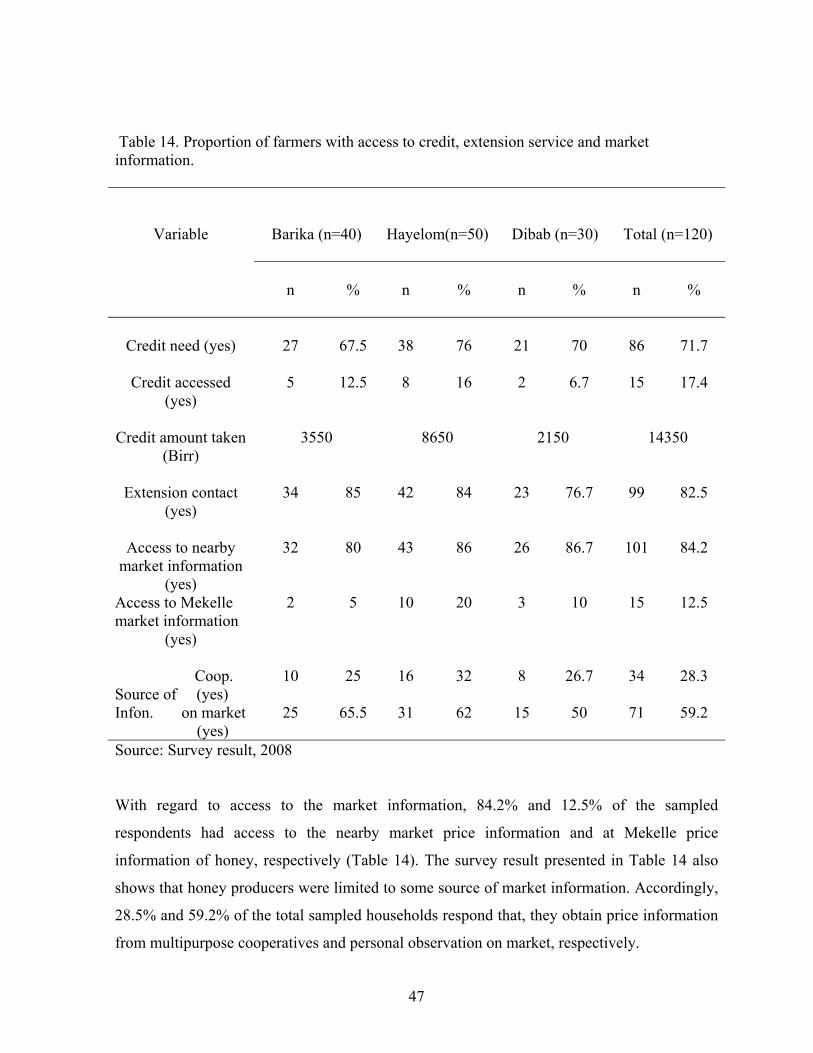
47
Table 14. Proportion of farmers with access to credit, extension service and market information.
Variable
Barika (n=40)
Hayelom(n=50)
Dibab (n=30)
Total (n=120)
n
%
n
%
n
%
n
%
Credit need (yes)
27
67.5
38
76
21
70
86
71.7
Credit accessed
(yes)
5
12.5
8
16
2
6.7
15
17.4
Credit amount taken
(Birr)
3550
8650
2150
14350
Extension contact
(yes)
34
85
42
84
23
76.7
99
82.5
Access to nearby
market information
32
80
43
86
26
86.7
101
84.2
(yes) Access to Mekelle market information
(yes)
2
5
10
20
3
10
15
12.5
Coop. Source of (yes) Infon. on market
(yes)
10
25 16 32 8 26.7 34 28.3
25
65.5 31 62 15 50 71 59.2
Source: Survey result, 2008 With regard to access to the market information, 84.2% and 12.5% of the sampled
respondents had access to the nearby market price information and at Mekelle price
information of honey, respectively (Table 14). The survey result presented in Table 14 also
shows that honey producers were limited to some source of market information. Accordingly,
28.5% and 59.2% of the total sampled households respond that, they obtain price information
from multipurpose cooperatives and personal observation on market, respectively.

48
4.1.8. Demographic characteristics of traders
The demographic characteristics of traders summarized in terms of age, sex, marital status,
education level, religion and average experience in honey trading (Table15). The age of
traders ranged from 26 to 42 with an average age of 30 years old. The survey result indicates
that, all the sample honey traders are males and about 93 percent of them were married. With
regard to religion, 85.7 percent and 14.3 percent of the sampled traders were Orthodox
Christian and Muslim, respectively. About 64 percent and 21.4 percent of the sample traders
were within the level of Primary and Secondary School education, respectively, and only 14.3
percent of the traders have some kind of tertiary education. Table15 also indicates that traders
had 6.3 years of experience on honey trading on the average.
Table 15. Demographic characteristics of sample traders
Variable
Number of traders
percentage
Sex
Male 14 100
Female 0
Religious Orthodox Christian 12 85.7
Muslim 2 14.3
Education level
Diploma 2 14.3
7-10 grade 3 21.3
1-6 grade 9 64.3
Marital status
Married 13 93
Single 1 7
Source: Own computation, 2008

Financial capital of sample honey traders: Table 16 shows that average initial and current
working capital of honey traders during the survey period was estimated to be Birr 1381.5 and
Birr 5977.8, respectively. Moreover, as it was indicated in Table 16, the current working
capital of honey traders was about 5 times greater than their initial working capital and the
initial and current working capital of the honey trades varies from Birr 250 to 5000 and Birr
2000 to 30000, respectively. With regard to the sources of working capital, 44.4 percent, 50
percent and 50 percent of honey traders reported that their source of current working capital
was own saving and credit in Mekelle, Wukro and Atsbi, respectively. Table 16 also indicated
that honey traders in Mekelle, Wukro and Atsbi, respectively reported that 44.6 percent, 50
percent and 66.7 percent of their current source of working capital was from DCSI. Only 11
percent of honey traders found in Mekelle indicated that their source of working capital was
obtained as gift from their families.
Table 16. Financial capital of sampled honey traders Descriptive statistics
Mekelle
Wukro
Atsbi
Initial working capital (Birr)
Mean
2111.10
1050
983.3
Minimum
500
300
250
Maximum
5000
1800
1500
Current Working Capital (Birr)
Mean
9166.7
4000
4766.67
Minimum
3500
2000
3800
Maximum
30000
6000
6000
Source of current working capital
Own saving & credit
44.4
50
33.3
DCSI
44.6
50
66.7
Donation
11
Source: Survey result, 2008

50
4.2. Production and Marketing Problems and Opportunities
Beekeepers confronted with several problems related to production and marketing. Major
problems in beekeeping arise from bee characteristics and environmental factors that are
beyond the control of the farmers. A questionnaire was designed as part of the study with the
objective of identifying the existing problems limiting development of the apiculture sector in
the study district. Table 17 summarized major constraints identified and prioritized by the
respondents.
Table 17. Beekeeping problems encountered by sample respondents
Type of problem
% of respondents replied (n=120)
Shortage of bee forage
( drought)
75
Absconding honeybee
52
Disease and pests 45
Lack of beekeeping equipments
38
Death of colony
32
Marketing problems
28
Lack of adequate beekeeping skill 18
Reduction of honey bee colony
17
Credit 15 Source: Survey result, 2008
It can be seen from Table 17 that the most serious problem faced by respondents in order of
their importance were shortage of bee forage (drought), followed by absconding honey bee,
disease and pests, lack of beekeeping equipments, death of colony, marketing, lack of
beekeeping skill, reduction of honey bee colony and credit. Shortage of bee forage (drought)

51
is the primary constraint in beekeeping development identifying by farmers in the study area
during the survey. It affects the feed source (bee forage) and water adversely. IPMS (2005)
documented that the major source of feed in the district is from the natural bush (about 70%
of the requirement) and the rest are from home-prepared pulse flour and sugar. Another
problem mentioned is that of rust which affects the flower, because of which the honeybee
cannot get nectar and pollen. Therefore, the honeybee colony absconds to areas where
resources are available for their survival. The prevalence of disease and pests also forces the
colonies to abscond. In order to enable safety protective materials such as veil, glove, overall
and smoker is essential for the beekeeper farmers. In the study area, though the distribution of
improved box beehives was encouraging, in most cases the protective materials did not
accompany them.
Respondents reported that death of colonies/affected of bees by agro chemicals, due to the
draining of chemicals used in the animal health center of the PAs in to water source of the
area, from which honeybees use the water was another problem. Honey is produced mainly
for marketing in the district. Households sell about 80-90% of the honey produced (IPMS,
2005). The increased honey production during the harvest period was found to coincide with
high supply in the study area. This brings a down ward pressure on honey price in the high
supply seasons mainly in Atsbi Wemberata district. Beekeepers generally supply to markets in
nearby towns like Atsbi and Wukro, traveling on foot. The farmers sell the honey they
produce on individual basis mainly to consumers and private traders twice a year. Among
producers, on average about 10-20 kg of honey is sold per household per annum (IPMS,
2005). They are price takers and have low bargaining power. Despite the high honey,
production in the district there is no ready market which attracts farmers.

52
Honeybee Management Practices
About 59 percent of the respondents visit their bees every day while 33.3 percent of them visit
their bees at every three days and the rest visit their bees to check if the hive was occupied
with bees and at least during honey harvesting seasons. Internal hive inspection is almost not
practiced by most of the farmers. About 90 percent of the farmers responded that they clean
the areas around the box beehives and put ash under the hives to avoid small ant and ant like
insects from climbing the box beehives. While the rest 10 percent do not clean. About 65
percent of the interviewed farmers gave additional food and water for their bees in order not
to lose them and hence to harvest honey in the second honey fallow seasons.
During the survey period it has been also observed that some farmers who have improved box
beehives do not manage it properly. This might be due to lack of adequate training and better
knowledge how to manage improved beekeeping practices, lack of supervision or follow up
after distribution by the district Agriculture and Rural Development Office and non-
governmental organizations and might be also be due to carelessness of the farmers. Some of
the improved box beehives did not have stand but kept in inappropriate places.
Traders marketing problems:
Table 18 summarized the basic problems identified and prioritized by sample traders. As the
table indicates the basic problems faced by honey traders’ during the survey were quality
problem (adulteration), competition with unlicensed traders, and shortage of finance, demand
and unfair tax fee. Quality problem is the priority problem identified by honey traders.
Improving the quality of honey has to do with production, harvesting and storing by farmers.
As farmers reported one of the reasons for quality problem could be low beekeeping skills.
The other problem for the poor quality of honey that traders noted is that there are unlicensed
traders/honey collectors who might be mixing honey with sugar.

53
Table 18. Marketing problems of honey traders
Type of problem % of respondents replied (n=120)
Quality
64.5
Competition with unlicensed traders/honey
collectors
49.6
Shortage of finance 21.4
Tax 14
Demand 7.9
Source: Survey result, 2008
About 50 percent of the honey traders confirmed that they faced competition with unlicensed
traders; about 22 percent of them indicated that they face financial shortage to run and expand
their business. Table18 also indicated that 14 percent of the sample traders complain that they
were forced to pay unfair tax and about 8 percent of the sample traders reported that they
faced demand problems due to limited number of buyers, high supply of honey in other areas
of the region.
Opportunities
There are important honey production opportunities in Atsbi Wemberta district. Among the
different opportunities, the existence of conducive policy framework in the agricultural sector
development manifested by assigning three development agents in each PAs and
infrastructure development could facilitate honey production and marketing. The existence of
some development projects like IPMS-ILRI input supply/credit for honey production (supply
of bee colony) and to create a link between buyers and farmers is another opportunity for

54
farmers of the district. There is also governmental institution named as Tigray Agricultural
Marketing Promotion Agency (TAMPA) that disseminates weekly average prices of
agricultural commodities through the regional mass media on weekly basis. Moreover, a
private company, Dimma Enterprise, which has recently installed a honey processing plant in
Adigrat, the zonal capita, about 93 km from the study district is also another chance for honey
marketing of the study area since it creates demand for honey.
4.3. Market Structure
In this section of the study, honey market participants, their roles and linkages, the marketing
channel of honey production, the conduct and as well as the performance of honey market are
presented one after the other.
4.3.1. Honey marketing participants, their roles and linkages
In this study, different honey marketing participants were identified. Honey marketing
participants in the study area includes producers/farmers, honey collectors/assemblers,
retailers, processors and final consumers of the product.
Producers: Producers/farmers sell their honey to different buyers involved in honey in the
market at village or district market center. The market place that is the closest to the residence
of the farmers is the first chosen with regard to minimization of transportation costs.
According to the respondents, in 2006/07 production year, 43.3 percent, 34.8 percent, 14.4
percent and 7.4 percent of their annual sale of honey was sold to consumers, honey collectors,
retailers and processor, respectively.

55
Table 19. Amount of honey output supplied (kg) to different market participants by farmers in 2006/07 production year
Market participants
Amount sold
%
Consumers
4876
43.4
Honey collectors
3921
34.8
Retailers
1622
14.4
Processor
838
7.4
Total
11257
100
Source: Survey result, 2008
Honey collector/assembler: Rural actors play an important role in honey assembly. The
honey collectors found in the study area purchased the honey produce directly from farmers in
a small village markets for resell to other collectors, retailers, and consumers who come from
different areas of the region at the district market center.
Retailers: There are supper markets and other retailers who divide large-scale shipments of
produce and sell it to consumers in small units. These are the final link in the channel that
delivered honey to end users. The majority of honey retailers found at the regional as well as
district centers have their own stores and retail shops.
Processor: This is a private enterprise recently established in Adigrat. The processor purchase
honey from different areas of the region including the study area directly from farmers or
from rural collectors and has a retail shop in the regional town. The processor used different
packing material ranged from 1kg to 30kg.
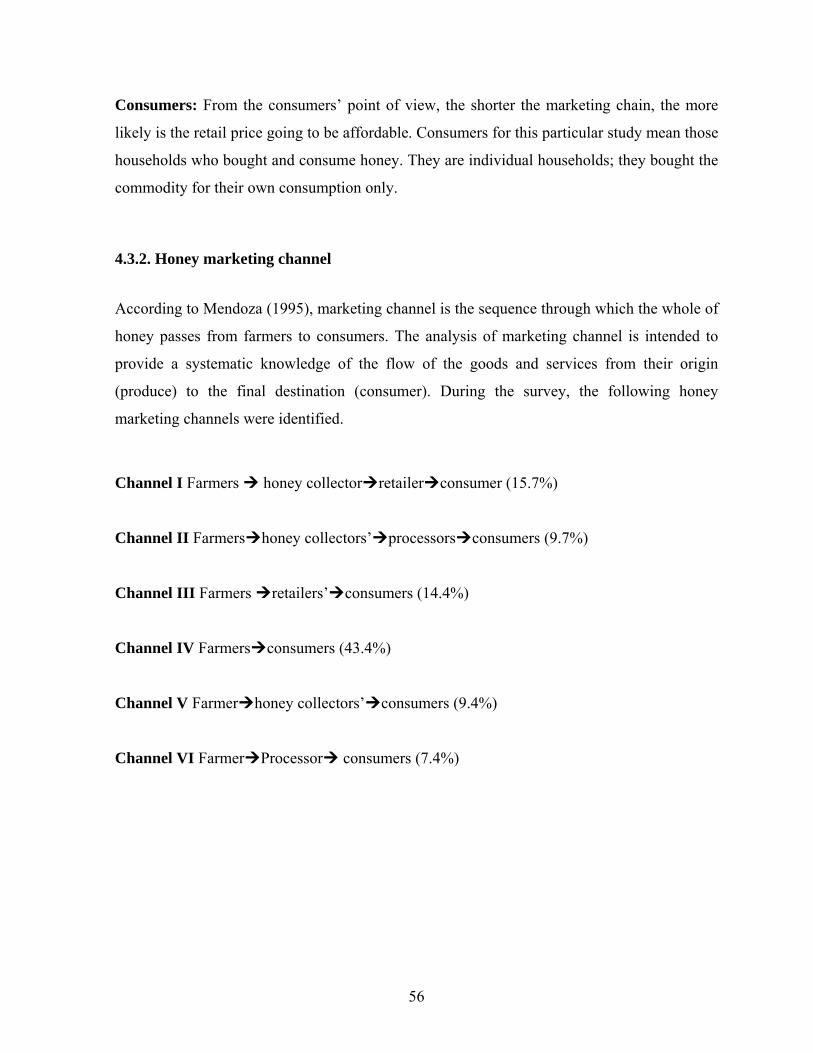
56
Consumers: From the consumers’ point of view, the shorter the marketing chain, the more
likely is the retail price going to be affordable. Consumers for this particular study mean those
households who bought and consume honey. They are individual households; they bought the
commodity for their own consumption only.
4.3.2. Honey marketing channel
According to Mendoza (1995), marketing channel is the sequence through which the whole of
honey passes from farmers to consumers. The analysis of marketing channel is intended to
provide a systematic knowledge of the flow of the goods and services from their origin
(produce) to the final destination (consumer). During the survey, the following honey
marketing channels were identified.
Channel I Farmers honey collector retailer consumer (15.7%)
Channel II Farmers honey collectors’ processors consumers (9.7%)
Channel III Farmers retailers’ consumers (14.4%)
Channel IV Farmers consumers (43.4%)
Channel V Farmer honey collectors’ consumers (9.4%)
Channel VI Farmer Processor consumers (7.4%)

57
As can be understood from fig 1, the main receivers from the farmers were consumers, honey
collectors, retailers and processors with an estimated percentage of 43.4, 34.8, 14.4 and 7.4
percent in that order.
34.8% 7.4%
45%
14.4%
28%
27% 43.4%
100%
61% 22.3%
Figure 1 Honey marketing channel
Honey collectors
Retailers
Consumers
Processor
Farmers (11257 kg)
Processor

58
Lines of marketing channels are identified for honey production of the study area. They are
very few honey collectors in the study area that employ solely in honey collection activities.
They do not carry out trade in honey in large quantities. Channel IV is the dominant in the
study area, while channel V is weak and inefficient. The honey collectors procure a
significant amount of honey and store it with inappropriate storage materials and they stay for
consumers to come to buy the honey, rather than supplying to the nearby markets. Channel II
and VI are found to be at an initial stage and it is hopped that this will become stronger in due
course of time. This optimism stems from the fact that a private company, which is recently
launched at the Zonal city of the study district (in Adigrat) will be an opportunity to create a
secure and consistent market in the times to come. According to the respondents, this private
enterprise purchased 7.4% of the honey produce in 2006/07 production year directly from the
farmers at reasonable price to test the efficiency of its processing plant. Generally, the channel
analysis of honey marketing of the study area is found to be a very short route.
Measure of market concentration ratio
The concentration ratio is expressed in terms of CRx which stands for the percentage of the
market sector controlled by the biggest X firms. Four firms (CR4) concentration ration is the
most typical concentration ratio for judging the market structure (Kohls & Uhl, 1985). A CR4 of over 50% is generally considered a tight oligopoly; CR4 between 25% and 50% is
generally considered a lose oligopoly and a CR4 of fewer than 25% is no oligopoly at all.
Since the number of traders at each sample market level was few, therefore, the analysis of
the degree of market concentration ratio was carried out for all traders. It was measured by the
percentage share of volume of honey handled by the largest four traders (Kohls & Uhl, 1985).
Here concentration ration for four traders was meant for all honey traders across the study
area with largest upper volume in general (Table 20).
As indicated in Table 20, the result of sample market honey traders’ concentration ratio CR4
was found to be 35.82 percent. Kohls and Uhl (1985) suggested, as a rule of thumb, a four

59
largest enterprises concentration ratio of 50 percent or more as an indication of a strongly
oligopolistic industry and CR4 between 25% and 50% is generally consider a lose oligopoly
and a CR4 of fewer than 25% is no oligopoly at all. Hence, the honey market concentration
ratio in the study area was 35.82 percent suggesting a lose oligopoly market type.
Table 20. Honey trader’s concentration ratio in the sample market centers Number of traders (I)
Cumulative frequency of traders (II)
% of traders (III)
Cumulative % of traders (IV)
Quantity purchased in kg (V)
Total quantity purchased in kg VI=IV*I
% share of purchase (VII)
% cumulative purchase (VIII)
1 1 7.143 7.143 629.95 629.95 9.89 9.89
1 2 7.143 14.286 580.45 580.45 9.11 19
1 3 7.143 21.429 537.75 537.75 8.44 27.44
1 4 7.143 28.572 533.75 533.75 8.38 35.82
1 5 7.143 35.715 471.5 471.5 7.40 43.22
3 8 21.429 57.144 442.4 1327.2 20.83 64.05
1 9 7.143 64.287 431.65 431.65 6.78 70.83
2 11 14.295 78.582 411 822 12.90 83.73
1 12 7.143 85.725 397.5 397.5 6.24 89.97
1 13 7.143 92.84 367.3 367.3 5.76 95.73
1 14 7.143 100 272.6 272.6 4.27 100
6371.3 100
Source: own computation, 2008

60
4.3.3. Market conduct
Market conduct refers to the patterns of behavior of firms. This implies analysis of human
behavioral patterns that are not readily identifiable, obtainable, or quantifiable (Pomeroy and
Trinidad, 1995). There are no agreed upon procedures for analyzing the elements of market
conduct. Rather, some points are put to detect unfair price setting practices and the conditions
under which such practices prevail. In this study conduct of the honey market is analyzed in
terms of the traders’ price setting, purchasing and selling strategies.
Producers’ Market Conduct
Honey is the most important cash income generating commodity in the study district. During
the survey, farmers pointed out that supply of honey to the market occurs mainly from
October to February. According to the report, about 27 percent, 25 percent and 18 percent of
the total yearly sale of honey was made in December, January and February, respectively. The
remaining portion of the output 6 percent, 9 percent and 12 percent was sold in September,
October and November, respectively. Respondents also reported that there were no significant
sales in the months of March-August. During the study, it was observed that, the frequency of
honey supplied to the market by most farmers (89%) was twice a year and almost 100 percent
of the households’ term of sale was on cash basis.
In the study area, farmers organized in terms of PAs. Starting from production up to
marketing, every farmer produces and sells on individual basis. This affects their bargaining
power during the sale of honey. Accordingly, 97 percent of households reported that,
generally, for the last five years, price of honey showed an increasing trend. One of the
reasons for the increase in price was mainly the quality of honey produce due to the
introduction of improved box beehives according to farmers.

61
Traders’ Market Conduct
The survey result indicated that the transactions made on honey marketing of the study area
takes place with direct contact between sellers and buyers. There were no observed
operational brokers in the honey marketing channel during the survey period. The honey
retailers were found to purchase honey either directly from farmers at the local/district market
or from honey collectors. The method of price setting is crucial importance in honey trading
activity. About 43 percent of the sample traders reported that their purchase price was set by
market, about 36 percent of traders set purchase price themselves and 21.4 percent of the
traders respond that purchase price was set by negotiation with suppliers. About 64 percent of
sample traders set their selling price by the themselves and the rest (or 34 percent) of them
respond that selling price was set by market during 2006/07.
4.3.4. Performance of the market
Methods employed for the analysis of honey market performance were marketing margins by
taking into account associated marketing costs for key marketing channels. Hence, on the
consideration of 2006/07 production year, costs and purchase prices of the channel actors,
margin at farmers,’ retailers,’ and honey collectors’ level was conducted.
Cost and profitability analysis of honey production for farmers
This section of the study focused on activities related to producing honey at farm household.
This shows an indication about the performance of honey market. Average costs and sales
prices of the producers were used (Table 21).

62
Table 21. Cost and profitability analysis of honey production for producers
Costs Cost/box hive (Birr) per
year
Percent
Feed cost 27.92 5.99
Labor cost 119.56 25.64
pest side cost 30.93 6.63
Transport cost 12.30 2.64
Tax paid 46.59 9.99
Interest payment 183.25 39.29
Cost of equipments (accessory of hive tools) 45.8 9.82
Total cost =A 466.35 100
Average Yield of honey (kg/hive) 28.66
Average market price of honey at farm gate
(Birr/kg)
37.35
Gross sales (birr/hive) =B 1070.45
Profit/Loss (Birr/hive) =B-A 604.1
Source: Own computation, 2008
As Table 21 indicates, cost and profitability analysis of honey production for 2006/07
production year in the study area was encouraging regarding its profitability. This shows that
a farmer with 28.66 average production of honey per box beehives with average market price
of honey 37.35 Birr at farm gate would generate annual return of ETB 604.1 per box
beehives. For this study as indicated in table13 total number of box beehives for the entire
sample of respondents was 414, the average holding size being 3.45 hives. If we consider the
Yield and the profit that is obtained from a given holding size, a farmer can be generated
annual profit of ETB 2084.15 from the beekeeping sector. With regarding to the cost items,
interest payment shares the highest (39.29%) followed by labor cost (25.64%). This might be
due to the improved hives which farmers’ receive on credit basis.

63
Cost and profitability analysis of honey production for honey collectors
Cost and profitability analysis of honey collectors was summarized in Table 21. Average
costs and sells prices of honey collectors were under taken in the analysis.
Table 22. Cost and profitability analysis of honey collectors
Cost items
Cost per kg (Birr) Percent from total cost
Honey collectors’ purchase
price =A
37.35
Labor cost 0.0.5 5
Transport cost 0.13 13
Tax paid 0.15 15
Honey container 0.315 31.5
Other costs 0.355 35.5
Total operation cost =B 1.00 100
Total cost =C 38.35
Gross sales = D 40.00
Profit/Loss ( E)= D-C 1.65
Source: Own computation, 2008
The result of Table 22 shows that honey collectors of the study area during the survey period
were obtained a profit of ETB 1.65 per kg of honey. This indicates that the performance of
marketing of honey collectors for the specified year 2006/07 was showing positive figure
even though the amount of profit was a small number per kg basis. The table also shows that
other costs like personal costs of the honey collectors during the operation takes the largest
proportion of overall costs (35.5%) followed by honey containers (31.5%).

64
Cost and profitability analysis of honey production for retailers
Cost and profitability analysis of honey retailers was summarized in Table 23. Average costs
and sales prices of retailers were under taken in the operation.
Table 23. Cost and profitability analysis of honey retailers
Costs
Cost per kg (Birr)
Percent
Retailers’ purchase price =A 40.00
Labor cost 0.09 7.36
Transport cost 0.18 14.75
Tax paid 0.16 13.11
Rent of retail shop 0.7 57.38
other cost 0.09 7.4
Total operation cost =B 1.22 100
Total cost (C) =A+B 41.22
Average retail price Birr/kg =D 45
Traders profit/loss E=D-C 3.78
Source: Own computation
With regard to the cost and profitability analysis of the sample honey retailer’s found in the
sample markets, as the Table 23 clearly shows retailers were found to be profitable. This
indicates that a retailer can obtain a profit of ETB 3.78 per kg at retail level which was higher
by 2.13 than Birr profit of honey collectors. Concerning cost of operation of retailers’, rent for
retail shop is the highest (57.38%) followed by transport cost (14.75%).
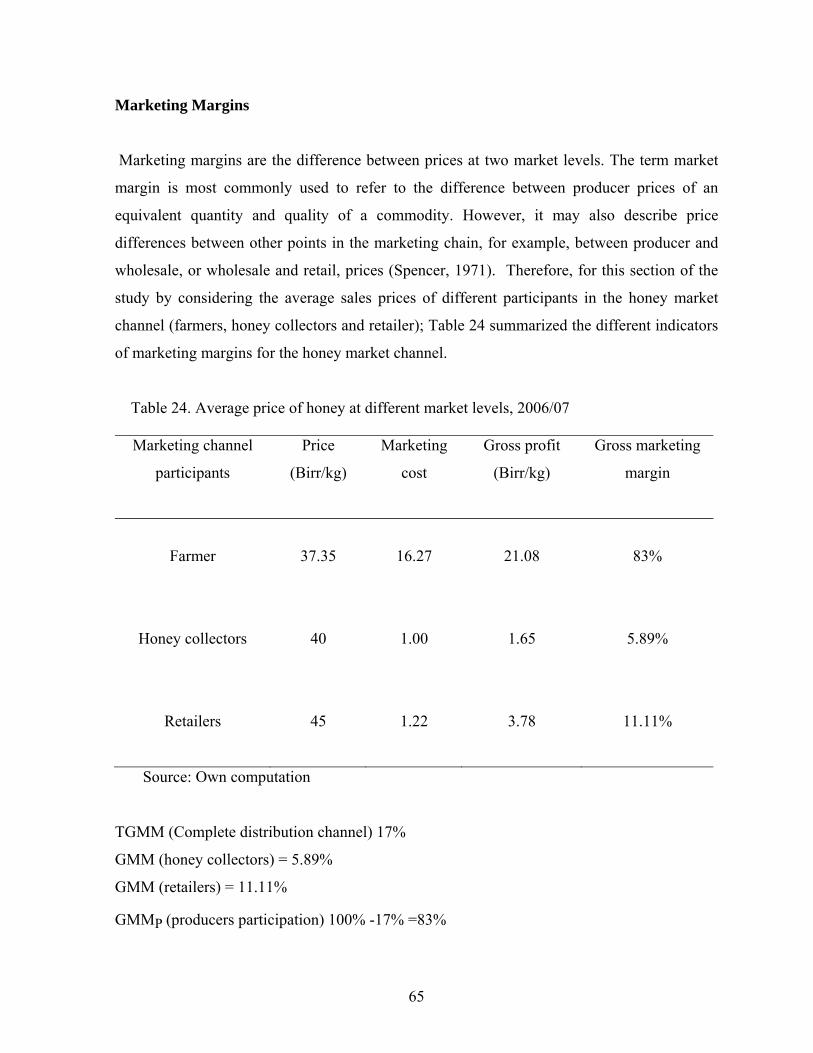
65
Marketing Margins
Marketing margins are the difference between prices at two market levels. The term market
margin is most commonly used to refer to the difference between producer prices of an
equivalent quantity and quality of a commodity. However, it may also describe price
differences between other points in the marketing chain, for example, between producer and
wholesale, or wholesale and retail, prices (Spencer, 1971). Therefore, for this section of the
study by considering the average sales prices of different participants in the honey market
channel (farmers, honey collectors and retailer); Table 24 summarized the different indicators
of marketing margins for the honey market channel.
Table 24. Average price of honey at different market levels, 2006/07
Marketing channel
participants
Price
(Birr/kg)
Marketing
cost
Gross profit
(Birr/kg)
Gross marketing
margin
Farmer
37.35
16.27
21.08
83%
Honey collectors
40
1.00
1.65
5.89%
Retailers
45
1.22
3.78
11.11%
Source: Own computation
TGMM (Complete distribution channel) 17%
GMM (honey collectors) = 5.89%
GMM (retailers) = 11.11%
GMMP (producers participation) 100% -17% =83%

66
Table 24 reveals that 17% of total gross marketing margin was added to honey price when it
reaches the final consumer at the regional capital of Mekelle. Out of the total gross marketing
margin 5.89% was gross margin of honey collectors, while 11.11% was that of retailers.
4.4. Determinants of Honey Market Supply
Honey is produced mainly for market and is one of the most important cash commodities for
Atsbi Wemberta district farmers. Data collected from sampled respondents indicated that 95
percent of the total honey produced in 2006/07 production year was supplied to the market.
According to the report all the sample households were potential suppliers of the commodity
to market during the survey period. Several variables are hypothesized to determine the
market supply by sampled honey produced farmers.
Before running the OLS regression model, all the hypothesized explanatory variables were
checked for the existence of multi-co linearity and heteroscedasticity problem. The study used
Variance inflation factor to investigate the degree of multi-co linearity among continuous
explanatory variables and contingency coefficient among discrete (dummy) variables. A
statistical package known as SPSS12 was employed to compute the VIF and CC values. The
results for all VIF values were ranging between 1.123 and 8.640. Likewise, the values of CC
were ranging between 0.039 and 0.101. Hence, multi-collinearity was not a serious problem
both among the continuous and discrete variables. For details (Appendix Table1 and 2).
In this study heteroscedasticity was tested for all variables by running heteroscedastic
regression using an Econometric soft ware (LIMDEP). There was no serious problem of
heteroscedasticity in the model. And hence all the explanatory variables were included for the
model analysis of determinants of market supply of honey. The overall goodness of fit of the
regression model is measured by the coefficient of determination (R2). It tells what proportion
of the variation in the dependent variable, or regress and, is explained by the explanatory
variable. R2 lies between 0 and 1, the closer it is to 1, and the better is the fit. Hence, The
overall model goodness of fit represented by model count R-square is very good and over 98
percent of the household were correctly predicted out of the 120 households heads.

67
4.4.1. Econometric results of the OLS model
Ten explanatory variables were hypothesized to determine the household level marketable
supply of honey. Among the hypothesized 10 variables namely sex of the household, age of
the household, education level of household, experience in beekeeping, extension access,
quantity honey of produce, price of honey in 1999 E.C., access to credit, distance to the
nearest market and market information, only three variables were found to be significantly
affecting the household marketable supply of honey at household level (Table 25). Quantity
of honey produce, price of honey in 1999 E.C., education level of the household head
influenced positively the marketable supply of honey by household as predictable. The
remaining 7 variables (age, sex, extension access, and experience in beekeeping, access to
credit, distance to the nearest market and access to market information) were found to have no
significant effect on honey market supply.
Education level of the beekeeping household (EDLHH): Education has a positive effect on
honey sale quantity per household per year. It is statistically significance at 10% significance
level. The model output verifies that one additional formal year education level leads to the
beekeeping household to increase yearly honey production by 1.962 Kilograms. The positive
and significant relationship indicates that education improves the beekeeping household
ability to acquire new idea production related and market information, which in turn improves
productivity and thereby increase marketable supply of honey.
Quantity of honey produced (QTYHP): As hypothesized the multiple linear regression
output variable was significantly at 1% significant level, a positive coefficient implies that an
increase in quantity of honey produced increase marketable supply of farmers. It indicates that
households who produce more quantity of honey had also supplied more to the market. The
result also shows that due to insignificant consumption of honey at household level, a unit

68
Table 25. OLS results of determinants of honey market supply
Variable
Coeff.
Std.Err
t-ratio
P-value
Constant
-23.666
10.601
-2.232
0.028**
AGE
-0.014
0.053
-0.264
0.784
SEX
0.078
2.642
0.030
0.976
EDLHH
1.962
0.900
2.180
0.031**
EXP
0.046
0.130
0.354
0.724
EXACC
-0.975
2.039
-0.478
0.633
QTYHP
1.006
0.031
32.452
0000***
PRICE99
0.550
0.225
2.444
0.016**
ACC
0.089
2.799
0.032
0.975
DSMKT
-0.025
0.199
-0.126
0.877
ACCMIF
2.557
2.114
1.210
0.238
Dependent variable=quantity supplied, N=120, R-Squared=0.987, Adjusted R-
squared=0.986***, ** and * shows the values statistically significant at 1%, 5% and 10%
respectively
69
increase in the quantity of honey produced per box beehives, causes a 1.006 kilograms
increase in the amount of market supply. Similarly, previous studies conducted by Wolday
(1994), Wolelaw (2005), Rehima (2006), Kindie (2007) and Bosena (2008), found that the
amount of grain, rice, red pepper, sesame and cotton respectively, produced by household
affected marketable supply of each of the commodities significantly and positively.
Price of honey in 1999 E.C.: The coefficient of price of honey in 1999E.C. which shows a
positive relation to the quantity of honey sold or supplied to market. Producers checked the
price of honey for their best benefit and this directs to the determinant to be the significance at
5% level. The positive and significant relationship between the variables indicates that as the
price of honey at market rises, the quantity of honey sold at the market also rises, which in
turn increases quantity of honey sold per household per year. The coefficient of the variable
also confirms that a unit price increase in the honey market directs to the beekeeping
household to raise yearly honey sales by 0.55 kilograms per box beehives. The study of
Wolelaw (2005), on determinants marketable supply of rice found a significant positive
relationship between rice sold and current price.
On the other hand, age of the household, sex, experience in beekeeping, extension access,
access to credit, distance to the nearest market and access to market information did not
significantly influenced the quantity of honey sold in the study area as they expected.

70
5. CONCLUSION AND RECOMMENDATIONS 5.1. Conclusion
The study was conduct with the objective of understanding the marketing system of apiculture
production in Atsbi Wemberta district of Tigray region with specific focus on honey. Honey
has been identified in the district as a major cash income generating commodity. Honey in the
district is important market oriented commodity. Atsbi Wemberta district has high potential
in honey production. There are about 18,567 honey bee colonies in the district out of which
5740 are improved box beehives. The price of one honeybee colony is Birr 550 in the study
area, pure and crude honey costs on average Birr 37.35 and 25 per kg respectively. The
analysis was made with the help of descriptive and econometric model using SPSS and
LIMDEP econometric software.
The data were generated by individual interview using pre- tested questionnaires and a rapid
market appraisal technique. This was supplemented by secondary data collected from
different published and unpublished sources. A total of 120 beekeeper farmer respondent’s
(115 males and 5 females) were selected randomly from a list of 1670 beekeepers from 3 PAs
in the district. Fourteen honey traders from three towns (Mekelle, Wukro and Atsbi) were also
interviewed. The result of descriptive analysis of farmers’ data point out that, the average
honeybee colony holding size per household in the study area during the survey year were
about 3.5 and the average honey productivity per box beehives was 28.66kg.
Majority (79%) of the respondents had about 3-8 years of beekeeping experience and the
average years of experience acquired for the entire sample was about 7 years. The result also
showed that total production of honey by respondents’ during the survey period was 11,867
kg and out of this total production, 11,257 kg or about 95 percent of the production were
marketed through different marketing channels that were being identified during the survey
period with an average price of Birr 37.35 per kg.

71
The survey result indicated that total gross income generated by respondents from annual sale
of honey was about Birr 420, 449 and the mean income of the sampled households was
estimated at Birr 3503.74 at the survey period. The district Office of Agriculture and Rural
Development is the center of extension providing institution with three development agents
assigned in each PA to support farmers. About 84 percent of respondents had access of
extension contact with different frequencies. The remaining percentage (16%) of respondents
reported no extension contact.
There are a number of highlighted problems that impede the further development of honey
production in the study area. About 75 percent of the respondents reported that the most
serious problems they faced was feed shortage (drought) followed by absconding of
honeybee. Disease, pests, lack of beekeeping equipments and death of colony problems were
also among the constraints which contribute for reduction of the production. The increased
honey production during the harvest period was found to coincide with periods of low price.
As a result 28 percent of the sampled households indicated that there were no ready markets
to attract their produce. The other problem related to production and marketing problems of
honey was the poor quality of the product due to improper handling which was recording
about 65 percent of honey traders.
Quantity of honey supplied to the market passed through different marketing agents from
farmers to consumers. About 43.4% (4876 kg), 34.8% (3921 kg), 14.4% (1622 kg) and 7.4%
(838 kg) of the total honey marketed were purchased by consumers directly from producers,
honey collectors, retailers and processors, respectively in 2006/07. The computed four-firm
concentration ratio (CR4), which is the share of the largest four traders in the total yearly
volume of honey purchased, was 35.8 percent indicated a lose oligopolistic market structure.
Starting from production up to marketing, every farmer produce and sold on individual basis.
This affects their bargaining power during the sale of honey. About 97 percent of households
reported that, generally, for the last five years price of honey in the study area showed
increasing trend. The survey result also indicated that there were no observed operational

72
brokers in the honey marketing channel during the survey period. The honey retailers were
found to purchase honey either directly from farmers at the local/district market or from
honey collectors. The method of price setting is crucially important in honey trading activity,
about 43 percent of the sample traders reported that their purchase price was set by market,
and about 36 percent of traders set purchase price themselves, and 21.4 percent of the traders
respond that purchase price was set by negotiation with suppliers.
The results of the marketing costs, profits and margin analysis indicated that producers
incurred the highest production cost followed by retailers. During production interest payment
takes the largest proportion which was 39.29 percent followed by labor cost which accounts
about 26 percent of the total production costs. With regard to the marketing cost of honey
retailers, without the purchase price of honey, rent for retail shop took the largest proportion.
This was about 58 percent of all marketing costs. Gross profit analysis for 2006/07 production
year showed that average gross profit for farmers per box beehives was estimated at Birr 604
and honey collectors gross profit was Birr 1.65 per kg, while that of retailers was about Birr 4
per kg on the average. About 17 percent of total gross marketing margin was added to honey
price when it reaches to the final consumers at the regional capital of Mekelle. Out of the total
gross marketing margin about 6% was gross margin of honey collectors, while 11% was that
of retailers. The study pointed out that all marketing participants of the commodity operated at
profit. This indicated that all the marketing agents were advantageous through the channel.
Estimation of determinants of marketable supply of honey with the help of Robust OLS
regression analysis was employed with ten hypothesized variables. The result of OLS
regression model analysis pointed out that education level of the household, size of quantity
of honey output and market price of honey in 1999 E.C. were found to be significant with the
expected sings. The model result predicts that one additional formal year education level leads
to the beekeeper household to increase yearly honey output by about 1.96 kg.

73
5.2. Recommendations
Possible recommendations that could be given on the basis of the study so as to be considered
in the future intervention strategies which are amid at the promotion of honey production and
marketing of the study area were as follows:
1. The result of OLS regression model analysis has shown that the most important variables
influencing the quantity of honey supplied in the study area during the survey period were
education level of the household head, size of honey output and price of honey in 1999 E.C
As it was indicated from the model analysis pointed out that honey marketing supply was
positively and significantly influenced by formal education level of the household head
beekeeper. This result verifies that education develops the willingness of the beekeeper
household to allow new technology and information which in turn widens their readiness to
produce more and thereby raises honey marketable supply. Accordingly, the district ARD and
other apiculture development partners should give weight practical supported beekeeping
training in which focused on pre and post harvest management of honey production and
marketing.
2. The OLS regression model output find out that size of honey produced by individual
households was found to influence the quantity supply significant positively during the survey
time. The positive significant effects of the variable propose that by improving productivity of
the household, sale volume of the commodity can be expanded. This believed to happen due
to the introduction of improved box beehives. Therefore, increasing the distribution of
improved box hives accompanied by safety protective materials for farmers of the district
would bring additional marketable supply of the produce.
3. The OLS econometric model result did not happen with significant influence on market
information as hypothesized, the problems related with market information lead to low-priced.
Hence, market information is an important component for improving production system of the
sector. The availability of timely and precise market information increases producers’

74
bargaining capacity to negotiate with buyers of their produce. In order to obtain this
advantage there is a need to improve extension system which focused on market extension
linkage farmers with markets is necessary to ensure a reliable market outlet for beekeepers of
the study area. This should be further strengthening by marketing organizations such as
cooperatives and other honey marketing institutions to involve in communicating the honey
produces and the ultimate consumers so that farmers can sell their produce at reasonable
prices.
4. Feed shortage (drought) is one of the major problems identified and prioritized by farmers
in the study area. To reduce this problem, it is essential to integrate beekeeping activities with
water harvesting to secure their livelihood. The research organization should select moisture
stress tolerant potential bee forage suitable to the area and promote them widely in
collaboration with bee keeping extension, NGOs, and the private sectors. Similarly, the
existing indigenous bee forages such as “gribiya” (Hypostus ariculata) and “tebebe” (Basium
Clandiforbium) etc, which flower even in the summer season should be promoted and also
grown in area enclosures. The survey result indicated that the overall honey marketing system
of the study area during the survey period was found to be traditional and under developed.
Thus government actions are required to license and inspect computing honey product traders
to ensure achievements of minimum hygiene and quality standards in order to facilitate the
honey production and marketing process.
5. Beekeeping is culturally defined as a men’s occupation. This was also indicated by the
result of descriptive analysis therefore, women should be encouraged to participate and
receive training and intuitional support in the form of credit in improved beekeeping methods.
Major problems of beekeeping identified and prioritized in the study area were feed shortage
(drought), pests and disease of honey bees, lack of beekeeping materials, death of colony,
marketing problems and lack adequate beekeeping management skill. Therefore, providing
the necessary exposure and skills, and institutional support in the form of credit, training,
experience in improved beekeeping methods and marketing linkages need to be addressed
simultaneously. All the problems faced by beekeepers cannot be addressed by a single

75
organization, various actors: including research, extension, decision makers, input suppliers
and credit agencies need to be collaborate in search of appropriate solutions and implement
them.

76
6. REFERENCES
Abonesh. T. (2005). Imperfect competition in agricultural markets: Evidence from Ethiopia. Journal of Development Economics 76 (2), 405-425.
Abbott, J.C., 1958. Marketing problems and improvements program. Food and Agricultural Organization of United Natios. 1:5-41.
Abbott, C., and Mekeham, p. (1990). Agricultural economics and marketing in the Tropics. Second Edition. Longmam Group, Limited. Harlow, England.
Acharya, S.S. and N.L. Agarwal, 1999.Agricultural Marketing in India. Oxford and Publishing Co. Pvt. Ltd., New Delhi. 370p. Adjare,S.O.1990.Beekeeping in Africa. Agricultural Services Bulletin 68/6. Food and Agriculture Organization of the United Nations Rome1990 .http://www.fao.org/docrep//to104e00.htm.
Atsbi Wenberta district Agriculture and Rural Development Office (2008).
Ayalew Kassaye, 2001. Production of beekeeping in the rural sector of Ethiopia. In proceeding of the third Ethiopian Beekeepers Association.(EBA), pp 55-58.
Bain, J.S. (1968).The Profit rate as a measure of monopoly power. Quarterly Journal of Economics 55:271-293.
Bain, J.S. (1968).Industrial Organization. Second Edition, John Wiley and Sons, New York.
Bosena Tegegne, 2008. Cotton market chain analysis: the case of Metema Woreda, North Gondar Zone, Amhara National Regional State. An MSc Thesis Presented to School of Graduate Studies of Haramaya University. 123p.
Branson, R.E. and D.G. Norvell (1983). Introduction to Agricultural Marketing, M.C.Grow Hill Book Company.
77
Bressler, RG. And R.A. King. 1970. Markets, prices and inter regional trade.Ny, NY, USA: John Wiley and Sons. Cleaver, K.M. and A.S. Gotz, 1994. Reversing the spiral: The population, agricultural and environment nexus in sub-Saharan Africa. The World Bank, Washington, D.C. 43p. CIAT (Centro International de Agricultureal Tropical). 2004. Increasing the Competitiveness of market chains of smallholders producers. Manual,3: Teritorial Approcch to Rural Agro Enterprise Development Project.
CSA, 2006. Statistical Abstract 2005. Central Statistical Agency: Addis Ababa, Ethiopia. Devine, P.S., N.Lee, R.M. JONES and W.J.Tyson. 1984. An introduction to industrial Organization. 5th Edition. London, UK: George Allen and Unwin.
EEA (2004). Industrialization and industrial policy in Ethiopia: Report on the Ethiopian Economy, Vol. III 2003/04. Ethiopian Economic Association/Ethiopian Economic policy Research Institute, Addis Ababa, Ethiopia. EEPD (Ethiopian Export Promotion Development), 2006. Export of honey and beeswax. Draft report. EEPD, Ministry of Trade and Industry, Addis Ababa, Ethiopia.
Edessa Negera, 2005.Survey of honey production system in West Shewa Zone. In proceeding of the 4th Ethiopian Beekeepers Association (EMA).
Eleni Gebremedhin, 2001. Market institutions, transaction costs, and social capital in the Ethiopian grain market. Research Report No124. International policy Research Institute. USA. 93p.
Fadare S.O. 2003. Bees for Development. Journal of Economics 66:132-287.
FAO (Food and Agriculture Organization), 1997. Agriculture and food marketing management. Rome, Italy.
FAO (Food and Agricultural Organization), 1999. Market Infrastructure Planning: A guideline for decision-makers, FAO, 141, Rome. 34p.
FAO STAT 2005. Statistical Data base- Livestock. Available from: htt://faostat.fao.org/default.aspx[Accessed on 21 October r 2007].
FAO (Westlake).2005. Addressing Marketing and Processing Constraints that Inhabit Agri food Exports: A guide for Policy Analysis’s and planners.Agricultural Service Bulletin 160. .
78
Gebre-Meskel Desalegne, T.S Jayne. And J.D.Shaffers. 1998. Market structure, Conduct, and Performance: Constraints on performance of Ethiopian Grain Marks.Working paper No.8, Grain market Research Project, MEDAC, Addis Ababa
Girma Deffar, 1998. Non-Wood Forest Production in Ethiopia. Addis Ababa, Ethiopia. Available from: ftp://ftp. Fao. Org/decrep/fao/003/X6690E00.pdf. [Accessed on 25 Sptember 2007 ]
Gizachew Getaneh, 2005. Dairy Marketing Patterns and Efficiency: The case of Ada’ Liben District, eastern Oromia. M.Sc Thesis presented to Alemaya University, Ethiopia
Goetz, S., and M, T., Weber, 1986. Fundamentals of price analysis in developing countries’ food system: a training manual to accompany the microcomputer software program “MSTAT” Working paper No 29. MSU. International Development papers Michigan State University, East Lansing, Michigan, USA. 148p.
Greene, W.H.2003. Econometric Analysis. Fifth Edition, Pretice Hall International, Inc. New York.
Guajirati, Domodar, 2003. Basic of Econometrics, 4th edition. McGraw hill Company, IN United States Military Academy, West point
Hartmann I, 2004. The management of resources and marginalization in beekeeping societies of South West Ethiopia. Paper submitted to the conference: Bridge Scales and Episte mologies, Alexandria.p.1.
Holloway, G., Charles Nicholso, C., and Delgado, C., 1999. Agro-industrialization through Institutional Innovation: Transactions Costs, Cooperatives and Milk- Market Development in Ethiopian Highlands. Discussion paper No.35.
Holloway, G., and S. Ehui, 2002. Export marketing participation among Smallholder livestock producers: A collection of studies employing Gibbs sampling and data from Ethiopian highlands. Socio-economies and policy Research Working paper 48. ILRI, Nairobi, Kenya. 85p.
ITC. 1986. Honey: a study of major markets. International Trade Centre, UNCTAD/GATT, Geneva.

79
ITC. 1996. Markets for selected medicinal plants and their derivatives. International Trade Centre/UNCTAD/GATT, Geneva
IPMS (Improving Productivity and Marketing Success), 2005.Atsbi Wonberta District Pilot Learning Site Diagnosis and Program Desing.
Jones, O.W. 1972. Marketing staple Foods in Tropical Africa. London, Cornell University Press.60p.Teff. Kindei Aysheshm, 2007. Sesame market chain analysis: the case of Metema Woreda, North Gondar Zone, Amhara National Regional State. An MSc Thesis Presented to School of Graduate Studies of Haramaya University. 123p.
Kohls, Richald L.and Joseph N. Uhl. 1985. Marketing of Agricultural Products. 6th edition. Macmillan Publishing Company, New York.
Koler, P. G. Amsrog, 2003. Principle of marketing 10th Edition, Hall of India Pvt. Ltd., New Delhi. 5-12p.
Kotler, P., 2003 marketing management. Eleven Edition. Pearson Eduction Inc, USA.
Larson, A.L., 1957.Agricultural marketing. Prentice- Hall. New York, USA.
Magrath, p. 1992. Methodologies for studying Agricultural Marketing in Developing countries UK.
Malhaotra N, 1996. The use of structure conduct and performance of the market to measure the marketing efficiency (A theoretical frame work) MEB (i); 53-59.
Malik, D.S.N. Sigh and K.N. Rai, 1993. Marketed and marketable Surplus of Wheat and Paddy crops in Kuruk Sheta District of Harchyana, India. Journal of Agricultural Marketing, Vol. 7, N0.1, pp.59-67.
Mazula, R., undated. 2006. Commodity Chain Approach and Deal Structuring: An Agri- Business Case Study in Zimbabwe Progress Fund. PP.73-78., Zimbabwe. [Online] Available from: http://www.zoic.co.zw/documents.pdf. [Accessed on 10 Sptember 2008].
Mendaoza, G.et al.1982. Canales de Comerrcializaciony precios delapalta. Ministerio de Agricultura-IICA, San Joes, Costa Rica.

80
Mendoza, G., 1995. A primer on marketing channels and margins. P257-275.In G.J. Scott (ends). Prices, Products, and people; Analyzing Agricultural markets in Developing Countries. Lynne Rienner Publishers, Boulder, London.
Mendaza, M.S. and Rose-grant (1995); pricing behavior in Philippine Corn market: Implication for food marketing efficiency, IFPRI Research report1.
Ministry of Trade and industry, Annual External Trade Statistics, 1984-1994. Ministry of Trade and Industry, Addis Ababa, Ethiopia.
Mudiantolo. 1990. The use of Structure, Conduct and Performance of the market to measure the marketing efficiency (A, theoretical framework). MEB 2(1):53-59.
Omta, O., Trienekens, J. and Beers, G. 2001. The Knowledge domain of chain and network Science, Journal on chain and Network service, Vol.1, Issue 2, Wagenigen University and Research Center, The Netherlands.
Organization for Economic Cooperation and Development (OECD). 1982. Price formation and the performance of agro food systems. OECD, Paris, France.
Pomery, R.S. 1989. The economics of production marketing in Small scale agricultural products: Matalom, Leyte, Phill ppines. ICLARM?
Pomeroy, R.S. and A.C. Trinidad, 1995. Industrial Organization and market analysis: P217-238. In: G.J. Scott (eds). Prices, products, and people: Analyzing Agricultural Markets in Developing Countries. Lynner Reinner publishers, Boulder, London.
Purcel, 1979. Market structure and monopoly power. American Economy Review 39:883-97.
Rehima Musema, 2006. Analysis of red pepper Marketing: The case of Alaba and Silitie in SNNPRSof Ethiopia. A M.Sc. Thesis presented to School of Graduate Studies of Haramaya University. 96-95p.
Renakumar, R., 2001. Costs and Margins in coconut marketing: Some evidence from Kerala, Indian J. Agric Economics 56 (4) 668-680.
Richarrd L.Kols. 1961. Marketing of Agricultural Products.2nd edition. Macmillan Publishing Company, New York.

81
Scarborough, Vanessa and Kydd, 1992. Economic Analysis of Agricultural market: A Manual Marketing Series 5, Chatham. UK: Natural Resource Institute. 172p.
SGS (School of Graduate Studies), 2004. A manual on Research Proposal and Thesis/Dissertation writing for Graduate students of Alemaya University.
Scherer, F.M. 1980. Industrial market Structure and Economics Performance. 2nd Edition. Chicago, IL, USA: Rand Mealally College Publishing Company.
Smith, I.R. 1985.The economics of the milkfish fry and fingerling industry of the Philippines. ICLARM Technical Reports 1. International Center for Living Aquatic Resources Management, Manila and Aquaculture Development (ICLARM), Southeast Asian Fisheries Development Center, Iloilo, Philippines.
Tomek, W.G. and K.L. Robinson, 1985. Agricultural product prices, 2nd ed. Ithaca, N. Y. USA: Comell University press.
Tomek, WG, and K.L., Robinson, 1990. Agricultural product prices. Third Edition. Comel University Press. Ithaca and London. 240p.
Trotter, B. W., 1992. Applying price analysis to marketing systems: Methods and examples from the Indonesian rice market. Marketing series3. Natural Resource Institute. Chatham. United Kingdom.
Tshiunza, M., L. Lemchi, J., Tenkonano, A., 2000. Determinants of Market production of Cooking Banana in Nigeria. African crop Science. Journal 9(3): 537-547.
Wolday Amaha (1994). ‘Food and Grain Marketing Development in Ethiopia after Reform of 1990,’ a study of Aleba Siraro district, Koster Publisher. Berlin.
Wolelaw, S., 2005. Factors Determining Supply of Rice: A Study in Fogera District of Ethiopia. A MSc. Thesis Presented to the School of Graduate Studies of Alemaya University.90p.

82
7. APPENDICES
Appendix Table 1. Multicollinerity test with VIF Variable
Tolerance
VIF
AGE
0.685
1.461
EDLHH
0.890
1.123
EXP
0.672
1.489
QTYHP
0.116
8.627
PRICE99
0.824
1.213
DNMKT
0.156
7.823
Appendix Table2. Contingency Coefficient
ACC ACCMIF EXACC SEX
ACC
1
ACCMIF
0.070 1
EXACC
0.050 0.101 1
SEX
0.039 0.047 0.056 1

83
Appendix Table 3. Average production of honey per box beehives and total production at the district level for the last four years Years
Average production of honey per box beehives in kg
Total production of honey in quintal
From improved box beehives
From traditional box beehives
From improved box beehives
From traditional box beehives
1999
35.75 12.77 1440.30 1029.10
1998
20.16 7.00 396.00 290.00
1197
22.67 7.00 394.97 190.40
1196
18.69 7.00 107.83 20.79
Source: ARDO of the District, 2008
Appendix Table 4.Quarterly Average retail price of honey (Birr/Kg) in different market centers found in the region from 5/2/2006 to 6/10/2008
Commodity Market Unit Qtr2
2006
Qtr3
2006
Qtr4
2006
Qtr1
2007
Qtr2
2007
Qtr3
2007
Qtr4
2007
Qtr1
2008
Qtr2
2008
Honey red
(tradition)
Abi-adi KGS 13.88 14.44 14.08 14.25 14.49 15.50 15.05 14.69 16.20
Adigrat KGS 14.09 14.32 15.92 16.72 17.94 17.59 18.41 19.62 21.69
Alamata KGS 14.91 15.76 16.47 16.84 18.32 20.33 19.62 20.54 23.08
Atbi KGS - - - - 14.47 17.00 16.78 18.23 19.70
Axum KGS 15.12 13.86 14.21 13.66 14.58 14.12 16.02 17.88 17.63
Endasilasie KGS 18.18 18.95 18.08 19.44 19.52 19.78 20.05 21.36 23.22
Hawzen KGS 16.36 16.37 15.62 15.56 15.52 15.57 15.15 16.44 19.95
Humera KGS 19.53 19.22 18.58 18.82 19.74 21.97 22.65 22.23 24.72
Maichew KGS 14.89 17.42 17.60 16.94 17.36 18.42 18.12 18.62 18.62
Mekelle KGS 14.83 15.86 15.52 16.98 18.42 18.89 18.38 19.62 20.80
Raya-
Azebo
KGS 17.94 15.76 17.75 19.50 22.26 - - - -

84
Sheraro KGS 14.55 15.99 15.43 16.89 15.68 17.11 18.12 18.60 19.00
Wukro KGS 16.50 16.48 17.96 18.39 19.04 21.75
Honey (white
traditional)
Abi-adi KGS 28.69 27.68 26.83 26.45 27.78 28.90 27.87 25.92 29.47
Adigrat KGS 36.36 39.13 38.64 40.00 40.34 38.57 37.65 39.25 37.91
Alamata KGS 26.50 27.87 28.16 30.20 29.52 33.54 32.29 36.77 39.63
Atsbi - - - - - 35.47 30.38 30.25 32.32 32.97
Axum KGS 25.33 26.49 25.92 26.15 27.08 26.99 28.26 28.88 29.73
Endasilasie KGS 23.00 25.25 23.22 24.98 25.57 26.55 26.82 27.24 27.87
Hawzen KGS 27.02 25.67 27.55 28.93 29.68 28.94 29.29 30.30 32.90
Humera KGS 25.00 25.09 25.28 25.72 26.15 32.33 30.56 30.63 30.30
Maichew KGS 27.76 26.73 26.21 28.10 29.55 30.50 30.67 32.19 32.87
Mekelle KGS 33.59 39.78 35.94 38.29 40.75 42.32 40.45 44.71 46.52
Raya-
azebo
KGS - - - - - 27.27 27.58 30.38 32.84
Sheraro KGS 17.41 20.85 19.89 22.55 23.48 22.49 23.25 24.38 25.80
Wukro KGS - - - 33.00 30.74 36.43 34.55 36.62 40.90
Honey (white ) Abi-adi KGS 37.95 35.16 - 25.50 - - - - -
Adigrat KGS 30.80 - 34.00 30.12 30.00 30.00 30.22 31.40 32.00
Alamata KGS - - - - - - - 31.20 -
Atsbi KGS - - - - 39.07 36.04 34.84 38.60 4060
Axum KGS 24.58 26.03 25.80 26.03 26.64 26.75 28.25 29.54 30.12
Endasilasie KGS 27.19 28.35 26.42 28.41 29.16 30.40 30.29 30.80 32.60
Hawzen KGS 31.22 31.22 31.09 31.50 - - - - -
Humera KGS - - - - - - - 38.00 -
Mekelle KGS 46.41 50.00 47.08 48.62 51.24 51.18 49.62 51.10 53.26
Raya-
azebo
KGS - - - - - - 30.15 - -
Sheraro KGS 18.80
Wukro KGS 37.50 38.74 38.71 39.55 39.92 43.90
Honey (Yellow, Abi-adi KGS 22.05 21.32 21.76 21.06 22.26 22.33 20.49 20.67 24.29

85
traditional)
Adigrat KGS 21.60 25.45 23.29 24.95 26.69 26.63 24.42 26.12 29.03
Alamata KGS 19.63 20.1. 20.24 20.63 23.05 25.55 23.33 24.93 28.13
Atsbi KGS - - - - 30.47 27.69 25.55 27.37 26.60
Axum KGS 20.51 22.47 22.04 21.47 23.16 23.62 22.31 23.36 25.48
Edaslasie KGS 18.45 23.25 20.18 20.45 22.28 22.73 22.69 24.34 26.73
Hawzen KGS 23.46 23.20 22.50 23.77 23.89 22.23 21.17 24.10 26.60
Humera KGS - - - 19.67 - - - - -
Maichew KGS 19.30 19.68 20.50 19.56 22.23 22.02 22.20 20.12 21.51
Mekelle KGS 22.25 24.45 24.82 26.95 28.03 28.37 28.06 29.14 30.86
Raya-
azebo
KGS - - - - - 25.33 21.62 25.16 27.80
Sheraro KGS 15.86 17.80 17.26 18.80 19.40 - 20.80 21.72 22.08
Wukro KGS - - - 24.50 23.60 25.19 25.95 27.83 28.30
Source: Tigray Agricultural Marketing promotion Agency (TAMPA), 2008