Final Technical Memorandum No. 1 Santa Margarita River ...Santa Margarita River Conjunctive Use...
42
U.S. Department of the Interior Bureau of Reclamation April 2007 Final Technical Memorandum No. 1 Santa Margarita River Conjunctive Use Project
Transcript of Final Technical Memorandum No. 1 Santa Margarita River ...Santa Margarita River Conjunctive Use...

U.S. Department of the Interior Bureau of Reclamation April 2007
Final Technical Memorandum No. 1
Santa Margarita River Conjunctive Use Project
Mission Statements The mission of the Department of the Interior is to protect and provide access to our Nation’s natural and cultural heritage and honor our trust responsibilities to Indian Tribes and our commitments to island communities. The mission of the Bureau of Reclamation is to manage, develop, and protect water and related resources in an environmentally and economically sound manner in the interest of the American public.
U.S. Department of the Interior Bureau of Reclamation April 2007
Final Technical Memorandum No. 1.0
Santa Margarita River Conjunctive Use Project Statistical Analysis of Santa Margarita River Surface Water Availability at the Conjunctive Use Project’s Point of Diversion Prepared by: Stetson Engineers Prepared for: Bureau of Reclamation Southern California Area Office
Santa Margarita River Conjunctive Use Project
iii
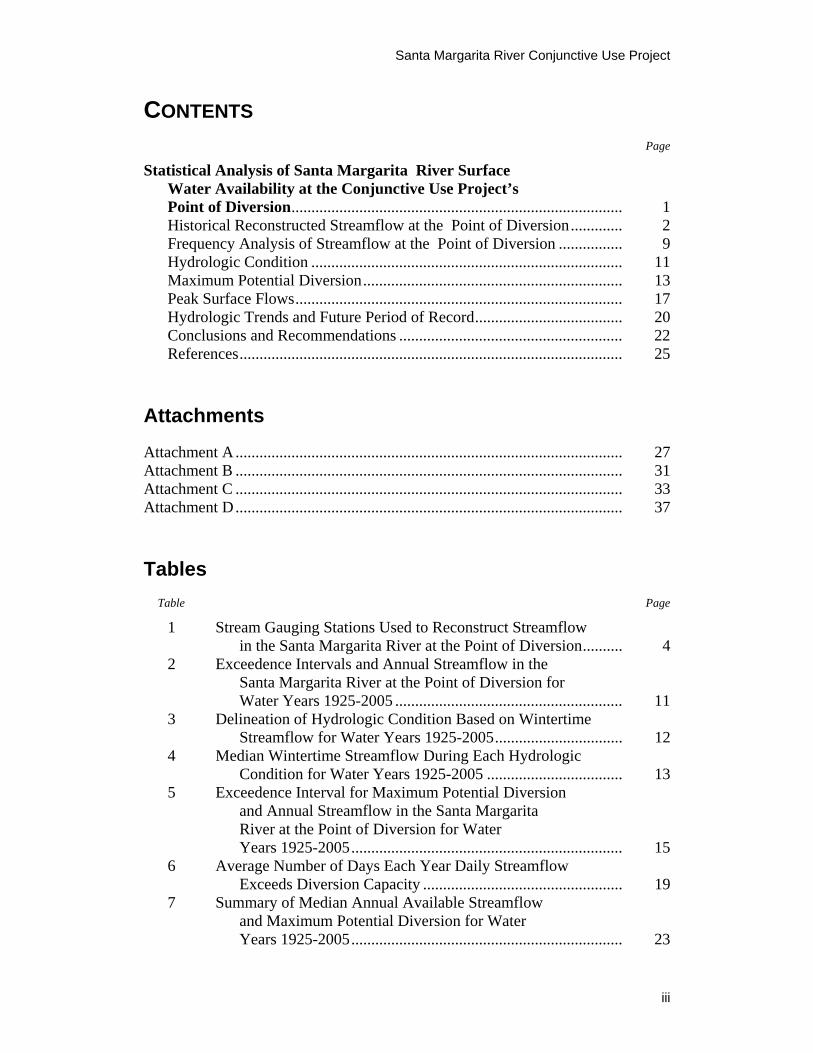
CONTENTS Page
Statistical Analysis of Santa Margarita River Surface Water Availability at the Conjunctive Use Project’s Point of Diversion................................................................................... 1
Historical Reconstructed Streamflow at the Point of Diversion............. 2 Frequency Analysis of Streamflow at the Point of Diversion ................ 9 Hydrologic Condition .............................................................................. 11 Maximum Potential Diversion................................................................. 13 Peak Surface Flows.................................................................................. 17 Hydrologic Trends and Future Period of Record..................................... 20 Conclusions and Recommendations ........................................................ 22 References................................................................................................ 25
Attachments
Attachment A................................................................................................. 27 Attachment B ................................................................................................. 31 Attachment C ................................................................................................. 33 Attachment D................................................................................................. 37
Tables Table Page
1 Stream Gauging Stations Used to Reconstruct Streamflow in the Santa Margarita River at the Point of Diversion.......... 4 2 Exceedence Intervals and Annual Streamflow in the Santa Margarita River at the Point of Diversion for Water Years 1925-2005 ......................................................... 11 3 Delineation of Hydrologic Condition Based on Wintertime Streamflow for Water Years 1925-2005................................ 12 4 Median Wintertime Streamflow During Each Hydrologic Condition for Water Years 1925-2005 .................................. 13 5 Exceedence Interval for Maximum Potential Diversion and Annual Streamflow in the Santa Margarita River at the Point of Diversion for Water Years 1925-2005.................................................................... 15 6 Average Number of Days Each Year Daily Streamflow Exceeds Diversion Capacity .................................................. 19 7 Summary of Median Annual Available Streamflow and Maximum Potential Diversion for Water Years 1925-2005.................................................................... 23
Final Technical Memorandum 1.0
iv
Figures Figure Page
1 Location of Proposed Point of Diversion for the Santa Margarita River CUP ............................................................. 3 2 Streamflow Gauging Stations Used to Reconstruct Streamflow in the Santa Margarita River at the Point of Diversion.................................................................. 5 3 Reconstructed Streamflow in the Santa Margarita River at the Point of Diversion Water Years 1925-2005................. 8 4 Frequency Distribution of Reconstructed Annual Streamflow at the Point of Diversion for Water Years 1925-2005.................................................................... 10 5 Frequency Distribution of Maximum Potential Diversion and Streamflow at the Point of Diversion for Water Years 1925-2005.................................................................... 15 6 Variability of Annual Streamflow and Maximum Potential Diversion for Each Hydrologic Condition for Water Years 1925-2005.................................................................... 18 7 Cumulative Departure from the Mean Curves for Water Years 1925-2005.................................................................... 21
Santa Margarita River Conjunctive Use Project
1
STATISTICAL ANALYSIS OF SANTA MARGARITA RIVER SURFACE WATER AVAILABILITY AT THE CONJUNCTIVE USE PROJECT’S POINT OF DIVERSION The Bureau of Reclamation (Reclamation) has begun work on a feasibility-level study of the Santa Margarita River Conjunctive Use Project (CUP). The CUP is intended to utilize surface water from the Santa Margarita River to enhance groundwater supplies in aquifers located within the Marine Corps Base Camp Pendleton (Camp Pendleton or Base). An environmental impact report and environmental impact statement (EIR/EIS) is concurrently being prepared to identify the environmental impact of various alternatives that may be used to achieve the purpose and need of the proposed CUP. The purpose of this technical memorandum is to develop statistics that describe the availability of Santa Margarita River surface water at the CUP’s point of diversion.
Technical Memorandum 1.0 (TM 1.0) is the first in a series of two technical memoranda that describe the hydrology and hydrogeology of the Santa Margarita River. TM 1.0 addresses the historical variation of flows in the Santa Margarita River over the historical period of record and presents statistics that describe those flows in terms of both total water supply and water available for diversion. Technical Memorandum 2.0 (TM 2.0) will report on the expected groundwater yield from the CUP based on the surface water analysis presented in TM 1.0. The determination of the CUP yield will involve an iterative process of optimizing surface and groundwater resources. These surface and groundwater analyses will be developed based on the statistical variability described and identified below.
Stetson Engineers received authority to proceed from Reclamation on September 20, 2005. Mr. Stephen Reich, Ms. Jean Moran, and Ms. Dawn Taffler of Stetson Engineers met with Reclamation’s feasibility design team members at a kickoff meeting in Denver, Colorado, on October 24 and 25, 2005. Representatives from Reclamation included Mr. Del Holz, Mr. Tom Bellinger, Mr. Bob Talbot, Mr. Bob Hamilton, and the study team’s project manager Ms. Meena Westford. Discussions during the kickoff meeting framed the constraints that would be used for the statistical analysis of water availability over the historical period of record. The purpose of studying Santa Margarita River water availability is to address the probability and occurrence of surface water available for future groundwater modeling runs and eventually the ultimate water yield from the CUP. These model runs will be used to develop management scenarios that maximize groundwater pumping yield from the Base’s aquifers.
The statistical analysis and supporting hydrologic study analyzed and reported in TM 1.0 establishes the boundary conditions that will eventually support Reclamation’s design of extraction, conveyance, and water treatment facilities. The groundwater modeling analysis to be completed under TM 2.0 will consider
Final Technical Memorandum 1.0
2
enhanced groundwater pumping from the Lower Santa Margarita River Basin using the available surface water identified in this technical memorandum. TM 2.0 will eventually describe the monthly and annual volume of water available for delivery to the Haybarn Canyon Water Treatment Plant.
Surface water availability was analyzed for historical hydrologic conditions based on long-term precipitation and streamflow records. Results of previous studies reflected hydrologic conditions based on historical records from 1980 through 1999 (Stetson, 2001). TM 1.0 utilizes the entire historical hydrologic record to extend the previous study period’s hydrologic cycle so that it reflects the driest and wettest periods on record. The flows considered at the point of diversion represent regulated or depleted conditions occurring over the historical period of record, not natural flow conditions that would have been maintained had no development occurred. The use of historical conditions represents the operational water supply available at the point of diversion and provides a more realistic estimation of the CUP’s potential yield. Previous estimates of CUP yield provided by Stetson (2001, 2002) and Reclamation (2005) will be updated with values developed in TM 1.0 and TM 2.0. The surface water availability in TM 1.0 was developed for use in the groundwater model. The recoverable water supply will continue to be refined through the groundwater model calibration process.
The 744-square-mile (mi2) Santa Margarita River basin lies within the counties of San Diego and Riverside in southern California. Hydrological conditions in the Santa Margarita River basin are controlled by wintertime tropical and northern Pacific storm events and, to a minor, degree summer monsoon events. While most of the precipitation occurs as rainfall throughout the watershed, snowfall may occur in the higher mountain ranges located in the upper reaches of the watershed influencing springtime baseflows above Vail Dam. Typical of many Southwestern United States stream systems, extreme peak flows often occur during winter rain events, and minimum baseflows occur during the dry summer months. The flashy nature of the Santa Margarita River and the daily streamflow variability were considered to statistically describe the volume of water available at the point of diversion.
Historical Reconstructed Streamflow at the Point of Diversion
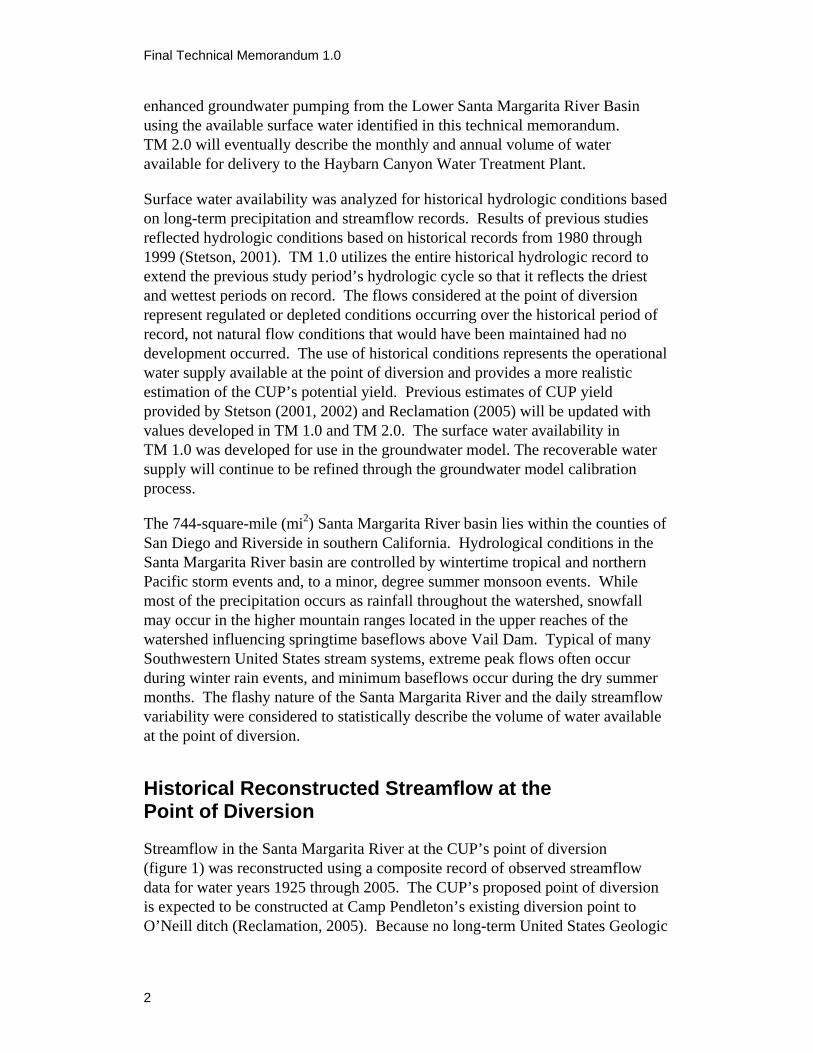
Streamflow in the Santa Margarita River at the CUP’s point of diversion (figure 1) was reconstructed using a composite record of observed streamflow data for water years 1925 through 2005. The CUP’s proposed point of diversion is expected to be constructed at Camp Pendleton’s existing diversion point to O’Neill ditch (Reclamation, 2005). Because no long-term United States Geologic

Santa Margarita River Conjunctive Use Project
3
Figure 1. Location of Proposed Point of Diversion for the Santa Margarita River CUP.

Final Technical Memorandum 1.0
4
Survey (USGS) gauge has ever been established at the existing diversion structure, recorded streamflow data from the USGS gauges listed in table 1 were used to develop a streamflow hydrograph at the diversion point. Figure 2 depicts the location of the historical USGS gauges used to reconstruct flow at the CUP’s proposed point of diversion. Historical daily streamflow observed at these gauge sites were used to simulate an 81-year period of record of streamflow at the CUP’s point of diversion. Missing data from streamflow gauges with incomplete periods of record were reconstructed and calibrated using established hydrologic methods and available data.
Table 1. Stream Gauging Stations Used to Reconstruct Streamflow in the Santa Margarita River at the Point of Diversion1
Station Name Station ID No.
Operating Agency
Period of Record
Drainage Area (mi2)
Santa Margarita River near Temecula (Gorge)
11044000 USGS 2/23-Present 588.0
Santa Margarita River at FPUD Sump
11044300 USGS 10/89-Present 620.0
Sandia Creek near Fallbrook 11044350 USGS 10/89-Present 21.1
Santa Margarita River near Fallbrook
11044500 USGS 10/24-9/80 644.0
De Luz Creek near De Luz 11044800 USGS 10/92-Present 33.0
De Luz Creek near Fallbrook 11044900 USGS 10/51-9/67 47.5
Santa Margarita River at Ysidora (various locations)
11046000 USGS 3/23-Present 723.0
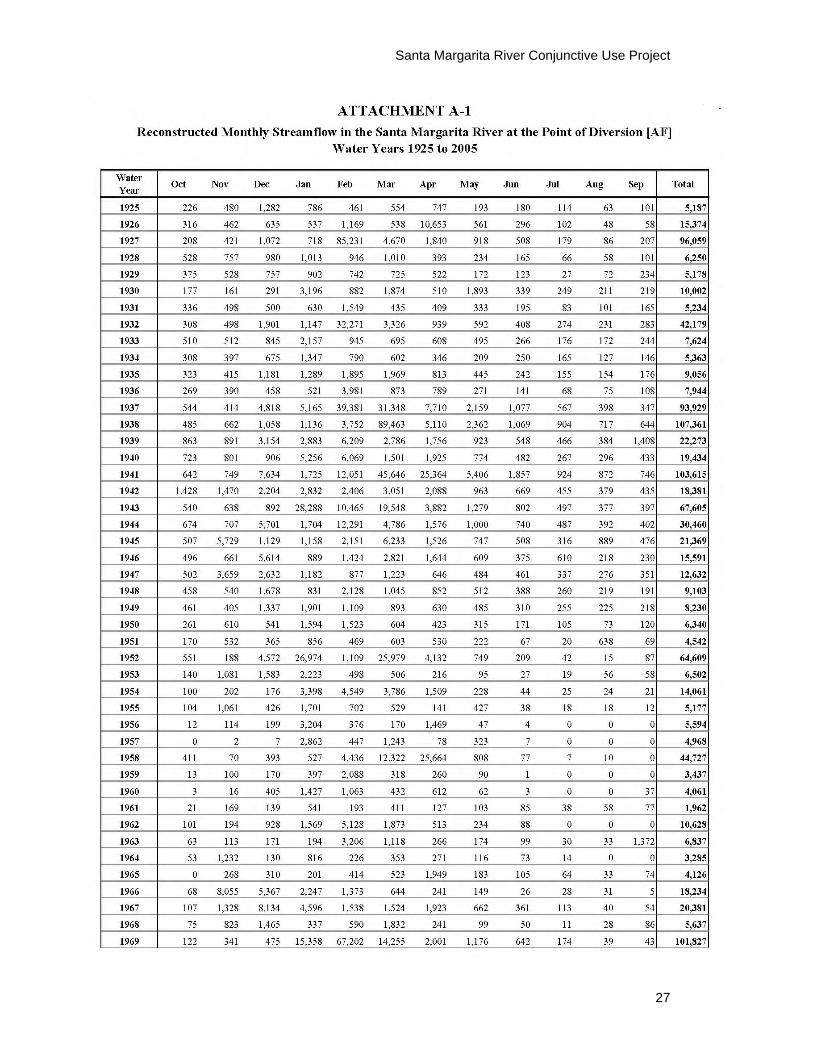
1 mi2 = square miles. A spreadsheet model was developed to reconstruct the streamflow in the Santa Margarita River at the point of diversion. The period of record was divided into three temporal intervals based on the period of record established by the available streamflow gauge data. The development of reconstructed streamflow at the point of diversion is based on observed daily streamflow recorded by the USGS and precipitation data from the National Ocean and Atmospheric Administration (NOAA) and Camp Pendleton. Annual and monthly streamflow records, at the point of diversion, were also developed from the hydrologic analysis that relied on the historical daily data. The hydrologic record is described by three time periods defined by the date when streamflow gauges in the lower Santa Margarita River Watershed were established.
• Water Years 1925 to 1980: The total streamflow at the point of diversion was calculated based on adding the streamflow from the Santa
Santa Margarita River Conjunctive Use Project
5
Figure 2. Streamflow Gauging Stations Used to Reconstruct Streamflow in the Santa Margarita River at the Point of Diversion.

Final Technical Memorandum 1.0
6
Margarita River near Fallbrook gauge (USGS #11044500) to streamflow from DeLuz Creek, plus estimated accretion between the downstream gauges and the point of diversion. The contribution from Sandia Creek was included in the Santa Margarita River near Fallbrook gauge during this period since the former gauge was located downstream from their confluence. During water years 1952 through 1967, streamflow from the DeLuz Creek gauge near Fallbrook (USGS #11044900) accounted for the contribution of streamflow from DeLuz Creek. For all other years, the contribution from DeLuz Creek was calculated using proportionality constant based on ratio of DeLuz Creek gauge and Santa Margarita River near Fallbrook gauge drainage areas.
• Water Years 1981 to 1989: The streamflow records in the lower Santa Margarita River basin during water years 1981 through 1989 were deficient due to missing gauge data. During the 1980 flood, the Santa Margarita River near Fallbrook gauge (USGS #11044500) was washed out and was not reconstructed until 1989. A new gauge was installed in 1989 at the Fallbrook Public Utility District (FPUD) Sump on the Santa Margarita River (USGS #11044300), upstream of the confluence with Sandia Creek. The only reliable historical streamflow dataset available during the 1981 to 1989 period of record was from the Santa Margarita River near Temecula gauge (USGS #11044000), commonly referred to as the Gorge.
To reconstruct streamflow at the point of diversion, the contribution of streamflow below the Gorge was estimated using the Soil Conservation Service (SCS) Curve Number method and the United States Environmental Protection Agency’s (USEPA) Hydrologic Simulation Program-Fortran (HSPF). The SCS method was used to calculate surface runoff during precipitation events while the HSPF model was used to simulate baseflows in each drainage area. Stetson Engineers applied these two methods in the development of the Permit 15000 water availability study (Stetson, 2001).
• Water Years 1990 to 2005: Streamflow at the point of diversion for the most recent period was developed by summing historical streamflow data from the Santa Margarita River at FPUD Sump (USGS #11044300), Sandia Creek (USGS #11044350), and De Luz Creek (USGS #11044800) gauges, plus estimated accretion between the downstream gauges and the point of diversion. The new DeLuz Creek gauge, located in the upper two-thirds of the DeLuz Creek basin, was multiplied by a proportionality constant to calculate contributions from lower DeLuz Creek. Missing data from De Luz Creek between October 1989 and October 1992 was calculated using a proportionality constant based on ratio of the DeLuz and Sandia Creek (47.5 mi2/ 21 mi2) drainage areas. The observed

Santa Margarita River Conjunctive Use Project
7
streamflow data obtained from the USGS for water year 2005 was identified as “Provisional” at the time of this analysis.
Geomorphologic conditions significantly influence the occurrence of surface flow and subsurface flow occurring below the Gorge. The geologic map indicates minimal stream channel alluvial sediments at the Gorge, thus the flow at this location is considered to be entirely surface flow. From the Gorge to the confluence with DeLuz Creek, the amount of alluvial sediment ranges from 15 to 20 feet, allowing for a portion of the total water supply to occur as subflow. Below the DeLuz Creek confluence, the alluvium increases considerably, supporting a larger volume of subflow. A general head boundary in the groundwater model evaluates the subflow contribution at the model boundary, identifying subflow contributions on a monthly basis. Thus, the recoverable portion of subflow is accounted for in the groundwater model, which will be examined in more detail in TM 2.0. Due to the occurrence of alluvial sediments in the stream channel, a portion of the baseflow for the drainage areas below the USGS gauges is accounted for in the groundwater model.
The surface water analysis utilized the SCS Curve Number method to calculate the contribution to peak flows occurring during storm events for the drainage areas below the USGS gauges. A California isohyetal map depicting average annual precipitation contours was used to predict the spatial distribution of rainfall in the lower portion of the Santa Margarita River Basin (Daly, 1998). A precipitation ratio, interpreted from the distribution of the average annual isohyetal contours below the USGS gauges, was employed to account for local variability in rainfall when calculating peak flow contributions for ungauged drainage areas. Daily and hourly Oceanside precipitation data were multiplied by the precipitation ratio to calculate precipitation excess, antecedent moisture conditions, and surface runoff during storm events for ungauged drainage areas.
An iterative calibration process using actual and simulated data was employed to reconstruct the streamflow at the point of diversion. The analysis included the investigation of multiple streamflow computational methods to calculate peak flow events and baseflows for ungauged drainage areas and missing data. The methods employed to estimate streamflow during periods of missing data were calibrated to periods of known streamflow to correlate results and identify inconsistencies. Observed flows from the Santa Margarita River near the Ysidora gauge were not used in the surface water calibration process due to the poorly constrained physical conditions that influence the quality of the data, the impact of groundwater pumping from the lower Santa Margarita River basin, and the effect of five different historical gauge locations over 7 miles. The surface water hydrology was developed to statistically describe surface water availability and to reconstruct streamflow at the groundwater model boundary. Additional refinements to streamflow at the point of diversion may occur throughout the groundwater model calibration process.
Final Technical Memorandum 1.0
8
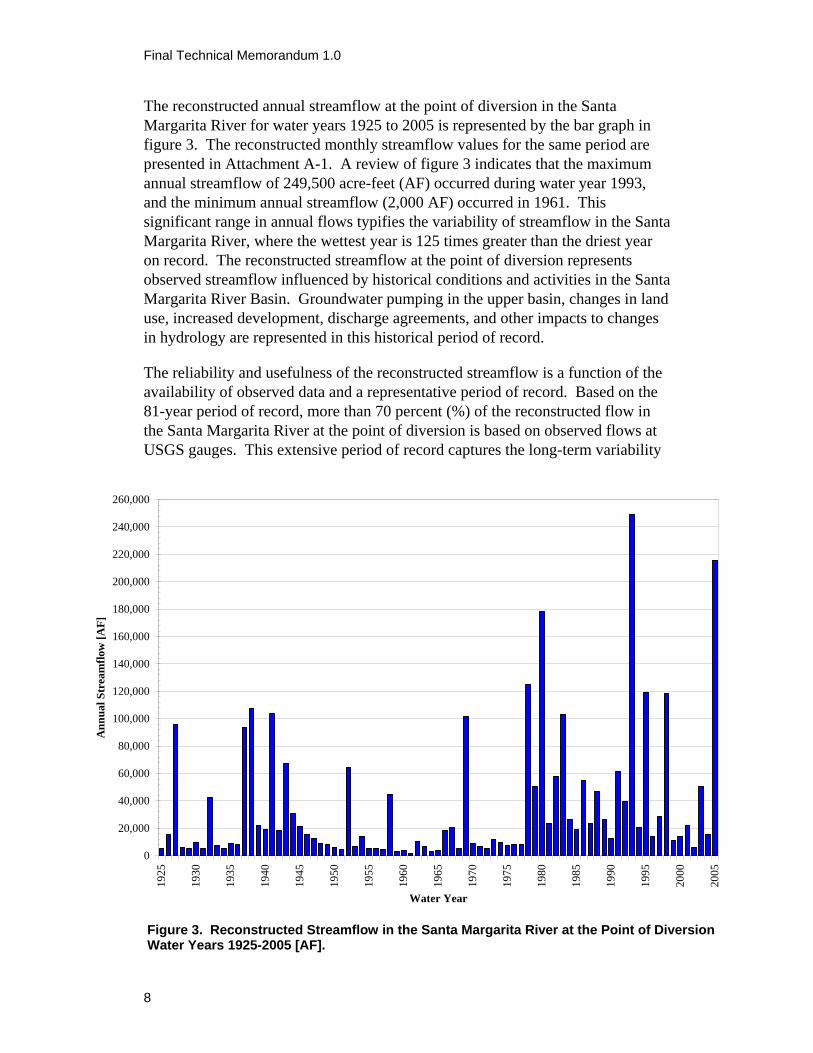
The reconstructed annual streamflow at the point of diversion in the Santa Margarita River for water years 1925 to 2005 is represented by the bar graph in figure 3. The reconstructed monthly streamflow values for the same period are presented in Attachment A-1. A review of figure 3 indicates that the maximum annual streamflow of 249,500 acre-feet (AF) occurred during water year 1993, and the minimum annual streamflow (2,000 AF) occurred in 1961. This significant range in annual flows typifies the variability of streamflow in the Santa Margarita River, where the wettest year is 125 times greater than the driest year on record. The reconstructed streamflow at the point of diversion represents observed streamflow influenced by historical conditions and activities in the Santa Margarita River Basin. Groundwater pumping in the upper basin, changes in land use, increased development, discharge agreements, and other impacts to changes in hydrology are represented in this historical period of record.
The reliability and usefulness of the reconstructed streamflow is a function of the availability of observed data and a representative period of record. Based on the 81-year period of record, more than 70 percent (%) of the reconstructed flow in the Santa Margarita River at the point of diversion is based on observed flows at USGS gauges. This extensive period of record captures the long-term variability
0
20,000
40,000
60,000
80,000
100,000
120,000
140,000
160,000
180,000
200,000
220,000
240,000
260,000
1925
1930
1935
1940
1945
1950
1955
1960
1965
1970
1975
1980
1985
1990
1995
2000
2005
Water Year
Ann
ual S
trea
mflo
w [A
F]
Figure 3. Reconstructed Streamflow in the Santa Margarita River at the Point of Diversion Water Years 1925-2005 [AF].

Santa Margarita River Conjunctive Use Project
9
of surface water in the Santa Margarita River at the point of diversion. The 81-year period of record includes extended dry and wet hydrologic periods. For example, the period from the late 1940s to early 1960s is characteristic of an extended dry-cycle in the Santa Margarita River watershed (Stetson, 2001). Conversely, the 1990s is considered to be an extended wet period. The extended wet and dry cycles can best be described using cumulative departure from mean curves that graphically describe wet and dry cycles (Stetson, 2001, 2002).
Frequency Analysis of Streamflow at the Point of Diversion
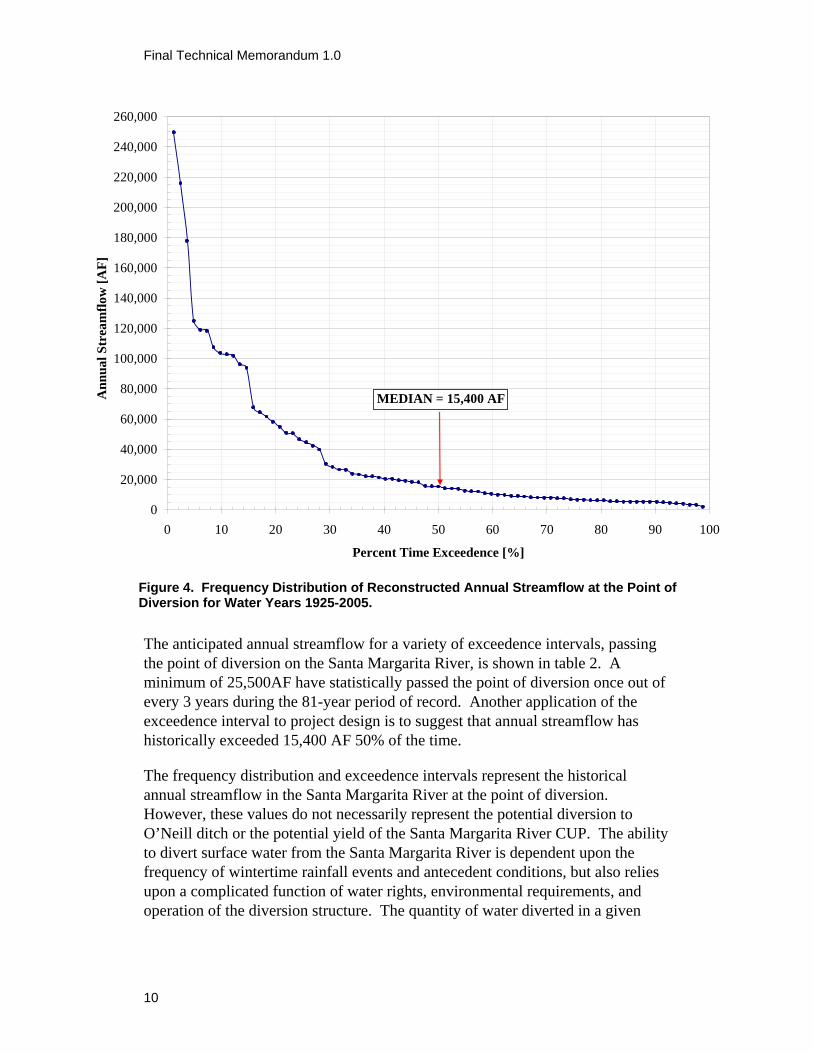
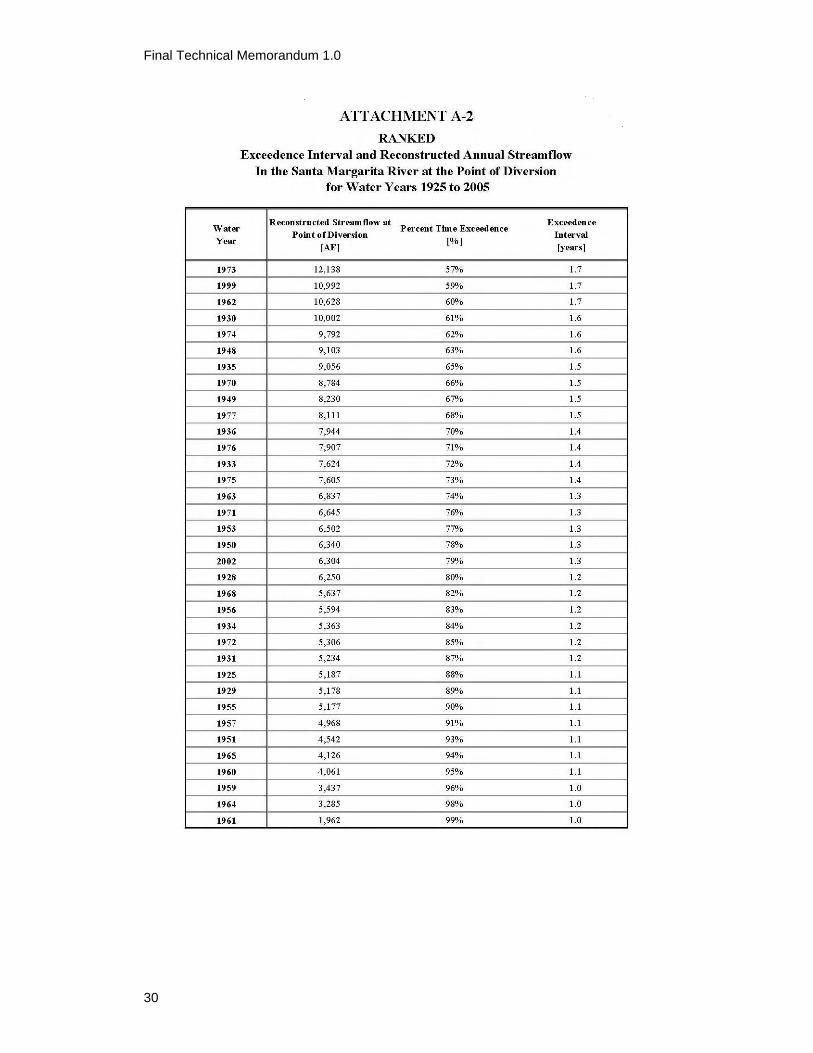
A frequency analysis was performed on historical annual streamflow in the Santa Margarita River at the point of diversion for the 81-year period of record to establish the frequency that annual streamflow volumes were historically exceeded. Similar to recurrence intervals assigned to flood events, exceedence intervals are used to establish a basis for predicting the frequency of future annual streamflow values. The historical streamflow for each year is ranked and assigned a percent time exceedence. The frequency curve depicts the frequency at which a given annual streamflow at the point of diversion was historically exceeded during the 81-year historical period (figure 4). Attachment A-2 lists the annual streamflow values at the point of diversion for this period, ranked in descending order.
The exceedence interval provides a statistical expression of the probability that an annual streamflow will be equaled or exceeded in any given year. For this analysis, the exceedence interval represents the period of time, in years, that an annual flow will likely be exceeded and is calculated as the inverse of the percent time exceedence. For example, the median (50%) annual flow (15,400 AF) represents a minimum volume that is expected to be exceeded 1 year out of every 2 years (1 divided by 50%). Streamflow during the other of the 2 years is statistically expected to be less than 15,400 AF.
Similar to flood events in which two or three “10-year” events may occur in a single year, annual streamflow above the median flow value may occur on the Santa Margarita River concurrently from year to year. Storage facilities, including both surface reservoirs and groundwater aquifers, uniquely reduce the natural variability so that the median flow value becomes a more statistically meaningful number in the arid Southwestern United States. Diversion of water to either surface or underground storage reduces the impact of the natural variability to the water supply. Surface water during dry years may be captured and stored, increasing the water available during those years—effectively reducing the occurrence interval of dry years.
Final Technical Memorandum 1.0
10
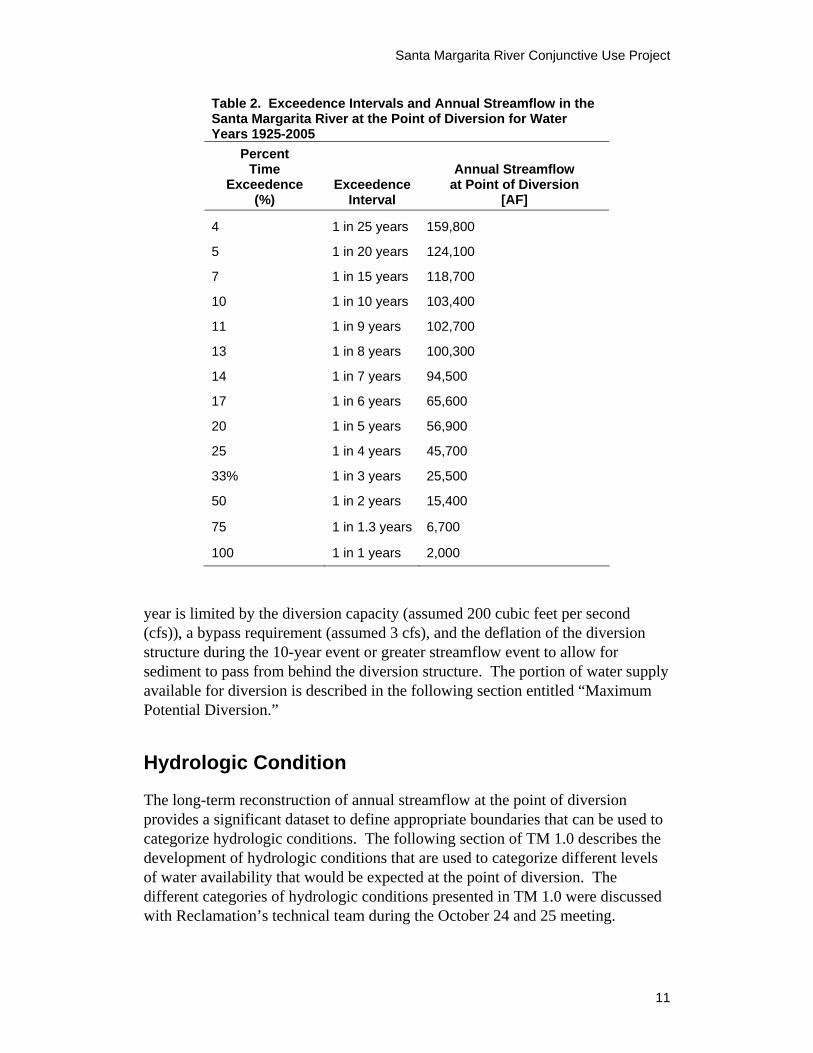
The anticipated annual streamflow for a variety of exceedence intervals, passing the point of diversion on the Santa Margarita River, is shown in table 2. A minimum of 25,500AF have statistically passed the point of diversion once out of every 3 years during the 81-year period of record. Another application of the exceedence interval to project design is to suggest that annual streamflow has historically exceeded 15,400 AF 50% of the time.
The frequency distribution and exceedence intervals represent the historical annual streamflow in the Santa Margarita River at the point of diversion. However, these values do not necessarily represent the potential diversion to O’Neill ditch or the potential yield of the Santa Margarita River CUP. The ability to divert surface water from the Santa Margarita River is dependent upon the frequency of wintertime rainfall events and antecedent conditions, but also relies upon a complicated function of water rights, environmental requirements, and operation of the diversion structure. The quantity of water diverted in a given
0
20,000
40,000
60,000
80,000
100,000
120,000
140,000
160,000
180,000
200,000
220,000
240,000
260,000
0 10 20 30 40 50 60 70 80 90 100
Percent Time Exceedence [%]
Ann
ual S
trea
mflo
w [A
F]
MEDIAN = 15,400 AF
Figure 4. Frequency Distribution of Reconstructed Annual Streamflow at the Point of Diversion for Water Years 1925-2005.
Santa Margarita River Conjunctive Use Project
11
Table 2. Exceedence Intervals and Annual Streamflow in the Santa Margarita River at the Point of Diversion for Water Years 1925-2005
Percent Time
Exceedence (%)
Exceedence Interval
Annual Streamflow at Point of Diversion
[AF]
4 1 in 25 years 159,800
5 1 in 20 years 124,100
7 1 in 15 years 118,700
10 1 in 10 years 103,400
11 1 in 9 years 102,700
13 1 in 8 years 100,300
14 1 in 7 years 94,500
17 1 in 6 years 65,600
20 1 in 5 years 56,900
25 1 in 4 years 45,700
33% 1 in 3 years 25,500
50 1 in 2 years 15,400
75 1 in 1.3 years 6,700
100 1 in 1 years 2,000
year is limited by the diversion capacity (assumed 200 cubic feet per second (cfs)), a bypass requirement (assumed 3 cfs), and the deflation of the diversion structure during the 10-year event or greater streamflow event to allow for sediment to pass from behind the diversion structure. The portion of water supply available for diversion is described in the following section entitled “Maximum Potential Diversion.”
Hydrologic Condition
The long-term reconstruction of annual streamflow at the point of diversion provides a significant dataset to define appropriate boundaries that can be used to categorize hydrologic conditions. The following section of TM 1.0 describes the development of hydrologic conditions that are used to categorize different levels of water availability that would be expected at the point of diversion. The different categories of hydrologic conditions presented in TM 1.0 were discussed with Reclamation’s technical team during the October 24 and 25 meeting.

Final Technical Memorandum 1.0
12
Hydrologic conditions in the lower Santa Margarita River basin were established in order to statistically group each year’s water availability into one of four different categories. Due to the influence of wintertime precipitation events on annual streamflow, October through April wintertime total streamflow volume was used to define the limits of four hydrologic conditions: Very Wet, Above Normal, Below Normal, and Extremely Dry. These four hydrologic conditions establish the boundaries that will be used to identify and statistically describe historical and future streamflow at the point of diversion. Furthermore, these four hydrologic conditions will be used to create limitations and boundary conditions that will be used to establish project yield from the groundwater model.
The four hydrologic conditions for the lower Santa Margarita River basin are based on the wintertime flows during the 81-year reconstructed streamflow in the Santa Margarita River at the point of diversion to O’Neill ditch. The frequency distribution of October through April total streamflow at the point of diversion was used to define the upper and lower boundary of each hydrologic condition. The wintertime streamflow frequency curve is divided into four parts, established by graphical slope breaks (Attachment B-1). These slope breaks allow each water year in the 81-year period of record to be categorized by a hydrologic condition based on the total volume of wintertime streamflow. The range of results extracted from the frequency distribution and graphical slope break analysis for each hydrologic condition are shown in Table 3. The median wintertime streamflow (13,700 AF) represents the break between Above Normal and Below Normal hydrologic conditions, while the average wintertime streamflow (33,100 AF) falls within the Above Normal hydrologic category. This is typical in the arid Southwest, where high volumes of wintertime streamflow during Very Wet hydrologic years significantly increase the range between the average and median streamflow values. The median wintertime streamflow (13,700 AF) is predictably less than the median annual streamflow (15,400 AF) due to the exclusion of nonwinter streamflow values.
Table 3. Delineation of Hydrologic Condition Based on Wintertime Streamflow for Water Years 1925-2005
Hydrologic Condition
Range of Wintertime Streamflow
[AF]
Range of Wintertime Streamflow
Percent Time Exceedence [%]
Very Wet 239,400 to 56,700 1 to 19 Above Normal 56,699 to 13,700 20 t0 50 Below Normal 13,699 to 5,800 51 to 75 Extremely Dry 5,799 to 1,600 76 to 100
Notes: Wintertime streamflow calculated as the total October through April Santa Margarita River streamflow at the point of diversion. The median wintertime streamflow (13,700 AF) represents the break between Above Normal and Below Normal hydrologic conditions.

Santa Margarita River Conjunctive Use Project
13
Wintertime streamflow at the point of diversion during Very Wet hydrologic conditions ranged between 56,700 and 239,400 AF based on the 81-year historical period. Further review of the annual percent time exceedence for flows that fell within this range indicated these flows occurred between 1 and 19% of the time. Similarly, review of Below Normal hydrologic conditions indicated that streamflow during these periods ranged between 5,800 and 13,699 AF and occurred between 51 and 75% of the time. Interpretation of exceedence intervals of streamflow during the historical period of record further suggests that annual flows will be 5,800 AF or greater at least 75% of the time.
Another aspect of describing the variability of flows during each hydrologic condition can be expressed in median wintertime streamflow values (table 4 and Attachment B-2). The median wintertime streamflow at the point of diversion during Very Wet hydrologic conditions was 99,800 AF. While Very Wet hydrologic conditions occurred 19% of the time on the Santa Margarita River, the median wintertime flow associated with Very Wet conditions occurred only 10% of the time. Similarly, Above Normal hydrologic conditions took place between 20% and 50% of the time, but the median wintertime flow associated with Above Normal conditions (22,100 AF) occurred only 35% of the time.
Table 4. Median Wintertime Streamflow During Each Hydrologic Condition for Water Years 1925–2005
Hydrologic Condition
Median Wintertime Streamflow
[AF]
Median Wintertime Streamflow Percent Time Exceedence
[%] Very Wet 99,800 10 Above Normal 22,100 35 Below Normal 8,200 62 Extremely Dry 4,600 87
Maximum Potential Diversion
The availability of surface water in the Santa Margarita River is highly variable. Large storms in the winter months typically provide a significant portion of the total annual flow in the river. The most efficient diversion of peak flow events would be the use of an in-stream dam and reservoir. Development of off-stream reservoirs are similarly infeasible since they demand large diversion and conveyance facilities that would require a design with flow rates exceeding at least 1,000 cfs. As previously stated, the quantity of water diverted under the proposed CUP is limited by the diversion capacity (200 cfs), the assumed year-around bypass requirement (3 cfs), and the deflation of the diversion structure

Final Technical Memorandum 1.0
14
during the 10-year or greater event to allow for sediment to pass from behind the diversion structure, all of which are incorporated into the TM 1.0 analysis. The quantity of water diverted is further limited by storage in Lake O’Neill and the existing and rehabilitated recharge ponds, the groundwater aquifer’s recharge capacity, the pumping schedule, and the groundwater aquifer’s storage capacity, which will be accounted for in the TM 2.0 analysis.
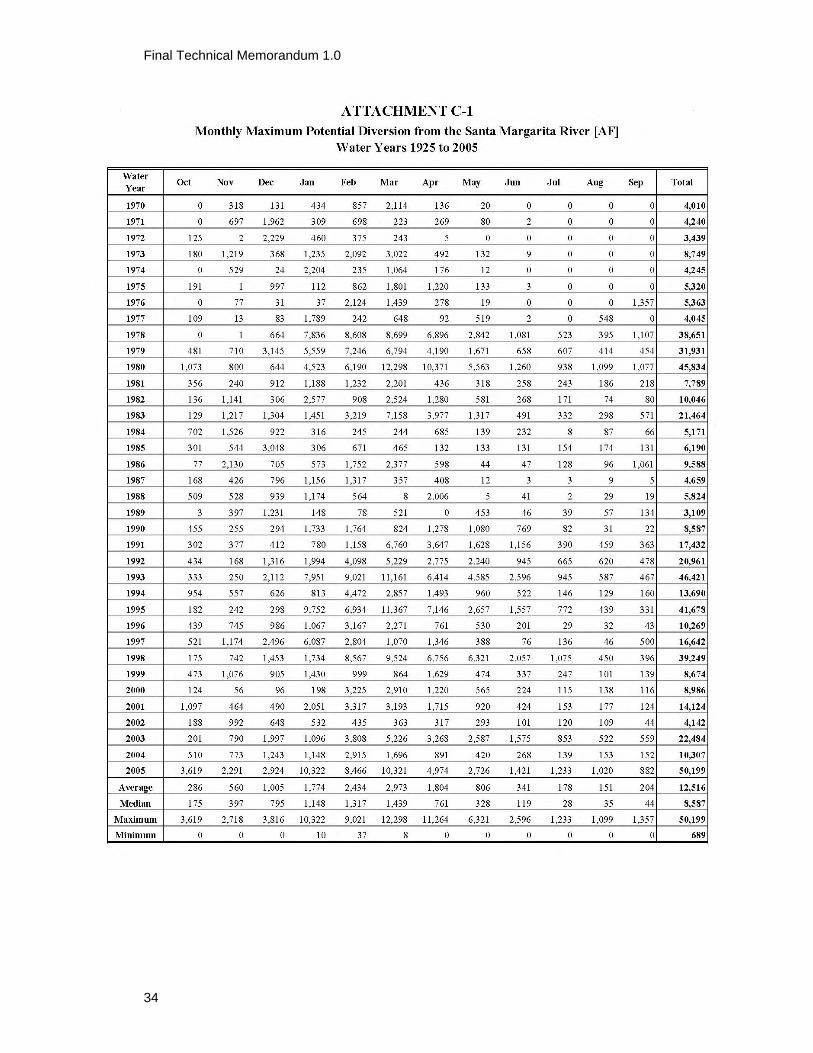
The maximum potential diversion is defined in TM 1.0 as the water diverted from the Santa Margarita River to O’Neill ditch for use by the CUP and is based on the assumed diversion constraints. Water diverted for use by the CUP includes surface water diverted to both Lake O’Neill and the groundwater recharge ponds. The actual determination of CUP yield will be presented in TM 2.0 based on an iterative process that optimizes surface water diversions and groundwater withdrawals using the lower Santa Margarita Groundwater model. As stated above, the maximum potential surface water available for diversion assumes the following constraints: 200-cfs maximum capacity diversion structure, a 3-cfs bypass, and the deflation of the diversion structure during the 10-year or greater event. This analysis does not take into account overflow spill from the recharge ponds, variable recharge rates, or the capacity of the groundwater basin influenced by groundwater pumping. The maximum monthly streamflow that can potentially be diverted in water years 1925 through 2005 based on the assumed diversion constraints is presented in Attachment C-1.
A frequency distribution was performed to rank and analyze the maximum potential diversion to Lake O’Neill and the recharge ponds for the 81-year period of record. The annual volume of maximum potential diversion for water years 1925 through 2005 is ranked in descending order in Attachment C-2. The frequency curve shown in figure 5 depicts a comparison between the percent time exceedence of the maximum potential diversion and the annual streamflow at the point of diversion. The gap between annual streamflow and maximum potential diversion is greatest during years characterized by a probability of exceedence of less than 30% (1 in every 3.3 years), typically Very Wet or Above Normal hydrologic conditions. The gap is due to the inability of the proposed facilities to capture large peak flow events. The gap between the two curves also includes the quantity of streamflow bypassed each year to satisfy the 3-cfs bypass requirement. The deviation between available water supply and maximum potential diversion illustrates the importance of designing conveyance systems based on that portion of total annual flow that can realistically captured.

Santa M
argarita River C
onjunctive Use P
roject 15
.
0
20000
40000
60000
80000
100000
120000
140000
160000
180000
200000
220000
240000
260000
0 10 20 30 40 50 60 70 80 90 100
Percent Time Exceedence [%]
Ann
ual S
trea
mflo
w [A
F]
Streamflow at Point of DiversionMaximum Potential Diversion
MEDIAN SMR Flow at Diversion = 15,400 AFY MEDIAN Potential Diversion = 8,600 AFY
Figure 5. Frequency Distribution of Maximum Potential Diversion and Streamflow at the Point of Diversion for Water Years 1925-2005.

Final Technical Memorandum 1.0
16
The annual streamflow at the point of diversion and the maximum potential diversion for common exceedence intervals are shown in table 5. The table is reflective of historical conditions and may not necessarily reflect the maximum potential diversion due to changes in future flow regimes due to urban development and upstream mitigation of the water supply stipulated in the 2002 Cooperative Water Resources Management Agreement (CWRMA). The table also fails to account for water that may recharge the groundwater aquifer by infiltrating the stream channel alluvium downstream from the point of diversion. The accounting of water spilling from either Lake O’Neill or the recharge ponds is incorporated in a Reservoir Operations Model (ROM) which is an input to the groundwater model to be analyzed in TM 2.0. The analysis of the groundwater model will provide a final value of maximum potential diversion once recharge to the aquifer, spill from the facilities, and changes due to the CWRMA have been fully accounted for in the development of CUP project yield.
Table 5. Exceedence Interval for Maximum Potential Diversion and Annual Streamflow in the Santa Margarita River at the Point of Diversion for Water Years 1925–2005
Percent Time
Exceedence [%]
Exceedence Interval
Annual Streamflow at Point of Diversion
[AF]
Potential Diversion
[AF] 4% 1 in 25 years 159,800 44,800 5% 1 in 20 years 124,100 42,600 7% 1 in 15 years 118,700 40,400
10% 1 in 10 years 103,400 34,300 11% 1 in 9 years 102,700 31,200 13% 1 in 8 years 100,300 25,800 14% 1 in 7 years 94,500 23,300 17% 1 in 6 years 65,600 21,500 20% 1 in 5 years 56,900 18,600 25% 1 in 4 years 45,700 17,000 33% 1 in 3 years 25,500 12,700 50% 1 in 2 years 15,400 8,600 75% 1 in 1.3 years 6,700 4,100
100% 1 in 1 years 2,000 700
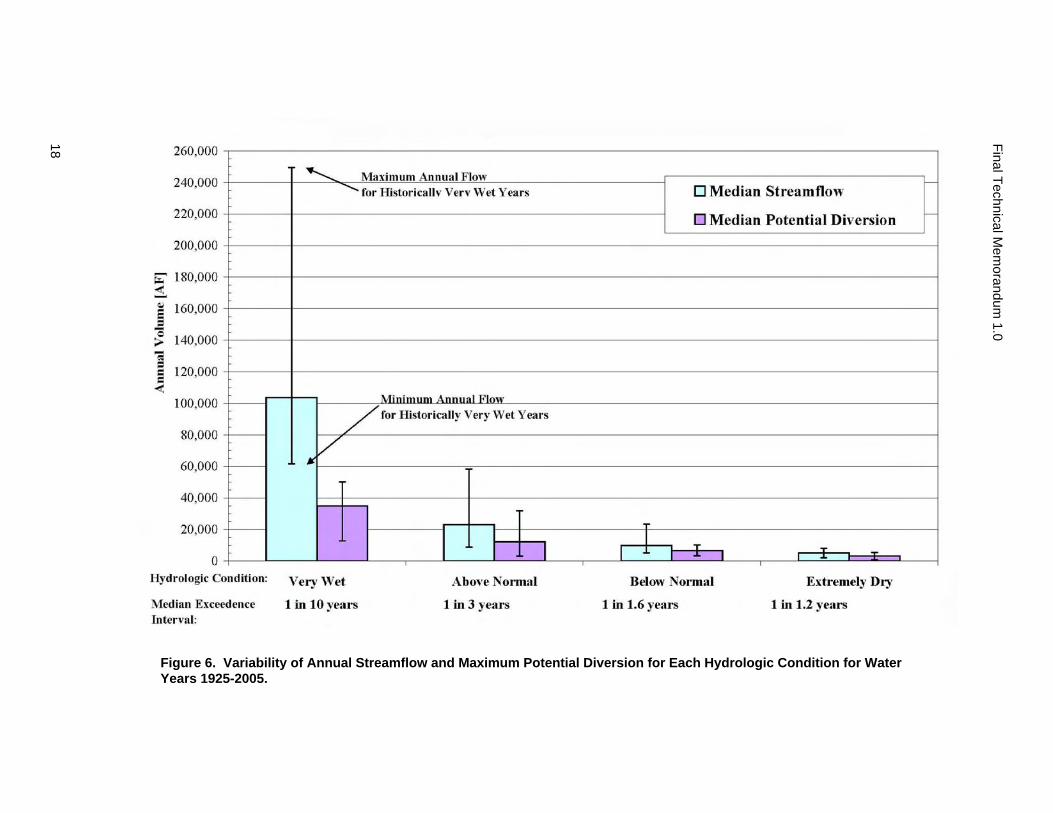
As previously discussed, each water year in the 81-year period of record can be categorized by hydrologic condition based on the total volume of wintertime streamflow. The variability of annual streamflow and maximum potential diversion for the water years grouped in each hydrologic condition is graphically

Santa Margarita River Conjunctive Use Project
17
represented in figure 6. The median annual streamflow and median potential diversion for the water years grouped in each hydrologic condition are represented by the vertical bars. The length of the vertical line, centered on each bar, represents the historical range in annual volume for the 81-year period. For example, water passing the point of diversion during Very Wet hydrologic conditions ranged between 61,600 and 249,500 AF with a median value of 103,600 AF, while the water available for diversion during these same years ranged between 12,800 and 50,200 AF with a median value of 35,000 AF. The reason for the disparity between the two ranges and median values is largely due to the volume of water contained in flows greater than 200 cfs which pass the point of diversion during short-duration peak flow events. These large flows cannot be captured by the diversion facilities due to capacity limitations and the deflation requirement. A daily accounting of streamflow rates is provided in the following section to describe the frequency and quantity of large flow events that are either difficult or impossible to capture without an in-stream storage facility.
Peak Surface Flows
In addition to investigating the annual flows at the point of diversion and the maximum potential diversion, Stetson Engineers investigated both daily and monthly surface water flows. Similar to the trends in variability that exists when reviewing annual volumes, the variability in daily and monthly streamflow in any given year is greatest during Very Wet hydrologic conditions and least during Extremely Dry conditions. Water Year 1991 is a typical example of the variability that exists in the Santa Margarita River’s monthly and daily streamflow record during Very Wet hydrologic conditions. Daily streamflow at the point of diversion averaged 25 cfs from October 1990 through February 1991 but increased to average more than 400 cfs from March 1991 through April 1991. This demonstrates that low baseflows typically occur in the early winter period following the dry summer months. As spring arrives, the ground has become saturated, and increased precipitation events translate into surface runoff and higher baseflows. Thus, in Very Wet hydrologic conditions, a large portion of the annual flow volume tends to pass the point of diversion over a few days during peak flow events. This results in a significant amount of the annual flow volume that cannot be captured by CUP facilities designed to divert only 200 cfs. The following section presents the variability in daily streamflow during each type of hydrologic condition that affects the volume of water that can be utilized by the CUP.
TM 1.0 has described the difference between water passing the point of diversion (annual streamflow) and maximum potential diversion for use by the CUP. The disparity between the values is based on the maximum 200-cfs diversion, the 3-cfs bypass, and the need to deflate the diversion structure to allow sediment to pass
Final Technical Mem
orandum 1.0
18
Figure 6. Variability of Annual Streamflow and Maximum Potential Diversion for Each Hydrologic Condition for Water Years 1925-2005.
Santa Margarita River Conjunctive Use Project
19
during the 10-year or greater storm event. Figure 6 graphically depicts the variance during Very Wet hydrologic conditions, demonstrating the median streamflow passing the point of diversion (103,600 AF) is three times greater than the median potential water available for diversion (35,000 AF). The difference between water availability and maximum potential diversion can best be explained by investigating the percent time exceedence of flows greater than 200 cfs.
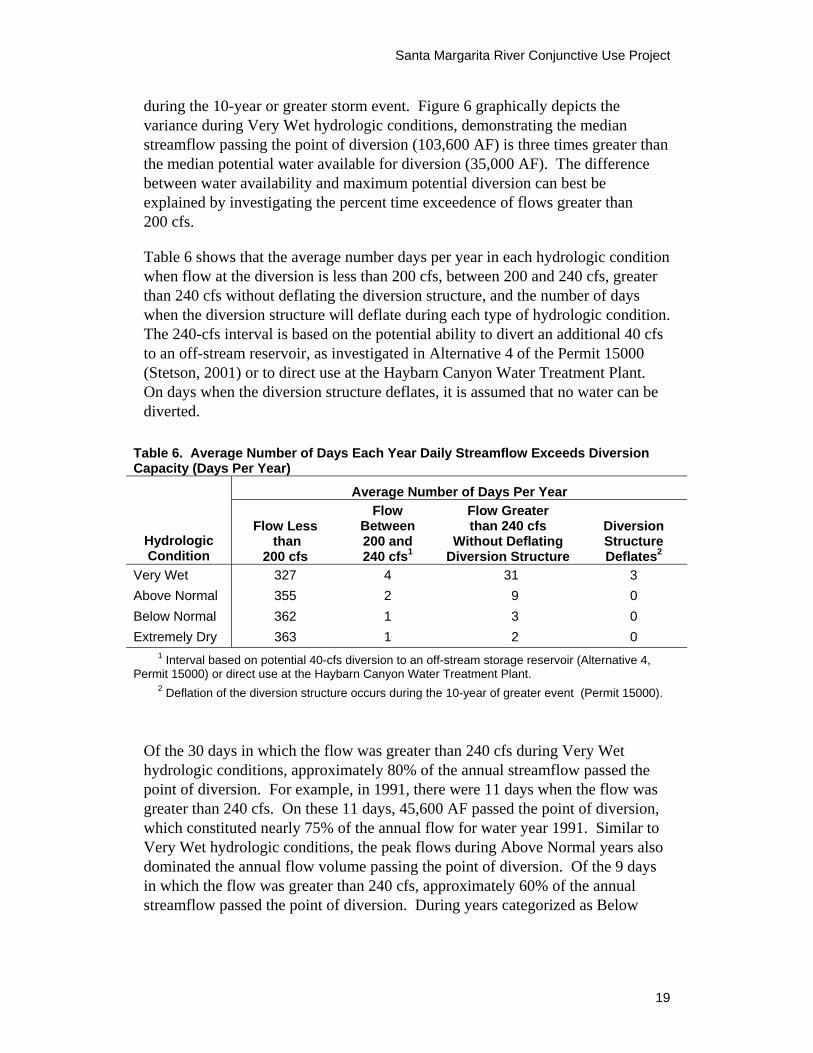
Table 6 shows that the average number days per year in each hydrologic condition when flow at the diversion is less than 200 cfs, between 200 and 240 cfs, greater than 240 cfs without deflating the diversion structure, and the number of days when the diversion structure will deflate during each type of hydrologic condition. The 240-cfs interval is based on the potential ability to divert an additional 40 cfs to an off-stream reservoir, as investigated in Alternative 4 of the Permit 15000 (Stetson, 2001) or to direct use at the Haybarn Canyon Water Treatment Plant. On days when the diversion structure deflates, it is assumed that no water can be diverted.
Table 6. Average Number of Days Each Year Daily Streamflow Exceeds Diversion Capacity (Days Per Year)
Average Number of Days Per Year
Hydrologic Condition
Flow Less than
200 cfs
Flow Between 200 and 240 cfs1
Flow Greater than 240 cfs
Without Deflating Diversion Structure
Diversion Structure Deflates2
Very Wet 327 4 31 3 Above Normal 355 2 9 0 Below Normal 362 1 3 0 Extremely Dry 363 1 2 0 1 Interval based on potential 40-cfs diversion to an off-stream storage reservoir (Alternative 4, Permit 15000) or direct use at the Haybarn Canyon Water Treatment Plant. 2 Deflation of the diversion structure occurs during the 10-year of greater event (Permit 15000).
Of the 30 days in which the flow was greater than 240 cfs during Very Wet hydrologic conditions, approximately 80% of the annual streamflow passed the point of diversion. For example, in 1991, there were 11 days when the flow was greater than 240 cfs. On these 11 days, 45,600 AF passed the point of diversion, which constituted nearly 75% of the annual flow for water year 1991. Similar to Very Wet hydrologic conditions, the peak flows during Above Normal years also dominated the annual flow volume passing the point of diversion. Of the 9 days in which the flow was greater than 240 cfs, approximately 60% of the annual streamflow passed the point of diversion. During years categorized as Below

Final Technical Memorandum 1.0
20
Normal and Extremely Dry, there are only a few days when the flow was greater than 240 cfs, but even one storm event may account for a significant percentage of that year’s total flow.
The computation of the average number of days per year that daily streamflow exceeds diversion capacity has been presented to show the number of days that elevated flows in the Santa Margarita River occur. Elevated streamflow beyond 200 cfs may be due to a peak storm event that occurred either that day or as the result of a previous day’s peak flow event. In either case, a statistical analysis of peak storm events is not warranted at this time because the effect of groundwater recharge through the streambed alluvium has not been taken into account. The need to recharge the aquifer and utilize the storage capacitance of the aquifer should be considered before statistical analysis regarding availability of peak daily streamflow is performed.
Hydrologic Trends and Future Period of Record
Due to the hydrologic variability of the Santa Margarita River Basin, the surface water and groundwater analysis (TM 2.0) for the CUP will require the development of a future period of record that is representative of the historical variability of hydrologic conditions. The statistics presented in this technical memorandum are based on the historical 81-year period of record. For the next phase of the water availability analysis, it is recommended that the groundwater model simulate historic trends over a 50-year period of record. The 50-year period of record will be developed to represent hydrology that captures antecedent conditions over extended dry and wet periods.
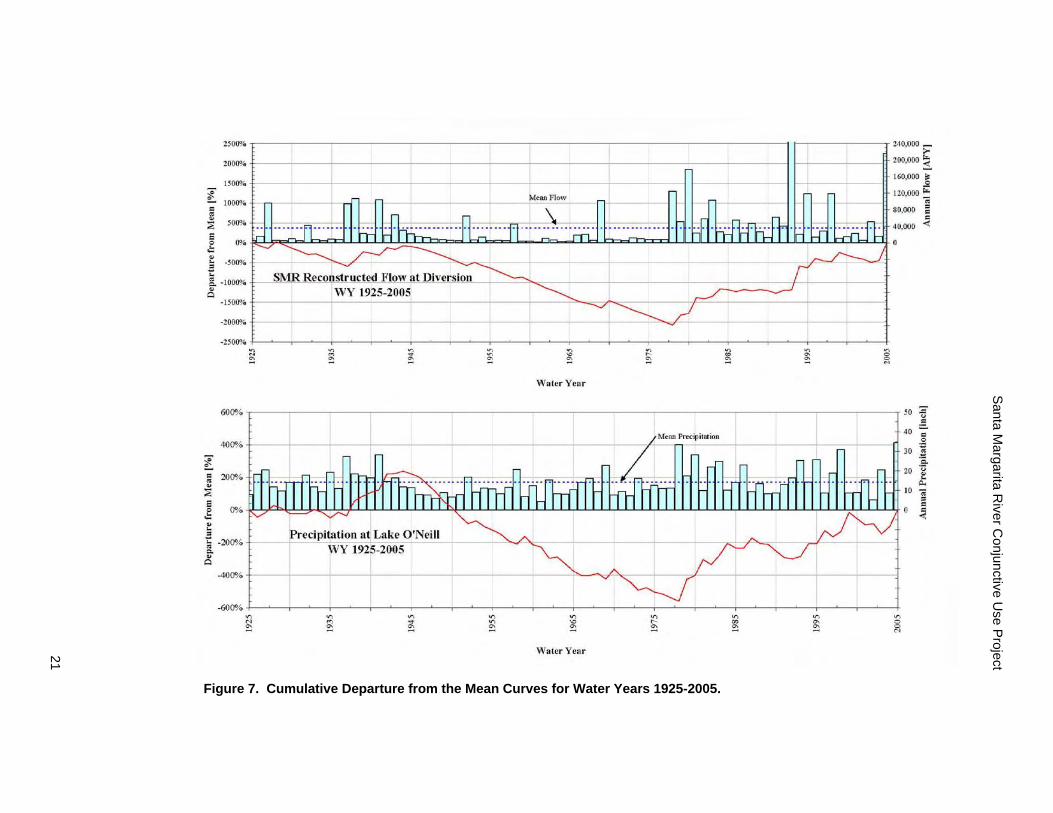
Long-term precipitation and streamflow datasets can be used to demonstrate hydrologic trends over the historical 81-year period of record for the lower Santa Margarita River Basin. Figure 7 shows a cumulative departure from the mean curve of annual streamflow at the point of diversion and annual precipitation at Lake O’Neill for water years 1925 to 2005. Monthly precipitation records from Lake O’Neill (Marine Corps Base Camp Pendleton [MCBCP] Office of Water Resources [OWR], 2005) were used to evaluate annual precipitation trends at the point of diversion. The annual departure from the mean graph is used to depict wet and dry cycles over an extended period of record. The solid line describes the hydrologic trend, where a downward slope indicates that the trend is to dry conditions and an upward slope indicates that the trend is to wetter conditions. The dashed line shows the long-term average annual precipitation at Lake O’Neill (14.2 inches) and the long-term average annual streamflow at the point of diversion (35,600 AF) during the 81-year period of record.
Santa M
argarita River C
onjunctive Use P
roject 21
Figure 7. Cumulative Departure from the Mean Curves for Water Years 1925-2005.
Final Technical Memorandum 1.0
22
The cumulative departure from the mean curve reveals that an extended dry period occurred from 1945 to 1978, followed by a prolonged wet period from 1979 to 1984. A moderately dry period occurred from 1985 to 1991, followed by a significantly wet period from 1993 to 1999. This pattern is similarly represented in both the precipitation and streamflow cumulative departure from the mean curves.
Stetson Engineers recommends that groundwater model years 1-50 should be chosen based on both extended dry and wet periods. One possible scenario for the future 50-year record would start with an Above Normal year, followed by an extended drought period, followed by another wet period, and eventually ending with normal hydrologic conditions. Stetson Engineers and Reclamation staff will work together to determine the best 50 years to provide an appropriate hydrologic record that can be used to optimize the design of the CUP’s water supply facilities. This will require multiple iterations in the surface water and groundwater modeling process before a final composite record is established.
Conclusions and Recommendations
Results of TM 1.0’s analyses confirm the wide variability of surface flows indicative of streams and rivers in the Southwestern United States. Large quantities of water are contained in peak flow events that commonly occur in the winter during Above Normal and Very Wet hydrologic conditions. Surface water availability during drier Below Normal and Extremely Dry hydrologic conditions occur from less frequent rainfall events and sustained baseflow releases from springs and groundwater sources. Review of the 81-year period of record, available for the lower Santa Margarita River watershed shows that total annual surface flow passing the point of diversion for the CUP has ranged between 2,000 and 249,500 AF between 1925 and 2005. During the same period, the maximum potential surface diversion available to the proposed CUP would have ranged between 700 and 50,200 AF. The maximum potential surface diversion for this analysis assumes a 200-cfs diversion structure, a 3-cfs bypass, and the deflation of the diversion structure during the 10-year or greater event. This maximum potential surface diversion does not take into account overflow spill from the recharge ponds, variable recharge rates, or the capacity of the groundwater basin influenced by groundwater pumping, which will be addressed in TM 2.0.
Four hydrologic conditions were established to statistically describe both the annual surface water at the point of diversion and the maximum potential diversion. The basis for the division of the four hydrologic conditions was a graphical interpretation method common to flood frequency analysis and other types of surface water flow characterizations. Reflective of the variability in
Santa Margarita River Conjunctive Use Project
23
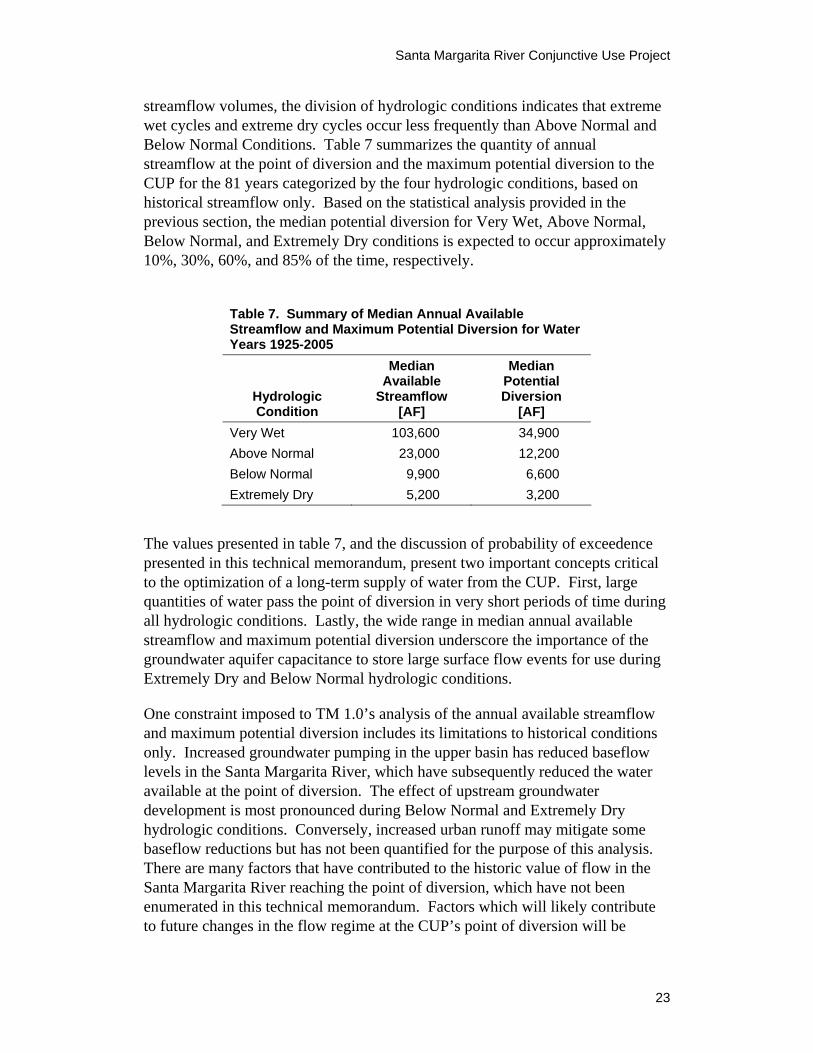
streamflow volumes, the division of hydrologic conditions indicates that extreme wet cycles and extreme dry cycles occur less frequently than Above Normal and Below Normal Conditions. Table 7 summarizes the quantity of annual streamflow at the point of diversion and the maximum potential diversion to the CUP for the 81 years categorized by the four hydrologic conditions, based on historical streamflow only. Based on the statistical analysis provided in the previous section, the median potential diversion for Very Wet, Above Normal, Below Normal, and Extremely Dry conditions is expected to occur approximately 10%, 30%, 60%, and 85% of the time, respectively.
Table 7. Summary of Median Annual Available Streamflow and Maximum Potential Diversion for Water Years 1925-2005
Hydrologic Condition
Median Available
Streamflow [AF]
Median Potential Diversion
[AF] Very Wet 103,600 34,900 Above Normal 23,000 12,200 Below Normal 9,900 6,600 Extremely Dry 5,200 3,200
The values presented in table 7, and the discussion of probability of exceedence presented in this technical memorandum, present two important concepts critical to the optimization of a long-term supply of water from the CUP. First, large quantities of water pass the point of diversion in very short periods of time during all hydrologic conditions. Lastly, the wide range in median annual available streamflow and maximum potential diversion underscore the importance of the groundwater aquifer capacitance to store large surface flow events for use during Extremely Dry and Below Normal hydrologic conditions.
One constraint imposed to TM 1.0’s analysis of the annual available streamflow and maximum potential diversion includes its limitations to historical conditions only. Increased groundwater pumping in the upper basin has reduced baseflow levels in the Santa Margarita River, which have subsequently reduced the water available at the point of diversion. The effect of upstream groundwater development is most pronounced during Below Normal and Extremely Dry hydrologic conditions. Conversely, increased urban runoff may mitigate some baseflow reductions but has not been quantified for the purpose of this analysis. There are many factors that have contributed to the historic value of flow in the Santa Margarita River reaching the point of diversion, which have not been enumerated in this technical memorandum. Factors which will likely contribute to future changes in the flow regime at the CUP’s point of diversion will be
Final Technical Memorandum 1.0
24
further investigated and accounted for in the evaluation of the 50-year hydrologic cycle applied to the analyses in TM 2.0.
To accurately specify the surface water available for diversion to the CUP, the following recommendations should be followed:
1. Commence TM 2.0 CUP water yield optimization.
2. Initiate Peer-Review of the existing groundwater model by Reclamation.
3. Adopt the four hydrologic conditions presented in TM 1.0.
4. Adopt the exceedence interval of each hydrologic condition presented in TM 1.0.
5. Update hydrology with flows from CWRMA. Address other aspects of urban development in the upper basin with respect to future changes in the flow regime at the point of diversion.
6. Establish a 50-year future hydrologic cycle that reflects prolonged droughts, wet periods, and normal hydrologic conditions that have been identified in TM 1.0.
7. Using the groundwater model, identify water available to the CUP, both upstream of and downstream from the point of diversion.
8. Using the groundwater model, refine the ROM to maximize the water diverted to O’Neill ditch, Lake O’Neill, and the recharge ponds.
9. Update water available for diversion following the surface water/groundwater optimization process.
The recommendations have been provided to establish a methodology for ultimately determining the yield of the CUP. Extensive hydrologic and hydrogeologic field investigations were initiated and completed in 2005 in order to refine previous estimates of groundwater yield from the CUP. Following development of the future 50-year hydrologic cycle, which includes changes and constraints identified by Reclamation and the Study Team, the surface and groundwater withdrawals will be optimized using the groundwater model. TM 2.0 will provide the project yield, the maximum potential diversion, and exceedence interval for each hydrologic condition.
Santa Margarita River Conjunctive Use Project
25
References
Daly, Chris and George Taylor. 1989. California average Monthly or Annual Precipitation, 1961-1990. [Map, GIS Coverage.] 1:250,000 Map downloaded from the Oregon Climate Service and Oregon State University. Portland, Oregon: Water and Climate Center of the Natural Resources Conservation Service.
MCBCP Assistant Chief of Staff, Facilities Office of Water Resources (MCBCP OWR), 2005. Lake O’Neill, monthly data - Period of Record Precipitation. [Precipitation Data.] Excel data files and hard copy data obtained from Mike Malloy, March – December 2005.
Stetson Engineers, Inc., March 23, 2001. “Permit 15000 Feasibility Study: The Santa Margarita River Recharge and Recovery Enhancement Program.” Prepared for Marine Corps Base, Camp Pendleton, CA.
Stetson Engineers, Inc., February 2002. “Recycle and Reuse Study: Conjunctive Use Project for the Lower Santa Margarita River. Fallbrook Public Utility District. Supplemental Study to the Santa Margarita River Recharge and Recovery Enhancement Program – Permit 15000 Feasibility Study for Marine Corps Base Camp Pendleton.” Prepared for Fallbrook Public Utility District, CA.
United States Geological Survey (USGS). [Streamflow Data & Metadata.] National Water Information System Web (NWISWeb). December 2005. <http://waterdata.usgs.gov/nwis/>.
United States Department of the Interior, Bureau of Reclamation (Reclamation), May 2005. Santa Margarita River Conjunctive Use Project. Pre-Feasibility Plan Formulation Study. San Diego County, CA.
Santa Margarita River Conjunctive Use Project
27

Final Technical Memorandum 1.0
28

Santa Margarita River Conjunctive Use Project
29
Final Technical Memorandum 1.0
30

Santa M
argarita River C
onjunctive Use P
roject 31

Final Technical Mem
orandum 1.0
32

Santa Margarita River Conjunctive Use Project
33
Final Technical Memorandum 1.0
34

Santa Margarita River Conjunctive Use Project
35

Final Technical Memorandum 1.0
36
Santa M
argarita River C
onjunctive Use P
roject 37
Final Technical Mem
orandum 1.0
38