Final Scientific report of the CCEM-Mobility project 807
70
1 Final Scientific report of the CCEM-Mobility project 807 GASOMEP: Current Status and New Concepts of Gasoline Vehicle Emission Control for Organic, Metallic and Particulate Non-Legislative Pollutants Authors: P. Comte, J. Czerwinski, A. Keller, N. Kumar, M. Muñoz, S. Pieber, A. Prévôt, A. Wichser, N. Heeb
Transcript of Final Scientific report of the CCEM-Mobility project 807

1
Final Scientific report of the CCEM-Mobility project 807
GASOMEP: Current Status and New Concepts of Gasoline Vehicle Emission Control for Organic, Metallic and Particulate Non-Legislative Pollutants
Authors: P. Comte, J. Czerwinski, A. Keller, N. Kumar, M. Muñoz, S. Pieber, A. Prévôt, A. Wichser, N. Heeb

2
Final Scientific report of the CCEM-Mobility project 807
GASOMEP: Current Status and New Concepts of Gasoline Vehicle Emission Control for Organic, Metallic and Particulate Non-Legislative Pollutants
Authors: P. Comte, J. Czerwinski, A. Keller, N. Kumar, M. Muñoz, S. Pieber, A. Prévôt, A. Wichser, N. Heeb
Project partners:
• Main investigator Dr. N. Heeb
• UASB, Dept. of combustion engine testing Prof. J. Czerwinski Engine operation, regulated pollutants, nanoparticles P. Comte Engine operation, regulated pollutants Ph. Willi FT-IR, non-regulated pollutants Y. Zimmerli
• UASNW, Institute of aerosol and sensor technology Prof. Dr. H. Burtscher Micro smog chamber, nanoparticles Dr. A. Keller
• PSI, Laboratory of atmospheric chemistry Dr. A. Prévôt Smog chamber, SOA formation Dr. S. Pieber Smog chamber, SOA formation Dr. N. Kumar
• EMPA, Laboratory of environmental technology/air pollution Dr. L. Emmenegger Exhaust sampling Dr. J. Mohn Exhaust sampling P. Honegger Exhaust sampling K. Zeyer
• EMPA, Laboratory of advanced analytical technologies Dr. D. Bleiner Sample work up R. Haag Analysis of semi-volatiles Dr. M. Muñoz Analysis of semi-volatiles C. Seiler Analysis of semi-volatiles Dr. P. Schmid Metall analysis A. Wichser
• Intertek Caleb Brett, Schlieren, Switzerland Dr. H. W. Jäckle Fuel analysis U. Debrunner Fuel analysis O. Schumm

3
Main Investigator
Norbert Heeb, Empa
Project Partners
BAFU
Empa
Industry
PSI
UASB
UASNWS
Time Frame of Project
2013-2017

4
In memoriam
Grief and pain were our first emotions, when we heard from the sudden and tragic death of Andrea Ulrich. She deceased on March 12, 2013 in a traffic accident in Zürich not three miles north of Dübendorf.
Andrea was on her way to work and would have presented a challenging new research project on emissions of metal oxide nanoparticles. She had organized the project the month before and just got it funded from CCEM a few days before.
The project, which she courageously developed, needed all her abilities. Clear scientific thinking, positive and optimistic attitude to scope with the demanding tasks, and confidence to convince project partners and the reviewing committee. These were some of her many abilities, which made her professional activities so successful.
As an analytical chemist and leader of the ICP mass spectrometry group at Empa, she contributed much to the elemental trace analysis and the characterization of nanoparticles from various sources including combustion generated nanoparticles.
Andrea Ulrich has guided several bachelor-, master-, and doctoral students through demanding research projects, which resulted in many publications and was awarded several times for this work. Andrea helped organizing the VERT Forum in Dübendorf and the ETH conference in Zürich on combustion-generated particles. On March 12, 2013 we all lost a good colleague and a dear friend. We will miss Andrea’s optimistic and enthusiastic nature and will keep her memories alive.
Norbert Heeb, on behalf of the project team
Dr. Andrea Ulrich
(2. 11. 1961 –12. 3. 2013)

5
Executive summary
More than 50 million gasoline-direct injection vehicles (GDI) will be operated on European roads in 2020 with yet unknown impact on human health and the environment. In the next decade to come it is expected that about every third combustion-engine vehicle will have GDI technology on board. Mitsubishi started mass production of GDI vehicles (Mitsubishi Carisma, 1.8 L, Euro-3) already in 1997.
We have tested this pioneer vehicle together with six additional Euro-4, -5, and Euro-6 GDI vehicles in comparison with an Euro-5 diesel vehicle (Peugeot 4008, 1.6 L) equipped with a state-of-the-art diesel particle filter. In other words, we compared the emission characteristics of 4 generations of GDI vehicles representing the technology of the last 20 years with a current bench mark diesel vehicle. All vehicles were tested in transient and steady engine operation. The worldwide harmonized light vehicle test cycle (WLTC), which will be the future legal test cycle in Europe, was applied together with a steady state cycle (SSC) representing constant driving at urban-, extra-urban, highway and motorway conditions and an idle phase. A comprehensive characterization of gaseous, liquid and solid exhaust constituents was performed. The focus was on toxic, especially carcinogenic and mutagenic compounds, on nanoparticles, also those smaller than 23 nm, on metals and on secondary pollutants that form during atmospheric oxidation of these exhausts. Thus, we compared the particle burden, the genotoxic potential and the SOA formation potential of GDI and diesel vehicles.
GDI particles are very small with diameters varying from 10-100 nm, they are numerous accounting for 2 – 6 x 10¹² particles/km and are found in exhaust concentrations of 106-107 particles/ccm. These particles are released from all GDI vehicles under all conditions during urban, extra-urban and highway driving. PN emissions of the average fleet in the cold- and hot-started WLTC varied around 2.5 x 10¹² ± 1.8 x 10¹² and 2.0 x 10¹² ± 1.6 x 10¹² particles/km, those in the SCC are 6.6 x 10¹² ± 1.4 x 10¹³. Particle emissions of the diesel vehicle equipped with a filter were 4.0 x 10¹⁰, 2.8 x 10⁹ and 1.7 x 10⁸ particles/km in the cWLTC, hWLTC and SSC. Thus the GDI fleet on average released about 100-, 1000-and 10’000-times more particles in the cold- and hot WLTC and the SSC than the diesel vehicle.
Well correlated with particles are emissions of polycyclic aromatic hydrocarbons (PAHs) which are formed in the same moment as the soot particles. Genotoxicity-weighted PAH emissions of the GDI-fleet on average were 480 and 435 ng benzo(a)pyrene equivalents/km compared to 22 and 23 ng/km for the diesel vehicle in the cold- and hot-started WLTC. In other words, the genotoxic potential of GDI vehicle exhaust is 21-, and 19-fold higher than that of the diesel bench mark vehicle. Genotoxic PAHs are semi-volatile compounds which are adsorbed on soot nanoparticles at ambient temperature. They can therefore be inhaled deeply into the lung, deposited at the alveolar membrane with the particles or even penetrating it (Trojan horse effect). On average, concentrations of genotoxic PAHs in GDI exhausts exceeded the EU ambient air limit value of 1 ng/m3 (yearly mean) 750- and 707-fold in cWLTC and hWLTC, while filtered diesel exhaust was 45- and 51-fold higher.
The WHO has classified non-treated diesel exhaust as class 1 carcinogen inducing lung cancer in humans. Based on the high concentrations of soot nanoparticles and adsorbed genotoxic PAHs, it has to be questioned, if non-filtered GDI exhausts are also carcinogenic to humans?

6
Vehicular exhausts are mainly released in urbanized areas and thus are directly inhaled by the population exposed to traffic. But exhausts are also processed during atmospheric transport and chemical transformation occurs under the influence of light and oxidants like NO2, HONO, ozone and others. These phenomena have been studied in smog chamber and reactor studies in the project.
Both, the smog chamber experiments at a time scale of hours, and the reactor studies with the PAM and MSC reactors, at time scales of minutes and seconds, revealed that substantial amounts of particle mass does form when GDI exhausts are aged under oxidizing conditions and under the influence of UV light and secondary organic aerosols (SOA) are formed. It was found that those volatile organic compounds (VOCs) released during the vehicle cold start accounted for most of the SOA. Among the VOCs released in the first few seconds of driving, before catalyst light-off, aromatic hydrocarbons are responsible for most of the SOA. Time-resolved SOA measurements also revealed that next to the cold start emissions also acceleration events contribute to SOA, but to a lesser extent. With this it was clear that particle filters have only limited potential to lower SOA precursors, which are volatile enough to penetrate the filter as was observed.
In the project could we study the efficiency of four prototype gasoline particle filters (GPFs), two with catalytic coatings and two non-coated filters. Particle number emissions in the cWLTC and hWLTC were, on average, lowered by 77% and 87% with these filters. Efficiency was high in the entire particle size range, even slightly higher at sub 23 nm particles. PN emission reductions varied among different filters and were reduced for one of the non-coated filters to 67% and 79%. It was this filter that also had the lowest efficiency of 10% for the genotoxic PAHs in the cWLTC. In the hot WLTC, even 2 times more genotoxic PAHs were released, possibly due to a store-release phenomenon. The other three prototype GPF lowered genotoxic PAH emissions by 45-70% and 71-83% in the cold and hot WLTC, respectively.
Particle-bound metal emissions were determined from non-diluted exhausts in the SSC and under idle on different ELPI stages (13 stages, one back-up sample) which allow a particle size-dependent analysis. However, metal levels of GDI vehicle exhausts were very low, hardly exceeding the blank levels. No increase could be observed due to the application of GPFs or the use of oxygenated fuels.
In conclusion, from a chemical point of view, exhausts of the current GDI fleet look like those of non-treated diesel exhausts with respect to nanoparticles and genotoxic PAHs. These are the most critical pollutants released from the GDI fleet with potentially adverse effects on human health. Particle concentrations are high, exceeding those of the bench mark diesel vehicle by 2-4 orders of magnitude, and those of genotoxic PAHs are 1-2 orders of magnitude higher. These critical pollutants can be lowered substantially even with prototype GPFs. But those volatile compounds released under cold start conditions will still contribute to secondary organic aerosol formation. Further improvements of the catalyst light-off could lower the emissions of these SOA precursors.
Considering the mass production of GDI vehicles and the low costs of particle filters, which are already produced and applied in millions of diesel vehicles, including the bench mark vehicle, it is difficult to understand, why filter technology has not been implemented in GDI vehicles already a decade ago. It is definitely the time to quickly implement state-of-the-art filter technology in GDI vehicles now.

7
List of abbreviations
AMS Aerosol Mass Spectrometer ArHC Aromatic Hydrocarbons (benzene and alkyl benzenes) catGPF Catalytically active Gasoline Particle Filter cE / hE Cold- / hot-started EDC test CVS Constant Volume Sampling system cW / hW Cold- / hot-started WLTC test DPF Diesel Particle Filter eBC Equivalent Black Carbon (determined by Aethalometer) EDC European Driving Cycle ELPI Electrical Low Pressure Impactor FID Flame Ionization Detector GC-HRMS Gas Chromatography High-Resolution Mass Spectrometry GDI Gasoline Direct Injection GPF Gasoline Particle Filter nanoSMPS Nano Scanning Mobility Particle Sizer NMHC Non-Methane Hydrocarbons, (determined by FID) NMOC = Non-methane organic compounds, (determined by PTR-ToF-MS OEM Original Equipment Manufacturer OFR Oxidation flow reactor (a potential aerosol mass, PAM, reactor) OFR-from-SC “batch OFR”, OFR continuously sampling from a batch SC sample Online OFR OFR deployed online during a driving cycle, connected directly to the CVS PAH Polycyclic Aromatic Hydrocarbons Ph 1 First phase of WLTC, Ph 1 (cW) refers to first phase of cold-started WLTC Ph 2-4 Second to fourth phase of WLTC, Ph 2-4 (hW) PN Particle Number POA Primary Organic Aerosol PTR-ToF-MS Proton Transfer Reaction Time-of-flight Mass Spectrometer SC Smog Chamber SMPS Scanning Mobility Particle Sizer SOA Secondary Organic Aerosol SSC Steady State Cycle SP Sampling Point WLTC World Harmonized Light Vehicle Test Cycle

8
Table of content
In memoriam 4
Executive summary 5
List of abbreviations 7
Scope of project 10
Final state of project 10
Main achievements in the project 14
1. Time-resolved emissions during transient driving 14
2. Fuel consumption of the GDI technology 16
3. Regulated pollutant emissions of the GDI technology 16
4. Particle emissions of the GDI technology 19
4.1. Particle size distribution 19
4.2. Particle number emission factors 20
5. Emissions of non-regulated pollutants 23
5.1. Emissions of genotoxic polycyclic aromatic hydrocarbons (PAHs) 23
5.2. Genotoxic potential of non-filtered GDI exhausts 25
5.3. Metal emissions 26
6. Impact of alternative fuels on GDI vehicle emissions 28
6. 1. Impact of ethanol fuel blends on particle and regulated pollutant emissions 28
6.2. Impact of ethanol fuel blends on genotoxic emissions 29
7. Impact of gasoline particle filters (GPFs) on GDI vehicle emissions 33
7.1. Impact of GPFs on particle size distribution 33
7.2. Efficiencies of GPFs and particle number emissions 34
7.3. Impact of GPFs on genotoxic PAH emissions 35
8. SOA formation in the PSI smog chamber and PAM oxidation flow reactor 37
8.1. Material and methods 37
8.1.1 Experimental design 37 8.1.2. Vehicle testing 37 8.1.3. Experimental procedures 39 8.1.4. PSI mobile smog chamber (SC) 40 8.1.5. PAM Oxidation flow reactor (OFR) 41 8.1.6. PTR-ToF-MS 42 8.1.7. HR-ToF-AMS 42

9
8.2. Results on SOA formation 43
8.2.1. Pollutants as function of vehicle technology and driving cycle 43 8.2.2. Time-resolved SOA formation in the OFR 45 8.2.3. Primary NMOC composition investigated by PTR-ToF-MS 46 8.2.4. Effect of gasoline particle filters (GPF) on SOA 50 8.3. Conclusions on SOA formation 50
9. Accelerated SOA formation in the UASNWS flow reactor 51
9.1. Impact of ethanol on secondary organic aerosol formation 51
9.2. Fast and time-resolved secondary organic aerosol formation 53
9.3. Integrated cycle based SOA formation potential 54
References 56
Project activities, presentations and patents 58
Publications, oral contributions and poster presentations 59
2014: 59
2015: 59
2016: 60
2017: 61
Industrial and institutional partners 63
Appendix 1 64
Appendix 2 66
Appendix 3 68

10
GASOMEP: Current Status and New Concepts of Gasoline Vehicle Emission Control for Organic, Metallic and Particulate Non-Legislative Pollutants
Scope of project
In the next decades to come, we will be increasingly exposed to exhausts of gasoline direct injection (GDI) vehicles with yet unknown consequences. But we still have a choice to equip these vehicles with catalytic filter technology or not or use better fuels to lower the health and environmental impact of these vehicles or not. In the GASOMEP project, we investigated the emission characteristics of a representative fleet of GDI vehicles covering Euro-3 to Euro-6 technologies and evaluated the potential of prototype gasoline particle filters (GPFs) currently developed by our industrial partners and alternative fuels. A wide spectrum of gaseous and particle-bound pollutants was studied for different GDI vehicles which were operated without and with filter technology and with commercial gasoline and blends with oxygenated fuels like ethanol and butanol. Particle emissions including their size distribution, number and metal content were characterized in detail. Emissions of semi-volatile compounds including genotoxic constituents like PAHs, their alkylated and nitrated forms were studied. Among others, these compounds are important precursors of secondary organic aerosols (SOA), which form in the atmosphere during oxidative aging. Respective SOA forming potentials were investigated with smog chamber experiments and two different flow reactors.
Final state of project
The four-year project, which was extended with an additional campaign devoted to oxygenated fuels, resulted in a comprehensive characterization of GDI vehicle emissions in comparison with a state-of- the-art diesel vehicle. With the contributions of our industrial partners, we were able to evaluate the potential of new filter technology to abate particles and potentially harmful exhaust constituents. The project was a joint effort of the industry, regulators, and the Swiss research institutions PSI, the Universities of Applied Sciences Northwestern Switzerland (UASNW) and Bern (UASB) and Empa. The project was divided in 4 work packages (WPs): WP 1: regulated pollutants (UASB), WP 2: nanoparticles (UASB, UASWN), WP 3: secondary organic aerosols (PSI, UASNW), WP 4: non-regulated pollutants and metals (Empa).
The vehicles were tested at the chassis dynamometer of the UASB in Nidau. A scheme of the dynamometer and the sampling points is given in Figure 1. Seven Euro-3 to Euro-6 GDI vehicles and – as a bench mark – an Euro-5 diesel passenger car with OEM diesel particle filter (DPF) have been tested. Table 1 reports some characteristics of the tested vehicles. A batch of commercial gasoline is used as reference fuel in the project and blended with biofuel (E85) to an ethanol content of 10% (E10) or with n-butanol to a butanol content of 15% (B15) for some experiments.
The Euro-5 Volvo V60 T4I, 1.6 L, which is a flex-fuel vehicle, was used as the reference vehicle throughout the entire project. This vehicle was tested as such or in fuel studies with variable levels of ethanol (E0, E10 and E85), with butanol (B15) or in combination with four gasoline particle filters (GPFs), which were specifically developed for GDI-vehicles by our industrial partners.

11
Figure 1: Scheme of the chassis dynamometer at UASB in Nidau. Different sampling points are indicated.
Table 1: Characteristics of the test vehicles. Vehicle
Volvo V60 T4F (flex-fuel)
Opel Insignia
Displacement (ccm) 1596 1598 Power (kW) 132 (5700 rpm) 125 (6000 rpm) Torque (Nm) 240 (1600 rpm) 260 (1650 -3200 rpm) Injection type GDI GDI Number of cylinder 4 (in line) 4 (in line) Curb weight (kg) 1554 1701 Gross vehicle weight (kg) 2110 2120 First registration 27.01.2012 2014 Legislation Euro 5a Euro 5b+
Vehicle
Opel Zafira Tourer
Mitsubishi Carisma 1.8 GDI
Displacement (ccm) 1598 1834 Power (kW) 125 (6000 rpm) 90 (5500 rpm) Torque (Nm) 260 (1650-3200 rpm) 174 (3750 rpm) Injection type GDI GDI Number of cylinder 4 (in line) 4 (in line) Curb weight (kg) 1676 1315 Gross vehicle weight (kg) 2360 1750 First registration 22.07.2014 05.2001 Legislation Euro 5b+ Euro 3

12
Table 1 continued: Characteristics of test vehicles. Vehicle
VW Golf Plus
VW Golf VII
Displacement (ccm) 1390 1395 Power (kW) 118 (5800 rpm) 110 (5000 - 6000 rpm) Torque (Nm) 240 (1500 rpm) 250 (1500 -3500 rpm) Injection type GDI GDI Number of cylinder 4 (in line) 4 (in line) Curb weight (kg) 1348-1362 1321 Gross vehicle weight (kg) 1960-1980 1820 First registration 01.02.2010 28.04.2015 Legislation Euro 4 Euro 6b
Vehicle
Citroën C4 Cactus
Peugeot 4008 1.6HDI STT
Displacement (ccm) 1199 1560 Power (kW) 81 (5500 rpm) 84 (3600 rpm) Torque (Nm) 250 (1500 rpm) 270 (1750 rpm) Injection type GDI DI (diesel) Number of cylinder 3 (in line) 4 (in line) Curb weight (kg) 1048 1462 Gross vehicle weight (kg) 1555 2060 First registration 19.11.2014 12.04.2013 Legislation Euro 6b Euro 5b
The reference vehicle (Volvo V60) was in compliance with the Euro-5 legislation, which still is based on the European driving cycle (EDC) with limit values for CO, THC, NOx and PN of 1000, 100, 60 mg/km and 6.0 x 10¹² particles/km. In other words, the PN limit for Euro-5 and Euro-6 GDI vehicles was 10 times higher than the one for Euro-5 and Euro-6 diesel vehicles, which are currently limited to 6.0 x 10¹¹ particles/km. One can conclude that European emission limits were not technology neutral, neither for NOx, nor for particles. From September 2017 on, the PN limit for future GDI vehicles is lowered to 6.0 x 10¹¹ particles/km.
We decided to relay on the world harmonized light vehicle test cycle (WLTC) shown in Figure 2 which is much better representing real world driving than the EDC. In contrast to EDC, does the WLTC include many transients and realistic acceleration and deceleration events and extended high speed operation (Fig. 2). The WLTC includes urban (26 km/h), extra-urban (45 km/h), highway (61 km/h) and motorway (94 km/h) driving with a total cycle time of 30 min. The WLTC was investigated under cold start (cWLTC) and hot engine/catalyst conditions (hWLTC) throughout the project.

13
Figure 2: The cold and hot started WLTC was used as the transient test cycle throughout the project.
In addition, a steady state cycle (SSC) covering constant vehicle operation at 26, 45, 61, 94 km/h and at idling was also included to investigate in more detail the characteristics and chemical composition of the released nanoparticles (Fig. 3). The SSC covers the mean velocity regimes of the four WLTC phases and includes an equally long hot idle phase. The cycle was driven from high loads (94 km/h) to idle. Each stage was kept for 20 minutes to yield a total cycle time of 100 min.
Figure 3: A steady state cycle (SSC), representing the mean velocities of the four WLTC phases and an idling phase, was used to study exhaust compositions and particle properties under stable conditions.

14
Main achievements in the project
Overall, we organized four three-week sampling campaigns in the project and investigated 7 GDI vehicles and one diesel vehicle in different configurations varying fuels and filter technologies. An additional campaign could be performed with additional means, which was devoted to study the impact of alternative oxygenated fuels (GASOMEP-OXY).
The data obtained in these different campaigns should be comparable. We applied the same test cycles, mostly in the same order. Therefore we can report robust mean values of the whole fleet and judge the representativeness of a single vehicle in relation to the fleet average and compare data with those of the bench mark diesel vehicle.
Some of the major results and achievements are discussed here, but it was not possible to include all findings of the different research groups which have been and will be published in separate contributions and peer-reviewed articles. So far, 62 oral, poster and paper contributions, six bachelor theses and two Ph.D. thesis were published which included findings from this project.
1. Time-resolved emissions during transient driving
Figure 4 displays time-resolved emission data for CO (ppmv), CO2 (%v) and particle number (#/cm3) in dilute exhaust of the CVS system of the reference vehicle (Volvo V60 T4I, 1.6 L, Euro-5) together with the velocity-time diagram of the WLTC.
It is obvious that CO2 emissions, and with it the amount of consumed fuel, increase substantially when accelerating the GDI vehicle. During these transients also CO and PN emissions increase by 2-3 orders of magnitude. In other words, CO, CO2 and PN emissions are well correlated throughout the entire cycle and substantial numbers of particles are released independent if the vehicle is operated at urban, extra-urban, highway or freeway conditions. Thus the implemented three-way catalyst (TWC) technology could not remove CO completely and did not prevent from high particle emissions.
In conclusion, increased CO and PN emissions are observed under all driving conditions. Whenever the vehicle is accelerated, combustion, at least in certain parts of the cylinder, becomes fuel-rich, with sub-stoichiometric fuel-to-oxygen levels. As a consequence, CO and PN emissions increase 2-3 orders of magnitude.

15
Figure 4: Time-resolved emissions of CO, CO2 and particles (logarithmic scales) during a hot-started transient cycle (WLTC) of the reference vehicle (Volvo V60, 1.6 L, Euro-5). The velocity-time diagram (top) and the four phases of the WLTC are given. The transient nature of CO, CO2 and PN emissions can be seen clearly. Emissions are highly correlated and increase 1-3 orders of magnitude during acceleration.

16
2. Fuel consumption of the GDI technology
Figure 5 displays the individual and mean fuel consumption of the seven tested GDI vehicles in comparison with the diesel vehicle (bench mark) in the cold and hot started WTLC and in the SSC. Fuel consumption varied from 4.2-9.5 L/100 km. On average, 7.6 and 7.4 L/100 km were consumed for the GDI vehicle fleet in the cold and hot started WLTC respectively, indicating that even with down-sized engines of 1.2-1.6 L, fuel consumption of these vehicles under real world driving conditions is substantial.
The bench mark diesel vehicle consumed only 5.8 and 5.5 L/100 km. This corresponds to 151 and 145 g CO2/km for the diesel vehicles which compares with mean CO2 emissions of 174 and 171 g/km for the GDI-vehicles (Figure 6).
In other words, the GDI vehicles, when tested under real world driving conditions (WLTC), will not contribute to substantial reductions of the CO2 emissions of the Swiss road traffic as advertised, when promoting the GDI technology. Average CO2 emissions of 175 g/km of the entire Swiss passenger car fleet are reported for 2015. The tested GDI-fleet released, on average, 171±28 and 174±28 g CO2/km in the cold and warm WLTC.
Figure 5: Fuel consumption (L/100 km) of seven GDI and one diesel vehicle in the cold and hot started WLTC and the SSC. Mean values of the GDI fleet are also given.
3. Regulated pollutant emissions of the GDI technology
Figure 6 displays CO2, CO, NOx, and THC emissions of individual GDI vehicles in the cold and hot started WLTC and the SSC. Emission limits in the European driving cycle (EDC), which were regulated to 60 mg NOx/km, 100 mg THC/km and 1000 mg CO/km for Euro-5/6 vehicles, respectively, are also indicated. EDC emission limits of 150 mg NOx/km, 200 mg THC/km and 2300 mg CO/km were prescribed for Euro-3 vehicles.
While variations of CO2 and THC emissions among the different GDI vehicles are moderate, those for CO and NOx are larger. On average, THC emissions are 4 times higher in a cold-started WLTC than in a

17
hot WLTC. CO emissions too showed a moderate cold start effect for all GDI vehicles. However, as also shown in Fig. 4, CO release is observed during the entire WLTC. On the other hand, CO emissions in the SSC are substantially lower than in the WLTC for all but one GDI vehicle. It is evident that transient driving is correlated with higher CO emissions. CO emissions of the GDI-3 vehicle (Opel Insignia, 1.6 L, Euro-5) is clearly exceeding the CO limit of 1 g/km about 4- and 5-fold.
Figure 6: CO2, CO, NOx (g/km) and THC (mg/km) emissions of seven GDI and one diesel vehicle in the cold and hot started WLTC and the SSC. Mean values of the GDI fleet are also given and the valid Euro-5/6 EDC emission limits for CO, NOx and THC of 1000, 60 and 100 mg/km are indicated (magenta lines) as well as the mean CO2 emission of the Swiss passenger car fleet in 2015 of 175 g/km.

18
CO and THC emissions of the bench mark diesel vehicle are substantially lower than those of the GDI vehicles. However, the Euro-5 diesel vehicle, with NOx emissions of 641 and 643 mg/km in the cold and hot WLTC clearly exceeded the NOx limit value of 180 mg/km, which is based on the EDC. Even at steady state driving (SSC), with NOx emissions of 294 mg/km, the EDC limit value is exceeded. In other words, this Euro-5 diesel vehicle is, like many diesel vehicles of this generation, contribution to high NOx emissions now described as “diesel-gate”.
NOx emissions of the GDI-1 vehicle (Mitsubishi Carisma, 1.8 L), which is an Euro-3 vehicle, exceeds those of the other GDI vehicles and emits above the Euro-3 NOx limit value of 150 mg/km. NOx emissions of all other GDI vehicles are below the limit.
THC emissions of all GDI vehicles are below 100 mg/km for the Euro-5/6 vehicles and below 200 mg/km for the Euro-3 vehicle, both under hot and cold start conditions. On average, THC emissions in the cold-started WLTC are five times higher than in the hot WLTC indicating a substantial cold start effect.
Figure 7 displays THC and CO emission factors of the seven GDI vehicles in different phases of the WLTC. It can be noticed that THC emissions are below 50 mg/km for all vehicles whenever catalyst light-off has occurred.
Figure 7: THC and CO emissions (mg/km) of seven individual GDI vehicles in different phases of the cold and hot started WLTC. Values of the reference vehicle (Volvo V60, 1.6 L, Euro-5) are indicated with gray bars, respective values of the benchmark diesel vehicle (Peugeot 4008, 1.6 L, Euro-5) are considerably lower and given in red. The EDC emission limits for THC of Euro-3 and Euro-5/6 GDI vehicles of 200 and 100 mg/km are indicated together with respective limits for CO of 2300 and 1000 mg/km (dashed lines).
However, under cold start conditions (urban phase 1,cold), THC emissions are one to two orders of magnitude higher than those with hot start (urban phase1, hot), indicating that indeed the very first seconds of driving, before catalyst light-off, are responsible for most of the hydrocarbon emissions.

19
THC emissions of the benchmark diesel vehicle are considerably lower than those of the GDI-fleet, not exceeding 5 mg/km in hot conditions and reaching only 26 mg/km in the urban phase after cold-start.
It has to be noticed that the volatile hydrocarbons released under these conditions are major precursors for secondary organic aerosols (SOA) formed in the atmosphere as will be discussed later.
Higher CO emissions of the GDI vehicles are also observed under cold start influence, before catalyst light-off (Fig. 7). But the cold start effect is less pronounced and CO is also released after catalyst light-off, being highest for most vehicles during motorway driving. CO emissions of the benchmark diesel vehicle are considerably lower than then those of the GDI-fleet, not exceeding 50 mg/km under hot conditions and are at 370 mg/km under cold start influence.
4. Particle emissions of the GDI technology
The exposure to ultrafine particles from diesel vehicles and diesel machinery is a major health threat, for more than a century now. Non-treated diesel exhausts contain large numbers of ultra-fine particles. Primary diesel particles typically have diameters of 15-20 nm only. They are so abundant that they quickly aggregate, but even the heavily branched agglomerates that form have mean mobility diameters of 80 nm. In other words, non-treated diesel particles are smaller than 200 nm which is considered as a critical size. From an inhalation toxicity point of view, particles below 200 nm were shown to penetrate the alveolar membrane of human lung cells.
In the following, we compare these well-characterized diesel particles with those, released from GDI vehicles and find remarkable parallels in particle number, size and chemical compositions.
4.1. Particle size distribution
Figure 8 displays mean particle number size distributions of the reference vehicle (VOLVO V60 T4F, 1.6 L, Euro-5) operated with gasoline without particle filter. A nano-SMPS instrument was used to detect particles down to 9 nm and a conventional SMPS was applied for the size range from 23-400 nm.
In general, nano-SMPS and SMPS data correlate well in the overlapping size range. The most prominent particles found in GDI-exhausts when constantly driving at 95, 61, 45 and 26 km/h have diameters of about 80 nm just like diesel particles. A second mode of 20 nm particles was observed in all cases. These smaller particles could be interpreted as nucleation mode particles and the larger as accumulation mode particles. Bimodal particle size distributions, as now observed for GDI exhausts, are very common in non-filtered diesel engine exhausts.
Concentrations of nucleation mode particles (20 nm) increased from about 1 to 2x10e6 particles/ccm while increasing the velocity. The increase of accumulation mode particles (80 nm) from about 1 to 5x10e6 particles/ccm is even more pronounced. In other words, at lower speed, particle number emissions are lowest with about half of the particles in the nucleation mode and half of them in the

20
accumulation mode. At higher speed more particles are released and the proportion of accumulation mode particles also increased to about 80% at 95 km/h.
Legal PN measurements only include particles in the size range of 23-400 nm. But as can be seen from Figure 8, substantial contributions are also found in the smallest size range below 23 nm. These sub-23 nm particles accounted for about 20% at all velocities.
Figure 8: Particle number size distribution (#/cm3) of the reference vehicle (Volvo, V60, 1.6 L, Euro-5) operated with gasoline while constantly driving at 95, 61, 45 and 26 km/h.
We conclude that particle size distributions of GDI- and diesel vehicles are very comparable. Distributions are bimodal with a nucleation and an accumulation mode, indicating a similar particle formation pathway as in diesel engines.
4.2. Particle number emission factors
Time-resolved particle number concentrations (#/cm3) in diluted exhaust of the reference GDI vehicle (VOLVO V60 T4F, 1.6 L, Euro-5) operated in a hot started WLTC have been shown in Fig. 4. During the WLTC, particle number concentrations varied by three orders of magnitude ranging from 103 up to 106 particles/cm3. As discussed before, particle and CO emissions are strongly correlated. It is obvious that particles are released throughout the entire cycle, mainly in transient vehicle operation, when sub-stoichiometric combustion conditions are prevailing.
To obtain more robust particle emission data and to document the status of the GDI-technology, seven GDI-vehicles have been studied (Table 1) representing Euro-3 to Euro-6 technology.

21
Figure 9 reports particle number emission factors (#/km) of seven GDI vehicles operated in the cold and hot-started WLTC and the SSC. Respective mean values of the GDI fleet together with the bench mark diesel vehicle (Peugeot 4008, 1.6 L, Euro-5) with particle filter are compared as well. Particle emissions of the different GDI vehicles varied by about one order of magnitude under transient driving conditions (WLTC) and two orders of magnitude under steady driving (SSC).
Figure 9: Particle number emissions (#/km, logarithmic scale) of seven GDI- and one diesel vehicle in the cold- and hot-started WLTC and the SSC. Mean values of the GDI fleet are also given and the Euro-5/6 EDC emission limit for diesel and for GDI vehicles of 6 x 10¹¹ and 6 x 10¹² particles/km are indicated (magenta lines).
All Euro-3, -4 and Euro-5 vehicles emit particles above the emission limit for Euro-5/6 diesel passenger cars of 6.0 x 10¹¹ particles/km but are in the limit for GDI vehicles of 6.0 x 10¹² particles/km (magenta lines). Particle emissions of the reference vehicle (Volvo V60 T4F, 1.6 L, Euro-5, GDI-4), is in the range of the mean values of the fleet. The Euro-3 vehicle (Mitsubishi Carisma, 1.8 L, GDI-1) was the first GDI vehicle on the market. Its particle emissions are comparably high as those of the Euro-4 and Euro-5 vehicles.
It seems like the announced reduction of the PN limit for GDI vehicles to 6.0 x 10¹¹ particles/km, as it is in force since September 2017, has already resulted in a certain PN reduction to about this level for both Euro-6 vehicles, which emitted at the lower end of the examined GDI-fleet.
We conclude that particle emissions of GDI vehicles in real world driving conditions are substantial for all vehicles and for all conditions. This is even more obvious, when comparing PN emissions of GDI vehicles with those of the bench mark diesel vehicle which is equipped with a state-of-the-art particle filter. Comparing with the GDI fleet average of 2.5 x 10¹², 2.0 x 10¹²and 6.6 x 10¹²particles/km in the cold and hot WLTC and the SSC, respectively, particle emissions of the diesel vehicle of 4.0 x 10¹⁰, 2.8 x 10⁹ and 1.7 x 10⁸particles/km were obtained, which are about 60-, 700- and 39’000-times lower the those of the GDI vehicles (Fig. 9).
In other words, particle emissions of the studied GDI vehicle fleet today are 2-4 orders of magnitude higher than those of comparable diesel vehicles which are nowadays all equipped with efficient particle filters. Thus GDI vehicles indeed release orders of magnitude more soot-like nanoparticles than modern diesel vehicles.

22
As discussed, GDI vehicles emit particles throughout the entire WLTC (Fig. 4). Figure 10 displays particle emission factors (#/km) of the seven GDI vehicles in different parts of the WLTC including urban, extra-urban, highway and motorway driving. Only particles in the size range of 23 – 400 nm (the legally binding size range) were counted.
Figure 10: Particle number emissions (particles/km) of seven individual GDI vehicles (colored lines) in different phases of the cold and hot started WLTC. Values of the Euro-5 reference vehicle (Volvo V60, 1.6 L) are indicated with gray bars, respective values of the Euro-5 benchmark diesel vehicle (Peugeot 4008, 1.6 L) are given in red. The particle number emission limits for Euro-5/6 diesel passenger cars of 6 x 10¹¹ particles/km and of Euro-5/6 GDI vehicles of 6 x 10¹² particles/km are also given (dashed lines).
There are some variations in PN emissions of different vehicles at different driving conditions. Highest PN emissions of 7 x 10¹¹ to 2 x 10¹³ particles/km were observed under cold started urban driving. Generally, particle emissions decreased under hot engine conditions and varied from 1 x 10¹¹ to 1 x 10¹³ particles/km. No clear trend was observed with respect to PN emissions at higher velocities. Emissions at hot urban, extra-urban, highway and motorway driving were comparable for most vehicles, varying about one order of magnitude.
We conclude that PN emissions of most of these gasoline-fueled GDI vehicles remain at or below the 6 x 10¹² particles/km limit in most driving conditions. But 5 out of 7 vehicles would clearly exceed, both under hot and cold start conditions, the threshold limit for diesel passenger cars of 6 x 10¹¹ particles/km (dashed line) valid since 2009. Only the Euro-6 GDI vehicles remained at or below the diesel limit and the future GDI limit.
Comparing with the diesel vehicle, it is obvious that a state-of-the-art particle filter lowers PN emissions by about two orders of magnitude. In other words, diesel vehicles can also fulfill PN emission limits of 1 x 10¹⁰ particles/km in the WLTC. This corresponds to a 60-fold reduction of the current PN limit without much to change on the technology. It is obvious too that filter technology also has the potential to lower particle emissions of GDI vehicles. Why this promising technology has not been applied since the advent of filters for diesel vehicles, which goes back to the year 2000, is difficult to understand, especially when considering the high health risks associated with exposure to genotoxic compounds adsorbed on persistent soot nanoparticles.

23
5. Emissions of non-regulated pollutants
5.1. Emissions of genotoxic polycyclic aromatic hydrocarbons (PAHs)
Polycyclic aromatic hydrocarbons (PAHs) are a large class of compounds. Figure 11 displays some of the analyzed PAHs and alkyl-PAHs. Some of these PAHs contribute to the overall genotoxicity of gasoline and diesel exhausts and of consequently of ambient air in traffic-affected areas. Thus emission levels for these critical compounds are important to know to be able to assess the genotoxic risks for any new technology and specifically for the GDI technology. Naphthalene (1), benzo(a)anthracene (18), chrysene (19), benzo(b)fluoranthene (20), benzo(k)fluroanthene (21), benzo(a)pyrene (22), indeno(1,2,3-cd)pyrene (23) and dibenzo(a,h)anthracene (24) are known human carcinogens according to the WHO and therefore analyzed specifically.
Figure 11: Chemical structures of the investigated PAHs. Compounds 1 and 18-24 are carcinogenic to humans according to the WHO.

24
Dilute exhausts have been sampled from the CVS tunnel for all vehicle configurations throughout the five campaigns. For this purpose, aliquots of diluted exhausts were collected in all-glass sampling devices. Overall more than 60 sampling devices have been exposed to collect complete exhaust samples including solid, condensed (liquid) and gaseous exhaust constituents. After a multi-step clean-up procedure, these samples were analyzed for PAHs and related compounds with GC-HRMS.
Figure 12 compares concentrations of individual PAHs in non-diluted exhausts of five Euro-3, -4 and Euro-5 GDI vehicles in the hot-started WLTC. For comparison, PAH concentrations in the exhaust of the Euro-5 diesel vehicle (Peugeot 4008, 1.6 L, black bars) with DPF, are also given.
Figure 12: PAH emissions (ng/m3, non-diluted exhaust, logarithmic scale) of five Euro-3, -4 and Euro-5 GDI-vehicles and the bench mark diesel vehicle equipped with particle filter (black) in the hot-started WLTC.
It was found that 4- to 5-ring PAH emissions of most GDI vehicles exceeded those of the bench mark diesel vehicle, whereas those of the less volatile 6- and 7-ring PAHs are comparably high. Emissions of individual PAHs can vary one to two orders of magnitude among different GDI-vehicles with the Euro-3 vehicle (Mitsubishi Carisma, 1.8 L, red bars) is the highest emitter in all, but one cases, and the Euro-5 vehicle (Opel Zafira, 1.6 L, blue bars) is the lowest emitting GDI-vehicle for most PAHs.

25
5.2. Genotoxic potential of non-filtered GDI exhausts
Figure 13 displays the weighted genotoxic potential of different GDI vehicle exhausts in the cold started WLTC. Non-diluted exhaust concentrations of those 8 PAHs rated to be genotoxic to humans (Fig. 11) were determined by GC-HRMS and weighted with respective toxicity factors.
Benzo(a)pyrene (red bars) and dibenzo(ah)anthracene (pink bars), both have the highest toxicity factor of 1, naphthalene has the lowest toxicity factor of 0.001, other PAHs have intermediate toxicity.
It is obvious that the seven GDI vehicles release substantially more genotoxic PAHs than the bench mark diesel vehicle equipped with particle filter (dashed red line). Diesel vehicle exhaust has a genotoxic potential of 45 ng benzo(a)pyrene equivalents/m3, while those of the GDI vehicles varied from 270 up to 1700 ng/m3. On average, GDI exhausts correspond to 750 ng benzo(a)pyrene equivalents/m3 having a 17-fold higher genotoxic potential than the diesel exhaust.
If one compares these values with the EU air quality limit of 1 ng benzo(a)pyrene/m3, it is clear that all GDI vehicles will substantially contribute to the overall benzo(a)pyrene burden in traffic-affected areas. In other words, the release of 1 m3 of GDI exhaust has to be diluted, on average, about 750 times to remain below the EU air quality standard.
Figure 13: Genotoxic potential of GDI exhausts (ng benzo(a)pyrene equivalent/m3, non-diluted exhaust) of four generations of Euro-3, -4, -5 and -6 GDI-vehicles and the bench mark diesel vehicle equipped with a particle filter in the cold-started WLTC. The mean of the GDI fleet is also given.
We conclude that all GDI vehicles emit relevant amounts of PAHs including genotoxic PAHs. In all cases did GDI vehicles release more PAHs than the bench mark diesel vehicle. Thus GDI vehicles not

26
only release billions of soot-like particles, they also emit relevant amounts of genotoxic PAHs. We can conclude that GDI-particles which are covered with genotoxic PAHs at ambient temperatures have a high genotoxic potential.
The co-release of nanoparticles adsorbing these semi-volatile compounds, acting as Trojan horses, transporting these PAHs into the human lung and possibly even penetrating the alveolar membrane, represent a serious health threat. We conclude that GDI exhausts contain numerous soot-like nanoparticles which carry genotoxic PAHs. In this respect they have a similar chemical composition as non-treated diesel exhausts. Non-treated diesel exhaust is considered as class 1 carcinogen by the WHO inducing lung cancer in humans. It is not clear yet, how the WHO will classify non-filtered GDI exhausts, but this certainly is an important task to do.
5.3. Metal emissions
Vehicle exhausts can contain trace amounts of metals typically released in oxidized forms as metal cations and sampled and analyzed as that, after microwave-assisted digestion in nitric acid. Several parts of the vehicle can contribute to metal emissions. The engine can contribute with engine wear, typically Fe, Al, Cu, Ni, Cr, or with abrasion from the converter technology, in this case three-way catalysts and particle filters, which are typically based on cordierite or silicon carbide, thus Al, Mg and Si have to be expected. Catalyst coating materials such as Ce, Al used as supports in form of Al2O3 and CeO2 and catalyst metals such as Rh, Pd, Pt are expected. Metal emissions from fuels or fuel additives such as iron and cerium oxides or their precursors, which are widely used as filter regeneration catalysts (fuel-borne catalysts), and metals from lubrication oils such as Ca, Zn and Ba have to be expected.
In other words, metal emissions associated with the GDI particles might be of relevance. In a first approach, diluted CVS exhausts during transient vehicle operation in the WLTC were collected with impingers. Elemental analyses of the impinging solutions indicate that metal concentrations in dilute vehicle exhausts were as low as those of the dilution air.
In a second approach, we collected non-diluted exhausts in the SSC and under idling conditions with an electrical low pressure impactor (ELPI) which allows size-classified particle sampling in the size range of 29 nm to 10 µm (aerodynamic diameter). A scheme of the ELPI is given in Figure 14. In addition to the 13 stages, a last sample (back up) was taken collecting particles below 29 nm.
Figure 14: Scheme of the electrical low pressure impactor (ELPI) used to collect size-classified particles in the size range of 29 nm to 10 µm (13 stages). In addition, back-up samples collecting particles < 29 nm were taken.

27
These samples were digested in conc. nitric acid (HNO3, supra pur) and analyzed with an inductively-coupled plasma high-resolution mass spectrometer (ICP-HR-MS).
Figure 15: Barium (left) and platinum (right) contents (ng per filter) of exhausts of the Euro-5 reference vehicle (Volvo V60, 1.6 L) operated in the SSC with gasoline and with ethanol/gasoline blends (E10 and E85) without and with GPF-1, -2, -3 and -4. Mean blank values of sampling filters also given (red line).
Current data on metal contents of GDI soot particles indicate that levels are very low, mostly at the blank level of the sampling filter. As Figure 15 shows, it can be excluded that e.g. barium is released at significant levels exceeding mean blank values from exhausts of the Euro-5 reference vehicle (Volvo V60, 1.6 L) neither when the vehicle was operated with gasoline or ethanol fuel blends (E10 and E85), nor when GPFs were used (Fig. 15 left). Also platinum levels (Fig. 15 right) were lower than mean blank values in the SSC when operating the reference vehicle (Volvo V60, 1.6 L, Euro-5) with gasoline without and with filter technology. Slightly increased Pt emissions were observed with ethanol blends (E10 and E85) which exceeded the mean blank level 3- to 4-fold.
We conclude that metal contents of GDI soot, collected on different ELPI filter stages, were very low, mostly at levels of the blank filters. With metal contents at background levels, no obvious differences could be observed for filtered and non-filtered samples or for samples obtained from combustion of gasoline or ethanol/gasoline blends. It can be concluded that most of the particulate matter released from GDI vehicles is soot, carrying adsorbates from semi- or non-volatile carbonaceous material. Thus the presence of substantial quantities of metal oxide particles can be excluded, also in the ultra-fine fraction (< 100 nm).

28
6. Impact of alternative fuels on GDI vehicle emissions
6. 1. Impact of ethanol fuel blends on particle and regulated pollutant emissions
One of the GDI vehicles (Volvo V60, 1.6 L, Euro-5) is a flex-fuel vehicle, which was used to study effects of ethanol on particle formation and PAH emissions as discussed below.
Figure 16 displays CO2, CO and PN emission factors of the flex-fuel GDI vehicle when operated with gasoline (E0), and gasoline ethanol blends which contained 10% (E10) and 85% (E85) ethanol. The vehicle was tested under steady-state conditions (SSC) and transient driving in the cold- and hot-started WLTC.
Figure 16: CO2, CO and PN emission factors of the reference Euro-5 GDI vehicle (Volvo, V60, 1.6 L) operated with gasoline (E0) and two gasoline/ethanol blends (E10, E85) in cold- (blue) and hot-started (red) WLTCs and the SSC (black). The EDC Euro5/6 diesel emission limits for CO (1000 mg/km) and for PN (6 x 10¹¹ particles/km) are indicated (magenta lines). The mean CO2 emission of the flex-fuel vehicle in the homologation cycle is reported to be 153 g/km, corresponding to a fuel consumption of 6.6 L/100 km (magenta).
As observed before, emissions of CO2, CO and particles (PN) are highest under transient driving compared with steady-state vehicle operation. Ethanol blending resulted in CO2 emission reductions in the WLTC of 10-13% and 15-17% for E10 and E85, respectively. CO emissions were lowered by 76-81% and 83-87% with E10 and E85 and PN emissions dropped by 77-97% and 94-96%.
When comparing the SSC with the cold start WLTC data, CO2 and CO emissions were lowered by 33-37% and 96-97%. CO and CO2 reductions were rather independent of the fuel. Substantial reductions of PN emissions were also observed. PN emissions were lowered by 37% when comparing transient and steady vehicle operation with gasoline (E0) and are reduced by more than 99% with E10 and E85.
In conclusion, ethanol blending had pronounced effects on CO2, CO and PN emissions of this flex-fuel GDI vehicle, both under transient and steady driving conditions.
Figure 17 compares CO- and PN- (y-axes, logarithmic scales) with CO2 emission factors (x-axes) of different cycle phases for E0, E10 and E85 fuels. CO and CO2 emission factors are correlated to some degree. CO emissions increased by about two orders of magnitude with increasing CO2 (Fig. 17, upper diagrams). CO2 is a metric for fuel consumption, which increases with vehicle speed and during

29
transient (red) rather than steady (black) driving. Urban transient driving under cold start influence (blue) produced highest CO, PN and CO2 emissions independent of the fuel applied.
Similar correlations could be observed for PN emissions (Fig. 17, lower diagrams), but fuel effects were much stronger for this vehicle. Especially PN emissions under steady-state driving (black) are two orders of magnitude lower than those from transient driving (red).
Figure 17: Correlation of CO-, PN- and CO2 emission factors of the Euro-5 reference vehicle (Volvo V60, 1.6 L) operated with gasoline (E0) and gasoline/ethanol blends (E10 and E85) in different phases of the cold- (blue), hot-started (red) WLTCs and the SSC (black).
It can be concluded that already at ethanol levels of 10% (E10) PN emissions are mostly below the emission limit of 6 x 10¹¹ particles/km. Even lower PN emissions are observed with E85.
6.2. Impact of ethanol fuel blends on genotoxic emissions
It has been shown that ethanol blending strongly affects CO and particle emissions of the tested Euro-5 flex-fuel vehicle (Volvo V60, 1.6 L). We hypothesized that PAH emissions are also affected by ethanol assuming that PAHs do form in parallel to particles in the engine, in sub-stoichiometric, fuel-rich mixing zones. Figure 18 compares PAH emission factors (µg/km, logarithmic scales) of selected PAHs. Respective chemical structures are given in Figure 11. Genotoxic PAHs are labeled (*).
PAH emissions were highest in the cold- (blue) and hot-started (red) WLTC with gasoline (E0). Emissions decreased with increasing ethanol levels when comparing E0, E10 and E85 data, both in the cold- and hot-started WLTCs. PAH emissions are often minimal under steady state operation (black) as observed before for other pollutants like PN, CO, CO2 and THC. This trend is independent of the fuel and is also observed for E10 and E85. Individual PAH emissions in the SSC were sometimes very low, at levels of the dilution air. Respective data is indicated as white bars in Fig. 18.

30
Figure 18: PAH emissions (µg/km) of the reference vehicle (Volvo, V60, 1.6 L, Euro-5) operated with gasoline (E0) and two ethanol-gasoline blends (E10, E85) in cold- (blue) and hot-started (red) WLTCs and the SSC (black). Dilution air levels are also reported (white). Genotoxic compounds are marked (*).
It can be concluded that ethanol blending has a positive effect and reduced particle and PAH emissions for this specific flex-fuel GDI vehicle (Munoz et al., 2016).
Figure 19 reports PAH reduction efficiencies when comparing data from hot- (red) and cold-started (blue) WLTC for E10 (left) and E85 (right) with respective gasoline (E0) data. Consistent trends were observed for hot WLTC data. Reduction efficiencies increase from 70% for 2-ring PAHs to about 95% for 6-ring PAHs when comparing E10 with E0 data. Efficiencies were even higher for E85. They increased from about 85% for 2-ring to 95% for 6-ring PAHs. There is more scatter in the cold start data (blue), but trends towards increased PAH reduction efficiencies with higher ethanol content and larger ring number are also evident.
In conclusion, ethanol blending leads to substantial reductions of PAH emissions for this flex-fuel vehicle. Reduction efficiencies increased with PAH ring number and ethanol content of the fuel.
Some of the investigated PAHs are genotoxic to humans (Fig. 11). Figure 20 reports the genotoxic potential of these exhausts and compares the toxicity equivalence-weighted emission factors (ng TEQ/km) for the genotoxic PAH fractions and different fuels and driving cycles.

31
Driving the reference vehicle (Volvo V60, 1.6L, Euro-5) with gasoline, produced genotoxic PAH emissions of 185–210 ng TEQ/km at transient driving in the cold and hot WLTC. Genotoxic PAH emissions in the SSC were considerably lower (0.01 x) as observed for most other pollutants.
Figure 19: PAH reduction efficiencies dependent on PAH ring number. Data of the flex-fuel vehicle (Volvo, V60, 1.6 L, Euro-5) operated with ethanol blends (E10 and E85) and gasoline (E0) in cold- (blue) and hot-started (red) WLTCs are compared.
Ethanol blending induced substantial reductions of genotoxic PAH emissions, most pronounced in the hot WLTC with reductions of 77% and 84%, if comparing E10 and E85 with E0 data, respectively. Effects were less pronounced in the cold WLTC but pointed in the same direction.
Figure 20: Genotoxic potential of the PAH emissions. The eight genotoxic PAHs listed and their toxicity equivalence-weighted proportions (ng TEQ/km) of the reference vehicle (Volvo, V60, 1.6 L, Euro-5) operated with gasoline (E0) and ethanol blends (E10 and E85) in cold and hot started WLTCs and the SSC are given (left). Respective weighted mass proportions are also shown for WLTC data (right).

32
Figure 20 also displays patterns of the genotoxic PAHs. Naphthalene (blue) and benzo(a)pyrene (red) mainly contributed to the overall genotoxic potential of these exhausts, independent of the fuel used.
Overall, one can conclude that ethanol blending strongly affected the emission characteristics of this vehicle. All critical pollutants were clearly reduced with strongest effects on emissions of particles, CO, PAHs including the genotoxic PAHs, THCs and even CO2.
However, before generalizing these findings, additional GDI vehicles have to be studied. With the support of CCEM, we performed an additional campaign and tested two other GDI vehicles. These vehicles were operated with E0 and E10 and, as another alternative oxygenated fuel, with an n-butanol/gasoline blend, containing 15% n-butanol (B15). Respective emission data is not available yet and will be published later elsewhere.

33
7. Impact of gasoline particle filters (GPFs) on GDI vehicle emissions
Particle filters are widely used in various diesel vehicles today. They have been implemented already in the year 2000 in an Euro-3 passenger car (Peugeot 607, 98 kW, 2.2 L). With the implementation of a particle number emission limit of 6 x 10e11 particles/km in 2009, all Euro-5 diesel vehicles were equipped with filter technology. This PN emission limit also affected light-duty vehicles. Since 2013, Euro-VI heavy-duty vehicles also have to comply with a PN limit of 6 x 10e11 particles/kWh and are equipped with particle filters too.
In parallel also construction machinery, buses for public transportation and many off-road diesel applications are equipped with particle filter technology. The Swiss clean air act (Luftreinhalte- Verordnung) limits particle number emissions of construction machinery to 6 x 10e11 particles/kWh already since 2009 and defines criteria to be met for filter technology for these applications. It is prescribed that particle number filtration efficiencies should be >98% for all particles in a size range of 23 and 400 nm. The application of particle filters should not lead to an increase of toxic secondary pollutants and these conditions must also be met after 2000 hours of field operation.
In other words particle filters have been widely used for nearly two decades now in many diesel applications but are so far not applied for gasoline vehicles. With the support of our industrial partners could we test four different prototype particle filters for their impact on GDI-exhausts.
Two GPFs were non-coated, two were coated with catalytic material not specified to us. The four filters named GPF-1, -2, -3 and -4, were installed at the tailpipe of the reference vehicle and tested under similar conditions in the cold and hot started WLTC and the SSC.
7.1. Impact of GPFs on particle size distribution
Figure 21 displays particle size distributions of exhausts of the reference vehicle (Volvo V60, 1.6 L, Euro-5) without and with a GPF under steady state driving at 95 km/h. A bimodal particle size distribution with nucleation mode particles at 20 nm and accumulation mode particles at 80 nm can be observed without GPF as discussed before. Both, the SMPS and the nanoSMPS data correlate well in the overlapping size range indicating that sub-23 nm particle are observed, but no indications are found for an increase towards 10 nm particles.
With GPF, particle emissions are lowered be 2-3 orders of magnitude to particle number concentrations of 2x10e2 to 6x10e5 particles/ccm in dilute exhaust (Fig. 21, left). In other words, PN filtration efficiencies are always > 99% and even > 99.9% for the very fine particles <30 nm. Thus the examined GPF is able to lower PN emissions in the entire size range without any brake through at sub-23 nm particles.

34
Figure 21: Particle number concentrations (particles/ccm) and size distribution (nm) of GDI vehicle exhausts (Volvo V60, 1.6 L, Euro-5) without and with a GPF at constant driving at 95 km/h. SMPS (solid lines) and nanoSMPS (dashed lines) data is compared and respective particle number filtration efficiencies are calculated (left).
7.2. Efficiencies of GPFs and particle number emissions
Figure 22 displays PN emissions of the reference vehicle (Volvo V60, 1.6 L, Euro-5) without (left) and with four different gasoline particle filters (GPF-1, -2, -3 and -4) in the cold and hot started WLTC and the SSC. For comparison, the mean values (±stdv.) and PN emissions of the bench mark diesel vehicle (Peugeot 4008, 1.6 L, Euro-5) with DPF are given.
Figure 22: Particle number emissions (particles/km) of the reference GDI vehicle (Volvo V60, 1.6 L, Euro-5) without and with GPF-1, -2, -3, and -4 in the cold and hot started WLTC and the SSC. Mean emissions (n=4) of the filtered exhausts are compared with those of the bench mark diesel vehicle (Peugeot 4008, 1.6 L, Euro-5) with DPF.

35
Particle number emissions after GPF-1, which showed the strongest effects, are reduced by 1 to 2 orders of magnitude at transient driving in the cold and hot WLTC and even 3 orders of magnitude lower under steady vehicle operation (SSC). PN emissions after this filter still are about a factor 10 higher than those of the diesel vehicle, but are more than one order of magnitude lower than those after GPF-2, -3 and -4.
On average, these four prototype GPFs induced PN reductions of 77%, 87% and 95% in the cWLTC, hWLTC and the SSC. In other words, the Euro-5 reference vehicle after a retrofit with these GPFs can lower PN emissions below the future PN limit of 6 x 10e11 particles/km. However, this seems not to be the maximum efficiency that can be achieved with well integrated filter technology, as shown by the bench mark diesel vehicle with a well-integrated and regulated catalytic DPF.
7.3. Impact of GPFs on genotoxic PAH emissions
Figure 23 displays the toxicity-weighted genotoxic potentials (ng benzo(a)pyrene equivalents/m3) of GDI vehicle exhausts of the Euro-5 reference vehicle (Volvo V60, 1.6 L) without and equipped with four prototype gasoline particle filters (GPF-1, -2, -3 and -4) in the cold and hot-started WLTC. For comparison, respective data of the bench mark diesel vehicle with integrated particle filter is also given.
Figure 23: Genotoxic potential of PAH emissions of filtered and non-filtered GDI vehicle exhausts in the cold and hot started WLTC. The eight genotoxic PAHs listed and their toxicity equivalence weighted proportion (ng TEQ/m3) of the Euro-5 reference vehicle (Volvo, V60, 1.6 L) operated without filter and with GPF-1, -2, -3 and -4 are given and compared with data of the benchmark diesel vehicle (Peugeot 4008, 1.6 L, Euro-5) with DPF.
It has been discussed that the genotoxic potential of exhausts of the non-filtered Euro-5 GDI vehicle (Volvo V60, 1.6 L) is substantial and is exceeding the diesel vehicle 6- to 7 -fold. Gasoline particle

36
filters GPF-1, -2 and -3 lowered emissions of genotoxic PAHs by about 45-70% in the cold and by 71-83% in the hot WLTC, respectively.
GPF-4, which was not coated, not only had moderate efficiency with respect to particle number emissions, its impact on genotoxic emissions were only 10% in the cWLTC. In the hot WLTC, even 2-times more genotoxic PAHs were released after the filter than from vehicle. In other words, this filter was not able to convert these genotoxic PAHs, but stored them, and released them again. Such store-and-release phenomena have been observed before for catalytically inactive DPFs.
We conclude that GPFs have a large potential to reduce both, nanoparticle emissions and genotoxic PAHs. But best-available filter technologies have to be implemented, to guarantee an efficient removal of soot particles. To be able to combust the accumulated soot, catalytic coatings are needed which should also convert semi-volatile adsorbates like PAHs. Otherwise, these critical compounds do accumulate in filters to be released again later under high load operations as observed for one of the four prototype particle filters.
Furthermore, fully integrated catalytic GPFs, operated at higher temperatures, allowing a combustion of accumulated soot and adsorbates, will be needed to lower the genotoxic potential of GDI vehicle exhausts to levels, already achieved for diesel vehicles since nearly two decades.
Further steps to integrated GPFs are needed. Due to the substantial risks associated with non-filtered GDI exhausts which include numerous nanoparticles and substantial levels of genotoxic PAHs, filters should be implemented quickly in GDI vehicles, on a global scale.

37
8. SOA formation of GDI exhausts in the PSI smog chamber and PAM oxidation flow reactor
Some of the emitted gaseous exhaust constituents and the semi-volatile hydrocarbons discussed above can contribute to the formation of organic secondary aerosols (SOA) once released to the atmosphere. Three independent approaches, which are applied in the project, address these exhaust properties. For SOA analysis, PSI used their mobile smog chamber (SC) and the potential aerosol mass (PAM) oxidation flow reactor (OFR) as discussed in this chapter. A third and independent approach to study the SOA potential is the micro smog chamber (MSC) developed by UASNWS, which will be discussed in the following chapter.
8.1. Material and methods
8.1.1 Experimental design
Two sets of experiments to study vehicle emissions were conducted (set I in 2014, set II in 2015). In addition, selected SOA precursors, the non-methane organic carbon (NMOCs) toluene, o-xylene, and 1,2,4-trimethylbenzene (TMB) were injected into the OFR at different concentrations for comparison (conducted in 2016, Pieber et al., 2017). In the following, we describe vehicle testing and photochemistry experiments. For further details also refer to Pieber et al., 2017.
8.1.2. Vehicle testing
All vehicles were operated on the UASB chassis dynamometer, those studied in the SOA campaigns are listed in Table 2. In 2014, the Euro-5 GDI vehicle (Opel Insignia 1.6 LGDI-1), as well as the Euro-5 reference vehicle (Volvo V60, 1.6 L, GDI-4) were tested. GDI1 was investigated i) in standard configuration, and ii) equipped with a prototype gasoline particle filter (GPF), installed at the muffler (“underfloor”). The GPF filtration quality is equivalent to the best available technology for DPFs (personal communication by the manufacturer). In 2015, two additional GDI vehicles were tested in standard configuration (no retrofitted after-treatment system). Tests with GDI-4 (Volvo V60) were repeated in 2015; furthermore, GDI-4 was retrofitted with i) the previously tested GPF as well as ii) a catalytically coated GPF (catGPF) (installed at the muffler, underfloor, while keeping the original TWC in the original position). For the retrofitted catGPF, the primary purpose of the catalytically active coating is the constant self-cleaning of deposited carbonaceous material on the particle filter (personal communication with manufacturer). In future applications, such catalytic coating on a GPF might replace the existing TWC in GDI vehicles, or specifically, the TWC can be replaced with a GPF carrying the TWC coating.
The WLTC (Figure 2), and the common but less representative European driving cycle (EDC) were used. The EDC is characterized by two phases (urban and extra-urban phase of highly repetitive characteristics) and lasts 20 min, the WLTC is characterized by four phases at different speed levels (referred to as Phase (Ph) 1-4, i.e. low, medium, high, extra-high speed); it contains patterns of disruptive acceleration and deceleration and lasts 30 min. Engines were started either after a soaking time of at least 6 hours at the test temperature (typically between 20-25°C, referred to as “cold-started”), or after warming up the engine and after-treatment system by driving for 3 min at a steady-state speed of 80 km h-1 (“hot-started”).

38
Table 2. Vehicles and tests (n number of tests conducted; EDC tests were only conducted with GDI-1 and GDI-1 w/GPF).
Vehicle Code
Vehicle Type
Expt. Set
cold-started WLTC
hot-started WLTC
cold-started EDC
hot-started EDC
GDI-1
Opel Insignia; Euro 5, standard conf iguration
2014 (I) n=4 n=4 n=1 n=1
GDI-1 w/GPF
Opel Insignia; Euro 5, with retrof itted GPF (underfloor)
2014 (I) n=4 n=4 n=3 n=3
GDI-2
Opel Zafira Tourer, Euro 5
2015 (I I) n=4 n=4 -- --
GDI-3
VW Golf P lus, Euro 4
2015 (I I) n=4 n=4 -- --
GDI-4 (2014)
Volvo V60, Euro 5, standard conf iguration
2014 (I) n=4 n=4 -- --
GDI-4 (2015)
Volvo V60, Euro 5, standard conf iguration
2015 (I I) n=3 n=1 -- --
GDI-4 w/GPF
Volvo V60, Euro 5, with retrof itted GPF (underfloor)
2015 (I I) n=4 n=2 -- --
GDI-4 w/catGPF
Volvo V60, Euro 5, with retrof itted catGPF (underfloor)
2015 (I I) n=4 n=2 -- --
Cycles are classified as cold-started WLTC (denoted cW), and hot-started WLTC (hW), cold-started EDC (cE), and hot-started EDC (hE). In parallel to the regulatory CVS sampling and tailpipe FTIR measurements, emissions were sampled using 1 or 2 Dekati ejector dilutors in series for characterization by non-regulatory equipment and photochemistry experiments. Figure 24 gives a scheme of the set-up, including our non-regulatory equipment, the SC and the OFR. Sampling was performed similar to the description in Platt et al., 2013; 2017, which demonstrated good agreement between batch-sampled emissions and 1) online measurements of gaseous emission at the tailpipe (Platt et al., 2013) and 2) gravimetric PM samples from the CVS (Platt et al., 2017). Clean air to operate the sampling and dilution system, as well as the SC and OFR, was provided by a compressor (Atlas Copco SF 1 oil-free scroll compressor with 270 L container, Atlas Copco AG, Switzerland) combined with an air purifier (AADCO 250 series, AADCO Instruments, Inc., USA).

39
Figure 24. Schematic (not to scale) of the experimental set-up for SOA measurements. Vehicles were driven over regulatory driving cycles (EDC and WLTC) on a chassis dynamometer . Emissions were sampled through a heated dilution and sampling system using 1 or 2 ejector dilutors into the PSI mobile SC and the potential aerosol mass (PAM) oxidation flow reactor (OFR). Instrumentation for characterization of fresh and photo-chemically aged emissions is listed. The raw exhaust was also sampled at the tailpipe using standard test bench equipment to monitor regulatory species (diluted in a constant volume sampler, CVS) and non-regulated emissions (with Fourier-Transformed Infrared Spectroscopy, FTIR).
8.1.3. Experimental procedures
Experiments were conducted in three configurations: 1) time-resolved measurements of primary emissions and time-resolved aging in the oxidation flow reactor, 2) OFR photochemical aging from SC batch samples, 3) SC photochemical aging of SC batch sample. Experiments were conducted as follows. First, diluted emissions from the cold-started vehicle tests were sampled online during the driving cycle and characterized in real-time, either fresh (“primary”), or photochemically aged in the OFR (“secondary”). In parallel, the emissions from the cold-started driving cycle were sampled into the SC for a later photochemical batch experiment, either over the full cycle (cW and cE), the first (Ph 1, cW) or the aggregated second through fourth phases (Ph 2-4, cW). Thereafter, a second vehicle test was performed, for which the vehicle was warmed up for 3 min at 80 km h-1 steady driving. The hot-started test emissions were sampled and characterized in real-time fresh or aged (“OFR online”). No sampling of hot-started driving cycle emissions into the SC was performed. When both driving tests were completed, the previously sampled cold-started emissions were characterized and photochemically aged in the OFR by sampling the batch collection from the SC (OFR-from-SC sampling experiments, also referred to as “batch OFR” herein). Then, photochemical aging was performed in the SC. At the start of each experiment the SC was filled to approximately two thirds full with humidified air, with the remaining volume available for sample injection. After sample injection, the chamber volume was filled up to its maximum with pure air, and the relative humidity

40
(RH) was adjusted to 50%. To quantify OH exposure during the experiments, 1 μL of deuterated butanol (BuOH-D9) was added. Once the monitored emissions parameters and the BuOH-D9 signal stabilized and indicated a well-mixed chamber, primary emissions were characterized and sampled into the OFR for photochemical aging. The OFR was operated at different OH exposures determined by UV lamp intensity (denoted 100%, 70% and 50%), followed by a UV off (OFR dark) period. Once OFR-from-SC sampling was completed, O3 was injected into the SC to oxidize NO to NO2. HONO, used as an OH precursor, was injected continuously for the remainder of the experiment and photochemistry was initiated by illuminating the SC with the UV lights for a period of 2 hours. The temperature around the SC was kept approximately at 25°C, but reached up to 30°C with UV lights switched on. The OFR likely, also has slightly higher than ambient temperatures close to the UV sources, due to heating from the lamps.
8.1.4. PSI mobile smog chamber (SC)
Figure 25 displays the PSI mobile SC (Platt et al., 2013) which is an approximately 12 m3, 125 μm thick collapsible Teflon bag (DuPont Teflon fluorocarbon film (FEP), type 500A, Foiltec GmbH, Germany) suspended from a mobile aluminum frame (2.3×2×2.5 m, L×W×H) with a battery of 40×100 W UV lights (Cleo Performance solarium lamps, Philips).
Figure 25: Light- and HONO-induced secondary organic aerosol formation in the mobile PSI smog chamber.
It is equipped with an injection system for purified air, water vapor, and gases (O3, NO, NO2, SO2, propene (C3H6). OH radicals used as the primary oxidant, are generated by photolysis of HONO, which is injected continuously into the chamber and generated as described in Platt et al., 2013 and Taira and Kanda, 1990. The SC was cleaned prior to each experiment by filling with humidified air and O3 and irradiating with UV light for at least 1 h, followed by flushing with dry, pure air for at least 10 h. Background measurements of the clean chamber were conducted prior to each experiment. Control experiments were conducted regularly in the SC to estimate the contribution of the SC background to SOA formation.

41
8.1.5. PAM oxidation flow reactor (OFR)
Experiments herein utilize the potential aerosol mass (PAM) OFR, of which several different configurations currently exist. We described our OFR previously (Bruns et al., 2015). It consists of a 0.015 m3, cylindrical glass chamber (0.46 m length, 0.22 m diameter) containing two low pressure mercury UV lamps, each with discrete emission lines at 185 and 254 nm (BHK Inc.), as shown in Figure 26.
Figure 26: The PSI oxidation flow reactor (OFR) equipped with 2 lamps.
The lamps are cooled by a constant flow of air. The incoming reactant flow is mixed radially dispersed by a perforated mesh screen at the inlet flange. The flow through the OFR was regulated by the flow pulled by instruments and pumps behind the reactor, and was set to 8-9 L min-1, corresponding to a plug flow residence time of 90-100 s. A small fraction of the total flow (0.5-1 L min-1) was sampled behind a second perforated mesh (often termed “ring-flow”) and discarded. The OFR was equipped with an injection system for water vapor (a Nafion humidifier) and organic compounds (BuOH-D9 as an OH tracer, and toluene, o-xylene and 1,2,4-trimethyl benzene for single precursor tests (Pieber et al., 2017). A scheme is presented in Figure 27.
During “online” time-resolved operation of the OFR, the diluted exhaust (either 1 or 2 ejector dilutors) was mixed with humidified air up to 50% of the total flow through the reactor, leading to an additional dilution of up to a factor 2. When sampling from the SC (OFR-from-SC experiments) instead, no separate addition of water vapor or BuOH-D9 was required. OH radicals in the OFR are produced by photolysis of water vapor (H2O) at 185 nm, or by production of atomic oxygen in excited state O(1D) from photolysis of ozone (O3) at 254 nm, which can react with H2O to form OH. O3 itself is produced by reaction of atomic oxygen in ground state, O(3P), with O2. O(3P) itself is formed by photolysis of O2 at 185 nm. Lamp power can be regulated between 0 and 100%, with lower intensities lowering both, O3 and OH production. The ratio of OH/O3 remained relatively constant at our test points (1.4-2.6 x 10⁻⁵ at 100%, 1.9-3.0 x 10⁻⁵ at 70%, and 1.7-2.6 x 10⁻⁵ at 50%). The OFR was cleaned prior to each experiment by flushing it with humidified, pure air, while keeping the UV lights on for at least 10 min.

42
Figure 27: Schematic of the oxidation flow reactor (not to scale, modified from Pieber et al., 2017). The reactor is equipped with an injection system for water vapor (H2O) and hydrocarbons (notably BuOH-D9, and selected precursors for single molecule testing). Water vapor is provided via a Nafion humidifier. Air is passing on one side of the Nafion membrane, collecting water vapor from the liquid on the other side of the membrane. In addition, other chemicals, such as BuOH-D9 (used as an OH tracer) can be injected by passing a small stream of clean air through a vial containing the liquid hydrocarbons.
8.1.6. PTR-ToF-MS
A high resolution proton transfer reaction time-of-flight mass spectrometer (PTR-ToF-MS, PTR-TOF-8000, Ionicon Analytik Ges.m.b.H., Innsbruck, Austria), was used to study the chemical composition of the gaseous organic compounds in fresh and aged emissions (Jordan et al., 2009; Graus et al., 2010). The PTR-ToF-MS uses hydronium ions (H3O+) as the primary reagent to protonate gaseous organic molecules having a proton affinity higher than that of water (Pieber et al., 2017).
8.1.7. HR-ToF-AMS
Quantitative, size-resolved mass spectra of the non-refractory sub-micron particle composition were provided by use of a high resolution time-of-flight aerosol mass spectrometer (HR-ToF-AMS, Aerodyne, DeCarlo et al., 2006). Particles are continuously sampled into the HR-ToF-AMS through a PM1 aerodynamic lens and focused onto a heated porous tungsten vaporizer (Tvap = 600 °C) in high vacuum (10-5 Pa). The non-refractory particle components are flash-vaporized and the resulting gas is ionized by electron ionization (EI, 70 eV), and then classified by a time-of-flight mass spectrometer (ToF-MS). The particle beam is alternately blocked (“closed”) and unblocked (“open”), and all data presented herein are open minus closed signals derived from high resolution analysis fitting procedures (SQUIRREL1.51H, PIKA 1.10H), running in the Igor Pro 6.3 environment (Wavemetrics Inc., Lake Oswego, OR, U.S.A.). Following standard procedures (Canagaratna et al., 2007), the instrument ionization efficiency (IE) and particle size measurement were calibrated using size-selected NH4NO3 particles and polystyrene latex spheres (PSLs), respectively. A relative ionization efficiency of 1.4 for organic material and a collection efficiency of 1 were applied to the data. No corrections for lens transmission were performed. HR-ToF-AMS data were corrected for background gas-phase CO2 in the emissions by subtracting a CO2-signal measured in a particle-free sample. The interaction of inorganic salts with pre-deposited carbon on the tungsten vaporizer can lead to the generation of CO2
+ signal in the open minus closed HR-ToF-AMS mass spectra (Pieber et al., 2016). Here photochemical aging of the exhaust resulted in significant NH4NO3 formation, reaching NO3/OA ratios of 5. A CO2
+ signal at 3.5% to NO3 was determined and corrected according to Pieber et al., 2016.

43
8.2. SOA formation in PSI-smog chamber and the oxidation flow reactor
8.2.1. Pollutants as function of vehicle technology and driving cycle
Figure 28 summarizes emission factors (EFs) of pollutants across all vehicles and conditions tested (Pieber et al., 2017). Investigation of THC, NMHC and gravimetric PM of time-resolved emissions for cold- and hot-started WLTC and EDC tests using GDI1-3 demonstrated significant THC and NMHC emissions during cold-engine tests, with emission factors reduced by a factor of 90 during hot-started cycles (Figure 29 panels a and c). Median NMHC EFs were 1132 mg kgfuel
-1 (cW) and 12.9 mg kgfuel-1
(hW). EFs from cold-started WLTC (cW) for GDI1-3 were dominated by Ph 1 (cW, 4663 mg kgfuel-1),
which exceeded all other phases of the WLTC by 2 to 4 orders of magnitude. GDI4 had lower total emissions during cold-started cycles compared to other vehicles (~factor 3 lower, median NMHC EF (cW): 434 mg kgfuel
-1) and a smaller difference between cold- and hot-started cycles (GDI4 cW NMHC is only 8 times higher than hW, rather than 90 times as for GDI1-3; median NMHC EF for hW (GDI4): 55.7 mg kgfuel
-1). When looking at individual phases of the driving cycle, e.g. comparing Ph 1 of cW and hW vs. Ph 2-4 of cW and hW, for different vehicles (GDI1-3 vs. GDI4), we find that while Ph 1 (cW) NMHC emissions for GDI4 are significantly lower compared to GDI1-3 (by a factor 3), NMHC EF for GDI4 during all other phases appeared higher than those of GDI1-3 (factor 2-30, with the biggest difference found for Ph 2-4 (hW). The corresponding median data are 4663, 0.1, 23.8, 1.6 mg/kgfuel (for GDI1-3, Ph 1 (cW), Ph 1 (hW), Ph 2-4 (cW) and Ph 2-4 (hW) respectively, and 1507, 2.2, 56.8, 41.1 mg/kgfuel(for GDI4).
Lower cold start emissions of GDI4 compared to other vehicles may be explained by differences in the catalytic after-treatment system, the location of the catalyst as well as reduced cold start enrichment. In terms of NMHC/THC EFs, GDI4 can be considered in line with Euro 6 vehicles, for which regulation also focuses on the reduction of the cold-start HC emissions. No influence of GPF installation on the NMHC EFs was observed for either GDI1 or 4 (GDI2 and 3 were not tested), as further discussed below. Primary PM emissions are less affected by the differences between cold- and hot-started cycles and among vehicles (Fig. 28). The largest difference was induced by the application of GPFs as discussed further below.
The total PM emitted by vehicles in standard configuration is dominated by eBC rather than POA (Fig. 28 b), and the low POA-to-eBC ratio is similar to diesel engines not equipped with DPFs, as also found by Saliba et al., 2017. PM measured in the batch samples (sum of eBC and POA, Fig. 28b) compares generally well with the gravimetric PM analysis of filters sampled from the CVS.

44
Figure 28: Emission factors (EF) of pollutants from cold-started (c) and hot-started (h) test cycles (WLTC (W) and EDC (E)) (modified from Pieber et al., 2017). Individual cW and hW phases are indicated as Ph 1-4. (a) EFs of total and non-methane hydrocarbons (THC, NMHC) and primary gravimetric particulate matter (PM) from CVS measurements over entire test cycles for different vehicle configuration and test conditions, (b) EFs of primary PM (equivalent black carbon (eBC) and primary organic aerosol (POA)), and secondary organic aerosol (SOA) formed during photochemical aging in SC, OFR-from-SC experiments and during online operation of the OFR (OFR at 100% UV intensity) per vehicle configuration for cold-started test cycles. (c) EFs of the same cW and hW experiments presented in (a) separated into individual cycle phases. (d) EFs of primary gravimetric PM, POA and eBC, NMHC and aromatic hydrocarbons (ArHC) and SOA full cW and cE, compared to individual phases of cW. Note that the EF for eBC for Ph 2-4 (cW) is 17 mg kg-1
fuel and that the data point is hidden behind the SOA data points in the graphical presentation. (a-d)

45
Selective sampling of phases of the cold-started cW into the SC (Fig. 28d) and time-resolved measurements (Figure 29) indicate that significant eBC is emitted during cold-engine start-up (Ph 1 cW). Equivalent BC emissions are however not as strongly reduced during hot-engine (Ph 2-4 from cold-started cycle) emissions, and during hot-started cycles (hW, Fig. 28b for total PM (CVS), Fig. 29 for eBC) as e.g. the NMHC EFs under hot engine conditions.
Emissions of all cold-started vehicles, technologies and driving tests showed significant SOA formation upon photochemical oxidation (Fig. 28b). This is consistent with the above observation that NMHC and NMOC emissions (determined by the PTR-ToF-MS, see Fig. 30d) are greatly elevated during cold-started cycles. The SOA production in mg kg-1
fuel lies within the range of previous aggregated data (Jathar et al., 2014; Platt et al., 2017) (median 60, range 10-400 mg kg-1
fuel) (Jathar et al., 2014) for the SC experiments with vehicles in standard configuration (as well as equipped with GPF). Similar to the observations for NMHC EFs, SOA production factors for GDI4 (median: 12 mg kg-
1fuel) are around a factor 20 lower compared to average SOA production factors for GDI1-3 (Fig. 28b)
(median: 222 mg kg-1fuel).
Photo-chemical aging of Ph 2-4, sampled into the SC and OFR-from-SC from a cold-started driving test, showed significantly lower SOA production factors (Fig 28d), in analogy to the lower NMHC and NMOC emission factors for hot engine conditions, which are discussed in detail later.
8.2.2. Time-resolved SOA formation in the OFR
Investigation of CVS and batch sampling of the individual phases of cold-started WLTC indicates the highest emission of SOA precursors and SOA formation from cold-started Ph 1 (cW), consistent with the previous discussion. This is confirmed by time-resolved SOA profiles from aging of the emissions in the OFR online during the driving cycles. Figure 29 shows the time-resolved aged emissions for cold- and hot-started WLTC tests using GDI1 (standard configuration). The emissions are exposed to photochemistry in the OFR, with UV intensity at 100%. OA and nitrate (denoted NO3) are monitored behind the OFR by the HR-ToF-AMS; for the cold-started cycle, the POA signal measured during a separate experiment (with OFR UV off) is shown for reference. The large difference between the OA and POA traces indicates that the observed OA is predominantly SOA.
During the cold-started cycle, significant SOA formation is observed by the HR-ToF-AMS during Ph 1 (i.e. start and low speed) and to a lesser extent during Ph 2-4 (simulated highway driving). The peak at engine start is observed during all cold-start vehicle tests, regardless of vehicle, driving cycle or presence/absence of GPFs, while the small peak at the end of high-speed/extra urban driving is finished appears inconsistently. The latter is related to a delay of the OFR signal by the residence time in the reactor. The cold-start SOA signal correlates with THC measurements at the OFR inlet, and is not evident during the hot-started cycle.
These trends are consistent with the regulatory test bench measurements described above and EFs calculated from batch samples in the SC. The duration of the SOA peak observed at the engine start is likely artificially increased by OFR residence/response timescales and reflects the first few seconds to minutes, prior to catalyst light-off, rather than representing consistently high emissions throughout Ph 1. Supporting this explanation, the hot-started cycle (in which the catalyst operates efficiently from the beginning of the test) does not exhibit any significant emission of NMHC, and leads to very

46
little SOA formation also when investigated online. Hence, the cold-start emissions dominate the total GDI SOA burden, and are selected below for investigation of relevant SOA precursors, SOA potential and yields in OFR-from-SC and SC photochemistry experiments.
Figure 29: Example of time-resolved aging of cold- and hot-started emissions (WLTC) (GDI1, standard configuration) (modified from Pieber et al., 2017). Top: WLTC speed profile. Bottom: OA profile during WLTC presenting the OA measurement during the 30 min driving test with OFR at 100% UV intensity; due to a delay in the OFR the signal after the WLTC is finished is displayed as well), nitrate aerosol (inorganic, ammonium nitrate, displayed is only NO3), as well as POA and equivalent black carbon (eBC).
8.2.3. Primary NMOC composition investigated by PTR-ToF-MS
Figure 30 a shows the average NMOC mass spectrum obtained by the PTR-ToF-MS for exhaust from vehicle GDI1 over a full cold-started WLTC. The relative NMOC composition over all test conditions (driving cycles and phases, vehicle configuration) is given in Fig. 30b. A detailed description is provided later. In summary, while gasoline as a fuel is mainly composed of aliphatic compounds and aromatic hydrocarbons (ArHC) having between 7 and 10 carbons (the latter making up roughly 35% of the fuel volume), the exhaust mass spectral composition from cold-started driving tests appears to be dominated ArHC by surviving fuel additives like methyl-tert-butyl-ether (MTBE), together with newly formed ArHC and short chain aliphatic hydrocarbons, which are incomplete combustion products. The composition depends strongly on the driving cycle phase, with ArHC dominating the emissions in Ph 1 (cW) and the full cycles (cW, cE), while constituting a smaller fraction of Ph 2-4 (cW). As discussed above, NMHC EFs during Ph 1 (cW) are far higher than Ph 2-4 (cW), with the resulting effect that the emissions composition for the full WLTC closely resemble those of Ph 1 (i.e., dominated by ArHC) also from a chemical composition perspective. Note that the NMOC concentrations for Ph 2-4 (cW) are close to our background measurements (signal not significantly different from 3 standard deviations of the background measurement). We showed above that GPF installation does not reduce NMHC EFs; in addition, it has no obvious influence on the gaseous NMOC composition (Fig. 30b-d).

47
In detail, the mass spectrum and relative composition for full WLTC and Ph 1 (cW) experiments is dominated by a small number of ArHC ions, specifically: benzene ([C6H6+H]+, m/z 79, BENZ), toluene ([C7H8+H]+, m/z 93, TOL), o-/m-/p-xylene or ethylbenzene ([C8H10+H]+, m/z 107, XYL/EBENZ) as well as C3-benzenes ([C9H12+H+, m/z 121, C3BENZ). Reaction rates of the above compounds are shown in Table 3. The most important additional aromatic HC peaks in the spectra correspond to C4-benzenes ([C10H14+H]+, m/z 135, C4BENZ), naphthalene ([C10H8+H]+, m/z 129, NAPH), styrene ([C8H8+H]+, m/z 105, STY) and methyl-styrene ([C9H10+H]+, m/z 119, C1STY). These 8 ArHC ions comprise 96.7±3.3% of the total ArHC signal in µg m-3 and correspond to 69.5±19.7% of the total NMOC signal for full cW, cE and Ph 1 (cW) experiments (Fig. 30; Ph 2-4 (cW): 65.2±9.8% and 13.9±12.1%). Oxygenated ArHC (such as phenolic compounds and benzaldehyde) make up an additional 1.2±2.0% contribution to the total ArHC fraction for cold-started conditions (cW, cE, Ph 1 (cW)). Their relative contribution increases when engine conditions are hot (Ph 2-4 (cW): 5.9±1.2%). Also GDI4 shows enhanced contributions of oxygenated ArHC to the total NMOC compared to GDI1-3, which is in line with relatively enhanced hot engine emissions.
Table 3: NMOC information (list of dominant peaks).
Ion, m/z Chem. Formula Assignment Denotation 79 [C6H6+H]+ benzene BENZ 93 [C7H8+H]+ toluene TOL
107 [C8H10+H]+ o-/m-/p-xylene, ethylbenzene XYL/E-BENZ 121 [C8H12+H]+ C3-alkyl-benzenes C3BENZ 135 [C10H14+H]+ C4-alkyl-benzenes C4BENZ
129 [C10H8+H]+ naphthalene NAPH 105 [C8H8+H]+ styrene STY 119 [C9H10+H]+ methyl-styrene C1STY
41 [C3H5]+ HC fragment - 43 [C3H7]+ HC fragment - 57 [C4H9]+ HC fragment -
Ions are referred to with their integer mass-to-charge (m/z) ratio for simplicity, but are identified based on the HR derived exact m/z instead.
While the primary ionization pathway in the PTR-ToF-MS is proton transfer reaction by H3O+ ions, the ion source produces up to 5% of unwanted O2
+. O2+ can lead to charge transfer or hydride abstraction
reactions (Amador Muñoz et al., 2016; Jordan et al., 2009; Knighton et al., 2009). Signals at [C6H6]+ (m/z 78), [C7H8]+ (m/z 92) and [C8H10]+ (m/z 106) likely derive from O2
+ charged ions of ArHC, and are hence excluded from the analysis of the total mass (but support peak identification by correlation with their corresponding protonated ion at ~5% of the protonated signal). Other ions deriving from O2
+ ionization are insignificant contributors to the total mass. The carbon content of the quantified ArHC corresponds to 48.8±7.6% of the FID NMHC signal (assuming equal response factors on the FID) for full cW, cE and Ph 1 (cW) (Note, that the ratio of total NMOC mass (µgC) determined by the PTR-ToF-MS to NMHC measured by the FID (after subtraction of CH4 as measured by the Picarro CRDS) is 0.65±0.15 as average of cW, cE, Ph 1 (cW) (NMHC/NMOC comparison for data for Ph2-4 are not presented due to interferences on FID in measurements of oxygen-containing hydrocarbons). Fig. 30c summarizes the ArHC emission factors, and Fig. 30d gives the relative composition of the most dominant ArHC.

48
Figure 30: PTR-ToF-MS derived NMOC composition (cold-started cycles). Data are collected by batch sampling (“SC”) or during online measurements (“online”) (modified from Pieber et al., 2017). (a) PTR-ToF-MS mass spectrum of emissions from GDI1 in standard configuration sampled into the SC during a cold-started WLTC (cW). (b) Relative composition of the PTR-ToF-MS derived NMOC fraction, (c) total ArHC EFs, and (d) relative contribution of the 8 dominant ArHC. (b-c) Data correspond to vehicle exhaust for GDI1 (expt. A-D), GDI2 (expt. E), GDI3 (expt. F) and GDI4 (expt. G) sampled into the SC during full cW and cE driving tests, or individual phases of cW, or measured “online”. The identifier in parenthesis specifies individual SC experiments (further information provided in (Pieber et al., 2017)). Note that the total NMOC levels for Ph 2-4 (cW) are about 1/10 of full cW and Ph 1 (cW) concentrations only and measurements are close to the background measurements (signal not significantly different from 3 standard deviations of the background measurement).
Of the non-aromatic peaks in Fig. 30a, the largest signals occur at m/z 57 ([C4H9]+), followed by 41 ([C3H5]+) and 43 ([C3H7]+), which taken together make up 7.9±4.8% of the signal for the full cycle (cW, cE) as well as for Ph 1 (cW). A larger fraction (13.2±11.9%) is observed when investigating Ph 2-4 (cW) (i.e. hot engine conditions). These ions are often fragments of larger molecules and hence not straight-forward to assign. Thus, they are included in the category of structurally unassigned

49
hydrocarbons in Fig. 7. Often, [C3H5]+ and [C3H7]+ are considered fragments of oxygenated parent molecules. In our experiments, however, these ions may dominantly derive from propene (C3H6), for which protonation leads to [C3H6+H]+, and a subsequent loss of H2 leads to [C3H5]+. The observed ratio of [C3H5]+ and [C3H7]+ is consistent with the ratio seen for pure propene (C3H6) injected into the instrument as reference. In analogy to O2
+ ionization of ArHC, we find [C3H6]+ in the spectra as insignificant signal (5% of [C3H6+H]+). It is likely related to an O2
+ charge transfer to propene (Amador Muñoz et al., 2016; Jordan et al.; Knighton et al., 2009), and supports the peak identification. The fuel contains 5%vol (2014) to 8%vol (2015) of methyl-tert-butyl-ether (MTBE), as an anti-knocking agent. Fragmentation by proton transfer reactions of MTBE can lead to a significant signal at m/z 57 ([C4H9]+). Protonated butene would also yield [C4H9]+, but analogous to the ArHC and propene, should also give a correlated signal at [C4H8]+ at approximately 5% of [C4H9]+, which is not observed. The carbon content of unspecific fragments ([C3H5]+ (m/z 41), [C3H7]+ (m/z 43), [C4H9]+ (m/z 57)) accounts for additional 4.4±3.0% of the FID NMHC signal (full cW, cE, and Ph 1 (cW)). Based on the literature reports of e.g. Platt et al., 2013 and Schauer et al., 2002 we expect a significant contribution of ethene (C2H4) to the exhaust hydrocarbons, which however, cannot be quantified by proton transfer reaction (Gueneron et al., 2015), and together with short-chain alkanes contributes in parts to the difference between the NMOC and NMHC signal. Other possibilities for parents of those potential fragments (41, 43, 57, and further CnH2n+1
+) are alkyl-substituted mono-aromatics, alkenes with >C4, or alkanes (>C10, potentially >C6 if cyclic) (Gueneron et al., 2015; Erickson et al., 2014; Buhr et al., 2002). While small intensities at the masses corresponding to CnH2n+1
+ (e.g. 71, 85, 99) are detected, we do not observe significant signals corresponding to aliphatic fragmentation patterns above m/z 57. Signals indicating larger cycloalkanes or alkenes (e.g. most abundant fragments at m/z 69 for substituted cyclohexane) (Gueneron et al., 2015; Erickson et al., 2014) are also not abundant in our spectra, although their presence has been reported by gas-chromatographic MS techniques in other experiments (e.g. Saliba et al., 2017; Zhao et al., 2016). We cannot exclude the presence of those compounds, however, due to the limitations of our measurement principle. Further missing carbon mass in the NMOC and NMHC measurements (may result from alkyl-substituted mono-aromatics which can also lead to fragments at m/z 41, 43, 57, and further CnH2n+1
+ as already mentioned above. The fragmentation process would result into a significant mass loss, as the aromatic ring would remain predominantly neutral (especially for mono-aromatics with long alkyl-substituents (Gueneron et al., 2015)). For example, only 22% of the ion signal generated from n-pentylbenzene fragmentation retains the aromatic ring (19% M+H+, 3% protonated benzene ring), and 88% is found at non-aromatic ions m/z 41 or 43). A small contribution from oxygenated species (such as small acids and carbonyls) is found, while larger oxygenated molecules are not detected in significant amounts except for traces of benzaldehyde ([C7H6O+H]+) and methyl-benzaldehyde ([C8H8O+H]+). Nitrogen is found only in very few species, of which the dominant one is assigned to acetonitrile (CH3CN). Due to challenges in its quantification without proper calibration of the PTR-ToF-MS, and its unknown source (including potential outgazing from Teflon sampling lines), it was excluded from our analysis. The carbon content of oxygenated compounds found in the NMOC fraction, which have a lower response in the FID, would make up only 3.6±3.9% of the FID signal assuming a response equal to pure HCs for cW, cE and Ph 1 (cW). Hence, even if oxygenated species have a limited response in FID measurements, they do not bias the total FID NMHC measurements substantially (assuming that the PTR-ToF-MS is able to detect and quantify all oxygenated species present). Summarizing, our above interpretation of the NMHC and NMOC closure holds for full cW and cE, and Ph 1 (cW) experiments, summing all these species and accounting for the uncertainties introduced by response factors and kH3O+ rates of fragments, as well as species that the PTR-ToF-MS is unable to detect.

50
8.2.4. Effects of gasoline particle filters (GPF) on SOA
Gravimetric PM and eBC were greatly reduced by the retrofitted GPFs (GPF tested on GDI1 and GDI4; with GPF performance apparently compromised on GDI4, potentially due to aging of the filter; catGPF tested on GDI4 also performed poorly on VOCs). While the retrofitted GPFs efficiently remove the non-volatile eBC and thus significantly reduce total primary PM, the effect on POA is more complex. POA has a wide range of volatilities and may thus encounter a particle filter in either vapor or particle phase. Thus GPFs can only efficiently remove the low volatility POA fraction, while more volatile POA passes through the filter as vapor and will condense when the exhaust is cooled in the ambient air. Within experimental uncertainty, retrofitted GPFs (including catGPF behind the standard TWC) did not affect the POA fraction. Further, GPFs did not affect FID-based NMHC and PTR-ToF-MS-based NMOC EFs, or NMOC composition as discussed in Fig. 30). The retrofitted GPFs did neither reduce the produced SOA mass. SOA reduction requires additional after-treatment to remove NMHCs/NMOCs, such as engine or catalyst pre-heating, indicated by significantly lowered SOA formation during Ph 2-4 (when engine and after-treatment systems are already hot), compared to Ph 1 emissions (when engine/after-treatment systems are cold).
8.3. Conclusions on SOA formation
We studied the SOA formation potential of GDI vehicles as a function of driving cycles, individual phases thereof and engine temperature (cold-started, hot-started), and evaluated the effect of retrofitted, prototype GPFs on the primary and secondary particle emissions. We present a detailed analysis of primary NMOC composition from PTR-ToF-MS measurements. The associated SOA formation potential was evaluated by SC and OFR experiments, and provided a quantitative link between the NMOC fraction and the observed SOA. For all GDI gasoline vehicles including GDI and conventional port-fuel injection vehicles, the dominant fraction of hydrocarbon emissions is released during the starting phase, before after-treatment systems are hot. These emissions of cold-started vehicles are dominated by aromatic hydrocarbons, especially toluene, xylenes/ethylbenzenes, C3-alkyl-benzenes and benzene which are also found in the fuel. Thus SOA formation is governed by the cold-start. These results are independent of testing protocol, demonstrating that the performance of after-treatment systems and to a lesser extent the driving behavior governs cold-start emissions.
GPF application efficiently removes elemental black carbon particles, which is the dominant component of primary PM, but has small effects on the minor POA fraction. The volatile POA fraction passes through the filter in the vapor phase and later condenses when the exhaust is emitted and cooled; hence POA emission factors are not significantly reduced by GPFs and SOA formation was not affected by the tested GPFs, neither by non-coated nor by catalyst coated GPFs. This means that retrofitting GDI vehicles with GPFs will result in an important reduction of the total primary PM emitted (removal of refractory material), but will not, or only to a small extent, reduce hydrocarbon emissions including benzene and alkylbenzenes and will not directly lead to a reduction of the SOA formation. Future work on so-called 4-way catalysts, i.e. a TWC catalyst directly applied onto a GPF and installed at the location of the current TWC for simultaneous filtration of particulates and catalytic conversion of hydrocarbons should be conducted to understand, whether reductions of SOA precursors, SOA production, and semi-volatile primary PM can also be achieved.

51
9. Accelerated SOA formation in the UASNWS flow reactor
An even faster flow reactor allowing the determination of the SOA formation potential of a vehicle exhaust per second during transient vehicle operation was developed by the UASNWS. Figure 31 displays the implementation of the micro-smog chamber (MSC) at the chassis dynamometer.
Figure 31: Schematic representation of the experimental setup using the MSC.
GDI exhaust samples are extracted during the WLTC (Figure 3) or during steady state conditions (constant speed or idle). Exhausts are filtered to remove primary particle and only the gas-phase fraction (dilution ~1:10 at 150°C) is oxidized inside the micro smog chamber. This produces nucleation particles composed purely of secondary aerosol. On a second dilution stage, the concentration is reduced to levels compatible with aerosol measurement devices.
9.1. Impact of ethanol on secondary organic aerosol formation
We studied the impact of ethanol on emissions of particles and non-regulated pollutants. The technology for measuring sub-23nm particles has been established with the nano-SMPS. The UASNWS supplied the nano-SMPS for the first round of measurements, the latter measurements in 2014 and 2015 were performed using a nano-SMPS acquired by the UASB.
Figure 32: Particle number concentration (#/cm3) in exhausts of an Euro-5 vehicle (Volvo V60, 1.6 L) operated with gasoline (E0) and gasoline/ethanol blends (E10 and E85) during different phases of the SSC.
EjectorDiluter
2 mµCeramic
Filter
QFFilter
MicroSmog
Chamber
Heated SectionRotating
DiscDiluter
to miniDiSC,CPC/SMPS
& CO2 Sensor
1.0E+02
1.0E+03
1.0E+04
1.0E+05
1.0E+06
1.0E+07
95 km/h 61 km/h 45 km/h 26 km/h idling
conc
. [#/
cm3 ]
Volvo with gasoline, E85 & E10 SMPS Volvo gasolineSMPS Volvo E85SMPS Volvo E10
integration SMPS : 10 - 414 nm
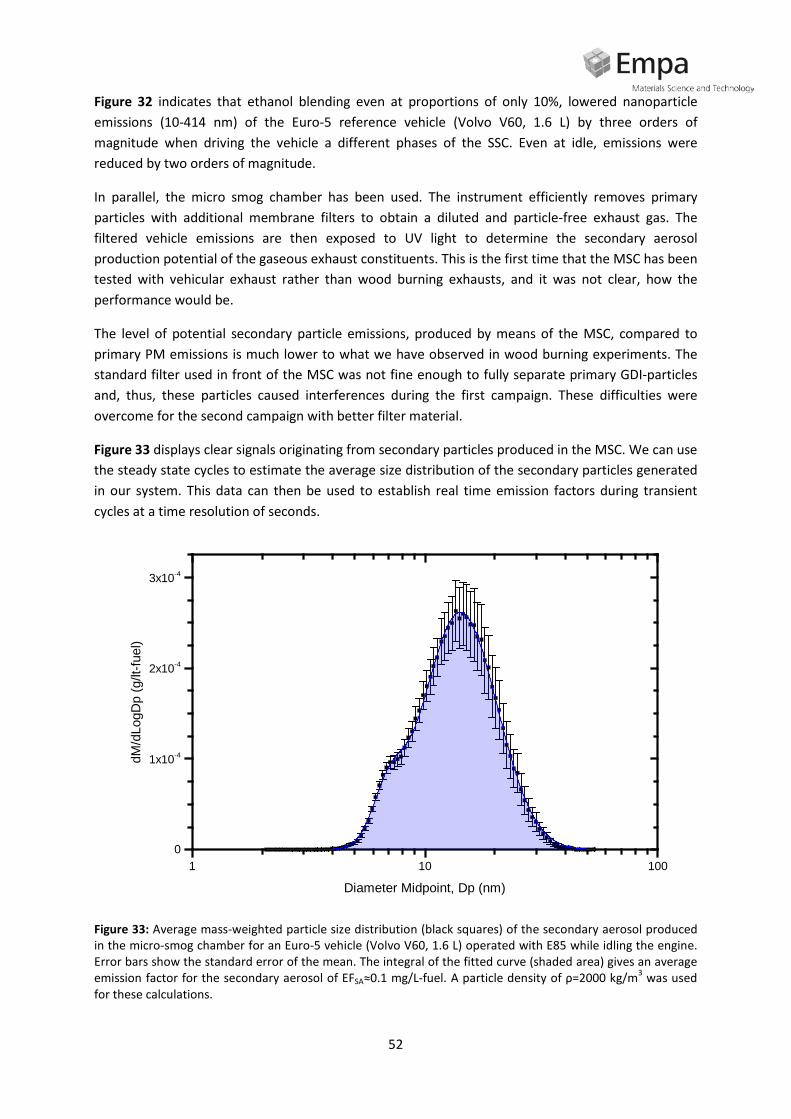
52
Figure 32 indicates that ethanol blending even at proportions of only 10%, lowered nanoparticle emissions (10-414 nm) of the Euro-5 reference vehicle (Volvo V60, 1.6 L) by three orders of magnitude when driving the vehicle a different phases of the SSC. Even at idle, emissions were reduced by two orders of magnitude.
In parallel, the micro smog chamber has been used. The instrument efficiently removes primary particles with additional membrane filters to obtain a diluted and particle-free exhaust gas. The filtered vehicle emissions are then exposed to UV light to determine the secondary aerosol production potential of the gaseous exhaust constituents. This is the first time that the MSC has been tested with vehicular exhaust rather than wood burning exhausts, and it was not clear, how the performance would be.
The level of potential secondary particle emissions, produced by means of the MSC, compared to primary PM emissions is much lower to what we have observed in wood burning experiments. The standard filter used in front of the MSC was not fine enough to fully separate primary GDI-particles and, thus, these particles caused interferences during the first campaign. These difficulties were overcome for the second campaign with better filter material.
Figure 33 displays clear signals originating from secondary particles produced in the MSC. We can use the steady state cycles to estimate the average size distribution of the secondary particles generated in our system. This data can then be used to establish real time emission factors during transient cycles at a time resolution of seconds.
Figure 33: Average mass-weighted particle size distribution (black squares) of the secondary aerosol produced in the micro-smog chamber for an Euro-5 vehicle (Volvo V60, 1.6 L) operated with E85 while idling the engine. Error bars show the standard error of the mean. The integral of the fitted curve (shaded area) gives an average emission factor for the secondary aerosol of EFSA≈0.1 mg/L-fuel. A particle density of ρ=2000 kg/m3 was used for these calculations.
1 10 1000
1x10⁻⁴
2x10⁻⁴
3x10⁻⁴
dM/d
LogD
p (g
/lt-fu
el)
Diameter Midpoint, Dp (nm)

53
9.2. Fast and time-resolved secondary organic aerosol formation
The MSC is the fastest system for secondary particle emission measurements used in this campaign and thus achieves the best time resolution. The continuous-flow reactor-tube was applied to study the formation of secondary aerosols by taking the gas-phase fraction of exhausts and oxidize it with ozone (up to 60 ppm) at residence times of about 10 seconds.
Figure 34: Secondary aerosol of a GDI vehicle produced in the micro-smog chamber during cold- and hot-started WLTC driving of the Euro-3 vehicle (Mitsubishi Carisma, 1.8 L). The mass concentration was derived from the observed number concentration, average mass distributions from the SSC and a particle density ρ = 2000 kg/m3.
Figure 34 displays an example of secondary aerosol emissions (g/L-fuel) during the cold and hot WLTC. Secondary aerosol emissions varied by two orders of magnitude and were highest during transient driving under hot conditions.
In conclusion, the secondary aerosol released per litre of fuel consumed is several orders of magnitude lower than what we have observed in wood burning experiments. However, time-resolved secondary aerosol data of GDI vehicles could be obtained using the micro smog chamber.
Figure 35 shows another example of secondary aerosol emissions of the Euro-5 reference vehicle (Volvo V60, 1.6 L). This vehicle is very different than the Mitsubishi Carisma 1.8 GDI (Figure 34) because it has very pronounced emissions of secondary aerosol at the beginning of the cold cycle. This is similar to the findings from the PAM-Chamber, the flow-reactor used by the PSI (Figure 29). However, a main difference between the two reactors was the fact that, when using the PAM chamber, this pronounced emission of secondary aerosol seems to be constant throughout several vehicles. In the case of the micro-smog chamber, this only seems to be the case for the Volvo V60 running on pure gasoline (Figure 35).
08:40 08:50 09:00 10:00 10:10 10:2010-5
10-4
10-3
10-2
UV off (background)
WLTC WarmWLTC Cold
Sec
onda
ry A
eros
ol (g
/lt-fu
el)
Time

54
Figure 35: Vehicle velocity and time resolved secondary aerosol produced in the micro-smog chamber during cold- (left) and warm-started (right) WLTC for an Euro-5 GDI vehicle (Volvo V60, 1.6 L). The mass concentration was derived from the number concentration by using average mass distributions from the steady state condition measurements.
9.3. Integrated cycle based SOA formation potential
Integration of time-resolved SOA data from CVS exhausts allows deducing mean SOA emission factors (mg/km) of different GDI vehicles in different cycle phases as shown in Figure 36.
Figure 36: Average emission factors for secondary organic aerosol during cold and warm-started WLTC for different vehicles of the GASOMEP fleet. Data is given for the four phases of the cycle, simulating different driving conditions, as well as for the whole cycle (right).
In general, comparing the results from the micro-smog chamber to the PAM reactor and the smog-chamber, it can be said that the micro-smog chamber produced lower amounts of secondary aerosols. Further analysis by the PSI group shows that few aromatic compounds are found to dominate the hydrocarbon emissions (primarily benzene, toluene, C2- and C3-benzenes), and a large fraction of the SOA production is explained by these compounds. The PAM reactor humidifies the sample close to 90% RH before exposing it to UV light. This busts the OH reactions that lead to formation of SOA.
09:10 09:20 09:30 09:40 10:00 10:10 10:20
10-5
10-4
10-3
10-2
10-1
WLTC WarmWLTC ColdS
econ
dary
Aer
osol
(g/lt
-fuel
)
Time
0
30
60
90
120V
eloc
ity (k
m/h
)
0.0
0.2
0.4
0.6
0.8WLTC Cold
Volvo V60 (Euro 5a), 85% ethanol mixture Volvo V60 (Euro 5a), 10% ethanol mixture Mitsubishi Carisma (Euro 3) VW Golf (Euro 4) Volvo V60 (Euro 5a)
Phase 1, Urban Phase 2, Extra-Urban Phase 3, Highway Phase 4, Freeway0.0
0.2
0.4
0.6
0.8WLTC Warm
Sec
onda
ry A
eros
ol (m
g/km
)
0.0
0.2
0.4
0.6
0.8
Cycle Average0.0
0.2
0.4
0.6
0.8
<V>=95 kmph<V>=61 kmph<V>=45 kmph
Average Velocity, <V>=26 kmph

55
Humidification in the PAM chamber is always required, because the sample is always diluted before aging starts. In contrast, the micro-smog chamber relies on the humidity already present in the sample, which in previous applications, like e.g. biomass combustion emission, is high enough for this processes to take place. But in the case of the GDI vehicles, the relative humidity was already low in the raw gas.
This explains the differences in SOA yield between the PAM reactor and the micro-smog chamber. Aging in the micro-smog chamber was dominated by ozonolysis, whereas aging on the PAM reactor and the smog-chamber includes both ozonolysis and OH reactions. These results gave us valuable insights on how to proceed for further applications. For instance, the micro-smog chamber is the smallest and fastest of the three reactors and could be easily adapted as a conditioning system for portable emission measurement devices.
It was one goal of the project to operate three independent devices to study the SOA potential of various exhausts in parallel. For this purpose, aliquots of the exhausts were delivered to a 12 m3 smog chamber (Fig. 25) and aged therein for 4-5 h under conditions similar to the atmosphere. Furthermore, the extent of SOA formation was also studied with two flow reactors, the PAM reactor and the just mentioned MSC.
Together with the other equipment to sample complete exhausts including the solid, liquid and gas-phase material for the detailed chemical analysis of semi-volatile compounds like PAHs or equipment for particle characterization (CPC, SMPS, nano SMPS, ELPI) and to determine emissions of regulated and non-regulated pollutants, this has resulted in a quite impressive clustering of instruments at the chassis dynamometer of the UASB in Nidau as Figure 27 gives an impression thereof.
Without the good collaboration of the crews from different institutions, this project would not have been possible. Most of the credit for the efficient teamwork goes to the UASB project partners in Nidau for hosting us in the different sampling campaigns.
Figure 37: The flex-fuel GDI vehicle V1 (Volvo V60, 1.6 L, Euro-5) on the chassis dynamometer at the UASB in Nidau and the instrumentation used to study regulated and non-regulated pollutants and particles.

56
References Amador Muñoz, O., Misztal, P. K., Weber, R., Worton, D. R., Zhang, H., Drozd, G., and Goldstein, A. H.: Sensitive detection of n-alkanes using a mixed ionization mode Proton-Transfer-Reaction-Mass Spectrometer, Atmospheric Measurement Techniques Discussions, 1-21, 2016. Bruns, E. A., El Haddad, I., Keller, A., Klein, F., Kumar, N. K., Pieber, S. M., Corbin, J. C., Slowik, J. G., Brune, W. H., Baltensperger, U., and Prévôt, A. S. H.: Inter-comparison of laboratory smog chamber and flow reactor systems on organic aerosol yield and composition, Atmos. Meas. Tech., 8, 2315-2332, 2015. Buhr, K., van Ruth, S., and Delahunty, C.: Analysis of volatile flavour compounds by Proton Transfer Reaction-Mass Spectrometry: fragmentation patterns and discrimination between isobaric and isomeric compounds, Int. J. Mass Spectrom., 221, 1-7, 2002. Canagaratna, M. R., Jayne, J. T., Jimenez, J. L., Allan, J. D., Alfarra, M. R., Zhang, Q., Onasch, T. B., Drewnick, F., Coe, H., and Middlebrook, A.: Chemical and microphysical characterization of ambient aerosols with the Aerodyne aerosol mass spectrometer, Mass Spectrom Rev, 26, 185-222, 2007. DeCarlo, P. F., Kimmel, J. R., Trimborn, A., Northway, M. J., Jayne, J. T., Aiken, A. C., Gonin, M., Fuhrer, K., Horvath, T., Docherty, K. S., Worsnop, D. R., and Jimenez, J. L.: Field-deployable, high-resolution, time-of-flight aerosol mass spectrometer, Anal. Chem., 78, 8281-8289, 2006. Erickson, M. H., Gueneron, M., and Jobson, B. T.: Measuring long chain alkanes in diesel engine exhaust by thermal desorption PTR-MS, Atmos. Meas. Tech., 7, 225-239, 2014. Graus, M., Muller, M., and Hansel, A.: High resolution PTR-TOF: Quantification and formula confirmation of VOC in real time, Journal of the American Society for Mass Spectrometry, 21, 1037–-1044, 2010. Gueneron, M., Erickson, M. H., Vanderschelden, G. S., and Jobson, B. T.: PTR-MS fragmentation patterns of gasoline hydrocarbons, Int. J. Mass Spectrom., 379, 97-109, 2015. Jathar, S. H., Gordona, T. D., Hennigan, C. J., Pye, H. O. T., Pouliot, G., Adams, P. J., Donahue, N. M., and Robinson, A. L.: Unspeciated organic emissions from combustion sources and their influence on the secondary organic aerosol budget in the United States, Proc. Natl. Acad. Sci. U. S. A., 111, 10473-10478, 2014. Jordan, A., Jaksch, S., Jürschik, S., Edtbauer, A., Agarwal, B., Hanel, G., Hartungen, E., Seehauser, H., Märk, L., Sulzer, P., and Märk, T. D.: H3O+, NO+ and O2
+ as precursor ions in PTR-MS: isomeric VOC compounds and reactions with different chemical groups. Jordan, A., Haidacher, S., Hanel, G., Hartungen, E., Märk, L., Seehauser, H., Schottkowsky, R., Sulzer, P., and Märk, T. D.: A high resolution and high sensitivity proton-transfer-reaction time-of-flight mass spectrometer (PTR-TOF-MS), Int. J. Mass Spectrom., 286, 122-128, 2009 Knighton, W. B., Fortner, E. C., Midey, A. J., Viggiano, A. A., Herndon, S. C., Wood, E. C., and Kolb, C. E.: HCN detection with a proton transfer reaction mass spectrometer, Int. J. Mass Spectrom., 283, 112-121, 2009 Munoz M., Heeb N. V., Haag R., Honegger P., Zeyer K., Mohn J., Comte P., Czerwinski J., Bioethanol blending reduces nanoparticle, PAH, and alkyl- and nitro-PAH emissions and the genotoxic potential

57
of exhaust from a gasoline-direct injection flex-fuel vehicle, Environ. Sci. Tech., 60, 11853-11861, 2016.
Munoz M., Haag R., Honegger P., Zeyer K., Mohn J., Comte P., Czerwinski J., Heeb N. V. Co-formation and co-release of genotoxic PAHs, alkyl-PAHs, and soot nanoparticles from gasoline-direct injection vehicles submitted, 2017.
Pieber, S. M., El Haddad, I., Slowik, J. G., Canagaratna, M. R., Jayne, J. T., Platt, S. M., Bozzetti, C., Daellenbach, K. R., Frohlich, R., Vlachou, A., Klein, F., Dommen, J., Miljevic, B., Jimenez, J. L., Worsnop, D. R., Baltensperger, U., and Prévôt, A. S. H.: Inorganic Salt Interference on CO2
+ in Aerodyne AMS and ACSM Organic Aerosol Composition Studies, Environ. Sci. Technol., 50, 10494-10503, 2016. Pieber, S. M., Kumar, N. K., Klein, F., Comte, P., Bhattu, D., Dommen, J., Bruns, E. A., Kilic, D., El Haddad, I., Keller, A., Czerwinski, J., Heeb, N., Baltensperger, U., Slowik, J. G., and Prévôt, A. S. H.: Gas phase composition and secondary organic aerosol formation from gasoline direct injection vehicles investigated in batch and flow reactors: effects of prototype gasoline particle filters, Atmospheric Chemistry and Physics Discussions, 1-41, 2017. Platt, S. M., El Haddad, I., Zardini, A. A., Clairotte, M., Astorga, C., Wolf, R., Slowik, J. G., Temime-Roussel, B., Marchand, N., Ježek, I., Drinovec, L., Močnik, G., Möhler, O., Richter, R., Barmet, P., Bianchi, F., Baltensperger, U., and Prévôt, A. S. H.: Secondary organic aerosol formation from gasoline vehicle emissions in a new mobile environmental reaction chamber, Atmos. Chem. Phys., 13, 9141-9158, 2013. Platt, S. M., El Haddad, I., Pieber, S. M., Zardini, A. A., Suarez-Bertoa, R., Clairotte, M., Daellenbach, K. R., Huang, R. J., Slowik, J. G., Hellebust, S., Temime-Roussel, B., Marchand, N., de Gouw, J., Jimenez, J. L., Hayes, P. L., Robinson, A. L., Baltensperger, U., Astorga, C., and Prévôt, A. S. H.: Gasoline cars produce more carbonaceous particulate matter than modern filter-equipped diesel cars, Sci. Rep., 7, 4926, 2017. Saliba, G., Saleh, R., Zhao, Y., Presto, A. A., Lambe, A. T., Frodin, B., Sardar, S., Maldonado, H., Maddox, C., May, A. A., Drozd, G. T., Goldstein, A. H., Russell, L. M., Hagen, F. P., and Robinson, A. L.: A comparison of gasoline direct injection (GDI) and port fuel injection (PFI) vehicle emissions: emission certification standards, cold start, secondary organic aerosol formation potential, and potential climate impacts, Environ. Sci. Technol., 2017. Schauer, J. J., Kleeman, M. J., Cass, G. R., and Simoneit, B. R. T.: Measurement of emissions from air pollution sources. 5. C1-C32 organic compounds from gasoline-powered motor vehicles, Environ. Sci. Technol., 36, 1169-1180, 2002. Taira, M., and Kanda, Y.: Continuous generation system for low-concentration gaseous nitrous acid, Anal. Chem., 62, 630-633, 1990. Zhao, Y., Nguyen, N. T., Presto, A. A., Hennigan, C. J., May, A. A., and Robinson, A. L.: Intermediate Volatility Organic Compound Emissions from On-Road Gasoline Vehicles and Small Off-Road Gasoline Engines, Environ. Sci. Technol., 50, 4554-4563, 2016.

58
Project activities, presentations and patents
In the four project years did we organize and perform five large sampling campaigns, either in spring or in fall of 2014 to 2016. Nine internal project meetings were organized in Nidau, Windisch and Dübendorf. Preliminary results have been presented to the project partners in these meetings. We informed to the general public in two meetings, both held at Empa in Dübendorf, which were connected to the 6th and 7th VERT Forum in 2015 and 2016. All project partners were invited to present their findings at the final GASOMEP project meeting in the Empa academy in Dübendorf which was held on March 16, 2017, connected to the 8th VERT Forum.
Several oral and poster presentations from findings of the GASOMEP project (see below) were presented by various project partners at the 5th, 6th, 7th and 8th VERT Forum in 2014, 2015, 2016 and 2017 to members of the international filter industry and parties interested in filter technology.
An even broader audience from industry, government and academia was reached with several contributions at the 18th, 19th, 20th and 21st ETH Conferences on Combustion Generated Particles held in Zürich in 2014, 2015, 2016 and 2017, respectively.
Some of the findings of the GASOMEP project, especially the SOA formation were also presented at the Aerosol Conference in Busan, Korea and the TAP conferences in Graz in 2014 and in Dübendorf in 2017.
These events were important occasions to interact with key person in the field, the scientific community, the industry and governmental authorities.
On behalf of the final project meeting in March 2017, a more general summary of the findings was distributed in form of a press release and some of the general conclusions were published and discussed in the printed national media (Empa Quaterly, NZZ am Sonntag, Beobachter, Blick, several regional newspapers), in the Swiss TV and in interviews which were broadcasted in Swiss and German radio stations.
It is beyond the scope of this report to list all interactions with the national and international press. A quick search with the term “GASOMEP” resulted in about 400 hits (November 1st, 2017).
At the occasion of the final meeting in 2017 an executive summary including the yearly CCEM reports from 2014, 2015 and 2016 was also distributed and given here as Appendices 1-3.
Based on their valuable contributions to the project the PSI doctoral students Simone Pieber and Nivedita Kumar both earned their PhD in February 2017.
In addition, the bachelor students Benjamin Fröhlich, Stefan Germann, Adrian Braun, Thomas Egli, Joel Delgado and Elia Limarzo from the UASB contributed with their work to the project and earned their bachelor’s degree in automotive engineering.

59
Publications, oral contributions and poster presentations
2014:
Czerwinski J., Comte P., Keller A., Mayer A.,< Investigations of nanoparticle emissions of two gasoline cars MPI & DI at stationary part load operation>. PTNSS Journal Combustion Engines, 3 (158), ISSN 2300-9896, 2014.
Czerwinski J., Comte P., Mayer, A., <Nanoparticle research on four gasoline cars>. Journal of KONES Powertrain and Transport, 21, (1) 49, ISSN 1231-4005, 2014.
Czerwinski J., <Research on petrol engine particle emissions>, 5. VERT Forum, Dübendorf, Switzerland, March 21, 2014.
Czerwinski J., <Nanoparticle research on four gasoline cars>, 18. ETH Conference on Combustion Generated Nanoparticles, Zürich, Switzerland, June 22-25, 2014.
Heeb N., <Catalysis – a key property of filters to lower emissions of genotoxic compounds>, 5. VERT Forum, Dübendorf, Switzerland, March 21, 2014.
Heeb N., <Catalysis – a key property of filters to lower emissions of genotoxic compounds>, 18. ETH Conference on Combustion Generated Nanoparticles, Zürich, Switzerland, June 22-25, 2014.
Pieber S. M. et al.,<Secondary organic aerosol measurements from road vehicle emissions with aerosol mass spectrometry with high loads of ammonium nitrate>, Aerodyne Aerosol Mass Spectrometer User’s Group, South Korea, Busan, August 26-27, 2014.
Pieber S. M.et al., <Secondary organic aerosol formation from road vehicle emissions>, Transport and Air Pollution Conference, Austria, Graz, September 17-19, 2014.
2015:
Czerwinski J. < Size-selective analysis of nanoparticles from diesel engine with fuel tracing>, Seminar TECHNION Israel Institute of Technology, Haifa, Israel, October 28, 2015.
Czerwinski J., Comte P., Stepien Z., Oleksiak S., Mayer A., Heeb N. < Non-legislative emissions of SI passenger car with ethanol fuel blends>, BIOTRETH Conference – Alcohol fuels for transport, background, research and development, Cracow, Poland, November 25-26, 2015.
Heeb N., Munoz M., Comte P., Czerwinski J., Haag R., Seiler C., Schmid P., Honegger P., Zeyer K., Mohn J. < Chemical assessment of genotoxic emissions from GDI vehicles>, Empa NAREP Seminar , Dübendorf, Switzerland, September 7, 2015.
Keller A., Burtscher, H., Comte P., Czerwinski J., Kumar, N., Pieber S., Prevot A., Heeb, N. < Estimation of the SOA-Formation Potential in Emissions from GDI Engines>, 19. ETH Conference on Combustion Generated Nanoparticles, Zurich, Switzerland, June 28 - July 1, 2015.
Munoz M., Heeb N., Comte P., Czerwinski J., Haag R., Seiler C., Schmid P., Honegger P., Zeyer K., Mohn J. < PAH and nitro-PAH emissions of GDI vehicles>, 6. VERT Forum, Dübendorf, Switzerland, March 20, 2015.
Munoz M., Heeb N., Comte P., Czerwinski J., Haag R., Seiler C., Schmid P., Honegger P., Zeyer K., Mohn J. < PAH and nitro-PAH emissions from GDI vehicles>, 19. ETH Conference on Combustion Generated Nanoparticles, Zurich, Switzerland, June 28 - July 1, 2015.
Munoz M., Heeb N., Comte P., Czerwinski J., Haag R., Seiler C., Schmid P., Honegger P., Zeyer K., Mohn J. < Influence of ethanol on genotoxic emissions of GDI>, Biotreth Conference – Alcohol fuels for transport, background, research and development , Cracow, Poland, November 25-26, 2015.

60
2016:
Czerwinski J., Comte P., Stepien Z., Oleksiak S. < Effects of ethanol blend fuels E10 & E85 on non-legislated emissions of a flex-fuel passenger car>,SAE 2016-01-0977, Detroit, U.S.A. 2016.
Czerwinski J., Comte P., Mayer A., Lemaire, J. <Experiences from nanoparticle research on four gasoline cars>, 7. VERT Forum, Dübendorf, Switzerland, March 18, 2016.
Czerwinski J., Heeb N., Comte P., Mayer A. < Particle number reduction of GDI cars with GPFs>, 20. ETH Conference on Combustion Generated Nanoparticles, Zurich, Switzerland, June 13 - 16, 2016.
Czerwinski J., Heeb N., Comte P., Mayer A. < Particle number reduction of GDI cars with GPFs>, 4. Int. Nanoparticle Workshop Technion, Haifa, Israel, June 21, 2016.
Czerwinski J. < Particle number reduction of GDI cars with GPFs>, 4. Int. Nanoparticle Workshop Technion, Haifa, Israel, June 21, 2016.
Heeb N. < Can diesel solve its emission problem in time>, 7. VERT Forum, Dübendorf, Switzerland, March 18, 2016.
Heeb N. < GASOMEP-Current status and new concepts of gasoline vehicle emission control>, 2. General GASOMEP Meeting, Dübendorf, Switzerland, March 17, 2016.
Heeb N. <Efficient filter and deNOx-technologies for both diesel- and gasoline direct injection vehicles>, 3. VDI/DECHEMA/GDCh Expert Forum on Atmospheric Chemistry, Frankfurt, Germany, December 5 - 6, 2016.
Keller A., Burtscher H. < On-line measurement of secondary aerosol emission factors from gasoline light duty vehicles>, 2. General GASOMEP Meeting, Dübendorf, Switzerland, March 17, 2016.
Keller A., Burtscher H. < High time-resolved SOA-formation potential of emissions from GDI engines>, 20. ETH Conference on Combustion Generated Nanoparticles, Zurich, Switzerland, June 13 - 16, 2016.
Munoz M. <Emissions of genotoxic compounds from GDI vehicles>, 2. General GASOMEP Meeting, Dübendorf, Switzerland, March 17, 2016.
Munoz M., Bisig C., Heeb N., Rothen-Rutishauser B., Comte P., Czerwinski J., Haag R., Seiler C., Schmid P., Honegger P., Zeyer K., Mohn J. < Comparison of PAH levels and mutagenicity of GDI- and diesel vehicle exhausts and impact of (bio)ethanol>, 20. ETH Conference on Combustion Generated Nanoparticles, Zurich, Switzerland, June 13 - 16, 2016.
Munoz M., Heeb N. V., Haag R., Honegger P., Zeyer K., Mohn J., Comte P., Czerwinski J. < Bioethanol blending reduces nanoparticle, PAH and alkyl- and nitro-PAH emissions and the genotoxic potential of exhaust from a gasoline-direct injection flex-fuel vehicle>, Environ. Sci. Techn., 60, 11853-11861, 2016.
Prevot A., Pieber S.M., Kumar N., Platt S.M., El Haddad I. <Secondary organic aerosol production potential from diesel and gasoline vehicle exhausts>, 2. General GASOMEP Meeting, Dübendorf, Switzerland, March 17, 2016.
Slowik JG, Pieber SM, Kumar NK, Klein F, Bhattu D, Dommen J, Prévôt ASH. <Gas phase composition and secondary organic aerosol formation from gasoline direct injection vehicles investigated in batch and flow reactors: effects of prototype gasoline particle filters>, 4th PAM USERS MEETING, October 2016, USA.

61
2017:
Czerwinski J., Comte P. <Particle, regulated & non-regulated emissions, size & number distribution, fuel effects>, Final GASOMEP Meeting, Dübendorf, Switzerland, March 16, 2017.
Czerwinski J. <Research on petrol engine particle emissions>, 7. VERT Forum, Dübendorf, Switzerland, March 17, 2017.
Czerwinski J. <Nanoparticle emissions of GDI cars with increased lube oil consumption, potentials of GPF>, 21. ETH Conference on Combustion Generated Nanoparticles, Zurich, Switzerland, June 19 - 22, 2017.
Czerwinski J., Comte P., Güdel M., Mayer A., Hensel V. <Nanoparticle emissions of GDI cars DI & MPI>, 21. ETH Conference on Combustion Generated Nanoparticles, Zurich, Switzerland, June 19 - 22, 2017.
Czerwinski J., Comte P., Güdel M., Bonsack P. <Nanoparticle emissions from gasoline vehicles DI & MPI>, PTNSS Journal of Combustion Engines, 170, 179-187, 2017.
Czerwinski J., Comte P., Heeb N., Mayer A., Hensel V. < Nanoparticle emissions of DI gasoline cars with/without GPF>,SAE 2017-01-1004, Detroit, U.S.A. 2017.
Czerwinski J., Comte P., Güdel M., Mayer A., Hensel V. <Ultrafine particles of gasoline cars DI & MPI and reduction potentials with GPF>, International Symposium, European Federation of Clean Air and Envrionmental Protection Associations (EFCA), Brussels, Belgium, May 10 - 11, 2017.
Czerwinski J., Comte P., Güdel M., <Non-legislated emissions of a GDI flex fuel passenger car at cold start with ethanol and butanol blend fuels>, 11th International Colloquium fuels conventional and future energy for automobiles (TAE), 199-207, 2017.
Czerwinski J., Comte P., Engelmann D., Hensel V., Kurzwart M., Mayer A. <Effects of GPFs on PN emissions of GDI cars>, 15th FAD-Conference, Dresden November 8- 9, 2017.
Elber U. <The CCEM perspective>, Final GASOMEP Meeting, Dübendorf, Switzerland, March 16, 2017.
Gentner D., Jathar S., Gordon T., Bahreini R., Day D., El Haddad I., Hayes P., Pieber S., Platt S., de Gouw J., Goldstein A., Harley R., Jimenez J.L., Prévôt A., Robinson A. <A review of urban secondary organic aerosol formation from gasoline and diesel motor vehicle emissions>, Environ. Sci. Technol., 2017, 51 (3), pp 1074–1093. DOI: 10.1021/acs.est.6b04509.
Heeb N. <Motivation, project design, fleet characteristics, experimental set-up>, Final GASOMEP Meeting, Dübendorf, Switzerland, March 16, 2017.
Heeb N. <Chemistry of the NOx trap technology>, 7. VERT Forum, Dübendorf, Switzerland, March 17, 2017.
Heeb N. <Blue technology not green enough: Nirogen chemistry of current on-road deNOx technologies>, 21. ETH Conference on Combustion Generated Nanoparticles, Zurich, Switzerland, June 19 - 22, 2017.
Keller A., Burtscher H. <Time-resolved SOA formation potential of GDI emissions during standard driving cycles>, Final GASOMEP Meeting, Dübendorf, Switzerland, March 16, 2017.

62
Keller A. <High time-resolved SOA-formation potential of emissions from GDI engines>, 21. ETH Conference on Combustion Generated Nanoparticles, Zurich, Switzerland, June 19 - 22, 2017.
Mayer A. <From diesel to gasoline particle filters: recent trends in filter technologies>, Final GASOMEP Meeting, Dübendorf, Switzerland, March 16, 2017.
Munoz M. <Genotoxic potential of GDI exhausts without and with GPFs>, Final GASOMEP Meeting, Dübendorf, Switzerland, March 16, 2017.
Munoz M. <Are GDI vehicle exhausts genotoxic like non-treated diesel exhausts>, 21. ETH Conference on Combustion Generated Nanoparticles, Zurich, Switzerland, June 19 - 22, 2017.
Munoz M., Haag, R., Zeyer K., Mohn J., Comte P., Czerwinski J., Heeb N., <Effect of oxygenated fuels on genotoxic emissions of gasoline direct injection vehicles>, 21. ETH Conference on Combustion Generated Nanoparticles, Zurich, Switzerland, June 19 - 22, 2017.
Munoz M., Haag, R., Zeyer K., Mohn J., Comte P., Czerwinski J., Heeb N., <Are GPFs effective for reducing genotoxic emissions of GDI vehicles?>, 22. International Transport and Air Pollution Conference, Zurich, Switzerland, November 15 - 16, 2017.
Pieber S.M., Kumar N.K., Klein F., Comte P., Bhattu D., Dommen J., Bruns E.A., Kilic D., El Haddad I., Keller A., Czerwinski J., Heeb N., Baltensperger U., Slowik J.G., Prévôt A.S.H. <Gas phase composition and secondary organic aerosol formation from gasoline direct injection vehicles investigated in batch and flow reactors: effects of prototype gasoline particle filters>, SAE World Congress, April 2017, Detroit (USA).
Pieber S. <Gas-phase composition and secondary organic aerosol formation from gasoline direct injection vehicles investigated in batch and flow reactors>, 21. ETH Conference on Combustion Generated Nanoparticles, Zurich, Switzerland, June 19 - 22, 2017.
Pieber S.M., Kumar N.K., Klein F., Comte P., Bhattu D., Dommen J., Bruns E.A., Kilic D., El Haddad I., Keller A., Czerwinski J., Heeb N., Baltensperger U., Slowik J.G., Prévôt A.S.H. <Gas phase composition and secondary organic aerosol formation from gasoline direct injection vehicles investigated in batch and flow reactors: effects of prototype gasoline particle filters>, European Aerosol Conference, August 2017, Zurich (CH).
Pieber S.M., Kumar N.K., Klein F., Comte P., Bhattu D., Dommen J., Bruns E.A., Kilic D., El Haddad I., Keller A., Czerwinski J., Heeb N., Baltensperger U., Slowik J.G., Prévôt A.S.H. < Gas phase composition and secondary organic aerosol formation from gasoline direct injection vehicles investigated in batch and flow reactors: effects of prototype gasoline particle filters >, Atmospheric Chemistry and Physics, 2017, DOI.org/10.5194/acp-2017-942.
Prévot A., Pieber S., Kumar N., Klein F, Slowik JG. <Secondary organic aerosol formation in the smog chamber>, Final GASOMEP Meeting, Dübendorf, Switzerland, March 16, 2017.
Slowik J.G., Pieber S.M., Kumar N.K., Klein F., Comte P., Bhattu D., Dommen J., Bruns E.A., Kilic D., El Haddad I., Keller A., Czerwinski J., Heeb N., Baltensperger U., Prévôt A.S.H. <Gas phase composition and secondary organic aerosol formation from gasoline direct injection vehicles investigated in batch and flow reactors: effects of prototype gasoline particle filters>, 5th PAM USERS MEETING, October 2017, USA.
Wichser A. <Metal emissions, fuel- and filter effects>, Final GASOMEP Meeting, Dübendorf, Switzerland, March 16, 2017.

63
Industrial and institutional partners
Interactions among project partners were productive and interesting exhausts of various qualities could be delivered. We could already demonstrate early in the project the potential of a first gasoline particle filter developed by one of our industrial partners. Two additional filters were made available by a second industrial partner and an additional filter was developed by the first partner. In other words, we were able to test four different particle filters, two had catalytic coatings, two were non-coated, in one campaign at the same vehicle. This was a unique opportunity and we would like to thank to our industrial partners for these important contributions. It was the policy of these industrial partners not to be visible and not to disclose technical details of these prototype filters which we respected throughout the project. Thus the applied filters were not specified further. However, the tested vehicles were rented and hence their producers name and model were specified.

64
Appendix 1

65
Appendix 1 (continued)

66
Appendix 2

67
Appendix 2 (continued)

68
Appendix 3

69
Appendix 3 (continued)
70
Appendix 3 (continued)