Final Results Presentation - franchisebrands.co.uk · speak only as of the date of this...
23
Final Results Presentation 22 March 2018
Transcript of Final Results Presentation - franchisebrands.co.uk · speak only as of the date of this...

Final Results Presentation22 March 2018

DisclaimerThis presentation is the sole responsibility of the directors of Franchise Brands plc (the “Company”). No offer or invitation or solicitation of any offer to acquire securities of the Companyis being made now nor does this presentation constitute or form part of any invitation or inducement to engage in investment activity under section 21 of the Financial Services andMarkets Act 2000. No reliance may be placed for any purpose whatsoever on the information contained in this presentation or any assumptions made as to its completeness and nowarranty or representation is given by or on behalf of the Company nor its directors, employees, agents, Allenby Capital, Dowgate Capital and advisors as to the accuracy orcompleteness of the information or opinions contained in this presentation and no liability is accepted by any of them for any such information or opinions, provided that nothing inthis paragraph shall exclude liability for any representation or warranty made fraudulently. The information and opinions contained in this presentation are provided as at the datehereof.
This presentation may contain forward-looking statements that involve substantial risks and uncertainties, and actual results and developments may differ materially from thoseexpressed or implied by these statements. These forward-looking statements are statements regarding the Company's intentions, beliefs or current expectations concerning, amongother things, the Company's results of operations, financial condition, prospects, growth, strategies and the industry in which the Company operates. By their nature, forward-lookingstatements involve risks and uncertainties because they relate to events and depend on circumstances that may or may not occur in the future. These forward-looking statementsspeak only as of the date of this presentation and the Company does not undertake any obligation to publicly release any revisions to these forward-looking statements to reflectevents or circumstances after the date of this presentation.
Allenby Capital Limited (“Allenby Capital”), which is authorised and regulated by the Financial Conduct Authority, is acting as the nominated adviser and joint broker to the Company.Dowgate Capital Stockbrokers Limited (“Dowgate Capital”), which is authorised and regulated by the Financial Conduct Authority, is acting as joint broker to the Company. Accordingly,Allenby Capital and Dowgate Capital are not acting for any one else in connection with the matters described in this document and accordingly will not be responsible to any person otherthan Company for providing the protections afforded to customers of Allenby Capital or Dowgate Capital, or for providing advice in relation to such matters. This presentation does notconstitute a recommendation regarding the shares of the Company nor a representation that any dealing in those shares is appropriate. The Company accepts no duty of care whatsoever tothe reader of this presentation in respect of its contents and the Company is not acting in any fiduciary capacity. The information contained in the presentation has not been verified byAllenby Capital or Dowgate Capital, nor does this presentation purport to be all-inclusive or to contain all the information that an investor may desire to have in evaluating whether or not tomake an investment in the Company.
The contents of this presentation must not be copied, published, reproduced or distributed.

Contents
3
Page
1. Highlights of final results 4
2. Metro Rod 6
3. Metro Plumb 11
4. Kemac 12
5. ChipsAway, Ovenclean and Barking Mad 13
6. Final results 14
7. Summary
Appendix
20

Highlights
4
Financial highlights:
• Revenue up five-fold to £24.3m (2016: £4.9m).
• Adjusted EBITDA increased by 101% to £2.7m (2016: £1.4m).
• Adjusted profit after tax grew by 77% to £1.7m (2016: £1.0m).
• Cash generated from operations before exceptional costs of £2.6m (2016: £1.4m).
• Net debt of £6.3m at 31 December 2017 (2016: nil), with gearing of 27% (2016: nil).
• Adjusted Basic EPS 2.5p (2016: 2.4p), reflecting the significant increase in shares in issue following the IPO and acquisition of Metro Rod.
• Final dividend of 0.33p per share proposed (2016: 0.17p per share), giving a total dividend for the year to 0.50p per share (2016: 0.17p per share), covered 5x by adjusted profit after tax.

Highlights
5
Operational highlights
• Trading summary:
• Metro Rod was acquired in April 2017 for £28.4m and traded in-line with management expectations.
• ChipsAway and Ovenclean exceeded budget through strong Management Service Fee (“MSF”) growth.
• Barking Mad made a good contribution in its first full year of ownership and exceeded budget.
• Kemac delivered a very disappointing performance due to the loss of work from water utilities.
• The Group’s shared support services extended and now complete.
• New strategy formulated for Metro Rod which includes investment in IT, sales and marketing.
• Board and senior management team strengthened.

Metro Rod Strategy (1)
6
• Feedback exercises with the franchisees and Support Centre teams confirmed that Metro Rod has a market-leading national offering in the commercial drainage market which has never been fully exploited.
• Significant opportunity identified for Metro Rod to take market share from competitors in a relatively stable c£750m market: • Approximately 1,500 competitors in a very fragmented market most of which are small firms,• Larger competitors such as Lanes for Drains and Ansa have a different strategic focus to Metro Rod
• However, franchisees have become over-dependent on central services, which provides them with the following services:• The central sales team wins 60% by value (70% by volume) of franchisee turnover as national accounts,• The works management system (Athena) deployed across the system which manages all work,• Liaison and updating of national accounts via call centre,• Management of all out of hours (5pm to 8am and weekends) customer contact, via the call centre,• The invoicing of all customers,• Credit control and cash collection,• Payment of all sales invoices in 47 days, regardless of cash collection (subject to 90 day clawback of unpaid commercial accounts),• The full credit risk on national accounts (ie, Carillion),• Most engineer and health and safety training and system accreditations,• Preparation and submission of all further recommendations relating to national accounts,• Central marketing support.
• All these services are provided for an MSF of 22.5% of turnover.

Metro Rod Strategy (2)• New strategy formulated for Metro Rod, the central objective of which is to grow franchisee sales and their profitability whilst also building
our MSF income.
• A key driver of the new strategy is for the franchisees to become more independent and more responsible for building their businesses. This will allow them to provide their customers with a superior and more responsive service.
• Our strategic goals are to:• Increase the amount of business won locally from 40% to 60% of franchisee sales,• Continue to develop nationally-won accounts,• Have all franchisees operate on a truly 24/7/365 business with a much reduced level of central support.
• The strategy will be achieved as follows:• Improve IT and MI infrastructure,• Regional sales team to help franchisees win more local work,• Professional marketing, underpinned by the NAF, to build the brand,• Improved skill base and equipment to increase capacity of franchisees,• Some corporate franchisees, so we can lead by example and pilot new ideas/systems,• Some franchisee churn, as not all will share our vision and ambition.
7

IT: Challenges and Opportunities
8
• Metro Rod’s business processes and IT systems need to be completely overhauled:• IT systems: old technology, over engineered for our needs, functionality issues, clunky,• Business processes: overly complicated, very manual, very poor MI.
• The scale of the Metro Rod investment has required us to create an in-house capability, headed up by Colin Rees, Chief Information Officer.
• Systems being developed are designed to enhance and automate the business systems and management information at Metro Rod but will have applications for all current and future Group brands.
• IT investment required to fully develop the opportunity at Metro Rod is greater than originally anticipated, but it is now factored into the Group’s budget.
• Additional investment in IT will enable us to build a significantly larger and more efficient business than we originally projected, including reducing the cost base at the Macclesfield Support Centre.

IT: Vision and Strategy
9
• Key design principles: cloud-based, future-proofed, customer-centric, simple to use, flexible, franchisee involvement, right sized, secure.
• Manual logging, deployment, amendments, updating, upselling, closing and invoicing of jobs.
• Marketing and upselling customer-specific and related to individual jobs.
• Automatic logging, deployment, amendment, updating, upselling, closing and invoicing of jobs.
• Automatic problem prediction, “smart drains”, reporting by exception, marketing and upselling to customers.
Current IT systems Future IT systems
• Incremental improvements to systems being made prior to system replacements. Areas of focus include: management information; ability of franchisees to log and amend jobs directly; automation of the upselling process (further recommendations); automation of customer portals; and improvements to the mobile application. These projects are already underway.
• New systems are at the early stages of being investigated (ie, works management system) but better MI and reporting is required to inform the changes that are required.
• Our approach to the IT budget follows the “Run, Grow, Transform” model: • Run - systems required to keep the business operational,• Grow - systems required to support business growth,• Transform - systems required to enable significant change.

Metro Rod Marketing and Sales• A key element of the Metro Rod strategy is to significantly improve the profile and awareness of the Metro Rod brand amongst key decision
makers.
• Investment in marketing is being funded through the introduction of a National Advertising Fund (“NAF”) at Metro Rod:• Franchisees are making a contribution of 1% of sales, • Metro Rod is also contributing an initial share equivalent to our MSF contribution of 22.5%, • NAF allows us to expand the Group’s central marketing team, which manages the marketing funds for all the brands.
• The objective is to position Metro Rod as the leading solution for commercial drainage clearance and maintenance by:• Rebranding the vans, signage and other marketing materials,• Targeting specific sectors on a national basis, e.g., education is the focus of the Q1 2018 campaign,• Using a broad marketing mix including: trade advertising, e-shots, LinkedIn advertising, exhibitions, PR,• Providing franchisees with new marketing assets as well as marketing training
• We have also created a regional sales team whose objective is to work with franchisees and win this local work. This is funded entirely by corporate.
10
Metro Plumb & KemacMetro Plumb
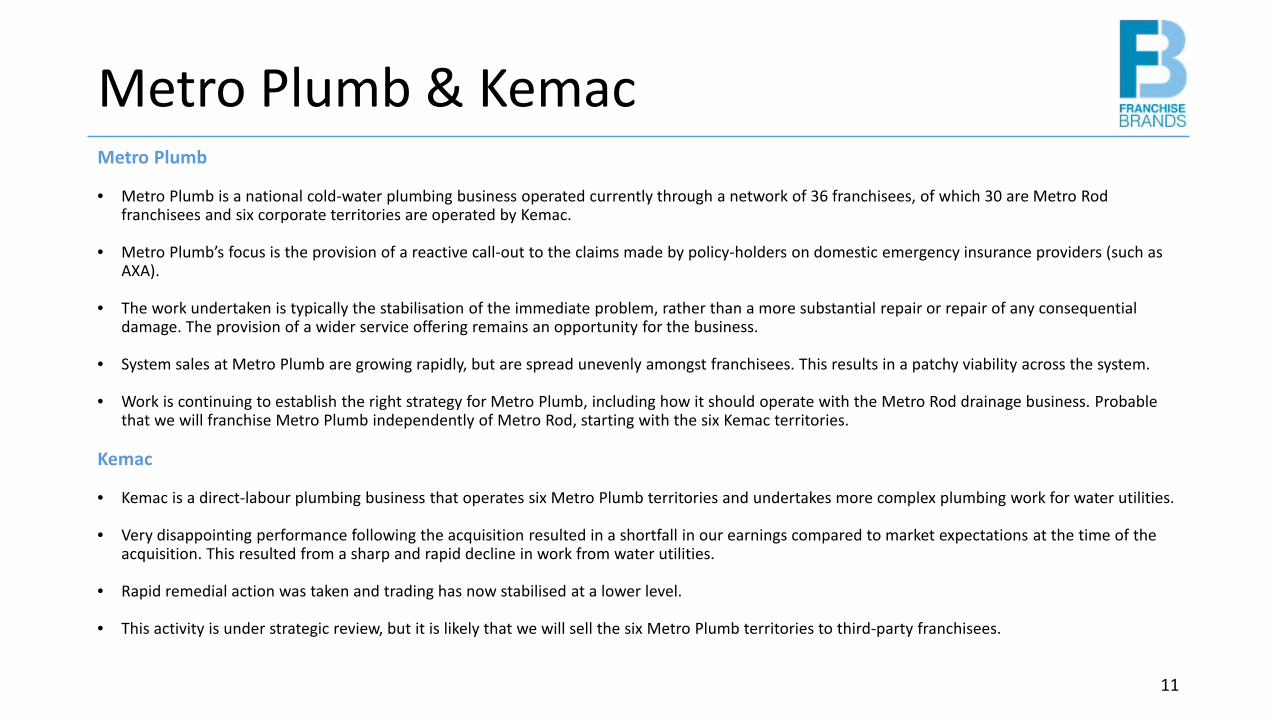
• Metro Plumb is a national cold-water plumbing business operated currently through a network of 36 franchisees, of which 30 are Metro Rod franchisees and six corporate territories are operated by Kemac.
• Metro Plumb’s focus is the provision of a reactive call-out to the claims made by policy-holders on domestic emergency insurance providers (such as AXA).
• The work undertaken is typically the stabilisation of the immediate problem, rather than a more substantial repair or repair of any consequential damage. The provision of a wider service offering remains an opportunity for the business.
• System sales at Metro Plumb are growing rapidly, but are spread unevenly amongst franchisees. This results in a patchy viability across the system.
• Work is continuing to establish the right strategy for Metro Plumb, including how it should operate with the Metro Rod drainage business. Probable that we will franchise Metro Plumb independently of Metro Rod, starting with the six Kemac territories.
Kemac
• Kemac is a direct-labour plumbing business that operates six Metro Plumb territories and undertakes more complex plumbing work for water utilities.
• Very disappointing performance following the acquisition resulted in a shortfall in our earnings compared to market expectations at the time of the acquisition. This resulted from a sharp and rapid decline in work from water utilities.
• Rapid remedial action was taken and trading has now stabilised at a lower level.
• This activity is under strategic review, but it is likely that we will sell the six Metro Plumb territories to third-party franchisees.
11

ChipsAway, Ovenclean and Barking Mad
12
• Main sources of revenue from these brands is MSF (50% of total), followed by sales of franchise territories (29%) and product sales (16%).
• ChipsAway continues to recruit new franchisees, however, the real opportunity lies in helping franchisees develop from being “man-in-a van” operators to management franchisees with turnover-related MSF income:
• 32 franchisees operate from Car Care Centres and a further 35 operate multiple territories and/or multiple vans, most of which now pay a turnover related MSF.
• Ovenclean remains fundamentally a “man-in-a van” franchise, however, the effectiveness of the consumer marketing has increased average franchisee turnover, thereby allowing us to increase the “fixed” monthly fee from £300 to £335, or 10% of the expected sales.
• Barking Mad accelerated the recruitment of new franchisees by leveraging the Group’s franchise recruitment capability:• Potential for up to 250 viable Barking Mad territories in the UK. • System sales, on which we collect a 10% MSF, continued to grow at a satisfactory rate.
13
Summary of Group ResultsYear ended 31 December
2017 2016 Change%
£’000 £’000 £’000
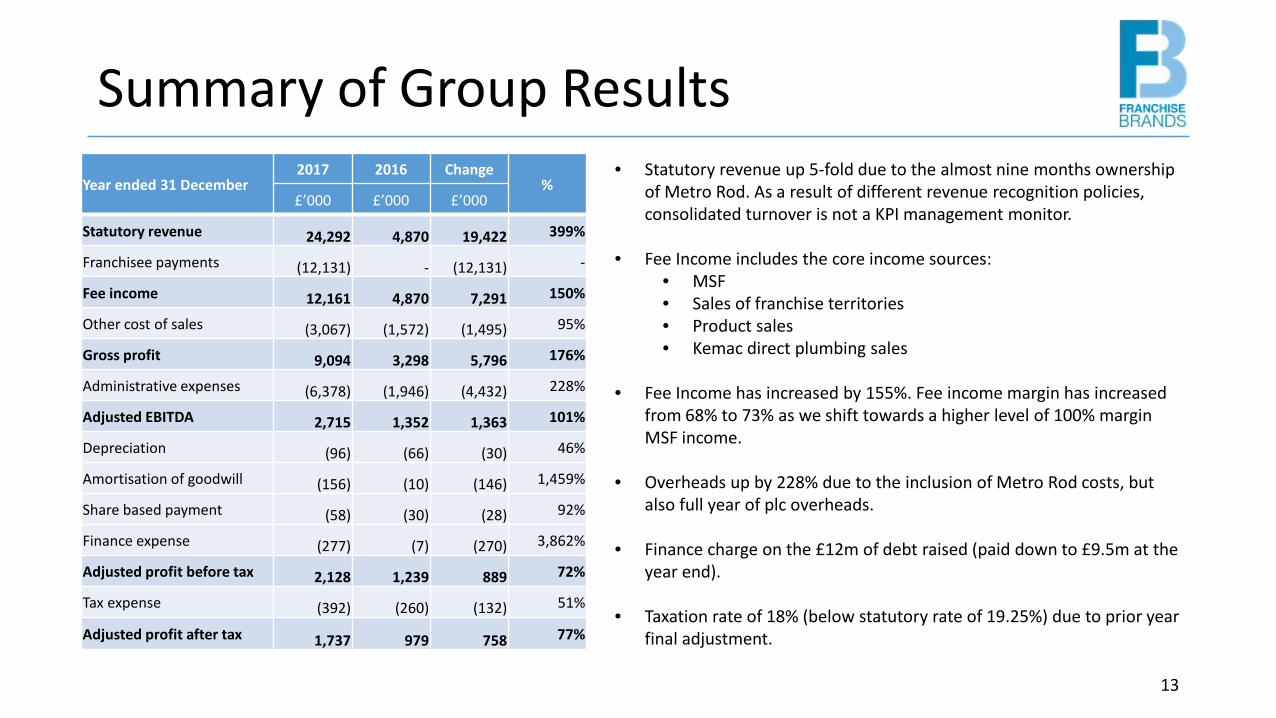
Statutory revenue 24,292 4,870 19,422 399%
Franchisee payments (12,131) - (12,131) -
Fee income 12,161 4,870 7,291 150%
Other cost of sales (3,067) (1,572) (1,495) 95%
Gross profit 9,094 3,298 5,796 176%
Administrative expenses (6,378) (1,946) (4,432) 228%
Adjusted EBITDA 2,715 1,352 1,363 101%
Depreciation (96) (66) (30) 46%
Amortisation of goodwill (156) (10) (146) 1,459%
Share based payment (58) (30) (28) 92%
Finance expense (277) (7) (270) 3,862%
Adjusted profit before tax 2,128 1,239 889 72%
Tax expense (392) (260) (132) 51%
Adjusted profit after tax 1,737 979 758 77%
• Statutory revenue up 5-fold due to the almost nine months ownership of Metro Rod. As a result of different revenue recognition policies, consolidated turnover is not a KPI management monitor.
• Fee Income includes the core income sources:• MSF• Sales of franchise territories• Product sales• Kemac direct plumbing sales
• Fee Income has increased by 155%. Fee income margin has increased from 68% to 73% as we shift towards a higher level of 100% margin MSF income.
• Overheads up by 228% due to the inclusion of Metro Rod costs, but also full year of plc overheads.
• Finance charge on the £12m of debt raised (paid down to £9.5m at the year end).
• Taxation rate of 18% (below statutory rate of 19.25%) due to prior year final adjustment.

14
Non-recurring Items
Year ended 31 December 2017 2016 Change%
£’000 £’000 £’000
Adjusted profit after tax 1,737 979 758 77%
Costs of acquisition of subsidiaries (1,144) (58)
Costs of transition of acquisition (734) -
Bad debt provision (316) -
IPO expenses - (397)
Tax on adjusting items 345 -
Non-recurring items (net of tax) (1,849) (455)
Statutory (loss)/profit (112) 524 (636) -121%
• Significant increase of non-recurring items in the current year arising from acquisition of Metro Rod.
• £1.1m in relation to the cost of the reverse take-over of Metro Rod transaction, funding and resulting re-admission to AIM. A further £0.4m was set-off against the share premium arising.
• £0.7m for the transition of acquisition (primarily IT related).• £0.3m bad debt provision in respect of Carillion liquidation. • Costs offset by partial tax relief of £0.3m.
• Statutory loss of £0.1m

15
Individual Business ResultsYear ended 31 December 2017 2016 Change %Fee Income* £'000s £'000s £'000s
ChipsAway 4,277 3,978 299 8%Ovenclean 790 818 (28) -3%Barking Mad 681 74 607 820%Metro Rod 6,423 0 6,423 -Total 12,171 4,870 7,301 150%
Year ended 31 December 2017 2016 Change %Adjusted EBITDA £'000s £'000s £'000s
ChipsAway 1,912 1,626 286 18%Ovenclean 297 300 (3) -1%Barking Mad 187 (10) 197 1,902%Metro Rod 1,325 0 1,325 -Central overheads (1,006) (564) (442) 78%
Total 2,715 1,352 1,363 101%
• Of the existing businesses ChipsAway has performed very strongly growing by 18%, with Ovenclean being flat year-on-year.
• Barking Mad is included for a full year following the acquisition in October 2016, and contributed £187k of EBITDA, in line with expectations.
• Metro Rod was owned for almost 9 months during the year, and contributed £1.3m of EBITDA. The core Drainage and Plumbing businesses performed in-line with management expectation, but was offset by a disappointing performance at the direct labour operation, Kemac.
• Central overheads have increased 110% due to the addition of full year of plc overheads relating to being an AIM quoted company, the strengthening of the management team, and the introduction of new non-cash items. However, the numbers shown in the table include the losses for MyHome of £17,000 (2016: £93,000).
* Fee income includes MSF income, licence fees, product sales and direct sales in relation to Kemac, less payments to franchisees.

16
EPS and Dividend
For the year ended 31 December 2017 2017 2016 Change %Adjusted profit after tax (£’000) 1,737 979 758 77%Non-recurring items (net of tax) (£’000) (1,849) (455) (1,394) 306%Statutory (loss)/profit (£’000) (112) 524 (636) -121%
Weighted number of shares- basic 69,553,746 40,837,885 28,715,861 70%Weighted number of shares- fully diluted 70,295,472 40,985,539 29,309,933 72%
Basic EPS (p) (0.16) 1.28 (1.44) -113%Fully Diluted EPS (p) (0.16) 1.28 (1.44) -112%Underlying Basic EPS (p) 2.50 2.40 0.10 4%Underlying Fully Diluted EPS (p) 2.47 2.39 0.08 3%
Dividend per share (p) 0.50 0.17 0.33 194%
• EPS on an adjusted basis has increased by a modest 4% year-on-year, despite earnings growing by 77% in the year.
• This is due to weighted number of shares increasing by 70% in the same period.
• Total dividend for the year proposed at 0.50p per share (0.17p paid at interim, final 0.33p to be approved at the AGM).
• Total dividend covered 5 times by adjusted basic EPS.

17
Movement in Net Debt
At 31 December 2017 2017 2016 Change
£’000 £’000 £’000
Cash 3,245 2,999 246
Term loan (6,000) - (6,000)
RCF (3,500) - (3,500)
Shareholder loan - (417) 417
Accrued interest (64) - (64)
Loan fee 145 - 145
Lease debt (86) (102) 16
Net debt (6,261) 2,480 (8,741)
• During the year the Group negotiated new debt facilities with HSBC in order to fund the acquisition of Metro Rod. These facilities included:
• £12m term loan• £5m Revolving Credit Facility (“RCF”)
• In order to reduce excess cash being held on the balance sheet, and to reduce our own-going financing costs, we paid down £6m of the term loan early during December 2018, and utilised £3.5m of the RCF (on which we pay a non-utilisation fee).
• At the year end net debt stood at £6.3m:• Interest cost covered 9.8 times by adjusted EBITDA• Moderate capital gearing of 27%• Operating well within all covenants
18
Balance SheetAt 31 December 2017 2017 2016
£'000 £'000
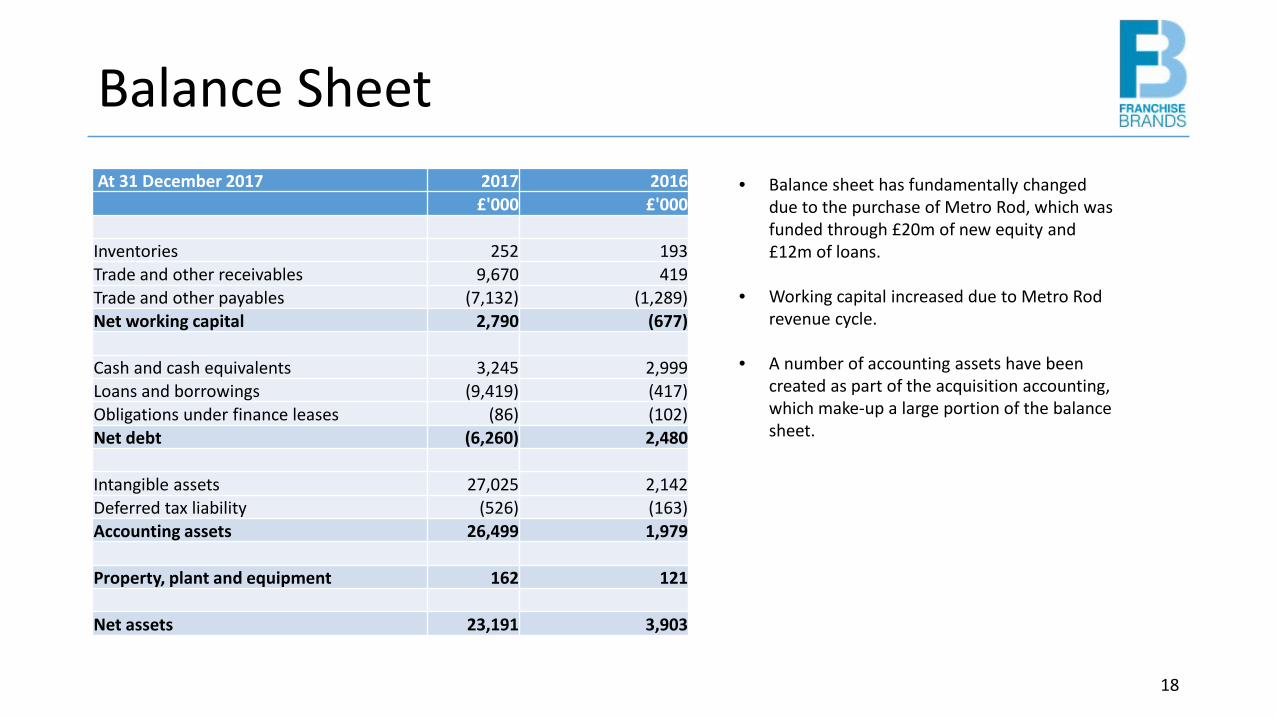
Inventories 252 193Trade and other receivables 9,670 419Trade and other payables (7,132) (1,289)Net working capital 2,790 (677)
Cash and cash equivalents 3,245 2,999Loans and borrowings (9,419) (417)Obligations under finance leases (86) (102)Net debt (6,260) 2,480
Intangible assets 27,025 2,142Deferred tax liability (526) (163)Accounting assets 26,499 1,979
Property, plant and equipment 162 121
Net assets 23,191 3,903
• Balance sheet has fundamentally changed due to the purchase of Metro Rod, which was funded through £20m of new equity and £12m of loans.
• Working capital increased due to Metro Rod revenue cycle.
• A number of accounting assets have been created as part of the acquisition accounting, which make-up a large portion of the balance sheet.

19
Cash FlowCash flow for year ended 31 December 2017 £'000
Adjusted EBITDA 2,715Movement on receivables (1,574)Movements on inventories (17)Movement on payables 1,629Taxes paid (204)Net cash from adjusted operating activities 2,550Net cash paid on exceptional costs (1,849)Net cash generated from operating activities 701Capital expenditure (106)Acquisition (28,403)Net cash used in investing activities (28,509)Loans repaid (6,417)Loans received 15,330Interest paid (186)Proceed from issue of shares 20,000Share issue expenses (444)Dividends paid (213)Leases (16)Net cash generated from financing activities 28,054
Net increase in cash and cash equivalents 246
Cash and cash equivalents at beginning of year 2,999Cash and cash equivalents at end of year 3,245
• The Group has had strong cash inflow from its operations, with £2.6m generated from is underlying operations.
• The Group has incurred exceptional costs of £1.8m in relation to the acquisition of Metro Rod, which also involved a re-admission of the enlarged group to AIM.
• The Group paid £28.4m (net of cash acquired) for Metro Rod.
• The acquisition was funded by £20m of new equity and a £12m term loan.
• The Group paid down £6m of the term loan, and utilised £3.5m of the RCF (£1.5m remains un-utilised) in order to reduce on-going finance costs.

Summary• Transformational acquisition of Metro Rod:
• Significantly increased the scale of the business.• Challenges and opportunities, but upside potential of the business much greater than originally anticipated.• Strategy being implemented.
• Original brands trading well and strategy is to develop more MSF income.
• Barking Mad made a good initial contribution, particularly in relation to the price paid for the business.
• Creation of an IT function and centralisation of finance substantially completes the Group’s shared support services.
• Cash generation and cash conversion remain strong, allowing us to rapidly reduce debt and maintenance of a progressive dividend policy.
20

Appendix

22
Network size Jan 2017
New franchisees recruited
Franchisees leaving the system
Network size Dec 2017
ChipsAway 218 33 37 214
Ovenclean 102 23 19 106
Barking Mad 71 24 18 77
Metro Rod 40* 2 1 41
Total: 431 82 75 438
Franchise system at 31 December 2017
* As at 11 April 2017

23
www.franchisebrands.co.uk@FB_PLC
www.metrorod.co.uk@MetroRodUK
www.chipsaway.co.uk@ChipsAwayUK
www.ovenclean.com@Oven_Clean
www.barkingmad.uk.com@BarkingMadHQ