Final Report Wood Flow 2020 - WRAP - Circular Economy ... Flow... · A factor which could help wood...
85
Final Report Wood Flow 2020 A review of the quantity of wood packaging being placed on the market (POM) and recycled in 2014 with projections to 2020 Project code: PMP005-003 Research date: October 2015 – March 2016 Date: July 2016
Transcript of Final Report Wood Flow 2020 - WRAP - Circular Economy ... Flow... · A factor which could help wood...

Final Report
Wood Flow 2020
A review of the quantity of wood packaging being placed on the
market (POM) and recycled in 2014 with projections to 2020
Project code: PMP005-003
Research date: October 2015 – March 2016 Date: July 2016

WRAP’s vision is a world in which
resources are used sustainably.
Our mission is to accelerate the move to a
sustainable resource-efficient economy
through re-inventing how we design,
produce and sell products; re-thinking
how we use and consume products; and
re-defining what is possible through re-
use and recycling.
Find out more at www.wrap.org.uk
Document reference: [e.g. WRAP, 2006, Report Name (WRAP Project TYR009-19. Report prepared by…..Banbury, WRAP]
Written by: Hugh McCoach and Emily Ford (Valpak), Paul Davidson (Specialist Consultant),
Kathryn Warren (Ricardo Energy & Environment) and Peter Sainsbury (WRAP)
Front cover photography: Wood Packaging
While we have tried to make sure this report is accurate, we cannot accept responsibility or be held legally responsible for any loss or damage arising out of or in
connection with this information being inaccurate, incomplete or misleading. This material is copyrighted. You can copy it free of charge as long as the material is
accurate and not used in a misleading context. You must identify the source of the material and acknowledge our copyright. You must not use material to endorse or
suggest we have endorsed a commercial product or service. For more details please see our terms and conditions on our website at www.wrap.org.uk

WRAP – Wood Flow 2020 3
Executive Summary
Background
This project was commissioned by WRAP and carried out by Valpak Consulting, with
support from Paul Davidson (Specialist Consultant), Ricardo Energy & Environment and
a dedicated Steering Group of industry experts. The objective was to review the quantity
of wood packaging being placed on the market (POM) and recycled in 2014. The project
also projected future POM figures and recycling rates to 2020.
The methodology to achieve this involved primary and secondary research with
engagement of the stakeholder Steering Group. The group comprised Defra,
Environment Agency, Advisory Committee on Packaging (ACP), Wood Recyclers
Association, Wood Panel Industries Federation, Scotch Whiskey Association, Valpak and
WRAP.
Project Key Conclusions: POM
● The project’s final estimate of UK wood packaging POM for 2014 is 1,310k tonnes:
an increase of 276k tonnes compared to the 2014 figure used by Defra, which is
based on PackFlow. Elements of the final project estimate have been verified using
data from a combination of sources such as Timcon, Confor and Unit Pallets
Ltd/Federation of European Manufacturers of Wooden Pallets & Packaging (FEFPEB)
and wider Valpak data. The Steering Group for the project was supportive of the
methodology adopted and key findings;
● Unobligated or unregistered flow of wood packaging accounted for 8% of POM in
2014; and
● The projected trend between 2014 and 2020 in wood packaging POM is 4.3% growth
over the period. This projection is based on reviewing past performance of obligated
flow and growth in the construction sector, which show a strong correlation.
Project Key Conclusions: Recycling
● Using the new POM estimate of 1,310k tonnes, the UK achieved a 31% recycling rate
in 2014, with 412k tonnes of wood packaging recycled by accredited reprocessors/
exporters;
● In 2008, there were 940k tonnes of accredited recycling; however, by 2014 this had
dropped to 412k tonnes. The project team believes this decrease in accredited
recycling is largely due to waste wood packaging being used in end markets which
have not raised PRNs such as in biomass. And to a lesser extent due to the PRN
value being low in the recent past, meaning some recyclers may not have registered
to issue PRNs;
● There was an estimated 372k tonnes of unaccredited wood packaging recycling in
2014 (47% of total recycling);
● Recycling projections predict a decrease in accredited recycling (down from 412k
tonnes in 2014 to 324k tonnes in 2020), but a slow-down in the rate of decrease

Wood Flow 2020 4
compared to the previous six years. Based on the projected POM estimate for 2020,
the UK would achieve a 24% recycling rate in 2020; and
● Wood packaging recycling is projected to continue to comply with the Directive
target (15%) currently in place to 2020. However, future revisions of this target could
put UK compliance at risk.
Project Recommendations
● This work identified that there was a difference in obligated wood producers listed
on the NPWD compared to industry databases (detailed in Appendix IV). This work
identified that there could be organisations listed on industry databases that are of a
sufficient size by turnover and core business activity, and which therefore should
potentially be registered. As such, this should be investigated further, as this could
result in a significant tonnage of obligated wood POM being missed;
● Encouraging a greater number of wood recyclers to become accredited for all
recycling activities could increase the number of PRNs/PERNs generated for
recycling;
● Work should be done to ensure that data used to identify wood flow estimates is up
to date and as accurate as possible. An example of this would be to work with
Timcon to ensure it updates its reports/surveys for years (such as in 2014) in which
POM flows are required to be identified or verified. New ways of working between
Government and industry could be examined to update these types of datasets on a
regular basis; and
● A factor which could help wood packaging meet any future circular economy
recycling targets is re-use. As there is a significant quantity of wood pallets and other
items such as wooden barrels being re-used, this should be investigated to identify
the contribution this could make to future targets.
Data Sources
The amount of wood packaging POM and recycled was calculated using several methods
and data sources including UK Government databases such as the EA National
Packaging Waste Database (NPWD), HMRC and regulatory bodies. It also used data from
trade associations, published reports and Valpak internal data.
Data Uncertainties and Appropriate Confidence in Estimates
The data presented in this report represents the best estimate possible, given the
available data. However, owing to uncertainties inherent in many of the data sources
and assumptions used, it is important to caveat the robustness of the estimates.
Appendix IX includes an assessment of the robustness of the estimates.

Wood Flow 2020 5
Contents
1.0 Introduction ........................................................................................................... 10
1.1 Background and Existing Data ........................................................................... 10
1.2 Project Objectives ................................................................................................ 10
2.0 Background to Methodology Development for Estimating Packaging Flow . 11
2.1 Rationale ................................................................................................................ 11
2.2 Best in class approach ......................................................................................... 11
3.0 Wood Packaging Supply Chain ............................................................................ 13
3.1 Supply Chain Map ................................................................................................ 13
3.2 Placed on the Market .......................................................................................... 15
3.3 Collection ............................................................................................................... 15
3.4 Sorting .................................................................................................................... 15
3.5 Recycling / Recovery ............................................................................................ 16
3.6 End Markets .......................................................................................................... 16
4.0 Obligated Wood Packaging POM in 2014: Net Pack Fill .................................... 17
4.1 Net Pack Fill ........................................................................................................... 17
4.2 Data Verification ................................................................................................... 18
5.0 Total Wood Packaging POM in 2014 .................................................................... 20
5.1 Total Wood Packaging POM 2014 ...................................................................... 20
5.1.1 UK Wood Packaging Production ............................................................ 20
5.1.1.1Timcon (Pallets) ........................................................................................ 21
5.1.1.2Prodcom (Non-pallets) ............................................................................. 22
5.1.1.3Total UK Wood Packaging Production 2014 ......................................... 23
5.1.1.4Limitations of the Data ............................................................................ 25
5.1.2 Imports ...................................................................................................... 25
5.1.2.1Obligated Imports .................................................................................... 25
5.1.2.2De-minimis Imports ................................................................................. 26
5.1.3 Exports ....................................................................................................... 28
5.1.3.1Obligated Exports ..................................................................................... 28
5.1.3.2De-minimis Exports .................................................................................. 29
5.1.4 Total Wood Packaging POM 2014 .......................................................... 29
5.1.5 Format of Total Wood Packaging POM 2014 ....................................... 30
5.1.6 Consumer and Non-consumer Proportion of Total POM 2014 ........ 30
5.1.6.1Consumer .................................................................................................. 30
5.1.6.2Non-consumer .......................................................................................... 33
6.0 Results: Final Project Estimate of Wood Packaging POM in 2014 ................... 34
7.0 Recycling of Wood Packaging in 2014 ................................................................. 38
7.1 Introduction .......................................................................................................... 38
7.2 Collections ............................................................................................................. 38
7.2.1 Local Authority Collections ..................................................................... 38
7.2.2 C&I Collections .......................................................................................... 39
7.3 Recycling of Wood Packaging ............................................................................. 40
7.4 Accredited Recycling ............................................................................................ 40
7.5 Unaccredited Recycling ....................................................................................... 42
7.5.1 Panel Board ............................................................................................... 45
7.5.2 Other markets ........................................................................................... 46

Wood Flow 2020 6
7.5.3 Markets supplied by Accredited Reprocessors (May 2016) ............... 48
7.5.4 Other non-recycling disposal route and end markets ........................ 49
7.5.5 Decrease in Accredited Recycling .......................................................... 51
7.6 Wood Packaging Waste Market Dynamics ....................................................... 53
7.6.1 Trends in Wood Waste Recycling ........................................................... 53
7.6.2 Market Pricing ........................................................................................... 54
7.7 Recycling & Recovery Rates ................................................................................ 55
8.0 POM and Recycling Scenario Analysis ................................................................ 57
8.1 Introduction .......................................................................................................... 57
8.2 POM Projections ................................................................................................... 57
8.3 Accredited Recycling Projections ....................................................................... 58
8.4 Recycling Rate Projections and Implications .................................................... 60
9.0 Conclusions and Recommendations .................................................................. 61
9.1 Conclusions: Flow ................................................................................................. 61
9.2 Conclusions: Recycling ........................................................................................ 62
9.3 Recommended Areas for Further Work ........................................................... 63
Appendix I Obligation Reporting Activity Lines ........................................................... 64
Appendix II Grocery Retail Cross Reference ................................................................. 65
Appendix III Retail Sensitivity Analysis ......................................................................... 67
Appendix IV Assessment of De-minimis and Free-riders ............................................ 68
Appendix V Grades of Wood Waste, as Defined in PAS 111 ........................................ 69
Appendix VI Fiscal Incentives for Biomass ................................................................... 70
Appendix VII Regression Model ...................................................................................... 73
Appendix VIII De-minimis Imports and Exports Sense Check and Sensitivity
Analysis ............................................................................................................................. 78
Appendix IX Data Robustness ........................................................................................ 79
Figures
Figure 1 ‘Best in Class’ Method Overview ................................................................................ 12
Figure 2 Wood Packaging Supply Chain Map ......................................................................... 14
Figure 3 Net Pack Fill Results 2014 ........................................................................................... 17
Figure 4 ‘Net’ Producer Data Table Calculations 2014 .......................................................... 19
Figure 5 Total Wood Packaging POM Calculation 2014 ........................................................ 20
Figure 6 UK Pallet Production and Repair in 2014 ................................................................. 22
Figure 7 UK Non-pallet Production 2014 ................................................................................. 23
Figure 8 Total UK Wood Packaging Production 2014 ............................................................ 24
Figure 9 Obligated Imports of Wood Packaging ..................................................................... 26
Figure 10 UK Import / Export Ratios by Size of Organisation by Value .............................. 27
Figure 11 Wood Packaging Imported by Small Organisations (De-minimis) ..................... 27
Figure 12 Obligated Exports of Wood Packaging ................................................................... 28
Figure 13 Wood Packaging Imported by Small Organisations (De-minimis) ..................... 29
Figure 14 Total UK Wood Packaging Production 2014 .......................................................... 29
Figure 15 Total Wood Packaging POM by Format in 2014 .................................................... 30
Figure 16 Consumer Packaging by Format ............................................................................. 32
Figure 17 Non-consumer Packaging by Format ..................................................................... 33
Figure 18 Final Project Estimates of Wood POM in 2014 ...................................................... 34
Figure 19 Reported Obligated Flow and Project Final Estimate of POM for 2014 ............ 35
Figure 20 Obligated Versus Unobligated POM for Packaging Materials ............................ 37

Wood Flow 2020 7
Figure 21 Wood WDF data 2013/14 ......................................................................................... 39
Figure 22 C&I Wood Collections................................................................................................ 40
Figure 23 Total Accredited Wood Packaging Recycling/Exports .......................................... 42
Figure 24 Grades of Wood Waste ............................................................................................. 44
Figure 25 Wood Waste Markets Supplied by WRA Members in 2014 ................................. 45
Figure 26 Wood Waste used in Panel Board Production ...................................................... 46
Figure 27 Wood Packaging Recyed by End Market 2014 ...................................................... 47
Figure 28 Wood Packaging Recyed by End Market 2014 ...................................................... 49
Figure 29 Reprocessor / Exporter Accreditations and Wood PRN Price ............................. 51
Figure 30 Accredited Recycling and Reprocessors................................................................. 52
Figure 31 Wood Waste Markets Supplied by WRA Members, 2007-14 .............................. 53
Figure 32 Wood Packaging 2014 Recycling Rates .................................................................. 55
Figure 33 Wood POM Projections 2014 to 2020 .................................................................... 58
Figure 34 Historic Wood Recycling and Projections .............................................................. 59
Figure 35 Wood Recycling Rate Projections ............................................................................ 60
Figure 36 The EA’s Data Form – Activity Descriptions ........................................................... 64
Figure 37 Aggregated EA Grocery Retail Packaging Handled (2014) ................................... 65
Figure 38 Aggregated Grocery Retail Packaging Handled (2014) ........................................ 65
Figure 39 Grades of Recycled Wood ........................................................................................ 69
Figure 40 ROC Bandling Levels for 2014-17 ............................................................................ 71
Figure 41 Net Pack Fill Historic and Projections ..................................................................... 75
Figure 42 Historic Wood Recycling ........................................................................................... 76
Figure 43 UK Import / Export Ratios by Size of Organisation ............................................... 78
Figure 44 Data Robustness Assessment Results .................................................................... 79
Figure 45 Data Robustness Assessment: UK Wood Packaging Production ....................... 80
Figure 46 Data Robustness Assessment: Imports & Exports ............................................... 80
Figure 47 Data Robustness Assessment: De-minimis Imports & Exports .......................... 81
Figure 48 Data Robustness Assessment: Grocery POM ........................................................ 81
Figure 49 Data Robustness Assessment: Retail POM ............................................................ 82
Figure 50 Data Robustness Assessment: NPWD Net Pack Fill POM .................................... 82
Figure 51 Data Robustness Assessment: Accredited Recycling ........................................... 83
Figure 52 Data Robustness Assessment: Waste Data Flow .................................................. 83
Figure 53 Data Robustness Assessment: Unaccredited Recycling ...................................... 84

Wood Flow 2020 8
Glossary
CA – Civic Amenity
CfD – Contract for Difference
C&D – Construction and Demolition
C&I – Commercial and Industrial
CITB – Construction Industry Training Board
CONFOR – Confederation of Forest Industries (UK)
CWR – Community Wood Recycling Group
DECC – Department for Energy and Climate Change
EA – Environment Agency
EfW – Energy from Waste
EPIC – Environmental Product Information Centre
FEFPOEB – Fédération Européenne des Fabricants de Palettes et Emballages en Bois
(European Federation of Wooden Pallet and Packaging Manufacturers)
GDP – Gross Domestic Product
GHG – Greenhouse Gas
GVA – Gross Value Added
HMRC – Her Majesty's Revenue and Customs
HWRC – Household Waste Recycling Centre
k – Thousand
kt – Thousand tonnes
kWh – Kilowatt-hour
LA – Local Authority
LCCC – Low Carbon Contracts Company
MDF – Medium Density Fibreboard
MRF – Materials Recovery Facility
MSW – Municipal Solid Waste
NPWD – National Packaging Waste Database
ONS – Office for National Statistics
OSB – Oriented Strand Board
PERN – Packaging Export Recovery Note
POM – Placed on the market
PRN – Packaging Recovery Note
Prodcom – PRODuction COMmunautaire (Community Production)
RHI – Renewable Heat Incentive
RO – Renewables Obligation
ROC – Renewables Obligation Certificate
SEPA – Scottish Environment Protection Agency
Timcon – Timber Packaging and Pallet Confederation
TRADA – Timber Research and Development Association
Transit/Tertiary Packaging – Any transit packaging e.g. pallets, shrink wrap, staples or
strapping
WDF – Waste Data Flow
WPIF – Wood Panel Industry Federation
WRA – Wood Recyclers Association

Wood Flow 2020 9
Acknowledgements
Valpak Limited and WRAP would like to thank the following organisations for their
contribution to the Wood Flow 2020 project:
● Advisory Committee on Packaging (ACP);
● Albion Environmental Limited;
● Community Wood Recycling Group (CWR);
● Confor;
● Defra;
● Department of the Environment (Northern Ireland);
● Environment Agency (EA);
● HMRC;
● Natural Resources Wales (NRW);
● Office for National Statistics (ONS);
● Poyry;
● Ricardo Energy & Environment;
● Scotch Whisky Association;
● Scottish Environment Protection Agency (SEPA);
● Timcon;
● UK Forest Products Association;
● Unit Pallets Ltd;
● Wood Panel Industries Federation; and
● Wood Recyclers Association.

WRAP – Wood Flow 2020 10
1.0 Introduction
1.1 Background and Existing Data
It is important to ensure that the estimates being used by Defra for its packaging policy
work are as accurate as possible. To support Defra, this work focuses on reviewing the
estimates of UK wood packaging placed on the market (POM)1 and the associated
compliance implications. Accurate and robust assessments of current and future UK
wood packaging flows are vital to help inform the setting of UK business targets and also
the UK negotiating position in the acceptance of any possible future targets. The
devolved administrations of Scotland, Wales and Northern Ireland are also interested in
the outcome of this research.
At the time of writing, the Defra estimate for 2014 is 1,034k tonnes of wood packaging
POM2. The PackFlow3 project and industry assessment formed the basis of this estimate
in 2008. PackFlow derived estimates of the growth in wood packaging (and other
packaging materials) from a variety of quantitative and qualitative sources, including
dialogue with key stakeholders. The objective of Wood Flow 2020 is to provide an
updated baseline estimate of wood packaging placed on the market and
recycled/recovered.
1.2 Project Objectives
Wood Flow 2020 had the following key objectives:
● Assemble a Steering Group to provide industry expertise and advice and help guide
the project;
● Develop a methodology, based on Valpak’s ‘best in class’ method, to estimate the
amount of wood packaging POM and recycled/composted/going to energy
recovery/landfilled in 2014;
● Estimate tonnage of consumer and non-consumer wood packaging collected;
● Estimate recycling and recovery by end market;
● Project POM and recycling rate to 2020;
● Quantify the amount of unaccredited wood packaging recycled;
● Assess compliance with recycling targets;
● Assess the quality and uncertainty of all data and assumptions used; and
● Produce a final report and slide set detailing the project findings.
1 Wood packaging placed on the market means all household and non-household wood packaging used around products within
the UK. 2 https://www.gov.uk/government/uploads/system/uploads/attachment_data/file/82437/packaging-ia-120321.pdf, p.20 3 http://www.valpak.co.uk/docs/default-source/environmental-consulting/packflow_2017.pdf?sfvrsn=0
WRAP – Wood Flow 2020 11
2.0 Background to Methodology Development for Estimating Packaging Flow
2.1 Rationale
A number of methodologies have been evaluated and used in previous flow projects
undertaken jointly by Valpak and WRAP, to best fit the specifics of different packaging
materials. These methodologies include:
● Bottom up approach – estimating the POM by sector, such as grocery retail (using
Valpak Environmental Product Information Centre (EPIC) data4), wider retail,
commercial & industrial, construction & demolition, agricultural and other key
sectors using published secondary sources. This approach adds together the data for
each of the sectors, covering both obligated and unobligated producers, to produce
a total POM figure;
● Net Pack Fill – uses data from the National Packaging Waste Database (NPWD) to
calculate the obligated POM. This is then added to an estimate of the
unobligated/free-rider tonnage to give a total POM; and
● Top down approach – using UK Trade Info data and other statistics from trade
associations.
Additionally, other methodologies and datasets have been used to assess recycling
levels for each material, such as Waste Data Flow (WDF), NPWD, published waste
composition reports, Valpak surveys and those conducted by trade associations as part
of projects, and Valpak internal data.
Due to the varying approaches used and the Government’s desire to have one ‘best in
class’ methodology that can be used for any packaging material and which could be
updated on a more frequent basis, the Paper & Card Flow 2020 project reviewed these
methodologies to identify the advantages and disadvantages of each.
2.2 Best in class approach
The review recommendations were used to develop the ‘best in class’ method statement
for packaging flow and recycling calculations. An overview of the proposed ‘best in class’
methodology is provided in the Figure 1.
4 EPIC is Valpak’s database of packaging weights, covering over 800,000 products, predominately relating to the grocery sector.

WRAP – Wood Flow 2020 12
Figure 1 ‘Best in Class’ Method Overview
Wood Flow 2020 used this approach to identify and sense check POM and recycling
estimates. The methodologies for estimating wood POM and recycling in 2014 are
discussed later in this report.
POM Total
NPWD Net Pack Fill
(obligated)
Non-Obligated Estimate
Recycling Total
NPWD (Accredited)
Unaccredited Estimate
All supported and cross-checked using industry and Valpak data

WRAP – Wood Flow 2020 13
3.0 Wood Packaging Supply Chain
This section of the report provides an overview of how wood packaging flows on and off
the UK market through consumption, collection, sorting and recycling to final end
market destination. This section is important in understanding the flow of wood
packaging on and off the market.
3.1 Supply Chain Map
A map of the wood packaging supply chain is provided in Figure 2.

WRAP – Wood Flow 2020 14
Figure 2 Wood Packaging Supply Chain Map5
5 Each stage is explained in the following sections.
Consumer Recycling Collections
Non-Consumer Recycling Collections
MRF / Bulking
Land/Horticulture
Animal Bedding
Equine Surfaces
Recycling / RecoveryPlaced on
the Market
Consumer
Non-Consumer
Placed on the Market Collection Sorting Recycling / Recovery
Panel Board
Non-Consumer Non-Recycling Collections
Consumer Non-Recycling Collections
Export
Biomass
End Markets
Reuse / Repair
WRAP – Wood Flow 202015
3.2 Placed on the Market
Placed on the market refers to the flow of new wood packaging onto the UK market.
Consumption of goods using wood as packaging can occur both in the consumer (in the
home and on the move) and non-consumer (by business) streams.
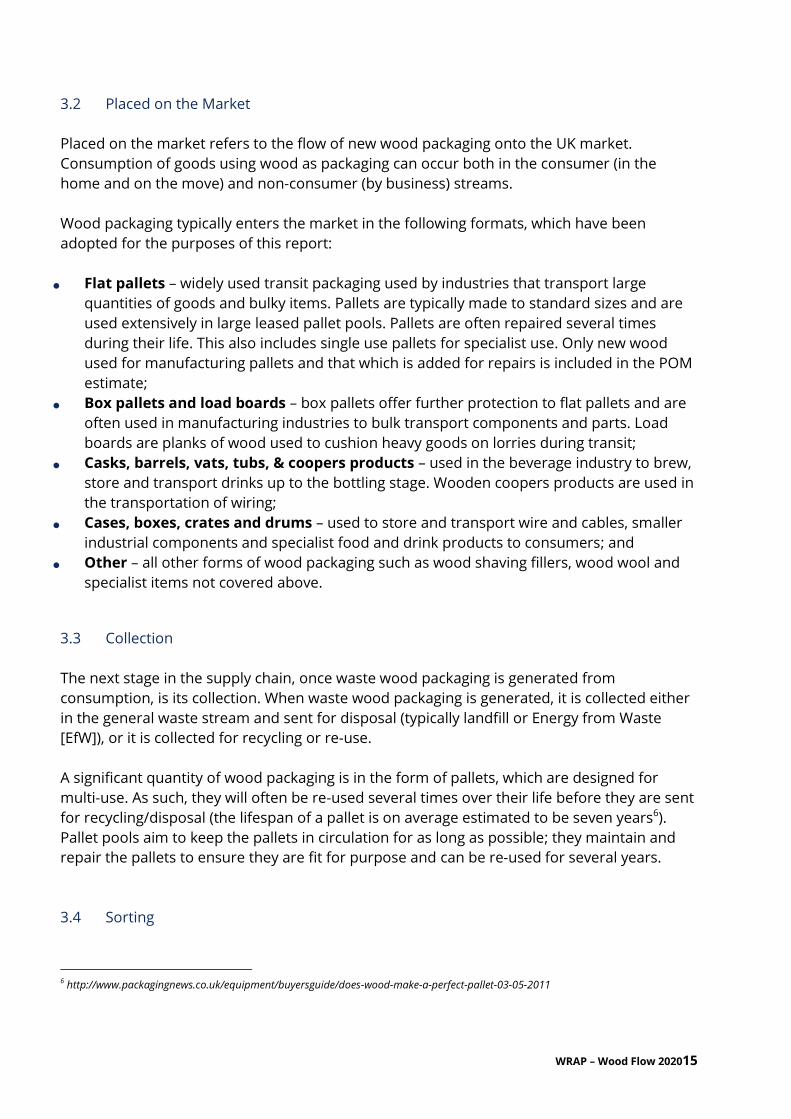
Wood packaging typically enters the market in the following formats, which have been
adopted for the purposes of this report:
● Flat pallets – widely used transit packaging used by industries that transport large
quantities of goods and bulky items. Pallets are typically made to standard sizes and are
used extensively in large leased pallet pools. Pallets are often repaired several times
during their life. This also includes single use pallets for specialist use. Only new wood
used for manufacturing pallets and that which is added for repairs is included in the POM
estimate;
● Box pallets and load boards – box pallets offer further protection to flat pallets and are
often used in manufacturing industries to bulk transport components and parts. Load
boards are planks of wood used to cushion heavy goods on lorries during transit;
● Casks, barrels, vats, tubs, & coopers products – used in the beverage industry to brew,
store and transport drinks up to the bottling stage. Wooden coopers products are used in
the transportation of wiring;
● Cases, boxes, crates and drums – used to store and transport wire and cables, smaller
industrial components and specialist food and drink products to consumers; and
● Other – all other forms of wood packaging such as wood shaving fillers, wood wool and
specialist items not covered above.
3.3 Collection
The next stage in the supply chain, once waste wood packaging is generated from
consumption, is its collection. When waste wood packaging is generated, it is collected either
in the general waste stream and sent for disposal (typically landfill or Energy from Waste
[EfW]), or it is collected for recycling or re-use.
A significant quantity of wood packaging is in the form of pallets, which are designed for
multi-use. As such, they will often be re-used several times over their life before they are sent
for recycling/disposal (the lifespan of a pallet is on average estimated to be seven years6).
Pallet pools aim to keep the pallets in circulation for as long as possible; they maintain and
repair the pallets to ensure they are fit for purpose and can be re-used for several years.
3.4 Sorting
6 http://www.packagingnews.co.uk/equipment/buyersguide/does-wood-make-a-perfect-pallet-03-05-2011

Wood Flow 2020 16
One of the next steps in the supply chain following the collection of wood packaging is the
bulking stage.
At an MRF/bulking facility, wood is typically sorted and bulked until a sufficient quantity is
achieved, at which point it will be transported to a recycler/reprocessor.
3.5 Recycling / Recovery
This stage represents the UK recycling/reprocessing of wood packaging, where it is subject to
a variety of processes including further sorting, shredding, and grading in order for it to be
used as a recyclate feedstock in other products or end markets.
3.6 End Markets
Depending on its quality grade (ranging from good quality Grade A material to poorer quality
contaminated wood which is Grade D [see Appendix V]), wood packaging can be used in
several end markets such as panel board production and animal bedding. The best quality
wood typically will be used in the higher value end markets.
In recent years it has been used increasingly as a recovery feedstock in biomass energy
production, both for the UK and export markets. This creates recovery PRNs over wood
recycling PRNs.

Wood Flow 2020 17
4.0 Obligated Wood Packaging POM in 2014: Net Pack Fill
4.1 Net Pack Fill
This section of the report identifies the total obligated wood packaging POM in the UK in
2014, based on the data stored on NPWD, as reported to the EA by obligated producers.
Obligated producers are those that are above the following threshold: having a turnover of
more than £2 million and handling more than 50 tonnes of packaging per year. The Net Pack
Fill estimate does not include unobligated producers (producers below the threshold and
free-riders).
The 2014 UK flow of obligated wood packaging was calculated using the packaging weights
reported to the EA by registered producers and is publicly available on the NPWD website7.
The calculation used is shown below:
Net
Pack
Fill
=
Packing/Filling table 1 -
pack/filling +
Imports table 3A -
imported for the purpose of selling
+
Imports table 3B - packaging
removed from around imports
-
Exports table 2A + table 2B – pack/filling
This methodology takes the weight reported at the packing stage of the supply chain as
opposed to the selling stage of the supply chain. This was used as it was the view of
stakeholders that there are fewer unobligated packers in comparison to unobligated sellers,
due to the likely size of the businesses8. Using this method, the total obligated wood
packaging POM in 2014 was 1,209k tonnes (as shown in Figure 3).9.
Figure 3 Net Pack Fill Results 2014
Wood Packaging
Table 1 Pack/Fill (UK pack/filling) 858kt
Imports:
3A Selling (filled imports) 206kt
3B (packaging removed from imports) 394kt
Total 1,458kt
2A P/F (direct exports) 240kt
2B P/F (third party exports) 9kt
Total Exported 249kt
Net Pack/Fill 1,209kt
This method does not account for wood packaging that is unobligated or handled by
unregistered producers, which is likely to include the following:
7 https://npwd.environment-agency.gov.uk/ 8 No evidence data is available to support this. 9 At the time of writing, the NPWD figure was considered final and unlikely to change significantly

Wood Flow 2020 18
● Unobligated producers – those below the obligation threshold of £2 million turnover and
handle 50 tonnes of packaging per year;
● Internal use packaging;
● Free-riders and some regulatory loop holes – those obligated to register but not doing so;
and
● Illegal importers10.
Identifying the amount of wood packaging that is not obligated/reported under the
regulations can be difficult to estimate accurately. Therefore, the Net Pack Fill figure was used
as a baseline to sense check the final POM figure.
4.2 Data Verification
In order to confirm levels of confidence in the Net Pack Fill calculation, checks were made
using the data within the producer packaging data (within NPWD) from other parts of the
supply chain. The net calculation was applied to other activity lines: raw material
manufacturing and conversion, in addition to pack/filling11. The aim was to identify the
obligated tonnage at other stages of the supply chain to see how they differ. The results are
shown in Figure 4.
10 Those importing goods illegally 11 See appendix I for further details on activity lines.

Wood Flow 2020 19
Figure 4 ‘Net’ Producer Data Table Calculations 2014
This pattern differs from other materials where the manufacturing and conversion columns
are comparable or higher than the Net Pack Fill figure. A possible reason for this could be
that due to the nature of wood packaging production, producers at the manufacturing stage
may not be aware that their wood products are made into packaging further along the supply
chain. Also, due to the high quantity of re-use pallets in circulation there could potentially be
producers entering these incorrectly into their packaging returns (they should only be
declared when entering the market for the first time). Other potential contributory factors
could be that there are differing levels of de-minimis and/or free-riders at each stage of the
supply chain. It is important to note that this pattern is not peculiar to 2014 for wood, but can
be seen in data from 2009 onwards.
Appendix IX provides a detailed assessment of relative levels of confidence in the data.
0k
200k
400k
600k
800k
1000k
1200k
1400k
Net Raw MaterialManufacturing
Net Conversion Net Pack Fill
NP
WD
Dat
a 2
01
4 (
Ton
ne
s)
Activity
1053k1005k
1209k

Wood Flow 2020 20
5.0 Total Wood Packaging POM in 2014
5.1 Total Wood Packaging POM 2014
In order to identify the total flow of wood packaging POM in the UK, the total UK production
of wood packaging was added to wood packaging imports and then exports were removed.
The methodology used industry data where possible to provide the best coverage of the
supply chain (compared to a Net Pack Fill approach, which only includes obligated tonnage).
Figure 5 provides an overview of the method and the key sources of data used.
Figure 5 Total Wood Packaging POM Calculation 2014
This methodology allowed for each stage of the supply chain to be considered independently
to ensure that the best possible data was used and (where possible) reduce the unobligated
proportion. The data sources used for the UK production stage of the supply chain was from
the manufacture of final packaging products giving the final weight, which ensured no
adjustments were required for process losses.
Using this approach (based on available industry data) meant that the methodology was not
confined to data pertaining to one part of the supply chain such as is the case with Net Pack
Fill.
Each of these data sources will now be discussed in more detail.
5.1.1 UK Wood Packaging Production
The wood packaging industry has been analysed by segment according to the 16240
Manufacture of Wooden Containers Standard Industrial Classification of Economic Activities
(SIC) 2007:
● 16241133 (CN 4415202) - Flat pallets and pallet collars of wood;
Obligated Packaging =
UK Production
Timcon UK PalletProduction Data
+
Prodcom UK Non-palletProduction Data
+
Imports
NPWD table 3A - imported for the purpose of
pack/fillingand selling
+table 3B - packaging
removed from around imports
-
Exports
NPWD table 2A + table 2B – pack/filling
De-minimis = + De-minimis Imports - De-minimis Exports
TOTAL PACKAGING = Total Production + Total Imports - Total Exports

Wood Flow 2020 21
● 16241135 (CN 4415209) - Box pallets and load boards of wood excluding: - flat pallets;
● 16241200 (CN 4416) - Casks, barrels, vats, tubs, and coopers products and parts thereof
of wood INCLUDING: - staves;
● 16241320 (CN 4415101) - Cases, boxes, crates, drums and similar packings of wood
excluding: - cable drums; and
● 16241350 (CN 4415109) - Cable-drums of wood.
Broadly, the industry is divided into two sectors, pallets consisting of 16241133 alone and
non-pallet packaging comprising the other codes.
The two principle data sources used in this report are the Timber Packaging and Pallet
Confederation & Forestry Commission, Wood Packaging Study (henceforth Timcon) and the
Office for National Statistics (ONS), UK Manufacturers' Sales by Product (henceforth
Prodcom). In order to identify the total UK production of wood packaging in 2014, the
following equation was used.
UK Production =
TIMCON
(Pallets) +
PRODCOM
(Non-pallets)
5.1.1.1 Timcon (Pallets)
The Timcon study was produced with the support of the Forestry Commission annually from
2009 to 201312. Although the Timcon studies are entitled “Wood Packaging”, in fact they only
cover pallets. The purpose of the studies was to quantify the manufacture of UK wood
packaging and pallet production (and repair) because of widespread industry concerns that
Prodcom was not accurate for pallets and that the discrepancy was too large to be accounted
for by a sampling error.
Timcon surveyed both their members and the members of the UK Wood Packaging Marking
Program (which it administers for the Forestry Commission). In the case of non-respondents,
the survey data was supplemented by the addition of data from the Timcon membership
database.
Timcon identified that a major problem was the correct classification of pallet repairs and this
has led to a change in the way that ONS has gathered data. A new production heading,
16249999 (refurbished flat pallets and pallet collars of wood), was introduced in 2015 for the
2014 intermediate estimates. However, the project team was not confident that the change
had been completely effective and felt that Timcon is a more reliable source for the pallet
data.
12 Forestry Commission: Wood Packaging Study – Quantification of the Manufacture & Repair of Wood Packaging in the UK
Wood Flow 2020 22
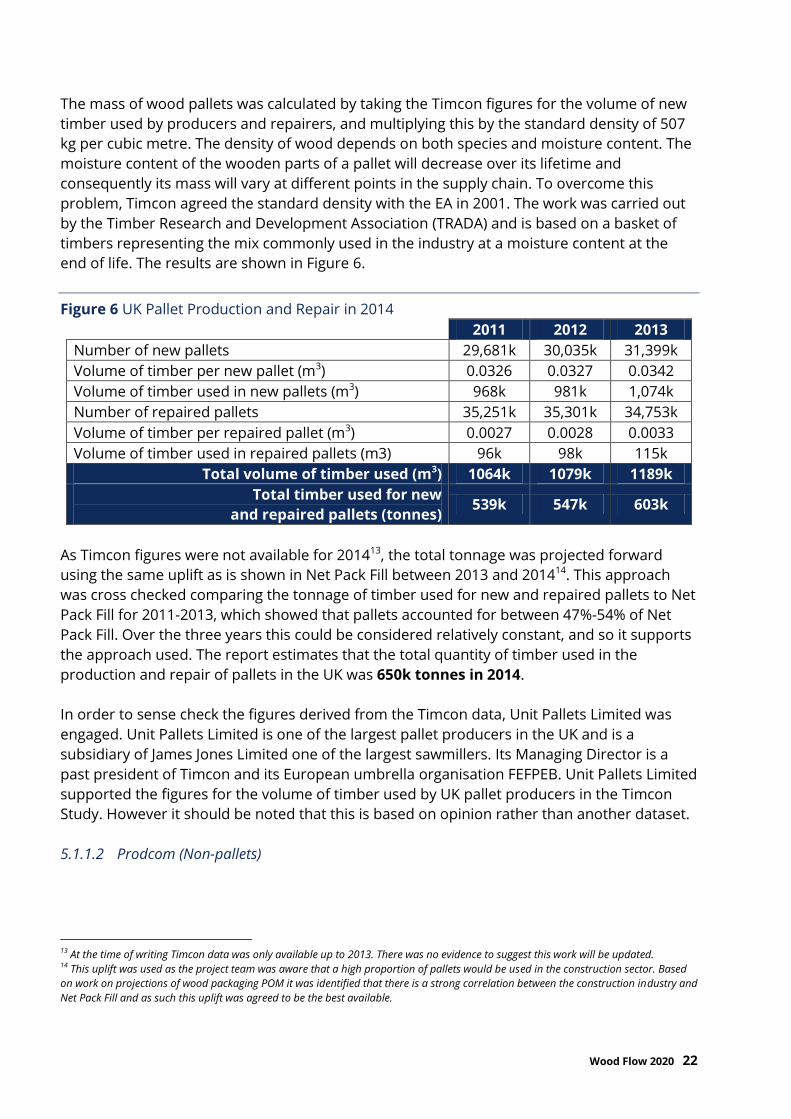
The mass of wood pallets was calculated by taking the Timcon figures for the volume of new
timber used by producers and repairers, and multiplying this by the standard density of 507
kg per cubic metre. The density of wood depends on both species and moisture content. The
moisture content of the wooden parts of a pallet will decrease over its lifetime and
consequently its mass will vary at different points in the supply chain. To overcome this
problem, Timcon agreed the standard density with the EA in 2001. The work was carried out
by the Timber Research and Development Association (TRADA) and is based on a basket of
timbers representing the mix commonly used in the industry at a moisture content at the
end of life. The results are shown in Figure 6.
Figure 6 UK Pallet Production and Repair in 2014
2011 2012 2013
Number of new pallets 29,681k 30,035k 31,399k
Volume of timber per new pallet (m3) 0.0326 0.0327 0.0342
Volume of timber used in new pallets (m3) 968k 981k 1,074k
Number of repaired pallets 35,251k 35,301k 34,753k
Volume of timber per repaired pallet (m3) 0.0027 0.0028 0.0033
Volume of timber used in repaired pallets (m3) 96k 98k 115k
Total volume of timber used (m3) 1064k 1079k 1189k
Total timber used for new
and repaired pallets (tonnes) 539k 547k 603k
As Timcon figures were not available for 201413, the total tonnage was projected forward
using the same uplift as is shown in Net Pack Fill between 2013 and 201414. This approach
was cross checked comparing the tonnage of timber used for new and repaired pallets to Net
Pack Fill for 2011-2013, which showed that pallets accounted for between 47%-54% of Net
Pack Fill. Over the three years this could be considered relatively constant, and so it supports
the approach used. The report estimates that the total quantity of timber used in the
production and repair of pallets in the UK was 650k tonnes in 2014.
In order to sense check the figures derived from the Timcon data, Unit Pallets Limited was
engaged. Unit Pallets Limited is one of the largest pallet producers in the UK and is a
subsidiary of James Jones Limited one of the largest sawmillers. Its Managing Director is a
past president of Timcon and its European umbrella organisation FEFPEB. Unit Pallets Limited
supported the figures for the volume of timber used by UK pallet producers in the Timcon
Study. However it should be noted that this is based on opinion rather than another dataset.
5.1.1.2 Prodcom (Non-pallets)
13 At the time of writing Timcon data was only available up to 2013. There was no evidence to suggest this work will be updated. 14 This uplift was used as the project team was aware that a high proportion of pallets would be used in the construction sector. Based
on work on projections of wood packaging POM it was identified that there is a strong correlation between the construction industry and
Net Pack Fill and as such this uplift was agreed to be the best available.

Wood Flow 2020 23
For wood non-pallet packaging, the only available source of data was Prodcom. The data is
presented in different units and was converted into k tonnes15. The Prodcom data is shown in
Figure 7.
Figure 7 UK Non-pallet Production 2014
2013 2014
16241135 (CN 4415209) - Box pallets and load boards of wood
EXCLUDING: - flat pallets 61k 58k
16241200 (CN 4416) - Casks, barrels, vats, tubs, and coopers
products and parts thereof of wood INCLUDING: - staves 6k 6k
16241320 (CN 4415101) - Cases, boxes, crates, drums and similar
packings of wood EXCLUDING: - cable drums 159k 157k
16241350 (CN 4415109) - Cable-drums of wood 7k 7k
Total Non-pallet Packaging (Incl. nails) 232k16 228k
Total Non-pallet Packaging (Excl. nails) 227k 223k
It was identified that the Prodcom data would also include the weight of non-wood fasteners.
Therefore, the total non-pallet figure was adjusted down to remove the weight of fasteners17.
Data for earlier years was extracted from Prodcom,however, estimates of cases, boxes,
crates, drums and similar were not felt to be consistent. As such, the project team believed
(for reasons identified above) that Prodcom had improved the data in recent years. This was
demonstrated by ONS upgrading its assessment of the quality of its estimate for 16241320
between the preliminary and intermediate estimates. There is no alternative to Prodcom for
non-pallet packaging data. The Prodcom Quality and Methodology Information Report (QMI)
provides details of its data collection methods and robustness18.
5.1.1.3 Total UK Wood Packaging Production 2014
Figure 8 shows that there were 873k tonnes of wood packaging produced in the UK in 2014.
15
The mass of wood packaging was calculated for the different SIC codes as follows:
16241135 – The Prodcom volume unit is Number of Items. This is converted to mass by assuming that there is on average twice as much
wood in a box pallet as a conventional timber pallet and using the Timcon average volume of timber per pallet together with the
standard density of 507kg per cubic metre.
16241200 – The Prodcom volume unit is kilograms but is suppressed for 2013. The average of the 3 preceding years is substituted
(Approx. 6k tonnes).
16241320 – The Prodcom unit is kilograms.
16241350 – There is no Prodcom volume unit. The value of sales is converted to tonnage of wood by assuming an average price of £150
per cable drum and that each drum contains 50kg of wood. 16 Do not add up due to rounding 17 Internal industry data shows that fastenings represent no more than 2.3% of the weight of a finished pallet. No data was available for
fastenings within non-pallet wooden packaging and therefore it was assumed that the degree of fastenings between pallets and non-
pallets was the same. 18 http://webarchive.nationalarchives.gov.uk/20160105160709/http:/www.ons.gov.uk/ons/guide-method/method-quality/quality/quality-
information/business-and-energy/quality-and-methodology-information-for-uk-manufacturers--sales-by-product--prodcom-.pdf

Wood Flow 2020 24
Figure 8 Total UK Wood Packaging Production 2014
2014
(Tonnes)
Pallets New Pallets & Pallet Repair 650k
TOTAL 650k
Non-pallets Box pallets and load boards of wood excluding: - flat
pallets 58k
Casks, barrels, vats, tubs, and coopers products and parts
thereof of wood including: - staves 6k
Cases, boxes, crates, drums and similar packings of wood
excluding: - cable drums 157k
Cable-drums of wood 7k
Total Non-pallet Packaging (Incl. nails) 228k
TOTAL (Excl. nails) 223k
TOTAL 873k
The above figure was sense checked against the NPWD Table 1 conversion figure of 528k
tonnes. Table 1 conversion records the obligated wood that is made into packaging that will
be supplied to be packed either in the UK or abroad. The tonnage includes UK sourced and
imported wood (any imported wood for conversion should also have been recorded in Table
3a conversion). As there was a significant gap (345k tonnes), this was investigated further to
determine whether this gap could be attributed to de-minimis, free-riders or inaccuracies
with data. This work identified that there was a significant number of organisations of a
sufficient size by turnover and core business activity that potentially should be registered as
producers and listed on the EA NPWD that at the time of writing were not. Details of this work
are included in Appendix IV. This indicates that the gap between the UK Wood Packaging
Production 2014 figure and the NPWD Table 1 conversion figure is made up of de-minimis
companies and free-riders. The identified free-riders should be investigated further to
confirm if they should be registered as obligated producers.
The UK wood packaging production 2014 figure was also sense checked against the Forestry
Commission’s Annual Forestry Statistics for the sawmill sector19. This identified that the total
tonnage of wood used in wood packaging put on the market by domestic sawmill producers
from 2012 to 2014 was only 4% less than the Timcon/PRODCOM estimate. CONFOR20 is a
membership organisation of sawmills and other forestry based businesses; it has confirmed
that the Forestry Commission statistics are a reliable source of information about the UK
sawmilling sector.
19 www.forestry.gov.uk/forestry/infd-7zhk85 20 http://www.confor.org.uk/?pid=1

Wood Flow 2020 25
5.1.1.4 Limitations of the Data
Wood Packaging (Non-pallet)
The wood packaging non-pallet industry is highly fragmented with specialist companies and
in-house activity within the despatch functions of manufacturing businesses. The only source
of data is the Prodcom survey, which provides data by volume. A number of assumptions
must be made because of inconsistent volume units in Prodcom. At every stage efforts were
made to confirm these assumptions with industry experts. There is no alternative data
source available for sense checking other than the overall check against the Sawmill Survey
explained below.
Pallets
For pallets there are two data sources available - Prodcom and Timcon. Due to a lack of
confidence in Prodcom data (explained above) Timcon data was used. There are limitations
inherent to any survey. However, the Timcon questionnaires were directed to executives
within the member companies who had a good knowledge of the detail of their business
activities and as such it is believed that the responses were reasonably accurate. Inaccuracies
in the pallet data might arise because the estimate does not measure mass directly but uses
the volume of timber supplied and multiplies it by the standard density. In its last report,
Timcon estimated that 81% of pallets are made from fresh sawn timber and are supplied to
the market wet. A pallet made from fresh wood from the sawmill could lose 25% to 50% of its
mass after it has dried out from being in use for a few months. The standard density (agreed
by the EA) is used within the raw material and conversion sectors of the packaging supply
chain. However, it is not known if to what extent it is adopted further along the supply chain.
Sawmill Survey
As a sense check of the total volume of timber used by the two segments combined, the
Forestry Commission annual sawmill survey, as recommended by CONFOR, was used. This
estimates the volume of sawn wood produced and the percentage supplied to the packaging
and pallets sectors. By combining this with the Timcon estimate of percentage of domestic
supply, the total volume supplied can be calculated, and, applying the standard density, the
mass. This methodology gives an average of 768k tonnes compared with 800k tonnes for
Timcon/Prodcom in the years 2012 to 2014. The difference may be because the Timcon
domestic percentage was based on pallet production and the packaging trade will
traditionally use more imported timber.
5.1.2 Imports
This section identifies imports by obligated producers as well as imports by unobligated
organisations.
5.1.2.1 Obligated Imports

Wood Flow 2020 26
The NPWD holds data on wood packaging for obligated producers that is entering the UK,
which is not covered by Timcon or PRODCOM data. The data was selected from the 2015
NPWD data, which is reporting the packaging handled by obligated producers in 2014. The
data in Table 3a packing/filling (imported empty packaging that remains in the UK) was
selected to capture imported empty packaging.
Table 3a selling (packed goods imported for onward selling in the UK) and Table 3b
(packaging discarded from direct imports) combined were then added to the imported empty
packaging. Table 3a selling and Table 3b provide the amount of wood packaging that
contains/holds goods when brought into the UK by obligated producers.
Figure 9 Obligated Imports of Wood Packaging
2015 NPWD Data (2014 Actual Data) Imports
(Tonnes)
Table 3a packing/filling (imported empty packaging that
remains in the UK)
11k
Table 3a selling (packed goods imported for onward
selling in the UK)
206k
Table 3b (packaging discarded from direct imports) 394k
TOTAL 611k
5.1.2.2 De-minimis Imports
NPWD was used for imports/exports data for obligated producers; however, the
imports/exports of the smaller wood packaging producers that are below the obligated
threshold needed to be identified.
In order to do this, several datasets were reviewed and the ONS was contacted to understand
what data was available to identify the imports of goods by size of organisation. Following
this exercise, HMRC UK TradeInfo data was used21, which breaks down the quantity of goods
imported /exported by:
● Industry sector;
● Size of business (by number of employees); and
● Value of goods.
The first stage was to cleanse the list of industry sectors to remove those that were not likely
to use wood packaging. This was conducted by a specialist consultant with extensive
knowledge of the wood packaging industry.
21 https://www.uktradeinfo.com/Statistics/NonEUOverseasTrade/AboutOverseastradeStatistics/Pages/PoliciesandMethodologies.aspx

Wood Flow 2020 27
The second stage was to identify which size of organisations were most likely to be under the
obligated threshold. In order to do this, internal Valpak data was reviewed to examine the
size of obligated businesses based on their number of employees and turnover. This
identified that the majority of businesses that are obligated22 have 50 employees or more.
Based on this evidence, and in the absence of more precise data, a 50 employee threshold
was used as a proxy for identifying obligated and unobligated businesses. Organisations with
50 employees or more were considered obligated. As a sense check, the number of
registered producers that handle wood packaging was compared to the number of
businesses in the HMRC UK TradeInfo, which is broadly supportive of the methodology (see
Appendix VIII).
Due to a lack of publicly available data to further cross-check this finding, a sensitivity analysis
was conducted to establish the impact on total flow if this employee number cut-off was
lower or higher. Details of this analysis can be found in Appendix VIII.
Once this was done, the value of total goods imported/exported by each group by size was
combined to give a ratio of imports/exports by small and large organisations as shown in
Figure 10. It should be noted that this uses turnover as a proxy for tonnage due to a lack of
other more appropriate data.
Figure 10 UK Import / Export Ratios by Size of Organisation by Value
2014 Imports Exports
Trade by small organisations 15.4% 12.5%
Trade by large organisations 84.6% 87.5%
Once the ratio of imports/exports by small and large organisations was identified, this was
applied to the obligated imports to give the figure for the de-minimis imports as shown in
Figure 11. The number of free-rider importing companies (those who are obligated but not
currently registered) is likely to be significantly smaller than the UK production as wood
packaging only makes up part of the packaging brought into the UK. It is also possible that
some may be using leasing pools for pallets in particular, which will have already been
included in the data above. Appendix VIII provides a sensitivity analysis for de-minimis
imports and exports.
Figure 11 Wood Packaging Imported by Small Organisations (De-minimis)
2014 Imports
(Tonnes)
Wood packaging imported by small organisations 111k
22 Obligated producers are those that have a turnover of more than £2 million per year and handle more than 50 tonnes of packaging
per year

Wood Flow 2020 28
5.1.3 Exports
This section identifies exports from obligated producers as well as exports from de-minimis
organisations.
5.1.3.1 Obligated Exports
NPWD holds robust data on wood packaging (for obligated producers) that is leaving the UK.
The data was selected from the 2015 NPWD data, which is reporting the packaging handled
by obligated producers in 2014.
To cover the largest and most accurate selection of wood packaging leaving the UK, Table 2a
packing/filling (direct exports) and Table 2b packing/filling (third party exports) were selected.
This is packaging that obligated producers add to their products before exporting to
customers abroad, or sending to a UK customer that will ultimately export.
There was a large difference between the tonnage of wood packaging exported in the
conversion stage compared to the packing/filling stage. Analysis of Valpak’s compliance
scheme members showed that exported empty packaging was small at the conversion stage
and therefore the packing/filling stage is more representative of wood packaging that is
exported. There was also concern that to include conversion and packing/filling data would
lead to duplication of data in the calculation due to the way packaging is reported in NPWD,
as producers are required to fill in Table 2a conversion and packing/filling when performing
both activities in the supply chain.
To further investigate exported empty wood packaging, the HMRC UK TradeInfo23 database
was used. This was filtered to identify wood packaging which would be exported empty24.
This identified that there were potentially 3k tonnes of empty wood packaging exported.
However, the database does not distinguish between new and re-use items, and, as such, due
to the small quantity and limitations to the database (not able to identify the quantity of new
packaging), the new wood packaging which is exported empty was considered negligible.
Figure 12 Obligated Exports of Wood Packaging
2015 NPWD Data (2014 Actual Data) Exports
(Tonnes)
Table 2a packing/filling (direct exports) 240k
Table 2b packing/filling (third party exports) 9k
TOTAL 249k
23 https://www.uktradeinfo.com/Statistics/BuildYourOwnTables/Pages/Table.aspx 24 SITC 635.11 - Packing cases, boxes, crates, drums and similar packings, of wood; cable-drums of wood. SITC 635.20 –Casks,
barrels, vats, tubs and other coopers products and parts thereof of wood (including staves).

Wood Flow 2020 29
5.1.3.2 De-minimis Exports
Using the same methodology described in Section 5.1.2.2., once the ratio of exports by small
and large organisations was identified, this was applied to the obligated exports to give the
figure for the de-minimis exports as shown in Figure 13.
Figure 13 Wood Packaging Imported by Small Organisations (De-minimis)
2014 Exports
(Tonnes)
Wood packaging exported by small organisations 36k
Due to the requirement to factor up from obligated data for imports and exports to estimate
de-minimis figures for both, there are limitations in determining the accuracy of these
estimates. This is compounded by the fact that the scaling factor used was not specific to
wood packaging. Appendix VIII provides a sensitivity analysis of scaling up factors to identify
the overall impact on POM.
5.1.4 Total Wood Packaging POM 2014
Figure 14 below shows the methodology used for calculating the total quantity of wood
packaging POM in 2014.
Figure 14 Total UK Wood Packaging Production 2014
*Does not add due to rounding
This shows that there was a total of 1,310k tonnes of wood packaging POM in 2014.
Obligated Packaging =
UK Production
Timcon UK PalletProduction Data
(650kT)
+
Prodcom UK Non-palletProduction Data
(223kT)
+
Imports
table 3A - imported for the purpose of pack/filling
and selling+
table 3B - packaging removed from around
imports
(611kT)
-
Exports
table 2A + table 2B –pack/filling
(249kT)
De-minimis = +De-minimis Imports
(111kT)-
De-minimis Exports
(36kT)
TOTAL PACKAGING
1,310kT
= Total Production
873kT+ Total Imports
721kT*- Total Exports
284kt

Wood Flow 2020 30
5.1.5 Format of Total Wood Packaging POM 2014
Figure 15 shows final project estimate of wood packaging POM in 2014, by format. This
highlights that flat pallets account for the largest proportion of wood packaging POM at 73%.
This estimate has been derived from a combination of sources including Timcon and
Prodcom to cover packaging supplied to business as well as Valpak’s EPIC database relating
to retail primary packaging supplied to consumers in the UK. The packaging formats for
Prodcom and EPIC are based on data for 2014, and as detailed in section 5.1.1.1. Timcon data
is factored up from 2013 based on the same uplift experienced in Net Pack Fill from 2013 to
2014.
Figure 15 Total Wood Packaging POM by Format in 2014
5.1.6 Consumer and Non-consumer Proportion of Total POM 2014
The total wood packaging POM 2014 can also be broken down by:
● Consumer; and
● Non-consumer.
The methodology and results of this work are discussed in more detail below.
5.1.6.1 Consumer
Grocery retail
958kt, 73%
91kt, 7%
13kt, 1%
245kt, 19% 3kt, 0.3%
Packaging Format Breakdown
Flat pallets
Box pallets & loadboards
Casks, barrels, vats,tubs, & coopersproducts
Cases, boxes, crates, &drums

Wood Flow 2020 31
In order to estimate the amount of packaging POM by the grocery retail market, EA
aggregated data was used for all major grocery retailers. This estimate uses wood packaging
quantities reported by NPWD in Table 1 selling (i.e. supplying packaging to the end-user). This
provides a wood packaging figure for all relevant products packaged in wood by obligated
grocery retailers in the UK which are supplied to consumers.
Using volume market share information from Kantar World Panel for these obligated grocery
retailers (i.e. supermarkets), the resulting quantity of wood packaging was scaled up to
represent an estimate for the total UK grocery retail market. An assumption has been made
that the wood packaging profile of these supermarkets is representative of those not
included. It is the opinion of the project team that wood packaging use is similar in
supermarkets that are not included in this dataset, due to the limited wood packaging
formats used in this sector. The wood packaging in the grocery retail sector was estimated to
be 275 tonnes in 2014.
This estimate was cross referenced with Valpak’s EPIC25 data (annual sales and packaging
weights for all relevant products packaged in wood) for a selection of Valpak’s supermarket
clients representing a cross-section of grocery retailers in the UK. This shows that NPWD was
179 tonnes (65%) higher than EPIC data. Since wood packaging for the grocery sector is small
in comparison to the total POM figure, NPWD data was used as it has the larger market
share26.
As the project team was able to view Valpak-held data and interrogate it on a product level27,
for the purpose of the grocery sector analysis, this was used to identify the format of grocery
retail packaging28. Details of this are provided in Appendix II.
Appendix IX provides a detailed assessment of relative levels of confidence in the data.
Total retail (including non-grocery)
To scale up the grocery retail result to represent total UK retail, including non-grocery retail,
retail sales data as reported by the ONS for 2014 was used. This shows that the proportion of
grocery spend of total UK retail spend was 45.5% in 2014.29
25 The database is based on information collected direct from suppliers as well as information sourced internally, meaning that it holds
a wide coverage of information across multiple product ranges. Product specific data collection is completed through site visits, supplier
mailings and weighing in-house (purchasing product and collecting used product from staff). All data goes through a comprehensive
checking process on receipt and is stored in Valpak’s bespoke software Environmental Product Information Centre (EPIC). Over 800,000
supermarket products are recorded in EPIC. 26 Valpak data was used for other materials flow projects because it provides increased granularity, however for other materials the
difference in tonnage was less significant in terms of percentage. For wood, because the percentage difference is greater, and the
consumer proportion of total POM is very small, it’s less important to see the granularity therefore NPWD data has been used. 27 Due to increased granularity and visibility, as well as the known inclusion of non-grocery items sold by grocery retailers in the data
reported to the EA. 28 NPWD is the only place where all reported obligated producer data can be viewed, so when looking at the UK in its entirety NPWD can
be used. In the case of consumer data, it is possible for Valpak to see specific customers’ product and sales data, and scale up using
market share, therefore Valpak held data is used. 29 http://www.ons.gov.uk/ons/publications/re-reference-tables.html?edition=tcm%3A77-324908

Wood Flow 2020 32
However, simply scaling up by market share was not considered robust, since it was likely
that packaging usage within both sub-sectors differed. Therefore, this difference in wood
packaging used by the grocery sector and other retail sectors was analysed using data
reported by Valpak members30. Analysis involved the following key stages:
● Identification of grocery and non-grocery retail members; and
● Gathering of company reported data and information.
The method used assumed the packaging profile of those retailers within the sample is
representative of those not in the sample.
Therefore, the following data/key steps were used to estimate total retail wood packaging
consumption in the consumer (retail) sector in 2014:
● Total grocery wood packaging flow in 2014 was 275 tonnes (see section 5.1.6.1);
● The proportion of grocery spend of the total retail spend in the UK was 45.5% in 201431;
● Total retail wood packaging flow, assuming like for like packaging was 604 tonnes;
● In order to take account of the difference in wood packaging supplied in the non-grocery
retail sector, the amount of wood packaging per £bn turnover was calculated;
● Non-grocery wood packaging tonnes/£bn turnover is 47 times greater than grocery wood
packaging tonnes/£bn turnover32 (this is as expected due to non-grocery covering DIY and
furniture retailers, as well as garden centres) and
● Accounting for the difference in tonnes/£bn turnover between grocery (275 tonnes) and
non-grocery (15.5k tonnes) the total retail wood packaging flow in 2014 was 16k
tonnes.
To allow for a targeted approach when analysing implications of flow on recycling, this
estimate has been broken down into formats. For consumer packaging this was derived by
analysing data within the Valpak EPIC database for grocery and non-grocery retailers. Figure
16 shows the breakdown of formats.
Figure 16 Consumer Packaging by Format
Wood Packaging
Format
%
Consumer
Boxes 63
Cases 13
Trays 2
Other 22
TOTAL Consumer 100
30 Valpak membership represents approximately 46% of all obligated companies, by obligation. The entire NPWD database was
considered for analysis; however, for confidentiality reasons it was not possible to gain access to NPWD to conduct the same analysis on
the complete dataset. 31 http://www.ons.gov.uk/ons/publications/re-reference-tables.html?edition=tcm%3A77-324908 32 Appendix III provides results of sensitivity analysis on this result. The result was deemed reasonable by stakeholders.

Wood Flow 2020 33
Appendix IX provides a detailed assessment of relative levels of confidence in the data.
5.1.6.2 Non-consumer
In order to identify the quantity of non-consumer wooden packaging, the consumer estimate
in section 5.1.6.1 (16k tonnes) is taken away from the total estimate (1,310k tonnes). This
shows that there was an estimated 1,294k tonnes of non-consumer wood packaging flowing
on to the UK market in 2014. This means that non-consumer wood accounted for 99% of the
total wood packaging flowing onto the UK market.
To break down the non-consumer packaging by format, the data was initially separated into
pallets and non-pallets. The Prodcom database then allowed for a further breakdown of non-
pallet packaging. Figure 17 shows the breakdown of non-consumer wood packaging POM in
2014.
Figure 17 Non-consumer Packaging by Format
Wood Packaging
Format
%
Non-Consumer
Flat pallets 74
Box pallets & load boards 7
Cases, boxes, crates, & drums 18
Casks, barrels, vats, tubs, & coopers products 1
TOTAL Non-Consumer 100
Appendix IX provides a detailed assessment of relative levels of confidence in the data.

Wood Flow 2020 34
6.0 Results: Final Project Estimate of Wood Packaging POM in 2014
The final project estimate for wood packaging POM in 2014 is 1,310k tonnes.
The final wood packaging POM figure is made up of a combination of published data sources
and internal Valpak data.
Figure 18 Final Project Estimates of Wood POM in 2014
Total
(k tonnes)
Grocery Retail –
Non-grocery Retail 16
Total Consumer 16
Non-consumer 1,294
Total Non-consumer 1,294
TOTAL POM 1,310
Elements of the final project estimate of 1,310k tonnes POM have been verified using a
combination of sources such as Timcon, Confor and Unit Pallets Ltd/Federation of European
Manufacturers of Wooden Pallets & Packaging (FEFPEB), and wider Valpak data.
The reported obligated flow of wood packaging and the project estimated flow (Wood Flow)
of wood packaging are shown in Figure 19 alongside Defra’s flow estimate at the time of
writing as well as Net Pack Fill (obligated flow).

Wood Flow 2020 35
Figure 19 Reported Obligated Flow and Project Final Estimate of POM for 2014
It is important to stress that the Net Pack Fill estimates are themselves open to the possibility
of error because they rely on the robustness of the data that is submitted to NPWD. The data
does not include companies that should be obligated and are not registered in the system.
This is likely to include companies that manufacture wood packaging and companies that
import goods in wood packaging. However, the NPWD data is widely recognised as being the
best available for total obligated POM as there is a legal obligation for companies to submit
data that is as accurate as reasonably possible. This data is then audited by the regulatory
body and is used by policy makers and their agencies.
The project has estimated the de-minimis tonnage of imported wood packaging; however, it
would be difficult to estimate the number of importer free riders and who they might be (as
was done for UK producers, see appendix IV), because this could potentially be any company
bringing goods into the UK from abroad.
The final project estimate for wood packaging POM in the consumer sector is 16k
tonnes
This estimate is taken from primary data alongside reliable market share data. No other
method was used for deriving consumer data as this method is considered the most robust
available, and was accepted by the Steering Group.
The final project estimate for wood packaging POM in the non-consumer sector is
1,294k tonnes
0k
200k
400k
600k
800k
1000k
1200k
1400k
Net Pack Fill Defra Flow Wood Flow
PO
M (
20
14
)
POM Calculation Method
1310k
1034k
1209k

Wood Flow 2020 36
This estimate is taken from a combination of secondary data sources for UK wooden pallet
production, non-pallet production and imports/exports.
Unobligated tonnage was 8% of total POM
The final project estimate was found to be 101k tonnes higher than data reported by
obligated companies under the Packaging Waste Regulations (using the UK Net Pack Fill
calculation method). This suggests that unobligated companies or tonnage (relating to the
regulation thresholds and packaging definitions) or unregistered tonnage through free-riding,
account for 101k tonnes (8%) of wood packaging in the UK.
Unobligated tonnage for wood packaging relatively low compared to other materials
Figure 20 illustrates the obligated versus unobligated flow for all reported materials using the
Net Pack Fill calculation (for obligated tonnage). All materials have undergone recent flow
analysis. Although each packaging type is characterised by different market structures, the
project results highlight that unobligated flow for wood is relatively low compared to other
packaging materials, but is comparable with steel, estimated at 9%33. This is consistent with
stakeholder views that wood packaging, in particular pallets, will be produced in large scale
facilities (and more likely to be obligated), with the more specialist bespoke non-pallet
packaging being manufactured by smaller producers.
33 The project stakeholders accepted this conclusion. The project team has made some suggestions as an explanation for the
unobligated proportion, however exactly where unobligated is made up is not possible to verify.

Wood Flow 2020 37
Figure 20 Obligated Versus Unobligated POM for Packaging Materials
Pallets are the dominant format of wood packaging POM
The final project estimate of wood packaging POM by type is flat pallets 958k tonnes (73%),
cases, boxes, crates and drums 245k tonnes (19%), box pallets and load boards 91k tonnes
(7%), casks/barrels/vats/tubs and coopers products 13k tonnes (1%), and other packaging 3k
tonnes (0.3%).
This estimate has been derived from a combination of sources including Timcon, Prodcom
and Valpak’s EPIC database.
-
500,000
1,000,000
1,500,000
2,000,000
2,500,000
3,000,000
3,500,000
4,000,000
4,500,000
5,000,000
Aluminium Glass Paper andCard
Plastic Steel Wood
Ton
ne
s P
OM
Obligated Flow Unobligated Flow
17%
9%
8%
1%
14%
21%

Wood Flow 2020 38
7.0 Recycling of Wood Packaging in 2014
7.1 Introduction
This section of the report examines the levels of wood packaging waste collected and
recycled/reprocessed within the UK or exported. The collections are split between local
authorities (LAs) and commercial and industrial (C&I) collections. As with previous flow
projects, the levels of collections have been assumed to be equivalent to the levels of
recycling; the data on LA recyclate collections is taken from Waste Data Flow (WDF)34 and is
used as a proxy for household recycling, and the number of PRNs being raised (reported on
NPWD) for the total accredited UK recycling. However, these figures do not account for
unaccredited recycling35, and, similar to previous flow reports, a separate analysis on this
element of recycling has been provided.
7.2 Collections
When wood packaging is collected by LAs and private collectors on behalf of LAs, it is
generally collected from:
● Kerbside;
● Bring sites; and
● Household waste recycling centres (HWRCs) or civic amenity (CA) sites.
This data is submitted by the LAs to WDF. The C&I collections of wood are usually carried out
by private waste management companies or wood recyclers.
7.2.1 Local Authority Collections
LA collections of wood packaging in the UK can be represented as follows:
Total UK Wood
Packaging Collected
by Local Authorities
= Kerbside
Collection36 +
Bring Site
Collection +
HWRC/CA Site
Collection
This data was extracted from WDF, and figures reported are for the financial year 2013/14.
This means there is some degree of inconsistency between the collection figures for April
2013 - March 2014 and the consumption figures for January 2014 - December 201437.
34 It should be noted that WDF is based on the collection of data from all LAs in the UK and as such due to the number of those reporting
data that there is the risk of inconsistencies in the way LAs interpret the questionnaire and / or report data. However it was used as it
was considered the best available dataset at the time of writing for LA collected wood. 35 That which is recycled or exported for recycling by a company that is not accredited / registered with the Environment Agency to raise
PRNs / PERNs on packaging reprocessed / exported. 36 Kerbside collections refer to LA(or a waste management company on behalf of a LA) collections from households 37 At the time of writing 2013/14 was the most recent full set of WDF data available.

Wood Flow 2020 39
It should also be noted that wood data that is reported in WDF refers to all wood waste and
does not separately report wood that is packaging. In order to investigate the proportion of
wood packaging that is collected in LA wood collections, Albion Environmental was engaged.
It has a strong track record of waste composition analysis and regularly works with LAs. It
estimated that of all the wood collected by LAs, less than 1% will be packaging38. This is
supported by waste compositional analysis of mixed waste collected by LAs published by
Defra in 200939, which concluded that 4% of all LA collected waste (at kerbside, HWRC’s and
bring sites) is estimated to be wood, of which only 1.48% is untreated wood and is therefore
likely to include an element of packaging wood waste.
A summary of the UK LA wood packaging collections is shown in Figure 21.
Figure 21 Wood WDF data 2013/14
Kerbside Bring HWRC/CA TOTAL
UK Total LA
WOOD Collected 5kt 1kt 737kt 744kt
UK Total LA
WOOD PACKAGING
Collected
0kt 0kt 7kt 7kt
As shown above, 744k tonnes of wood is reported on WDF by LAs as collected, of which it is
estimated 7k tonnes is wood packaging.
The majority of wood packaging collected by LAs is collected at HWRC/CA sites. However,
some may be collected at kerbside, although this is likely to be part of bulky item collections.
7.2.2 C&I Collections
C&I collections were estimated as follows:
Total UK Wood
Packaging Recycled -
Local Authority
Collections =
Commercial &
Industrial
Recycled
The total volume of materials recycled is taken from NPWD40. LA collection tonnages (used as
a proxy for recycling) are taken from WDF as described in 7.2.1. C&I recycling tonnages are
calculated from the total quantity recycled minus the estimate for local authority collections.
The estimate for C&I recycling is shown in Figure 2241.42
38 E-mail correspondence received (4th February 2016 and 15th February 2016) from Albion Environmental estimating wood packaging
within LA collections will be less than 1% by weight. 39 http://randd.defra.gov.uk/Default.aspx?Menu=Menu&Module=More&Location=None&Completed=1&ProjectID=15133 40 http://npwd.environment-agency.gov.uk/Public/PublicSummaryData.aspx 41 There is a time difference between the NPWD figures (calendar year 2014) and the LA figures (2013/14 financial year); however, this
was the best available data.

Wood Flow 2020 40
The NPWD figure only covers obligated waste recycled by accredited reprocessors/exporters,
and does not include tonnages recycled without a PRN/PERN being generated. Section 7.5
provides information regarding unaccredited reprocessing.
Figure 22 C&I Wood Collections
Wood NPWD data (2014) 412kt
Wood Packaging LA Collections (2013/14) minus7kt
Wood C&I Recycling 404kt
Based on the data reported in Figure 22 and the conclusions around consumer and non-
consumer wood packaging POM made earlier in the report, it is possible to estimate that 48%
of consumer wood packaging and 31% of non-consumer wood packaging was recycled in
2014.
7.3 Recycling of Wood Packaging
This section of the report examines the level of wood packaging recycling within the UK and
that which is exported. This is different from the material that is collected because it
specifically examines the material that is successfully reprocessed. Reprocessing is where the
process results in the creation of a new product from recovered wood packaging material.
In order to calculate the level of wood reprocessing that is taking place, the reprocessing
activity was split into two categories:
● Accredited recycling; and
● Unaccredited recycling.
The accredited reprocessing was estimated from NPWD data using the quantity of PRNs (UK
reprocessing) and PERNs (exported for reprocessing) issued.
7.4 Accredited Recycling
42
It is important to highlight that what is collected for recycling is not equal to that which is ultimately recycled.
The WDF collection figures will not equal the amount recycled, as many LAs do not robustly account for material
rejected by the MRF during the sorting process. Therefore, for simplicity, by assuming that the total collected for
recycling equals the total actually recycled, this calculation distorts the representation of contamination and non-
target material, accounting for them all upfront (in this case, by default, within the C&I collections estimate). This
means that C&I collections as reported here are implicitly underestimated by the combined, unknown level of
contamination and non-target material.

Wood Flow 2020 41
Accredited recycling and recovery is undertaken at a reprocessor whose activities are eligible
for the organisation to register as an accredited reprocessor and issue Packaging Recovery
Notes (PRNs).
Eligible markets for recycling and recovery of wood packaging include:
● Manufacture of wood board, for example, chipboard or orientated strand board (OSB);
● Decorative woodchip;
● Utility chip (including that used in riding arenas etc., and as a biomass fuel); and
● Animal bedding.
There may also be an element of packaging waste (including wood packaging) in mixed
municipal waste which is combusted in energy recovery facilities. This material is also eligible
for recovery PRNs:
● Energy recovery from packaging waste burnt in a municipal waste incinerator where the
energy efficiency meets the requirement of the R1 specification (i.e. with an energy
efficiency of 0.6 or above applies to installations permitted before 1 January 2009; for
installations permitted after 31 December 2008 the energy efficiency is 0.65 or above).
Recovery PRNs can be issued for 19% of the waste unless the operator of the incinerator
proposes an alternative sampling method in the accreditation application to demonstrate the
packaging content of these waste streams.
The total quantity of accredited wood packaging recycled (reprocessed in the UK or exported
by accredited exporters) from 2000 to 2014 is shown in Figure 2343.
43 http://npwd.environment-agency.gov.uk/Public/PublicSummaryData.aspx

Wood Flow 2020 42
Figure 23 Total Accredited Wood Packaging Recycling/Exports
The quantity of accredited wood packaging recycling has followed two trends. It increased
from 2000 up to 2008 when it reached 940k tonnes; it then started to decrease and in 2014
412k tonnes were recycled. It is thought that the decrease from 2009 is due to an increase in
wood packaging being used in end markets such as biomass (which is classified as recovery
rather than recycling) and the fall in the number of accredited reprocessors44. At the time of
reporting there are no biomass facilities listed as registered reprocessors with any UK
regulatory body45.
The project team believes that significantly higher quantities of wood packagingare being
recycled or recovered but this is taking place without any recycling or recovery evidence
being issued and as such is considered unaccredited. Section 7.5 discusses this in more
detail.
7.5 Unaccredited Recycling
This section presents analysis to determine the quantity of packaging wood waste recovered
for recycling and used in different end markets, in order to identify how much unaccredited
recycling occurred in 2014. This involved a two-step process:
44 Discussions with Wood Recyclers Association (WRA) on 11/12/2015 and Wood Panel Industries Federation (WPIF) on 07/12/2015 45 Biomass could become accredited; however the regulatory body would consider each application on a case by case basis. The
accreditation would depend on the information provided within the Sampling and Inspection Plan and there would need to be a site
specific protocol formulated to identify the wood packaging content, as the content of biomass can contain a wide array of materials:
virgin wood, energy crops, agricultural residues, food waste, industrial waste and co-products from manufacturing and industrial
processes.
0k
100k
200k
300k
400k
500k
600k
700k
800k
900k
1000k
2000 2001 2002 2003 2004 2005 2006 2007 2008 2009 2010 2011 2012 2013 2014
Ton
ne
s /
Ye
ar

Wood Flow 2020 43
1. Determining current markets for wood waste; and
2. Determining the quantity of packaging waste wood utilised by each market.
There is no fully inclusive and comprehensive source of waste wood statistics for the UK that
includes up-to-date and accurate data on waste wood arisings and markets. This is
complicated by the fact that a significant quantity of wood waste does not go to final disposal,
but instead goes directly to re-use, recycling or recovery. The most recent published reports
on waste wood markets include:
● An assessment of the environmental impact of the management options for wood waste,
AEA, published by Defra, 2012;
● The business case for wood waste collection hubs, WRAP, 2012;
● 2011 Briefing Report – The UK Waste Wood Market, Tolvik Consulting, 2011;
● Realising the value of recovered wood – Market Situation Report, Pöyry Forest Industry
Consulting Ltd, published by WRAP, 2011;
● Annual Data on Wood Recycling – 2011 Market Statistics, Wood Recyclers Association
(WRA), 2011;
● Impact Assessment of a Quality Protocol for Waste Wood, Environment Agency, 2011; and
● Wood Waste Market in the UK, Pöyry Forest Industry Consulting Ltd & Oxford Economics
Ltd, published by WRAP, 2009.
These data sources were reviewed, and the information drawn from them updated using
information on current markets for wood waste from the Wood Recyclers Association and the
Wood Panel Industries Federation. Major end markets for waste wood include:
● Panel board manufacture;
● Biomass energy generation; and
● Animal bedding.
Other markets include products where the wood will eventually degrade, i.e. mulches or
composting.
To understand how wood waste packaging may be used in different markets, it is first
necessary to understand the quality requirements of each market. Wood waste comes from a
variety of sources that dictate the level of contamination in the waste wood. The source and
level of contamination is used by wood recyclers to grade the quality of the wood waste,
providing an indication of the need for processing and potential end markets. This
classification has been standardised by the WRA and is used in the Publically Available
Standard 111. Essentially there are four grades of waste wood, as summarised in Figure 25
and detailed in Appendix V.

Wood Flow 2020 44
Figure 24 Grades of Wood Waste
Grade Typical Materials Typical Markets
Grade A
Packaging waste, scrap pallets,
cases and cable drums, process
off-cuts from manufacture of
untreated products
Animal bedding, horticultural
markets, equine surfaces, energy
generation in non-IED
installations, manufacture of
pellets and briquettes
Grade B
As Grade A, may contain up to
60% Grade A material, plus
construction and demolition
materials
Panel board, energy generation
in IED compliant installations
Grade C
All of the above, plus fencing
products, flat pack furniture,
panel board products
Biomass fuel in IED compliant
installations
Grade D
Fencing, transmission poles,
railway sleepers, wood from
cooling towers
Requires disposal at facilities
licensed to accept hazardous
waste
This suggests that the main markets for packaging wood waste are predominantly in Grade A
applications, i.e., animal bedding, equine surfaces, and also in Grade B applications, i.e., panel
board. There will also be packaging wood waste present in mixed wood waste streams, i.e.,
Grade C and possibly Grade D.
Figure 26 presents the wood waste markets supplied by members of the WRA in 2014. It
should be emphasised that this is all waste wood, and not just packaging wood waste.

Wood Flow 2020 45
Figure 25 Wood Waste Markets Supplied by WRA Members in 2014
Having identified the total quantity of wood waste utilised by each market, the next stage in
the analysis was to estimate how much packaging wood waste is used by each end market
(See Figure 28). Where possible, actual data on packaging wood waste by specific markets
was utilised, i.e., panel board industry. In other cases, assumptions on the quantity of
packaging wood waste used by each market have been made, using guidance from the WRA.
7.5.1 Panel Board
The Wood Panel Industry Federation (WPIF) was established in 1995 and represents the
interests of industrial manufacturers in the UK and Ireland of Wood Chipboard, Oriented
Strand Board (OSB) and Medium Density Fibreboard (MDF). There are currently six
manufacturing companies in the UK, with a total of eight plants:
● SmartPly;
● Norbord;
● Medite Europe Ltd;
● Kronospan Ltd;
● Egger (UK) Ltd; and
● Egger (Barony Ltd).
The WPIF collects detailed annual data from its members on the quantities of recovered
wood used. Data for 2010 - 2014 provided by WPIF is included in Figure 27.
896kt, 31%
807kt, 27%
548kt, 19%
331kt, 11%
179kt, 6% 178kt, 6%
Total Wood Waste Markets Supplied by WRA Members, 2014
UK energy
UK panel board
Export energy
Animal bedding
Export panel board

Wood Flow 2020 46
Figure 26 Wood Waste used in Panel Board Production
Year
Raw Board
Production
(k Green
tonnes)46
Recycled Wood
(k Green
tonnes)
Amount of
Recycled Wood
which is
Packaging
(k tonnes)
Quantity
Declared for
PRNs
(k tonnes)
2010 3,367 1,120 550 504
2011 3,271 952 423 396
2012 3,298 909 345 304
2013 3,117 853 296 274
2014 3,223 812 266 247
In 2014, the UK panel board industry reported 266k tonnes of wood packaging waste was
recovered by its members, of which 247k tonnes was accredited.
It should be noted that up until 2014, the amount of recycled wood used that is packaging
was higher than the amount declared for PRNs. According to the WPIF, the reason for this is
that not all wood was able to be sufficiently identified as packaging wood, in line with the
requirements of the PRN system. However, in 2015, all recycled wood was declared as PRNs.
The 2014 PRN figure reported by the WPIF member’s accounted for 60% of the wood PRNs
issued in 2014.
7.5.2 Other markets
Whereas data is available on the quantity of packaging wood waste utilised by the panel
board market, there is no such reported data on quantities of wood packaging waste utilised
in the remaining markets. Therefore, assumptions were made on the proportion of wood
packaging waste that is used in the overall quantities of wood waste used by each end
market. These assumptions have been informed by industry understanding of the quality
requirements and specifications of each market. For example, the animal bedding market is
required to manufacturer its products from clean, high quality wood waste, i.e., Grade A.
Grade A will consist predominantly of packaging waste, but may also contain other sources of
wood waste, i.e., manufacturing and joinery waste. The WRA estimated that 80% of the wood
waste consumed by the animal bedding market is likely to be packaging wood waste. The
same estimate applies to equine surfaces. Meanwhile, the WRA estimated that the amount of
packaging wood waste utilised in horticultural markets such as mulches and pathways is
much lower: 30%, as these are lower value markets. Finally, the proportion of packaging
wood waste estimated to be exported for use in the European panel board market is 35%,
46 Green tonnes is the weight measurement of timber freshly felled before any natural or artificial drying has occurred.

Wood Flow 2020 47
which is similar to the proportion of wood packaging waste used by the UK panel board
industry in its overall use of wood waste47.
These estimates and therefore the total estimated quantity of wood packaging recycling is
summarised in Figure 28. This includes both information on quantities of wood recycling
reported by members of the WRA and estimates that the WRA have made on quantities of
wood waste managed by non-members.
The amount of wood packaging waste included in both the UK and export bio-energy markets
is thought to be low, with these markets utilising lower grade mixed wood waste streams. In
any case, this would not be counted as recycling and so no estimates have been made for the
amount of wood packaging waste included in these markets for the purpose of determining
unaccredited recycling. Further information on other markets for packaging wood waste can
be found in Section 7.5.3.
Figure 27 Wood Packaging Recyed by End Market 2014
Market WRA
members
(k tonnes)
Additional %
estimated
from non-
members
Total
(k tonnes)
Estimated
packaging
content (%)
Total
packaging
recycled
(k tonnes)
UK Panel
board 807 0 807 n/a 26648
UK energy 896 11 992 - 0
Animal
bedding 331 18 390 80 312
Equine
surfaces 134 18 157 80 126
Mulches,
pathways 45 25 56 30 17
Export panel
board 179 0 179 35 63
Export
Energy 548 0 548 - 0
To other
wood
recyclers
124 0 124 0
TOTAL 784
47 Discussions with the WPIF and WRA have indicated that there are likely to be no other export markets for wood packaging due to the
high value of this material in the UK. There may be minimal amounts in waste wood, however this is likely to be lower grade wood
packaging. 48 Actual figure from WPIF

Wood Flow 2020 48
The total quantity of packaging wood waste recycled is estimated at 784k tonnes. When the
accredited recycling figure of 412k tonnes is subtracted from this figure, this gives a total
unaccredited recycling figure of 372k tonnes.
Whilst the data reported by the panel board sector is based on actual tonnes of packaging
wood recycled, as outlined above, the data for other sectors is based on estimates and will be
subject to a greater degree of uncertainty. The estimates of packaging waste content used by
each market in Figure 28 have been informed by both the WPIF and the WRA. For example,
the WRA works with a number of organisations to update its annual estimates of markets
supplied by non-members. Despite this, the complexities of the waste wood market and the
mixed types of wood used by some markets means that there will be a degree of error in the
data.
In a Briefing on Regulation of Wood49 published by the EA, it stated that wood must be
effectively segregated into the four grades – A, B, C, and D – before subsequent processing
for use. The markets dictate the quality specification, and therefore grade and type of wood
that is supplied to them. For example, the use of waste wood permitted for use in equestrian
surfaces includes untreated wood only, i.e., packaging wood and process off-cuts from the
manufacture of products from untreated timber. This gives confidence to the WRA that the
estimates of packaging content in the table above are as accurate as possible.
Further robustness of the estimates could be achieved by more accurate or mandatory
reporting of waste wood type received by recyclers/reprocessors, and by the wider adoption
of the PAS 111 specification that provides the definitions, minimum requirements and test
methods for processing waste wood into materials intended for use in suitable new
applications or end products.
7.5.3 Markets supplied by Accredited Reprocessors (May 2016)
As can be seen in Figure 29 below, the accredited wood reprocessors represent the full range
of waste wood market types. Some reprocessors specialise whereas others supply multiple
markets. The panelboard and animal bedding sectors represent a significant number of the
accredited reprocessors. This is to be expected, given the large quantities of recycled
packaging wood consumed by these markets.
49 Briefing on Regulation of Wood – Our approach to working with the wood recycling sector on the management of waste wood,
September 2014

Wood Flow 2020 49
Figure 28 Wood Packaging Recyed by End Market 2014
Accredited Reprocessor Markets served
Arden Wood Shavings Ltd Animal bedding
Boden & Davies Animal bedding, equine surfaces
Egger (Barony Ltd) Panelboard
Egger (UK) Limited Panelboard
Eglinton (Timber Products Ltd) Pallets
Giffords Property Limited Pallets
Hadfield Wood Recyclers Ltd Animal bedding, biomass, panelboard
feedstock
Kronospan Ltd Panelboard
Marlin Industries (Wrexham) Ltd Cable drum repair, horticulture
Mendip Woodshavings Limited Animal bedding
Norbord Europe Ltd Panelboard
Norbord Limited Panelboard
Tracey Timber Recycling Ltd Animal bedding, equestrian surfaces,
biomass
7.5.4 Other non-recycling disposal route and end markets
Packaging wood waste that is unaccounted for in the total estimate of accredited and
unaccredited recycling is likely to be treated, recycled or recovered in the following ways:
Disposed of in landfill
There will be an element of wood packaging waste disposed of in landfill. A recent WRAP
report estimates 2.5 million tonnes of waste wood is disposed of in landfill. However, this is
likely to mainly consist of mixed waste wood from industry. It is not possible to determine
how much of this is wood packaging.
Present in lower grades of wood waste used in bioenergy
Clean wood and wood waste are also used as a biomass fuel as follows:
● Existing infrastructure which run on fossil fuels (co-firing);
● A replacement for, or co-fired with other types of biomass; and
● In specifically constructed wood fuelled biomass plants.
If lower grade wood waste is used, the plant must be compliant with the Industrial Emissions
Directive (IED). There is an estimated capacity of over three million tonnes of wood fuelled
bioenergy plants in the UK, with a further one million tonnes in construction. However, much

Wood Flow 2020 50
of the existing capacity is using virgin biomass, and the plants that are compliant with the IED
are targeting lower grade wood waste which will contain relatively low quantities of
packaging wood waste. A database of plants that are compliant with the IED can be found on
the GOV.UK website50.
Present in household and C&I waste treated in Energy from Waste (EfW) facilities
In 2012, there was an estimated 5.2 million tonnes of EfW capacity operating in the UK; this is
estimated to increase to 11.9 million tonnes of capacity by 202051. If the composition data for
MSW which indicated that 1.48% could be untreated wood, including packaging wood, is
applied to the 2012 capacity estimate, this would equate to an estimated 77k tonnes of wood
packaging waste being treated in EfW facilities. However, it should be noted that this would
only be counted as recovery where it is used in facilities that have been deemed to be
compliant with the R1 classification for waste recovery.
Unrecorded but legitimate use in biomass plants which are accredited under the
Renewable Heat Incentive (RHI)
Some packaging wood wastes (i.e. pallets) are used as a fuel in small-scale biomass plants
including those accredited under the RHI. Whilst participants of the RHI are obligated to keep
records of quantities and type of fuel used, this data is not centrally collated.
Used in the manufacture of pellets for biomass plants
Whilst most wood pellets are manufactured from virgin wood, pellets are manufactured from
clean waste wood, some of which may include packaging.
Used in non-legitimate (i.e. not adhering to standards) markets of animal bedding, use
on land etc.
The WRA report mentions that wood packaging waste may be being used in markets that do
not adhere to standards, for example, in animal bedding that is also using lower grade wood
waste.
Re-use by the third sector
The third sector plays an important role in facilitating the re-use and recycling of wood waste
through the delivery of a wide range of collection, repair and re-use schemes. Community
Wood Recycling (CWR) represents a UK wide network of community wood recyclers. The
organisation grades wood collected by re-use outcomes, as opposed to the type of wood it is.
For example, wood waste collected by its members will be classed as high or low grade. High
grade is wood that can be re-used in DIY projects, or made in to furniture or other items.
High grade wood includes pallets that can be repaired and sold back to pallet distributors.
50 https://www.gov.uk/government/collections/industrial-emissions-directive-ied-environmental-permits-issued 51 http://www.greeninvestmentbank.com/media/25376/gib-residual-waste-report-july-2014-final.pdf

Wood Flow 2020 51
Low grade wood is wood that is not suitable for re-use, and is subsequently used for fire
wood and kindling. Some low grade wood will also be sent to other recyclers for chipping.
The CWR has seen a rise in the popularity of using packaging wood from pallets as cladding
and decoration in shops and restaurants.
In 2014, CWR recorded 12k tonnes of wood that was collected across its network, of which
more than 40% was re-used. Whilst CWR collect detailed data on wood collected, it does not
break the data down any further into the type of waste wood. However, CWR estimated that
20% of waste wood collected by weight is packaging wood.
Burned on bonfires and other ‘back-yard’ burning
Packaging waste may be disposed of in bonfires and other examples of back-yard burning,
both by householders and businesses.
7.5.5 Decrease in Accredited Recycling
An analysis was completed on the number of large and small registered reprocessors or
exporters for wood packaging, from 2008 to 2014. This was plotted against the average wood
PRN price across these years to ascertain what role, if any, the price of a wood PRN has on
making it viable for reprocessors to become accredited. This is shown in Figure 30.
Figure 29 Reprocessor / Exporter Accreditations and Wood PRN Price52
52 Based on the number of active reprocessors / exporters reported on NPWD on 07/07/2015

Wood Flow 2020 52
This appears to show a spike in the number of registered reprocessors and exporters when
the PRN price was high in 2009. Following this, the price drops significantly from just over £5
per tonne in 2009 to just over £1.50 per tonne in 2010, however, the number of
reprocessors/exporters declines more gradually. Between 2009 and 2014, 18 companies
(predominantly large companies) have foregone their EA accreditation.
For other materials, it has been found that as the PRN price declines a company will only
register for accreditation if it handles a significant tonnage. In previous packaging flow
projects53, an assessment of accreditation costs (EA fees and internal administration costs)
has helped the identification of the tonnage of unaccredited recycling undertaken based on
this economic benefit seen of raising PRNs. Applying the same methodology for wood, this
would be around 1.5k tonnes of wood per registered company. It is known that typical
companies in the sector on average handle in the region of 26k-27.5k tonnes per year.
Therefore this calculation method was not considered appropriate for wood packaging.
The PRN price may have contributed to the decline in registered reprocessors and exporters.
However, as the PRN is relatively low compared to the overall value of the material, other
factors such as supply/demand, consolidation within the marketplace and the development
of new end markets may also have contributed to the decline.
Figure 31 shows how the number of accredited reprocessors has fallen in line with the
quantity of accredited recycling. This suggests that whilst the amount of accredited recycling
has decreased, this could be due a fall in the number of reprocessors registering for
accreditation as opposed to a fall in the throughput of wood waste recycled by the industry.
This theory is supported by the fact that there are a number of major players in the wood
waste market who were previously accredited but who are no longer accredited in 2014, yet
they are still in operation. These include a major supplier of animal and equine bedding
manufactured from wood waste and a major supplier of plywood to the panelboard sector.
Figure 30 Accredited Recycling and Reprocessors
Year 2008 2009 2010 2011 2012 2013 2014
Accredited
recycling
(Tonnes)
940k 882k 772k 601k 525k 436k 412k
No. of
Accredited
Reprocessors
31 33 32 24 21 18 15
53 Metal Flow (http://www.wrap.org.uk/content/metal-packaging-market-study-metal-flow-2014) and Glass Flow
(http://www.wrap.org.uk/content/glassflow-2012-report-0)
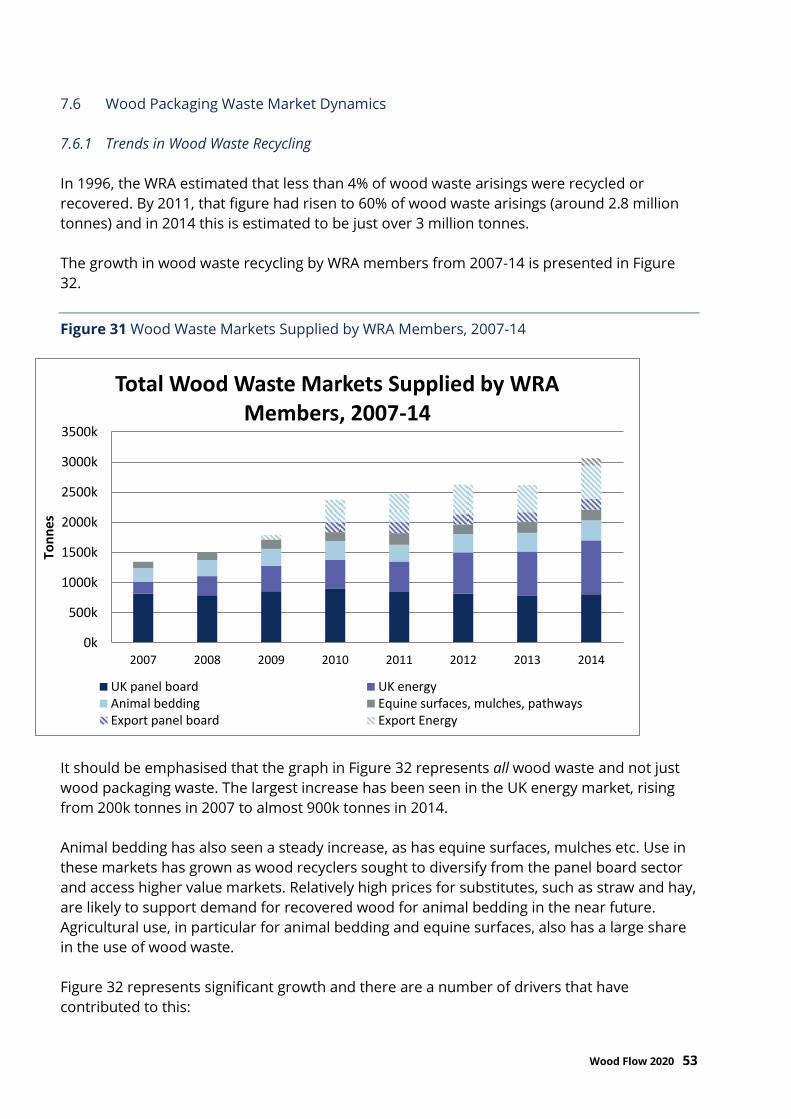
Wood Flow 2020 53
7.6 Wood Packaging Waste Market Dynamics
7.6.1 Trends in Wood Waste Recycling
In 1996, the WRA estimated that less than 4% of wood waste arisings were recycled or
recovered. By 2011, that figure had risen to 60% of wood waste arisings (around 2.8 million
tonnes) and in 2014 this is estimated to be just over 3 million tonnes.
The growth in wood waste recycling by WRA members from 2007-14 is presented in Figure
32.
Figure 31 Wood Waste Markets Supplied by WRA Members, 2007-14
It should be emphasised that the graph in Figure 32 represents all wood waste and not just
wood packaging waste. The largest increase has been seen in the UK energy market, rising
from 200k tonnes in 2007 to almost 900k tonnes in 2014.
Animal bedding has also seen a steady increase, as has equine surfaces, mulches etc. Use in
these markets has grown as wood recyclers sought to diversify from the panel board sector
and access higher value markets. Relatively high prices for substitutes, such as straw and hay,
are likely to support demand for recovered wood for animal bedding in the near future.
Agricultural use, in particular for animal bedding and equine surfaces, also has a large share
in the use of wood waste.
Figure 32 represents significant growth and there are a number of drivers that have
contributed to this:
0k
500k
1000k
1500k
2000k
2500k
3000k
3500k
2007 2008 2009 2010 2011 2012 2013 2014
Ton
ne
s
Total Wood Waste Markets Supplied by WRA Members, 2007-14
UK panel board UK energyAnimal bedding Equine surfaces, mulches, pathwaysExport panel board Export Energy

Wood Flow 2020 54
● Increased landfill costs (which are still rising);
● Government funding for capital investment in reprocessing facilities (in order to increase
recycling to meet recycling and landfill diversion targets);
● Government waste and energy policy (such as encouraging the management of waste in
line with the waste hierarchy, and the implementation of the EU Renewable Energy
Directive, including government incentives to encourage electricity generation from
renewable sources); and
● The associated increase in use of recycled products in panel board and animal bedding
markets.
These drivers have resulted in increased wood waste supply and demand, with an associated
rapid deployment of reprocessing capacity in the wood waste sector. Historically,
reprocessors have invested heavily in the development of wood waste reprocessing54 in
order to increase the amount of wood waste that is recycled and to provide a better product
to meet customers’ specifications. To date, however, much of the wood waste that is
reprocessed and used is high grade (Grades A and B). Typically, this waste wood is of
relatively high value and has significant markets outside of the bioenergy market. Such
markets include the panel board sector, animal bedding, mulch and land cover.
For some time there was a lower market demand for Grade C wood waste, which meant that
it was sent to landfill. It is generally agreed that there is only one viable market for this grade
of wood waste and that is in bioenergy facilities. A number of developers have seen an
opportunity in Grade C wood waste, and the market for Grade C wood waste fuel for
bioenergy is now growing as more facilities are being developed that are IED compliant. This
market is further incentivised by fiscal measures.
Figure 32 also shows the emergence of new markets and how others have grown or
remained the same. Despite some large panel board plant closures, the total amount of
wood waste consumed by the panel board industry has not decreased significantly, although
the percentage of wood packaging waste used has fallen due to competing markets.
Growth in the biomass sector has been encouraged by government incentives to increase
electricity generation from renewable resources. These include the Renewables Obligation,
the Contract for Difference scheme and the Renewable Heat Incentive. Information regarding
these fiscal incentives for biomass can be found in Appendix VI.
7.6.2 Market Pricing
Reprocessors are willing to pay for good quality, clean Grade A wood, whereas for lower
grades they will charge a gate fee to accept this material. The market reports payments of up
to £200 per tonne for Grade A wood for animal bedding markets. Similar quality wood sent to
54 In 2007 (the earliest reported on NPWD at the time of writing) reprocessors invested £2.7 million of PRN revenue on capacity, which
would be to increase their capacity and improve the quality of product for both established and emerging end markets. More recently,
although the market is more mature reprocessors continue to invest albeit at lower levels in wood reprocessing infrastructure and
capacity as investment from PRNs / PERNs increased by 20% from 2012 (£323k) to 2014 (£388k) as reported in the NPWD.

Wood Flow 2020 55
biomass markets will see prices of £60-£65 per tonne. The panel board industry is reported
to pay in the region of £18-£26 per tonne for wood waste that meets its specifications.
Therefore, it is clear that Grade A wood waste, i.e., wood that includes packaging wood waste,
has a clear price advantage over other grades of wood.
Prices paid or gate fees charged for handling wood waste are a combination of:
● Market prices for the products leaving the site; and
● Reprocessing investment and operating costs.
The price of wood waste is very demand orientated. In a low demand market the wood
reprocessors will increase the gate fee to decrease waste wood coming into their site. In a
market where there is high demand, the reprocessors may choose to decrease gate fees to
attract waste wood to their sites. Prices vary depending on demand, location and
specification.
Reprocessors can react quickly to market conditions by altering gate fees, although in the
short term they can also change the amount of wood waste stored on site as a temporary
smoothing of supply and demand. This means that they can act to ensure that the price of
the final product does not vary significantly on short term cycles. However, permit conditions
typically mean that reprocessors are not allowed to stockpile waste wood on site indefinitely,
nor do they allow for large stock piling. As a result, they will not take in waste wood for which
there is no foreseeable market. Conversely, as demand for waste wood increases, they can
lower gate fees to attract waste wood into the site. This has proved to be a successful
strategy to date for the reprocessors.
7.7 Recycling & Recovery Rates
Throughout Sections 4 to 7 of the report, estimates for wood packaging POM and recycled in
2014 have been made. As such, Figure 33 shows the recycling rates calculated based on these
estimates.
Figure 32 Wood Packaging 2014 Recycling Rates
POM Accredited
Recycling
Total
Recycling
Wood Packaging 1,310kt 412kT 784kT
Wood Recycling Rate 31% 60%
Based on the new estimate for wood packaging POM and the current reported recycling
through PRNs/PERNs raised, the recycling rate is calculated to be 31% in 2014 (or 60% if
unaccredited recycling is included). This is lower than the previous estimate of 40%, due to
the increase in the estimated quantity of wood packaging POM.

Wood Flow 2020 56
Using the POM estimate from this study means the UK would have met its 2014 Packaging
Regulation material specific policy intention target for wood, which was 21.6%. The EU
Packaging Directive target for wood of 15% would also have been met.

Wood Flow 2020 57
8.0 POM and Recycling Scenario Analysis
8.1 Introduction
This section looks at the historical (1997 – 2014) POM and recycling figures for wood
packaging in the UK and uses these, combined with wider industry knowledge, to generate
projections up to 2020.
8.2 POM Projections
A regression analysis using historical POM data was undertaken to help project future
tonnages of wood packaging POM. This was done using the EA NPWD packaging data from
1997 to 2014, and the Net Pack Fill calculation (as described in Section 4 of this report).
This process involves using an independent variable to project POM until 2020. Several
variables were considered for this analysis: historical Net Pack Fill, UK Gross Domestic
Product (GDP) and the UK construction industry’s Gross Value Added (GVA)55. In this scenario,
the construction industry’s GVA was the variable used due to it having the highest correlation
with wood packaging POM56. A projected growth rate for the construction industry was
obtained from the ‘Blueprint for the Construction Industry 2015-2019’ report by the
government backed Construction Industry Training Board (CITB), which is updated on a yearly
basis57. This takes into account growth in public and private new housing, infrastructure and
public non-housing sectors.
Implicit in this regression model is the assumption that the construction industry will grow
slowly over the next five years, resulting in an increase in wood packaging. This is supported
by the report mentioned above, and evidence from the government of the intent to
encourage the building of houses and commercial premises. It is also assumed that the
density of wood packaging will remain constant and that other products / materials do not
replace wood packaging. The full details of the technique applied are described in Appendix
VII of this report.
Obligated POM does not represent the full tonnage of wood packaging flowing onto the UK
market. Therefore, in order to project forward the total POM figure the same
increases/decreases projected for the obligated data forward to 2020 were applied to the
total 2014 POM figure and then consecutively to 2020. It was therefore assumed that the
forward trend in unobligated tonnage is the same as the obligated tonnage as the Steering
Group did not identify why there would be any difference in performance between them. The
results are shown in Figure 34.
There is uncertainty around projections, and therefore a range was developed around the
POM projection. Assuming a normal distribution and using a 95% confidence interval, a range
55 http://researchbriefings.files.parliament.uk/documents/SN01432/SN01432.pdf 56 In 2013 Timcon estimated that 30% of pallets were used by the construction products sector 57 https://www.citb.co.uk/documents/research/csn%20reports%202015-2019/construction-skills-network-uk-2015-2019.pdf

Wood Flow 2020 58
was calculated and is shown in Figure 34 as the upper and lower bounds. This was completed
using the regression standard error resulting from the projection analysis.
Figure 33 Wood POM Projections 2014 to 2020
The projections up to 2020 show that there will be a slight decrease in wood packaging POM
in 2015, but overall it will increase from 1,310k tonnes in 2014 to 1,366k tonnes in 2020: an
increase of 4.3%.
There are a number of potential factors identified that could affect future POM including
changes in construction industry GVA, light-weighting and replacing wooden pallets with
plastic pallets.
First, there is not thought to be much scope for light-weighting in wood packaging. Use of
design software and commercial pressures have ensured that pallets are optimal in terms of
price/performance.
Second, wood also provides a better grip than plastic, especially when wet. Whilst it is
possible that plastic may gain market share at the expense of wood there were no signs of
this happening at the time of writing.
Overall, the Steering Group felt that the growth projected by the model was sensible and that
actual POM was likely to fall within the bounds of the projection.
8.3 Accredited Recycling Projections
1310k 1305k 1323k 1335k 1341k 1353k 1366k
0k
200k
400k
600k
800k
1000k
1200k
1400k
1600k
2014 2015 2016 2017 2018 2019 2020
Ton
ne
s TOTAL POM
Upper Bound
Lower Bound

Wood Flow 2020 59
An analysis of historical recycling data was possible by using PRN/PERNs generated as an
estimate of wood recycling rates (i.e. accredited recycling only). Data from 1998 to 2014 was
used.
It was tested to determine if the data was suitable for regression analysis. However, it was
found that two trends existed in the data, from 1998 to 2008, and then from 2009 to 2014. It
is likely this is due to an increase in biomass as an end market for collected wood from 2009
onwards. Due to this structural break, too few data points in the latter trend were available to
produce a regression model that would be considered robust. Nevertheless, the output trend
of the model looked like it could be a realistic scenario and as such was presented and
discussed (along with other scenarios) with key stakeholders58 to identify, based on their
experience of the wood recycling industry, whether they could agree to this being a suitable
projection for accredited recycling. This also allowed for them to consider factors (other than
historical trends) such as strength and capacity of end markets as well as the price paid by
each end market to ensure that as many variables as possible were considered in assessing
the model output. Although the output from the regression model was not considered robust
in modelling terms, the stakeholders agreed that this was a realistic scenario given their
knowledge of the market. The results are shown in Figure 35 below.
Figure 34 Historic Wood Recycling and Projections
58 Discussions with Wood Recyclers Association (WRA) on 11/12/2015 and Wood Panel Industries Federation (WPIF) on 07/12/2015
812k 772k
601k
525k
436k 412k
358k 355k
325k 331k
314k 324k
0k
100k
200k
300k
400k
500k
600k
700k
800k
900k
2009 2010 2011 2012 2013 2014 2015 2016 2017 2018 2019 2020
Ton
ne
s Wood
Upper
Lower

Wood Flow 2020 60
The projection shows a decrease in recycling tonnage (down from 412k tonnes in 2014 to
324k tonnes in 2020), but a slow-down in the rate of decrease compared to the previous six
years. Both the WRA and WPIF state that this is due to the presence of established high value
end markets for wood packaging ; i.e., wood recyclers that have good quality wood will
continue to send their material to end markets which could pay up to ~£200 per tonne rather
than biomass, which attracts a much lower price per tonne. Therefore, although biomass has
taken market share from other markets, this is likely to be for packaging that is lower quality
or where it is not cost effective to transport to higher value end markets. Although more
biomass capacity is expected to come online in the next few years, it is unlikely to displace
accredited recycling at the same rate as over the period 2009-14. This is because most of the
diplacement to date has been for low-value uses for wood packaging.
It was considered by the Steering Group that there are a number of potential factors that
could cause this trend to take a different path. Government policy was highlighted as an
important factor in this market. A shift in energy policy away from supporting renewable heat
could lead to more wood waste being recycled instead of going to biomass. New fire
prevention plan guidance for wood reprocessing facilities could mean that it is harder to
store wood waste, therefore leading to less being recycled. Similarly, an increase in the
PRN/PERN price (driven by targets) could encourage more recyclers to become accredited,
increasing this figure whilst reducing the unaccredited amount.
8.4 Recycling Rate Projections and Implications
Using the POM and recycling tonnage projections identified above, the recycling rates from
2014 to 2020 can be calculated. These are shown in Figure 36.
Figure 35 Wood Recycling Rate Projections
2014 2015 2016 2017 2018 2019 2020
POM 1,310kt 1,305kt 1,323kt 1,335kt 1,341kt 1,353kt 1,366kt
Recycling 412kt 358kt 355kt 325kt 331kt 314kt 324kt
Recycling Rate 31% 27% 27% 24% 25% 23% 24%
Using the POM estimated in this study means the UK would meet its 2014 Packaging
Regulation material specific policy intention for wood, which stands at 21.6% until 2017. The
EU Packaging Directive target for wood of 15% would also be met.
At the time of writing, the European Commission is proposing in its Circular Economy
Package extending recycling targets for packaging materials (including wood) through to
2030. Although the targets have yet to be confirmed, they are likely to be significantly higher
than previous targets.

Wood Flow 2020 61
9.0 Conclusions and Recommendations
This section details the conclusions of the project and details the main areas recommended
for further work.
9.1 Conclusions: Flow
The project’s final best estimate of UK flow for 2014 is 1,310k tonnes, an increase of
276k tonnes from the previous Defra estimate
The most robust estimate that could be derived, using a variety of the most authoritative
methods, including industry estimates, Valpak data and publicly available data, suggests that
the quantity of wood packaging POM in 2014 was 1,310k tonnes. This figure is 276k tonnes
higher than the current Defra estimate of 1,034k tonnes for 2014.
Unobligated or unregistered flow for wood packaging accounted for 8% of POM in 2014
The final project estimate was found to be 101k tonnes higher than data reported by
obligated companies under the Packaging Waste Regulations (using the UK Net Pack Fill
calculation method). This suggests that unobligated companies or tonnage (relating to the
Regulation thresholds and packaging definitions) or unregistered tonnage through free-
riding, account for 101k tonnes (8%) of wood packaging in the UK.
Although each packaging type is characterised by different market structures, the project
results highlight that unobligated flow for wood is relatively low compared to other packaging
materials. However, this is consistent with stakeholder views that wood packaging (in
particular, pallets) will be produced in large scale facilities, with the more specialist bespoke
non-pallet packaging being manufactured by smaller producers.
The final project estimate of wood packaging POM by format is: flat pallets 958k tonnes
(73%), cases/boxes/crates & drums 245k tonnes (19%), box pallets & load boards 91k
tonnes (7%), casks/barrels/vats/tubs, & coopers products 13k tonnes (1%) and other
packaging 3k tonnes (0.3%)
Using a combination of industry data sources and Valpak’s EPIC database for retail packaging
sold to the consumer, the final project estimate by format was made. This indicates that
almost three quarters of wood packaging POM is flat pallets.
The projected trend for obligated wood packaging POM between 2014 and 2020 is an
increase of 4.3%
A regression analysis using historical POM data was undertaken to help project future
tonnages of wood packaging POM. This was done using the EA NPWD packaging data from
1997 to 2014. This process involves using an independent variable to project POM until 2020.

Wood Flow 2020 62
In this scenario, the construction industry’s Gross Value Added (GVA)59 was the variable used
due to its high correlation with wood packaging POM60.
By using this, the model suggests that there will be 4.3% growth in wood packaging POM to
2020. This does not consider unobligated flow, which, for 2014, accounts for 8% of POM.
9.2 Conclusions: Recycling
Using the new POM figure of 1,310k tonnes and the accredited recycling figure of 412k
tonnes, the UK achieved a 31% recycling rate in 2014
Using the new POM figure, the UK achieved a 31% recycling rate in 2014, which is 9% lower
than the previous estimate by Defra.
The quantity of accredited wood packaging recycling in the UK has dropped
significantly since 2008
In 2008 there were 940k tonnes of accredited recycling; however, by 2014 this had dropped
to 412k tonnes. The project team believes this decrease in accredited recycling has been
largely due to material being diverted for use in end markets that have not raised PRNs, i.e.,
bioenergy, bioenergy exports and panel board exports. Also, there has been a decrease in
the number of accredited reprocessors. This is due to the PRN value being relatively low
compared to the overall value of the material.
There is an estimated 372k tonnes of unaccredited wood reprocessing
The project estimated some 372k tonnes of wood packaging reprocessed in 2014 did not
have a PRN/PERN issued against it. This is 47% of total recycling (accredited and
unaccredited).
By including the estimated unaccredited reprocessing, the recycling rate increases to
60%
The recycling rate for wood packaging increases to 60% if the level of unaccredited recycling
is included.
Wood recycling projections indicate accredited wood recycling may decrease further
The projections show a decrease in recycling (down from 412k tonnes in 2014 to 324k tonnes
in 2020), but a slow-down in the rate of decrease compared to the previous six years. Based
on the new POM estimates, this indicates that the UK would achieve a 24% recycling rate in
59 http://researchbriefings.files.parliament.uk/documents/SN01432/SN01432.pdf 60 The correlation analysis produced a value of 0.796 since 1997, and 0.892 since 2002. Which was higher than any of the other
variables tested.

Wood Flow 2020 63
2020. However, if this decrease in recycling puts pressure on the market to meet future
targets, this could potentially lead to higher PRN/PERN prices, which may increase accredited
recycling.
9.3 Recommended Areas for Further Work
Investigate potential unregistered producers to capture more obligated POM tonnage
The total quantity of unregistered wood packaging producers should be investigated. This
work has identified a significant number of organisations of a sufficient size by turnover and
core business activity that potentially should be registered as producers on the EA NPWD list.
Encourage accreditation of wood recycling activities
If there were greater incentives for companies in the UK performing recycling activities on
wood packaging to become accredited, this would encourage more PRNs to be issued on the
wood packaging that is recycled, resulting in less unaccredited recycling. It would also help
the UK comply with future recycling targets.
Work with other key organisations to collect data important to wood flow estimates
Work should be done to ensure that data that is important for identifying wood flow
estimates is as up to date and as accurate as possible. An example of this would be to work
with Timcon to ensure it updates its reports/surveys for years in which flows are required to
be identified or verified. New ways of working between government and industry could be
examined to update these types of datasets on a regular basis.
Potential for re-use contributing towards circular economy recycling targets should be
investigated
A factor that could help wood packaging meet any future circular economy recycling targets
for 2020 and beyond is re-use. The current EU circular economy package states that
‘preparing for re-use and recycling61’ can contribute towards the target. As there is a
significant quantity of wood pallets being re-used, this should be investigated to establish the
contribution re-use could make to achieving future targets.
61 http://eur-lex.europa.eu/resource.html?uri=cellar:b68494d2-999f-11e5-b3b7-01aa75ed71a1.0019.02/DOC_1&format=PDF

Wood Flow 2020 64
Appendix I Obligation Reporting Activity
Lines
Figure 36 The EA’s Data Form – Activity Descriptions
Activity Description
Raw material
manufacturing Production of raw materials that will be made into packaging
Conversion Conversion of raw materials into packaging
Packing/filling Applying packaging to goods
Selling Supplying packaging to an end user i.e. the company / person
who removes the packaging

Wood Flow 2020 65
Appendix II Grocery Retail Cross Reference
To sense-check the validity of the EPIC data for grocery retail, Valpak requested aggregated
data from the EA for selected retailers. Table 1 selling data were requested for wood
packaging handled in 2014 (2014 sales) for the following retailers:
Aldi;
Asda;
Boots;
Co-Op;
Iceland Foods;
Lidl;
Marks & Spencer;
Morrison’s;
Musgrave (Budgens);
Nisa;
Sainsbury; and
Tesco.
These retailers are estimated to represent 85.2% of the UK grocery retail market, based on
Kantar World Panel data. As such the EA data was scaled up to represent 100% of the UK
market and the table below shows this grocery retail estimate.
Figure 37 Aggregated EA Grocery Retail Packaging Handled (2014)
Wood
(k tonnes)
Grocery Retail 0.27562
EPIC data was scaled up to account for the above retailers (using market share information
by volume sales for the four supermarkets’ data used, provided by Kantar). Figure 39, below,
compares the scaled-up EA figures to the scaled-up EPIC data.
Figure 38 Aggregated Grocery Retail Packaging Handled (2014)
Wood
(k tonnes)
EA Grocery Retail 0.27563
EPIC Grocery Retail 0.95
Difference 0.179 (65%)
62 As reported in December 2015 63 As reported in December 2015

Wood Flow 2020 66
The EPIC grocery retail tonnage is 65% lower than the EA data, which is a relatively high
difference and is likely to be significant. Therefore the EA data has been used to calculate the
non-grocery retail sector. Valpak data was used for other materials flow projects because it
provides increased granularity, however for other materials the difference in tonnage was
less significant in terms of percentage. For wood, because the percentage difference is
greater, and the consumer proportion of total POM is very small, it’s less important to see the
granularity therefore EA data has been used.
Valpak’s EPIC data was still used to define the format split for the retail sector as the project
team was able to access the raw data and felt that the format would not change considerably
between the different retailers covered in the two sets of data.

Wood Flow 2020 67
Appendix III Retail Sensitivity Analysis
In order to assess total retail flow, including non-grocery retailers, analysis was completed on
wood packaging tonnes per £bn turnover. The result showed that non-grocery wood
packaging tonnes / £bn turnover is 4,713% of grocery wood packaging tonnes / £bn turnover,
based on the average for a number of retailers.
Sensitivity analysis has been carried out to establish the impact on total flow if this
percentage was 100 percentage points lower or higher. If non-grocery wood packaging
tonnes / £bn turnover was 4,613% of that used in the grocery sector, total flow would be
15.450k tonnes (-0.03% below the final project estimate) and if non-grocery wood packaging
tonnes / £bn turnover was 4,813% of that used in the grocery sector, total flow would be
16.108k tonnes (+0.03% higher than the final project estimate).

WRAP – Wood Flow 2020 68
Appendix IV Assessment of De-minimis
and Free-riders
There are various databases available that can be used to identify wood packaging
manufacturers.
A list was compiled of market participants and estimated their sales (where not
published) using the proxies of trade debtors, number of employees and net assets. This
was done by searching the Bureau Van Dijk MINT database by SIC code and combining
that with the list of members of the UK Wood Packaging Material Marking Program
(www.ukwpmmp.org). After cleansing it produced a list of 438 market participants
ranked by estimated sales.
Companies on the list with estimated sales of over £2m per annum were compared with
the National Packaging Waste database. All of the major industry participants were
included but there were 53 companies which were likely to be of sufficient size to
require registration but no registration data was available.
Based on industry knowledge it is likely that a wood packaging manufacturer with sales
of £2m would purchase 10,000 cubic metres of wood per year which would have a mass
of around 5k tonnes. For the 53 companies identified this would equate to potentially
over 265k tonnes of material.
This database was also used to estimate that 25% of total turnover is made by
companies with turnover of less than £2m. However we have not used this in our
calculations as the percentage of wood packaging in this total is unknown.

WRAP – Wood Flow 2020 69
Appendix V Grades of Wood Waste, as
Defined in PAS 111
Figure 39 Grades of Recycled Wood
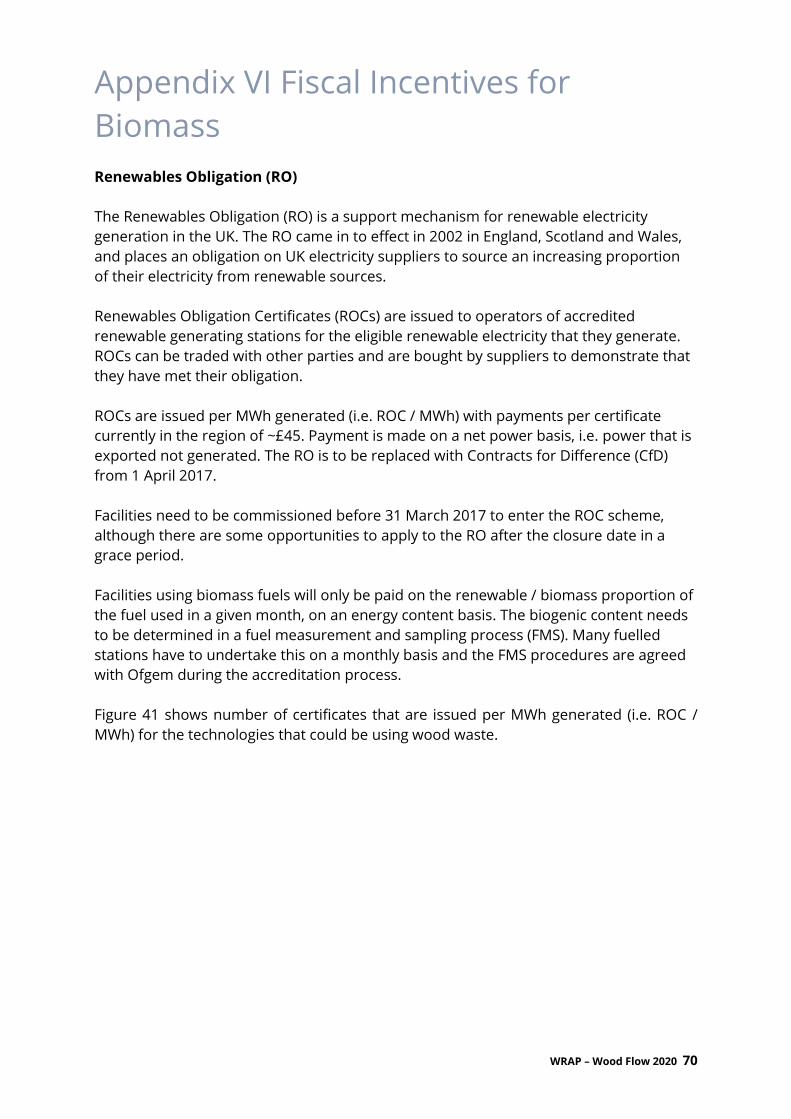
WRAP – Wood Flow 2020 70
Appendix VI Fiscal Incentives for
Biomass
Renewables Obligation (RO)
The Renewables Obligation (RO) is a support mechanism for renewable electricity
generation in the UK. The RO came in to effect in 2002 in England, Scotland and Wales,
and places an obligation on UK electricity suppliers to source an increasing proportion
of their electricity from renewable sources.
Renewables Obligation Certificates (ROCs) are issued to operators of accredited
renewable generating stations for the eligible renewable electricity that they generate.
ROCs can be traded with other parties and are bought by suppliers to demonstrate that
they have met their obligation.
ROCs are issued per MWh generated (i.e. ROC / MWh) with payments per certificate
currently in the region of ~£45. Payment is made on a net power basis, i.e. power that is
exported not generated. The RO is to be replaced with Contracts for Difference (CfD)
from 1 April 2017.
Facilities need to be commissioned before 31 March 2017 to enter the ROC scheme,
although there are some opportunities to apply to the RO after the closure date in a
grace period.
Facilities using biomass fuels will only be paid on the renewable / biomass proportion of
the fuel used in a given month, on an energy content basis. The biogenic content needs
to be determined in a fuel measurement and sampling process (FMS). Many fuelled
stations have to undertake this on a monthly basis and the FMS procedures are agreed
with Ofgem during the accreditation process.
Figure 41 shows number of certificates that are issued per MWh generated (i.e. ROC /
MWh) for the technologies that could be using wood waste.

WRAP – Wood Flow 2020 71
Figure 40 ROC Bandling Levels for 2014-17
Technology 2014/15 2015/16 2016/17
Co-firing (low-range) 0.3 0.5 0.5
Co-firing (mid-range) 0.6 0.6 0.6
Co-firing (high
range) 0.9 0.9 0.9
Co-firing (low-range)
with CHP 0.8 1 1
Co-firing (mid-range)
with CHP 1.1 1.1 1.1
Co-firing (high-
range) with CHP 1.4 1.4 1.4
Dedicated biomass 1.5 1.5 1.4
Dedicated biomass
with CHP 2 1.9 1.8
Energy from waste
with CHP 1 1 1
Standard
gasification/pyrolysis 2 1.9 1.8
Advanced
gasification/pyrolysis 2 1.9 1.8
Contracts for Difference
The Contract for Difference (CfD) scheme has been introduced to replace the
Renewables Obligation, as part of the Electricity Market Reform. A CfD is a private law
contract between a low carbon electricity generator and the Low Carbon Contracts
Company (LCCC), a government-owned company. A generator party to a CfD is paid the
difference between the ‘strike price’ – a price for electricity reflecting the cost of
investing in a particular low carbon technology – and the ‘reference price’– a measure of
the average market price for electricity in the GB market. The aim of the CfD is to give
greater certainty and stability of revenues to electricity generators by reducing their
exposure to volatile wholesale prices. The Government has divided the CfD budget
between two groupings:
● Established technologies: onshore wind (>5MW), solar photovoltaic (PV) (>5MW),
energy from waste with CHP, Hydro (>5MW and <50MW), landfill gas and sewage
gas; and
● Less established technologies: offshore wind, wave, tidal stream, advanced
conversion technologies, anaerobic digestion, dedicated biomass with CHP, and
geothermal.
WRAP – Wood Flow 2020 72
The CfD budget allocated for the established technology is defined as Pot 1 and the CfD
budget allocated for the less established technologies is defined as Pot 2. There is also a
third CfD budget, which is for biomass conversion and this is defined as Pot 3.
The UK is now in a transition phase, where developers can choose between ROCs or CfD,
although the timing of getting plants to commissioning means that is now more likely
that newer developments will fall under the CfD scheme.
In February 2015, the Department for Energy and Climate Change (DECC) announced
the first awards under the CfD system. These projects were those that had bid through
an ‘allocation round’ auction. Budgets were set for different technology types and then
projects accepted starting with the lowest bid price, until the budget is exceeded. A
‘clearing price’ was then awarded to successful bidders at the highest bid price for each
year included in the auction. There were no contracts awarded to biomass facilities in
the first round.
Renewable Heat Incentive
The Renewable Heat Incentive (RHI) was introduced in 2011 with a budget of £860m
over four years, ending in March 2016. The 2015 spending review confirmed that the RHI
will continue until at least 2020/21. Eligible technologies include solid biomass, energy
from waste and CHP installations.
The RHI pays generators of renewable heat a payment per kWh thermal of heat used
(i.e. not heat generated. Payments depend on tariffs, and tiers within each tariff, which
will depend on the technology. Eligible heat uses include heating a space or water, or
process heat.
From 5 October 2015 all participants generating heat (or heat and power) from biomass
must comply with sustainability requirements (greenhouse gas (GHG) emissions limit
and specific land criteria.). Waste or fuel wholly derived from waste is considered to
meet the sustainability requirements.
The RHI has been instrumental in driving an industry of renewable heat technologies, of
which biomass accounts for the majority of installations uses virgin wood pellet or wood
chip, but there are many installations utilising wood waste, including pallets, and also
wood chip manufactured from wood waste.
However, other users of recovered wood, the panel board sector in particular, have
expressed concern that such incentives impair their ability to compete for recovered
wood. However, as more UK biomass capacity becomes operational exports of
recovered wood may decline.

WRAP – Wood Flow 2020 73
Appendix VII Regression Model
Introduction
This report conducted a similar analysis carried out for previous flow reports64. Two
analyses were carried out for this report – one studying changes in obligated wood Net
Pack Fill, and the other investigating wood PRNs (as a proxy for recycling rates).
The observations on the time series made at date t are denoted Yt and the total number
of observations is denoted T. The interval between the observations, that is, the
difference between t and t-1, is one year.
The value of Y in the previous period is called its first lagged value or, more simply, its first
lag, and is denoted Yt-1. Its pth lagged value (or pth lag) is its value at p periods, which is Yt-
p. Yt+1 denotes the value of Y one period in the future.
Net Pack Fill
The data used in this report was the obligated NPWD Net Pack Fill65 tonnage, rounded to
the nearest 1000 tonnes. Data was available reaching back to 1997, allowing for 18
observations in the data set. This is relatively few data points for a regression model, but
the annual nature of packaging data reporting means that this number of observations
provides the best possible model.
The first hypothesis investigated in this analysis was that Net Pack Fill tonnage is closely
related to past Net Pack Fill tonnage. This was considered after looking at the data
graphically. To test whether this was the case, a correlation test using Excel’s Data
Analysis tool between Net Pack Fill and the previous period’s Net Pack Fill was
conducted. This produced a correlation value of 0.746. Given this is relatively low
compared to autoregression correlations carried out for other flow reports, alternative
variables were considered that could provide a stronger correlation.
The construction industry was considered as a potential variable influencing wood Net
Pack Fill, due to a large proportion of wood packaging being pallets and crates. A
correlation test between Construction Industry Gross Value Added (GVA)66 and wood Net
Pack Fill was conducted using Excel’s Data Analysis tool. This produced a value of 0.796
since 1997, and a correlation of 0.892 since 2002. Given this higher correlation, a model
using construction industry GVA as a variable was used.
A regression model is a tool used to project future outputs for the dependent variable
based on past trends with other independent variables. A simple regression with one
variable in the current period is represented as shown:
64 http://valpak.co.uk/information-zone/white-papers-reports 65 https://npwd.environment-agency.gov.uk/Public/PublicReports.aspx 66 http://researchbriefings.files.parliament.uk/documents/SN01432/SN01432.pdf

WRAP – Wood Flow 2020 74
Yt = β0 + β1Xt + μt
Where β0 is the intercept, β1 is the effect of a unit change of the X variable on the Y
variable, Xt is the independent variable and μt is the error term. The model therefore
uses the independent variable, either in the current period or previous periods, to
predict the value of the dependent variable in the current period. The pth order
regression model represents Yt as a function of p lags in the X variable. The number of
lags, p, is called the order, or lag length, of the regression. The pth order regression
model can be represented as below:
Yt = β0 + β1Xt + β2Xt-1 + … + βPXt-P + μP
For this analysis, three regressions using lags for the construction industry’s GVA were
calculated, extending to another period from the current in each model. The optimum
number of lags for the X variable, or the value of p, needs to be decided upon. The
trade-off is as follows: too few lags or regressors are potentially omitting valuable data
from the more distant lagged values. However, if there are too many, there will be more
coefficient calculations, which in turn will introduce additional estimation error into the
forecasts. The way the optimum p number is calculated is by minimising an “information
criterion”. The Bayes information criterion (BIC) is a common tool, which can be
calculated as follows:
BIC(p) = ln ((SSR(p)) / T) + (p+1) ln T / T
The first term calculates the Sum of the Squared Residuals and so necessarily decreases
(or at least does not increase) as lags are added. This is because, as more regressors are
added, more (or at least not fewer) is explained by the model (i.e. R2 will increase). The
second term is the number of estimated regression coefficients (the number of lags, p,
plus one for the intercept) multiplied by the factor (lnT)/T. This increases as the number
of lags is added and so these two opposing forces allow us to choose the p value, which
minimizes the BIC. Therefore, the BIC measures the trade-off qualitatively described
earlier.
When running the OLS regression when a lag is added, often one fewer year’s data can
be used when calculating a coefficient. This is because, when running a regression, the
number of dependent variable observations needs to be the same as the number of
observations for each regressor. Therefore, if one lag is added, there is one fewer
observation, as the oldest year’s data cannot have an equivalent for the previous year
(assuming all observations are used in the first regression).
The Bayes Information Criteria results are as follows:
p SSR(p)/t ln(SSR(p)/t) (p+1)ln(t)/t BIC (p)
1 4717.963875 8.459132603 0.333319217 8.79245182
2 4014.184937 8.297589601 0.519860385 8.817449987
3 3911.651129 8.271714848 0.72214672 8.993861568

WRAP – Wood Flow 2020 75
The results show that the lowest BIC value, and therefore the optimal model, is only
using the current period’s construction industry as a variable (no lags). We assume the
Ordinary Least Squares assumptions hold, and use this model in our forecasting. The
model in general form can be seen below:
Yt = β0 + β1Xt + μt
It is assumed that the error term is independently and identically distributed and has a
mean of zero. The regression was run in excel and produced the following function for
obligated Wood Net Pack Fill:
Yt = 664.209 + 4.996 Xt
The regression had a standard error of 70.801. Projections were calculated using the
estimates for construction growth up to 2019 produced by the government backed
Construction Industry Training Board (CITB) in their ‘Blueprint for Construction 2015-
2019’Report67. 2020 growth was assumed to be 2%, the same as CITB’s 2019 projection.
The figure below shows the results of projecting wood Net Pack Fill using the method
described above.
Figure 41 Net Pack Fill Historic and Projections
67 https://www.citb.co.uk/documents/research/csn%20reports%202015-2019/construction-skills-network-uk-2015-2019.pdf
0k
200k
400k
600k
800k
1000k
1200k
1400k
19
97
19
98
19
99
20
00
20
01
20
02
20
03
20
04
20
05
20
06
20
07
20
08
20
09
20
10
20
11
20
12
20
13
20
14
20
15
20
16
20
17
20
18
20
19
20
20
Ton
ne
s
Year
Wood Net Pack Fill

WRAP – Wood Flow 2020 76
The year on year increases / decreases in Net Pack Fill were applied to the total POM
estimate for 2014 and then consecutively until 2020. This assumes that the unobligated
tonnage will experience the same increases / decreases as obligated tonnage.
To calculate the bounds, the common method of a 95% confidence interval around each
projection was calculated using the regression standard error. However, it is recognised
that the bounds will become less certain as we stretch further into the future.
An implicit assumption in this model is that past trends are useful to predict the future.
If this was to not be the case, the coefficients in the equation would change, leading to
Net Pack Fill following a different trajectory. Similarly, it is assumed that the estimates
for construction industry growth over the next five years are reasonable. If the
construction industry did not grow at this rate, then the trend in wood packaging would
change to reflect this. However, the CITB Report provides the most reliable estimates at
the time of writing.
Wood Recycling
The data used in this report for Wood Recycling is PRNs, rounded to the nearest 1000
tonnes. This represented a proxy for total wood recycling, and it is expected that
changes to the obligated tonnage will capture the trends in the industry. Data was
available reaching back to 1998, allowing for 17 observations in the data set. This is
relatively few data points, but the annual nature of the reports means that these
observations provide the best current model to predict future PRN tonnage.
The first hypothesis investigated in this analysis was that there are two separate trends
in the data. This was decided after considering the data graphically as shown in the
figure below.
Figure 42 Historic Wood Recycling
0k
100k
200k
300k
400k
500k
600k
700k
800k
900k
1000k
19981999200020012002200320042005200620072008200920102011201220132014
Ton
ne
s
Wood Recycling
WRAP – Wood Flow 2020 77
To test whether this was the case, a Chow Test was carried out. A Chow test is an
econometric tool to find the statistical probability that the coefficients on two linear
regressions are equal, and therefore the entire dataset exhibits the same trend. This is
achieved by splitting the data at the expected ‘break point’, where the new trend begins,
and then running a regression analysis on each of these two datasets before comparing
the results.
If we split our data into two groups and run regressions on each data set, then we get
the general form:
Yt = β0 + β1Yt-1 + μt
and
Yt = β2 + β3Yt-1 + μt
The Chow test asserts a null hypothesis that β0 = β2 and β1 = β3. We assume that both
error terms μt are independently and identically distributed with a mean of zero, and
therefore omit them from this analysis.
Let Sc be the sum of squared residuals (SSR) from the combined data, S1 be the sum of
squared residuals for the first data set, and S2 be the sum of squared residuals from the
second data set. N1 and N2 are the number of observations in each data set, and k are
the number of parameters. The test statistic follows an F distribution with k and N1 + N2 –
2k degrees of freedom. The Chow test statistic is:
(Sc – (S1 + S2)) / (k)
(S1 +S2) / (N1+N2 -2k)
The data was split between 1998-2008, and 2009-2014. This split was decided by seeing
the change in direction of the trend graphically. A regression using one lag was
calculated for each individual data set, and for the ‘global’ data set. This was used to
calculate a Chow test statistic, which was compared with the F distribution (2,12). The
Chow test statistic resulting from this analysis was 4.357. The 95% confidence value for
the relevant F distribution was 3.885, and therefore it was concluded that it was likely
there was a break in the data set at this point. Other break points were considered, but
these two data sets had the highest probability of being a break in the trend.
Given this analysis, the useful data for forecasting recycling rates forward was from 2009
onwards. As a result of only six data points being available, it was concluded that a full
regression analysis would not be useful in forecasting, and industry experts were
instead used as the primary source of information. The forecast was generated to
provide a basis for discussion.

WRAP – Wood Flow 2020 78
Appendix VIII De-minimis Imports and
Exports Sense Check and Sensitivity
Analysis
In order to estimate de-minimis imports and exports using publically available
databases, import / export data was used which could break down imports and exports
by industry sector, value of goods and company size (by number of staff).
In order to identify a cut-off for staffing levels for obligated and unobligated producers’
an analysis of Valpak’s internal member data was conducted. This identified that
obligated producers were more likely to have 50 staff or more, which in turn meant that
unobligated or de-minimis producers had less than 50 staff.
As a sense check the number of registered producers that handle wood packaging was
compared to the number of businesses in the HMRC UK TradeInfo.
Figure 43 UK Import / Export Ratios by Size of Organisation
Number of businesses with
50 or more employees
NPWD registered producers handling wood packaging 4,015
HMRC UK TradeInfo data 6,874
These two datasets are not completely comparable as the HMRC UK TradeInfo data only
gives a high level breakdown. Also, as a result of how data is reported into NPWD there
will be some companies in the HMRC data that are likely to be registered producers, but
won’t report any wood packaging because they are part of a leased packaging system
and therefore it is not their obligation.
Due to a lack of publicly available data to cross-check this finding a sensitivity analysis
was conducted to establish the impact on total flow if this staff cut-off was lower or
higher. This identified that if the de-minimis banding is reduced to 0-9 staff then this
reduces the de-minimis imports to 42kT from 111kT and exports to 9kT from 36kT.
Overall, this reduces the total POM from 1,310kt to 1,268kT, representing a reduction of
3.3%.
If a larger de-minimis banding is used, such as 0-249 staff, this increases the de-minimis
imports to 368kT from 111kT and exports to 158kT from 36kT. Overall this increases the
total POM from 1,310kt to 1,444kT, representing an increase of 10%. This has a larger
impact than the smaller cut-off (0-9 staff) due to it encompassing a far greater number
of staff.

WRAP – Wood Flow 2020 79
Appendix IX Data Robustness
A robustness analysis was completed on the data sources used. This was developed to
highlight the level of uncertainty for each data source by scoring the data sources on the
evidence and agreement level from stakeholders. The results are shown in Figure 45,
which has been constructed based on analysis completed for each project estimate.
Questions were created relating to the evidence and agreement levels of the data used.
The tables thereafter provide a full breakdown for each project estimate. If the question
is answered ‘Yes’ then a score of 3 is given, if ‘No’ then a score of 0. Where a partial score
is given, a score 1 or 2 is made and a comment is added to justify this decision.
Figure 44 Data Robustness Assessment Results
1 2 3 4 5 6 7 8 9 10 11 12 13 14 14 15 16 17 18 19 20 21 22 23 24 25 26 27
Limited Evidence Significant
Unaccredited Recycling
De-minimis Imports & Exports
8
7
6
5
4
High
Low
Agre
em
en
t
Key
UK Wood Packaging Production
Imports & Exports
Grocery POM
9
3
2
1
Retail POM
NPWD Net Pack Fil l POM
Accredited Recycling
Waste Data Flow

WRAP – Wood Flow 2020 80
Figure 45 Data Robustness Assessment: UK Wood Packaging Production
Figure 46 Data Robustness Assessment: Imports & Exports
Evidence (Robustness and completeness, max 27):
Does the data cover the correct time-frame? Most, not all 2 Timcon was updated from 2013
Does the data provide complete coverage? Yes 3
Has the data been sourced from credible, up-to-date sources? Yes 3
Is the underlying data reasonably free from concerns (e.g. official data from the ONS)? Most, not all 2 Based on surveys
Have the findings been independently peer-reviewed? Yes 3
Is the methodology/calculation reasonably free from concerns? Yes 3
Have the methodology/calculations been independently checked (internally or externally)? Yes 3
Is the quantitative evidence well rooted in a wider qualitative understanding of the issue? Yes 3
Have the findings been sense-checked against credible alternative sources (incl. inconclusively)? Yes 3
Total
Degree of agreement around the findings (max 9):
Does more than one data source confirm the findings (within +/- 5%)? Yes 3
Do the key stakeholders/experts actively agree with the findings? Yes 3
Has feedback from the key stakeholders been incorporated in the reporting of findings? Yes 3
Total 9
Scoring Evidence
25
Evidence (Robustness and completeness, max 27):
Does the data cover the correct time-frame? Yes 3
Does the data provide complete coverage? Yes, with reservations 2 Scaling for de-minimis was required
Has the data been sourced from credible, up-to-date sources? Yes 3
Is the underlying data reasonably free from concerns (e.g. official data from the ONS)? Most, not all 2 Scaling for de-minimis was required
Have the findings been independently peer-reviewed? Yes 3
Is the methodology/calculation reasonably free from concerns? Yes, with reservations 2 Scaling for de-minimis was required
Have the methodology/calculations been independently checked (internally or externally)? Yes 3
Is the quantitative evidence well rooted in a wider qualitative understanding of the issue? Yes, with reservations 2 Difficult to cross check de-minimis estimates
Have the findings been sense-checked against credible alternative sources (incl. inconclusively)? No 0
Total
Degree of agreement around the findings (max 9):
Does more than one data source confirm the findings (within +/- 5%)? No 0
Do the key stakeholders/experts actively agree with the findings? Yes 3
Has feedback from the key stakeholders been incorporated in the reporting of findings? Yes 3
Total 6
Scoring Evidence
20

WRAP – Wood Flow 2020 81
Figure 47 Data Robustness Assessment: De-minimis Imports & Exports
Figure 48 Data Robustness Assessment: Grocery POM
Evidence (Robustness and completeness, max 27):
Does the data cover the correct time-frame? Yes 3
Does the data provide complete coverage? Yes, with reservations 1 To able to determine coverage
Has the data been sourced from credible, up-to-date sources? Yes, with reservations 1 Not specific to wood packaging
Is the underlying data reasonably free from concerns (e.g. official data from the ONS)? No 0 Not specific to wood packaging
Have the findings been independently peer-reviewed? Yes, with reservations 2 Not specific to wood packaging
Is the methodology/calculation reasonably free from concerns? Yes, with reservations 1 Not specific to wood packaging
Have the methodology/calculations been independently checked (internally or externally)? Yes 3
Is the quantitative evidence well rooted in a wider qualitative understanding of the issue? Yes, with reservations 1
Have the findings been sense-checked against credible alternative sources (incl. inconclusively)? No 0
Total
Degree of agreement around the findings (max 9):
Does more than one data source confirm the findings (within +/- 5%)? No 0
Do the key stakeholders/experts actively agree with the findings? Yes, with reservations 2 Not specific to wood packaging
Has feedback from the key stakeholders been incorporated in the reporting of findings? Yes, with reservations 2 Not specific to wood packaging
Total
Scoring Evidence
12
4
Evidence (Robustness and completeness, max 27):
Does the data cover the correct time-frame? Yes 3
Does the data provide complete coverage? Yes 3
Has the data been sourced from credible, up-to-date sources? Yes 3
Is the underlying data reasonably free from concerns (e.g. official data from the ONS)? Yes 3
Have the findings been independently peer-reviewed? No 0
Is the methodology/calculation reasonably free from concerns? Yes 3
Have the methodology/calculations been independently checked (internally or externally)? Yes 3
Is the quantitative evidence well rooted in a wider qualitative understanding of the issue? Yes 3
Have the findings been sense-checked against credible alternative sources (incl. inconclusively)? Yes 3 Checked against EA reported Data
Total
Degree of agreement around the findings (max 9):
Does more than one data source confirm the findings (within +/- 5%)? No 0
Do the key stakeholders/experts actively agree with the findings? Yes 3
Has feedback from the key stakeholders been incorporated in the reporting of findings? Yes 3
Total
Scoring Evidence
24
6

WRAP – Wood Flow 2020 82
Figure 49 Data Robustness Assessment: Retail POM
Figure 50 Data Robustness Assessment: NPWD Net Pack Fill POM
Evidence (Robustness and completeness, max 27):
Does the data cover the correct time-frame? Yes 3
Does the data provide complete coverage? No 0
Has the data been sourced from credible, up-to-date sources? Yes 3 ONS and Valpak member data
Is the underlying data reasonably free from concerns (e.g. official data from the ONS)? Yes, with reservations 2
Have the findings been independently peer-reviewed? Yes 3
Is the methodology/calculation reasonably free from concerns? Yes, with reservations 2
Have the methodology/calculations been independently checked (internally or externally)? Yes 3
Is the quantitative evidence well rooted in a wider qualitative understanding of the issue? Yes 3
Have the findings been sense-checked against credible alternative sources (incl. inconclusively)? No 0
Total
Degree of agreement around the findings (max 9):
Does more than one data source confirm the findings (within +/- 5%)? No 0
Do the key stakeholders/experts actively agree with the findings? Yes 3
Has feedback from the key stakeholders been incorporated in the reporting of findings? Yes 3
Total
EvidenceScoring
6
19
Evidence (Robustness and completeness, max 27):
Does the data cover the correct time-frame? Yes 3
Does the data provide complete coverage? Most, not all 3
Has the data been sourced from credible, up-to-date sources? Yes 3 The EA is an official data source
Is the underlying data reasonably free from concerns (e.g. official data from the ONS)? Yes 3
Have the findings been independently peer-reviewed? Yes 3 By the EA
Is the methodology/calculation reasonably free from concerns? Yes 3
Have the methodology/calculations been independently checked (internally or externally)? Yes 3 By the EA
Is the quantitative evidence well rooted in a wider qualitative understanding of the issue? Yes 3
Have the findings been sense-checked against credible alternative sources (incl. inconclusively)? Yes 3
Against total flow and gap between obligated and non-obligated is
reasonable
Total
Degree of agreement around the findings (max 9):
Does more than one data source confirm the findings (within +/- 5%)? No 0
Do the key stakeholders/experts actively agree with the findings? Yes 3
Has feedback from the key stakeholders been incorporated in the reporting of findings? Yes 3
Total
Scoring Evidence
27
6

WRAP – Wood Flow 2020 83
Figure 51 Data Robustness Assessment: Accredited Recycling
Figure 52 Data Robustness Assessment: Waste Data Flow
Evidence (Robustness and completeness, max 27):
Does the data cover the correct time-frame? Yes 3
Does the data provide complete coverage? Yes 2
Has the data been sourced from credible, up-to-date sources? Yes 3
Is the underlying data reasonably free from concerns (e.g. official data from the ONS)? Yes 3
Have the findings been independently peer-reviewed? Yes 3
Is the methodology/calculation reasonably free from concerns? Yes 3
Have the methodology/calculations been independently checked (internally or externally)? Yes 3
Is the quantitative evidence well rooted in a wider qualitative understanding of the issue? Yes 3
Have the findings been sense-checked against credible alternative sources (incl. inconclusively)? Yes 3
Total
Degree of agreement around the findings (max 9):
Does more than one data source confirm the findings (within +/- 5%)? With reservations 2
Do the key stakeholders/experts actively agree with the findings? Yes 3
Has feedback from the key stakeholders been incorporated in the reporting of findings? Yes 3
Total 8
EvidenceScoring
26

WRAP – Wood Flow 2020 84
Figure 53 Data Robustness Assessment: Unaccredited Recycling
Evidence (Robustness and completeness, max 27):
Does the data cover the correct time-frame? Yes 3
Does the data provide complete coverage? Yes 3
Has the data been sourced from credible, up-to-date sources? Yes, with reservations 2
Is the underlying data reasonably free from concerns (e.g. official data from the ONS)? Yes, with reservations 2
Have the findings been independently peer-reviewed? Yes 3
Is the methodology/calculation reasonably free from concerns? Yes, with reservations 2
Have the methodology/calculations been independently checked (internally or externally)? Yes 3
Is the quantitative evidence well rooted in a wider qualitative understanding of the issue? Yes 3
Have the findings been sense-checked against credible alternative sources (incl. inconclusively)? No 0
Total
Degree of agreement around the findings (max 9):
Does more than one data source confirm the findings (within +/- 5%)? No 0
Do the key stakeholders/experts actively agree with the findings? Yes, with reservations 2
Has feedback from the key stakeholders been incorporated in the reporting of findings? Yes 3
Total
Scoring Evidence
21
5
Evidence (Robustness and completeness, max 27):
Does the data cover the correct time-frame? Yes 3
Does the data provide complete coverage? No 0
Has the data been sourced from credible, up-to-date sources? Yes, with reservations 1
Is the underlying data reasonably free from concerns (e.g. official data from the ONS)? Yes, with reservations 2
Have the findings been independently peer-reviewed? Yes, with reservations 1
Is the methodology/calculation reasonably free from concerns? Yes, with reservations 1
Have the methodology/calculations been independently checked (internally or externally)? Yes, with reservations 2
Is the quantitative evidence well rooted in a wider qualitative understanding of the issue? Yes, with reservations 2
Have the findings been sense-checked against credible alternative sources (incl. inconclusively)? No 0
Total
Degree of agreement around the findings (max 9):
Does more than one data source confirm the findings (within +/- 5%)? No 0
Do the key stakeholders/experts actively agree with the findings? Yes, with reservations 2
Has feedback from the key stakeholders been incorporated in the reporting of findings? Yes 3
Total
Scoring Evidence
12
5

www.wrap.org.uk/wood


![FOR RENT Economy Circular Economy Infographic.pdf · the framework of a circular economy."[5] Global Partners Many major companies are embracing the circular economy shift by partnering](https://static.fdocuments.us/doc/165x107/6013459c7f9b4e43ae74bad4/for-rent-economy-circular-economy-the-framework-of-a-circular-economy5.jpg)