Final Report, Volume I--Nitrogen and Ambient Oxygen Testing
159
II AD-A234 757 NASA Contractor Report 185262 Aerojet 2459-56-1 Orbital Transfer Vehicle Oxygen Turbopump Technology Final Report, Volume I--Nitrogen and Ambient Oxygen Testing R.J. Brannam, P.S. Buckmann, B.H. Chen, S.3. Church, and R.L. Sabiers D TIC GENCORP Aerojet TechSystems ELECTE, Sacramento, California APR 0 9 1991 ) C : December 1990 Prepared for Lewis Research Center Under Contract NAS3-23772 DTIC FILE COPY ,'ational Aeronautics and Space Administration c JrxtSO Ise; l
Transcript of Final Report, Volume I--Nitrogen and Ambient Oxygen Testing

II
AD-A234 757NASA Contractor Report 185262Aerojet 2459-56-1
Orbital Transfer VehicleOxygen Turbopump Technology
Final Report, Volume I--Nitrogen andAmbient Oxygen Testing
R.J. Brannam, P.S. Buckmann, B.H. Chen,S.3. Church, and R.L. Sabiers D TICGENCORP Aerojet TechSystems ELECTE,Sacramento, California APR 0 9 1991
) C: December 1990
Prepared forLewis Research CenterUnder Contract NAS3-23772
DTIC FILE COPY
,'ational Aeronautics andSpace Administration
c JrxtSOIse; l

TABLE OF CONTENTS
List of Tables ,0.List of Figures t -'s[ iv"Foreword E l viiSummary Viii1.0 Introduction 1
1.1 Background "1.1.1 Aerojet Dual Expander Cycle . 11.1.2 Oxygen Turbopump t)t " 3
1.2 Objectives 51.2.1 Test 3eries "0" 71.2.2 Test Series "C" 71.2.3 Test Series "El" 71.2.4 Test Series "D" 71.2.5 Test Series "EU" /LT 8
1.3 Scope 4' rjo 81.3.1 General 81.3.2 Specific Subtasks 8
1.4 Relevance to Current Rocket Engine Turbopump Design 91.5 Facility Description 10
2.0 Oxygen Turbopump Testing 132.1 Test Preparation 13
2.1.1 Test Approach 132.1.2 Facility Buildup 132.1.3 Test Procedure 23
2.2 Testing 312.2.1 Facility Checkout and TPA Chilldown 312.2.2 Series C 342.2.3 Series D 352.2.4 Series E 36

TABLE OF CONTENTS (cont.)
3.0 Discussion of Results 40
3.1 Overall Turbopump Performance 40
3.2 Pump Performance 44
3.3 Turbine Performance 50
3.3.1 Analysis Details 52
3.3.2 Discussion of Results 55
3.4 Bearing System Performance 58
3.5 Teardown and Inspection 82
3.6 Conclusions 113
3.7 Recommendations 117
Appendices
A Data Reduction Equations A-1B Test Data Plots From High Pressure High Speed LOX/GOX B-1
Test No. 2459 -D02-OP-183C Symbols arnd Acronyms C-1D References D-1
ii

LIST OF TABLES
Table No.
1.1-1 Technology Goals for the New OTV Engine 22.1-1 OTV Oxygen Turbopump Testing Conditions 14
2.1-2 Test Series "C," "D," and "E" Operating Conditions 162.1-3 Instrumentation List - 2-Wire Channels 212.1-4 Instrumentation List - Transducer Channels 24
2.1-5 Instrumentation List - High Frequency Channels 26
2.2-1 OTV OTPA Testing Summary of Testing Through 3/21! /8 38
3.2-1 Pumping System Calculated Efficiency (Ref. 13) 463.2-2 Data Reduction - Test 183 47
3.3-1 GN2 Pseudo-Ideal Gas Properties 54
3.3-2 GOX Pseudo-Ideal Gas Properties 54
[ iii

LIST OF FIGURES
Figegre No.
1.1-1 Dual Expander Cycle Schematic 41.1-2 OTV Oxygen Turbopump Assembly 6135-1 Oxygen Turbopump on Stand Early in Installation 111.5-2 Oxygen Turbopump on Stand - Installation Completed 122.1-1 Test Schematic: Series "C," "D" and "E" 152.1-2 O1V Oxygen Turbopump Assembly 192.1-3 Instrument Port Location Scheme 202.1-4 Instrumentation Locations - 2-Wire Channels 222.1-5 Instrumentation Locations - Transducer Channels 252.1-6 Instrumentation Locations - High Frequency Channels 272.1-7 Oxygen Turbopump on Test Stand 322.1-8 Oxygen Turbopump on Test Stand 333.1-1 "Waterfall" Plot for Test 133 Probe Signal NT-Z 413.1-2 "Waterfall" Plot for Test 163 Prove Signal NT-Z 423.2-1 Pump Performance 513.3-1 Turbine Efficiency Ratio 53
3.3-2 Turbine Nozzle Flow Test and Measured Value 56after Disassembly
3.4-1 Nominal Assembly Clearances Between Rotating and 59Stationary Parts
3.4-2 Turbine Bearing Flowrate vs Pressure Differential 613.4-3 Pump Bearing Flowrate vs Pressure Differential 62
3.4-4 "X" vs "Y" Orbits at 72,000 rpm 643.4-5 Thrust Bearing Axial Load Capacity vs Axial Clearance, 66
First Stage
3.4-6 Radial Load Across Impeller Port Width vs % Design Q/N 673.4-7 Radial Load on Impe!ler vs % Design Q/N 683.4-8 Radial Load on Pump Bearing vs % Design Q/N 693.4-9 Pump Bearing Flow Ratio vs Test Number 733.4-10 Bearing Inlet and Pump Discharge 75
Pressure vs Shaft Speed - Test 1313.4-11 Bearing Inlet and Pump Discharge 76
Pressure vs Shaft Speed - Test 174
iv

LIST OF FIGURES (CONTINUED)
Figure No.
3.4-12 Bearing Inlet and Pump Discharge 78Pressure vs Shaft Speed Test 183
3.4-13 Bearing Inlet and Pump Discharge 79Pressure vs Shaft Speed - Test 190
3.4-14 Typical Pressure vs Time Plot for GOX Driven, 81Unassisted LOX Bearing Run
3.5.1 Turbine Tip Clearance Check 833.5-2 OTV TPA Components 843.5-3 OTV OTPA Rotating Assembly 853.54 OTV Oxygen Turbopump Rotating Assembly Post-Test 863.5-5 Turbine End Journal Bearing Shaft Surface - Post-Test 873.5-6 Pump Journal Bearing Shaft Surface - Post-Test 883.5-7 Profile of Turbine Bearing Journal Surface Along Shaft Axis 893.5-8 Profile of Pump Bearing Journal Surface Along Shaft Axis 893.5-9 First Stage Impeller Thrust Surface - Post Test 903.5-10 Second Stage Impeller Thrust Surface - Post Test 923.5-11 Pump and Turbine Bearing Post-Test 933.5-12 Turbine Bearing Bore 943.5-13 Turbine Bearing Journal Profiles 953.5-14 Pump Bearing Bore View Looking from First Stage 96
Impeller Side3.5-15 Pump Bearing Bore View from Second Stage Pump Side 973.5-16 Pump Bearing Journal Profile 983.5-17 First Stage Thrust Bearing Surface 1003.5-18 Second Stage Thrust Bearing Surface Post-Test 1013.5-19 Pump Bearing Housing 1023.5-20 Pump Bearing Housing Cup Silver Surface 1033.5-21 Contact Locations on Pump Bearing Assembly 1043.5-22 Second Stage Impeller Housing 1053.5-23 Second Stage Impeller Shroud Contour 1063.5-24 First Stage Impeller Shroud Contour 1083.5-25 Turbine Blades 1093.5-26 Turbine Nozzle Section 1103.5-27 Turbine Nozzle "V" Seal 111
LIST OF FIGURES (CONTINUED)
Figure No.
3.5-28 Turbine Nozzle - Exit Side 1123.5-29 Turbine Tip Seal and Turbine Housing Post-Test 1143.5-30 Turbine Tip Seal Post-Test 1153.5-31 Pump Cross Over Pipe 116
vi

FOREWORD
This document represents a final report to the National Aeronautics and SpaceAdministration for work performed under Test Task Order B.7 to ContractNAS 3-23772. The task work span was from 21 September 1987 to 30 August 1939.
The tests reported herein are Series "C," "D," and "E," of a planned series of six
tests that will verify the operation of a gaseous oxygen driven turbine powering aliquid oxygen pump. No interpropellant seals or purge gas are required for this
concept.
The extended test schedule was the result of a need to convert the test unitfrom a bearing test configuration to a complete turbopump between the Series "B"and Series "C" tests.
Volume I, Reference 1 of this report covered the turbopump design, fabrication,and Series A and B testing. Volume III will report on the testing with 400°F oxygenturbine drive gas which will duplicate the expected engine operating conditions.The site of the 400°F oxygen testing (Series F and G) is the NASA-JSC White Sands
Test Facility in New Mexico.
vii

ORBITAL TRANSFER VEHICLE OXYGENTURBOPUMP TECHNOLOGY
FINAL REPORT, VOLUME IINITROGEN AND AMBIENT OXYGEN TESTING
R.J. Brannam, P.S. Buckmann, B.H. Clen,S.J. Church, and R.L. Sabiers
GENCORP Aerojet TechSystemsAerojet Propulsion Division
Sacramento, California 95813-6000
SUMMARY
This report documents the continuation of testing of a rocket engine turbop-
ump (TPA) designed to supply high pressure liquid oxygen propellant to the engine.This TPA is unique in that it uses hot (4000F) gaseous oxygen as the turbine drive
fluid. It is a critical technology for the dual propellant expander cycle, a cycle usingboth hydrogen and oxygen as the working fluids for a maximum performance cryo-
genic propellant rocket engine.
The first volume of this report (Reference 1) documents the results of earlier
NASA LeRC funded work to determine the structural materials most compatiblewith liquid and 400°F oxygen and the detailed design of the turbopump using thesematerials. It also has a discussion of the TPA fabrication and the Series A and B testswhich verified the hydrostatic bearing concept in a bearing tester using many
common parts from the TPA. These tests successfully demonstrated the hydrostaticbearing system at speeds up to 72,000 rpm in liquid nitrogen. Following these tests,the housing and rotating assembly turbine impellers were finish machined to form
a complete oxygen TPA. Difficulties in finding a competent machine shop willingto bid on this finish machining caused the start of the next series of tests to be
delayed well over a year. The test series*documented herein, Series C, D, and E,started on 15 February 1989 and were concluded on 21 March 1989.
viii

Series C1 used liquid nitrogen in the pump and gaseous nitrogen as the turbine
drive gas. Series C2 used liquid oxygen as the pumped fluid with gaseous nitrogen
driving the turbine. The TPA performed as expected with limitations on the
turbine speed due to the use of nitrogen as the turbine drive fluid which has a lower
density than that of oxygen. In addition, the drive gas temperature was lower than
design temperature and the flow passage resistance was higher than expected.
Series D also used gaseous nitrogen drive while pumping liquid oxygen, but
the starts were made without any prepressurization of the hydrostatic bearings using
the separate bearing assist supply. This is a realistic condition for actual engine
operation, and results in a rubbing start. When the drive pressure exceeded the
"breakaway" force the rotating assembly accelerated normally.
Test Series El demonstrated the pure gaseous exygen turbine drive with LOX in
the pump. This was done with the bearing assist system on. Series E2 again used an
ambient oxygen turbine drive but the bearing assist system was off, and the
hydrostatic bearing system provided its own pressurization after a rubbing start.
Total operating time during the testing was 2268 seconds. The test article had
14 starts without bearing assist pressurization. Operating speeds of up to 80,000 rpm
were logged (Test 135) with a steady state speed of 70,000 rpm (Test 165)
demonstrated.
The hydrostatic bearing system performed satisfactorily exhibiting no bearing
load or stability problems. Post test examinations of the journal and thrust bearing
surfE.ces showed minor evidence of operating wear. The silver plated bearing
surfaces showed some smearing from rubbing and one gouged area apparently due
to a particle passing through the bearing. No monel surfaces were exposed by the
silver plate wear. There was no evidence of any melting or oxidation due to the
oxygen exposure. There was one minor anomaly encountered that was not traced to
a particular cause. This was a slow axial motion, sinusoidal at 10,000 cpm, (-167 Hz)
of ± 0.0005 inch amplitude. It caused no problems during the testing but was plainly
evident in the distance readings from the axial probe.
The conclusion of Series C, D, and E testing made the turbopump hardware
available for refurbishment prior to continued testing. Testing as an operational
turbopump, pumping liquid oxygen and powered by hot gaseous oxygen to the
turbine, is scheduled in 1990 at the NASA White Sands Test Facility, New Mexico.
ix

I
1.0 INTRODUCTION
1.1 BACKGROUND
This oxygen turbopump test program supports the NASA-OAST plans fordevelopment of a new orbit transfer vehicle (OTV) to be operational in the late1990s. Critical to the economical operation of a space based OTV is a new 0 2/H 2
rocket engine with capabilities superior to existing engines. Table 1.1-1 presents thetechnology goals for the new OTV engine. It summarizes the characteristics of theproduction RL-10 reference engine and those desired in a new engine. In total, theserequirements represent a substantial advance in the state-of-the-art, and aconsiderable challenge to rocket engine designers.' Aerojet Propulsion Divisicn hasselected a unique engine cycle and turbopump designs in response to thoserequirements. The result is an advancement in the state of the art that combines aheated oxygen driven turbine with a leng life hydrostatic bearing system to yield an
advanced, high performance oxygen turbopump.
1.1.1 Aerojet Dual Expander Cycle
In a conventional (single) expander cycle engine hydrogen is
routed through passages in the combustion chamber where it cools the wall andacquires thermal energy to power the turbine of both hydrogen and oxygen pumps.It is then routed to the injector for combustion. This cycle is fairly simple, and it
offers good performance potential as all propellant is burned in the combustionchamber. It does not have the losses associated with open cycles. Its limitations arerelated to dependence on only one propellant as a turbine drive fluid which, inturn, requires interpropellant seals and purge gas for the oxygen turbopump. Toobtain the needed power the hydrogen must be heated to a temperature very near tothe design limit for the copper based alloys employed for the chamber liner. Withthe added limits imposed by the high number of starts, long operating times with-
out maintenance, and a 10:1 or greater engine thrust throttling requirement, thehydrogen expander cycle is capable of only modest performance and lifeimprovements over the production RL-10 engine.
The Aerojet dual expander cycle alleviates these limitations by using oxygen as aworking fluid as well as hydrogen. This reduces the demands on the hydrogen

-.. U)
E M 0 CD
.Cc 0
0 E cm =-a.0 CL .0 r=RU
0- E_-0EzO ~ 0 0 10 0 W ob )
=0 e L-04 00 z
(0 3_ 0 L
I-ac U a cc 00z * 0 _ %'O
0) 0 8 =c
SE00 E
BEE
0~C a)CuC Muir -%00 cc Q:. co
x 0OCwzz ~ ~ ~ * 16, o Alo R0'
&'20C U)i.O >0)S0 CL 0>
CLLL > tL
aE E)0a CU'
.V m (A »0 =0o E E 0
oom (M 02
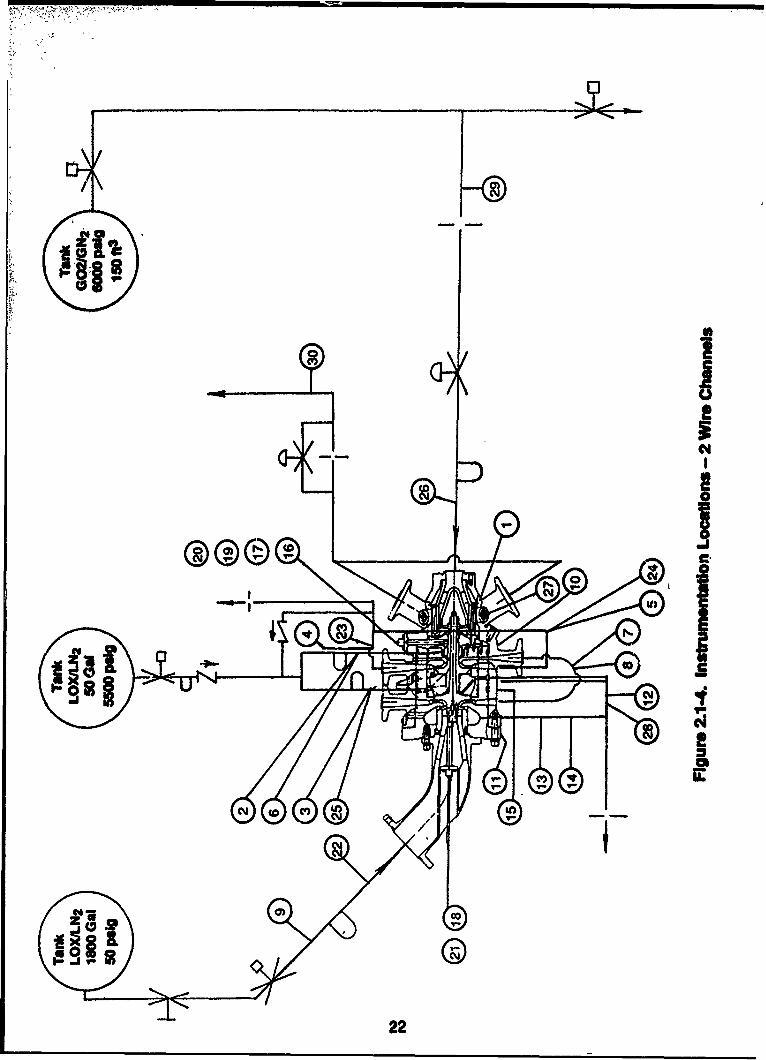
1.1, Background (cont.)
circuit as the oxygen turbopump is driven by heated oxygen. It also eliminates theneed for an interpropellant sea' and the associated helium purge system weight
penalty. The oxygen is heated to approximately 400*F by flowing through aLOX/GH 2 heat exchanger and then through the regeneratively cooled nozzle exten-sion. The flow schematic is shown in Figure 1.1-1. Th.e hydrogen used to heat thecold oxygen in the heat exchanger is the effluent from the hydrogen TPA turbine. Itprovides the thermal energy to the oxygen at a thermodynamic cost to the hydrogen
circuit of the pressure drop across the heat exchanger. Also, both propellants aredelivered to the thrust chamber injector as superheated gases; an important aid tocombustion stability over a wide throttling range.
1.1.2 QO gen Turbopum=
Key to this turbopump design is the use of a hot oxygen turbinedrive. Many turbopumps have been successfully use4 to pump liquid oxygen, buthot oxygen has been considered too reactive to use as a turbine drive fluid. TheNASA LeRC has sponsored an extensive program in oxygen compatibility experi-ments with various materials and under ,aeious conditions of pressure, tempera-ture, and mechanical stress. A number of materials have been identified that can beused in an oxygen turbopump with high confidence that the materials will notignite under either particle impact or minor rubbing at temperatures in the 40°0Frange. Despite the experimental data, verification of an oxygen turbopump requiressuccessful completion of an extensive test program with a TPA in oxygen service.At the completion of this program the TPA will have demonstrated compatibility ofthe selected materials with cryogenic oxygen, ambient oxygen, and 400*F oxygen inconditions closely approximating actual service.
The oxygen TPA also uses a number of design innovations otherthan materials selection. The most critical is the self aligning hydrostatic bearingsystem. The long life requirements of the OTV engine are incompatible with con-ventional ball bearing systems that require rolling and sliding contact in liquid oxy-gen at high speeds. A hydrostatic bearing was chosen for thi ; TPA as it had thepotential for very long service life free of wear or fatigue life limits.
3

wzsft. %fS~lf% Sll
x zs
ILI
ý ow
& -El-af 10
.4 9s Fas 0.0 ea aa -0. ........
, 0g.
080
> a-cc5
CL m
)I-
C2..514
>

1.0, Introduction (cont.)
The oxygen turbopump consists of a single stage full admission
axial flow turbine that drives an inducer and a two stage centrifugal pump, Figure1.1-2. The centrifugal pump impellers face in opposite directions utilizing the backoi their hubs as part of the axial thrust bearing. A journal bearing is integral withthe second stage thrust bearing and is located between the thrust faces. A secondjournal bearing, located between the pump and turbine, carries radial load only.Both bearings are hydrostatically supported to permit self-alignment. Maximumbearing capacity is achieved with parallel alignment. The inducer permits full speed
operation down to a 'minimum Net Positive Suction Head of 80 ft-lbf/lbm of liquidoxygen. An additional 17.3 gpm capacity is designed into the inducer. This flow isturned radially before the first stage centrifugal impeller and is collected in anannulu,; to then be conveyed to a boost pump hydraulic turbine.
A boost pump, not part of this contract, will be required to meet the2 ft. lbf/lbm minimum Net Positive Suction Head at 162.70R when flowing liquid
oxygen, Table 1.1-1. The 156 hp iarbine powers the pumps to 75,000 rpm whichdeliver 34 gpm of liquid oxygen at 4600 psi pressure rise. Complete design
specifications are discussed in Reference 1.
The design of this bearing system as well as the turbopump design,materials selection, fabrication, and Test Series "A" and "B" are covered in detail in
Volume I of this report (Reference 1).
1.2 OBJECTIVES
The fundamental objective of the OTV oxygen turbopump test program isto identify and develop the pertinent technoiogy for operating a high pressure LOX
pumping/GOX driven turbopump for extended duration with multiple start/stopcycles. The main technology issue is the ignition potential from a metal rub or par-ticle impingement in pure oxygen service. The overall goal is to provide extendedlife and restart capability. The main thrust of the test program is to demonstrate theviability of this design approach for high-speed LOX/GOX turbopumps, and todevelop a data base in this area.
Specific test objectives for series testing are outlined below.
5

ww
aa.
a cc
2= c
C11

1.2, Objectives (cont.)
1.2.1 Test Series "0"
The objective of Series "O" was to checkout all systems prior to
shaft rotation. This included a helium leak and moisture content check of the
turbopump and all associated plumbing. The system was then chilled with liquid
nitrogen and all instrumentation was checked for function without shaft rotation.
At this time, the bearings were pressurized with liquid nitrogen to ensure proper
shaft/bearing alignment.
1.2.2 Test Series "C"
The objective of Test Series "C" was to obtain turbopumpperformance data of the OTV oxygen turbopump with minimum risk to the
hardware. Risk was minimized by powering the turbine with ambient temperaturegaseous nitrogen and by using a high pressure bearing assist to support the shtft
prior to and during low speed rotation. Performance was measured over a range of
404 o 120 percent design pump flowrate to speed ratios, Q/N, at intervals of 20%.Test Series C1 used LN2 in the pump and bearings. These tests were followed by
Test Series C2 which used L02 in the pump and bearings.
1.2.3 Test Series "El"
The objective of Test Series "El," was to demonstrate the pure
oxygen driven gas turbine for the first time. The turbine was plumbed to theambient GOX supply and it powered the pump, pumping LOX from zero to the
maximum operating speed with ambient GOX. Approximately five minutes of runtime was to be accumulated with the bearing assist system on.
1.2.4 Test Series "D"
The objective of Test Series "D" was to demonstrate a start of the
turbopump shaft system without the external bearing assist system. In thisconfiguration (unassisted bearing start) the bearings are initially supplied with
suction line pressure only. A discussion of the bearing assist system is given in
Section 2.1.2.3. Bearings were fed from the pump discharge so that shaft rotation
7

1.2, Objectives (cont.)
would start with bearing hydrostatic lift limited to pump discharge pressure. Series"D" testing was run using GN2 as the turbine drive gas and LOX as the pumped
fluid.
1.2.5 Test Series "E2"
The objective of Test Serier, "E2" was to demonstrate six unassistedbearing starts as in Series "D," using an ambient oxygen driven turbine whilepumping liquid oxygen. Bearing lift-off was achieved with oxygen tapped from thepump second stage discharge line.
1.3 SCOPE OF WORK
1.3.1 General
Aerojet Propulsion Division shall cone uct a test program to
determine the performance and operaiing characteristics of the oxygen turbopumpfor the Aerojet Orbit Transfer Vehicle engine design concept.
1.3.2 Specific Subtaslk
1.3.2.1 Subtask I - Testing
Aerojet Propulsion Division shall conduct test evaluations todetermine the design and off-design performance and operating characteristics ofthe oxygen turbopump previously designed, fabricated, and tested as a bearing tester.
Testing shall be conducted in accordance with the detailed test plan and shall consistof the following series:
Series C: The turbopump configuration shall consist of bladedpump and turbine stages but shall utilize external pressurization
of the hydrostatic bearings. The pump fluid shall be liquid oxy-gen and the turbine drive fluid shall be gaseous nitrogen. Testsshall be conducted to verify overall turbopump performance andto demonstrate the ignition-resistance of the pump ci cuit.
8

1.3, Scope of Work (cont.)
Series D: The same configuration shall be tested with internal
(pump discharge) pressurization of the bearings. The same fluids
shall be used. Tests shall be conducted to demonstrate the bearingstart transient with internal pressurization and the ignition-resis-
tance of materials in the pump circuit.
Series E: The same configuration as used in Series D shall betested with liquid oxygen as the pump fluid and gaseous oxygenas the turbine drive fluid. Turbopump performance at nominaland off-nominal operation shall be characterized. The ignition-
resistance of the turbine circuit shall be demonstrated.
1.3.2.2 Subtask II - Reporting
The reports shall be prepared and distributed in accordance with
contract requirements. In addition, a final formal report will be submitted and will
cover the design, fabrication and testing.
1.4 RELEVANCE TO CURRENT ROCKET ENGINE TURBOPUMP DESIGN
The intent of this technology program is to demonstrate and reduce topractice several key design innovations that, taken together, significantly advancethe design base for rocket engine turbopumps. These design innovations are:
1) Use of hot (400°F) oxygen as a turbine drive fluid.
2) Use of the monel family of alloys along with various platings for
material's compatibility with both liquid and hot oxygen.
3) Use of a hydrostatic bearing system in LOX to meet performance goalsand operating life goals well beyond current rocket engine require-ments.
4) Use of an articulating, self adjusting spherical bearing system to hold
close running clearances by accommodating minor shaft motion and
misalignment.
9

1.4, Relevance to Current Rocket Engine Turbopump Design, (cont.)
5) Demonstration of a rotating assembly design that will operate subcrit-
ically over the operating range for a deep throttling engine.
6) Incorporation of unshrouded impellers to achieve a more stable headversus flow operating characteristic (negative slope) over a 20:1 thrustthrottling range.
7) Elimination of the need for an interpropellant seal and a purge gas
system by using an oxygen turbine driving an oxygen pump.
1.5 FACILITY DESCRIPTION
The oxygen TPA testing was conducted at the Aerojet 'A Zone' tesf facility.This test complex includes a central control room adjoining a laboratory experimen-
tal facility. An earth embankment separates the control room from the complex oftest bays. The oxygen TPA testing was done in Bay 7.
The facility is set up such that all valves are actuated from the controlroom. Propellant tanks used in Series "C," "D," and "E" testing are located outside
Bay 7, either in other Bays or on the other side of the earth embankment. The pro-
pellants used in Series "C," "D," and "E" testing, nitrogen, helium, and oxygen, werevented directly to atmosphere after passing through the TPA. Testing was con-
ducted remotely from the control room and monitored by video, sound, alod other
electronic instrumentation.
Figure 1.5-1 shows the TPA early in the installation period, mounted onthe test stand. Figure 1.5-2 shows the TPA, obscured by wires and lines, after the
intallation was completed.
10

wc
m U
ac
ccaw1
c kz c
ccc2
ILt I'U13
CL
'U
IL C-
(3 Sw
cmm

usz
v.A.
CL
cc2
121

2.0 OXYGEN TURBOPUMP TESTNG
2.1 TEST PREPARATION
2.1.1 Test Approach
The test program consisted of taking a fully operational turbopumpthrough a series of tests, Table 2.1-1, progressively obtaining performance, opera-tional and life experience. Test Series "C" and "El" were setup with the bearing
Lnlet ports pressurized by a separate supply tank before power was supplied to theturbine in order to ensure the bearings would lift-off the shaft assembly prior to
rotation (refer to the schematic in Figure 2.1-1). Test Series "C" and "D" usedgaseous nitrogen to drive the turbine, and Test Series "El" and '2." used gaseousoxygen for turbine operation. Test Series "D" and "E2" were run without the highpressure assist to the bearings in order to demonstrate tank-head start conditions.
2.1.2 Facility Buildup
2.1.2.1 Facility Requirements
The turbopump predicted performance tabulation shown in
Table 2.1-2 was provided to assist in determination of storage vessel capacities, linesizes, test run durations, pressure capabilities, and other parameters impacting the
test facility design.
2.1.2.2 Facility Schematic
Figure 2.1-1 is a schematic diagram depicting the turbopump
along with major test stand components and lines.
2.1.2.3 Hardware Description
The OTV LOX turbopump consists basically of a two-stage cen-trifugal pump directly driven by a single-stage axial flow turbine (Figure 1.1-2). Thefirst pump stage incorporates an inducer section to meet Suction Specific Speed
requirements and to provide pressurization for the low speed boost pump which
would be used in a flight system. The interstage pump flow (Stage 1 to Stage 2) isrouted external to the main housing through two ducts connecting first-stage
13

Z Le* e e 7- 00i 0 I
V-V-V-V-T- V- V-V-V9 V V 9- to - W 0
G a .0
C 0.UN R0 F CCwad e -
E 09 0.J cc
(a 06
a.'P. n U.
1 -Ic
wu-w*1 ui Z 0 Z0
5 0~~ 0 0000
c 9- ____o c*
0 0 00ce
IIN
00
0 r4 zCIw C)
w0
ww
14

1~ W "~' ~ -- ~ -- - '
"3uaM
aC
z%
> cU
00
Z..;
z F6wU
AS
0_13

TABLE 2.1-2
TEST SERIES "C," "D," AND "E" OPERATING CONDITIONS
Maximum Speed Operating Conditions - Predicted Performance
Design Test SeriesConditions Nominal "Cl" "C2" & "D" "El" & I'M"
PumpPumped Fluid L02 LN2 Lo2Number ofStages 2 2 2 2Weight Flow Rate -lb/sec 5.4 43 5.4 5.4Volume Flow Rate - 51A 58.0 51A 51.4
Inducer - GPMVolume Flow Rate - 34.1 38.5 34.1 34.1
Impellers - GPMNet Postive Suction 80 97.1 71.3 71.3Head - ft.
Suction Pressure - psia 54.6 50 50 50Discharge Pressure - psia 4,655 2,500 4,580 4,580Head Rise, Inducer - ft 52.5 459 520 520Head Rise per Stage - ft. 4,575 3,504 4,575 4,575Speed - RPM 75,000 70,500 75,000 75,000Pump Shaft Power - HP 158 102 155 155
TurbineDrive Gas GO2 GN 2 GN 2 G02Tubine Shaft Power - HP 163 105 163 163Inlet Temperature - 'R 860 510 510 510Inlet Pressure - psia 4,170 2,200 3,780 4,130Exit Pressure - psia 2,327 1,250 2,290 2,290Pressure Ratio 1.79 1.76 1.65 1.80Flow Rate - lb/sec 4.91 3.32 5.58 6.31
16

2.1, Test Preparation (cont.)
discharge to second-stage inlet. Double discharges are utilized on both pump stagesto reduce flow induced hydraulic radial loading. The shaft system is sipported bytwo hydrostatic bearings each supplied with high pressure propellant (LOX or LN 2)
from the second stage pump discharge after pump discharge pressure exceeds
bearing assist pressure. Both bearings articulate on spherical seats, providing ameasure of compensation for misalignment and/or transient thermal distortion.
The hydrostatic bearings provide a very stiff radial and axial support for the rotorsystem. This facilitates sub-critical operation with ample margin, and very small
shaft displacements at all speeds. The result is high efficiency in the turbo-machinery by virtue of the close running clearances at whici impellers and turbines
can be operated.
Provision is made for future addition of a hydraulic boost pump,
with an internal extraction point at the inducer discharge and delivered via aflanged pc -t in the outer housing. Although the boost pump was not incorporatedfor this test, the flow for boost pump drive was tapped off, orificed and measured.
A separate high pressure liquid oxygen (or nitrogen) supply sys-
tem is used for bearing pressurization. Without this bearing assist pressurizationthere will always be a brief period at low speed where the rotating assembly contacts
the bearing surfaceo. As the speed increases and pimp output rises the rotating
assembly is stabilized within high pressure fluid films without any mechanicalcontact. The rotating pump bearing journal and thrust faces have a thin densechromium surface treatment at potentiai contact points for a hard, low friction, wear
resistant surface. Mhe turbine bearing journal was left with the untreated monelK500 surface in an attempt to verify the prediction that the K500 has adequate wear
resistance without surface treatment. Post test inspection showed both the treatedand untreated surfaces in good condition. The correb,.'rding bearing surfaces aresilver plated to give a low friction, highly ignition resistant surface whosemechanical wear products will not add combustible particles to a high speed streamof oxygen. These surfaces then, are designed to accept the repeated rubbing starts
from actual engine operation.
17

2.1, Test Preparation (cont.)
For the initial testing the bearing assist system reduces potential
hazards and the wear attendant in over a hundred starts by prepressurizing thebearings prior to rotation. Transition from bearing assist to pump providedpressurization is done with a check valve that opens when the pump discharge
pressure is greater than the bearing assist pressure. In a flight system there would be
no special bearing assist; all pressurization would be from the pump discharge.
The test configuration of this turbopmnp is shown in Figure 2.1-2and is further defined in Aerojet drawing No. 1197585-9 and sub-tier drawings. Thetest unit incorporates special instrumentation which is detailed in Section 2.1.2.4.The instrumentation provided with the turbopump assembly also includes axial
and radial shaft displacement sensors.
2.1.2.4 Instrumentation
The scheme for identification and location of instrument ports
on the test unit is presented in Section 2.1.2.4.1. The instrumentation list in Section2.1.2.4.2 •nclfdes units, ranges, and.type of instrument for all parameters that wererecorded. The accompanying sketches relate the symbols in the instrumentation listto approximate locations on the test unit.
2.1.2.4.1 Port Location Scheme
The instrumentation list gives nomenclature and locations for
ports located on the test unit. The nomenclature refers to the symbol etched ortagged on the test unit. The approximate locatic.n of each port is designated by a dis-tance and an angle as described in Figure 2.1-3.
2.1.2.4.2 Instrumentation List
The instrumentation list is divided into the three functional
types of wiring used to transmit the electrical output of the instruraents: (1) a two-wire system, (2) a transducer system and (3) a high frequency system.
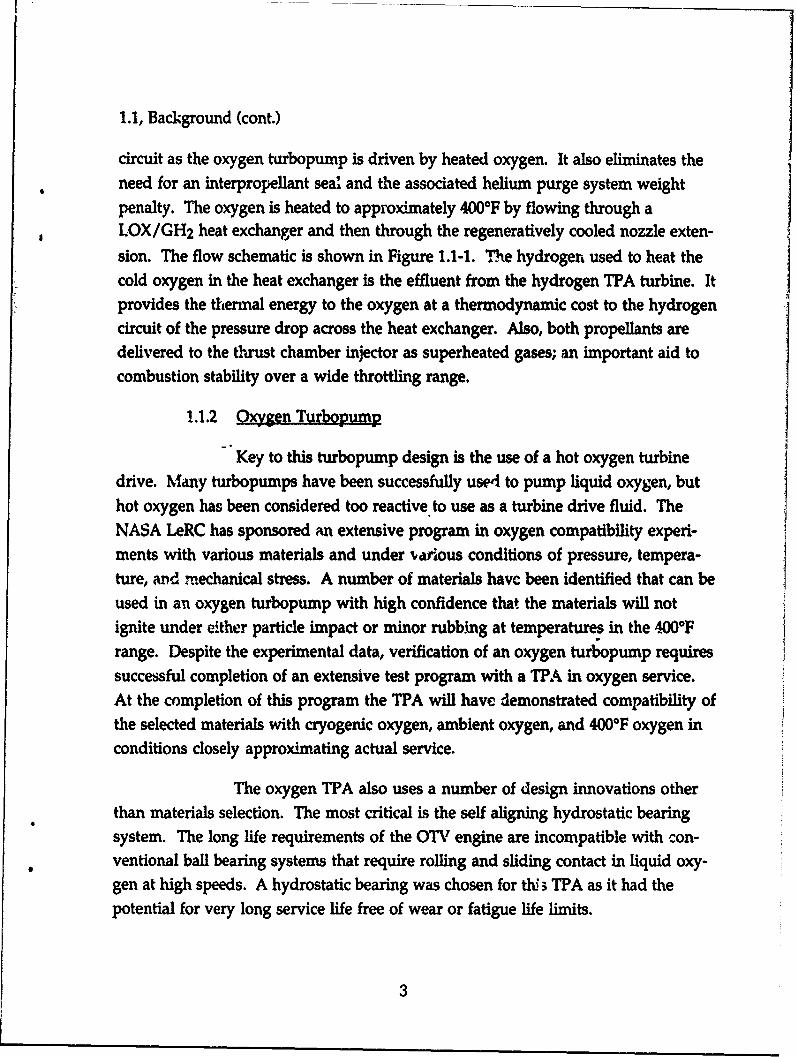
The two-wire system is outlined in Table 2.1-3. The location of
the sensor is number coded, 0, on the flow diagram Figure 2.14.
18

0 A6. ON
II
3E
oxl
0
1.19

IncreasingLength
S 4So
0 ~ 1LK
901D 27-0010 900
/6Pu end d Iooturbine (driving) e•.d
Shaft rotates Shaft rotatescounterclockwise clockwise lookinglooking at pump at turbine (driving)(driven) end end
£KAHPLC:"--XAM--- Port location illustrated on cylinder outside diameter is notedis (L,4S) for L" distance from outside surface of the pumO end in a plane45 degrees from the vertical center line in a clockwise direc.tion whenlooking from the turbine end. Location designator ignores radial distance.
Figure 2.1-3. Instrument Port Location Scheme
20

LL A. L L 00a U. UL. 0Lt. U. LA. LL0 LL L L LL. U. 0. LL L0 S. (3 0 SD a 0 0 LC Ls0sa20(
U- U- )U W W W W
- w I . .O.
w W3
j.A LLU.F
00 z Niit
-0 C#)c' c 00V C
___ I 0.cJc-II P 0 -C..
f 01 0.,
amR' 911111 0Iil I
21
la,
CV cmq
ep~
22

2.1, Test Preparation (cont.)
The transducer system is outlined in Table 2.14. The location
of the sensor is number coded, •, on the flow diagram Figure 2.1-5.
The high frequency system is outlined in Table 2.1-5. The loca-tion of the sensor is number coded, ['I, on the flow diagram Figure 2.1-6.
2.1.3 Test Procedure
2.1.3.1 Test Descriptions
Test Seriesý ""- Checkout
After plumbing was completed in Bay A7, the system was leakchecked by pressurizing with 50 psig dry (less _tan 50 ppm water) helium. Afterleaks were sealed, a helium purge at 50 psig was applied to the turbopump, andmaintained at all times when testing was not in progress.
An instrumentation checkout was performed next, followed by amoisture content check of the helium discharged from the TPA. When the mois-ture content was found to be less than 50 ppm water, liquid nitrogen was introducedin the pump circuit and bearing feed lines. The pressure in the bearing feed wascycled from zero to 2800-3800 psia five times in order to align the bearing/shaft sys-tem.
Test Series "Cl" - Pump, Bearing and Turbine Performance
The complete turbopump was operated with the inducer %ndcentrifugal pumps pumping liquid nitrogen and the tarbine flowing ambienttemperature gaseous nitrogen plumbed per Figure 2.1-1. The turbopump waspowered by increasing turbine inlet pressure to 3000 psia maximum with a speedlimit of 68,000 rpm. Speed changes were limited to a rate of 4000 rpm/second.Flows, pressures, speed and temperatures were recorded per Section 2.1.2.4. Bearingassist pressure was initially set at 1200 psia minimum for this Series. Dual checkvalves were employed to ensure the bearings were fed by the bearing assist systempressure before shaft rotation. Sufficient runs were conducted at approximately 20%
23

wi
0000 0 00000
OR oRoooooooooocooo- - -. - -a 01 1 1 0 0 0 - 0.. a - 0a - 1 1
iNNI~NNNIN- - a tno- N n 0 -' - 0
0) 0
w iool c'JIO 010 000o
.~~ ~ -- a a- a-
(LW - I "wLU~ l
169 8I-1 dC LLC.NC (WIIL0. _ _
c1
24w

0
Y~n. . . _ ( . . .. .€ , ..
0u 14ODJ
c CL
25
25 •

71
WN N N~
1- -1 1
00000
T- V- V- V- 1
00000
0000
*cif, r-1rI 0000oC
C0)
_0 0
MIU00
cw w(D
L o !
ad cm o t

464
c CL
C4
uro
27z

2.1, Test Preparation (cont.)
intervals of design flow/speed ratio from 40% to 120% Q/N until the goals of Table
2.1-1 were met for this series.
Test Series "C2" - Pump, Bearing and Turbine Performance
The complete turbopump was operated with the inducer and centrifugal pumpspumping liquid oxygen and turbine flowing ambient temperature gaseous nitrogen.
The tukbopump was powered by increasing turbine inlet pressure to 4,850 psia maxwith a speed limit of 70,000 rpm. Flows, pressures, speed and temperatures wererecorded per Section 2.1.2.4. Bearing assist pressure was 500 ± 50 psia for this Series.Sufficient runs were conducted until the goals outlined in Table 2.1-1 were
achieved.
Test Series "El" - Demonstrate Oxygen Driven Turbine
The turbopump was operated with the inducer and centrifugalpumps pumping liquid oxygen and turbine powered by ambient temperaturegaseous oxygen during this series. The turbopump was powered by increasingturbine inlet pressure to 4000 psia with a speed limit of 63,000 rpm. Bearirtg assist
pressure was 500 ± 50 psia for this series. Eight runs were necessary to achieve thegoals outlined for Series El in Table 2.1-1.
Test Series "D" - Demonstrate Unassisted Start of Bearings
The turbopump was operated with the inducer and centrifugal pumps flowing liq-uid oxygen and the turbine flowing ambient temperature gaseous nitrogen. Bearingassist pressure was reduced to 55 ± 5 psia (pump suction pressure) to simulate atank-head ,tart. Turbine inlet pressure was increased to 1600 psia with a speed limitof 42,000 rpm. Six unassisted starts were necessary to achieve the 60 second run time
goal of Table 2.1-1.
Test Series "E2" - Demonstrate Unassisted Start with Oxygen
Driven Turbine
The turbopump was operated with the inducer and centrifugalpumps pumping liquid oxygen and the turbine powczcd by ambient temperature
28

2.1, Test Preparation (cont.)
gaseous oxygen. The turbopump was powered by increasing turbine inlet pressureto 4000 psia with a speed limit of 63,000 rpm. Bearing assist and pump inlet
Ab •pressures were 55 ± 5 psia for this series. Eight unassisted starts were necessary toachieve the minimum run time requirement of this Series.
2.1.3.1.2 Special Requirements
Aerojet Propulsion Division Test Laboratory furnishedalternate sized pump discharge orifices in addition to the one for nominal Q/N foroff-design Q/N operating points. Data points were recorded over the full speedrange. Turbine inlet pressure was not increased until saturated liquid was present atthe pump inlet for all runs.
2.1.3.1.3 Starts with Bearings Assisted
In Series "C" and "E" the hydrostatic bearings were pressurizeddirectly from a high pressure 50 gallon run tank to assure lift-off in the bearingsbefore rotation. During LN2 pump tests, Series C1, the bearing assist pressure was
maintained well above pump discharge pressure to assure adequate critical speedmargin. Check valves were placed in the tank fed bearing supply line and a secondvalve in the pump discharge fed bearing supply line, Figures 2.14 and 1.2-6. Whenpump discharge pressure exceeded bearing assist pressure the pump then suppliedthe high pressure to the hydrostatic bearings.
2.1.3.1.4 Starts with Bearings Unassisted
The bearing assist system pressure was reduced to pump inletPressure (55 psia) for Series "D" and "E2" so that bearing lift-off occurred as a resultof pump discharge pressu. .lone as discharge pressure increased with pump speed.A speed kill was set at 80,000 rpm for this test.
The shaft experienced auto rotation during chill-in. This made
it a necessary to supply the bearings with 200 psia minimum assist pressure until 5.,econds before an unassisted start.
29

Zip Test Preparation (cont.)
2.132 Data Requirements
* • The data furnished by the Test Laboratory for each test performedfalls into five general categories. These are digital data, plots, floppy diskettes, mag-netic tape and calculated performance. The requirements are described in the fol-lowing sections. The Test Laboratory shall retain archive copies of all test data for aminimum of 3 years.
2.1.3.21 Digital Data
Digital printed data was provided for all test runs for quick look purposes,in absolute engineering units. This data was in the form of a time history for thietest. An "edit ratio" was used in printing the data scans, for selected tests, to reducethe volume of printed data. The digital data is in the form of computer printouts.One copy of all digital data was furnished to the TPA Lead Engineer.
- 2.1.3.2.2 Plotted Data
Plots were provided of all pertinent parameters versus time for
selected test runs. One copy of all plots were provided to the TPA Lead Engineer.
2.1.3.2.3 Floppy Diskettes
Raw data from selected tests was furnished to Engineering onfloppy diskettes in spread sheet format. These data were calibrated but not screenedor reduced.
2.1.3.2.4 Magnetic Tape
Output signals from accelerometers and distance detector probeswere continuously recorded on magnetic tape. One copy of all magnetic tape datawill be stored at Aerojet Propulsion Division Test Area Archives for three years.
30

2.1, Test Preparation (cont.)
2.1.3.2.5 Calculated Parameters
Performance calculations were performed for selected test runs.
Equations for these parameters (using variable names and channel numbers) areprovided in Appendix A.
2.1.3.3 Photographic Records
The Test Laboratory has provided 8" x 10" color photographs doc-
umenting the test stand with the test unit mstalled. These include both overallviews and close-up views. The photographs are sufficient in quantity and detail to
identify plumbing and instrumentation line connections. Figures 2.1-7 and 2.1-8 are
examples of such photos. Additional photographs were taken of the stand duringthe test program. The test stand was videotaped during all testing, as was theoscilloscope when a shaft orbit was visible.
2.2 TESTING
Testing of the OTV oxygen turbopump was performed at AerojetPropulsion Division from 9 February through 21 March of 1989. Testing wasdivided into three main test series, "C," "D," and "E," and performed in the order ofincreasing risk.
2.2.1 Facility Checkout and TPA Chilldow,
Before beginnig high-speed turbopump testing, a facility checkout
and TPA chilldown tests were performed. Minor facility and TPA leaks were sealedon 9 February, and time was spent determining the most efficient method ofchilling the TPA to saturated LN2 temperature. A circuit bypass chill-in flow
around the highly restrictive pump discharge orifice had to be installed.
It was also during this phase that instrumentation problems wereaddressed. The main problem was the nonfunction of displacement/speed probes.The displacement probes used are quite sensitive to operating temperature and pro-duce out-of-range readings when either the operating temperature or gap between
31

(Dw 0
L 0)c'J
0
0 ui 0
0.
z
0 0)
UU. SiI0CC
z C2

ux
ir
0 Ix va,
3 CL LU
CO co
3
ca
lk
Nk ui
CL
an WRM MWto
0
CLall
CL
IL
, ?
CL
33

2.2, Testing (cont.)
the probe and target are noi optimum. Since operating temperature was notadjustable, experimentation with gap size was performed with each probe. The best
results of these experiments resulted in the axial probe functioning successfully for
nearly all tests, and the radial probes functioning only intermittently throughoutthe test program.
The main area of work during the "checkout" phase was thecontrol of the two facility flow control valves. One of these valves was located
upstream of the turbine, and s(.rved to control the flow and inlet pressure to theturbine. The other was located downstream of the turbine and served to control theturbine back-pressure. Workirrg together, these valves controlled the turbinepressure ratio, turbine power aad to some extent the axial thrust balance of the TPA.The valves were critical to perfo:-inng a successful TPA test. The main challenge incontrolling these valves was sequencing the valves to maintain the desired pressureand pressure ratio rise rate. A start that was too fast resulted in automatic test kills
due to low pump suction pressure, high shaft speed or high pump dischargepressure. Conversely, a start that was too slow resulted in an array of automatic testkills associated with low shaft speed. A slow rate would also cause excessivedepletion of turbine supply gas sufficient to limit maximum operating speed.
Chill-in and facility checkout efforts culminated in a successful lowspeed test, test number 124, on 20 February in which there were no automatic kills.All work after the helium leak-check in this phase was performed with LN 2 as thepumped fluid and ambient temperature GN 2 as the drive gas.
2.2.2 Series C
Test Series C was the first attempt at obtaining performance datafrom the OTV oxygen turbopump. Series C was further divided into Series C1 andC2. Series C1 consisted of operating the turbopump at five operating points using aGN2 turbine drive, pumping LN 2. The successful completion of Series C1 qualified
the turbopump for operation at high speed and off-design flow without mechanicaldifficulty. The total run time accumulated on the turbopump through Series C1 was
646 seconds.
34
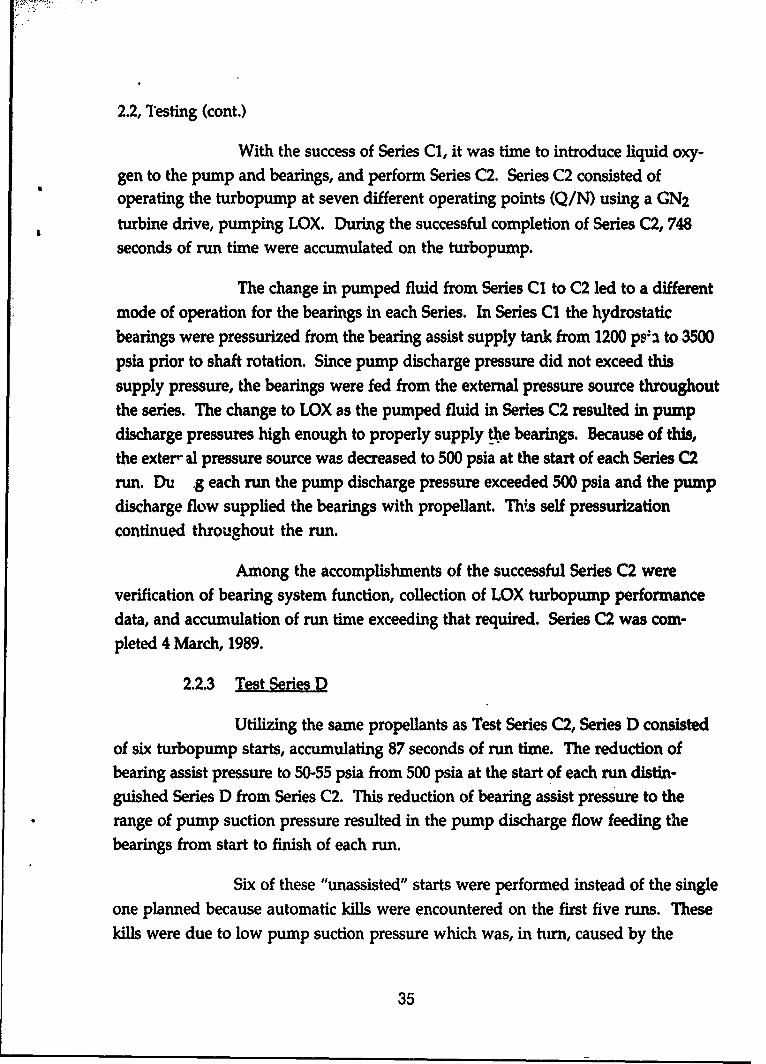
2.2, Testing (cont.)
With the success of Series C1, it was time to introduce liquid oxy-
gen to the pump and bearings, and perform Series C2. Series C2 consisted ofoperating the turbopump at seven different operating points (Q/N) using a GN 2
turbine drive, pumping LOX. During the successful completion of Series C2, 748seconds of run time were accumulated on the turbopump.
The change in pumped fluid from Series C1 to C2 led to a different
mode of operation for the bearings in each Series. In Series CI the hydrostaticbearings were pressurized from the bearing assist supply tank from 1200 ps':a to 3500
psia prior to shaft rotation. Since pump discharge pressure did not exceed this
supply pressure, the bearings were fed from the external pressure source throughoutthe series. The change to LOX as the pumped fluid in Series C2 resulted in pumpdischarge pressures high enough to properly supply the bearings. Because of this,
the exter al pressure source was decreased to 500 psia at the start of each Series C2run. Du .g each run the pump discharge pressure exceeded 500 psia and the pumpdischarge flow supplied the bearings with propellant. Thts self pressurizationcontinued throughout the run.
Among the accomplishments of the successful Series C2 wereverification of bearing system function, collection of LOX turbopump performancedata, and accumulation of run time exceeding that required. Series C2 was com-pleted 4 March, 1989.
2.2.3 Test Series D
Utilizing the same propellants as Test Series C2, Series D consistedof six turbopump starts, accumulating 87 seconds of run time. The reduction ofbearing assist pressure to 50-55 psia from 500 psia at the start of each run distin-guished Series D from Series C2. This reduction of bearing assist pressure to therange of pump suction pressure resulted in the pump discharge flow feeding thebearings from start to finish of each run.
Six of these "unassisted" starts were performed instead of the singleone planned because automatic kills were encountered on the first five runs. Thesekills were due to low pump suction pressure which was, in turn, caused by the
35

2.2, Testing (cont.)
unsupported rotor "sticking" then suddenly rotating as the turbine inlet pressure
was increased. The "sticking" could have been due to a number of factors:
1) misalignment of the shaft causing binding that exceeded normal breakaway
torque, 2) a particle caught between the bearing and the shaft, or 3) a galled bearingsurface contacting the shaft. Its practical effect is to increase the threshold pressure
for shaft rotation without bearing assist.
Test Series D demonstrated the turbopump's ability to start without
an external bearing supply.
2.2.4 Test Series E
It was in Test Series E testing that an ambient temperature gaseous
oxygen turbine drive was first used. on the OTV oxygen turbopump. As in Series D,all testing in Series E was performed with the pump operating at its design Q/N
value. A total of 787 seconds of turbopump operating time was accumulated during
Series E, divided between Series El and Series E2.
Test Series El consisted oi operating the turbopump for the first
time with GOX as the drive gas, pumping LOX. While accumulating approximatelyseven minutes of run time during this series, the turbopump utilized a 500 psia
bearing assist pressure for each of the seven "assisted" starts. Series El was per-
formed prior to Series D as it was considered to be potentially less risky thanSeries D.
Test Series E2, GOX/LOX turbopump operation with unassistedbearing starts, was performed last as it was considered to be the highest risk series ofthe program. Not only was the oxygen in all operating sections of the TPA, but thebearing and shaft surfaces would generate some frictional heating during the
rubbing start. The pump operated at design Q/N while accumulating over sixminutes of run time and eight more unassisted starts. Test Series E2 ended with thesuccessful completion of Test 190 on 21 March 1989. This brought the test program
to a close.
36

2.1, Test Preparation (cont.)
Table 2.2-1 is a listing of sample data at a single time slice for eachcritical test. The table was originally compiled from quick look data with latercorrections from calibrated data where necessary. Total TPA run time as given inthe summary included time from the checkout tests not given in this table. Also,the highest TPA speed was recorded on Test 135 where a decay in suction pressureduring a kill allowed a brief overspeed to 80,000 rpm. The tests were numbered inthe order performed. The "Comments" column denotes the significance of eachtest, including test series, turbine gas and pump/bearing fluid.
Throughout Test Series C, D and E, the OTV oxygen turbopumpwas successfully operated for 2268 seconds (counting all rotating time) with a total offourteen starts without the bearing assist system.
37

0 dI- cc~I
CD(0
!5Hm0z z z 0 0
z Wcc cL,0 z z z 00 0 00
w C L DCc0 01. .
Cc c
0cc c tcc
20
U.I0- ____c
0acoca0 0 0 C 0 0 ( c o ( )c
o 6 0
cc N 0 CM 0 T- N A
ccCC%. V- 0NoV--r 00 0 0
I-
vzw
0-0
o~ 10(0- V
O~z V. I.VV
m 22 L2
cc F= c34
_______________ ___I_____

IN NN N m C4N c C4NNNNCCMC
Og 0 9 ,-
U.
IL x
U' R
V- V-V N V
o : 'Cco ro Vl0 0 q ) ( C o)( *0
ocCOc N 0 ) N N' 0 00
co CcwV 0O~~ 0N cmNNoN0 N CM')
CO- N N 0 0 C N 0
6L 0)0 0 WS a) v r- W40 0' 0 U)U -0 0)
93

3.0 DISCUSSION OF RESULTS
3.1 OVERALL TURBOPUMP PERFORMANCE
The completion of Test Series "C", "D", and "E" has succeeded in demon-
strating the OTV Oxygen Turbopump to be mechanically sound while being oper-
ated to the maximum limits of the testing facility. Testing ranged over a pump Q/N
range of 40 to 120% of design. A maximum steady state speed of 69,800 rpm wasreached when pumping liquid oxygen, which is 93% of the nominal design speed of75,000 rpm. A maximum discharge pressure of 4015 psia resulted at that same time,which is 88% of the nominal design pressure of 4575 psia. A maximum turbineinlet pressure 4829 psia was required to achieve this highest demonstrated powerpoint, which is 16% greater than design pressure. At the conclusion of 38 successful
data productive tests, the turbopump was found to be in operational condition with
minor evidence of wear to the bearing surface plating.
During these test series the turbopump operated with an apparent cyclic
axial shaft motion. This anomaly was detected by the axial distance probe and was
basically undetected in the radial "Y" distance detector with only a small response inthe axial "Z" direction. This axial motion was characterized by a constant frequency
of approximately 10,000 cpm. The amplitude was also constant at approximately+ .0005 in. "WAaterfall" plots of the axial distance detector for two typical tests aregiven in Figure 3.1-1 and Figure 3.1-2. The liquid nitrogen pumping test, Figure 3.1-
1, used a separate pressurized tank to feed the bearings. The second plot documentsthe same phenomenon extending right up to the last revolution (see the time linemarked F.S.2,. fireswitch two) at the termination of the run period (the top time vsfrequency plot, Figure 3.1-2).
The predominant displacement peak starting at zero progressing upwardsto the right is the shaft speed signal with the amplitude derived from the .002 inch
step at the end of the shaft. The vertical predominant peak is the 10,000 cpm fre-quency (-170 Hz)axial displacement and anomaly. Figure 3.1-1 shows the tank fedbearing system operating with liquid nitrogen. Figure 3.1-2 illustrates the pump fedbearing system operating with LOX showing the same phenomena.
40

3.1 cont
1,'60 A:MGRA14GE: 7 8 STATUS: PAUSED Terminationof Run Period
c * F.S.2
E- E
Shaft Speed
START$ 0 NZ 3145 19.097 Hz STOP: 2 0016 HzFrequency
RANGE: 7 dBV STATUS: PAUSED -Middle of Run
Vr~~os ~ Anomaly Signal __________ShfTiePro
SatSpeed
0 Tank Fed Bearings0 Shaft Speed - 68700 rpm Max
*G2 Driven/Div Pumping LN2
START: SH31:9.7HzSTOP$ 2 6509 N0 zFrequencyaw1997"
RANGE: 7 d3V STATUSI PAUSED Start of Run1/66 SIIAGTime Period
Vras .Anomaly 1ina
-~ Shaft See
- Valve Closes
STRU 9H w 19.69? HZ STOP: 2 060 Hz
STAT:S z Frequency
Figure 3.1-1. "Waterfall" Plot for Test 133 Probe Signal HT-Z41

3.1 cont
RaSrGE * 7 STA.TUS: PE4US.(D
I 1 '6 A: N- TerminationVrsAnomaly Signal of Run Period
/D-
- - ShaftSpeed
STARTS e HWI~ 19.097 Hz STOP: 2 066 Hz0 zFrequency O
RANIGE: 7 dBY STATUS: PAUSED
I ~--* - Mddle of RunVrasAnomly SgnalTime Period
_________ - Shaft Speed
,DIV Pump Fed Bearings_________ *Shaft Speed . 400 rpm Max
E______ GN2 Driven
________ _________ *Pumping LOX
STARTS 6 Hr DWI 19.097 Hz STOP: e eeo HzFrequency -
RANGE: 7 dE'l STAsTUS: PAUSED
1/60 IMAGStart of RunVrms Anomaiy Signal Time Period
_ _ ~ Shaft Speed
_______________ -Valve Closes
START: $TCP: 2 000~ H.
ciýzFrequency _ ________9-'
Figure 3.1-2. "Waterfall" Plot for Tes! 163 Probe Signal NT-Z
42

3.1, Turbopump Performance (cont.)
The first diagnosis related the dosing of the pump discharge flow meterbypass valve with the initiation of the axia: displacement signal. Closing of thisvalve prior to the start of the unassisted bearing transient test, corresponded to theappearance of the displacement signals at about the same shaft speed. Further anal-ysis showed the inducer discharge pressure and the pump inlet pressure to a lesserdegree have the same cyclic frequency as the shaft axial motion. Since this is thepressure going into the first impeller it is assumed the pressure in this impeller alsoexperiences the cyclic frequency which is the driving force for the rotating assembly.Other pressure locations did not show this frequency possibly because of lowerresponse rate passages. Additional analysis is recommended prior to testing in thesame facilty to identify the initial source of the pressure oscillation that causes therotating assembly axial motion. At this writing it is considered a facility relatedphenomenon.
The overall TPA efficiency can be determined directly with currentlyavailable measurements. The design TPA efficiency is the product of the designvalues for turbine efficiency (0.67), the pump efficiency (0.59) and the tare efficiency(0.97) for a value of 0.38. For the five 100% Q/N design point tests the average mea-sured value (determined as described below) is 0.31. This lower than design valueindicates that either the turbine performance or pump performance or both arebelow design but does not provide any information for determining which of thesepossibilities is correct. It should be noted that the pump performance (efficiency) ischarged with the bearing and other recirculating flow losses. The recirculating flowlosses are much greater than expected.
Measurements are available to allow direct calculation of only the overallTPA efficiency. This quantity is determined by dividing the delivered fluid power atthe pump discharge by the turbine isentropic available power. This overall quantitycan also be expressed as the product of the turbine efficiency, the pump efficiencyand the mechanical efficiency (which accounts for tare losses). In the absence ofindividual pump and/or turbine test data, the estimation of how this overall valueis split up between these different components involves a large amount of subjec-tivity guided by past experience and knowledge of general pump and turbine charac-teristics. If separate turbine and/or pump tests had been conducted, characterization
43

3.1, Turbopump Performance (cont.)
of individual component performance would be much more direct and accurate.This is the justification for the data reduction and analysis procedure descried inSections 32 and 3.3. It represents a best estimate of individual pump and turbineperformance given the current test data constraints.
32 PUMP PERFORMANCE
This section summarizes the OTV LOX pump non-cavitating performancetest results. Five test series whose test objectives were outlined in Reference 7, weresuccessfully completed. Raw test data, such as pump volumetric flow rates, staticpressures and temperatures measured at strategic locations on the test apparatuswere recorded many times per second during the test. These raw data were laterreduced to engineering units and combined to calculate TPA performance param-eters using a data reduction computer program.
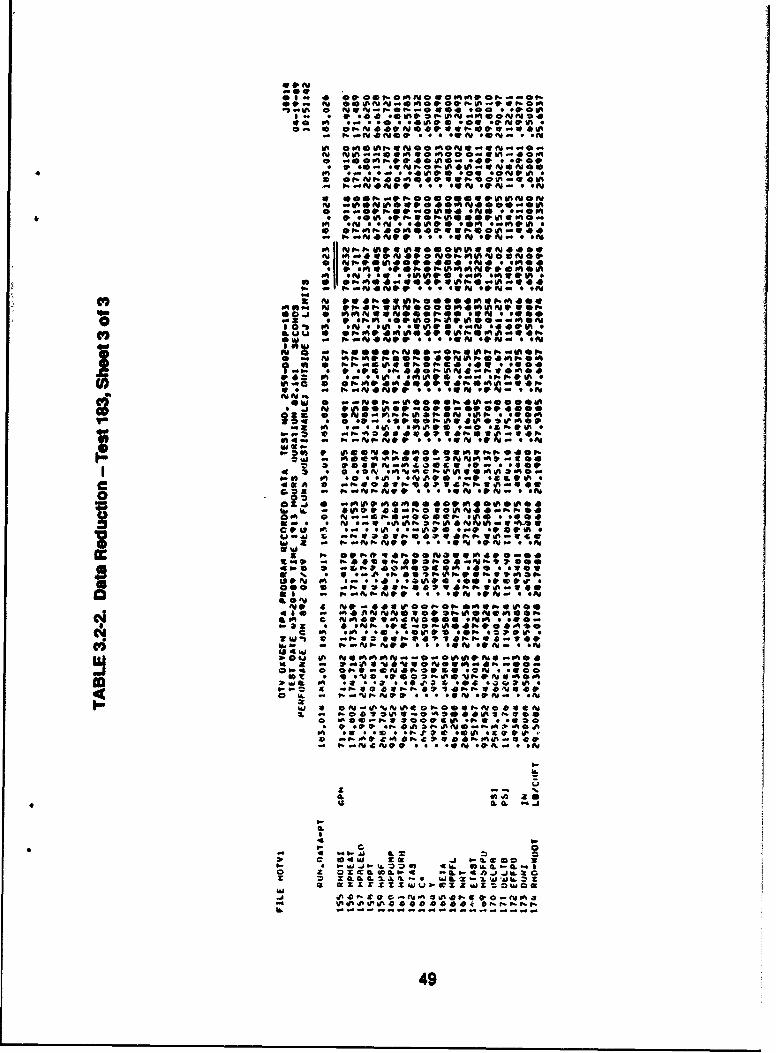
Data reduction results of ten tests were reviewed to verify the TPA perfor-mance. Test No. 183 of series E2 which has LOX pump flow at 99.8% of the designQ/N and GOX turbine fluid was selected to demonstrate the pump design point op-..erating condition. Q/N is defined as the overall pump delivered volumetric flowrate in gal/min divided by the TPA rotating speed in rpm. Five tests in test series C2(test No. 154,156, 165, 167, 164) with GN2 turbine fluid were selected to represent theoff design conditions from 47% to 128% of the desIgn Q/N. Four tests in test series D(test No. 171,172,173,174) at about 100% Q/N and GN2 turbine fluid without bear-ing assist systems were also included in this section to verify the repeatability of thetest results. Boost pump flow is charged to pump recirculating flows and is, there-fore, not considered as part of the overall pump delivered flow.
The data reduction equations which calculated pump flow rate, head rise,overall efficiency and pump horsepower were entered into the computer programto facilitate the data reduction process. Fluid properties, such as density and vaporpressure of the liquid oxygen, were taken from the fluid properties tables (Ref. 8) as afunction of local temperature and pressure at the measuring station. Pump overallhead rise (H in feet of fluid) was calculated from the total pressure difference
44

3.2, Pump Performance (Cont.)
between pump indet and outlet. The total pressure is the sum of the measured staticpressure plus the dynamic pressure calculated from the flow rate and pipe area atthe measuring station. A method to calculate overall TPA efficiency from availabletest data is given in Table 3.2-1. This method was used in the data reduction
program.
Each test case was run at near constant speed and pump flow rate. Datapoints were selected at a selected time instant after the shaft speed reached steady
state. A portion of Test No. 183 data reduce'on computer print out is shown in Table3.2-2 for example. It lists several time points around the selected design point, i.e.183.023, where the shaft speed, NT-Z, was almost constant at 60626 rpm. Pump per-formance parameters, i.e., normalized htýad (!I/N**2) and overall pump efficiencyvs. normalized flow (Q/N), are better summarized in Figure 3.2-1. It compares thetest results from test series E2, D and C2 against the original predicted curves. The
slightly higher data points compared with the design curve is due to the increasedimpeller tip diameter for additional head margin (see Ref. 9). The OTV TPA• usingpropellant fluid bearings has a complicated internal recirculation flow network. Atoff design Q/N conditions, the slope of the head curve can be offset from the predi-cation due to different internal seal flow. The small variation might be a factor atthe 128% Q/N point noted on Figure 3.2-1.
A corrected pump overall eificiency is established by correcting the pumpflow rate for the excessive bearing flow rates. At the design operating point, themeasured bearing cooling flow rates are about double the design value. Thesehigher measured bearing coolant flow rates are believed to be caused by the internal
leakages across the pump housing piston r~ing seals between the 2nd stage inlet,pump bearing supply inlet, turbine bearing supply and bearing discharge. Thepump volumetric efficiency, which is a part of the overall pump efficiency (Epump= Effhyd * Effvol * Effdsk windage), needed to be adjusted from the original design
value. This adjustment will decrease pump overall efficiency from 59% to 48% atthe design point. The pump off-design efficiencies were back calculated from the
45

TABLE 3.2-1. Pumping System Calculated Efficiency (Ref. 13)
delivered fluid horsepowerEFFp = = Total TPA Efficiencyshaft input horsepower
delivered fluid horsepower = (Q*Q*H)/550/448.8
Q = average fluid density through pump (Ibm/ft"3)
Q 0 pump discharge volumetric flow rate (gpm)
H = pump total head rise (ft)
shaft input horsepower (not including tare torque) -
delivered pump fluid power + boost pump turbine fluid power +bearing supply fluid power + friction power sensed as heat
boost pump turbine + bearing fluid power =(Q(bp *Q bpt* H ind + Q out "(Qpbi + Qtbi) * H)/550/448.8
friction power sensed as heat = delivered flow fluid losses +pump bearing fluid losses +turbine bearing fluid losses -
(out Q* Cp *(Tp out - Tind out) + Qpb *Qpbi Cp (Tp out- Tpi) +
Qind Qi "Cp (Tind out- Tind i) + Qtb Qtbi* Cp (Tp out- Tp i)) (3600/2545/448.8)
bp = boost pumpt = turbinep = pump
ind = pump inducer
i = inlet
o = outletpb = pump bearing supplytb = turbine bearing supplyT = fluid temperature (OF)
Cp = fluid specific heat (btu/lbmiF)
46

*9tinv m Ny O ' U
OO 0v0t 4 wf 9 0 0 *b *O. *0 9 4,9001A-~b~ 0 .. 9000* 0 *419' *4.;;:InT s'@R1'o ~ ~ ~ ~ ~ ~ ~ _Am n 0* 0mwf 009-.09a *- . 0 1 4 O . O -. O9.e9.1-RRZ~II.(RR OM;
U~~~ O@@A0 Q4001.4l *@.9 4I 01.0 P C. A940% 0;P. %'oftvA
O ~ ~ C o@I& 9 'W S . 4 0 9 . 0 & 3, Ot N9 m9 in am* 9 5 09 0 9 9 41
:: # 9"A1091E 00"00. oomm'0040 OdR $.~R1;"* 9
9 0U9909R .9 v A *1% * R1 Am'. * memo** .19 .. '.9 9ý A4 *. 9 ý 19 AtI V
* ~ ~ ~ ~ ~ ~ ~ ~ ~ ~ ~~P 4:.0 091J00P P. *..@419 ;4 m- M0.9 *OIRJ4 m 0
0 '*9.e A w Pg*1.91.i9 0.041% 0109V40 9 .ef0 41 9,1.O 501*4 @1j 'W' 90'-0 C * .01.'1 000.0to99 or%1 jV .9 R4 0RIRI R10IR IIO I
-~: $A.V.0.-0~ AI1 0 '4 * 4*55 ~,0vii 00001.111.91. @I1RI090of. *0A. O.09@4%0 44 9 0 5049994V
A It" 201'O 0*11 low 1IV9@ 1.% U RICO 051.UOilA M0d .0 0 19 9 9 9 9 ft 9 9ft9m$0559
:1 4 : A .0 9~f N NV01%90. NU1199M5I40 9 v N901.- .0i -- f 941 A *sRin106
£ IV ~ ~ ~ ~ mp.4 .0o0000 *0 E 4 I 9 1. 9 9 0 5 .%00
9, 0 0 i 90000U9.4 N *VU004VQ0NO.9
9 W~ 90 91 0 9A201 1%4. 49..
TOO 01 9 9.I0 qvO ftN.1...0109 9 0.0I.5RR1 RIRIO MVA
AM" A 055V 05E NS A.....Ul.9.9AVIVV0 5
0A40 fl w # to ISI6
IV 0 -
o ~ ~ ~ P ft N f0V.IV.~ . 10 lot0
009 - -v A40 011 A NVV l V 4u 0 IV54
VOW -a VN05-I 0 aV 1 4 5 1 0
9~V a04 v - AU aO S 5 t- 040044 i
P.J -W- ** N
z 0" Aao:f90ft)0 9999., 9 .. * 9 ' W * 9 .10 0099 got. 5
C .1) - 0 9A P% 9 90 9*m 9 IV01555N1 ... 150515R11 64 V 9 .AN V o" 0 w f A RI
0 0, 0. 41 ON ON *blow* e g...,OX .1 0000.00510050-*t 44000 7!v1 vv @ ". * 1 0 1 0%0 0400P. 90M0A901W0R
cootN: At I9. .0 *. N14455~.VV1 *. -0 40-IVW 40 5
9 0 00, 90 9000-1.1.0 omIV
a 3 - *A av -'g V V 1 5 5 V 5 I 1 0~ N *ft ON* 0e 4v;4sO~-
* t-.~- O22J05W op- OPMA 33V09.?341.-No .U0"0 64's1 RI.
__ 2 0* -a * * , . 0 ' a- a 0 So OR A .3 90 m. m1 . A 90 NN * A mm.1.
;4 0 0I.' *.'.4V05 O t. i
'119 C 0 050 9 1 6" ; , J~ O. ~ lI A I 110 m P: 4:0~b RI 0
3 xO N UlI v1C .. * * ~ 9 * . ;99403.-.A - N% a "..sPa q#r
Ls~~~~9 v95 N9 a9 a AA10' ... N w
W 14 00 0 1. 5 5 900 2 C I 1.V0 9 4 Oe $ 059...041.19 9RIIV 0RONO*oc - 0~11"~' On
5 NO 014 RI9V .A@N 0. 0
0 904
0%~ C: It 7 Ot0.1t I .p 1 .. 0 9 1 9. 9919.9.5U ,0 4199.
C4 z *ý -vot.)02~ lt t151.0111 * 11 ~ .9410. 99 99 9009 b41 .1 5 N "ay 'I ; O
0 ~~~ 0W N A 99 *0 a9 *4 01 g.0 5P# :003.0W I 9' 'll11 A1. 11at11.0I 00I(p.- 49 "o M
^ - b^ 0#
I.- o a I V00- luo 4 V a 0 0, z c W fur OF% 94611190*S*;;VA&
-~ ~ ~ N -~20 W - -0
C~1 0. k'd.9 bI.1 - 4 .
' 0 1. J , O
-N I - a IZJ -f _ sA-44
~ 0 5 5J ~ £4. 1. 2 2 C
- x 2U.Z3-2Ig J -02 f~.l)..X 4 ~~N'
L 1 - IVNEV050 C0p- - % % C T - z -0 IL j 6- I
47

of - 4 fAINaNOW0004-@- a@,N40N No ON 00000a A*O-90000..
-0 0 * 9M a 9I @0000 0. 0 9 *N@N 4.9 *900p -46 -aonON%(y0%000-12a 4NN45-t.@0 90* .9 9 09N 000.4009 900.000 90 *0.NO.Inv9 *aflNAJ40 9090WIN1 .0 *-Novic "Yo 994
po 0 pw e* 9 * s. 9 *N104*.0*NO . 4 * 0 0 11 9 *NNAJ *4EgeO *0N90f0- o Mify~JNAJ0@ *44090 @49 00I1IUN&N 9 W .4 94 sou 9011 * * ow'&Q.o
IA~~-I 1%MA P 4090000.0 [email protected]@O9-000 0-00 0 v 4 w09099a a *0A @4 [email protected] 0- 0 .4 4 0oD o e0ve. 'aa op oe-Oo 0e044P 040-4 l0-40 0"o
N* - 0 .9.@ @ 0.99 0 0 9 9 9 0 9 N 0l @ 4.0IV- *-a ow- .- , '*vvuyyo @9 9 0 4 0 N 0 00 9 0 9 9 09 4099 490 .V9 99
0~~~~~~~~~~~~~~~~~~-le soo 0 fi..9 *.' OO99**99-00-0*1 4l~*
F 9S S00yf * WE -. 00 #r 44 * 9 0. 9 Ob N *..00 9.00 9 S*69N 4
*~~O *[email protected]*0 a9000 -00 No atn*'vapOO--44404N90& 4.A cow*O bW 0.999..**00.V 0 fr*0vo *No0 9. I~9-40O 9fJ * 4 -9i9
0 IfffW 4ý% ' 4 O OP' *9 .0 00 N4 9 0040 0 0'0900 W . @0000 u190 119000*% b & vO %Owy0090N % V 4 0 N #*#4o#"Nvo * #fWEO pn * # - Ai 40~d 0 004141V @.0.09 4 140-0
* *999900 00009099N4FbW00 ID4) **00-00940 @@-4909' @9 #NO
"a . 0 9 90.9*fd. 9*A0090 9f#O 9N40 to 94919Q0- O-004N00 9AuE'tN *04,4o 04 tefl0 go M N NN . *4 4 9 90 0 4 @Uy' A -*we *11 * 99 **4 OVNI *J04NO Oo -
a 0. M N 99. 905%4 .NA 0 0 9 ~ 4 *4.- .A -. 90 . . 9VN O-VXiN
0 $n "4 *00. 00WA @#60 0400O90N40.we*@ 0 00. 0 * 0.404
_w v NN Noe 0 a9: 990 N0 a z * 90N00 *- -A w03 3 Oa 04~0 i 'a*0c0 1 OC 4I * A 9 0 4 @. 0 9 0 N 00 0 0 0900 40949 4NNO *::
'I "A NNNNNNOW.M * 9 00 Vo 00000000919J WO -1 9`vv( *0 . 0 .04 see 0 009
a 0 0N00 ... O01 0 -- A604P4000 0- 0900 00 0 NN 0
9AO 0ON0. 9 *la40.NU 9 ON9 906'r 99 9 V.UA0 0 * 0 .99.4 -w~:~ I 1@9. IN "4 995-Ff 0-01* 4 9 S 0 t-OM-0,0 .. 04A ~ 90"o"W ON 4 999090 D Aa * NNN 0 -4 N* *DO@aNA** vfv40.0% A9.0o
999 @0.9 *N *5 9*N 4110 9to kno0 40 0 *9Ai0 ZIN04N0 * 0pop
ltI.IUAMI"N@@ to4 0bi.4906090'D00.00O00(00 0900a
0 ovl-O w 0.@00 0. Ooly 4 0-E azUlo4 .00.0.W@900. O00.0~00"A094'NU4 O 00.W
0.0 0;NOMM N N 0 f* pw * @ @0 ON # 00U9N .99 0. 900 tou 900.0ve -0-ag"Qa4I fu09 v.4 .0 00.4.4~ IA.-0. A..9@ *e q~0 N .-~~~b 4040 000N 9.N 90 4 ft - 4..94@0#0WN409N9 z..9 tau
1 0 11 : I .Z A141t . -*O0-. .9 408 Ait -01A~ -. l9 qio 0 #N 4 A RO A N.w0 A-N 94 *A0 0 N-4- c A,
9aa 0 40 . 0 aW a av ft *044-4 .0 a99
0 NA VI00 9, @9. 'N at000 V 9N *49 a. * a0 V.0 P.~i 00A -N9N- a A9
o£oevylon . A 0 0:4040;00 0 0 9 i 0 0 0 4 N i 0 0 0 0 . 9 0.
ON 40.0g; v; 0 I_*! 900 00 . ;0 &AA .. 0 N . . . 9
% 9I IVN4 0 40 0 4N O " 901 *99v 9 'D ~ % 4D ~t- *3 N?
;t 0 90909 @00MNO00 04N.O 009 NO * ON N(3.409N0
0.30 * 0 .101% ý0v00 0 90Vt0 v fta-ANN ftv4 N Nu Noe0?* * 0UNO NOO 64'J9 *N66409319 *9.to lif 0.1099. *t'. 9!09^f40 040~ p * #A 0 ~ A C0*N LO0 0
Z 9 0 NN NN ;. 9. 9 @1 -A ?' 4~~93.01 , 0. %1 - SO* 1974 4N0 -0 4 0
O~ it .- A% IV04 99 * % *N
004 0 Y N9N99 9 000 O -0 V .0PI419940 4 *C 40 31 N O .00.% 4U W .0
c') 0i 0.90 190 1 1N 10 9. "03 *9 9 00 *N 0 91 0 0 N0 w on4 . an N
* W b t- *b9 ve *0 6 04 & .WVN00-1 Y04 0 04 P 4 N4.t-4 4 *40 N 0 00 t NC * 4 99 ON ON 4%0 4
I-it 0 k.N04 0 N 0 0..9900.Ct9N v *0I @00400 00.30S01O WiAD PO
o ,99 90 040 .FO N N * 9-ON480*N 9WI-.0 0 003 0 CO 4 0UG* 3 -4N* (N O O 00 4% 004- 0e 9010..4 ON *0." 3'P4 -%A90NN 9OAAO'-C.p~ O9-NC-p -to *@
A 0.~0 v00' 69WO -ey W%0 9D . 0 W% N on 1 *Q N.0 00O .0N # & O N a, 490.71toim N ly ru N - 10 0 & 10 t0 aa 4300C0% . 0. *9 a.0 9U @3 .9 a * ANz-
0 N0A of999- 904.4)-4 *N4 N9~ 4' * 4 -Oft NV .-9 3 .9 *19. N I 9.0
00. 0.0 6VtON
wU v 4 4 .4 w~94. v ~ 4j4 i
9 . %v 0 -3 w % .N - 'D
0. 99JAU 4.zv; z rc 2 LWa 8_ C 0.1. J 9 4L
4 - S - -CL0. .Z 3
- 4 I 9- LZ 9 9.j @09 W3 4ZI ~~ ~ ~ ~ 4 x 99.z 4 909a U '0 5 .. fz -3
= d 19909 9-99.9 W:- . O.. Z % S .~-o 4 z L C C Z Z~~--~0 0 03 C4 0N
3N.- =. O9. 3 I3.. .S 33 L 9 . 34.Z9 '-U?3
6.-
48
.9ON
PS N 4 0 NO.@ N N@e0 ~
~~~ 00 ASA-~ @ @*a *0 9 900U
#0 ~ ~ f 0 N. v90 *10 9 0 f *0 0 M
0... ~ ~ 44 f. 0-l4A* WS0 At4
O *@0N9 04 9 '0 of* 00* 0 ~ ~ 01 M0 0!4ON %~W A0Q
W ftv10 * 61 01 01A a p St U
M 0.ON*0~ 4 .u @
!0 * "ANPAWN4@PA 40 $ON*0U 9410 a v or. 0 9vm p v 9_ 'A potS' 9 IV
go *0 ofl Aap.Oe;;.400 It 0 400 0~a II 0 'P. *9@ a*.@NU ;PAP mfW00 pA*
s0 i *Ai 9W *y No& 99 too P .AW*V
0~~~ seSeW4O
40. V PA A S WA @ @ CS 'W S *
o A 90C:P ZVI*:
0ww- 0.4AS* t . NA -A V - 9 *AS
ce 49 A 9.0.9s~ Q.~N~
a C. I .w 0ONON f
*e:9" 00VIOSOWP-. *sE 0 0064
cc' m op AS9 03U*SD8
t. -N 3% p". a" W N W~-11 N A 9NS4a V 4,aS~W A 9 .
*~ 000v
ft - A.N v # 9. 'aS SA S. Ova10 ; ' O .1,00 1
ASP *of APC UO @ ot 00 1t 11@
u 0 - Oon0 .AJA N; ASS0P3P'[email protected]@0P
10 % t 10 1. i 0 ON15S" NP*.tP 90 4D *@v 0 I.N t *-Fl 140
1W ~ ~ 0 WS fu@g N *~8 N~ 4N.' NAN~iP 9* 'WA 'PS 'ASt
UON:;-
m 040 ON .'.AS4OPSW'OAS* 'ON
IL-
a z x~ z * zz z z z o
4 49

3.2, Pump Performance (cont.)
turbine efficiency and the overall TPA efficiency (see turbine performance section
for details). As shown in Figure 3.2-1, the adjusted efficiencies fit into a revised pre-
dicted efficiency curve. The lower efficiency calculated from last data is credited to
the following three sources. First, the pump flow is not a fully adiabatic process.
There are heat transfers betwcen the turbine and the pump fluids, and some heatlosses to the ambient. These heat exchanges were not considered in the data reduc-tion calculation. Second, the calculation was based on a simplified internal recir-
culation flow model. The internal flows can not be verified with the external flowmeasurements available. Therefore significant uncertainty occurred from the leak-
age power loss calculation. Third, the pump discharge fluid temperatures were
measured with the film RTD (Resistance Temperature Detector) attached on thepipe outside surface. Although this type of temperature measurement is very accu-
rate and responsive, it is inappropriate to use the wall temperature as the insidefluid temperature without a correction during transient conditions.. The thermalpower loss in the efficiency calculation may therefore have some error. For thisTPA as tested, the efficiency corrected for bearing flow losses ("X" in Figure 3.2-1) are
consideied representative of the final pump efficiency.
In general, this series of tests demonstrated that the TPA can be operated
close to the original design requirements. For the later TPA test series, the inter-stage data, such as pressure and temperature measurements in the external
crossover pipes should be obtained to separate the pump stage performance. Thiscan provide more detailed information about the multistage pump performancecharacteristics with hydrostatic bearings for future design improvements.
3.3 TURBINE PERFORMAN4CE
Turbine performance estimates were based in part on the pump shaft
horsepower estimates presented in Section 3.2 of this report. Initially, the values forthe pump shaft horsepower were added to tare horsepower estimates and divided bythe ideal isentropic horsepower available to the turbine to define turbine efficiency.However, when compared to the design turbine efficiency vs. U/Co curve,
(Reference 10), these data did not show the typical parabolic shape that is to be
expected (Ref. 1). Upon examination of the pump data, as described in the Pump
50

4 xo
,,-
......... .............. .. .. .... . .... ......... ........... .............c: 1 .Q U ::::::::::::::::: .
4t- -.. X
S......... ......... ...... .. !. ....... .... ..... ......... ........ ...... ! i i i i;l.... ................... ....ii iii i ' ......... I ......... ....I.. ....... A........ .........
S. ........ .........*. ......... ... ....
.~~........, ......... .......... ......... L ........ ........ .. .................1 2
........ .. .. .. ..... ..... 1.... ......... ......... ........ ....... I ........ ... .
....... .............. . ........ .... ... ...
.......................
..... ........................
?,udJ/Ul '93; N/H V pue ,Aoue~o!lt3
51

3.3, Turbine Performance (Cont.)
Perferv.nce, Section 3.2, of this report, it was felt that the pump efficiency curve
was too high at Q/N values below design and too low at Q/N values above design.
This would account for some of the distortion to the turbine efficiency curve
mentioned above.
To adjust these curves to better reflect the real efficiency characteristics, it
was decided that a parabola should be fit from the zero efficiency point, through theaverage of the turbine efficiencies at the design Q/N operating point, peaking at a
U/Co of 0.50. (The peak efficiency location was determined from previously run
computer simulations of turbine off-design performance). Turbine efficiencies were
then determined from the fitted parabolic curve for each test at the test values of
U/Co. These values of turbine efficiency, Figure 3.3-1, and the subsequently derived
TPA tare efficiencies were then divided into the corresponding values of overall
TPA efficiency to give the respective pump efficiencies. These calculated pump effi-
ciencies were then used as described in the pump analysis in Section 3.3.2 of this
report and noted as the corrected values.
3.3.1 Analysis Details
The analytical relationships used for turbine data reduction are
based on ideal gas properties and characteristics. Unfortunately, at the 2000 to 4000psia turbine pressures involved, neither the GN 2 nor the GOX working fluids
behaved as ideal gases with constant properties over the ranges of interest. It was
therefore necessary to derive "pseudo-ideal" gas properties. This was done by pick-
ing a characteristic turbine test operating point for each gas, determining the isen-
tropic enthalpy drop across the turbine inlet-to-exit conditions from the gas proper-
ties program MIPROPS (Ref. 8) and i .sing the isentropic ideal gas relations to back
out the pseudo values for the specific heat at constant pressure (Cp), the gas constant
(R) and the ratio of specific heats (Gamma). The results of these calculations arepresented in Tables 3.3-1 and 3.3-2. These are the gas properties used in the subse-
quent analysis for the respective gases. Comparing turbine efficiency calculationsusing these properties to the efficiency calculated for one GOX and one GN 2 case
calculated using enthalpies determined directly from MIPROPS showed an
52

qbq00
0
CM 8e
CLI
O i CL)
IL
IUOOJOd - Aouop*Wg *11319 1310±
53

TABLE 3.3-1
GN2 PSEUDO-IDEAL GAS PROPERTIES
h in, enthalpy 101.1 Btu/ibmh ex 77 Btu/lbmT in, temperature 491.81 OR
Tex 400 ORp in, presrure 4422.5 psia
p ex 2083.2 psia
rho in, density 20.73 ibm/ft3
rho ex 14.909 ibm/ft3
s, entropy 1.165 Btu/Ibm-°RCp, specific heat, 0.262499 Btu/ibm-OR
p = constan~t
Gamma ratio of 1.37832specific heatsR, gas constant 56.38326 ft-lbf/lbm-OR
TABLE 3.3.2
GOX PSEUDO-IDEAL GAS PROPERTIES
h in, enthalpy 82.1 Btu/Ibmh ex 63.8 Btu/Ibm
T in, temperature 499.57 ORTex 403 ORp in, pressure 3757.6 psiap ex 1751.2 psiarho in, density 24.075 ibm/ft3
rho ex 16.563 lbm/ft3
s, entropy 1.128 Btu/Ibm-ORCp, specific heat 0.1895 Btu/Ibm-OR
Gamma ratio of 1.391514specific heatsR, gas constant 41.38437 ft-lbf/lbm-OR
54

3.3, Turbine Performance (Cont.)
approximately 1 percentage point difference in overall TPA efficiency. Since this isfar less than the discrepancy observed between calculated and predicted in the val-ues discussed below, this "pseudo-ideal" gas property approach was deemed to be
reasonable.
An important quantity used in data reduction is the turbine flowrate. Provision was made for measuring this quantity with an orifice flow meter
between the turbine and gas source. It was intended to use the standard orifice flowmeter relations from Ref. 12 but these yielded erroneous values, possibly due to im-proper static pressure tap locations. Also, for several tests, valid static pressure mea-suwements were unavailable due to transducer problems. After the completion ofthe testing and the teardown inspection of the hardware, an actual flow test of theturbine nozzle was made to determine the actual "as-build" flow area. This wasconsidered necessary as all earlier calculations involving turbine flow area or flowcoefficient used "as designed" area and flow coefficient (0.945). A minor discrepancybetween these values could significantly effect the calculation of overall turbopump
efficiency. A test apparatus was setup and the turbine nozzle pressure drop was care-fully measured while flowing gaseous nitrogen of known temperature and pressure.The results of this calibration testing are presented in Figure 3.3-2. Based on thisflow data a flow area of 0.06237 square inches was calculated. This was less than thedesign value by five percent, and served to reduce the TPA efficiency. This mea-sured flow area was then used to calculate overall turbopump efficiency.
TPA tare losses were calculated by multiplying the tare horsepowerat the design point, (3% of the design turbine shaft horsepower), by the square of theratio of the test speed to the design speed. Turbine tare efficiency is then simply one
minus the ratio of tare horsepower to turbine shaft horsepower.
3.3.2 Discussion of Results
The turbine efficiency vs. velocity ratio (U/Co) data are presentedin Figure 3.3-1. The test data values were calculated as described in the previous sec-tion. The test data show slightly lower efficiencies th the predicted curve.Insufficient data and analysis time hinder the investigation as to the reasons butseveral possibilities should be considered:
55

to CY
eco IN4
zI g &z I I
z0w0
00
LL E
zz
566

3.3, Turbine Performance (cont.)
1) A potential leak was detected upon post-test teardown inspec-
tion at the "V" seal of the turbine nozzle to turbine housing
interface resulting in possible turbine by-pass flow. This
would reduce the working fluid flow through the turbine
resulting in reduced power output.
2) Upon post-test teardown inspection, the turbine nozzle vanes
were found to have a very rough surface finish compared to
the drawing value of 32 micro-inches. Also the rotor blades
were found to have parallel surface grooves running from
hub-to-tip on the central portion of the blades (the leading
and trailing edge regions had been polished smooth as far as
possible along the blade chord until interference with the ad-
jacent blade would not allow access to the central portions of
the blade surfaces). These large surface roughnesses would
increase blade losses but the ultimate effect on turbine per-
formance was not quantified for this report. A more detailed
acceptance inspection prior to assembly and testing would
possibly have detected these hardware deficiencies.
3) Calculated turbine performance is dependent on the accuracy
of the calculated pump performance at the 100% pumpdesign Q/N point. Any inaccuracies in the pump calcu-
lations and efficiencies will also be found in the calculated
turbine efficiency.
4) Design predictions are based on nozzle inlet and rotor exit
conditions whereas the test data reduction is based on turbine
inlet and turbine exit conditions. That is, the results pre-
sented in Ihis report include inlet and exit manifold losses
lumped into turbine performance.
57

3.0, Discussion of Results, (cont.)
3.4 BEARING SYSTEM PERFORMANCE
When operating the turbopump it is difficult to separate bearing perfor-man%, characteristics especially in this design where functions of the bearings and
seals are combined. Some bearing performance can be inferred by the success of the
turbopump. Characteristics to be rated are:
"* Clearance Control
"* Flow Rate
"* Radial Motion of Shaft
"* Axial Motion of Shaft
"* Load Capacity
"* Stiffness
"* Rotor Critical Speed
"* Oxygen Ignition Resistance
"• Wear Resistance
"* Start Transient Capability
Clearance Control
The rotating assembly to stationary housing clearances were establishedduring the buildup procedure and are shown in Figure 3.4-1. These are the miii-mum clearances for potential rub zones in the propellant. The only close clearancein the GOX is the turbine tip seal at .005 in. All other close clearances exist in the
liquid oxygen. The bearing radial and axial clearances limit the rotating assemblyposition. As shown in the figure the radial and axial bearing clearances are very
small and prevent other zones from having contact. Thermal deflection andhydraulic loading will contribute to clearance change. This design controls thermaldifferential by using the same material throughout, by adequate cooling passages
58
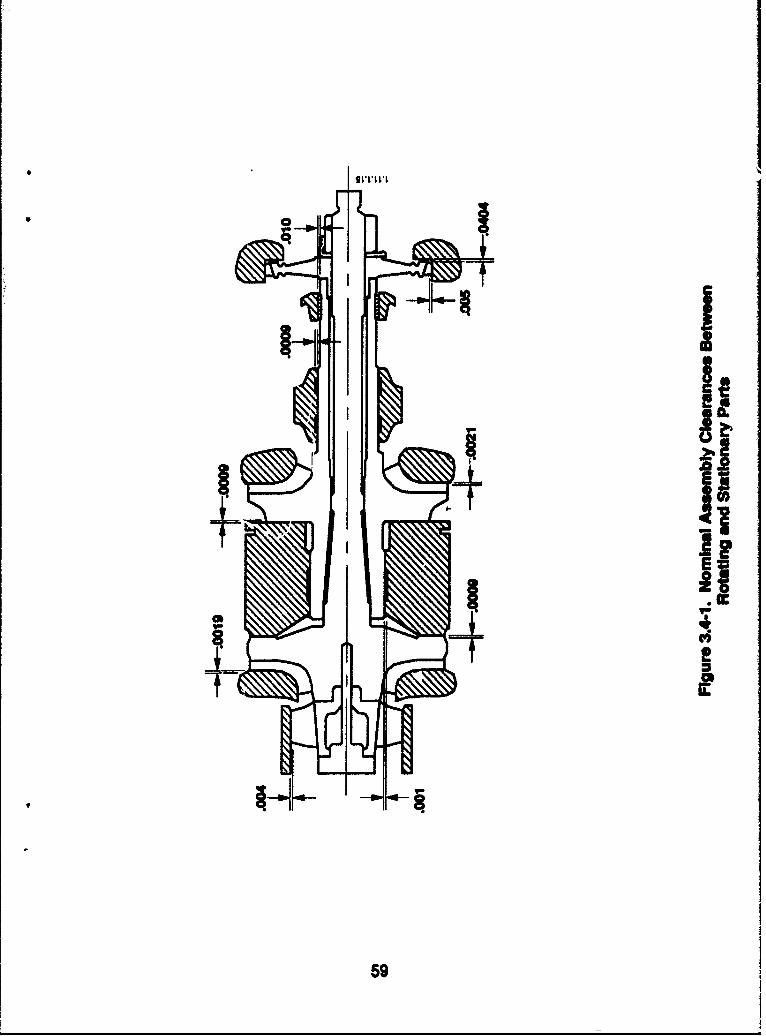
A
ILD
59i
3.4, Bearint System Performance (Cont.)
(including the shaft bore) and by allowing radial temperature growth withoutmechanical restraint. The housing and rotor are of robust proportions and the bear-ing load capacities are large resulting in minimum deflections.
Flow Rates
Flow rates to both the turbine end and pump end bearings were supplied
from the pump discharge line. Bearing supply flow passed through 2 micron filters,and each flow was mpasured with a turbine type fiowmeter. All flow through theturbine end bearing passes through a flowmeter. The flow rate to the turbine endbearing is shown in Figure 3.4-2. The measured flow and the predicted flow differ
considerably. The measured flow is approximately 2.5 times the predicted flow. Theflow through the bearing is controlled by the compensating orifices with a pressureratio of approximately 0.4.
Even with zero back pressure on the pocket the flowrates would be lessthan what was measured. There are other leakage paths for this bearIng supply flow
as it crosses housing joints. The bearing supply is fed tlirough the housing acrossthe circumferential joints sealed by piston rings. Assuming the piston ring gap is
small, i.e., .0001 inch, the piston ring flow area is equivalent to the bearing flow area.As is true for most ring seals, the effective gap will vary with the installation andthe groove dimensiofts. In the Series A and B tests (Ref. 1) two ring seals were
found to be stuck in their grooves allowing a 50 percent increase in flow. Despitereasonable care in the installation for this TPA buildup a recurrence is possible
accounting for the higher recirculation flow. The ring grooves were reworked priorto this test series, and the test data indicates the flowrate was reduced, but someleakage around the ring seals is likely.
The pump bearing flowrate is shown in Figure 3.4-3 as a function of pres-sure difference between orifice supply and the pump bearing exit cavity. This is the
flowrate supplied to three bearing faces, the pump journal, the first stage thrust face
60

71
Test: 2459--OZ-OP-183Date: 3-20-89Test Duration: 82.161 secFluid: LOX
6
*5
4
Measured
Flow
1 0
0
2
0 -Predicted
BearingFlow
010 500 1000 1500 2000 2500 3000
Turbine Bearing Pressure Differential, lb/In.2MI3140-.04
Figure 3.4-2. Turbine Bearing Flowrate vs Pressure Differential
61

14
Test: 2459-DOZ-OP-183Date: 3-20-89Test Duration: 82.161 secFluid: LOX
12 0
0
0
10
0
8' - Measured Flow
C Including
Piston Rings
E6
4 -00
0'.000000000 -PredictedBearing
Flow
00 500 1000 1500 2000 2500 3000
Turbine Bearing Pressure Differential, Wb/in2MI 3OHD-
Figure 3.4-3. i. "9 Bearing Flowrate vs Pressure Differential
62

3.4, Bearing System Performance (Cont.)
and the second stage thrust face. The solid curve is the predicted flowrate for the
bearing alone while the data points include any leakage the piston rings may allow.
The test flowrate appears to follow a square root of pressure differential curve for a
relative to bearing flow area that would account for the additional flow area. It
should be noted here that the outer cylinder of piston ring seals will not exist in aflight type turbopump which will eliminate a significant proportion of bearing sup-
ply flowrate.
Shaft Radial Motion
The shaft radial motion was monitored by a set of "X" and "Y" distance
detectors adjacent to the turbine end journal bearing. This cavity is a high pressure
zone exposed to the turbine exhaust pressure. This pressure reaches a design pointmaximum of about 2300 psi. In order to make an oxygen compatible, low ignition
potential distance detector and accommodate the high pressure a distance detector
probe tip of alumina ceramic was used. This tip reduces the gap sensing range of the
probe and makes it very sensitive to temperature changes. As a result obtainingreliable distance detectors readings is difficult. The probes were calibrated to operate
near LOX temperature and the axial probe in the pump inlet performed reasonablywell. The radial "X" and "Y" probes were in a zone prone to exceeding their range
due to temperature shifts. When the "X" probe was reading during a test the shaft
motion was stable with very small deflections approximately the same magnitude as
the surface runout. The pump "X" and "Y" distance probe signals combined to
display a shaft orbit. Several orbits from the series A and B for the pump end At
approximately 70,000 rpm are shown in Figure 3.4-4. A .002 inch step in the shaft
was used for speed signal generation and displacement calibration.
Shaft Axial Motion
An anomalous 170 Hz cyclic motion was present during most of the test
runs. It is discussed in some detail in Section 3.1, and is considered an installation
caused phenomenon. It caused no problems during the TPA operation and is a
concern only because the actual shaft displacement during the cycling reduces the
clearances between the rotating assembly and stationary surfaces. Minimum clear-
ances of 1 to 2 mil are reduced to 1/2 to 1 rail during the cyclic motion.
63

"0
in
0)y
64

3.4, Bearing System Performance (Cont.)
Load Capacity
The thrust bearings provided high axial load support, high pressureimpeller sealing, high axial stiffness, and unassisted lift-off during start and stoptransients. The bearings were operated to high pressures subjecting the rotatingassembly to high axial forces. Typical calculated nominal net axial loads wereapproximately 150 lb. The absolute loads on each impeller disk are quite high on theorder of 5000 lb. The thrust bearing axial capacity is shown in Figure 3.4-5 for thedesign pressure differential. The bearing capacity is a direct ratio of this pressure dif-ferential which is determined by pump speed. Tue first thrust bearing sealing pres-sure differential was 962 lb/in.2 while the bearing orifice supply pressure differentialwas 2612 lb/in.2 (PPBI-PBE). Axial motion of the shaft at a low constant frequencyexisted (displacement probe output signal) during this test series. It obviously
loaded the thrust bearing. Thrust cyclic excursions were in the range of .0005 in.This requires several hundreds of pounds cyclic axial load to produce this motion.Even with this adverse loading situation the thrust bearing maintained adequateimpeller vane clearance and thrust bearing clearance. The calculated thrust bearingload during the unassisted "start transient" started at 24 lb on the first stage thrustbearing. This load definitely created metal-to-metal contact initially. Fourteenunassisted starts were performed in LOX. The thrust bearings were found to be inexcellent condition posttest.
Radial loads on the journal bearings were determined by the impellerperipheral pressure distribution. Loads cannot be measured directly but can be cal-culated from the pressure distribution and the projected area. A summation ofradial load over the first stage impeller port width as a function of Q/N is shown inFigure 3.4-6. The off-design Q/N tests were not all at the same speed. The speed andQ/N followed a throttled engine operating requirement for flow and pressure. Thelower Q/N values were run at lower speed and pressure. Ik order to determine thebearing radial loads the full impeller load must be calculated. Therefore, assumingthe pressure distribution is constant over the axial width of the impeller disk andthat the second stage impeller has the same peripheral pressure distribution, the twoimpeller radial loads were calculated. These radial loads as a function of Q/N areshown in Figure 3.4-7. The resulting radial bearing loads are shown in Figure 3.4-8
65

Amd C! 9,,,,, l "C#
10 l II ISMIAS hu l ii , ll ill iil i
goo
k UWew. ol !isl !
1111 1U.2
cI I oI.
M
~0
NOl Avf pol1 lel• -- "A

...r . . . .. ... . .. . . .. . . .. . . . .
". .. . . . . . . . . . . . . . . .. . . .. . . . . . . . . . . . . . .
.. N......... ............
rS .....
... .. .. .. .. .. .. .. ...... .... ..... .. .. .. .z
* ai
..... ............ .
4 Cq
ul 0.u ) W) W ! Wri C a ft 0 n v i C4Vý0
*- * - V. VU
jqj le~jo.
67*. .... q...........;.

S... .... ... .......... .... ........ ............ !............ !............
S.. . - -!........ ..L• ........ .. ............ i............ i..... . . .S.. . ..! ......... .. .. ...........................................
L . . . .. . .. . . . .. ............ ............ t ...... ... 4 .... .. . ..-
C4
S...... °..... .• . . .... •.... N .............. . . . . ............. °.... ... ..
1............
* ..... .... . t . ........
Clf9. .. . . . ... .. . . .. . . .... . .... ....
....... ................................ ...... 1 .
.........i ........... ......... ..........
aql 'pool
C!
A 0
*1~ ...-
* *~.....-!

Utcm . . . . . . .. . . . . . .. . . . ... . . .. . . . !C
4..... .............. .. ................................................... 5
I ... . . . . . . . . . . . .. . . . . .
00.... .... ..... ....... t. ... . . . . . .. . . .. .. . . . . .. . . . . . .
-~ Sc
..... ..... 4 ......................................i i li '
0. .. .. . . .. ...
..... . .. ..l.... 'p.. .. l. .. . ... . .
. ... . .
C4
... .. ... .. .. ... .. .... .. .. ... .. .. ... .. .. ... .. .. .. .. ..
.. ... . . . . . . .. .. . . . . . ..... . . . . . . . . . . O
Iql 'pool lelpeU Buleoag dwnd
69

3.4, Bearing System Performance (Cont.)
for the pump end journal bearing. The turbine journal bearing loads are less than 1
pound. At the 100% Q/N design point and maximum speed of 67000 rpm andpump discharge pressure of 3350 Ib/in.2 the calculated pump journal bearing load is
85 lb. This radial load is equivalent to a bearing unit load of 295 lb/in.2, which issignificant, but well within the capability of the bearing (approximately 1440 psi at
67,000 rpm).. Some excursions were experienced during start transients that resultedin much higher radial loads. On one LN 2 test the peripheral pressure distribution
resulted in a pump bearing radial load of 230 lb which is equivalent to 800 psi unitloading.
Stiffness
The bearing stiffness of this turbopump was designed to control the rotor
radial and axial motion and prevent contact with the stationary components, espe-cially in the turbine tip seal area. This means the bearings must be of adequate stiff-
ness to react to both static and dynamic loads. No direct measurement of stiffnesswas made for two reasons: 1) special loading devices were not incorporated and, 2)the distance detectors were very sensitive to temperature and accurate loaddeflection characteristics were difficult to measure. The fact that only incidental
minor contact was made between the rotating assembly and the housing during theextensive testing would indicate that the stiffness was adequate over the operating
range experienced.
Rotor Critical Speed
The rotor critical speed also a function of the bearing stiffness, wasdesigned to be above the operating speed by a wide margin at all times. Eventhough distance detector operation was erratic, no indication of any resonance or
amplfied whirl orbit or any indication of excess vibration on the accelerometers wasrecorded. This includes all speeds up to a maximum speed of 80,394 rpm logged inTest 135.
70

3.4, Bearing System Performance (Cont.)
Oxygen Ignition Resistance
The turbopump oxygen ignition resistance feature is achieved throughtwo methods. First, the turbopump was designed to prevent contact between the"stationary and rotating components.
Secondly, materials were selected that have minimum burn factors and
sufficient strength while sustaining rubs and particle impact in oxygen. There were
a few minor rubs in the impeller vane area and a significant rub in the exit land atthe pump end journal bearing. There is no way of knowing the pressure velocity ofthis rub. It appears to involve a third party wear particle. The results to date con-firm the adequacy of the design as there is no evidence of any melting or localized
ignition.
Wear Resistance
Wear of this.turbopump would likely occur only in the loss of dose oper-ating clearances between the rotating assembly and the stationary mating housings.The dose clearance locations are identified in Figure 3.4-1. Section 3.5, Teardowik
and Inspection, defines the type of wear experienced at each location. Photographsshow the mating surfaces. Profile traces are provided for each bearing surface. Theinspection results showed the pump end journal bearing exit land experienced the
most wear. The turbine journal bearing also experienced a small amount of wear in
one land but the remainder of the surface experienced very minor wear. There wasno significant symptom during the test program that would indicate wear was
occurring.
Some wear was anticipated during unassisted bearing starts. Since thehighest start load was in the axial direction it was expected that the thrust bearingswould experience the most wear. Several operational and mechanical anomalies
that could have precipitated the bearing wear are listed below.
1. The overspeed exrcursion during turbine valve malfunction
2. Unsymmetrical impeller pressure distribution during start transient
3. Excessive radial load during operation
71

3.4, Bearing System Performance (Cont.)
4. Misaligned bearing (would cause contact at the outer comers of the
thrust bearing)
5. Disbond of silver plating
6. Debris particle(s) in the system (from a ruptured filter)
These are potential causes that could have happened during the test pro-gram.
Wear of the bearing exit land will increase the bearing flowrate.Fortunately the pump journal bearing combined with the first stage thrust bearingexit flowrate, QPBE, was measured. Also the flow supplied to the compensating on-
fices, QPBI, was measured. Not all the flow through the bearing was measured by
QPBI but a relative comparison may be made at different pressures. Comparing
QPBE/QPBI vs. test sequence in Figure 3.4-9 shows a significant change between tests
125 and 131 indicating wear occurred early in the test series. These are the firstrotating tests in LN2 with high pressure jassist to the bearings before shaft rotation.
The material loss in the bearings, which occurred on the downstream exitland of the pump journal bearing, appears to have been merhanically removed.Debris from the fluid system or silver debris from a rui could have caused this wear.An overload during the start transient may have created silver debris, but journal
overloads usually have unidirectional wear patterns. The observed wear was notunidirectional. In addition, a small groove was worn on the shaft surface asdiscussed in Section 3.5. Since the shaft is relatively hard, this groove could not
have been caused by soft silver. It is more likely that a hard particle from the fluidsystem caused the wear on both the shaft and pump journal bearing surface. Ifparticles came from the supply system flow, the fluid velocity would direct themtowards the journal bearing and not to either of the two thrust bearings.
Since upon disassembly the upstream pump bearing fiter was found to beruptured and since the pressure drop across this filter was higher than the turbinefilter and varied with time, it is concluded that hard debris passed through the
pump journal bearing and caused the exit land wear.
72

T 2p
5 9U.9 9 9 .
*v 9 996* 2* . * *W
* 9 9 9 9
* * 9 9
* 9 9
9 9 9 5* 9 9 9
* .0V. do 4 *
* 1d/38o 9 o~ 9quj~~ 9 9 0
* 9 973

3.4, Bearing System Performance (Cont.)
Start Transient
Several options for dealing with bearing start stop transients when using
hydrostatic bearings are:
1. Unassisted start (rubbing-hydrodynamic-hydrostatic)
2. Series hybrid ball bearing/hydrostatic.
3. Parallel hybrid ball bearing/hydrostatic
4. Accumulator
5. Magnetic lift-off.
Two of these options considered for the OTV turbopump are the accumu-lator and the unassisted start. Factors to consider when selecting the start technique
are the applied radial and axial loads, material wear resistance, number of revolu-tions until pump pressure rises, turbine torque available, and the condition of the
propellant in turbopump (phase, temperature, and pressure).
In this test series the bearing assist start (accumulator) was used for most of
the tests. The unassisted starts with transition to pump discharge fed bearings weredone only in the final LOX tests. All of the LN 2 tests were tank fed at higher pres-
sure than the pump discharge pressure. This was done to mnaPtain high bearingstiffness. The rotor speed was designed for oxygen, but the fluid density of LN2 is
lower than LOX and, therefore, the pump discharge pressure was lower. Also on allLN 2 tests the bearings were lifted prior to rotation with external tank pressure. The
relative pressures vs. speed for LN2 are shown in Figure 3.4-10. In the turbopump
performance test series with LOX, (C2 and El), the bearing assist was set to 200 to 500lb/in.2. When the pump discharge pressure surpassed the bearing assist pressure,the bearing feed line check valve opened and the bearings were pvmp fe. The
pressure vs. speed data for this type of transient is shown in Figure 3.4-11. This
bearing assisted start maximizes the life of hydrostatic bearings during transients.
74

CLCa. CL
CL
-es - - -ngrin
75I

CLC
E g
CL* W
Q (0Ln 0 tncoIelsI IInsG
76d

3.4, Bearing System Performance (cont.)
During its operational life the turbopump will have hundreds of startsthat begin with a low speed shaft rotation at low oxygen pressure. The LOX has verylow viscosity which reduces its lubrication effectiveness. The contacting surfacemust provide their own capability to rub without significant wearing. It must be alow friction rub otherwise the energy generation becomes a hazard with LOX at allrub points. A well-proven design for such a situation is to have a hard, slickrotating material contacting a softer, yielding stationary material. If there is anywear It should be to the stationary surface which will have sufficient sacrificialthickness to last through the life of the component. A design corollary is thatmaterial removed by rubbing must be of a size and composition that will not harmthe components downstream. The materials selected were silver bearing platingoperating against a hard chrome shaft surface. Silver is a low bum factor materialwhich has high resistance to ignition in oxygen. Energy generated during the tran-sient is dependent on the applied load, the rubbing distance and speed just beforelift-off. The pump d2scharge and bearing pressure as a function of speed is shown inFigure 3.4-12 and Figure 3.4-13 for an unassisted bearing start transient with GN2 in
the turbine (Figure 3.4-12) and with GOX in the turbine (Figure 3.4-13). The load onthe rotating system during the start transient is the rotor weight, .6 lb, on the journalbearings and approximately 24 lb axial load on the first stage thrust bearing. Thisload comes from the pressure-area force differential between the pump inlet (50-70
psi) and the turbine exhaust (ambient). This causes an axial load that would not bethere in a flight type turbopump system. The real system is an arrangement where
the boost pump, main pump, heat exchanger, and turbine are in series. In that situ-ation only a small pressure drop exists on the rotor, which is a small axial load,during the start transient. In our test setup the inlet pressure was fixed and the tur-bine back pressure was a function of turbine supply pressure. The pump inlet pres-sure and the turbine inlet pressure were two separate sources. The start transientwas controlled by the turbine inlet supply pressure. As the turbine pressure in-creased the turbine torque increased and turbine back pressure increased, decreasing
the rotor axial load. Turbine pressure ramp rates were keyed to acceleration ratesslow enough that they did not decrease pump inlet pressure to less than 40 psia yet
77

co E
C .L
-- 0 0
- ~-I
I 0
00
T. a.alsd linssOa
78S
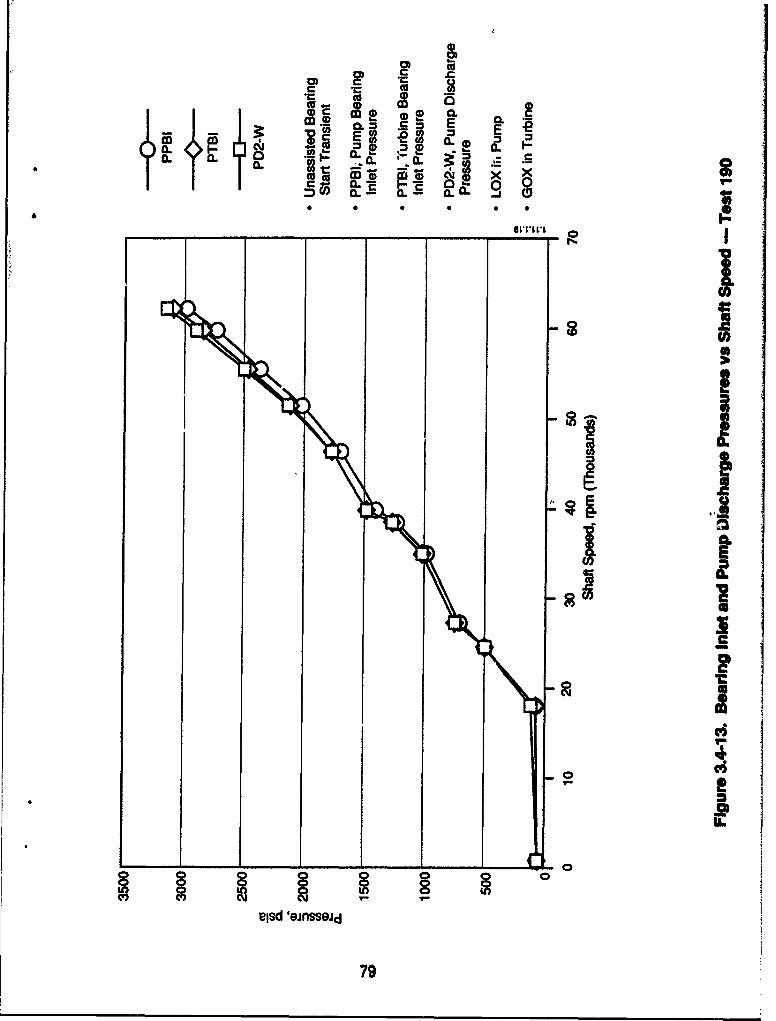
CC
we 0 0 0 4) (
-L M- -m ev&.w
ED- -CL OI
8 IU)Ielsd 'jnssO1
791

3.4, Bearing System Performance (cont.)
fast enough to achieve the highest shaft speed and pump discharge pressure before
supply tank pressure decayed. Typical test pressure vs. time characteristics are
shown in Figure 3.4-14.
During these start transients the axial distance detector indicated non-con-
tact rotation after approximately 10 revolutions. The speed at this time was in therange of 15,000 rpm. During the test series D and El which were LOX/GN 2 and
LOX/GOX tests, respectively, 14 unassisted start/stop transients were performed.
The axial thrust bearing condition on teardown after the entire test series was excel-
lent. The journal bearings had some wear which was diagnosed as occurring duringthe initial rotation tests in LN 2.
Both tank fed and unassisted bearing start transients were demonstrated
for this turbopump and both techniques were successful. The bearings did contact
with the shaft during unassisted start transients. These tests demonstrated the
material wear resistance and oxygen ignition resistance of the design, and the
bearing ability to maintain impeller and turbine clearances over the full range of
operating conditions.
80

00
0
0
E E
2 0D
I-i
C4 -h - -- -- h
C-i A.V(spussnOaL
- -- - - - - - - - -m

3.0, Discussion of Results (cont.)
3.5 TEARDOWN AND INSPECTION
After completion of test series C, D, and E, the turbopump was taken toDevelopment Operations Assembly clean room for post test inspection. The turbo-pump was basically in very clean condition. The bolt removal was very positivewithout any suggestion of galling. Two fittings on the turbine end of the outside
housing were starting to gall and therefore were not removed. The outer housinginlet elbow and the the turbine nozzle were removed. At this point, shaft rotationand turbine tip clearaxvce at the tip seal was checked. The shaft rotated freely and theradial clearance between the turbine rotor and the turbine tip seal was consistentwith the pre test dimensions. A slight post test eccentricity was observed which isdue to the minor rubbing/wear experienced by the bearing components. The mea-sured tip seal clearance is shown in Figure 3.5-1 for concentric and eccentric
positions.
The turbopump disassembly was completed and the condition of the
major parts are shown in Figuire 3.5.2. The general condition was excellent withsome local rubs on the journal bearings, shaft journals and impeller vane mating
contours. The rotating assembly cross section is shown in Figure 3.5.3 and the rotat-ing assembly after testing in Figure 3.5.4. The turbine end journal surface shows
minor scratches and the pump end ;-,urnal surface shows the burnish work fromthe balancing procedure and a small groove towards the pump end of the journal.A dose up of these two journal surfaces are shown in Figures 3.5-5 and 3.5-6. A
profile of the turbine end surface is shown in Figure 3.5-7 indicating minor
scratches. An axial profile trace at the pump end journal surface is shown in Figure3.5-8. This shows a sharp groove approximately .0013 in. deep at the approximate
axial location of the pocket to exit land entrance. This groove would suggest aparticle possibly trapped in the pocket wearing on the chrome coated shaft surface.
The first stage impeller thrust surface, Figure 3.5-9, shows some minor cir-
cumferential scratches in the area of the mating hydrostatic bearing pocket. Thiswas the highest loaded bearing of the system during the unassisted start transients.
82

1.0. Turbine Seal
~-O.D. Turbine Blades
________ ________Both Shimsat Same lime
1.0. Turbine Seal
C.D. Turbine Blades
Turbine Pushed________ ________Off Center
Both Shimsat Same Time
M13HNO-M6
Figure 3.5-1. Turbine Tip Clearance Check
83

44",
tiN
CL
0
040h
-, - '
t84

ac
uJ
U.
UU
I-
LA.d
-JI
85a

V
0.
49* z
0 4c 0
0 2.Z
w U. Vý V,-elc
UJ Z E
CL
uiO
00
0
WIT
C/)D LA.(Oh-
L86

1"0 __ WIGO1 _ I
flu.. ~ 242,u~lI sum.SI.,,;w - ___
2-01
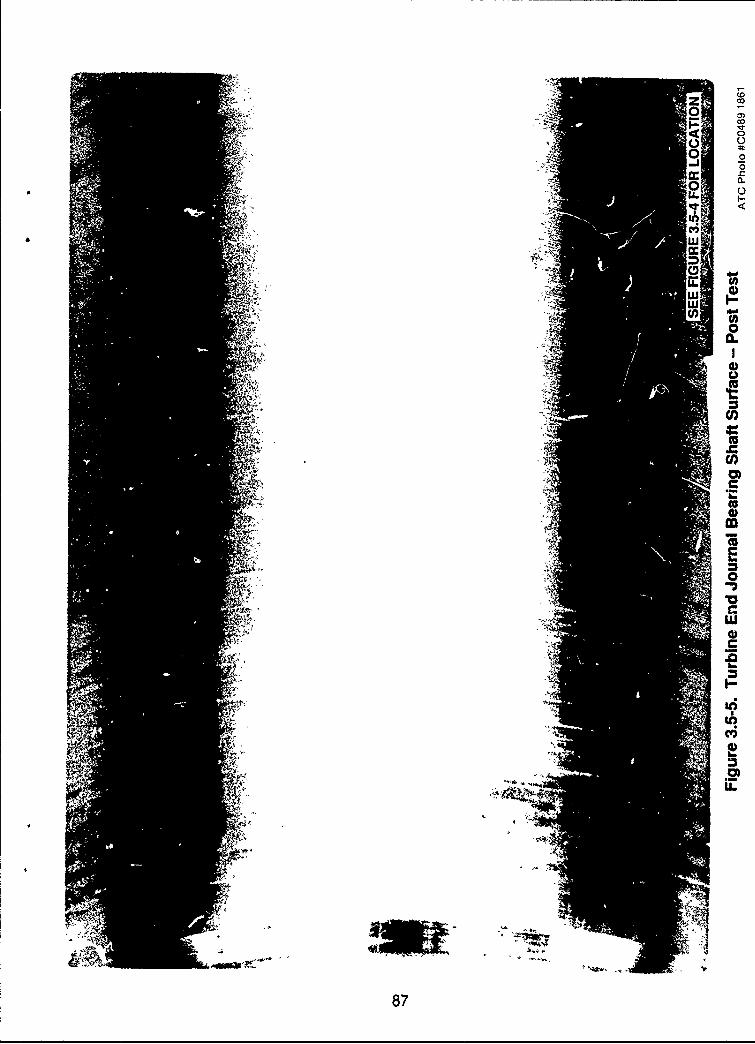
(0(0o
F4 0
o0 4;0
0
0.
I-
&
'.4 LU 0LUa,
(I)00..
4 0U0It
U)¼.
(UC
'3' 0)C).5b.(U0)m
E0
*0w0
1,'. .5.0a-
I' I-
It;'aCE,0I..
C)
U-S
2'.
87
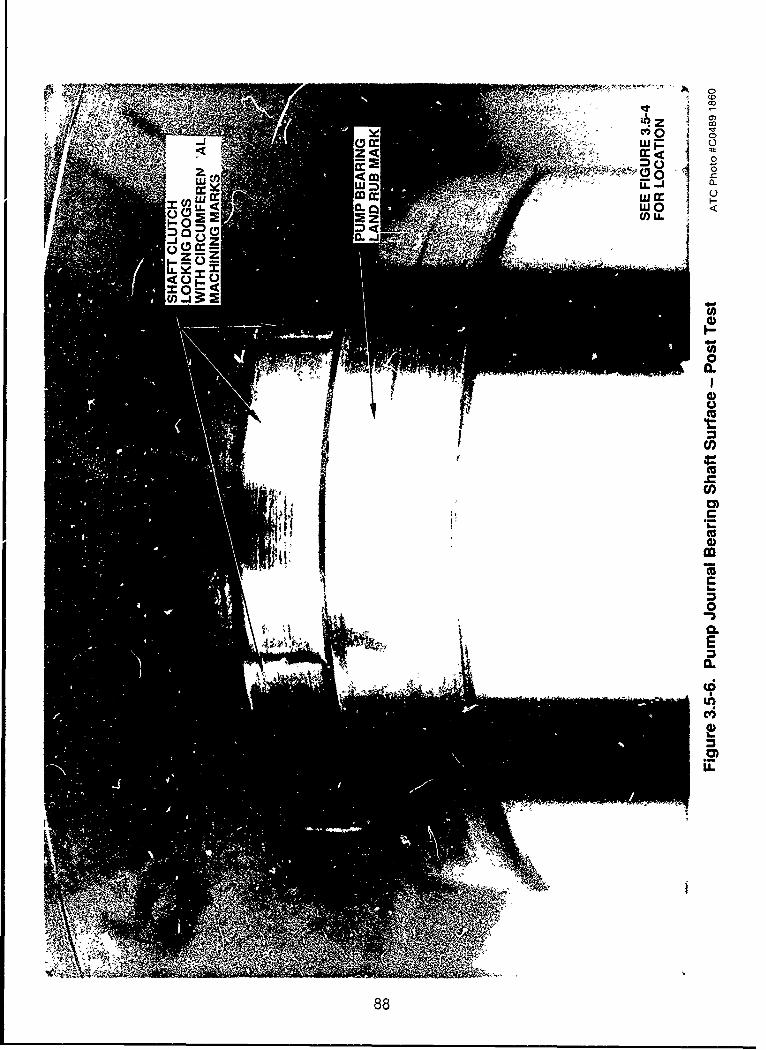
CI-OD0a.
UJ to
-0)
US-3U
0CL
" 00.
~b¼A E
U.
88n

120
bI
Figure 3.5-7. Profile of Turbine Bearing Journal SurfaceAlong Shaft Axis
LOCAL CIRCUMFERENTIAL.0002INCHSCRATCH AT EXIT LAND
- FRST STAGE
Figure 3.5-8. Profile of,.3ump Bearing Journal SurfaceAlong Shaft Axis
89

0)
0..
00 o
M W6
C))
LU)4c-
Ilk-
w0
>9

3.5, Teardown and Inspection (cont.)
The second stage impeller thrust surface, Figure 3.5-10, indicates essentially no con-tact. The radial marks over the surface are grinding marks under the thin densechrome coating on this surface.
The condition of both the pump end bearing and the turbine end bearing
are shown in Figure 3.5-11. Generally the condition of both bearings is very good.The pump and thrust bearing face shows some material collection at the end of thepockets and material removed from the journal bearing bore at the exit land adja-
cent to the first impeller. The spherical surface was in excellent condition and allpassages within the bearing were clean and free of any obstructions. The turbineend bearing had some material removed from the exit land at the turbine side.
Disassembly of this part showed the spherical surface to be in excellent conditionagain with all passages clean and free of any obstructions. A close up view of this
bearing surface is showiL in Figure 3.5-12. From the close up photo it appears thatsome of the silver plate may have been mechanically dislodged or smeared andbecame a third member wear particle The profile of this surface is shown in
Figure 3.5-13.
Close up photos of the pump bearing from the first stage side,
Figure 3.5-14, and from the second stage side Figure 3.5-15 show that the wear occursat the first stage exit land. A significant portion of the silver plating on the exit landhas been removed or smeared in the circumferential direction. An axial surface
profile across the bearing bore between the four pockets is shown in Figure 3.5-16.
From these profiles and the photos it is obvious that the predomirant wearoccurred on the exit land. The rest of the bore :s close to original condition. Itappears that once wear started on the exit land the debris moved circumferentiallyremoving the silver plating. Mentioned earlier was the fact that a groove was
carved in the chrome coating on the shaft. This would indicate a hard particle towear a groove in the hard chrome surface. With this exit land worn the journal
bearing flowrate will increase. Subsequent disassembly of the pump enc. bearingsupply filter showed a ruptured filter element. In addition, the pressure drop onthis filter was higher than the turbine end fiter and also varied with time. The con-
clusion is that debris passed through the pump journal bearing.
91

jiin
OD
U)-POW V
LIL
M 92

A-r.z , pp¾. ' MR,~-t2A).7-r%.4 k~ C'- - - - ()
k!5 -w
-C
4r4I ± ME~ Y
, w IU
rt i¶ ~ A tr ~ .-
z Z7-- ± -
MOM
n---
93

C-D
> it
944

I• ' ;f " ' " ••" ) 4)
•,)4 c
, W
I :1 I! .
L Oto
LL'-
1. ... C0 )
4 :1-. "
S , Ii !?CV)
4 i
I uc
.... ..... .. 44 ... C o
" ,¢
, ' 0)' - . . .. -
' I , I -,, ,i , i: . .
'. . * -"11 11 1, , 0•• . r
1714.
91
.5
S.I,. 0)]•
0- III, . •
1. . ;.. . : :
•, - t . .
w ~' ' 4"~{IiI I
09

Al,,
C,t
LLI-
CD U)
a.
0)
co
coCL
kv it
962

In
0
0
0.
0I-.
00(I)
0
Co
20
0
00
C
(U0
0.20.
1�
U,cv,
IL
A
97

2nd Stage End
Exit Land PocketrA
... ~H ..... 0
.1 .- ..----

I st Stage End
Exit Land
SmearedmeteiW
Note: The Four Axia Profiles Reprsent Surfaces at900, Circumferential Between Pockets
Figure 3.5-16. Pump Bearing Journal Profile

3.5, Teardown and Inspection (cont.)
The first stage thrust bearing is shown in Figure 3.5-17. There is some
scuffing of material between the pockets and the mating rotating surface and this is
the highest loaded bearing surface during the start transient. There are slight bur-
nish marks on the inlet and exit lands. The second stage thrust bearing surface is
shown in Figure 3.5-18. This surface shows some minor circumferential scratches
between pockets and just inside the pockets. In evidence are random surface
scratches that have occurred during manufacturing and handling over the past two
years.
The pump bearing cup is shown in Figure 3.5-19. The silver sphere is in
excellent shape but with several discoloration marks near the sphere outside diame-
ter. These marks are shown close up in Figure 3.5-20. Contact scratches were evi-
dent in this zone with corresponding discologred marks on the pump bearing sphere.
Contact at this location on the sphere is a logical condition. This location on the
sphere is at a maximum diameter and the radial clearance is not adjustable. The
axial clearance is adjustable to compensate for increasing load with increasing pump
pp assure. In addition as axial load is applied to the bearing cup the cup "ends to twist
about a diametral axis inward at the maximum diameter. Contact locations are dia-
grammed in Figure 3.5-21 for the sphere and the pump journal hearing. Light
contact is not considered detrimental.
The second stage impeller housing shown in Figure 3.5-22, is in excellent
condition. Two things were found on this part. First, there was slight trace of dis-
coloration in the pump inlet and a small amount in the bearing area. This sub-
stance was a very thin tan powder (oxidation?). There was the same substance in
the first stage diffuser passage but not in the crossover passages. Second, a small
amount of hnpeller vane contact on the silver housing contour was experienced.
This minute contact is shown close up in Figure 3.5-23. This contact occurred where
the radial surface of the impeller housing contour enters the housing inner radius.
This was the point of minimum clearance during the turbopump assembly and
probably contacted during armembly.
99

(0
C)
u it\•, °
) €0
a._
00
U)
Lf)
6
hL
100

co
00
101-

Figure 3.5-19. Pump Bearing Housing ATGc Photo .CO489 1872
102

Go.4 i (0
co
4,> 4CL
C.,
;,.; pm n
4.44,
4 cm
'>4, .b
103

Pump BearingouInuHousing
DiscoloredSliver Rate
Pump Bearing, MarksCup
BurnishPump Bearing
Burnish • / • • -
Marks
'- _
Good Condition
"Journal Bearing Exi Land Slver Is Scored With "Silver Pick Up" on Surface
Figure 3.5-21. Contact Locations on Pump Bearing Assembly
104

rN 4
N'- %- -
_0105

CL
in
itt
C4
ci
P M
106

3.5, Teardown and Inspection (cont.)
The frst stage housing impeller contour also had a local burnish mark.This contact is shown in Figure 3.5-24. On this surface the contact was light and onthe radial portion of the surface near the outer diameter of the impeller. The turbo-pump was assembled with .002 inch axial clearance at the impeller vane tips. Asmall amount of silver pickup was found on two vane tips at the diameter of thecontact.
The turbine disk appeared in excellent condition. There were no marksindicating any contact on the turbine blade tips and basically all original machiningmarks were still visible as shown in Figure 3.5-25.. This is one of the key features ofthe design. The turbine must operating at close tip clearance without making con-tact in gaseous oxygen.
The turbine nozzle was in very good condition. Some difficulty was expe-rienced with the gas piston ring seal, the location of which is identified in Figure 3.5-26. The piston ring was a two piece design, a seal ring, and an expander ring. The
assembly of this ring was deep inside a blind housing and the expander ring held theseal ring out of the groove and could never be assembled. Therefore a modificationwas made to the end of the nozzle piece to accept a metal "V" seal. The nozzle end
surface and the mating housing had about .010 inch clearance when assembled. The"V" seal was the same seal used for the turbine discharge flanges. Since the matingsurfaces have clearance the seal groove depth was selected accordingly. On diss-sembly of the housing the seal appeared to have been offset in the groove, Figure3.5-27. It is possible that a complete seal was not made and that some portion of theturbine flowrate bypassed the turbine through this seal. It appears that the grooveO.D. was too small for the O.D. of the compressed '"" seal. It is recommended thatthis diameter be opened prior to the hot GOX test series at White Sands Test Facility(WSTF).
The turbine nozzle exit is shown in Figure 3.5-28. The axial clearancebetween the nozzle and the turbine wheel is approximately .040 inch. As expected,no evidence of contact was found in this area. Some contact indentations are seennear the outer diameter that mates with the turbine housing. This is an expected
contact area.
107

LO
IC
Io
Q
14 1
100

CM
1CCD
109

C1- 'pi
0>0
O.c
o E-
11

Contact Patternof sea Caughton O.D. of Groove
i ~~1.055 Inch •
Figure 3.5-27. Turbine Nozzle "V" Seal
111
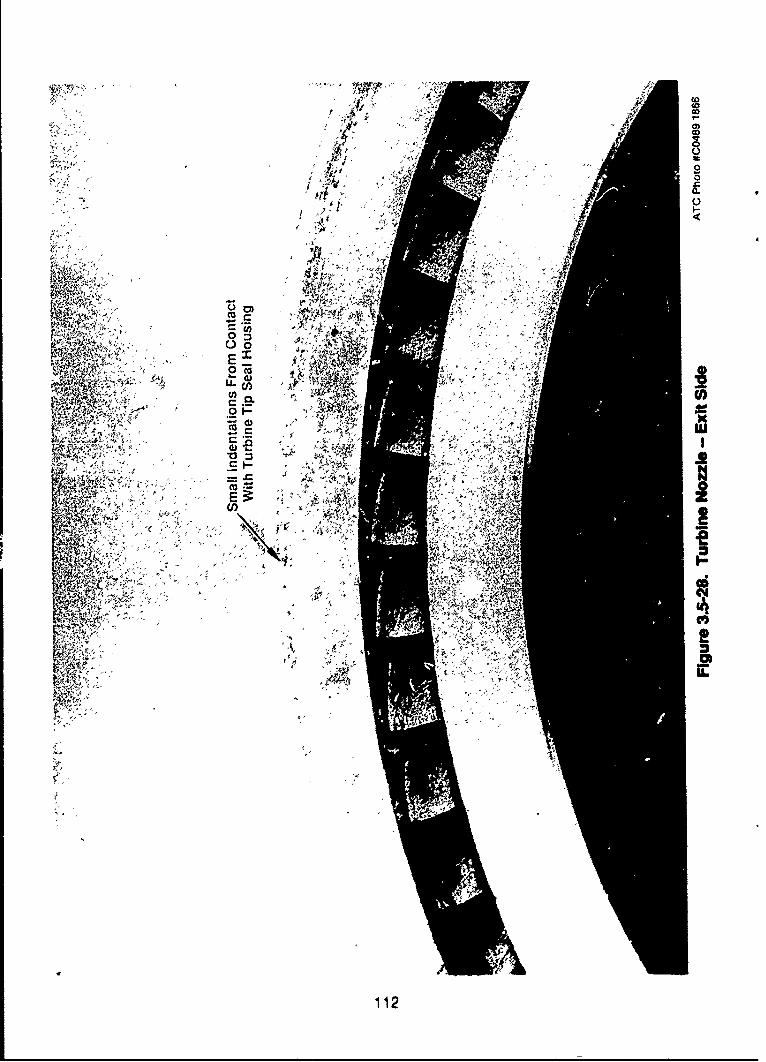
4' 0kM, fl
®R", U2o
Sr. 4
it-
11

3.5, Teardown and Inspection, (cont.)
The mating turbine housing is shown in Figure 3.5-29 looking from the
turbine inlet. This part is in excellent condition with no contact at the shaftlabyrinth gold wear surface. A close up view of the turbine tip seal is shown in
Figure 3.5-30. The gold tip seal surface has a small circumferential groove at the
entrance to the turbine blades. Since there are no marks on the turbine blades it is
possible a particle passing through the turbine made this mark. The axial scratches
seen on the gold seal surface are from the shim material used for determining the
installed turbine tip clearance.
An anomaly noted on disassembly on the pump interstage crossover lines
was that the welded flange ends were offset approximately .010 inch from the tube.
This offset is shown in Figure 3.5-31. All four ends had similar offsets. This offset
will adv~ersely affect the pump efficiency and is undesirable to have sharp comers
and edges in oxygen from an ignition consideration. Therefore these offsets will bo
corrected before the next test series.
3.6 CONCLUSIONS
A liquid oxygen turbopump with 860°R gaseous oxygen turbine drive wasdesigned for a 3750 lb thrust, dual expander cycle rocket engine. This turbopump
which requires no interpropellant seals or purges, features a 156 hp, single stage full
admission impulse turbine, axial flow inducer, a two stage centrifugal pump with
unshrouded impellen., long-life LOX lubricated, self-aligning, hydrostatic bearings,
and a subcritical rotor design. It is constructed of Monel, a nickel-copper alloy,which has low ignition potential in oxygen. The pump was designed to deliver 34.7
gpm of liquid oxygen at a &dscharge pressure of 4655 psia and a shaft speed of 75,000rpm. Completion of test series "C1 ", "C2", "D", "Ei", and "E2" has successfully
demonstrated several of the critical performance characteristics of this unique GOX-
driven LOX-turbopump. Critical characteristics demonstrated are listed below.
1. Turbopump demonstrated in L0 2
2. High discharge pressure demonstrated/achieved
3. High speed demonstrated
113

0U.
3 2
IN c HE
- - ---- : COMPAN
114

0oZ-0
COL
za
U)E
rc0
11

lý N O W A0
"A'~ Avg.
I iir
116ý,,XA

3.6, Conclusions, (cont.)
4. High load capability hydrostatic bearing system demonstrated
5. Low burn factor materials running at close clearance and high pres-sures demonstrated in L0 2
6. Full hydrostatic self aligning LO2 bearing demonstrated
7. Structurally and thermally layered turbopump mechanical design
concept demonstrated
8. Pump throttled off-design performance demonstrated
9. Feasibility of close clearance open impeller design demonstrated
10. Sub-critical axial and radial rotor operation to speeds in excess of
design speed demonstrated on Test 135 where an overspeed on shut-
down reached 80,394 rpm
11. Low radial loads demonstrated with dual discharge
12. GOX driven turbine feasibility demonstrated
13. Tank fed bearing (assisted) start demonstrated
14. Unassisted bearing start demonstrated in L0 2 with GOX turbine drive
Although life testing and testing with warm (860R) GOX in the turbine
must be conducted in the next test series, results of the testing to date indicate a GOX
driven LOX turbopump is feasible.
3.7 RECOMMENDATIONS
Some improvement should be made to the bearing feed system to reduce
excess leakage. The outer cylinder piston ring total circumferential length is 74.6 in.and the inner cylinder piston ring total length is 45.2 in. In a flight type turbopump
design the outer cylinder set of piston rings would be eliminated which is equiv-
117

3.7, Recommendations, (cont.)
alent to 62% of the piston ring leakage area. As a point of reference the total circum-
ferential length of the bearing exit flow area is 10.99 in., approximately 25% of the
total piston ring length.
Prior to the warm GOX drive test series several tasks are recommended, asnoted throughout the text, and are summarized below:
* Resurface journal bearings
* Refurbish distance detectors
* Rework turbine nozzle static seal
* Replace static seals at Military Standard (MS) fittings
e Analyze the shaft axial oscillation phenomenon
* Fabricate new external crossovers to eliminate flange mismatch
* Add additional instrumentation capability to new crossovers
The proximity probes or distance detectors caused considerable delay andthe abort of some test runs due to a shift or loss of signal. A more thermally for-giving probe is needed to correct these problems prior to any subsequent testing.Despite the numerous test runs the available probes were never able to provide ausable shaft motion for all three axes at the same time. Most runs had only oneprobe operating with another intermittent. One probe must operate to give a speedindication or the run is aborted. This is critical instrumentation for both testing andturbopump health diagnosis. Better probes need to be identified and procured. Ifthey are not available commercially, the NASA-LeRC sponsored development work
on a multichannel 3 axis probe should be completed to provide a usable device. (See
Reference 14.)
Additional information on the OTV engine turbopump is available inReferences 14 and 15. Additional OTV systems background can be found inReferences 16 and 17.
118

APPE9N A
DATA REDUCTION EQUATIONS
A-1

a. Pump Overall Pressure Rise (DELTAPO) psid
Assumptions:
1. Measured parameter nomenclature is per Test Lab InstrumentNomenclatures, Section 2.1.2.4, Table 2.1-3 and Table 2.1-4 whe.-e notdefined in this Appendix.
2. Fluid density (9 lbm/ft**3) as a function of fluid temperature at that
location.
gin, IFMSI*0.3211Pin = PS+2"32.2"144 + 4*Di**2 *2, where Din = Pipe diameter at PS.
9outi *•FMPDI*0.321Pouti = PD2i + 2*32.2*144 / 4*)out **2 r2, where Dout = Pipe diameter at
PD2-E and PD2-W. See u. for FMPDI.
i = 1,2 (for pump discharge locations, 2SD1 and 2SD2)
gin = f (TS)
gout = f (TPDD, i, I = 1,2
Pout is the average of the Pouti at the two pump discharge locations, 2SDI and2SD2.
DELTAPO = Pout - Pin
b. Pump Overall Head Rise (DELTAHO) ft
DELTAHO = DELTAPO * 144
(9in + qout)/2
c. Pump Specific Speed (NPSPTNSI) (rpm)(gpm).5/(ft). 75
c.1 Delivered Overall Specific Speed
NT*= W Pi DE+FMPDWNPSPT = (DELTAWiol
A-2

c.2 Inducer Specific Speed
NSI =NT*f-F-M- where DEL TAHI = (PBPH-PS) = 144/qbp'(DELTA1I)0
d. Pump Net Positive Suction Pressure (NPSPTNPSPI) psid
d.1 Inducer Net Positivo Suction Pressure
NPSPI = Pin - Pvi
d.2 Centrifugal Impeller Net Positive Suction Pressure
NPSPT = Pin + DELTAPI - Pvbp
where:
Pvi m inlet vapor pressure as a function of TS
Pvbp r vapor pressure at in iucer discharge as a function of TBPD
Note: See line g for application
e. Pump Net Positive Suction Head (NPSHPT,NPSHI) ft
e.1 Inducer Net Positive Suction Head
NPSHI = NPSPI*144/gin
e.2 First Stage centrifugal Pump Net Positive Suction Head
NPSHPt = NPSPT*144/qbp
gin and gbp are function of TS and TBPD, respectively.
f. Pump Suction Specific Speed (SPTSI) (rpm)(gpm).5 /(ft). 75
f.1 Inducer Suction Specific Speed
SI = N T*ýSI(NPSHI)-s
A-3

f.2 First Stage Centrifugal Pump Suction Specific Speed
ST-NT*VFMSI --FMBPDSPT =
g. Pump Inducer Pressure Rise (DELTAPI) psid
DELTAPI = PBPH - PS
Note: Assumes the velocity head at suction and boost pump supply
housing are the same.
h. Pump Inducer Head Rise (DELTAHI) ft
DELTAHI = DELTAPI * 144/qbp
i. Pump Efficiency (f) DelfVered Fluid Power and Fluid Losses determined
from Temperature Rise (ETAP)
ETAP = HPPT/HPSF
j. Pump Shaft Power (f) [Delivered Fluid Power + (Hydraulic Power Losses (f)
Temperature Rise)]
HPSF = HPPT+HPLOSS
k. Delivered Fluid Power
HPPT = gout * FMPD * DELTAHO/550/448.8, where FMPD = FMPDE +
FMPDW
1. Hydraulic Power Loss based upon Temperature Rise
HPLOSS = HPHEAT + HPBLEED
Centrifugal pump friction loss (f) temperature
= [out * FMPD * Cp * (TPD-TS) + Note: See m for FMPD definiton
A-4

Pump bearing flow work + friction loss (M temperature
;pbi * FMPBI * Cp * (TPBE-TPBI) +
Turbine bearing flow work + friction loss (f) temperature
9pb2 * FMTBI * Cp * (TPBE-TBI)] *
(3600/2545/448.8) +
Boost Pump Hydraulic Turbine fluid power
[bp * FMBPD * DELTAHI +
Pump Bearing Exit (overboard) Flow work minus Pump Bearing
Recirculated .ow work
qbe * (FMPBE-FMPBI) *
(DELTAHO/2)]/448.8/550 Note: Uses only 2nd stagehead rise, half of DELTAHP
qout = f (TPD) where TPD = (TPD1 + TPD2)/2
qpbl = f (TPBD
9pb2 = f (TBI)
p= f (TBPD)
q= f (TPBE)
Cp is the fluid specific heat as a function of local temperature. =0.49
Btu/lbm/R for LN2
=0.405 for LOX
m. Pump Weight Flow Rate (PMPD) (lbm/sec)
PMPD = (FMPDE+FMPDW)*cout/448.8
A-5

n. Pump Power (HPPT) HP
HPPT = HPSF - HPLOSS (Rearranged from line j)
p. Pump Flow Rate to Speed Ratio (QI/N, QP/N) gpm/rpmi
QI/N = FMSI/NT
QP/N = FMPDE+FMPDW-FMPBI-FMTBI)/NT
q. Pump Head Rise to Speed Squared Ratio (DELHO/N2) ft/rpm**2)
DELHO/N**2 = DELTAHO/NT**2
r. DELPB = PPBI-PBE, Pump Bearing Pressure Differential, psi
s. DELTB = PTBI-PTBC, Turbine Bearing Pressure Differential, psi
t. PD2 = PD2E + PD2W Average Pump Discharge Pressure, psi2
v. NRT = NT/1/TTI+46o, Turbine Speed Parameter
u. FMPDI = FMPDE + FMPDW, Total Pump Discharge Flow, gpm
w. ETAST = ETATPA/EFFPD, Turbine Total to Static Efficiency
x. HPPUMP HPSFPD, Pump Horsepower
y. HPDIS HPPFL, Fluid Horsepower
z. HPTARE = [qbp * FMBPD * DELTAHI + cout * (FMPBI + FMTBI)*
DELTAHO]*
448.8 * 550, TARE Horsepower
aa. For Pump Delivered Fluid Horsepower
HPPFL = qout * (FMPDI - FMTBI - FMPBI) * DELTAHO/550/448.8, Fluid
Horsepower
A-6

ab. Original Predicted Design Efficiency
EFFPD = -0.074437 + 3809.4314 * (QP/N)
- 8202769.6* (QP/N)2
+ 5.65306 *109 * (QP/N)3
ac. IIPSFPD = EFFPD, Calculated Predicted Pump Horsepower based on
Predicted Design Efficiency
HPPFL = pump delivered fluid horsepower = HPPT
ad. Overall turbopump efficiency, ETATPA
ETATPA = HPPFL * 550/(WDOT * DHI * 778),
where: WDOT = turbine gas flow rate, lb/sec
DHI = CP * (TrI + 460) * (1-(1/PRS)**
((GAM-1)/GAM))
and CP = gas specific heat at constant pressure, Btu/lb°R
GAM = gas specific heat ratio
PRS = total to static pressure ratio
Tr1 = turbine gas total/inlet temperature, OF
ae. Turbine Blade Mean Slfeed to total to static gas Spouting Velocity ratio
uco = u/Co = turbine blade-spouting velocity ratio
where: u = DBAR * NT * x/(12 * 60)
DBAR = 1.333/12 = 0.11108 ft.
n = 3.14159
A-7

Co = (2 * 32.174 * 778 * DHI)**0.5
af. Turbine flow parameter
lbf2
WRTP = WDOT*SQRT (R*(TTI + 460))/PTI, in.
Floppy diskettes, plots and performance calculations were recorded for the
following selected tests:
Test 154,156,164,165,167,,169,171,172,173, 174,175,176,,177,178,,179,180,
181,182,183,185,186,187,188,189, and 190.
NT was defined as NT-Z for calculating performance in all tests
except for the following: Test 154, 169, 181, 186. NT-X was used. as NT in these casesfor performance calculation purposes.
A-8

APPENDIX B
TEST DATA PLOTS FROM HIGH PRESSURE
HIGH SPEED LOX/GOX TEST NO. 2459-D02-OP-183
B-1
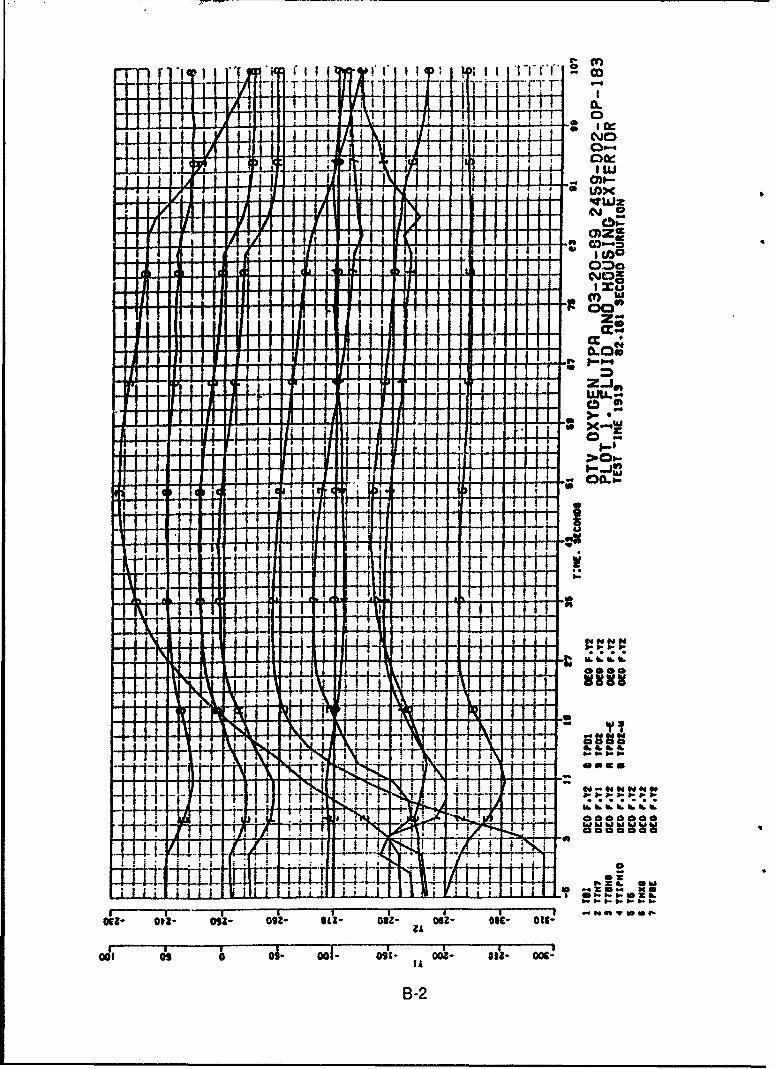
T I F, CD
I- Coe
A! LDX
v* 3--13
II +
IAI
B-cc

.. 14jI i-n-, * ~ 117Tf~ Tn -i+[TI'
r r~tOt-
-r-rr H- tr~ -T ttr r'r-- T7 TT!rr
____ iO .LLLL.LL '
I fI I I I
000?~~~~~~o) 009 00Cc9 0Z 001 00 0
~iis~ W1S9w*
o~? od~ oJ~ v~3a oodc oo~ ocb, b' B u
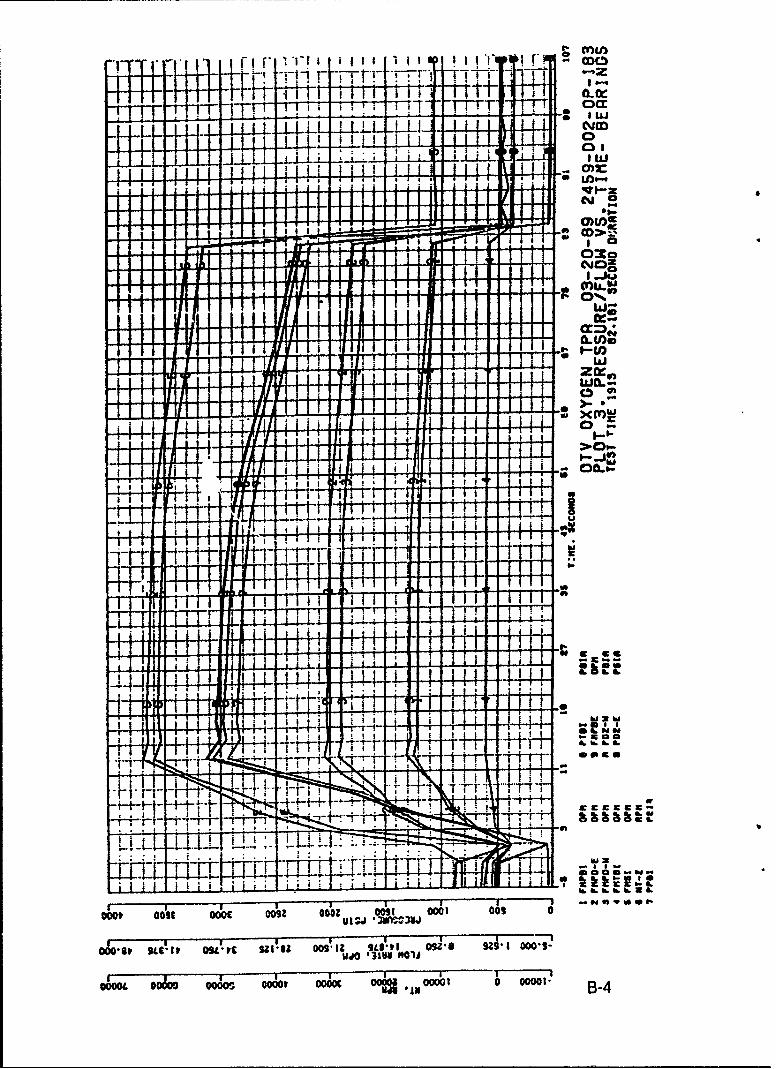
[Ir *1-t I I III !,~II *~ r 2 aELL 1 4 FrY'+-'F
H JIM
I I Ijj
-I II I If I
f III I I I j
0008k~~~~~~~ IL1 09L ug 093 9SI 036 99 oS
~~il -4 0B-

*T- I ITi T3iF O~tt~t?
F,,
-rtl4 LL 1.1J L -FLL-I RL- - _ y*.T11r i 66U0
ILL L..L .L.L
II I I I I I I 1 11 1 1C M
IA I If130
I0* 00t 00 01 03 0 0 03'tu
061 +44-4iii-H iii

)000
- Tr 7' 7-i a ~
TF 0l ~~ - CL
TT HI FT .aa ~* 1a~~t~* itt Trt~r.~ WS17.w
ii~t 1. wfff~~ftf
BY w
.LLLLjiLL ~ .. LLOJ
LI~~~ wS C 91W ~1LN O(Lo
obo ~~~~~~ ~ C- oo'u oC 09 OOl041
.h~~~~~~~~ *oo oA odtoz oo; -* 3 ~8?g~dU~ 0000

T .i1 I III I I T I I - 1 I FT tT i Z
-Ts V 1 Tr- I3 T73 11 0
_uLL 1-.J-~M ~CC1L JOO
IF
Cag
IIII I I I I - 4~
o I I I IL ' it I lf It'l IH ) !0001~ ~~~~~~ 096 00 05 03 091 00 0
uJsT *053
Itoo ooPo- --Pto Hoo ooo uoo ~oo, ~ oot

0-j
T1 I i I (L
-4. J* 1 1 iS 00 in
B8*
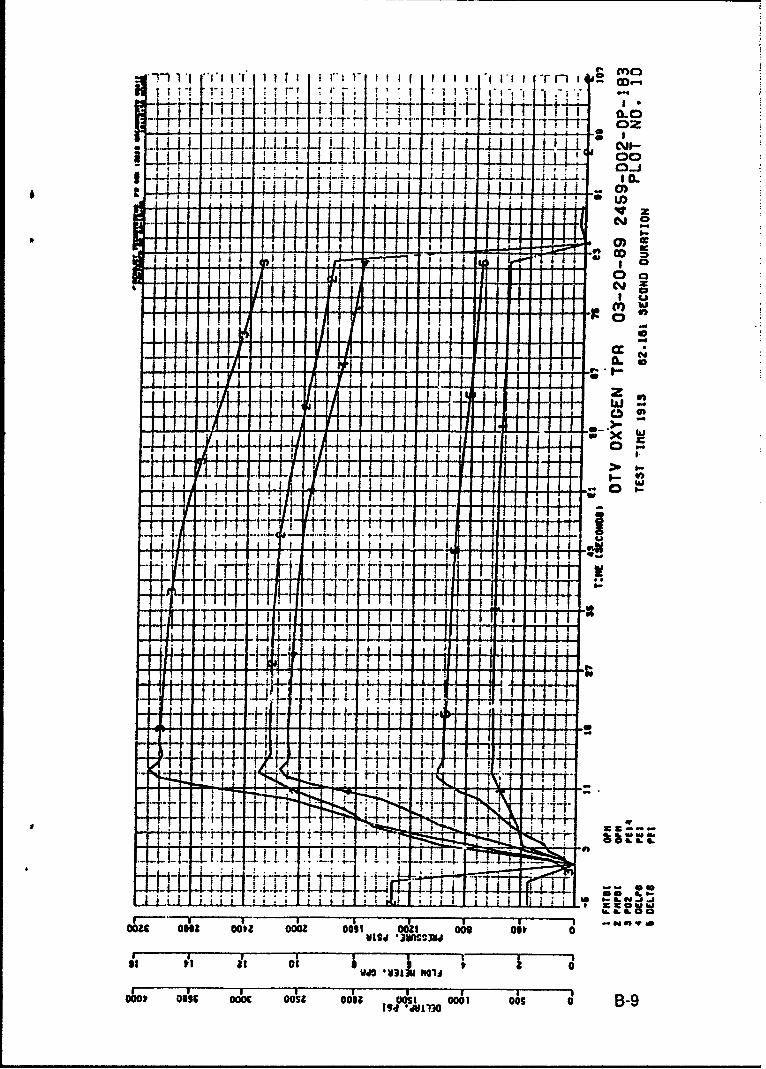
'r-4.t r T i iA..1LU.JJJIL.L. I LL -LL .LL1 * Nt-
3~ 44 I~.L I I 1~ 1 1 4L LJLLi[
cyJ
CD
CY
pI I I Iw m
L X
V i l I I I i Inone ~ ~ T--r __Toe ni ni ns nn 0 -I I t I III I 1I 4 *JI II I 10

SYMBOL$
APPENDIX B
DELPB PSI Delta Pressure Across Pump Bearing
DELTB PSI Delta Pressure Across Turbine Bearing
ETATPA - Efficiency Ratio - Pump Fluid Power Out/Turbine Gas Total to
Static Power In
FMBPD GPM Flow Meter Boostpump Drive
FMPBE GPM Flow Meter Pump Bearing Exit
FMPBI GPM Flow Meter Pump Bearing Inlet
FMTBI GPM Flow Meter Turbine Bearing Inlet
FMPD-E GPM Flow Meter Pump Discharge - East
FMPD-W GPM Flow Meter Pump Discharge - West
FMBI GPM Flow Meter Suction Net
HPDIS HP Delivered Fluid Horsepower
NT-Z RPM Speed Turbine - Z Axis Probe.
PBE PSIA Pressure Pump Bearing Exit 1
PBPD PSIA Pressure Boost Pump Turbine Drive Line
PBPH PSIA Pressure Boost Pump Housing Annulus
1 02 PSIA Pump Discharge Average Pressure -
[(PD2-E) + (PD2-W)]/2
PD2-E PSIA Pressure Discharge 2nd Stage - East
PD2-W PSIA Pressure Discharge 2nd Stage - West
PDTR PSIA Pressure Drive Turbine Run TankPIM1 PSIA Pressure Impeller Wall, Mid Station 3300
PIT2 PSIA Pressure Impeller Wall, Tip Station 300*PPBI PSIA Pressure Pump Bearing Inlet
PPP1 PSIA Pressure Pump Peripheral Wall, Station 00PPP2 PSIA Pressure Pump Peripheral Wall, Station 2700
PPP3 PSIA Pressure Pump Peripheral Wall, Station 1800
PPP4 PSIA Pressure Pump Peripheral Wall, Station 900
PRS - Turbine Pressure Ratio - Total to StaticPS PSIA Pressure Suction Line
I'rBC PSIA Pressure Turbine Bearing Cavity
B-10

Appendix B, Symbols, (cont.)
PTBI PSIA Pressure Turbine Bearing InletPTD-E PSIA Pressure Turbine Discharge - East (TD2)PTDH PSIA Pressure Turbine Discharge HousingPTD-W PSIA Pressure Turbine Discharge - West (M1)
PTI PSIA Pressure Turbine Inlet
TBI DEG F Temperature Bearing InletTHX9 DEG F Temperature Housing Exterior No. 9TP BE DEG F Temperature Pump Bearing ExitTS DEG F Temperature Suction LineTTBH8 DEG F Temperature on Turbine Bearing Housing Exterior No. 8TrDM DEG F Temperature on Turbine Discharge Housing Exterior
TTH7 DEG F Temperature on Turbine Housing Exterior No. 7TfI DEG F Temperature Turbine Inlet Gas
ITIPHIO DEG F Temperature on Pump Housing Exterior No. 10WDOT LB/SEC Turbine Weight Flow RateWRTP (LBM/SEC)(OR**0.5)/(LBF/IN**2) Turbine Flow Parameter
B
B-il
4
APPENDIX C
SYMBOLS AND ACRONYMS
C-1

SYMBOLS AND ACRONYMS
Symbol Meaning Dimensions
A Actual flow area inches squaredBtu British thermal unit 778.98 (ft-lbs)Cd Ratio of empirical to "blueprint" nozzle area w
Ce Gas spouting velocity as a function of total to static ft/secpressure ratio
Cp Specific heat at constant pressure Btu/(Ib x OR)
cpm Cycles per minute 1/min.D, DIA Diameter inches
F Force lbsOF Degrees Fahrenheit OF
ft Feet feetG Earth gravitational constant 32.17 ft/sec2
GAL. Gallon gallonGHe Gaseous heliumGN 2 Gaseous nitrogenGO2 Gaseous oxygen
gpm Volumetric flow rate gal/min.h Enthalpy Btu/lbmH Head of fluid flowing; Head rise feet
hp, HP Horsepower 33,000 ft. lb/min.Hz Cycles per second 1/secH2 Hydrogen
in. Inch in.KHz One thousand cycles per second 1000/secKpsia One thousand pounds per square inch 1000 lb/in.2
L Length feet; inchlb Pound lb
lbf Pound force lbfIbm Pound mass Ibm
min, MIN. Minute min.N Angular speed rev/min.
NT Turbine angular speed rev/min.P,p Pressure lb/in2
psia, PSIA Absolute pressure lb/in.2
C-2

Symbols and Acronyms, (cont.)
Symbol Meaning Dimensions
psid, PSID Differential pressure rise lb/in.2
psi& PSIG Gage pressure (pressure above atmospheric) lb/in.2
Q Volume flowrate gal./min.R Gas constant (ft)(Ibf)/( 0 R)(lbm)R Radius inchesOR Temperature in Degrees Rankine ORrho Specific weight Ibm/ftW
rpm,RPM Angular speed rev./min.S Entropy Btu/(lbm x OR)
sec, SEC Time sec.shp Shaft power hpT Temperature OF, ORU Liner velocity ft./sec.
Weight flow rate Ibm/sec
SSpecific w eight average from entrance to exit Ibm /ft. 3
C-3

Symbols and Acronyms, (cont.)
SUBSCRIPTS
AX Axial
d Design
ex Exhaust
F,f Force
in At entrance location
m Mass
N Unitless number
o Initial state condition
PDI Pump bearing Inlet
R Reynolds number
Is First Stage
2 At exit location, number of atoms
C4

Symbols and Acronyms, (cont.)
ACRONYMS
Aerojet Aerojet TechSystems
Boeing The Boeing Company
C/A Thermocouple material chromel-alumel
dsk Disk
EFF, eff Efficiency - delivered power/input power
F Fuel
F.S.2 Fire Switch (number 2) at the end of engine firing
GOX, G02 Gaseous oxygen
GN2 Gaseous nitrogen
H, H2 Hydrogen
hyd Hydraulic
I.D. Inside diameter
JSC Joint Spacecraft Committee
K Temperature, Kelvin
LERc Lewis Research Center
LN 2 Liquid nitrogen
L0 2 Liquid oxygen
LOX Liquid oxygen
MISFC Marshall Spaceflight Center
N Number, dimensionaless
NASA National Aeronautics and Space Administration
0, 02 Oxygen
OAST Office of Astronautics and Space Transportation
C-5

Symbols and Acronyms, (cont.)
O.D. Outside diameterOTV Orbit Transfer vehicle
OTPA Oxygen Turbopump Assembly
P Pressure rise
PBE Pump Bearing exit
PBI Pump Bearing inlet
PV Pressure times velocity
RL-10 Pratt and Whitney Aircraft Companyliquid oxygen/liquid hydrogenfueled rocket engine
TBD To Be Determined
TPA Turbopump Assembly
X Distance detector centerline inclination from the verticalat 1200 and normal to the shaft centerline
Y Distance detector centerline inclination from the verticalat 2100 and normal to the shaft centerline
Z Distance detector centerline is horizontal and parallel tothe shaft centerline
* Diameter
C-6

APPENDIX D
REFERENCES
D-1

REFERENCES
1. Buckmann, P.S., Hayden, W.R., Lorenc, S.A., Sabiers, R.L., Shimp, N.R., "OrbitalTransfer Vehicle, Oxygen Turbopump Technology, Design Fabrication and SeriesA and B Testing, Final Report, Vol. I," Aerojet Report No. 2459-54-2, Contract NAS3-23772, NASA CR 185175, August 1989.
2. Schoenman, L., Stoltzfus, J. and Kazaroff, B., "Friction Induced Ignition of MetalsIn High Pressure Oxygen," Appendix B, Orbit Transfer Rocket Engine TechnologyProgram, Monthly Report 23M772-M048, May 1987.
3. Schoenman, L., "Oxygen TPA Material Ignition Study," Aerojet TechSystemsCompany Report 23772-M-42, November 1986.
4. Schoenman, L., "Friction Rubbing Test Results of Dissimilar Materials in High-Pressure Oxygen," Aerojet TechSystems Report 23772-M-32, appendix A, January1986.
5. Schoenman, L., "Advanced Cryogenic OTV Engine Technology,"AIAA/ASME/ASEE 21st Joint Propulsion Conference Paper No. AIAA-85-1341,July 8-10,1985.
6. Schoenman, L., "Selection of Burn-resistant Materials for Oxygen-DrivenTurbopumps," AIAA/ASME/SAE 20th Joint Propulsion Conference Paper No.AIAA-84-1287, June 11-13,1984.
7. Brannam, R.J., "ATC Test Plan for Orbit Transfer Vehicle (OTV) LOX TurbopumpTesting," 10 January 1989.
8. McCarthy, R.D., "Interactive FORTRAN Programs for Micro Computers toCalculate the Thermophysical Properties of Twelve Fluids (MIPROPS)," NationalBureau of Standards, May 1986.
9. Shimp, N.R., "GO2 Driven Turbopump for OTV (LOX TPA) Preliminary PumpHydrodynamic Design," 25 July 1984.
10. Lorenc, S.A., "OTV Oxygen TPA Design Point Selection and Aerodynamic Designof Turbine," ATC Memo 6973:D-0Yi9:SAL:ag, 20 July 1984.
11. Glassman, A.J., ed., "Turbine Design and Application," NASA SP-290,1972.
12. "Flow of Fluids Through Valves, Fittings, and Pipe," Crane Technical Paper No.410, Engineering Division, Crane Co., 1980.
13. Collamore, F.N., "Integrated Control and Health Monitoring CapacitiveDisplacement Sensor Development Task," Final Report Orbital Transfer RocketEngine Technology Program, NASA CR 182279, July 1989.
D-2

References, (cont.)
14. Buckmann, P.S., Hayden, W.R., and Sabiers, R.L., "Orbital Transfer Vehicle EngineTurbopump Oxygen Series A and B Test Report, "Interim Report ATC 2459-54-1,Contract/Task Order NAS 3-23772-B.4, April 1988.
15. Buckmann, P.S., "Freon Hydrostatic Bearing Test Report," Contract (NASP)August 1986.
16. Cooper, L.P., "Advanced Propulsion Concepts for Orbital Transfer Vehicles,"AIAA Paper 83-1243, June 1983.
17. Cooper, L.P. and Scheer, D.D., "Status of Advanced Propulsion for Space BasedOrbital Transfer Vehicle," NASA TM 88848, October 1986.
D-3

Nam" Aefrurý o Report Documentation PageSpaw Adivunisidion
1. ReOWt No. 2 Government Accession No 3 Recipient's Catalog NoNASA CR-185262
4. Title and Subtitle 5 Report Date
Orbital Transfer Vehicle Oxygen Turbopumip Technology December 1990Find[ Rcpmr. Vo~lume It --Nitroigen and Ambhient Oxygeni Testiing 6 Performing Organization Code
7. Authorqs) -- -8 Performing Organization Report NoR.J. Brannam. P.S. Buckmiann, B.H. Chen, Aerojet 2459-56-1SiJ. Church. and 111, Sabiers 10. Work Unit No.
591-41I-119. Performingl Orgaization Name and Address I___ontrctoGrat_ N
GENCORP Aerojet TechSystemsAerojet Propulsion Division NAS3-23772P.O. Box 13222
Sacrwnt, Caifonia 581-6M13. Type of Report and Period Covered12,~ ~ ~ ~ SpnogAIW-mm drs Contractor Report
12. ponorln A a~4a .a4 AdraaFinalNational Aeronautics and Space Admninistration 14 Sponsoring Agency CodeLewis Research Center
KCleveland. Ohio 44135-31911s. 8upploeiyfiWNotes
Project Manager. Margaret Proctor. Space Propulsion Technology Division, NASA Lewis Research Center.
16 Abstract (I- YA)ý ;7his report covers the testing of a rocket engine oxygen turbopu-Riplusing high pressure ambient temperature
nitrogen and oxygen as the turbine drive gas in separate test .series. Thq pumiped fluid was liquid nitrogen orliquid oxygen. The Qarbopump i1i'PAY'is designed to operate with 400 1 oxygen turbine drive gas, h' hih will bedemonstrated in a subsequent test series. The TPA Hydrostatic Bearing System was demonstrated tl tesltsdocumented in ithe first volume of this report. (foiiioving bearing teststhe TPA was finish machined (impellerblading and inlet/outlet ports). Cfestiing started on- 15 -FebuwjtryJ.9ý 1nd wajs successfully concluded on 21 March1989. Testing started using nitrogen to reduce the ignition hazar during initial TPA checkout-1'he~fjydrostatic
13ealrin .. ystem requires a ~earingfesrzio Sstem. Ilnitial testing use asparate bearing supply to preventa rubbing start•cTwoliest seiies were successfully completed with the bearing assist supplied only by the pumpsecond stage output which entailed a rubbing start until pump pressure builds up., The final test series usedambient oxygen drive and no external bearing assist Total operating time was 2268 seconds. There were 14starts withou bearing assist and operating speeds ulp to 80,000 rpm were logged. Teardown examination showedsome smearing of silverplated bearing surfaces but no exposure of the underlying monel material. There was noevidence of melting or oxidation due ito the oxygen exposure. The articulating, self-centering hydrostatic bearingexhibited no bearing load or stability problems. The only anomaly was higher than ~edicted flow losses whichwere attributed to a faulty ring seal. The TPA will be refurbished prior ito the 400 F oxygen test series but itscondition is accepitable, as is. for continued operating. This was a highly successful test program.
17. Key Words (Smuggested by Aufthr(s;) 18 Distributi-on Statemeiint-'-Oxygen turbopump,, Hydrostatic bearings, Expander Unclassified -Unlimitedcycle engine; Cryogenic propellant pumping Subject Category 20
19 Security Classif (of this report) 20 Security Ciassif (of this page) 1 I21 No of pages 122 PriceUnclassi fied Unclassified 154 A08
NASA FO$M 1626 OCT 6 *For sale by the National Technical Information Service Springfield Virginia 22161