Final Report - Toyota Camry - Kevin Wood%2c Colby Ford%2c ... the Next... ·...
31
TOYOTA: PREPARING FOR THE NEXT GENERATION CAMRY JOEL AMICK, COLBY FORD, TANAYA KRAUSS, AND KEVIN WOOD INNOVATION ANALYTICS SPRING 2015 DR. MOON
Transcript of Final Report - Toyota Camry - Kevin Wood%2c Colby Ford%2c ... the Next... ·...

TOYOTA: PREPARING FOR THE NEXT GENERATION CAMRY JOEL AMICK, COLBY FORD, TANAYA KRAUSS, AND KEVIN WOOD
INNOVATION ANALYTICS SPRING 2015 DR. MOON

2 | P a g e
CONTENTS
1-‐ Introduction ............................................................................................................................................................. 3
Toyota History .......................................................................................................................................................... 3
Toyota Precepts .................................................................................................................................................... 4
Mission Statement ................................................................................................................................................ 4
Guiding Principles ................................................................................................................................................. 5
Toyota Way ........................................................................................................................................................... 5
Global Vision ......................................................................................................................................................... 6
Toyota Camry ....................................................................................................................................................... 6
Competitors .............................................................................................................................................................. 7
Competitor Comparisons .......................................................................................................................................... 8
Stock Prices ............................................................................................................................................................... 8
Percent of Total Sales ............................................................................................................................................... 9
Recall and Number of Car Impacted ....................................................................................................................... 10
Pricing Strategies .................................................................................................................................................... 11
Marketing Strategies .............................................................................................................................................. 12
Miles per Gallon Comparison ................................................................................................................................. 13
2-‐ Research Problems ................................................................................................................................................. 14
3-‐Analysis Methods & Results .................................................................................................................................... 14
Data and Data Extraction ........................................................................................................................................ 14
Exploratory Analysis ............................................................................................................................................... 16
Text Categorization ................................................................................................................................................. 16
Sentiment Analysis ................................................................................................................................................. 22
Regression Analysis ................................................................................................................................................ 27
4 – Recommendations & Strategy .............................................................................................................................. 29
5- References .............................................................................................................................................................. 31

3 | P a g e
1-‐ INTRODUCTION
TOYOTA HISTORY
Toyota Motor Corporation began in 1933 as a division of the Toyoda Automatic Loom Works,
Ltd. a Japanese manufacturer founded by Toyoda Sakichi. Ford and Chevrolet served as
inspiration to Toyoda in many ways. When designing the original prototype vehicle it was
decided to use common parts so that customers could use Ford and Chevrolet parts that were
prevalent in Japan at the time. In 1934, Toyoda visited research facilities and universities and
studied the automotive and machine tool industries, and benchmarked mass production
processes. The Model A1 passenger car prototype was completed in May 1935.
In October 1936, the company name was changed from "Toyoda" to "Toyota" in conjunction
with the adoption of the Toyota logo. On August 27, 1937 Toyoda Automatic Loom Works'
Automotive Department was spun off and Toyota Motor Co., Ltd. was established as a new
company. On October 31, 1957 Toyota Motor Co., Ltd. and Toyota Motor Sales Co., Ltd.
reached an agreement and established Toyota Motor Sales, U.S.A., Inc., a California
corporation. The Toyopet Crown was the first ever Japanese car sold in the United States.
In 1972 Toyota sold its one-‐millionth vehicle. By the end of 1975, Toyota surpassed Volkswagen
to become the No. 1 import brand in the United States. Three years later, in 1978, Toyota won
the "Import Triple Crown" by leading all import brands in sales of cars, trucks and total vehicles.
Toyota's success continued, and in 1986, it became the first import automaker to sell more than
one million vehicles in America in a single year, racking up sales of 1,025,305 cars and trucks.

4 | P a g e
Toyota Motor Corporation, became the largest automobile manufacturer in the world for the
first time in 2008. Toyota’s success continues and today manufactures a diverse line-‐up of
vehicles all over the globe.
TOYOTA PRECEPTS
On October 30, 1935 Toyoda released the "Five Main Principles of Toyoda.” Since that time the
Five Main Principles of Toyoda have been handed down to every Toyota Group company and
serve as conduct guidelines for all employees.
• Always be faithful to your duties, thereby contributing to the Company and to the overall good.
• Always be studious and creative, striving to stay ahead of the times. • Always be practical and avoid frivolousness. • Always strive to build a homelike atmosphere at work that is warm and friendly. • Always have respect for spiritual matters, and remember to be grateful at all
times.
MISSION STATEMENT
Seeking Harmony between People, Society and the Global Environment, and Sustainable
Development of Society through Manufacturing (Toyota Motor Corporation, 2012).

5 | P a g e
GUIDING PRINCIPLES
TOYOTA WAY
“The Guiding Principles at Toyota reflect the kind of company that Toyota seeks to be. The
Toyota Way 2001 clarifies the values and business methods that all employees should embrace
in order to carry out the Guiding Principles at Toyota throughout the company's global activities
(Toyota Motor Corporation, 2012).”

6 | P a g e
GLOBAL VISION
TOYOTA CAMRY
The Toyota Camry was introduced in 1983 as a replacement for the Toyota Corona. The name
"Camry" is an anglicized phonetic transcription of the Japanese word kanmuri, meaning
"crown". Originally compact in size with a narrow-‐body, later Camry models have grown to a
wide-‐body and fit the mid-‐size classification. The Camry is sold internationally, spanning
multiple generations. All Camrys are built in Georgetown, KY, and Lafayette, Indiana. “It won
acclaim from Consumer's Digest in 1986 as a "Best Buy", and has remained on the list since that
time” (Toyota Motor Sales, U.S.A., Inc., 2014). In July 2013, Toyota Camry cumulative sales

7 | P a g e
reached 10 million units in the United States alone. Of the Camry models sold in the last 20-‐
plus years, nearly two-‐thirds of them remain on the road today. Camry has been the best-‐
selling car in America twelve times in the past thirteen years.
COMPETITORS
To identify the Toyota Camry’s competition, we looked at US sales data from 2002-‐2015. This
information has been summarized in the table 1 below.
Table 1. Toyota Camry’s Competitor Sales (GoodCarBadCar, 2015)
We ranked each car by sum of total sales and by average sales. We chose Honda Accord and the
Ford Fusion as the competitors for our analysis. The Honda Accord was a logical choice. The
Accord/Camry rivalry is as well-‐known as the competitiveness between Coke and Pepsi. The
Honda Accord has been manufactured since 1976 and was the first car from a Japanese
manufacturer to be produced in the United States. Conversely, the Ford Fusion is a recent
release from Ford Motor Company making its first appearance in 2006 to replace the Ford
Make / Model 2002 2003 2004 2005 2006 2007 2008 2009 2010 2011 2012 2013 2014 SumSum Rank
Avg Avg Rank
Toyota Camry 434,145 413,296 426,990 431,703 448,445 473,108 436,617 356,824 327,804 308,510 404,886 408,484 428,606 5,299,418 1 407,648 1
Honda Accord 398,980 397,750 386,770 369,293 354,441 392,231 372,789 290,056 311,381 253,599 331,872 366,678 388,374 4,614,214 2 354,940 2
Toyota Corolla/Matrix 259,732 325,477 333,161 341,290 387,388 371,390 351,007 296,874 266,082 240,259 290,947 302,180 339,498 4,105,285 3 315,791 3
Honda Civic 313,159 299,672 309,196 308,415 316,638 331,095 339,289 259,722 260,218 221,235 317,909 336,180 325,981 3,938,709 4 302,978 4
Nissan Altima 201,822 201,240 235,889 255,371 232,457 284,762 269,668 203,568 229,263 268,981 302,934 320,723 335,644 3,342,322 5 257,102 5
Ford Focus 243,199 229,353 208,339 184,825 177,006 173,213 195,823 160,433 172,421 175,717 245,922 234,570 219,634 2,620,455 6 201,573 14
Chevrolet Impala 267,882 290,259 246,481 289,868 311,128 265,740 165,565 172,078 2,009,001 7 251,125 6
Ford Fusion 142,502 149,552 147,569 180,671 219,219 248,067 241,263 295,280 306,860 1,930,983 8 214,554 12
Chevrolet Malibu 169,377 179,806 203,503 178,253 161,568 198,770 204,808 1,296,085 9 185,155 15
Ford Taurus 332,690 300,496 248,148 196,919 174,803 1,253,056 10 250,611 7
Hyundai Sonata 196,623 225,961 230,605 203,648 216,936 1,073,773 11 214,755 11
Chevrolet Cruze 231,732 237,758 248,224 273,060 990,774 12 247,694 8
Chevrolet Cobalt 212,667 211,449 200,620 188,045 812,781 13 203,195 13
Toyota Prius 181,221 158,884 139,682 236,659 716,446 14 179,112 16
Chevrolet Cavalier 238,225 256,550 195,275 690,050 15 230,017 9
Hyundai Elantra 186,361 247,912 222,023 656,296 16 218,765 10
Ford Mustang 166,530 166,530 17 166,530 17
Buick Century 163,739 163,739 18 163,739 18
Pontiac Grand Am 156,466 156,466 19 156,466 19
Pontiac G6 150,001 150,001 20 150,001 20

8 | P a g e
Taurus. We excluded the Toyota Corolla, Honda Civic, and the Ford Focus because we felt as if
they represented a smaller size vehicle classification. We also decided to exclude Nissan Altima
because we wanted to represent the foreign/domestic aspect of the relationship.
COMPETITOR COMPARISONS
Not only did we want to look at what customers were complaining about in their Toyota’s, we
also wanted to look to see what the consumers were raving about in their competitors. To do
this we needed to understand what the competitors had to offer. The Honda Accord boasted 4
different model types with 8 different engines choices, 8 color options, 6 trim options and 2
different wheel options. 2012 was the first year of the Accord coupe but since Toyota wasn’t
playing in that space with the Camry, we did not use any of the coupe data. In 2013 Honda
added 2 new trim packages to bring it to the current 6.
The Ford Focus has been a juggernaut in this class of sedans. The Focus current has 8 models to
choose from with 5 different engine choices, 10 color options, 4 trim options and 11 different
wheel options to chose from. In 2013 the focus went through a complete redesign of the entire
car. This redesign included a longer wheel-‐base, new multi-‐link rear suspension and a bevy of
technology and driver assistance based on sensors, cameras and radar. In 2014 the added the
new 1.5 liter four cylinder engine option as well.
STOCK PRICES
To begin our examination of the 3 companies, we began comparing the companies’
performance on the New York Stock Exchange. As seen in the graph below (Figure 1) Toyota is
dominate in this area. At the beginning of 2011 Toyota’s stock prices was almost double that of

9 | P a g e
its top competitor, Honda, and quadruple that of Ford. At the end of 2014, it was four times
higher that Honda and eight time higher than Ford.
Figure 1. Stock Prices Toyota, Honda, Ford (Yahoo Finance, 2015)
PERCENT OF TOTAL SALES
Next we looked at the percentage of sales each model contributed to the overall company sales
(Table 2). Here we discovered that the Camry accounts for 18%-‐19%, the Honda Accord 21%-‐
25%, and the Ford Fusion 11%-‐12% of total sales for their respective parent company.

10 | P a g e
Table 2. Percent of Total Sales (GoodCarBadCar, 2015)
RECALL AND NUMBER OF CAR IMPACTED
Then we compared the number of recalls issued and the total number of cars impacted from
the recalls from 2006-‐2014 (Figure 2). Toyota has issues almost three times the number of
recalls than both Honda Accord and Ford Fusion during that timeframe. Overall, Camry recalls
have impacted almost fifty million vehicles, Accord twenty-‐one million, and Fusion almost six
million. Toyota Camry recalls spiked in 2007, remained high through 2010, and has been
declining since. Toyota has always had a reputation for quality. It is known as a manufacturing
company that others model and aspire too. This dramatic increase in recalls surprisingly has not
had a visible impact on sales.
Toyota MoCo
U.S. Sales 2011
Toyota MoCo
U.S. Sales 2012
Toyota MoCo
U.S. Sales 2013
Toyota MoCo
U.S. Sales 2014
Honda MoCo
U.S. Sales 2011
Honda MoCo
U.S. Sales 2012
Honda MoCo
U.S. Sales 2013
Honda MoCo
U.S. Sales 2014
FoMoCoU.S. Sales
2011
FoMoCoU.S. Sales
2012
FoMoCoU.S. Sales
2013
FoMoCoU.S. Sales
2014
1,644,660 2,082,465 2,236,042 2,373,771 1,147,285 1,422,785 1,525,312 1,540,872 2,143,101 2,243,009 2,485,236 2,471,315
Toyota Camry
Toyota Camry
Toyota Camry
Toyota Camry
Honda Accord
Honda Accord
Honda Accord
Honda Accord
Ford Fusion
Ford Fusion
Ford Fusion
Ford Fusion
U.S. Sales 2011
U.S. Sales 2012
U.S. Sales 2013
U.S. Sales 2014
U.S. Sales 2011
U.S. Sales 2012
U.S. Sales 2013
U.S. Sales 2014
U.S. Sales 2011
U.S. Sales 2012
U.S. Sales 2013
U.S. Sales 2014
308,510 404,885 408,484 428,606 235,625 331,872 366,678 388,374 248,067 241,263 295,280 306,860
Percent of Sales 19% 19% 18% 18% 21% 23% 24% 25% 12% 11% 12% 12%
0
5
10
15
2006 2007 2008 2009 2010 2011 2012 2013 2014
# of Recalls CAMRY
ACCORD
FUSION
11 | P a g e
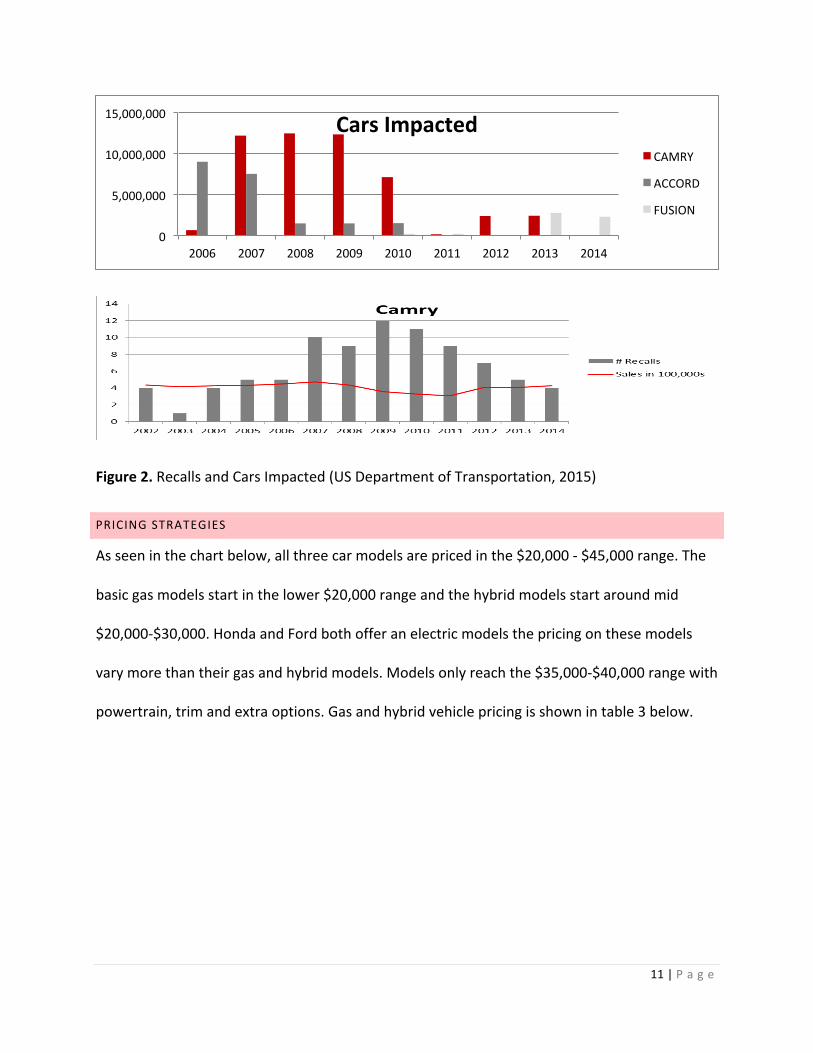
Figure 2. Recalls and Cars Impacted (US Department of Transportation, 2015)
PRICING STRATEGIES
As seen in the chart below, all three car models are priced in the $20,000 -‐ $45,000 range. The
basic gas models start in the lower $20,000 range and the hybrid models start around mid
$20,000-‐$30,000. Honda and Ford both offer an electric models the pricing on these models
vary more than their gas and hybrid models. Models only reach the $35,000-‐$40,000 range with
powertrain, trim and extra options. Gas and hybrid vehicle pricing is shown in table 3 below.
0
5,000,000
10,000,000
15,000,000
2006 2007 2008 2009 2010 2011 2012 2013 2014
Cars Impacted CAMRY
ACCORD
FUSION

12 | P a g e
Table 3. Camry, Accord, and Fusion Pricing
MARKETING STRATEGIES
Each Company handles their marketing strategies very differently. Toyota is marketing the
Camry specifically. Their current campaign focus around the complete new redesigned Camry
titled ‘One Bold Choice Leads to Another.’ We believe that Toyota uncharacteristically
completed a mid cycle redesign in response to Ford’s strategy on the Ford Fusion. When Ford
was designing the Fusion to replace Taurus the designers were told to create a mid-‐size car that
could be priced in the same range as the Camry but looked and felt as if it were $20,000 more
expensive. Ad campaigns for the Ford Fusion at the time of release were ‘Random Acts of
Fusion’ focusing on how the Fusion sets itself apart from the “bland competition” and ‘Not your
Father’s Taurus’ as Ford tried to appeal to the millennials.
Overall Honda follows more of a “sit back and let the product speak for itself” marketing
approach. In 2013, Honda campaigns were ‘Start Something Special’ a theme that spanned all
models and retail advertising and ‘It Starts with You’ that stated that Honda understands what
its customers want and need. Today Honda’s marketing campaign centers around customer
Gas $24,460 - $37,878Hybrid $27,615 - $36,297
Coupe Gas $24,595 - $40,710Sedan Gas $22,925 - $43,041
Hybrid $30,125 - $40,544 Plug-In $40,600 - $41,480
Gas $22,935 - $40,760 Hybrid $25,185 - $38,615Energi $33,900 - $43,610
Accord
Camry
Fusion

13 | P a g e
awareness of airbag recalls and urging customers to have this maintenance preformed
immediately. Current, Honda ads are also highlighting sales promotions and incentives.
Fords current marketing emphasizes its brand more than a single model. The commercials
concentrate on Fords commitment to fuel economy. A statement issued by Ford about its
marketing strategy said, “We will highlight our vehicles features and attributes in our
advertising and marketing, which includes fuel economy and fuel-‐saving technologies like
EcoBoost and hybrids”.
MILES PER GALLON COMPARISON
For the gas models, all brands are fairly close. Toyota’s 4 cylinder engine receives 25 city, 35
highway and 28 combined MPG. Honda offers both a manual and automatic transmission 4
cylinder engine 24-‐26 city, 34-‐35 highway, and 27-‐29 combined MPG. Ford offers three 4
cylinder engines with and 22-‐25 city, 31-‐37 highway, and 25-‐29 combination MPG. It is
important to note that Ford has had to downgrade their MPG rating twice in the past year,
which has damaged their reputation and impacted their sales and growth in the market.
Toyota
4 Cyl 4 Cyl - Manual 4 Cyl - CVT2.5L i-VCT I-4 engine
1.5L Ti-VCT GTDI I-4 EcoBoost
2.0L Ti-VCT GTDI I-4 EcoBoost
25/35/28 MPG 24/34/27 MPG 26/35/29 MPG 22/34/26 MPG 24/36/28 MPG 22/33/26 MPG FWD25/37/29 MPG Auto SS 22/31/25 MPG AWD
Toyota6 Cyl V-6 Manual V-6 Automatic21/31/25 MPG 18/28/22 MPG 21/32/25 MPG
Toyota Toyota Honda Ford
Hybrid Hybrid E-CVT2.0L Atkinson-Cycle
43/39/41 MPG 43/39/41 MPG 50/45/47 MPG 44/41/42 MPG
Honda Ford
Plug in 2.0L Atkinson-Cycle I-4 Energi
115 MPGe 95/81/88 MPGe47/46 /46 MPG 40/36/38 MPG
Honda
Honda
Ford

14 | P a g e
Table 4. Miles per gallon comparison
2-‐ RESEARCH PROBLEMS
Our goal is to predict the perfect next generation Toyota Camry. To do this, we compare
consumer reviews of Camry and key competitors from Cars.com, a common, one of the largest,
classified automotive sites.
Problem 1: Use text categorization topics to discover common themes of reviews
Problem 2: Use sentiment analysis to determine key terms associated with positive and
negative reviews.
Problem 3: Preform regression analysis to discover which features (year, make/model, fuel
type, reliability, comfort and value) are relevant in positively or negatively affecting the overall
review.
3-‐ANALYSIS METHODS & RESULTS
DATA AND DATA EXTRACTION
We looked to various sources for our data to use in our comparisons. These included Cars.com,
Twitter, Consumer Reports and Edmunds.com to name a few. After much research and
deliberation we decided to use the data from Cars.com as the main focus of our research.
Cars.com boasted individual categories on important features of the cars: Comfort, Exterior
Styling, Value for the Money, Performance, Interior Design, Reliability and an Overall rating.
We felt that this delineation would be an important part of trying to have a comprehensive
comparison between different manufactures and models of cars. To extract the data from

15 | P a g e
Cars.com we used various tools and technologies. We used Kumonolabs.com data extraction
tools to get data from the website. We created multiple API’s to extract the various different
year models for the various different cars and different trim packages of those cars we wanted
data for. This in and of its self posed unique challenges. Not all the data on the website is
straightforward. For instance the Overall rating of the cars is not a count of stars but actually a
shading over a background. We had to use custom CSS paths to be able to extract the width, in
pixels, of the shading. When then had to use an algorithm to determine what the rating was
based on the size of the shading. Other complications came from the fact that Cars.com uses
java based pagination and not different URL’s for different number of reviews. This had to be
overcome as well in order to extract more than just the first page of reviews for each car and
model. Once we extracted the needed data, we used both Python programs as well as some
Java to format and clean up the data into Excel based files to be able to use with the SAS
software for the various analyses we needed to perform.
16 | P a g e
EXPLORATORY ANALYSIS
Gas Hybrid Make and Model Year Av
gRating
Performan
c e Exterio
r Interio
r Va
lue
Reliability
AvgR
ating
Performan
c e Exterio
r Interio
r Va
lue
Reliability
Ford Fusion 2012 4.44 4.24 4.58 4.44 4.38 4.5 5 4.86 4.86 4.86 4.57 4.86 2013 3.98 3.83 4.59 4.2 3.89 3.89 4.28 4.23 4.83 4.5 4.13 4.35 2014 4.67 4.44 4.82 4.51 4.49 4.72 4.88 4.81 4.81 4.69 4.63 4.81
Honda Accord
2012 4.33 4.33 4.33 4.25 4.29 4.7 2013 4.33 4.4 4.69 4.39 4.29 4.5
2014 4.55 4.53 4.64 4.53 4.56 4.67 4.41 4.24 4.76 4.51 4.16 4.57
Toyota Camry
2012 4.37 4.32 4.46 4.37 4.55 4.43 4.69 4.35 4.52 4.65 4.79 4.54 2013 4.16 4.22 4.06 4.18 4.33 4.41 4.33 4.33 4.27 4 4.67 4.2 2014 4.42 4.37 4.51 4.63 4.66 4.46 4.82 4.65 4.35 4.53 4.65 4.88
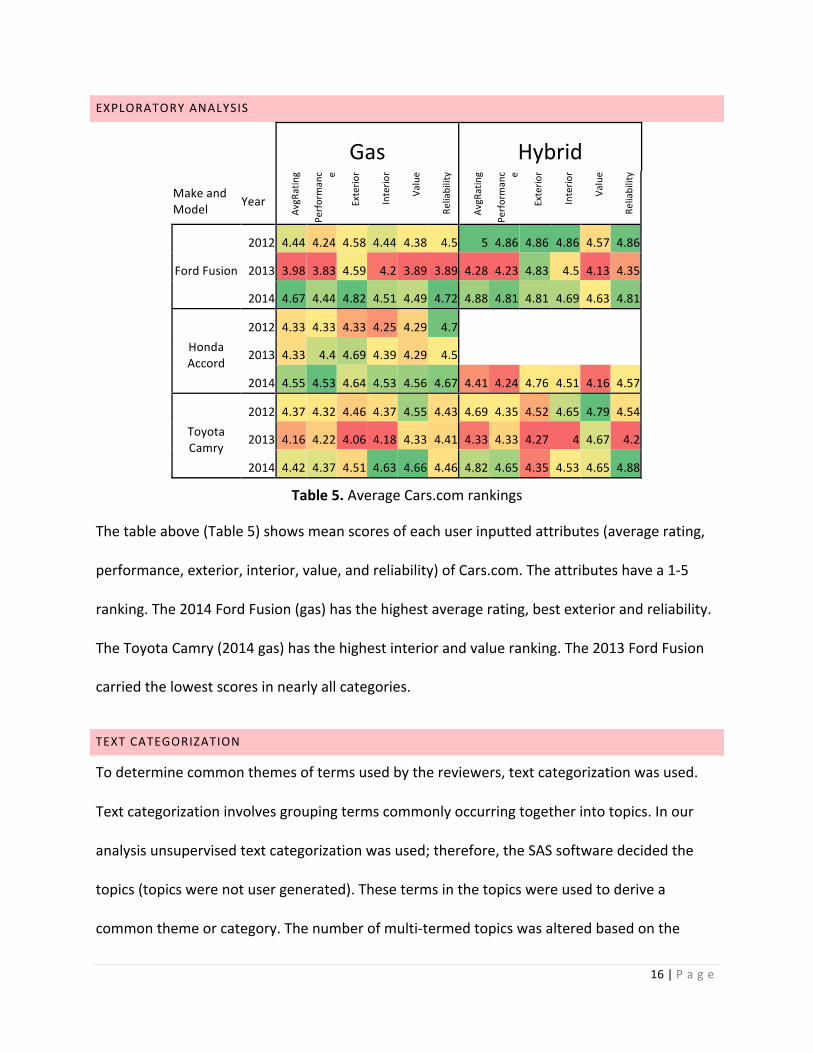
Table 5. Average Cars.com rankings
The table above (Table 5) shows mean scores of each user inputted attributes (average rating,
performance, exterior, interior, value, and reliability) of Cars.com. The attributes have a 1-‐5
ranking. The 2014 Ford Fusion (gas) has the highest average rating, best exterior and reliability.
The Toyota Camry (2014 gas) has the highest interior and value ranking. The 2013 Ford Fusion
carried the lowest scores in nearly all categories.
TEXT CATEGORIZATION
To determine common themes of terms used by the reviewers, text categorization was used.
Text categorization involves grouping terms commonly occurring together into topics. In our
analysis unsupervised text categorization was used; therefore, the SAS software decided the
topics (topics were not user generated). These terms in the topics were used to derive a
common theme or category. The number of multi-‐termed topics was altered based on the

17 | P a g e
results: decreased if many topics carried similar themed terms or increased if topics appeared
to be too broad. Five topics were found to be most suitable. This topic number was maintained
throughout analysis so comparisons between the different makes could be made. Term weight
was set to inverse document frequency and all other values were left as default.
First, reviewer remarks of the Toyota Camry were analyzed (Table 6). Toyota Camry owners
write most their experience and value of their purchase (Topic 1) and also write about test-‐
driving other cars (Topic 3). They enjoy the good gas mileage (Topic 2) afforded by the Camry.
However, they do complain about its features and quality of components (Topics 4 and 5).
Although text categorization does not inherently connect any positive or negative sentiment to
the terms, using the interactive topic viewer allows direct connection from the terms to the
review. Subsequent reading of the can reveal reviewers’ overall attitude. In the case for topics 4
and 5, these reviews of seat, trunk dash, and plastic were mainly negative. Concept link plot
was used to elucidate further relationships. For example the concept linkage for cheap is shown
in Figure 3. The term cheap is most strongly related to plastic and appear (denoted by the
thicker black lines). All the terms in this concept linkage plot seem acceptable to be connected
to cheap. A plastic component can appear cheap and drivers may notice it rattle on the
freeway. The cheap component can be located on the dash[board] and can be soft, light, or
leather. This is one interpretation of the terms used together (based on reading the actual
reviews).

18 | P a g e
Topic Name Topic ID
Document Cutoff
Term Cutoff
Topic Number of Terms
# Docs
Experience & Value (Brand Reliability)
1 0.173 0.051 camry,toyota,+purchase, +year, +car
67 46
Mileage 2 0.178 0.051 mileage,gas,mpg,gas mileage, +car
56 52
Test Driving Other Cars
3 0.170 0.051 +accord,test,honda, ford, car 71 40
Complaints about Quality
4 0.139 0.051 dash,+rattle,+appear,plastic,cheap
83 26
Complaints about Features
5 0.123 0.052 +seat, trunk,+door, rear, difficult
91 41
Table 6. Toyota Camry Text Categorization Topic Table
Figure 3. Concept Link Plot for Cheap (Toyota Camry)
Although this can yield insights on the Toyota Camry buyer as a whole, it is also useful to
understand what appeals to the competitor’s buyers. To do this, positive reviews (average
rating of 4-‐5) were filtered for each brand and categorized similarly. The multi-‐term topic

19 | P a g e
number was restricted to 5, which yielded the best, most distinct topics and allowed for direct
comparison across brands. Interestingly, both the Ford Fusion and Honda Accord resulted in the
same topics. This overview is shown in Table 7: the topic category is in bold, while characteristic
terms for each car is shown under the category. Both positive Ford Fusion and Honda Reviews
detailed reliability of brand, mileage, interior comfort, technological features, and steering &
handling. Topics such as seat, passenger, trunk, ride, interior, and style all are synonymous with
interior comfort. Further exploration of the topics within the reviews with the interactive topic
viewer in SAS supplementary corroborated this. Tables 8 and 9 depict the full SAS output with
document and term cutoff statistics. These tables also show the number of terms and
documents in each category. For example, there are 51 terms related to Brand Reliability
spanning 34 documents (reviews) for Ford Fusion reviews. The concept link plot for interior
(Figure 4, Ford Fusion) is shown below Ford Fusion’s text topic table. Reviewers are pleased
with the Fusion’s interior sound system, leather, and they think it is comfortable. The reviewers
compare the interior to be luxurious. Honda Accord’s concept link for comfortable is shown in
Figure 5. Comfortable is connected to ride, seat, quiet, leather, sound, sound system, and easy.
Overall Ford Fusion reviewers are pleased with the comfortable ride, seats, and sound system
which (from further analysis from the reviews) is easy to operate.

20 | P a g e
Ford Fusion Honda Accord
1-‐Reliability of Brand
car, great, fusion, buy honda, car, accord, buy, good
2-‐Mileage
mpg, hybrid, mileage, car, trip car, mileage, mile, mpg, great
3-‐Interior Comfort
seat, passenger, trunk, power ride, driver, interior, style
4-‐Technological Features
sensor, side, camera, mph camera, feature, blind spot, cruise
5-‐Steering and Handling
steer, service, engine, well transmission, power, curve, control
Table 7. Summary Table Competitor’s Similar Topic Categorization
Category Topic ID
Document Cutoff
Term Cutoff
Topic Number of Terms # Docs
Reliability of Brand
1 0.64 0.182 +car,great,fusion,mileage,+buy
51 34
Mileage 2 0.567 0.175 mpg,+hybrid,mileage,+car,+trip
48 26
Interior Comfort
3 0.469 0.158 +seat,+passenger,trunk,+seat,power
58 19
Technological Features
4 0.544 0.15 +sensor,+side,+camera,mpg,mph
67 7
Steering & Handling
5 0.45 0.139 +steer,+service,+engine,well,+sedan
55 10
Table 8. Ford Fusion Text Categorization (Positive Reviews) Topic Table

21 | P a g e
Figure 4. Concept Link Plot for Interior (Ford Fusion)
Category Topic ID
Document Cutoff
Term Cutoff
Topic Number of Terms
# Docs
Reliability of Brand
1 0.59 0.181 honda,+car,+accord,+buy,+good 52 32
Mileage 2 0.598 0.17 +car,mileage,+mile,mpg,great 53 27
Interior Comfort 3 0.496 0.166 Interior,ride,+feature,style,+driver
57 35
Technological Features
4 0.545 0.159 camera,+feature,blindspot,cruise,cruise control
77 17
Steering and Handling
5 0.532 0.148 transmission, power, control,driving,cruise
70 13
Table 9. Honda Accord Text Categorization (Positive Reviews) Topic Table

22 | P a g e
Figure 5. Concept Link Plot for Comfortable (Honda Accord)
SENTIMENT ANALYSIS
It is useful to determine the sentiment or “attitude” of the terms or text written by the
reviewers. This provides a richer understanding of the reviews’ meanings. Text categorization
can oversee sentiment because sentiment is not just determined based on the inherent
meaning of the term, but is also based on context. For sentiment analysis, each review is placed
into different text documents and categorized into negative (average ratings 1 -‐2) or positive
(average ratings 4-‐5) groups. SAS sentiment analysis algorithm classified the terms within the
positive and negative groups. Sentiment analysis was completed for Toyota Camry, Honda
Accord, and Ford Fusion reviews. The results of Toyota Camry are shown in the Table 10 below:
Toyota Camry
positive negative
Term Weight Term Weight
love 3194.99 paint 1325.28
feature 1572.48 fault 1269.34
quiet 1488.19 fire 1269.34
model 1450.91 refuse 1140.58

23 | P a g e
Hybrid 1356.78 rebuild 1140.58
best 1337.42 unusual 1140.58
style 992.803 drain 941.978
fuel 916.95 lemon 934.358
Great 915.728 chip 918.976
excellent 904.41 ice 855.288
reliable 901.538 vinyl 768.582
recommend 875.121 Paint 716.306
Accord 849.88 horrible rattle coming 680.674
performance 819.328 Constant correction 663.066
MPG 806.118 Oxidation 663.066
room 783.877 boat load of problems 663.066
Camry SE 781.452 dangerous 663.066
quality 692.731 Oxidation of paint 663.066
smooth 687.417 Constant 663.066
reliability 665.964 blame 663.066
safety 619.103 Alignment 663.066
Very 592.991 console box 635.095
space 563.922 rattle 635.095
enjoy 562.689 catch 635.095
impress 542.066 displease 635.095
air 539.789 console 635.095
fit 528.072 Complicated guidance system 609.391
right 526.891 complicated 609.391
speed 505.75 source 609.391
great gas mileage 487.161 guidance 609.391
Table 10. Top 30 Positive and Negative Terms of Toyota Camry Reviews
It is no surprise that MPG, great gas mileage, space, reliability, smooth, and are positive terms
associated with Toyota Camry (based on previous the text categorization). Toyota buyers are
displeased with certain features such as the complicated guidance system, console, console box,
and constant correction. Most of the complaints center around the paint: oxidation of paint,

24 | P a g e
oxidation, and chip. There are also with noise from terms such as rattle and horrible rattle
coming.
Ford Fusion
Positive Negative
Term Weight Term Weight
great 4019.58 plastic 2765.08
very 3401.12 LAST 2765.08
drive 3263.47 several Fords 2765.08
good 2588.53 owned 2765.08
mileage 2453.64 Reverse 2765.08
gas 2348.92 trans drops 2765.08
feature 1611.37 LAST Ford 2765.08
driving 1481.06 had major 1998.15
average 1318.33 NEVER 1998.15
MPG 1293.88 Nissan Altima 1798.22
vehicle 1177.97 adjustability 1798.22
recommend 1133.22 different sizes 1798.22
happy 1057.3 Altima 1798.22
handle 1048.5 proof 1740.18
style 1021.33 car worth 1740.18
SE 1014.57 bad ones 1740.18
month 995.65 engineering 1740.18
quiet 893.282 Rate 1254.47
fuel 887.864 flush 1254.47
smooth 864.156 ridiculous 1254.47
Love 855.879 Fusions 1254.47
interior 827.639 dealer test 1254.47
nice 789.213 scam 1254.47
system 781.459 unit 1083.72
week 755.286 Cheap 1037.41
speed 754.993 toyota 1037.41
highway 751.362 poor quality build 1037.41
engine 743.575 overflow 1037.41
Ford Fusion 712.556 better selection 1037.41
Great 635.631 junk yard 1037.41

25 | P a g e
Table 11. Top 30 Positive and Negative Terms of Ford Fusion Reviews
Ford Fusion reviewers (Table 11) are most happy with their mileage (common terms: mpg, fuel,
gas,) and the car’s driving (common terms: handling, speed, highway, engine, driving, quiet).
The negative reviews appear to focus around their frustration with buying or test driving the car
and they mention other competitors. Terms suggesting this are scam, cheap, dealer test, better
selection, car worth, rate, Nissan Altima, and Toyota. The reviewer also complain about the
car’s body: poor quality build, cheap, engineering, and plastic.
Honda Accord
Positive Negative
Term Weight Term Weight
far 1353.35 restraint 1589.55
mpg 1307.91 imperfection 902.877
handle 1285.97 seat restraint starts 795.193
Love 1225.71 great but the seat 795.193
right 721.843 relief 795.193
amaze 630.512 fee 691.488
perfect 623.204 hurt 667.674
easy 581.68 bone 632.352
economy 540.197 multiple 602.118
room 514.242 waste gas 557.705
add 513.444 making good cars 557.705
lane 503.24 bone-‐shatter 557.705
Coupe 468.077 spine 557.705
run 462.543 one wrong 557.705
plenty 449.922 every imperfection 557.705
Great car 445.085 pedal 557.705
top 440.165 rock hard seats 557.705
previous 439.164 spine while sitting 557.705
dealership 438.957 road and rattle 557.705
Civic 426.923 same price 557.705
Good 393.657 gas pedal 557.705

26 | P a g e
control 389.653 lot of noise 557.705
always 389.307 much effort 557.705
navigation 382.276 gasket 494.255
space 364.3 head gasket 494.255
fun 359.933 nature 482.22
key 357.251 nail 482.22
backup camera 354.235 whistling sound 482.22
economical 352.872 consumer 482.22
keyless 349.31 shortly 482.22
Table 12. Top 30 Positive and Negative Terms of Honda Accord Reviews
Honda Accord reviewers (Table 12) are most happy with the car’s spaciousness (room, plenty,
space). They also like its technological features such as backup camera, keyless/key, and
navigation. Control, lane, and handle are terms associated with the vehicles steering or
handling. The major negative reviews have terms dealing with seat issues, specifically seat
issues causing spine or back problems. The following are the terms: seat restraint starts, rock
hard seats, spine, bone-‐shatter, bone, hurt, great but the seat, and [seat] restraint. This is a
major negative and the next generation Toyota Camry should not mimic any of Honda Accords
seats. Noise issues also are apparent with the Honda Accord.

27 | P a g e
REGRESSION ANALYSIS
Model With Just Score Attributes
Parameter Estimates
Variable DF Parameter
Estimate Standard
Error t Value Pr > |t| Variance Inflation
Intercept 1 -0.38084 0.09868 -3.86 0.0001 0
Comfort 1 0.291 0.02303 12.64 <.0001 2.15081
Performance 1 0.12075 0.02371 5.09 <.0001 2.1414
Exterior 1 0.02148 0.02706 0.79 0.4277 1.82982
Interior 1 0.08834 0.02571 3.44 0.0006 2.27147
Value 1 0.29242 0.0247 11.84 <.0001 2.82453
Reliability 1 0.26899 0.02618 10.28 <.0001 2.62858
Table 13. Score Attribute Model
Note that all of the variables on Comfort, Performance, etc. have positive parameter estimates
and therefore effect the overall average rating positively with Value and Reliability having the
greatest positive effect. Exterior is not significant.
Model With Just Year Attribute
Parameter Estimates
Variable DF
Parameter Standard
t Value Pr > |t|
Variance
Estimate Error Inflation
Intercept 1 4.55512 0.06254 72.84 <.0001 0
Is2012 1 -0.12219 0.0833 -1.47 0.1428 1.37925
Is2013 1 -0.34437 0.08953 -3.85 0.0001 1.37925
Table 14. Year Model
28 | P a g e
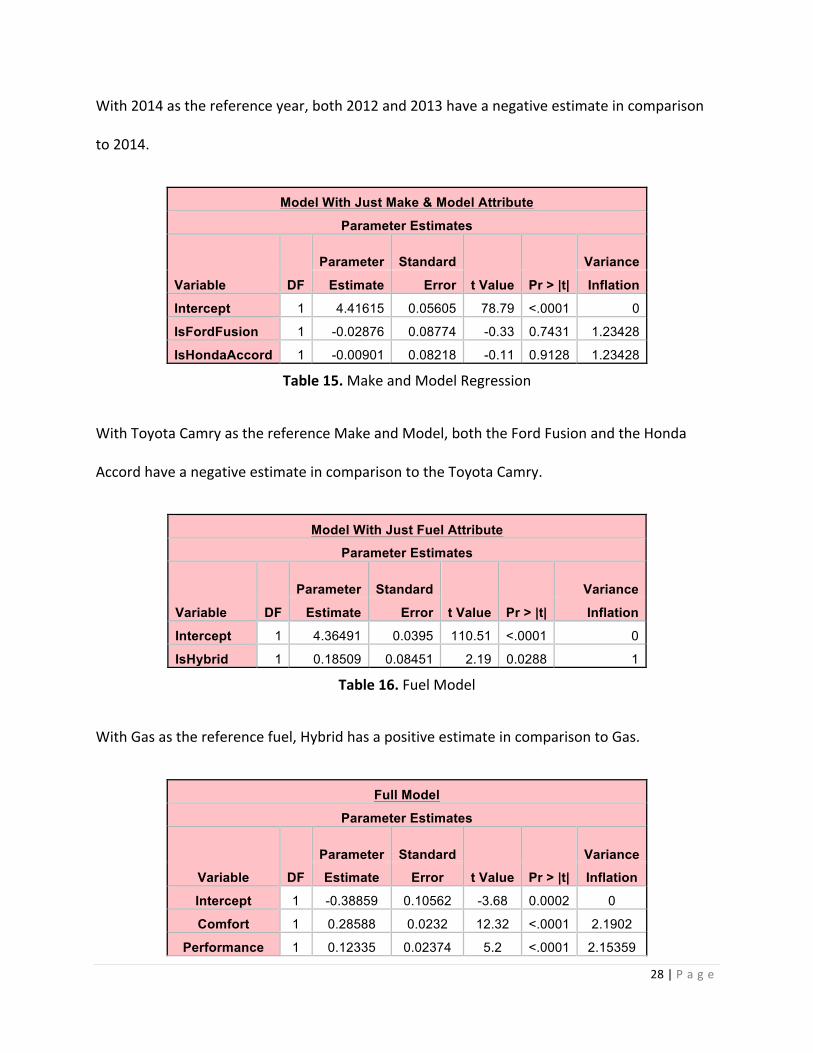
With 2014 as the reference year, both 2012 and 2013 have a negative estimate in comparison
to 2014.
Model With Just Make & Model Attribute
Parameter Estimates
Variable DF
Parameter Standard
t Value Pr > |t|
Variance
Estimate Error Inflation
Intercept 1 4.41615 0.05605 78.79 <.0001 0
IsFordFusion 1 -0.02876 0.08774 -0.33 0.7431 1.23428
IsHondaAccord 1 -0.00901 0.08218 -0.11 0.9128 1.23428
Table 15. Make and Model Regression
With Toyota Camry as the reference Make and Model, both the Ford Fusion and the Honda
Accord have a negative estimate in comparison to the Toyota Camry.
Model With Just Fuel Attribute
Parameter Estimates
Variable DF
Parameter Standard
t Value Pr > |t|
Variance
Estimate Error Inflation
Intercept 1 4.36491 0.0395 110.51 <.0001 0
IsHybrid 1 0.18509 0.08451 2.19 0.0288 1
Table 16. Fuel Model
With Gas as the reference fuel, Hybrid has a positive estimate in comparison to Gas.
Full Model
Parameter Estimates
Variable DF
Parameter Standard
t Value Pr > |t|
Variance
Estimate Error Inflation
Intercept 1 -0.38859 0.10562 -3.68 0.0002 0
Comfort 1 0.28588 0.0232 12.32 <.0001 2.1902
Performance 1 0.12335 0.02374 5.2 <.0001 2.15359

29 | P a g e
Exterior 1 0.00989 0.02774 0.36 0.7217 1.92845
Interior 1 0.08789 0.0257 3.42 0.0007 2.27535
Value 1 0.30346 0.02539 11.95 <.0001 2.99317
Reliability 1 0.26455 0.02655 9.96 <.0001 2.71283
Is2012 1 0.00679 0.03886 0.17 0.8614 1.51725
Is2013 1 -0.03416 0.04081 -0.84 0.4028 1.44892
IsFordFusion 1 0.09309 0.04118 2.26 0.0241 1.40014
IsHondaAccord 1 0.04676 0.03937 1.19 0.2353 1.45841
IsHybrid 1 0.05114 0.03848 1.33 0.1842 1.06046
Table 16. Full Model
Note that when the full model is constructed, the relationship of 2012 to the reference year
(2014) flips from negative to positive whereas 2013 stays negative. The relationship of both the
Ford Fusion and the Honda Accord flips from negative to positive as well. There may be some
other unknown multicollinearity issues or issues within year/model combinations that would
explain the change in parameter estimates in the full model.
4 – RECOMMENDATIONS & STRATEGY
The Honda Accord gets great reviews that reference the technological features whereas
previous Toyota Camry models have some complaints about the features being complicated
and difficult to use. Modeling the next generation Camry to have great feature, but having
them be less difficult will be necessary.
Results from analyses conclude that a modern, stylish exterior of the Camry is desired. Thus,
design is key. Also, Honda Accord reviews showed that many consumers complain of their seats

30 | P a g e
causing great back pain and discomfort. So, the next generation Camry must comfortable, have
great seating, be roomy and with plenty of storage space.
Some reviews of the Camry show that consumers complain of the cheap parts on the exterior
of the car, many of which are easily broken off or make noise while driving. Paint chipping is an
issue as well. Ensuring that the Camry is made of quality parts is key to upholding the value
image of the car.
As far as fuel economy goes, a high miles per gallon score is likely to attract buyers over other
brands. Camry buyers buy for value, the look, and reliability of the machine, so performance is
less importance than the other features.

31 | P a g e
5- REFERENCES
Ford Motor Company. (2015). 2016 Fusion. Retrieved March 1, 2015, from Ford: http://bp3.ford.com/2016-‐Ford-‐Fusion?branding=1&lang=en&gnav=header-‐cars#/Models/Style%5BBodyStyle:_GASS%5D
Ford Motor Company. (2015). FUSION Specifications. Retrieved March 1, 2015, from Ford: http://www.ford.com/cars/fusion/specifications/
GoodCarBadCar. (2015). Best Sellers. Retrieved March 1, 2015, from Good Car Bad Car: http://www.goodcarbadcar.net/p/best-‐sellers.html
GoodCarBadCar. (2015). Sales Stats. Retrieved March 1, 2015, from Good Car Bad Car : http://www.goodcarbadcar.net/p/sales-‐stats.html
Honda Motor Company. (2015). Pricing Options. Retrieved March 1, 2015, from 2015 Honda Accord Sedan: http://automobiles.honda.com/accord-‐sedan/price.aspx
Honda Motor Company. (2015). Pricing Options. Retrieved March 1, 2015, from 2015 Accord Coupe: http://automobiles.honda.com/accord-‐coupe/price.aspx
Honda Motor Company. (2015). Pricing Options. Retrieved March 1, 2015, from 2015 Accord Hybrid: http://automobiles.honda.com/accord-‐hybrid/price.aspx
Honda Motor Company. (2015). Pricing Options. Retrieved March 1, 2015, from 2014 Accord Plug-‐in: http://automobiles.honda.com/accord-‐plug-‐in/price.aspx
Honda Motor Company. (2015). Specifications. Retrieved March 1, 2015, from 2015 Honda Accord Sedan: http://automobiles.honda.com/accord-‐sedan/specifications.aspx
Honda Motor Company. (2015). Specifications. Retrieved March 1, 2015, from 2015 Accord Coupe: http://automobiles.honda.com/accord-‐coupe/specifications.aspx
Honda Motor Company. (2015). Specifications. Retrieved March 1, 2015, from 2015 Accord Hybrid: http://automobiles.honda.com/accord-‐hybrid/specifications.aspx
Honda Motor Company. (2015). Specifications. Retrieved March 1, 2015, from 2014 Accord Plug-‐in: http://automobiles.honda.com/accord-‐plug-‐in/
Toyota Motor Company. (2015). Camry Models. Retrieved March 1, 2015, from Toyota : http://www.toyota.com/camry/#!/models
Toyota Motor Company. (2015). Camry 2015. Retrieved March 1, 2015, from Toyota : http://www.toyota.com/content/ebrochure/2015/camry_ebrochure.pdf
Toyota Motor Corporation. (2012). 75-‐Year History TOP. Retrieved March 01, 2015, from Toyota Global: http://www.toyota-‐global.com/company/history_of_toyota/75years/text.html
Toyota Motor Sales, U.S.A., Inc. (2014, November 19). Toyota Passenger Car Chronology. Retrieved March 1, 2015, from Toyota -‐ USA Newsroom: http://pressroom.toyota.com/article_display.cfm?article_id=2493
US Department of Transportation. (2015). FLAT FILE COPIES OF NHTSA/ODI DATABASES. Retrieved March 1, 2015, from Vehicle Manufacturers: http://www-‐odi.nhtsa.dot.gov/downloads/
Yahoo Finance. (2015). Historical Prices. Retrieved March 1, 2015, from Yahoo Finance: http://finance.yahoo.com/q/hp?s=TM+Historical+Prices