Final Report to the University Senate on an Evaluation of a Proposed New University Budget Model...
36
Final Report to the University Senate on an Evaluation of a Proposed New University Budget Model Prepared by: The Ad Hoc Senate Committee on Strategic Budgeting (AHSCSB) March 31, 2015
-
Upload
alison-holt -
Category
Documents
-
view
214 -
download
0
Transcript of Final Report to the University Senate on an Evaluation of a Proposed New University Budget Model...

Final Report to the University Senateon an Evaluation of a
Proposed New University Budget Model
Prepared by:The Ad Hoc Senate Committee on Strategic Budgeting
(AHSCSB)
March 31, 2015
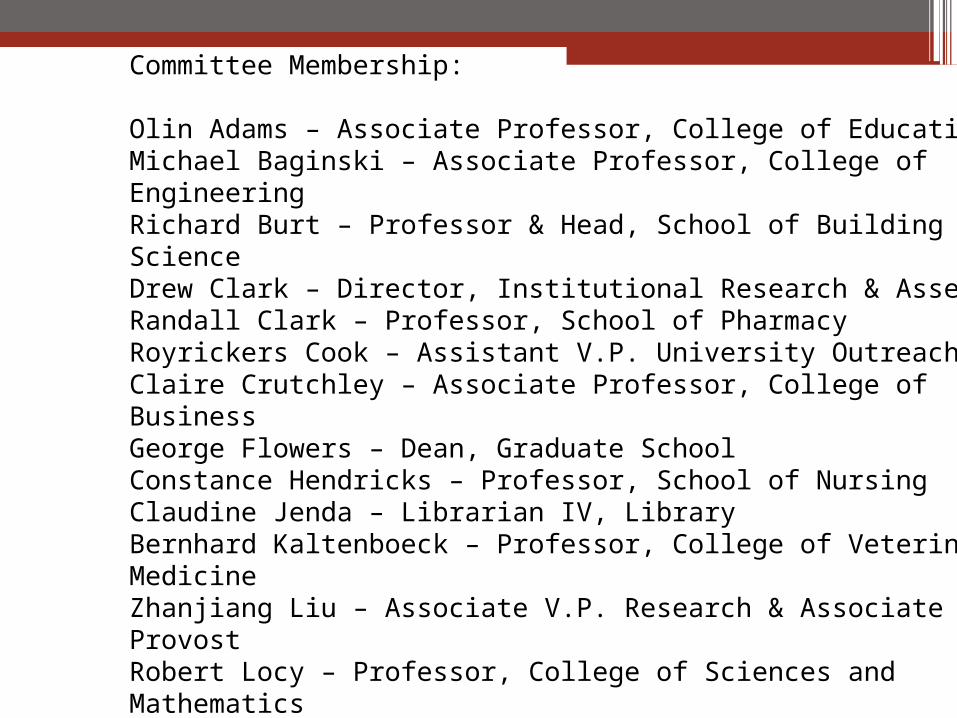
Committee Membership:
Olin Adams – Associate Professor, College of EducationMichael Baginski – Associate Professor, College of EngineeringRichard Burt – Professor & Head, School of Building ScienceDrew Clark – Director, Institutional Research & AssessmentRandall Clark – Professor, School of PharmacyRoyrickers Cook – Assistant V.P. University OutreachClaire Crutchley – Associate Professor, College of BusinessGeorge Flowers – Dean, Graduate SchoolConstance Hendricks – Professor, School of NursingClaudine Jenda – Librarian IV, LibraryBernhard Kaltenboeck – Professor, College of Veterinary MedicineZhanjiang Liu – Associate V.P. Research & Associate ProvostRobert Locy – Professor, College of Sciences and MathematicsJames Prevatt – Extension Specialist Professor, College of AgricultureMarcie Smith – Senior Associate V.P. Business & FinanceBarb Struempler – Professor, College of Human SciencesLarry Teeter – Professor, School of Forestry & Wildlife Sciences, ChairJoseph Vonasek – Assistant Professor, College of Liberal Arts
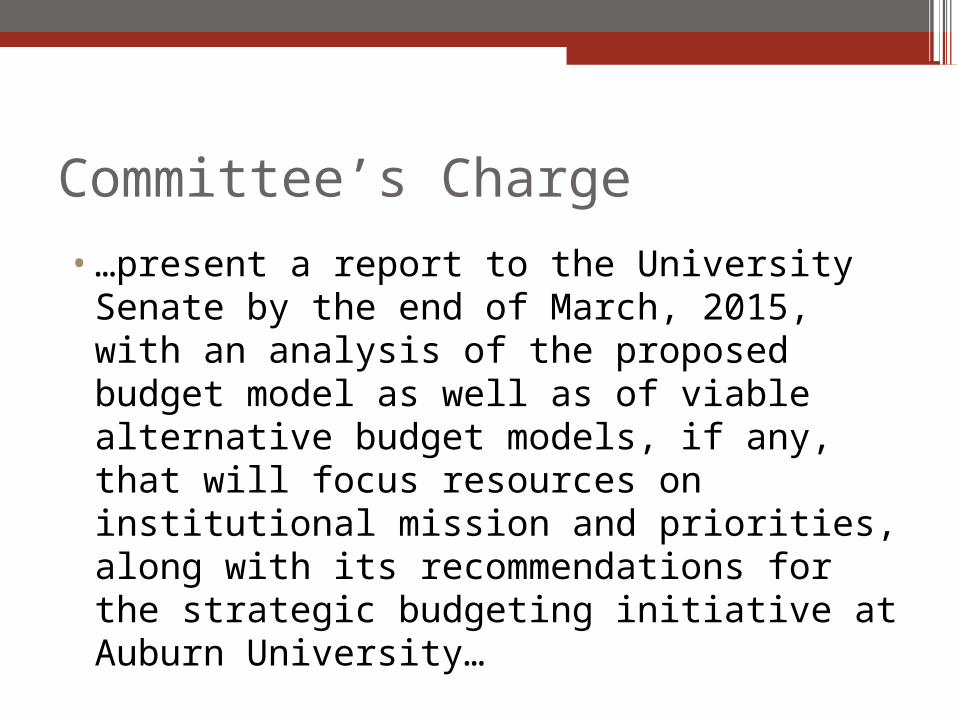
Committee’s Charge
•…present a report to the University Senate by the end of March, 2015, with an analysis of the proposed budget model as well as of viable alternative budget models, if any, that will focus resources on institutional mission and priorities, along with its recommendations for the strategic budgeting initiative at Auburn University…
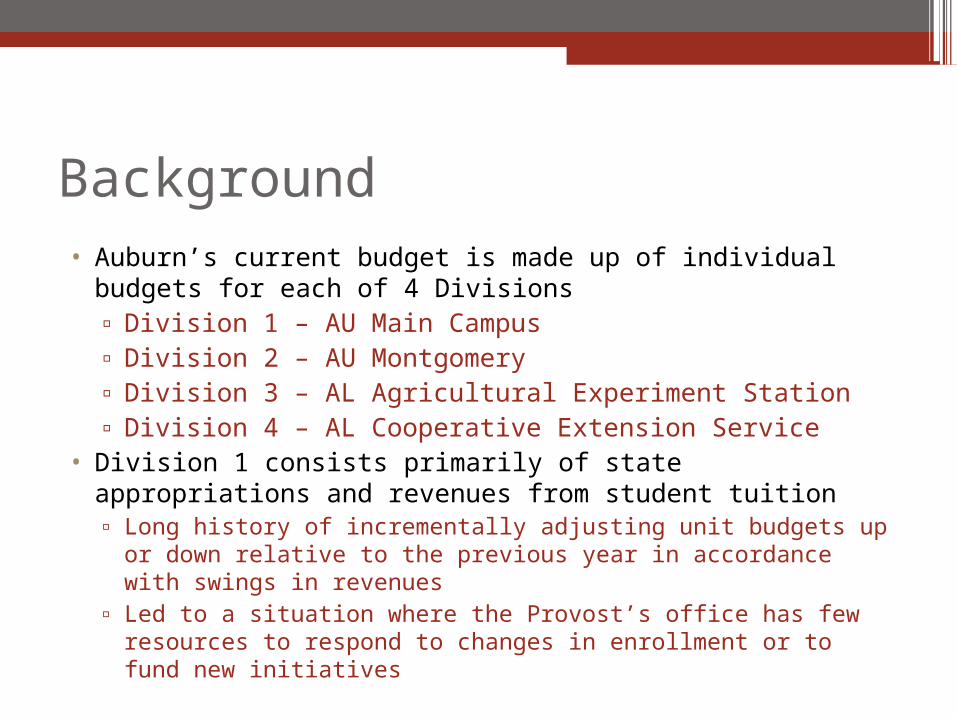
Background• Auburn’s current budget is made up of individual budgets
for each of 4 Divisions▫ Division 1 – AU Main Campus▫ Division 2 – AU Montgomery▫ Division 3 – AL Agricultural Experiment Station▫ Division 4 – AL Cooperative Extension Service
• Division 1 consists primarily of state appropriations and revenues from student tuition▫ Long history of incrementally adjusting unit budgets up or down
relative to the previous year in accordance with swings in revenues
▫ Led to a situation where the Provost’s office has few resources to respond to changes in enrollment or to fund new initiatives
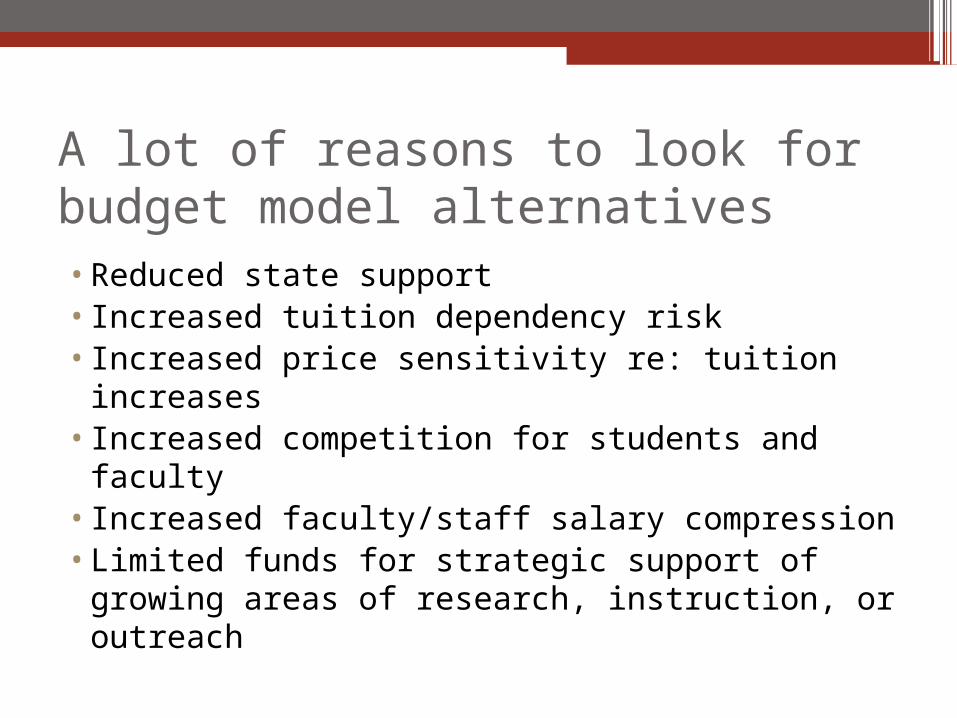
A lot of reasons to look for budget model alternatives•Reduced state support• Increased tuition dependency risk• Increased price sensitivity re: tuition
increases• Increased competition for students and
faculty• Increased faculty/staff salary compression•Limited funds for strategic support of
growing areas of research, instruction, or outreach
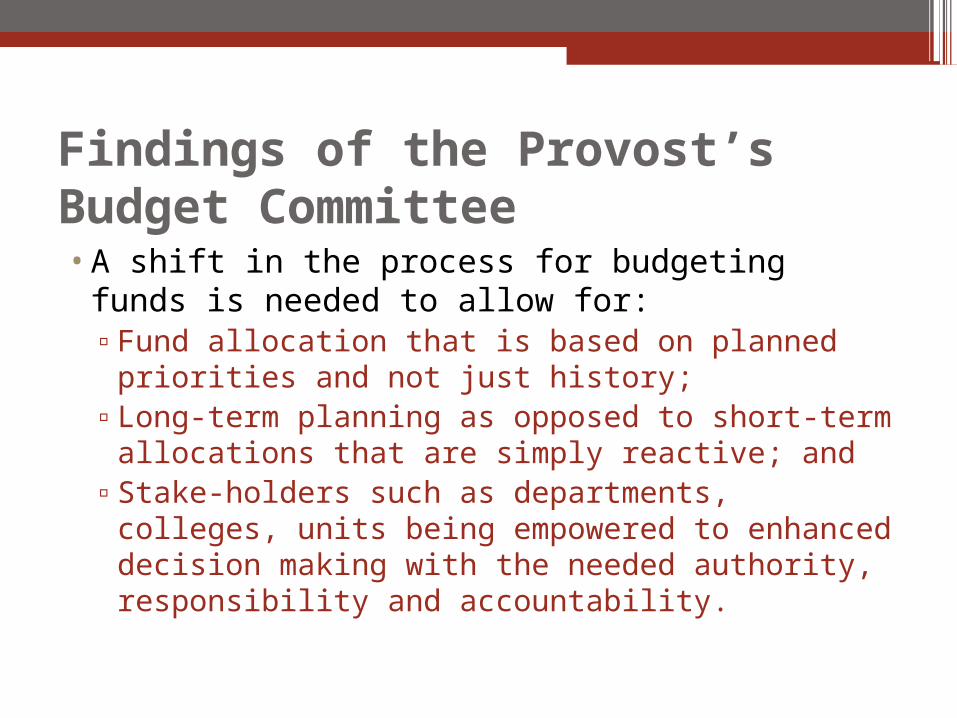
Findings of the Provost’s Budget Committee•A shift in the process for budgeting funds is
needed to allow for:▫Fund allocation that is based on planned
priorities and not just history; ▫Long-term planning as opposed to short-term
allocations that are simply reactive; and ▫Stake-holders such as departments, colleges,
units being empowered to enhanced decision making with the needed authority, responsibility and accountability.
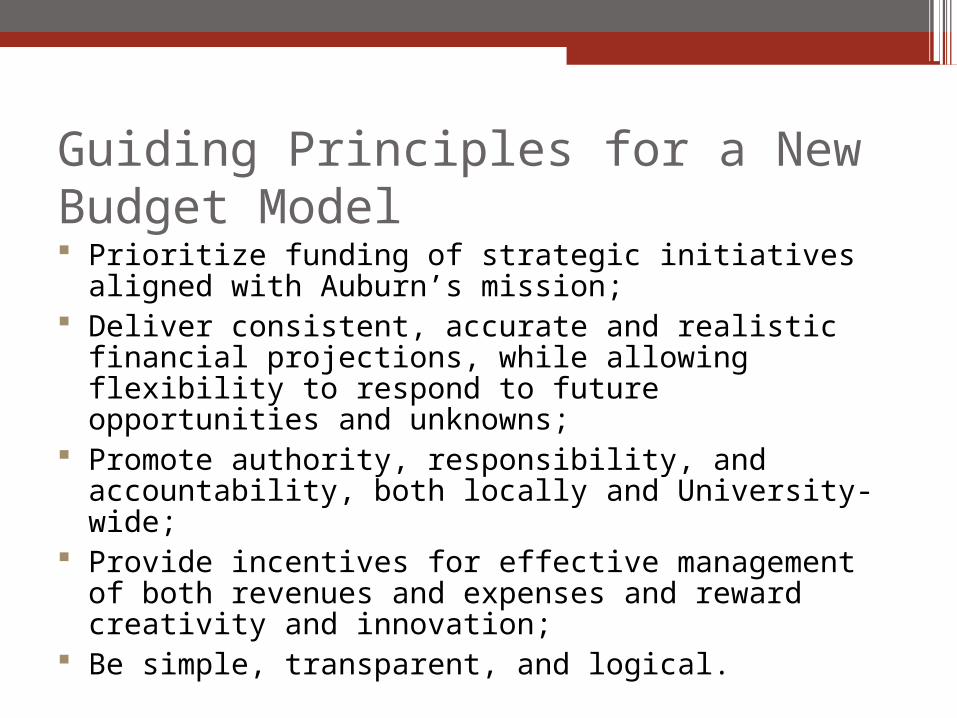
Guiding Principles for a New Budget Model Prioritize funding of strategic initiatives aligned
with Auburn’s mission; Deliver consistent, accurate and realistic
financial projections, while allowing flexibility to respond to future opportunities and unknowns;
Promote authority, responsibility, and accountability, both locally and University-wide;
Provide incentives for effective management of both revenues and expenses and reward creativity and innovation;
Be simple, transparent, and logical.

Responsibility Center Management (RCM) –Auburn version•Colleges/Schools are centers, Deans are
managers•All Funds Model – Includes restricted and
unrestricted revenues•Revenues will be classified as Direct
Revenues or Allocated Revenues
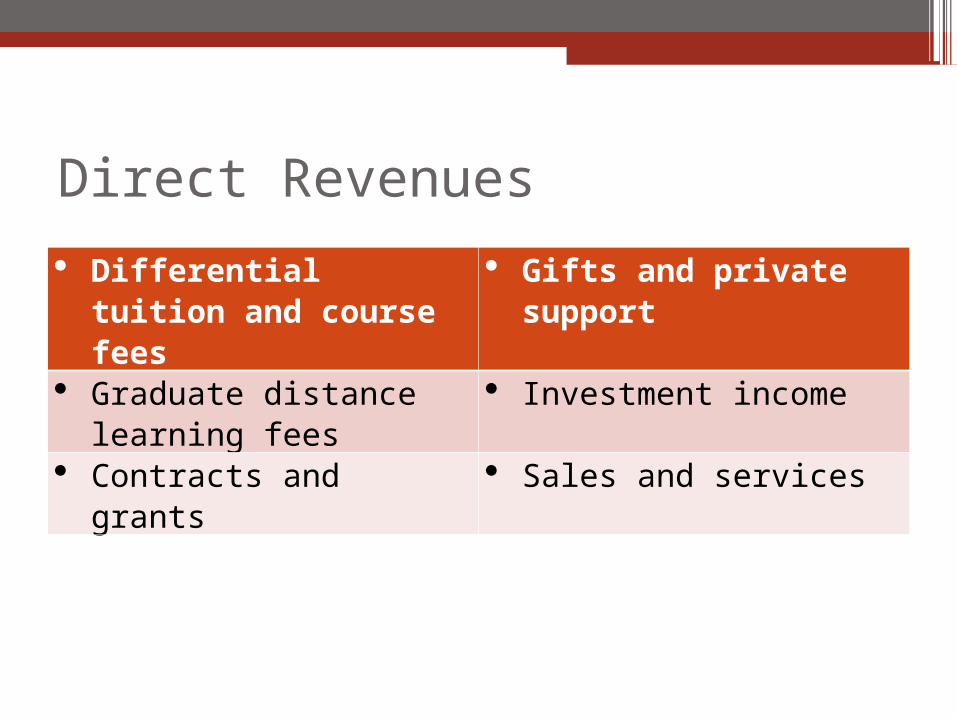
Direct Revenues
Differential tuition and course fees
Gifts and private support
Graduate distance learning fees
Investment income
Contracts and grants Sales and services
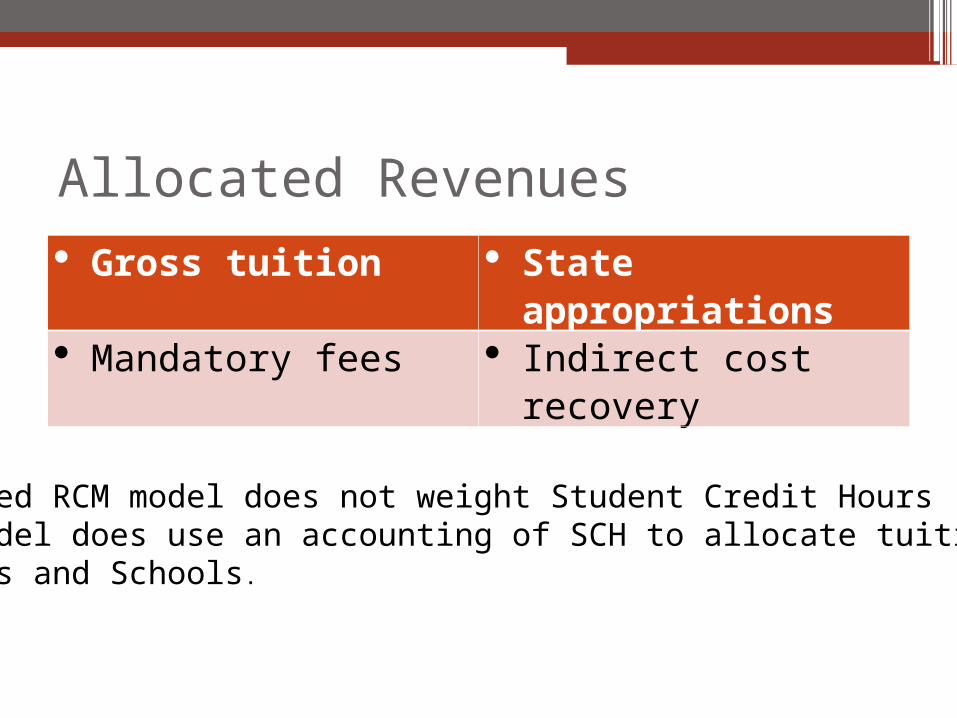
Allocated Revenues Gross tuition State
appropriations Mandatory fees Indirect cost
recovery
The proposed RCM model does not weight Student Credit Hours (SCH),but the model does use an accounting of SCH to allocate tuition revenuesto Colleges and Schools.
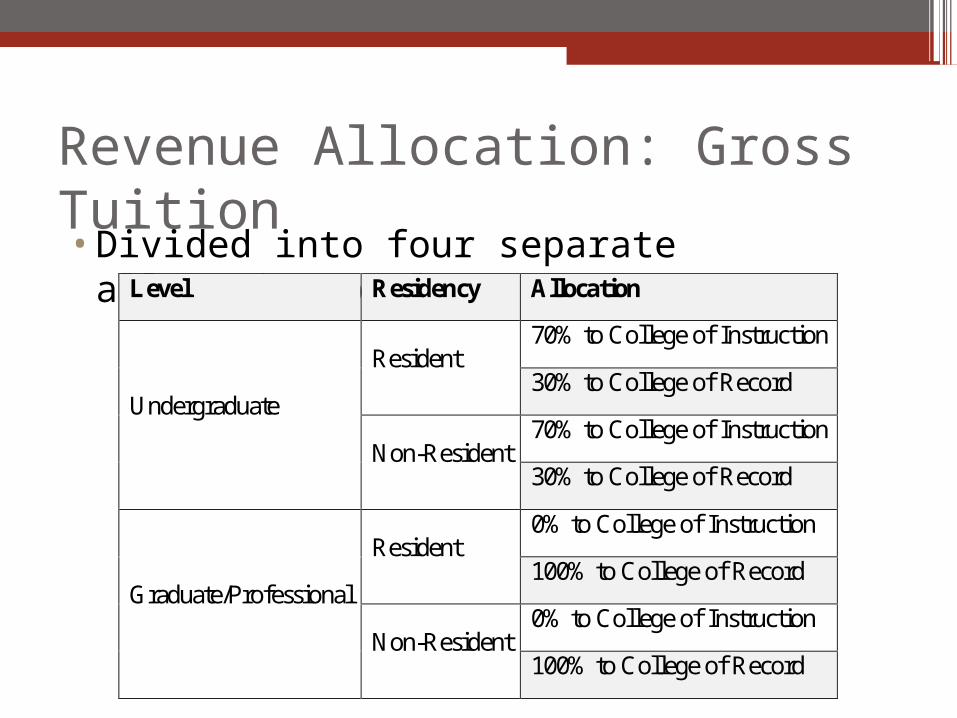
Revenue Allocation: Gross Tuition•Divided into four separate allocation pools Level Residency Allocation
Undergraduate
Resident 70% to College of Instruction
30% to College of Record
Non-Resident 70% to College of Instruction
30% to College of Record
Graduate/Professional
Resident 0% to College of Instruction
100% to College of Record
Non-Resident 0% to College of Instruction
100% to College of Record

Revenue Allocation: Student Aid and Waivers•Total gross tuition is offset by the amount
the university decides to spend on student aid and waivers.Expense Consideration Cost Assignment
Student Aid Decision to award is made centrally by Administration
Share assigned to college/school is based on its share of gross undergraduate tuition.
Undergraduate Waivers
Graduate Waivers Decision to award is made by college or school awarding
Share assigned is based on actual waivers awarded by a college/school

Revenue Allocation•Division 1 State Appropriation
▫70% to resident instruction and academic support
▫30% to sponsored programs supportBased on college’s share of gross resident tuition & college’s share of total sponsored program direct revenues
• Indirect Cost Recovery▫100% of sponsored program’s indirect costs
recovered back to recovering unit

Direct & Allocated Expenses
•Direct expenses include the following examples:▫Salaries, wages, and benefits▫Equipment and supplies▫Repairs and maintenance▫Travel▫Other expenses

Allocated Expenses• Model will pool the indirect costs of
administration and support services (6 separate pools) and allocate them to the collegesCentral Support Pool Allocation Base
Academic and student services
Examples: Libraries, Student Affairs
Credit hours taught
Administration
Ex: President’s Office, EVPs Office
Total direct expenses
Alumni affairs and development
Student headcount
Facilities
Ex: Maintenance, depreciation
Adjusted square footage
Sponsored program support
Ex: VP for Res.& Econ. Devel, C&G Acctg.
Research expenditures
University-wide support
Ex:OIT, HR, Public Safety
Total FTEs, Divisions 1, 3, & 4
(employees + student workers)
Mission Enhancement Fund
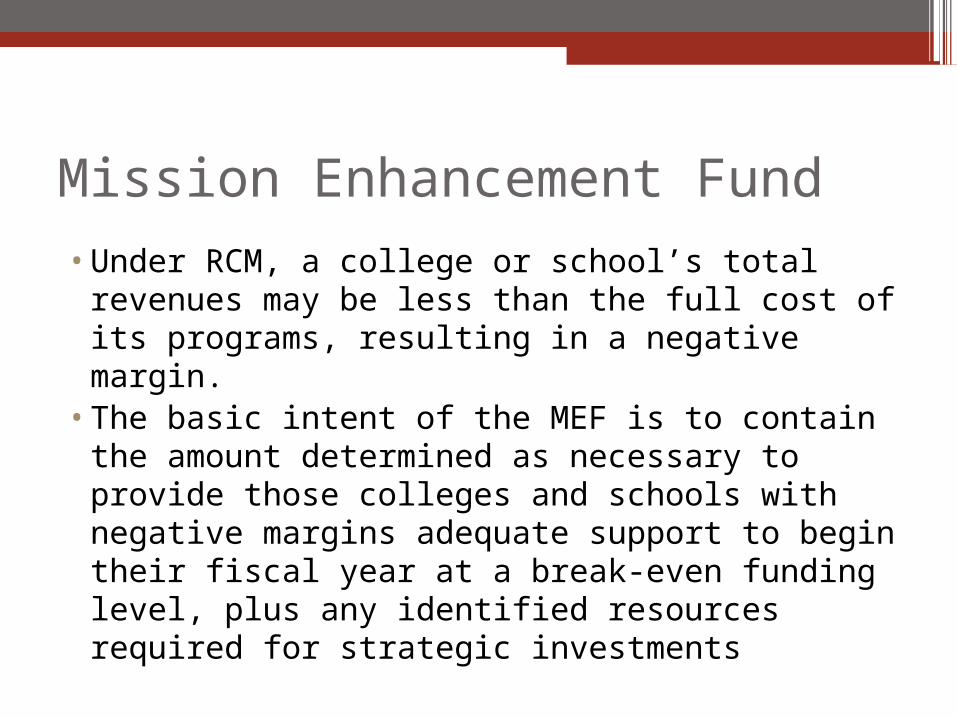
•Under RCM, a college or school’s total revenues may be less than the full cost of its programs, resulting in a negative margin.
•The basic intent of the MEF is to contain the amount determined as necessary to provide those colleges and schools with negative margins adequate support to begin their fiscal year at a break-even funding level, plus any identified resources required for strategic investments

MEF (continued)
•The MEF is generated through application of a participation rate to eligible budgeted revenues of all Schools & CollegesIncluded Revenues Excluded Revenues
Gross tuition and fees Sponsored program revenues
(less) Student aid and waivers Indirect cost recovery
Appropriations Gifts, private support, and investment income
Sales and services
Other revenues

Ad Hoc Senate Committee’s Evaluation of the Currently Proposed RCM Budget Model1) There is concern that the model could produce swings in the
annual resources available for a college or school’s operational expenditures that would make it difficult for them to plan.
2) There is concern about the magnitude of the shortfalls associated with higher cost programs under the approach to tuition (and other allocated revenues) allocation being recommended. Under the currently proposed allocation method, it is unlikely that many colleges will reach the breakeven level without MEF funding.
3) How will the historical distributions of funds by deans within the colleges compare to the proposed RCM model distributions? Will there be comparable incentives in place for departments and will they be rewarded for increased efficiency?
4) More detail is needed about procedures for monitoring the effectiveness of any new modeling framework that is ultimately adopted. Fixed cost charges and bases for those charges will require regular oversight.
Tuition/Fees Allocation and Basic Modeling Suggestions
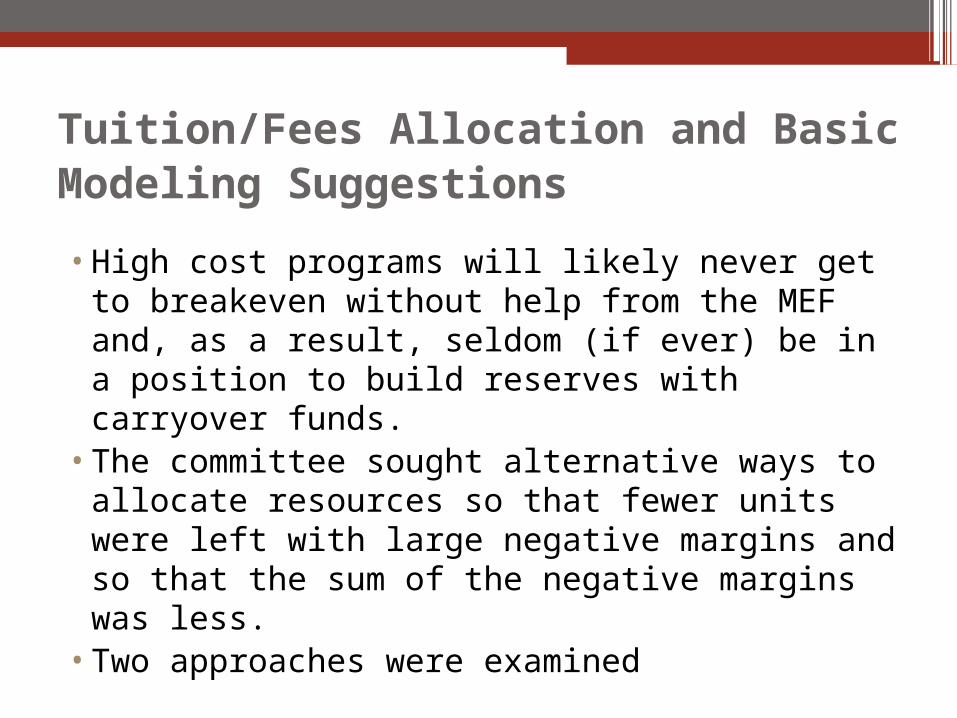
•High cost programs will likely never get to breakeven without help from the MEF and, as a result, seldom (if ever) be in a position to build reserves with carryover funds.
•The committee sought alternative ways to allocate resources so that fewer units were left with large negative margins and so that the sum of the negative margins was less.
•Two approaches were examined

Method 1: Weighted Student Credit Hours•Acknowledges that there are differences in
the cost of instruction per student credit hour across the 65 departments on campus.
•Other universities implementing RCM have chosen some approach to weighting
•According to the National Study of Instructional Costs and Productivity (Delaware Cost Study), national norm costs per student credit hour (by department) range from $158 to $618 per SCH in those disciplines in which Auburn University has instructional programs.
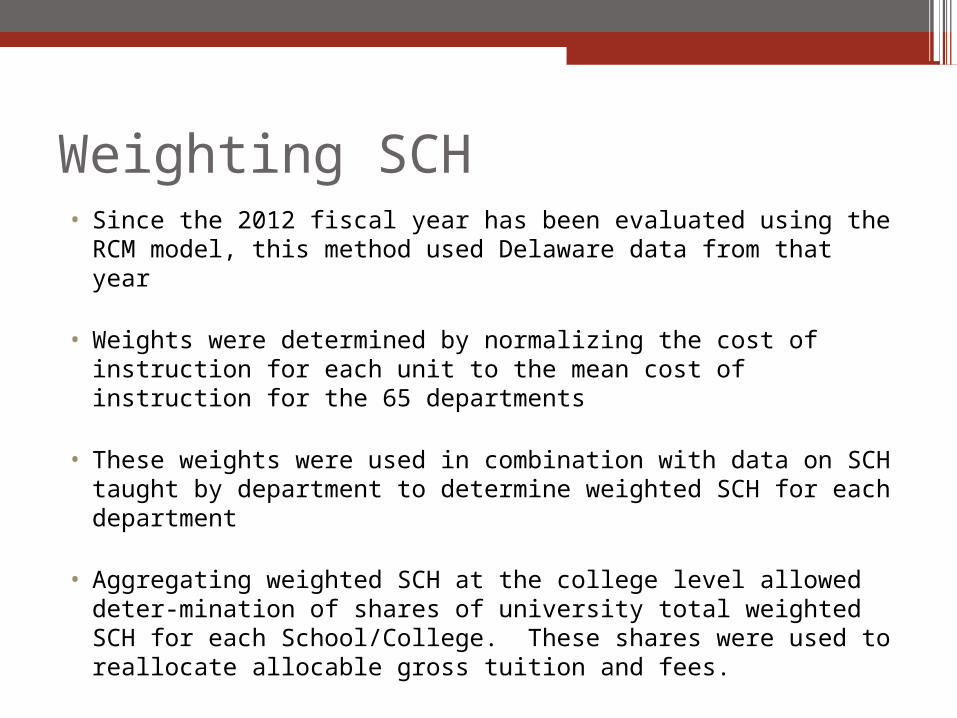
Weighting SCH• Since the 2012 fiscal year has been evaluated using the
RCM model, this method used Delaware data from that year
• Weights were determined by normalizing the cost of instruction for each unit to the mean cost of instruction for the 65 departments
• These weights were used in combination with data on SCH taught by department to determine weighted SCH for each department
• Aggregating weighted SCH at the college level allowed deter-mination of shares of university total weighted SCH for each School/College. These shares were used to reallocate allocable gross tuition and fees.

2 slightly different assumptions• First, no distinction was made between in-state and
out-of-state students. The supporting rationale for this modification was that it costs the same to teach a student from Alabama, Georgia, Florida, etc., and that it is an inefficient use of department/College funds to recruit for students in multiple states. The University’s brand is primarily responsible for attracting out-of-state students.
• The second change in assumptions is that all gross tuition & fees goes to the college or school of instruction. This assumption simply acknowledges the fact that there are no good data (or similar national norms data) on the separable costs of maintaining/advising students in a department/college.

College of Agriculture
College of Architecture,
Design & Construction
Raymond J. Harbert
College of Business
College of Education
Samuel Ginn College of
Engineering
School of Forestry and
Wildlife Sciences
College of Human
Sciences
College of Liberal Arts
School of Nursing
Harrison School of Pharmacy
College of Sciences &
Mathematics
College of Veterinary Medicine
Academic Unit
Total
(Divisions 1, 3,
4)
11,902,428$ 20,094,898$ 53,221,722$ 30,491,257$ 41,979,080$ 2,962,490$ 15,607,498$ 90,869,795$ 6,029,531$ 14,672,826$ 63,048,070$ 15,979,085$ 366,858,679$
College of Agriculture
College of Architecture,
Design & Construction
Raymond J. Harbert
College of Business
College of Education
Samuel Ginn College of
Engineering
School of Forestry and
Wildlife Sciences
College of Human
Sciences
College of Liberal Arts
School of Nursing
Harrison School of Pharmacy
College of Sciences &
Mathematics
College of Veterinary Medicine
Academic Unit
Total
(Divisions 1, 3,
4)
13,151,305$ 21,296,380$ 43,882,032$ 31,181,610$ 49,280,456$ 2,726,293$ 11,940,368$ 76,714,338$ 5,884,027$ 23,605,296$ 61,006,583$ 26,189,990$ 366,858,679$
Distribution of the tuition and fees according to the two methods is indicated below:
Original Allocation
Weighted Allocation
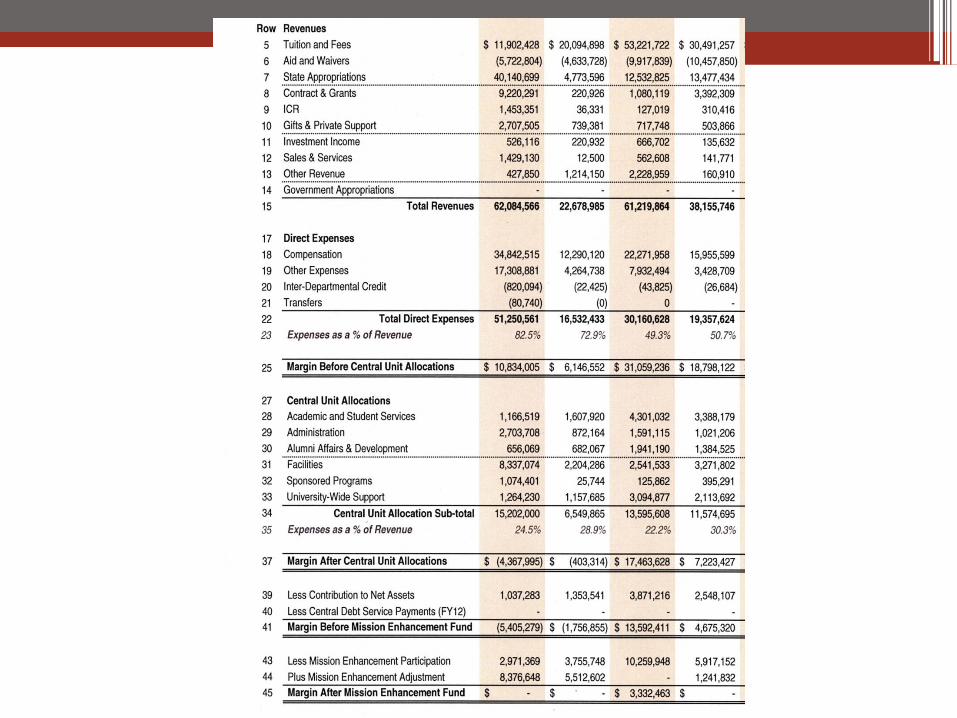

Using this redistribution of tuition resources (and leaving other cost and revenueamounts as they were calculated for the un-weighted case), the sum of the negativemargins presented in the budget models as ‘Margin Before Mission Enhancement Fund’is reduced from -$33,188,286 to -$13,461,841 (nearly 60%)

Similarly, the FY2013 sum of negative margins before MEF was reducedfrom -$24,861,070 to -$9,369,154

2nd Modeling Approach
•Even more objective, avoids value judgements associated with weighted SCH
•Uses Partial Least Squares (PLS) regression to estimate weights
•Weights applied (as above) to allocable gross tuition and fees
• (Tuition&Fees + Margin Before MEF) / Tuition&Fees = weighting factor

Given the same FY2012 data referenced above, True Weighted Tuition could be estimated and ‘True Weights’ determined:
Note: Margin Before MEF is a measure reported by the model that indicates how close (positive or negative) a unit is to meeting its budget (revenues minus costs) before the MEF participation rate is applied as an additional cost.

The PLS method is used to estimate these ‘True’ tuition weights
•22 variables were examined (# of students, # of faculty, sq.ft. of classroom, etc.)
•6 variables were selected

College Tuition Weight Predicted Tuition Weight
The PLS Model combines these variables with different weightsinto new variables (termed components) and predicts tuitionweight with these components.

These weights were then used to reallocate Tuition & Fees for FY2012(as was done with the weighted SCH example):
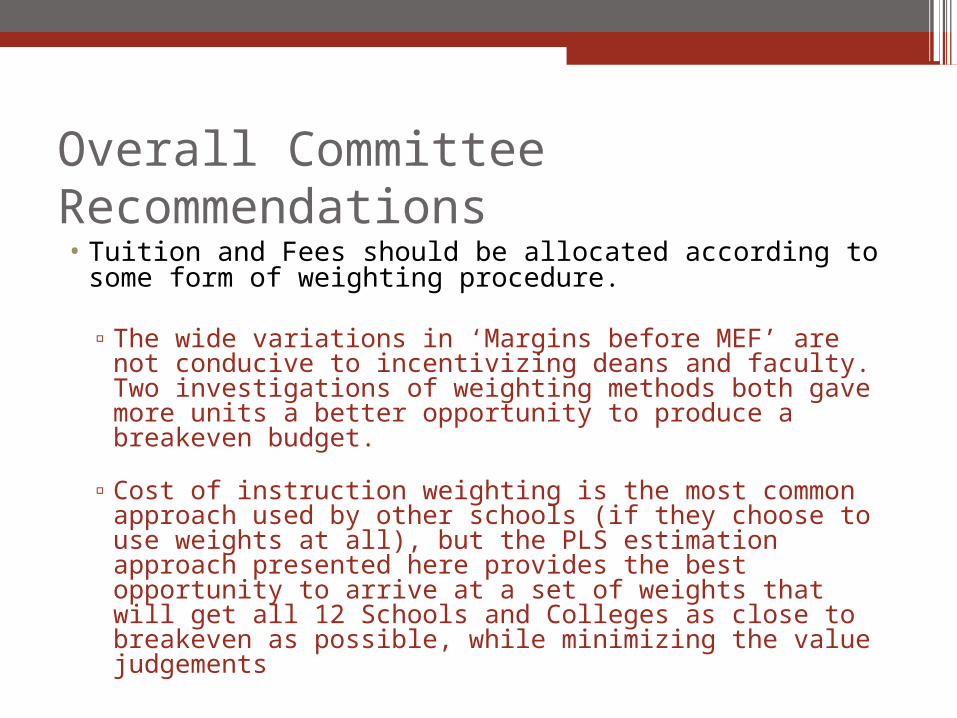
Overall Committee Recommendations• Tuition and Fees should be allocated according to
some form of weighting procedure.
▫The wide variations in ‘Margins before MEF’ are not conducive to incentivizing deans and faculty. Two investigations of weighting methods both gave more units a better opportunity to produce a breakeven budget.
▫Cost of instruction weighting is the most common approach used by other schools (if they choose to use weights at all), but the PLS estimation approach presented here provides the best opportunity to arrive at a set of weights that will get all 12 Schools and Colleges as close to breakeven as possible, while minimizing the value judgements
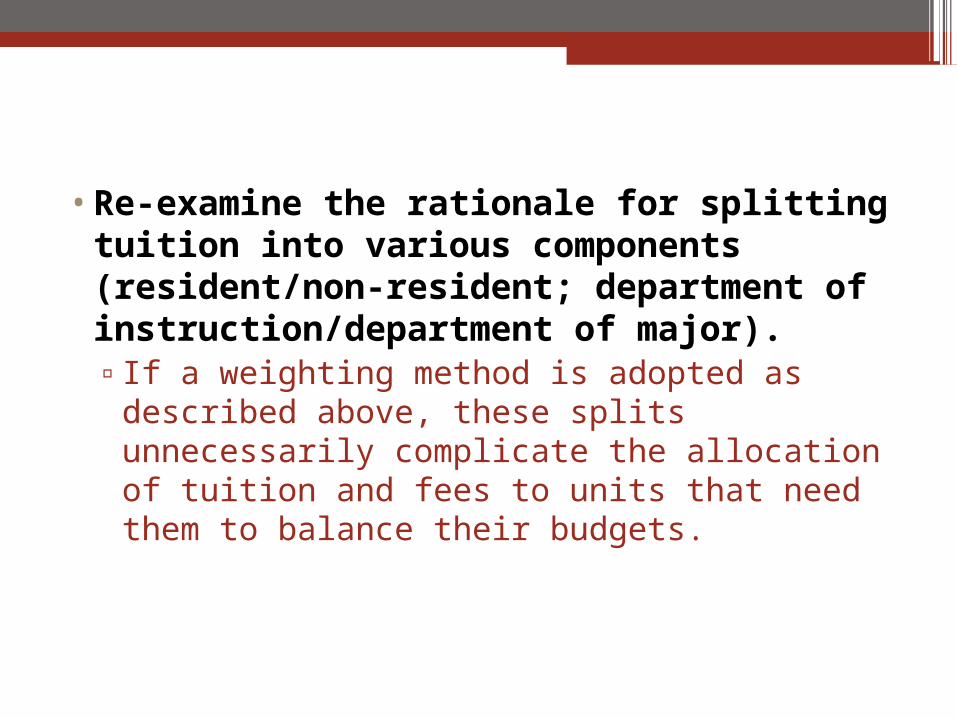
•Re-examine the rationale for splitting tuition into various components (resident/non-resident; department of instruction/department of major). ▫If a weighting method is adopted as
described above, these splits unnecessarily complicate the allocation of tuition and fees to units that need them to balance their budgets.

•Year-to-year reductions in funding should be capped at 3% of total revenues.
▫Many of the academic units will face a negative margin as they are forecasting their revenues and costs (in the 2012 example, 2 units faced a shortfall of over $10,000,000). If the MEF contribution to the unit makes it solvent there is no problem.
▫But if in budget negotiations, a Provost suggests awarding less than that amount, that reduction should not exceed 3% of the unit’s total budgeted revenues for the year.
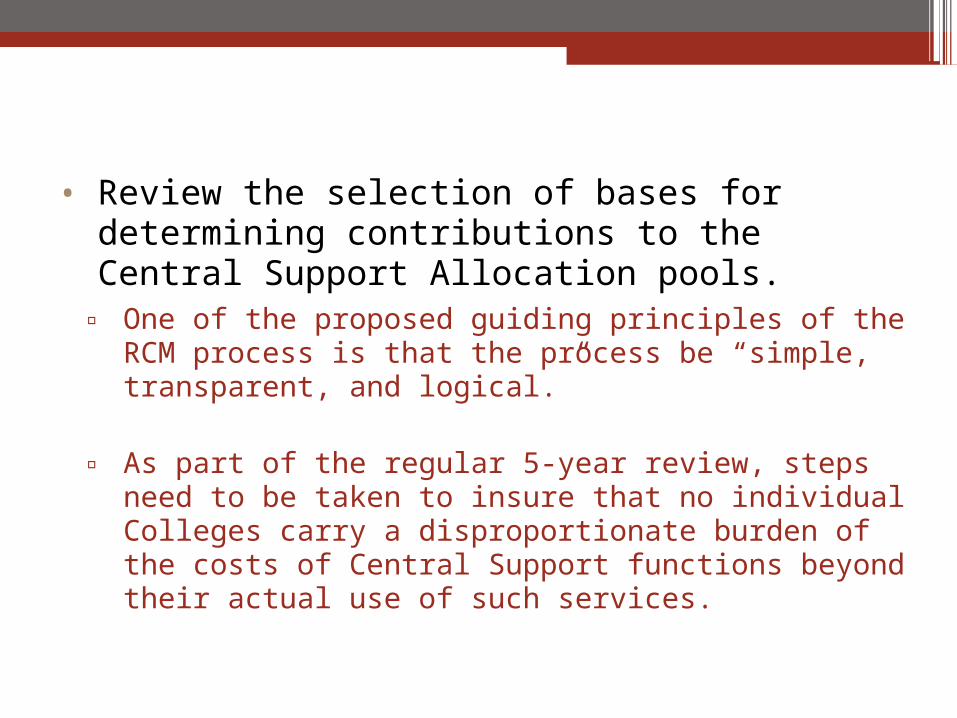
• Review the selection of bases for determining contributions to the Central Support Allocation pools.
▫ One of the proposed guiding principles of the RCM process is that the process be “simple, transparent, and logical.”
▫ As part of the regular 5-year review, steps need to be taken to insure that no individual Colleges carry a disproportionate burden of the costs of Central Support functions beyond their actual use of such services.
• Institute a policy that encourages Colleges/Schools to prepare guidelines providing for the participation of departments (and their faculty) in the budget process.
▫ The committee suggests that some sort of budget monitoring processes be incorporated at the department levels that dovetail with procedures at the College/School level to insure faculty buy-in of the new procedures.
▫ Faculty need to be confident they are being treated equitably with respect to other faculty in other departments within a college.