
Final Report to DG Research and Innovation 8 May...
159
Assessment of progress in achieving ERA in Member States and Associated Countries Final Report to DG Research and Innovation 8 May 2015
Transcript of Final Report to DG Research and Innovation 8 May...

Assessment of progress in achieving ERA in Member States and Associated Countries Final Report to DG Research and Innovation
8 May 2015

This page is intentionally blank
Assessment of progress in achieving ERA - Final Report
Assessment of progress in achieving ERA in Member States and Associated Countries Final Report to DG Research and Innovation
A report submitted by ICF International in association with
Technopolis
Date: 8 May 2015
Job Number 30260436
Elta Smith
ICF Consulting Services Limited Watling House 33 Cannon Street London EC4M 5SB
T +44 (0)20 3096 4800 F +44 (0)20 3368 6960
www.icfi.com

Assessment of progress in achieving ERA - Final Report
2 April 2015 i
Document Control
Document Title Assessment of progress in achieving ERA in Member States and Associated
Countries
Job No. 30260436
Prepared by ICF: Elta Smith, Jan Franke, Andrew Jarvis, Prateek Sureka, Stefania Chirico
Technopolis: Viola Peter, Paul Simmonds, Peter Kolarz
Checked by Elta Smith and Andrew Jarvis
Date 8 May 2015
This report is the copyright of DG RTD and has been prepared by ICF Consulting Services Ltd under
contract to DG RTD. The contents of this report may not be reproduced in whole or in part, nor passed
to any other organisation or person without the specific prior written permission of DG RTD.
ICF has used reasonable skill and care in checking the accuracy and completeness of information
supplied by the client or third parties in the course of this project under which the report was produced.
ICF is however unable to warrant either the accuracy or completeness of such information supplied by
the client or third parties, nor that it is fit for any purpose. ICF does not accept responsibility for any
legal, commercial or other consequences that may arise directly or indirectly as a result of the use by
ICF of inaccurate or incomplete information supplied by the client or third parties in the course of this
project or its inclusion in this project or its inclusion in this report.
Disclaimer:
The views expressed in this report, as well as the information included in it, do not necessarily reflect
the opinion or position of the European Commission and in no way commit the institution.

Assessment of progress in achieving ERA - Final Report
2 April 2015
Contents
Executive summary ............................................................................................................ i ES1.1 Introduction ................................................................................................................................i ES1.2 The European Research Area ...................................................................................................i ES1.3 Study scope and context ........................................................................................................... ii ES1.4 Indicators and suitable metrics to measure progress ............................................................... ii ES1.5 Roadmaps and peer review approaches to measure progress ............................................... iv ES1.6 A future evaluation and monitoring system ...............................................................................v
1 Introduction 1 1.1 Study scope and objectives ..................................................................................................... 1 1.2 Report structure ....................................................................................................................... 2
2 An ERA framework 3 2.1 ERA background and objectives .............................................................................................. 3 2.2 The European Research Area and the Innovation Union Flagship Initiative ........................... 4 2.3 Rationale and intervention logic of ERA priority areas ............................................................ 5
3 Indicator identification and appraisal 10 3.1 Approach of the appraisal ...................................................................................................... 10 3.2 Priority 1 - indicator assessment ............................................................................................ 12 3.3 Priority 2 - indicator assessment ............................................................................................ 15 3.4 Priority 3 - indicator assessment ............................................................................................ 18 3.5 Priority 4 - indicator assessment ............................................................................................ 20 3.6 Priority 5 - indicator assessment ............................................................................................ 21 3.7 International Dimension Outside ERA (Priority 6) - indicator assessment ............................ 24 3.8 Indicator selection - summary ................................................................................................ 25
4 The role of national roadmaps in achieving the ERA 29 4.1 Political context at European level and steps towards a European roadmap........................ 29 4.2 State of play in Member States .............................................................................................. 30 4.3 Potential role of national roadmaps in the ERA monitoring framework ................................. 31
5 Role of peer reviews in ERA 32 5.1 An introduction to peer review ............................................................................................... 32 5.2 Previous peer reviews in the context of the ERA ................................................................... 33 5.3 Use of peer review in other policy areas ................................................................................ 36
6 Conclusions and recommendations 41 6.1 Indicators and suitable metrics to measure progress ............................................................ 42 6.2 Desirable attributes of a future evaluation and monitoring system ........................................ 42 6.3 Towards an integrated approach to measuring ERA progress .............................................. 43 6.4 An illustrative rating system for progress reporting ................................................................ 45
Annex 1 Study tasks and work completed against objectives ................................. 47
Annex 2 Methodology to assess ERA progress ....................................................... 48
Annex 3 Outcome of scope test ............................................................................ 54
Annex 4 Comparable indicators - 2013 and 2014 ................................................... 63
Annex 5 Indicator data availability 2013 and 2014 ................................................ 64
Annex 6 Summary of evaluation progress, steps 1-3.............................................. 67
Annex 7 ERA intervention logics ........................................................................... 71

Assessment of progress in achieving ERA - Final Report
2 April 2015
Annex 8 Indicator maps and indicator appraisal tables .......................................... 77
Annex 9 The German ERA roadmap and a template for national roadmaps .......... 124
Annex 10 Overview of ERA peer reviews performed by CREST/ERAC ...................... 128
Annex 11 Case studies – Peer review and mutual learning mechanisms ................. 129
Annex 12 References ............................................................................................. 143
Table of tables
Table ES1.1 Selected input, output and outcome/impact indicators by priority area ............................... ii
Table ES1.2 Traffic light rating system for ERA progress ........................................................................v
Table 3.1 Priority 1 – proposed indicators ........................................................................................ 14
Table 3.2 Priority 2 – proposed indicators ........................................................................................ 16
Table 3.3 Priority 2 – proposed indicators along sub-categories ...................................................... 17
Table 3.4 Priority 3 – proposed indicators ........................................................................................ 19
Table 3.5 Priority 4 – proposed indicators ........................................................................................ 21
Table 3.6 Priority 5 – proposed indicators ........................................................................................ 22
Table 3.7 Priority 5 – proposed indicators along sub-categories ...................................................... 23
Table 3.8 International dimension outside the ERA (Priority 6) – proposed indicators .................... 25
Table 3.9 Selected input, output and outcome/impact indicators by priority area ............................ 26
Table 3.10 Indicator selection – one indicator per priority area .......................................................... 27
Table 6.1 Traffic light rating system for ERA progress ..................................................................... 45
Table A1.1 Study tasks and work completed against study objectives ............................................... 47
Table A3.1 Priority 1 comparison of progress indicators and data sources ........................................ 54
Table A3.2 Priority 2 comparison of progress indicators and data sources ........................................ 54
Table A3.3 Priority 3 comparison of progress indicators and data sources ........................................ 56
Table A3.4 Priority 4 comparison of progress indicators and data sources ........................................ 58
Table A3.5 Priority 5 comparison of progress indicators and data sources ........................................ 59
Table A3.6 International dimension outside ERA - comparison of progress indicators and data
sources .............................................................................................................................. 62
Table A4.1 Indicators that remain unchanged between 2013 and 2014 ............................................. 63
Table A5.1 Priority 1 - Data availability for indicators that changed between 2013 and 2014 ............ 64
Table A5.2 Priority 2 - Data availability for indicators that changed between 2013 and 2014 ............ 64
Table A5.3 Priority 3 - Data availability for indicators that changed between 2013 and 2014 ............ 65
Table A5.4 Priority 4 - Data availability for indicators that changed between 2013 and 2014 ............ 66
Table A5.5 Priority 5 - Data availability for indicators that changed between 2013 and 2014 ............ 66
Table A6.1 Priority 1 - Evaluation status ............................................................................................. 67
Table A6.2 Priority 2 - Evaluation status ............................................................................................. 68
Table A6.3 Priority 3 - Evaluation status ............................................................................................. 68
Table A6.4 Priority 4 - Evaluation status ............................................................................................. 69
Table A6.5 Priority 5 - Evaluation status ............................................................................................. 70
Table A6.6 International Dimension outside ERA - Evaluation status ................................................ 70
Table A8.1 Indicator maps - key .......................................................................................................... 77
Table A8.2 Indicator scoring system ................................................................................................... 77

Assessment of progress in achieving ERA - Final Report
2 April 2015
Table A8.3 Indicators Appraisal - Priority Area 1 ................................................................................ 79
Table A8.4 Priority 1 - appraisal of indicators suggested by DG RTD ................................................ 84
Table A8.5 Indicators Appraisal - Priority Area 2 ................................................................................ 86
Table A8.6 Priority 2 - appraisal of indicators suggested by DG RTD ................................................ 93
Table A8.7 Indicators Appraisal - Priority Area 3 ................................................................................ 96
Table A8.8 Priority 3 - appraisal of indicators suggested by DG RTD .............................................. 100
Table A8.9 Indicators Appraisal - Priority Area 4 .............................................................................. 102
Table A8.10 Priority 4 - appraisal of indicators suggested by DG RTD .............................................. 111
Table A8.11 Indicators Appraisal - Priority Area 5 .............................................................................. 113
Table A8.12 Priority 5 - appraisal of indicators suggested by DG RTD .............................................. 118
Table A8.13 Indicators Appraisal – International dimension ............................................................... 120
Table A8.14 International dimension outside the ERA - appraisal of indicators suggested by DG RTD
........................................................................................................................................ 123
Table A9.1 Overview of German guidelines and roadmap on ERA .................................................. 124
Table A10.1 Overview of ERA peer reviews conducted by the European Union Scientific and
Technical Research Committee (CREST) and ERAC .................................................... 128
Table of figures
Figure 5.1 Country-to-country peer review process in ERAC using the Innovation Union Self-
Assessment Tool............................................................................................................... 35
Figure A2.1 Flow Diagram for ERA Evaluation .................................................................................... 49
Figure A2.2 Summary of the indicator appraisal following the application of steps 1-3 ....................... 51
Figure A2.3 Example of a scorecard .................................................................................................... 52
Figure A7.1 Intervention Logic – ERA Priority 1 – More effective national research systems ............. 71
Figure A7.2 Intervention Logic – ERA priority 2 – Optimal transnational cooperation and competition
.......................................................................................................................................... 72
Figure A7.3 Intervention Logic – ERA priority 3 – Open Labour Market for researchers ..................... 73
Figure A7.4 Intervention logic - ERA priority 4 – Gender equality and gender mainstreaming in
research ............................................................................................................................ 74
Figure A7.5 Intervention logic - ERA priority 5 – Optimal access to and circulation and transfer of
scientific knowledge .......................................................................................................... 75
Figure A7.6 Intervention logic - ERA priority International dimension outside ERA ............................. 76
Figure A8.1 Priority 1 – potential input, output and outcome/impact indicators ................................... 78
Figure A8.2 Priority 2 – potential input, output and outcome/impact indicators ................................... 85
Figure A8.3 Priority 3 – potential input, output and outcome/impact indicators ................................... 95
Figure A8.4 Priority 4 – potential input, output and outcome/impact indicators ................................. 101
Figure A8.5 Priority 5 – potential input, output and outcome/impact indicators ................................. 112
Figure A8.6 International dimension outside ERA (Priority 6) – potential input, output and
outcome/impact indicators .............................................................................................. 119
Figure A9.1 Draft template for national roadmaps on ERA ................................................................ 125

Assessment of progress in achieving ERA - Final Report
2 April 2015 i
Executive summary
ES1.1 Introduction
This is the final report for a study to assess progress in achieving the European Research Area (ERA)
in Member States and Associated Countries. The call for tender was issued by the Directorate-
General for Research and Innovation (DG RTD) under a framework contract for the evaluation of
research and innovation programmes and policies between ICF Consulting Services, Ltd and DG
RTD.
ES1.2 The European Research Area
The ERA is defined as a unified research area which enables the free circulation of researchers,
scientific knowledge and technology. It should enable Members States and the European Union (EU)
overall to strengthen its scientific and technological bases, competitiveness and capacity to address
grand challenges. There are five ERA priorities plus a crosscutting focus on international cooperation
which at ERAC/Member State level is often considered to be the sixth ERA priority. The priorities are:
1. More effective national research systems to increase competition and excellence within
national borders and ensure the most efficient and effective funding allocation. ERA priority 1 sets
out two main fields of action to tackle structural differences between Member States’ research and
innovation systems and improve value for money, quality and quantity of research outputs. First,
Member States, together with relevant national actors, are expected to mainstream competitive
project-based funding based on international peer review standards. Second, Member States are
expected to design or amend legal measures which govern institutional research funding to
introduce institutional funding based on performance and quality of research.
2. Optimal transnational co-operation and competition to establish a common research agenda,
improve interoperability of national programmes, and build effective pan-European research
infrastructures. One aspect of ERA priority 2 is improvement of the framework conditions for joint
programming and transnational cooperation both on funding programmes for research as well as
major research infrastructures.
3. An open labour market for researchers to increase researcher mobility, training and attractive
career development. This priority area seeks to improve framework conditions for researcher
mobility across Europe, across different stages of their career and between the academic and
private sector. This includes actions to improve the attractiveness of research careers, structured
doctoral training programmes and standards in recruitment of academic staff.
4. Gender equality and gender mainstreaming in research to make better use of diverse scientific
human resources as a way to foster quality and relevance of research. Firstly, this priority includes
actions to promote gender equality in research and emphasise cultural and institutional changes to
remove legal and other barriers to recruitment, retention and career progression of female
researchers. It also includes actions to ensure a gender-balanced approach to decision making
processes with regards to allocation of funding and recruitment. Secondly, it integrates the gender
dimension in research content, programmes and projects.
5. Optimal access to and circulation and transfer of scientific knowledge, including via digital
ERA to improve access to and uptake of knowledge transfer and facilitate open innovation. This
includes improving open access to publications and access to data resulting from publicly funded
research and strengthening the connections between science and industry and the role of public-
sector research in open innovation.
The crosscutting focus on international cooperation encourages Member States to foster openness
for international cooperation to maximise EU research potential. Most Member States already have
national strategies for international cooperation on research and innovation (EC, 2014). But national
level initiatives could be strengthened through greater coordination between Member States.

Assessment of progress in achieving ERA - Final Report
2 April 2015 ii
The Commission has identified actions for each priority area which are expected to be implemented
through initiatives and measures undertaken by the Commission, Member States and research
stakeholder organisations, acting in partnership.
ES1.3 Study scope and context
Progress reports and other research have found that progress in achieving ERA in the Member States
and Associated Countries has been limited but there have been improvements across most ERA
priority areas (Dinges et al., 2013; ERA Progress Report, 2014). These changes have not been
uniform across the EU-28, however, with greater progress achieved in Nordic and Western European
countries compared to Central and Eastern European countries. As a consequence, the knowledge
gap has widened. The present study was expected to examine whether the measures in place in
Member States and Associated Countries had advanced since 2012 and were better aligned with the
ERA priorities.
The terms of reference set the following objectives: update the state-of-play of ERA; develop and
estimate policy progress indicators; and evaluate ERA progress in the Member States and Associated
Countries. The evaluation was intended to inform the preparation of the second ERA Progress Report
to be published in September 2014, but delays in the procurement procedure meant that the present
study could not be completed in time to fulfil this original objective. Ongoing work by DG RTD and the
Member States and Associated Countries provided some of the information asked for in the original
study terms of reference. As a result, the study team supported DG RTD in the preparation of its 2014
progress report and undertook to complete the evaluation of progress.
Following preliminary work on the evaluation, it became clear that the evaluation as originally
programmed could not be performed and an alternative strategy was agreed with DG RTD to develop
an approach for future ERA progress monitoring and evaluation. The objective of the work was to
develop a set of proposals for further development of the ERA progress monitoring framework to be
considered by DG RTD.
ES1.4 Indicators and suitable metrics to measure progress
For each priority area, the study team conducted an appraisal of available or potential indicators. The
output of this exercise was an inventory of indicators, organised by ERA priority, with an appraisal of
their suitability for monitoring and evaluation, and a final suite of indicators proposed as a core set to
measure progress across ERA priorities. The final indicator suite is summarised in Table ES1.1.
Table ES1.1 Selected input, output and outcome/impact indicators by priority area1
Priority Input Indicator Output Indicator Outcome/ Impact Indicator
Priority 1: more
effective national
research systems
Total GBAORD2 as per cent
GDP (OECD)
Share of national
GBOARD allocated
through project-based
funding (as opposed to
institutional funding)
(ERA Survey)
Number of patents per total
public research and
development (R&D)
expenditure (Eurostat)
2a ESFRI Per cent of MS participating
in the development of at least
one of the RIs identified by
ESFRI
Per cent of research
performers experiencing
problems accessing RIs
Number of implementation
phase ESFRI projects in
which each MS is a partner
2b Transnational
cooperation
Degree to which MS engage
in transnational cooperation
via an EU framework
programme
Share of public funding
allocated to transnational
R&D cooperation
Cross-border ownership of
patents
1 Data sources are indicated in brackets.
2 Government budget appropriations or outlays for research and development

Assessment of progress in achieving ERA - Final Report
2 April 2015 iii
Priority Input Indicator Output Indicator Outcome/ Impact Indicator
Priority 3: Open
labour market for
researchers
Per cent of research funding
available for mobility
scholarships and stipends of
the total funding for research
(MORE2, JRC)
Share of research
organisations with EC
Human Resources
Excellence in Research
Acknowledgement
(EC web site, JRC)
Proportion of doctoral
candidates with a citizenship
of another EU MS (Innovation
Union (IU) Scoreboard,
pending)
Alternative: Researchers
working in the business
sector (Eurostat)
Priority 4: Gender
equality and gender
mainstreaming in
research
Proportion of female PhD
(ISCED 6) graduates (She
Figures, based on Eurostat)
Proportion of female
academic staff (She
Figures, based on data
from Women in Science
(WiS) database)
Proportion of women in grade
A (professor) positions (She
Figures)
5a Open Access Share of funders funding
open access to publications
(ERA Survey)
(Data collection needed)
(Data collection needed)
5b Knowledge
transfer
Share of organisations that
has or uses a structure for
knowledge transfer activities
(ERA Survey)
R&D in higher education
institutions (HEIs) / public
research organisations
(PROs) funded by
business (Eurostat)
Public / private co-publication
per million of the population
International
dimension outside
ERA (Priority 6)
Share of the public R&D
budget allocated to
collaborative programmes
with third countries (ERA
Survey)
Non-EU doctorate
holders as a per cent of
total doctorate holders
(Eurostat via the IU
Scoreboard)
Licence and patent revenues
from abroad as a per cent of
GDP (Eurostat via the IU
Scoreboard)
The advantages and limitations of reducing the indicator suite to a set of six indicators, one for each
priority area, were assessed. It is possible in principle to reduce the three selected indicators per
priority to only one. To ensure comparability among the priority areas, these should be either the six
inputs, outputs or outcome/impact indicators. The outcome / impact indicators are recommended for
monitoring ERA progress because a lack of progress on any of them would suggest that ERA-related
policies and initiatives may not be having their desired effect and warrant further investigation. Though
this approach is straightforward and user-friendly, such a minimalist selection of indicators is
problematic because it is difficult to represent progress on what are very broad ambitions by reference
to a single, narrow indicator. For example, selecting input, output and outcome/impact indicators for
each priority area can provide insight into whether resources have been invested in each priority,
whether benefits are observable, and whether there is evidence of wider impacts, resulting in an
overall ability to assess effectiveness in fulfilling ERA priorities.
Composite indicators could provide an aggregated view on progress, but current variation in data
availability and relevance of available indicators highlighted in this study suggest this is not feasible at
present.
Furthermore, the indicator appraisal highlighted data collection needs and opportunities for
strengthening the evidence base for relevant indicators in each ERA priority. Nevertheless, the
analysis conducted of indicators across ERA priorities demonstrated that existing data sources
provide information that can be used for ERA progress monitoring. One of the main issues with current
data from ERA surveys is the variation in response rates, which should be addressed in future survey
design. There are gaps in some other areas as well; these do not suggest the need for entirely new
data collection exercises but rather a need for more complete and comprehensive data from existing
sources.

Assessment of progress in achieving ERA - Final Report
2 April 2015 iv
ES1.5 Roadmaps and peer review approaches to measure progress
Member States vary in their levels of ERA attainment, ambitions, and resources, and in the research
systems’ scale and structure. National roadmaps that set country-specific paths to achieving the ERA,
and which define milestones and timelines, have a potentially important role in an ERA monitoring
framework. This study provided an assessment of that role and how roadmaps and peer review
approaches could complement other components of the ERA monitoring system.
The analysis suggests that for national roadmaps to provide added value to existing monitoring
activities, they should have a common structure whilst allowing Member States flexibility in pace and
scope of action. Advice and guidance on the structure could be provided as part of the upcoming
European roadmap on ERA, which is currently being prepared by the European Research Area and
Innovation Committee (ERAC) in cooperation with the European Commission, and expected to be
presented in the first half of 2015.
The research undertaken for this study found that ERAC and the Commission should aim to provide
certain ‘framework conditions’ in developing guidance and advice on national roadmaps as part of the
European ERA roadmap. This would include a set of non-binding recommendations and aim to
establish a high level of mutual trust between Member States and the Commission through clear and
transparent discussion on, and review of, national roadmaps within the context of ERAC.
To support the development of a progress monitoring framework that includes national targets and
pathways to completion of the ERA, the national roadmaps should:
■ clearly identify relevant actors within the national research system and their role in achieving
progress;
■ include a clear definition of specific problem areas and challenges which inhibit a Member State in
its efforts to implement the ERA;
■ define quantitative targets and the actors responsible for meeting them;
■ give a timeframe for achievement of individual activities and targets;
■ explain the mechanism to be used for progress reporting, including the actors responsible for
progress reports; and
■ commit to review progress on a regular basis, describing the actors that need to be involved and
planned frequency of review.
These requirements could be set out in the European roadmap.
Furthermore, past experience of peer review in the ERA and the case study examples prepared for
this study suggest that a peer review mechanism could have a positive role to play in completing the
ERA if appropriately constructed, operated and resourced.
Future ERA peer reviews could be organised as a joint effort by the Commission and Member States,
built on the concept of ‘shared responsibility’ (TFEU Article 182.5). Member States can be encouraged
to initiate development of a common approach and guidelines to establish a formalised and credible
peer review system. The planned Policy Support Facility could serve as a hub for expertise and
provide administrative support and guidance to external experts and peer review participants.
The peer review mechanism’s prospects for success would be improved if it incorporated the following
elements and approaches:
■ decisions on the peer review programme and approval of the outputs being taken by ERAC;
■ a properly documented peer review process that was well understood by Member States;
■ the scope of reviews and selection of reviewers was organised based on the principal ERA
objectives or individual measures identified in the EU ERA roadmap in 2015;
■ a structured approach to provide for national roadmaps and a corresponding EU feedback
mechanism, possibly linking into the European Semester;

Assessment of progress in achieving ERA - Final Report
2 April 2015 v
■ the peer review teams including a mix of experts, including independent experts, rather than being
dominated by Member State policy administrators;
■ a structured approach towards the provision of thematic and administrative support, and the
development of guidelines, templates and a structured knowledge management system for
collected data and analytical reports, that encouraged more Member States to express an interest
in being peer-reviewed and reduced administrative burden on national representatives;
■ an annual summary of peer reviews, drafted by ERAC (i.e. by the Member States themselves),
that strengthened ownership, provide guidance for the EU as a whole and built mutual
accountability between Member States; and
■ a review of the Innovation Union Self-Assessment Tool (SAT) and the inclusion of relevant
overlapping policy fields to increase interest from Member States. The SAT currently forms the
basis and thematic framework for peer reviews in ERAC, but might neglect or miss essential topics
and issues that are addressed within the national research and innovation system.
ES1.6 A future evaluation and monitoring system
Current monitoring arrangements and the indicators identified by the study team only cover parts of
the overall activities. Complementary approaches are required to reflect Member State diversity and
encourage progress reporting. Building on the work already undertaken by ERAC, any future
integrated approach should be built around a core set of indicators with individual national roadmaps.
This arrangement should allow for specific focus on strengths and weaknesses of national systems
and iterative performance review against a core set of indicators, accompanied by individual national
objectives set out in roadmaps. This could also strengthen the political visibility of ERA in national
research governance systems.
There is also limited integration and coordination between the ERA and complementary European
strategies on innovation and economic growth. The Innovation Union’s Self-Assessment Tool has
been used in a series of ERA peer reviews. A number of indicators from the Innovation Union
Scoreboard are being used by the ERA progress reports. But while the Innovation Union groups
Member States according to structural similarities and performance using a scoreboard approach,
there is no structured performance measurement in ERA which would allow for a similar ‘grouping’ of
countries according to ERA priorities. A more structure approach could strengthen the political
dimension and visibility of ERA.
Progress and performance at EU level could be demonstrated across ERA priorities through the use
of a ‘traffic light system’. This could signal the status of progress towards ERA objectives and EU level
goals. Progress could be assessed against the goals defined under the EU roadmap. Progress could
be assessed against all ERA priorities or specific areas of action identified in the roadmap.
An example of how this approach could be used in the ERA is provided in Table ES1.2.
Table ES1.2 Traffic light rating system for ERA progress
Performance Description Status
Taking all relevant information into account, the aggregate assessment is that this aspect of the ERA
is either complete or track for completion by the given deadline.
The available information suggests that achievement of this aspect of the ERA within the given
timetable is in doubt. There are issues to be addressed but the situation is not irrecoverable providing
the risks are addressed.
There are significant problems and achievement of this aspect of the ERA is not expected within the
given timetable. Progress objectives are not being met and actions is required.
This approach offers succinct and easily identifiable messages about the state-of-play at EU level on
ERA priorities. Traffic light ratings could be assigned by a team of individual experts, who review data
collected against the core indicator set and peer review reports.
G

Assessment of progress in achieving ERA - Final Report
2 April 2015 1
1 Introduction
This is the final report for a study to assess progress in achieving the European Research
Area (ERA) in Member States and Associated Countries. The call for tender was issued by
the Directorate-General for Research and Innovation (DG RTD) under a framework contract
for the evaluation of research and innovation programmes and policies between ICF
Consulting Services, Ltd and DG RTD.
The study was delivered by a team led by ICF with the support of Technopolis, Lancaster
University and Delft University of Technology.
1.1 Study scope and objectives
The ERA is central to the Europe 2020 strategy and its Innovation Union (IU) initiative. The
following ERA definition is presented in the European Commission (EC) ERA
Communication (EC, 2012d) and is based on the Lisbon Treaty3 and European Council
conclusions:
A unified research area open to the world based on the internal market, in which
researchers, scientific knowledge and technology circulate freely and through which the
union and its Member States strengthen their scientific and technological bases, their
competitiveness and their capacity to collectively address grand challenges.
The Commission defined five priority areas and a cross-cutting focus on international
cooperation to achieve the ERA as envisioned (EC, 2012a and 2012d):
1. more effective national research systems to increase competition and excellence
within national borders and ensure the best and most effective funding allocation;
2. optimal transnational co-operation and competition to establish a common research
agenda, improve interoperability and comparability of national programmes, and build
effective pan-European research infrastructures;
3. an open labour market for researchers to increase researcher mobility, training and
attractive career development;
4. gender equality and gender mainstreaming in research to make better use of diverse
scientific human resources as a way to foster quality and relevance of research; and
5. optimal access to and circulation and transfer of scientific knowledge to improve
access to and uptake of knowledge and facilitate innovation.
The Commission has also identified actions for each priority area expected to be
implemented through initiatives and measures undertaken by the Commission, Member
States and research stakeholder organisations, acting in partnership (EC, 2012d).
Dinges et al. (2013) observed that following the ERA Communication (EC, 2012d), progress
in achieving ERA in the Member States and Associated Countries was limited: the majority
of countries reviewed had only implemented half of the indicators to a ‘medium degree’. The
ERA progress report 2014 (EC, 2014a) suggests that there has been progress across most
of the ERA priority areas. Developments across the European Union (EU) were not uniform,
however, with greater progress achieved in Nordic and Western European countries
compared to Central and Eastern European countries. Southern European countries were
mixed in this respect.
3 Article 179 of the Consolidated Version of the Treaty on the functioning of the European Union (EU, 2012).
Assessment of progress in achieving ERA - Final Report
2 April 2015 2
The present study was expected to examine whether the measures in place in Member
States and Associated Countries4 had advanced since 2012 and were better aligned
with the ERA priorities.
The terms of reference set the following objectives:
■ update the state-of-play of ERA;
■ develop and estimate policy progress indicators; and
■ evaluate ERA progress in the Member States and Associated Countries.
In the period between the submission of ICF’s proposal and the start of the contract the
Commission developed and estimated the policy progress indicators, Member States
submitted updates of the National Reform Programmes (NRP), and surveys of public
research organisations and research funding organisations were launched. The surveys
were expected to provide data on ERA monitoring indicators, which were to a large extent
included in the ERA impact assessment report (EC, 2012b) and agreed with the Member
States.
The evaluation was intended to inform the preparation of the second ERA Progress Report,
to be published in September 2014, but delays in the procurement procedure meant that the
present study could not be completed in time to fulfil this original objective. On-going work by
DG RTD and the Member States and Associated Countries provided some of the information
asked for in the original study terms of reference. As a result, the study team supported DG
RTD in the preparation of its 2014 progress report and undertook to complete the evaluation
of progress (the tasks completed are summarised in Annex 1).
Following preliminary work on the evaluation, described and documented in Annex 2 through
Annex 6, it became clear that the evaluation as originally programmed could not be
performed, and an alternative strategy was agreed with DG RTD to develop an approach for
future ERA progress monitoring and evaluation. The objective of the work was to develop a
set of proposals for further development of the ERA progress monitoring framework to be
considered by DG RTD. The results of this work programme are set out in this report.
1.2 Report structure
The remainder of this final report is structured as follows:
■ Section 2 sets out a framework explaining the ERA ambition and expected mechanisms
of change;
■ Section 3 identifies indicators that could be used to measure ERA progress and
appraises their suitability;
■ Section 4 assesses the potential role of national roadmaps in achieving the ERA;
■ Section 5 considers potential approaches to support monitoring and performance
management mechanisms in the context of ERA; and
■ Section 6 provides recommendations on system development to assist DG RTD in the
future evolution of the ERA.
4 Namely: Albania, Bosnia and Herzegovina, Faroe Islands, Macedonia, Iceland, Israel, Lichtenstein, Moldova,
Montenegro, Norway, Serbia, Switzerland and Turkey (EC, n.d.).

Assessment of progress in achieving ERA - Final Report
2 April 2015 3
2 An ERA framework
Monitoring and evaluation must be set in the context of the ambitions identified for the ERA
and mechanisms by which change is expected to occur. This includes having a clear
understanding of the ERA objectives, its activities, outputs and outcomes, as well as the
expected impacts.
This section sets out the rationale for the ERA, and then for each of the priority areas
through intervention logics. An intervention logic is an analytical tool that shows how
priorities are operationalised, illustrating the path from objectives to expected results
(impacts). Intervention logics have been prepared for each priority area, illustrating the
mechanism(s) by which inputs (such as research funding and infrastructure) are connected
to outcomes (and achievement of the strategic objectives) via activities and outputs. These
serve as a model of how the system should work.
Figures illustrating the intervention logics for each priority area are provided in Annex 7.
They help demonstrate where the current progress monitoring mechanism is focused and
where gaps can be identified. They illustrate the main actions, inputs, outputs, outcomes and
expected impacts for each priority area.
The intervention logics are complemented by a set of indicator maps identifying potential
indicators against the proposed intervention logic. The proposed indicators are presented in
section 3.
2.1 ERA background and objectives
The ERA was conceptualised as an instrument to integrate research resources and capacity
across EU Member States, mirroring the common market. The ERA was introduced to
support the Lisbon Agenda, which set out the EU’s strategic economic development goals
(European Council, 2000). The Lisbon Treaty and its amendments established research
policy as a shared competence between the European Commission and the Member States,
reinforcing the community dimension of research policy and providing a legal basis for EU
action on ERA.5
The ERA Vision (EC, 2000) and the ERA Green Paper (EC, 2007) identified fragmentation
and ‘compartmentalisation’ of national research efforts as major issues to address, and as
fundamental to the rationale for a unified research area. The Commission’s objectives
included strengthening the EU’s global competitiveness and eliminating the EU’s innovation
gap with the US and Japan. The Innovation Union Scoreboard 2014 suggests that this gap is
closing slowly, but the US continues to be ahead of the EU in the commercial exploitation of
research results. EU investments in research and development (R&D) in relation to the gross
domestic product (GDP) are below the levels of competitors. The ERA contributes to
improvements in these areas by tackling major differences in innovation and research
performance between Member States, particularly the uneven spread of knowledge
production and innovation (EC, 2014).
Major trends also affect the EU’s social and economic development, and impact on its
innovation and research systems. A joint EU approach which is founded on coordinated
action in the field of research and innovation is considered to be the best way to address
these challenges including climate, energy and resource scarcity; security concerns and
emerging conflicts; and the rise of a service and knowledge-based economy (EC, 2008).
5 Article 182.5 of the Consolidated Version of the Treaty on the Functioning of the European Union (TFEU) (EU,
2012).

Assessment of progress in achieving ERA - Final Report
2 April 2015 4
2.2 The European Research Area and the Innovation Union Flagship Initiative
The ERA operates alongside the EU’s strategic growth agenda. Europe 2020 and the
Innovation Union flagship initiative address framework conditions and access to finance to
enable exploitation of research and innovation in products and services (EC, 2010). The
Europe 2020 strategy includes specific development targets, including a target to spend
three per cent of the EU’s GDP on R&D by 2020. The Innovation Union, announced as one
of seven flagship initiatives in the Europe 2020 strategy, is intended to improve the
framework conditions for research and innovation in Europe, including ERA completion.
The Innovation Union aims at creating an ‘internal market for innovation’. The initiative has
therefore set out the following objectives in 2010 (EC, 2010):
■ Member States should leverage investment in education, R&D, innovation and
information and communication technologies (ICTs);
■ EU and national research and innovation systems should be better connected;
■ education systems should be modernised and focused on excellence;
■ the ERA should be completed by 2014;
■ access to EU funding programmes for research and innovation should be simplified and
their leverage effect on private sector investment, i.e. the amount of private investment
triggered by public funding, must be enhanced;
■ cooperation between science and business should be enhanced to enable more effective
commercial exploitation of research;
■ European Innovation Partnerships should be launched to accelerate research,
development and market deployment of innovation for major societal challenges;
■ strengths and potential in design and creativity should be better exploited; and
■ international cooperation in R&D should be improved.
The Commission provides three main instruments to measure progress against these
targets:
■ a self-assessment tool for Member States to review their national and regional research
and innovation systems;
■ a regular review of performance against the objectives listed above using a performance
scoreboard approach (i.e. the Innovation Union Scoreboard); and
■ European Innovation Partnerships, which bring together aspects of R&D and market
deployment along thematic areas of societal concern (e.g. health, agricultural
sustainability, smart cities and communities, water, and raw materials).
There has been limited integration and coordination between the Innovation Union initiative
and ERA activities, despite thematic overlap. The Innovation Union’s self-assessment tool
has been used in a series of ERA peer reviews. Knowledge management and data analysis
systems are available through the ERAWATCH portal and the Innovation Union Dashboard.
A number of indicators from the Innovation Union Scoreboard are being used by the ERA
progress reports. But while the Innovation Union groups Member States according to
structural similarities and performance using a scoreboard approach, there is no structured
performance measurement in ERA which would allow for a similar ‘grouping’ of countries
according to ERA priorities.

Assessment of progress in achieving ERA - Final Report
2 April 2015 5
2.3 Rationale and intervention logic of ERA priority areas
Five priority areas for ERA action were identified in the 2012 Communication on 'A
Reinforced European Research Area Partnership for Excellence and Growth' (EC, 2012):6
The following sections outline detailed activities, inputs, direct outputs, outcomes and wider
impacts for each priority area.
2.3.1 ERA priority 1 - more effective national research systems
Almost all Member States have adopted a national strategy on research and innovation (EC
2014). The Innovation Union Scoreboard 2014 suggests that there are wide performance
gaps between ‘innovation leaders’ and ‘modest innovators’ who lag behind. Whilst respecting
the specifics of national research systems, structural differences and variation in institutional
set-up as well as different approaches to allocation of funding are a significant structural
problem preventing national research systems from becoming more integrated, competitive
and effective.
ERA priority 1 sets out two main fields of actions to tackle these structural differences and
improve value for money, quality and quantity of research outputs. Under this priority
Member States are expected to establish, maintain and develop performance-enhancing
structures, framework conditions and processes such as national strategies, specific funding
programmes adhering to these standards, and organisational change in research funding
organisations (RFOs) to reflect these priorities.
First, under Action 1a, Member States, together with relevant national actors such as RFOs
and programme management agencies, are expected to mainstream competitive project-
based funding based on international peer review standards. This may happen, for example,
through specific national strategies focussing on competitive funding of projects or clusters of
projects that have been peer reviewed by domestic or international experts. National
strategies might focus on specific research areas to build upon existing national
infrastructure, scientific expertise or existing industries to commercialise results. Examples
include the German High-Tech Strategy and Excellence Initiative, which is expected to
increase the share of competitively allocated research and development funding and
increase the share of peer-reviewed projects in total research and development spending.
Under Action 1b, Member States are expected to design or amend legal measures that
govern institutional research funding and, through RFOs and individual measures, govern
institutional funding mechanisms, introducing qualitative performance goals without
compromising long-term financial planning certainty. These activities will directly result in an
increased share of institutional funding allocated to research performing organisations
(RPOs) based on quality-oriented performance measurement and/or on the evaluation and
appraisal of performance-related indicators.
A direct outcome of these activities should be a stronger focus on scientific and technical
excellence in allocating national research and development funding, an increased number of
high-impact publications and increased social and commercial impact of research projects.
Long-term impacts of the activities, outputs and outcomes outlined above may include
improved capacity and efficiency of national research systems and allow for a higher degree
of regional specialisation, enable better performance in overall scientific and commercial
output and reduce unintentional overlap in RPO research profiles.
2.3.2 ERA priority 2 – optimal transnational cooperation and competition
ERA priority 2 focuses on, amongst other aspects, improving the framework conditions for
joint programming and transnational cooperation both on funding programmes for research,
as well as major infrastructures. Most transnational cooperation within the EU is
6 Based on the ERA Green Paper (EC, 2007).

Assessment of progress in achieving ERA - Final Report
2 April 2015 6
implemented via European framework programmes and activities of the European Space
Agency.
Evaluation of the EU’s framework programmes and schemes such as ERA-NET7 show that
these bring about a strong economic impact and structure EU research efforts towards more
efficient mainstreaming and capacity building of research agendas (EC, 2012b). Member
State interest in Joint Programming Initiatives (JPIs) and support to ERA-NET Co-fund
actions, as well as Article 185 initiatives in Horizon 2020 all indicate further development
towards increased and more comprehensive transnational cooperation. But Member States
still have significant hurdles to overcome. For example, some Member States are working on
national action plans, roadmaps and strategies to further develop JPIs and align national
research agendas with initiatives supported under Horizon 2020. Twelve Member States
have made provisions to foster bilateral or multilateral international cooperation (EC, 2014).
Under the ERA, Member States are expected to improve framework conditions for JPIs with
a specific focus on grand challenges. Member States and RFOs should also continue to
remove legal and administrative barriers to ensure evaluation practice and funding rules
conform to international standards and are compatible across Europe.
These activities could result in short-term outputs such as increased national budgets for
JPIs and other transnational cooperation instruments, as well as an increased share of
funding allocated along compatible and interoperable evaluation practice. In the medium-
term, these outputs could increase EU research capacity and allow for a more coordinated
approach and critical mass of resources to:
■ leverage additional public and private investments in research;
■ increase the average impact of co-authored work; and
■ allow for wider knowledge dissemination and spillover effects across the European
economy.
The long-term impact of a JPI could include contributions to solving grand societal
challenges of cross-border relevance through research, and aligning national strategies in
the selected JPI domains.
The second main focus of ERA priority 2 is to improve the capacity and development of, as
well as access to, large national and pan-European research infrastructures. Improved
research infrastructures can improve the scale and speed of major research undertakings.
Cross-border access to national infrastructure and the development of pan-European
infrastructures also offer financial benefits as well as distributed costs of development,
maintenance and staffing, which may be shared across Member States.
Twenty-two Member States have adopted national roadmaps on research infrastructures,
although many of them do not show consistent links with EU-level efforts and financial
commitments to establish infrastructures of pan-European interest identified by the European
Strategy Forum on research Infrastructures (ESFRI) (EC, 2014). Member States are
therefore expected to reserve budgets for the preparation, development and maintenance of
ESFRI roadmap projects. They should also develop their national research infrastructure
strategies to remove legal, technical and other barriers to enable complete cross-border
access to national research infrastructure. This is expected to result in improved access to
national infrastructures by non-nationals and improved financial security, financial capacity
and bundled capacity for the development and maintenance of research infrastructures
including completion of ESFRI roadmap projects. In the long-term, resources for, and access
to both national infrastructures and ESFRI roadmap projects should be pooled and the
development of new infrastructures coordinated transnationally.
7 The ERA-NET (networking) scheme was launched in 2003 to support networking activities leading to improved
cooperation and coordination of national and regional research programmes carried out by Member States and Associated Countries (EC, 2003).

Assessment of progress in achieving ERA - Final Report
2 April 2015 7
2.3.3 ERA priority 3 – open labour market for researchers
Free movement of knowledge has been highlighted as the EU’s ‘fifth freedom’ needed to
maintain a competitive and attractive EU labour market, a knowledge-driven economy and to
avoid ‘brain-drain’ through the loss of European talent to competing regions such as Brazil,
Russia, India, China (BRIC countries) and the US. EU programmes like the Marie-
Skłodowska-Curie instruments contribute to the mobility of EU researchers and international
research, but important barriers remain at Member State and EU level regarding the working
conditions and mobility of researchers. These include variety in transparent and fair
recruiting of research staff, low levels of staffing autonomy in many research performing
organisations, varying and incompatible career structures across the EU as well as legal,
administrative and language barriers for non-national and third-country staff. In a number of
Member States an open, transparent and merit-based recruitment system is not in place,
intersectoral mobility is low and working conditions as well as the overall attractiveness of
scientific careers are insufficient (EC, 2014a).
ERA priority 3 sets out a number of actions to tackle these problems. These include Member
States’ activities to introduce or expand structured doctoral training, programmes to increase
mobility between industry and academia, and efforts to remove barriers to cross-border
portability of national grants. RFOs are expected to implement and adopt the EU’s ‘European
Code of Conduct for the recruitment of researchers’ and oblige funded institutions to comply
with the European Charter of Researchers and Code of Conduct for the Recruitment of
Researchers. The ‘Principles of Innovative Doctoral Training’ (IDTP) defined by the ERA
Steering Group on Human Resources and Mobility (ERA SGHRM, 2013) should be adopted
by RFOs, which is expected to improve cross-sector mobility of researchers. The
Commission is expected to further improve the usefulness, usability and usage of the
EURAXESS portal8 and support the establishment of a transnational pension fund
(RESAVER9) for research organisations and their employees (EC, n.d.b). This should result
in further improvements to the openness and fairness of recruitment procedures, improved
working conditions and attractiveness of research careers, and increased mobility of
researchers internationally and across sectors. In the long-term, activities under this ERA
priority are expected to help strengthen the EU workforce by attracting more people to
research careers and providing both academia and industry with better trained personnel.
2.3.4 ERA priority 4 – gender equality and gender mainstreaming in research
Gender equality and mainstreaming have gained increased recognition on policy agendas at
national, European and international levels, as well as within research organisations
including universities. Significant steps have been undertaken under ERA priority 4 on
gender issues in research and innovation. But skilled female research capabilities are
underutilised and women are under-represented across career paths. This may undermine
the quality and relevance of research outputs and represents an inefficient use of talent
across the EU (EC, 2012).
Priority 4 objectives include improving gender equality and strengthening the gender
dimension in research programmes. The ERA Communication (EC, 2012) invited Member
States to create a legal and policy framework to promote and incentivise gender equality.
Specific national policies on gender equality in public research have been adopted in 17
countries. According to the ERA progress report 2014, the proportion of women in
recruitment committees and evaluation panels was 36.6 per cent and 35.8 per cent
respectively compared to the target of 40 per cent set by the Commission in the
Communication (EC, 2014c).
8 The EURAXESS – Researchers in Motion jobs portal provides recruitment support services to researchers with
the aim of improving researchers’ mobility in the EU (EC, 2015b). 9 More details of RESAVER are provided online at http://ec.europa.eu/euraxess/index.cfm/rights/resaver

Assessment of progress in achieving ERA - Final Report
2 April 2015 8
Action 4a refers to gender equality in research and emphasises cultural and institutional
changes to remove legal and other barriers to recruitment, retention and career progression
of female researchers. Member States are expected to design national policies on gender
equality in public research. RPOs are asked to adopt Gender Equality Plans and implement
changes in their recruitment and promotion policies to off-set current imbalances. This would
be expected to result in more gender-balanced recruitment across RPOs.
Member States are expected to ensure that there is a gender balance in decision making
processes with regards to allocation of funding and recruitment (Action 4b). The Commission
has invited Member States to ensure that committees which are involved in recruitment,
career progression and establishing and evaluating research programmes are composed of
at least 40 per cent of the under-represented sex. The 2014 ERA progress report indicates
that the average share is currently 33 per cent.
Gender imbalance in expert groups and in decision-making committees is thought to have
further impact on the consistent and appropriate consideration of the gender balance in basic
and applied research (German Federal Government, 2014). The proportion of organisations
whose leaders are women is 18 per cent on average, with a high degree of variation among
countries and where about half of Member States fall below the EU average. Member States
are expected to increase the proportion of women at all career stages, and particularly in
leadership positions and on executive boards of science organisations. Under Action 4b,
RFOs are expected to work further to introduce gender related evaluation criteria for funding.
Member States should look to remove institutional and cultural barriers that directly or
indirectly prevent more gender-balanced decision making. This is expected to result directly
in improved access to funding for female researchers and more gender-balanced
evaluations.
These activities may increase the share of female researchers across career stages and in
research fields where women are particularly underrepresented (e.g. information sciences,
engineering, and mathematics). Outcomes may also include improvements in the contractual
situation of female researchers (e.g. the share of permanent versus non-permanent
contracts compared to male researchers). An expected long-term impact of activities under
this priority area is improvement in the labour market where there is a deficit in skilled labour
and inefficient use of the qualified female labour force within the EU (EC, 2012b and 2013d).
2.3.5 ERA priority 5 – optimal access to and circulation and transfer of scientific knowledge
The Commission has identified clear challenges and problem areas to be addressed under
priority area 5 (EC, 2012):
■ knowledge generated through research is not accessible throughout the research
community due to institutional and infrastructural barriers;
■ limited information is freely available to researchers in the public domain;
■ the cost of accessing knowledge is high for smaller institutions, RPOs in less-advanced
Member States and small and medium-sized enterprises (SMEs);
■ knowledge transfer between academia and the private sector is unsatisfactory; and
■ the lack of EU-wide digital infrastructure to manage the access to and maintenance of
scientific knowledge is keeping costs for accessing knowledge high and specifically
prevents institutions in less-advanced Member States from catching up.
Priority 5 objectives include effective knowledge transfer, which is expected to contribute to
open innovation and increase the speed of scientific discovery and knowledge spill-overs
between academia and industry. Action 5a aims at improving open access to publications
and access to data resulting from publicly funded research. Currently, only 44.6 per cent of
the average share of research funders have strategies in place to support this (EC, 2014c).

Assessment of progress in achieving ERA - Final Report
2 April 2015 9
ERA survey results in 2014 indicate that funding for open access to data is not a common
practice in RFOs. Among those Member States whose funders support it, the average share
of funding organisations frequently supporting open access activities is 28.1 per cent.
Member States are therefore expected to provide legal frameworks for open access, which
may result in RPOs making scientific research available in online repositories and
subsequently a higher total number of scientific publications available through open access.
Action 5b on open innovation and knowledge transfer between public and private sectors
sets out objectives for Member States related to strengthening the connections between
science and industry and on the role of public-sector research in open innovation. RFOs
should systematically fund knowledge transfer activities as part of research projects and
incentivise RPOs to support knowledge transfer through institutional support (e.g. through
the introduction of technology transfer offices). These activities and short-term outputs are
expected to result in further joint research developed between the private sector and RPOs
as well as increased patenting and licensing revenues for RPOs. Greater spill-over effects to
support the development of new products and services are expected long-term impacts
under this action.
Actions 5c and 5d seek to harmonise policies for public e-infrastructures and associated
digital research services. RPOs improving access to public e-infrastructures using federated
identities may over the long-term reduce the administrative costs of accessing scientific
knowledge and computing power.
2.3.6 International dimension outside ERA
The pace of scientific and technological change worldwide has increased pressure on the
competitiveness of the European scientific community. Emerging economies continue to
build research and innovation capacity. The share of the BRIC countries in global R&D
expenditure doubled between 2000 and 2009. The European Commission has recognised
these developments and warned that a lack of collaborative approaches with these countries
poses significant challenges and that there are risks that the scientific community in Europe
is falling behind (EC, 2012c).
The cross-cutting priority on international dimensions outside the ERA is supported by a
Commission Communication to enhance and focus EU international cooperation in research
and innovation (EC, 2012). Member States have increasingly opened their research
programmes to international cooperation, but fragmented national approaches to identifying
and securing international talent may have resulted in reduced EU competitiveness and
hampered access to foreign markets in technology-driven sectors (EC, 2012c).
Under this cross-cutting priority area, Member States are encouraged to foster openness for
international cooperation to maximise EU research potential. Most Member States already
have national strategies for international cooperation on research and innovation (EC, 2014).
But national level initiatives could be strengthened through greater coordination. The
Commission supports a number of initiatives like the Strategic Forum for International
Cooperation in Science and Technology (SFIC) in this regard (EC, 2012c and 2014e).
RFOs are expected to increase the R&D budget going to third countries and work with
Member States to develop collaborative programmes with third countries. Outcomes of these
efforts may include an increase in research projects with third countries and improved
international mobility of scientific knowledge and research results. Long-term impacts such
as improved overall capacity to tackle global challenges and improved attractiveness of the
EU as a location for researchers, companies and investments in R&D will benefit the EU
economy and improve its attractiveness as an R&D location. The EU can also leverage the
capacity international infrastructures and resources to tackle global challenges in R&D by
strengthening the level of international cooperation in research.

Assessment of progress in achieving ERA - Final Report
2 April 2015 10
3 Indicator identification and appraisal
The next stage of the research involved a review of available indicators relevant to ERA
monitoring in order to highlight data collection opportunities and map these across the
priority areas. This also enabled an assessment of data requirements, where data best
suited to ERA monitoring were insufficiently robust, complete or available.
The research documented the information available for each indicator, the source, and
frequency of collection. The indicators were then evaluated for suitability in relation to their
relevance, reliability, availability, completeness and frequency of collection. The study team
assessed the indicators against each criterion based on information provided in previous
studies and expert reviews of ERA monitoring arrangements as well as the teams own
judgment.
The output is an inventory of indicators, organised by ERA priority, with an appraisal of their
suitability for monitoring and evaluation, and a final suite of indicators proposed as a core set
to measure progress across ERA priorities. There may also be indicators where data
availability is currently unsatisfactory, but that would be valuable ERA indicators if
information were available. The team considered such indicators and proposed that they
could be included, where appropriate, if data collection were improved. The proposed
indicators are intended to be illustrative of what the Commission could use in the future and
provide a basis for discussion with Member States, RPOs and RFOs and other stakeholder
organisations.
3.1 Approach of the appraisal
For each priority area, the study team conducted an appraisal of available or potential
indicators. The main data sources used for this exercise were Eurostat, the ERA Survey of
RPOs and RFOs, the Innovation Union Scoreboard and Organisation for Economic Co-
operation and Development (OECD) statistics. The appraisal also considered other known
and potentially relevant and complete data sources in particular areas. Most notably, data
from the second phase of the project on mobility patterns and career paths of researchers
(MORE2) were considered for priority 3, and She Figures10
for priority 4. Other sources that
were considered included information captured by DG RTD and the Joint Research Centre
(JRC) for the European Semester, as well as data captured by the Research and Innovation
Observatory (RIO).
The team conducted an appraisal of the indicators and data sources, identifying a smaller
set of the best available indicators for use in ERA monitoring. The indicators were sub-
divided into input, output and outcome/impact indicators, with the aim of selecting one
indicator for each category per ERA priority area, reflecting progress on as many of each
area’s actions as possible, resulting in a final selection of three indicators for each priority
area, with one indicator respectively reflecting the best available input, output and
outcome/impact indicators to capture progress on ERA priorities. In order to move from a
large number of possible indicators to a final selection of three per priority, appraisal of each
indicator involved a simple four-point scoring system on all key criteria that needed to be
considered. Scores for the reliability and relevance of indicators carried a double weighting,
given their exceptional importance. The scoring system is provided in Annex 8 along with the
indicator maps and complete appraisal of all of the identified indicators.
The final indicator chosen was chosen based on the overall score and taking into
consideration potential limitations. This meant for instance that any indicator that received a
10
She Figures report on the situation of women in science and research through a set of indicators that assess the participation of women at all levels and in all scientific disciplines. Data collection is undertaken every three years, starting in 2003, by DG RTD in cooperation with the Helsinki Group and its sub-group of Statistical Correspondents (EC, 2012d).

Assessment of progress in achieving ERA - Final Report
2 April 2015 11
low score on any one criterion would not be included in the final selection, even if it had the
highest overall score. Further considerations are discussed where the appraisal revealed a
choice to be made between two or more high-scoring indicators. Indicators that were
fundamentally relevant but currently not available or where data quality was poor are
discussed separately.
The indicators selected (three per priority area) represent what the study team believes
should be the minimum number and range of indicators and as such the simplest possible
reference tool that can currently be derived from the wide range of available indicators.
As explained below, a consideration here was also to ensure that the smallest possible
number of indicators could reflect the fullest possible range of actions under each priority. As
such, it was critical to identify indicators that address several actions where possible,
meaning that indicators should not be read as representing linear progression across each
action (this would involve an absolute minimum of three indicators for each of the 19 actions,
or 57 separate indicators).
The breadth of each ERA priority, as well as the variety of actions contained within them,
could be represented by a larger number of indicators. Additional potential indicators are
noted where relevant, whilst areas not covered by currently available indicators are also
identified. The resulting indicator matrix is therefore a substantive tool for immediate
consideration and use, but should not be viewed in isolation from the whole of the analysis
presented here.
3.1.1 Indicator maps and links between actions and indicators
The study team developed an indicator map for each ERA priority area, which plots
indicators across inputs, outputs and outcomes to identify where there are data and
indicators available that are or could be used to measure progress in each priority area. The
indicator maps are presented in Annex 8. The indicators considered included:
■ Indicators identified by DG RTD for particular consideration.
■ Indicators which have been identified in reports prepared by expert groups reviewing the
ERA monitoring mechanisms (e.g. JRC, 2013; EC, 2009a; Haegeman et al., 2012;
Doussineau et al., 2013).
■ Indicators available from existing datasets (e.g. OECD, Eurostat, the Innovation Union
Scoreboard, etc.)
■ Indicators that can be derived easily from the activities identified through the intervention
logics. These indicators could be useful to fill gaps in the monitoring framework,
particularly in the measurement of outputs and outcomes.
Indicators that have been used in ERA progress reports are presented in the indicator maps.
They are not appraised here: instead, the results of the analysis in this section presents
possible alternatives and extensions to the indicators already in use. Indicators that have
been used in the ERA survey for RPOs are also presented. Assessment of these indicators
is out of scope for this study, but are identified in the indicator maps to demonstrate where
information about research performing organisations is being used to assess ERA progress.
Actions under each ERA priority are included in the indicator selection. Indicators should not
be read directly against actions, however, and are not intended to suggest a link between
inputs, outputs, and outcomes/impacts. Moreover, outcome/impact indicators consistently
overlap across the different ERA priorities. Linking individual inputs to specific, long-term
impacts is problematic for almost all priority areas. Similar effects can occur for outputs, and
even for inputs there is not always a clear link between each indicator and a single action.
Most often, this is due to the broad nature of the actions, as well as to the multitude of
identified indicators, which are often highly relevant to a priority area, but do not always
neatly address one action specifically.

Assessment of progress in achieving ERA - Final Report
2 April 2015 12
Instead, the indicators selected are intended to highlight the availability of both broad and
more focused indicators relating to each priority area. In practice, this means that an
indicator’s ability to highlight progress on multiple actions, or the ability of a selection of
indicators to cut across as many actions as possible, are critical criteria to make the best use
of available data to monitor the progress of the ERA as a whole.
3.1.2 The potential for composite indicators
As an alternative to selecting one input, output, outcome and/or impact indicator for each of
the ERA priority objectives, it is possible to construct a composite indicator. A composite
indicator summarises information for pre-selected variables. The variables of choice can
include input, output, outcome, and impact variables or can be limited to a selection of
outcome or other variables only, for example. It also is possible to construct a composite
indicator that captures the different dimensions of the ERA priorities. Synthesizing
information in this way can facilitate tracking a country’s overall score on ERA priorities over
time relative to another country. As a result, composite indicators can be powerful tools for
communication.
Despite the advantages of composite indicators there are also a number of pitfalls. In order
to construct composite indicators for each of the ERA priority areas that are comparable over
time and comparative across countries there are a number of prerequisites. First, the
underlying data must be available for all countries for all years under consideration.11
Different methodologies can be used to construct composite indicators, including factor
analysis (which also has a multitude of options), simple aggregation to the mean and
correlation analysis. The appropriate methodology is dependent on the theoretical framework
and the data characteristics. If the data characteristics are substantially different across the
different ERA areas and it is the intention to construct different sets of composite indicators,
different methodologies may be recommended across the ERA areas.
The study team does not recommend constructing composite indicators at this stage,
however, because they are less powerful when it comes to representing specific policy
actions and recommendations on ERA priority areas. Measuring progress or lack thereof
over time usually requires analysing changes in single variables that capture different
aspects of a given ERA priority area. For example, the input variables on gender equality
includes a variable ‘measuring the proportion of funding allocated for projects that integrate
gender aspects to science and technology research’ and a variable that captures ‘the
number of applicants and beneficiaries of research funding (by sex)’. Countries may achieve
different levels of progress on each of these ERA aspects. When working with composite
indicators it is more challenging to interpret the progress made on different ERA priority
areas and to recommend a specific policy action.
3.2 Priority 1 - indicator assessment
ERA priority 1 focuses on effective national research systems. Thirteen indicators (excluding
indicators used in previous ERA progress reports) were identified for this area (see Annex 8,
section A8.2). The ERA actions relate closely to funding issues, therefore the suggested
indicators are focused on finance. Useful, reliable and robust data covering ERA Member
States are available through Eurostat and the OECD (Science and Technology Indicators
and Science and Technology Outlook). These databases cover all Member States in most
cases and offer time series data. A disadvantage of some of the Eurostat and OECD
indicators is their generic focus, which makes them helpful as headline figures but not
always fully relevant to specific actions or ERA priorities. Indicators based on the two-part
ERA Survey of, respectively, Research Funding and Research Performing Organisations
11
In the case of missing data, it is possible to use imputation but additional care has to be taken to interpret the resulting composite indicator. See also OECD (2008) Handbook on constructing composite indicators: methodology and user guide for a general guideline on constructing composite indicators.

Assessment of progress in achieving ERA - Final Report
2 April 2015 13
(hereafter ERA Survey) might be better at measuring progress for specific ERA priorities, but
the robustness of such indicators is a drawback: on some questions, response rates have
been high for previous studies and there are complete data for all or almost all Member
States, but this is not always the case. Overall, response rates have been low in some
countries, which is a problem that needs to be addressed in order to obtain more robust data
in the future.
Total government budget appropriations or outlays for R&D (GBAORD) as a per cent of GDP
could be an appropriate input indicator. Data are collected regularly by OECD and Eurostat
and are highly reliable and revised annually. Whilst it is a general indicator that leaves
considerable space for interpretation, it is by far the most robust of the available selection,
and provides an indication of the resources invested in the research system.
The share of the national GBOARD allocated through project-based funding (as opposed to
institutional funding) is the preferred choice for an output indicator, as these data are
collected through the ERA survey and has received high response rates. This indicator could
be considered to be an input rather than output of the research system. But the decision to
make a proportionately larger amount of funding available on a competitive basis suggests
that researchers are deemed able to compete for such funding, and can do this to the extent
that institutional stability is possible, making large amounts of block funding no longer
essential.
Immediate outputs for priority 1 yielded only a small number of possible indicators.
Nevertheless, the ability of researchers to secure funding and the presence of increased
competitive funding signify improvements in the research system. Combined with reliable
and robust indicators to measure these aspects, the share of national GBOARD is a
reasonable option.
There are several potential outcome/impact indicator options:
■ trademarks as a per cent of GDP;
■ number of patents per total public R&D expenditure; and
■ revealed technological advantage in selected fields (e.g. bio- and nanotechnology, ICT
and environment).
The last indicator is a closed measure of the impact of actions taken in R&D. But
establishing a causal link between the input and impact is difficult. ‘Number of patents per
total public R&D expenditure’ was selected as the preferred indicator for measuring
efficiency of public spending for innovation output. The final selection of indicators for ERA
priority 1 is summarised in Table 3.1.

Assessment of progress in achieving ERA - Final Report
2 April 2015 14
Table 3.1 Priority 1 – proposed indicators
Type Indicator Data source Comments/ explanation
Input Total GBAORD as
per cent of GDP
OECD Main
Science and
Technology
Indicators,
Eurostat
Good overall indicator of the resources allocated to
research, taking into consideration the different sizes
of individual MS.
Available annually, time series, one-year or two-year
time lag.
Output Share of national
GBOARD allocated
through project-
based funding (as
opposed to
institutional
funding)
ERA Survey
Project-based funding is an accepted means by
which to generate competition among researchers
and improve overall quality and productivity.
Collected in the ERA Survey 2014; inclusion in all
future ERA Surveys likely.
Outcome/
Impact
Number of patents
per total public
R&D expenditure
Eurostat
Measures efficiency of public spending for innovation
output. Good measure of effectiveness.
Available since 2000 (available as a single indicator
until 2009, both components still available
separately), regularly updated.
3.2.2 Data collection needs and opportunities
The analysis has not highlighted any immediate data collection needs for priority 1, although
the selected output indicator highlights that continuation of the ERA survey in some
(simplified) form is important to ensure the availability of indicators. At present there are
suitable input, output and outcome/impact indicators, which are relevant to all specific
actions. All of the indicators identified as relevant to the priority objectives are robust.
Two indicators assessed relate to research evaluations:
■ share of national institutional funding allocated based on institutional assessments; and
■ share of block and institutional funding allocated using performance-based criteria, as
share of national GBAORD.
A country’s use of performance-based research funding systems could be a useful subject
theme for an indicator to assess ERA priority 1. But there are many limitations that need to
be considered, including:
■ Not all research evaluations are institutional: some countries (such as the United
Kingdom (UK)) distribute a large share of institutional funding through evaluations, but
evaluation is conducted at the level of the discipline, not the institution.
■ Some countries (especially Nordic countries) have sophisticated and regular evaluations
of both fields and institutions, but do not base much if any of their funding decisions on
these evaluations. Nevertheless, the evaluations are useful in terms of quality control
and identification of research strengths and priorities. An indicator should ideally capture
such endeavours, or at least not make them appear insignificant.
■ Whilst there is broad consensus that some degree of performance based institutional
funding is helpful in terms of achieving better and more targeted outcomes in the
research system, there is little evidence to suggest that the extent of positive outcomes
is dependent on the amount or share of funding distributed in this way: some degree of
non-performance based funding can be critical to ensuring long-term stability of
institutions. This is especially important for institutions wishing to plan long-term research
endeavours, as well as institutions with substantial teaching duties.

Assessment of progress in achieving ERA - Final Report
2 April 2015 15
Ultimately, there is a potential need to design an indicator capable of capturing information
on research evaluation and assessment-driven funding allocation. But the complexity of the
subject matter, as well as the diversity of both institutions and assessment and evaluation
mechanisms make this a formidable task. In the ideal case, qualitative investigation into
individual Member State research assessment models may be preferable to a numerical
indicator, but notwithstanding this, currently available indicators do not offer a suitably robust
compromise.
3.3 Priority 2 - indicator assessment
Twenty indicators were identified and appraised for ERA priority 2, ‘Optimal transnational
cooperation, competition and research infrastructures’ (see Annex 8, section A8.3). The two
main data sources are the OECD Science, Technology and Industry Scoreboard and the
ERA Survey. Member State coverage and data reliability are advantages of the OECD
databases. Possible indicators based on the ERA Survey could provide more specific
information related directly to intra-EU activities aimed at greater integration and
cooperation.
The ERA Survey is an especially valuable source for inputs indicators. The degree to which
Member States participate in the European Strategy Forum on Research Infrastructure,
expressed in the survey as participation in at least one of the research infrastructures (RIs)
identified by ESFRI, provides useful insight into this particular aspect of ERA.
The best available output indicator for this priority is the share of public funding allocated to
transnational R&D cooperation, which is collected by Eurostat. The ‘true’ figure of funding
used in transnational R&D may well be much higher than what is reported, however, since
many research projects may have transnational dimensions even though the funding was not
explicitly allocated with such a condition attached. But identifying the full amount of R&D
funding used in transnational endeavours requires information from funders that is potentially
confidential. Given this difficulty, it is preferable to opt instead for the share of funding
explicitly allocated for transnational work, as this is a readily available figure, and reflects not
only the extent of transnational activity, but also highlights the efforts made (in terms of
resource provision) to create more transnational cooperation.
The OECD commissions several useful outcome/impact indicators that are reliable, cover
most Member States and provide time series data. Their design does not focus specifically
on monitoring ERA-related priorities but the overall effects of international cooperation
overlap well with the desired results of ERA priority 2, so OECD data can be used here,
particularly through the following indicators:
■ impact of internationally mobile scientists, inflows versus outflows;
■ international collaboration in science and innovation;
■ cross-border ownership of patents;
■ technology balance of payments as a per cent of GDP; and
■ international technology flows of royalties and licence fees.
Cross-border ownership of patents has been chosen as the preferred indicator. It captures
the degree to which Member States collaborate internationally in developing technology and
innovation. The OECD Science, Technology and Industry Scoreboard is a basic reference,
but the OECD statistics and European Patent Office (EPO) statistics are more suitable
alternative sources for exploring this type of indicator. ‘International collaboration in science
and innovation’ is another viable measure, though a more specific aspect, such as patent
ownership relates better to private as opposed to public R&D. The alternative would give a
more general picture that would also be influenced by strictly blue-sky research. The
preferred indicator between these two could not be identified in this analysis.

Assessment of progress in achieving ERA - Final Report
2 April 2015 16
With respect to research infrastructures, available sources do not offer enough data to
assess impact on the economy and society. The ESFRI proposal referenced ‘Indicators of
pan-European relevance to research infrastructures’ and the ESFRI expert group on
indicators developed a toolkit for the evaluation of the pan-European relevance of ESFRI
roadmap projects and future candidate entries (Rossi, 2013). Some of the indicators are
newly constructed and their usefulness depends on data availability, which often requires
new data collection within research organisations. When their availability and the frequency
of data collection are established, these could be considered for future ERA monitoring
activities.
Table 3.2 Priority 2 – proposed indicators
Type Indicator Data source Comments/ explanation
Input Per cent of MS
participating in the
development of at least
one of the RIs
identified by ESFRI
ERA Survey Useful indicators because the ERA Survey is
tailored to assess ERA progress.
Included in ERA Survey; inclusion in future ERA
Surveys likely.
Output Share of public funding
allocated to
transnational R&D
cooperation
Eurostat This indicator provides a measure both of the
resources explicitly allocated for transnational
cooperation, and gives an indication of the
minimum degree of transnational R&D (the ‘real’
figure being potentially higher).
Available through Eurostat. Data collected since
2007, latest data from 2012.
Outcome Cross-border
ownership of patents
OECD
Science,
Technology
and Industry
Scoreboard
Useful indicator for this priority because it
captures international innovation aspects.
Available annually.
Priority 2 does however present a special case, in that its breadth invites a wider selection of
indicators. It has furthermore been split into two sub-priorities, relating respectively to
transnational cooperation and ESFRI. Whilst the above table presents the final selection of
indicators, the inventory of possible indicators may also be used to cover the two sub-
priorities separately, as presented in Table 3.3.

Assessment of progress in achieving ERA - Final Report
2 April 2015 17
Table 3.3 Priority 2 – proposed indicators along sub-categories
Type Indicator Data source Comments/ explanation
Input ESFRI:
Per cent of MS
participating in the
development of at least
one of the RIs
identified by ESFRI
Transnational
cooperation:
Degree to which MS
engage in
transnational
cooperation via an EU
framework programme
ERA Survey
ERA Survey
Useful indicator because the ERA Survey is
tailored to assess ERA progress.
Included in ERA Survey; inclusion in future ERA
Surveys likely.
Highlights the extent to which the framework
programme is drawn upon to achieve greater
transnational cooperation
Included in ERA Survey; inclusion in future ERA
Surveys likely.
Output ESFRI:
Per cent of research
performers
experiencing problems
accessing RIs
Transnational
cooperation:
Share of public funding
allocated to
transnational R&D
cooperation
ERA Survey
Eurostat
Highlights the extent to which access to research
infrastructures is facilitated in individual MS. Note:
on this indicator, lower values will indicate
preferable scores.
Included in ERA Survey; inclusion in future ERA
Surveys likely.
This indicator provides a measure both of the
resources explicitly allocated for transnational
cooperation, but also gives an indication of the
minimum degree of transnational R&D (the ‘real’
figure being potentially higher)
Available through Eurostat. Data collected since
2007, latest data from 2012.
Outcome ESFRI:
Number of
implementation phase
ESFRI projects in
which each MS is a
partner
Transnational
cooperation:
Cross-border
ownership of patents
ERA Expert
group (Data
available
through
ESFRI)
OECD
Science,
Technology
and Industry
Scoreboard
Highlights overall success in MS participation in
ESFRI.
Included in ERA Survey; inclusion in future ERA
Surveys likely.
Useful indicator for this priority because it
captures international innovation aspects.
Available annually.
3.3.2 Data collection needs and opportunities
The indicator appraisal for this priority area has yielded several indicators that could be used
immediately for monitoring, but the analysis has also highlighted some data collection needs,
due to the fact that some potentially useful indicators have been suggested by the ERA
expert group, but the necessary data are not collected systematically.
■ Share of national public funding for R&D transnationally co-ordinated, expressed as a
percentage of the GBOARD.
The share of national funding for which the condition of transnational coordination
applies is likely to be small, and subject to many external factors. But the involvement of
non-national research agencies / partners in the framing of national research priorities
provides a useful indication of the extent to which a country is outward-looking and

Assessment of progress in achieving ERA - Final Report
2 April 2015 18
receptive to international perspectives and priorities. Depending on the exact definition,
measurements related to this theme could either contribute to input or output indicators.
Involvement of non-national research agencies represents an area for further discussion.
■ Share of the national GBAORD invested in the construction and operation of research
infrastructures listed on the ESFRI roadmap.
This is a good example of measuring EU added value and a very relevant input indicator.
The EU has a long history of developing international research infrastructure, and with
the increasing importance of large and costly facilities in the majority of research fields
this tradition is likely to intensify. Relevant data have been collected previously through
the ERA Survey, but only three Member States provided estimates. Further efforts would
be needed to gather more complete data.
■ Amount and share of joint research agenda initiatives that address grand challenges and
are subject to common ex post evaluation.
This indicator would highlight a key aspect of collaboration, whilst also demonstrating the
level of importance of research activities in relation to current social and political issues.
But data are not currently collected for this indicator. A robust definition of ‘relevance to
grand challenges’ must be agreed to avoid different interpretations.
■ Share of national GBAORD allocated to transnationally coordinated research based on
grand challenges.
This could be a valuable indicator related to Member States’ overall expenditure. A
common definition of relevance to grand challenges must be agreed.
3.4 Priority 3 - indicator assessment
This ERA priority is particularly challenging to monitor because the concept of an open
labour market is multi-faceted, encompassing national and transnational movement between
research institutions, between research and industry, and several other dimensions
contained for instance in the European Code of Conduct for the Recruitment of Researchers.
The five distinct actions under this priority illustrate its breadth. Seventeen indicators were
identified and appraised for this priority area (see Annex 8, section A8.4).
The percentage of research funding available for mobility scholarships and stipends of total
research funding is the preferred input indicator, as it reflects resources invested to achieve
this priority and is reliably collected through the MORE2 survey.
There are two suitable choices for output indicators, which address fundamentally distinct
issues.
■ The number of researcher posts advertised through EURAXESS by Member State could
serve as a useful indicator. There are currently some limitations to this, which are
discussed below.
■ The share of research organisations that have been acknowledged by the Commission’s
Human Resources (HR) Excellence in Research award. This indicator would especially
reflect institutional awareness and openness.
There are several potential outcome/impact indicators, although each one focuses on a
different but important aspect of an open labour market. Time spent abroad and outside of
academic institutions could be combined as a composite indicator. But the most robust
figures are collected by different organisations that use different data collection approaches.
The degree of international mobility of researchers is a good indicator of an open labour
market. As such, the proportion of doctoral candidates with citizenship from another EU
Member State has been chosen as the preferred outcome/impact indicator for priority 3. The
indicator shows researcher mobility within the EU at an early career stage. As such, it is a
proxy for attractiveness of individual Member State research systems, the presence of

Assessment of progress in achieving ERA - Final Report
2 April 2015 19
mechanisms capable of attracting non-national EU researchers, and the extent of mobility at
this career stage. Data to construct this indicator are available, and it has been suggested for
inclusion in the IU scoreboard and is supported by DG RTD. Eurostat’s data on researchers
working in the business sector is a plausible alternative. Both options are considered in
Table 3.4.
Table 3.4 Priority 3 – proposed indicators
Type Indicator Data source Comments/ explanation
Input Per cent of funding
available for mobility
scholarships and
stipends out of the
total funding for
research
MORE2,
JRC
The indicator gives an overview of the relative
degree of spending for mobility, but it might be
difficult to identify the sources and collect the data.
Updated annually.
Output Share of
organisations with
EC HR Excellence in
Research
Acknowledgement
EC Website,
JRC
This indicator highlights acknowledgement of efforts
to ensure progress related to several actions of
priority 3
Updated with high regularity.
Outcome/
Impact
Proportion of doctoral
candidates with a
citizenship of another
EU MS
Alternative:
Researchers working
in the business
sector
IU
Scoreboard
(pending)
Eurostat
The share of non-national doctoral candidates as a
percentage of all doctoral candidates serves as a
useful indicator of the openness and attractiveness
of a research system.
Updated annually or every two years.
This alternative indicator highlights outcomes at a
different and important level of mobility and open
labour markets
Updated regularly
3.4.2 Data collection needs and opportunities
The ERA expert group has identified the share of job offers within the national public
research system published on EURAXESS or equivalent websites as a potential output
indicator. This was noted above as a highly relevant indicator, but there are some concerns
with the indicator which would need to be addressed:
■ Whilst numbers of jobs advertised through EURAXESS are recorded for individual
countries, there is a serious problem of adjustment. The Researchers' Report for
EURAXESS Jobs (2014) has constructed an indicator adjusting for size of Members
States research systems: ‘Researcher posts advertised through the EURAXESS Jobs
portal per thousand researchers in the public sector’. But whilst this provides one critical
level of adjustment, it does not reflect different recruitment patterns and frequencies in
different countries: for example, systems that typically have more short-term contracts
and fewer tenured positions may score higher. In order to adjust for this, it would be
necessary to express the number of EURAXESS postings not per thousand researchers,
but as a share of overall appointments to new posts.
■ Additionally, some Member States might have their own commonly used portals for
advertising research posts (e.g. the UK’s www.jobs.ac.uk), whilst other might not. The
scale of this issue is unclear at this point, but it may lead to problematic results.
■ Although advertising job posts is an important aspect of an open labour market, open
publication of appointments is not equivalent to appointments being decided based on
merit.

Assessment of progress in achieving ERA - Final Report
2 April 2015 20
An additional limitation for this indicator is that it only relates to the public sector, whilst the
ERA objectives are multi-sectoral. Nevertheless, EURAXESS is a valuable resource that
could be drawn on in future to better inform progress on ERA priority 3 if used in concert with
other metrics.
An additional possible data collection need relates to the importance of joint research for
mobility, which is noted throughout the literature, and begins as early as doctoral training
(EC, 2011b). As such, the share of joint projects or publications encompasses opportunities
for greater mobility and openness in several different inter-institutional contexts. Vertesy and
Tarantola (2012) suggest the possibility for targeted indicators on co-publication, to be drawn
from data sources such as Scopus. This would be a major data collection project, but could
ultimately contribute to a better understanding of where cross-institutional co-publication
occurs.
3.5 Priority 4 - indicator assessment
The objective of priority 4 is to achieve greater gender equality (in terms of socio-economic
circumstances and equal opportunity) and gender mainstreaming. Specific objectives include
creating a supportive legal and policy environment, removing legal and other barriers to the
recruitment, retention and career progression of female researchers and addressing gender
imbalances, and ensuring that at least 40 per cent of participants in recruitment/career
progression decisions are women. The objective of gender mainstreaming is to strengthen
the gender dimension in research programmes.
The study team appraised 20 indicators in this priority area (see Annex 8, section A8.6).
There are disproportionately more indicators related to gender balance than to
mainstreaming primarily because gender mainstreaming is a more qualitative concept,
referring to the content and scope of research, as well as to gender representation in
managerial and evaluator positions, whose status and functions differ significantly between
Member States, unlike more standard academic roles. As such, indicators on gender
balance are significantly more robust, whilst numerical measurement of gender
mainstreaming requires further deliberation.
The She Figures reports published by the European Commission provide a valuable source
of gender statistics in the area of research and innovation. She Figures build on several data
sources including Eurostat, Statistics on Income and Living Conditions (SILC), and
International Labour Organisation (ILO) data.
The first choice of input indicator under ERA priority 4 is the proportion of female PhD
graduates according to the International Standard Classification of Education (ISCED 6).
This indicator reflects the degree to which there is a gender-balanced pool of job market
candidates, and whether gender balance is something that Member States are able to
facilitate from the point of early career development onwards. The indicator is revised
annually and is available for all Member States. An alternative indicator is the number of
applicants and beneficiaries of research funding by gender.
There are several output indicators that can be considered, which reflect gender balance in
the academic workforce:
■ proportion of female academic staff;
■ share of female researchers on temporary contracts vs. non-temporary contracts across
career paths;
■ distribution of researchers in the higher education sector, by sex and age group; and
■ distribution of researchers across sector, by sex.
The output indicator selected by the study team is the proportion of female academic staff.
The indicator is based on data that all Member States are able to provide and gives an
overall snapshot of the extent to which gender balance is achieved across academic grades.

Assessment of progress in achieving ERA - Final Report
2 April 2015 21
Whilst promotion of gender equality and greater numbers of female PhD students might
result in the immediate output of better gender balance across the sector, these data may
hide certain forms of discrimination, for example, gender imbalances amongst senior staff.
As a result, the proportion of women in grade A (professor) positions has been chosen as
the preferred outcome/impact indicator.
The final selection of indicators for ERA priority area 4 are summarised in Table 3.5. The
data quality for the stated sources is still improving, but close to being comprehensive.
Furthermore, their focus is on the HEI sector. Nevertheless, the chosen indicators represent
the most robust and relevant selection of the available options.
Table 3.5 Priority 4 – proposed indicators
Type Indicator Data source Comments/ explanation
Input Proportion of
female PhD
(ISCED 6)
graduates
She Figures (2013)
based on Eurostat -
Education Statistics
(online data code:
educ_grad5);
Italian Ministry of
Education (IT -
MIUR) (2009-2010)
The indicator reflects the degree to which there is
a gender imbalance in the distribution of PhD
graduates.
The indicator should be used in concert with other
indicators to give a complete picture of ERA
priorities (e.g. actual employment of female
researchers after graduation).
The data is available for all MS.
Annual data
Output Proportion of
female
academic staff
She Figures, based
on data from WiS
database (DG
RTD)
This indicator reflects gender balance in the
academic workforce. Data are missing for some
MS.
Data collected every three years
Outcome/
Impact
Proportion of
women in grade
A (professor)
positions.
She Figures Degree of gender balance in the distribution of
researchers in the workforce. Data available for
most MS.
Data collected every three years
3.5.2 Data collection needs and opportunities
Data collection initiatives such as She Figures provide robust indicators for this priority area.
But the majority of available indicators relate predominantly to gender balance. In this area
there are no further data collection needs.
But while gender balance can be reported through the use of numerical indicators, it is more
challenging to identify indicators that reflect gender mainstreaming, which refers to the
content and scope of research and research programmes, as well as the gender balance of
those involved in their design. One suggested indicator is the proportion of funding allocated
for projects that integrate gender aspects into science and technology research (also known
as gender mainstreaming the science / gender dimension in research content). This indicator
highlights gender awareness amongst researchers. But data are not collected for this
indicator. There are additional challenges with using this indicator such as how to define the
integration of gender aspects into research. There might be several different forms this might
take, and it might occur to different extents that could not be robustly quantified. There is
also likely to be considerable variation in the opportunities to include the gender dimension
across different research fields.
3.6 Priority 5 - indicator assessment
Fifteen indicators were appraised for ERA priority area 5 (see Annex 8, section A8.6). Four
of these indicators do not have any available datasets; these are discussed in section 3.6.2.

Assessment of progress in achieving ERA - Final Report
2 April 2015 22
The preferred input indicator is the share of funders funding open access to publications.
Data for this indicator are collected through the ERA survey and provide insight into how
open access is being pursued and the extent to which funders are putting resources in place
to ensure greater availability of research to wider stakeholders. As open access publication
is not yet as systematised as research through traditional publication channels, output and
wider impact indicators on, for example, availability or use of open access publications are
inherently problematic.
The appraisal identified R&D in HEIs / PROs funded by business as the preferred output
indicator. This indicator is a monetary measure of business interests according to the R&D
they perform and fund in the higher education sector (HERD) and the government sector
(GOVERD). The data for this indicator are robust and available as a time series through
Eurostat. But this indicator does not make a distinction between large and small firms, and
the capacity of large firms to fund R&D in HEIs and PROs is much greater than that of small
firms. Additionally, the data do not distinguish between the degree of cooperation between
firms funding R&D in HEIs / PROs.
Seven outcome / impact indicators were identified for this priority area, two of which could be
used in a future monitoring framework. These indicators are ‘firms co-operating with HEIs’
and ‘firms co-operating with PROs’. They represent reasonable proxies for private firms’
propensities to work with HEIs and PROs, respectively. But while these are useful indicators,
the data do not distinguish between large and small firms, and large firms are more likely to
cooperate with HEIs and PROs than small firms due to their R&D capacities. Available data
do not enable a distinction between the level and extent of cooperation (Finne et al., 2011).
The preferred outcome / impact indicator in this priority area is the number of public-private
co-publications per million of the population, which is a proxy for public-private research
linkages and active collaboration activities between business sector researchers and public
sector researchers. This indicator combines data from two sources: the Centre for Science
and Technology Studies (CWTS), Leiden University (Thomson Reuter) and Eurostat. This
indicator is particularly useful for looking at outcomes / impacts because it addresses two of
the main challenges of this priority area. The first of these is effective knowledge transfer,
which is expected to contribute towards open innovation and the second, open knowledge
transfer between the public and private sector. There are two issues with this indicator,
however. First, the definition of private sector used in this context does not include private
medicine or the health sector and second, publications are assigned to the country /
countries in which the business or other private sector organisations are located and not
where the public sector organisation / institution is located (OECD, 2014b).
Table 3.6 Priority 5 – proposed indicators
Type Indicator Data source Comments/ explanation
Input Share of funders
funding open
access to
publications
ERA Survey Open access publication is an essential component
of ensuring circulation, access to and transfer of
knowledge.
Included in ERA Survey; future inclusion highly likely.
Output R&D in HEIs /
PROs funded by
business
Eurostat Robust and reliable data source. Provides an
indication of the extent of public-private collaboration.
Latest data 2012.
Outcome/
Impact
Public / private co-
publication per
million of the
population
CWTS
(Thomson
Reuter) and
Eurostat
Data collection methods are reliable and robust.
Indicator addresses several challenges highlighted in
this priority area, and represents public-private
collaborations.
Latest data 2014. Regular updates through Eurostat.

Assessment of progress in achieving ERA - Final Report
2 April 2015 23
As is the case with priority 2, priority 5 is also especially broad and has been divided into two
sub-priorities: open access and knowledge transfer. However, in this case, the data
collection needs are so extensive that it is impossible to propose a robust and complete
alternative matrix of indicators to deal with both sub-priorities separately. The problem arises
in relation to open access specifically. Data collection needs in this area are discussed
below. Table 3.7 presents an alternative matrix that fully addresses the sub-priority on
knowledge transfer, but shows where data collection needs for open access are currently
required.
Table 3.7 Priority 5 – proposed indicators along sub-categories
Type Indicator Data source Comments/ explanation
Input Open Access:
Share of funders
funding open
access to
publications
Knowledge
transfer:
Share of
organisations that
has or uses a
structure for
knowledge transfer
activities
ERA Survey
ERA Survey
Open access publication is an essential component
of ensuring circulation, access to and transfer of
knowledge.
Included in ERA Survey; future inclusion highly likely.
Indicates the resources available to engage in KT
activities.
Included in ERA Survey; future inclusion highly likely.
Output Open Access:
Data collection
needed
Knowledge
transfer:
R&D in HEIs /
PROs funded by
business
n/a
Eurostat
n/a
Robust and reliable data source. Provides an
indication of the extent of public-private collaboration.
Latest data 2012.
Outcome/
Impact
Open Access:
Data collection
needed
Knowledge
transfer:
Public / private co-
publication per
million of the
population
n/a
CWTS
(Thomson
Reuter) and
Eurostat
n/a
Data collection methods are reliable and robust.
Indicator addresses several challenges highlighted in
this priority area, and represents public-private
collaborations.
Latest data 2014. Regular updates through Eurostat.
3.6.2 Data collection needs and opportunities
Whilst there are suitable indicators available to measure progress on ERA priority 5, there
are also data collection needs for some actions.
First, there is a gap with regard to indicators related to the ERA actions under this priority
area. Priority 5 is composed of four actions: open access to publications, open innovation
and knowledge transfer between the public and private sector, harmonising policies for
public e-infrastructures, and uptake of federated electronic identities. The available indicators
broadly cover the first three actions. But there are currently no indicators which address
uptake of federated electronic identities. The topic of digital unique researcher identification,
as well as a federated system common to all Member States is likely to become more

Assessment of progress in achieving ERA - Final Report
2 April 2015 24
important, as proper attribution of work to researchers is essential for research assessment
exercises. There is a need to consider how progress on this might be measured and who is
best suited to undertake the necessary data collection.
There are also indicators that could be used in this priority area, but for which data are not
currently collected. This primarily relates to indicators on open access publication:
■ Number and share of national research performing organisations with mandatory policies
for open access to and preservation of scientific information (EC, 2013c).
This indicator would provide a good measure of the first action under priority 5. The
number and share of institutions with mandatory open access policies could be provided
by Member States. A clear definition of the form and substance of these policies would
be required.
■ Share of open access publications compared to total output of Member States (EC,
2013c).
National and international open access repositories and national statistics on scientific
publications could be combined and drawn on to produce this indicator. Since open
access publication is still a relatively new activity, there is a question as to whether this
would capture all open access journals. Open access repositories are updated on a
regular basis and often provide statistical information. National statistics on scientific
output are available in most Member States although there is some variation, so this
indicator may be restricted to Member States that publish national statistics on scientific
publications.
A further point worth highlighting on the issue of open access publication is the difference
between gold and green open access, which respectively refers to whether or not
researchers are charged money for their work to be published. In the ‘gold’ standard model
these costs can be prohibitive, and effectively shift the access cost from user to producer of
the research. Archambault et al (2014) conducted a study touching on this subject, which
could provide a starting point for regular data collection in the future.
There are two further indicators that warrant consideration:
■ Number and share of research performing organisations with interoperable and
federated repositories (EC, 2013c).
This would be a useful indicator to capture progress on action 3. Once again, this should
be an un-problematic metric for Member States to provide, although a clear definition of
an interoperable and federated repository would need to be agreed upon. This could be
done in the form of a shortlist of specific systems in use.
■ Share of research and development budget financed by the private sector.
This indicator was suggested by DG RTD for consideration in this study, and would help
to show the extent of transfer between the research and private sectors. Data for this can
be provided by the ERA Survey. But it is difficult to express private sector investment as
a share of the overall R&D budget: reduced government investment would artificially
increase this indicator and, conversely, additional government investment in R&D would
decrease it. An alternative way of looking at private sector R&D financing would need to
be considered to address this problem.
3.7 International Dimension Outside ERA (Priority 6) - indicator assessment
Eight indicators were assessed for this cross-cutting priority area on international dimensions
outside ERA (see Annex 8, section A8.7).
The ERA survey collects data on the share of public R&D allocated to collaborative
programmes with third countries. This input indicator is recommended because it provides a
clear idea of resources invested in international collaboration.
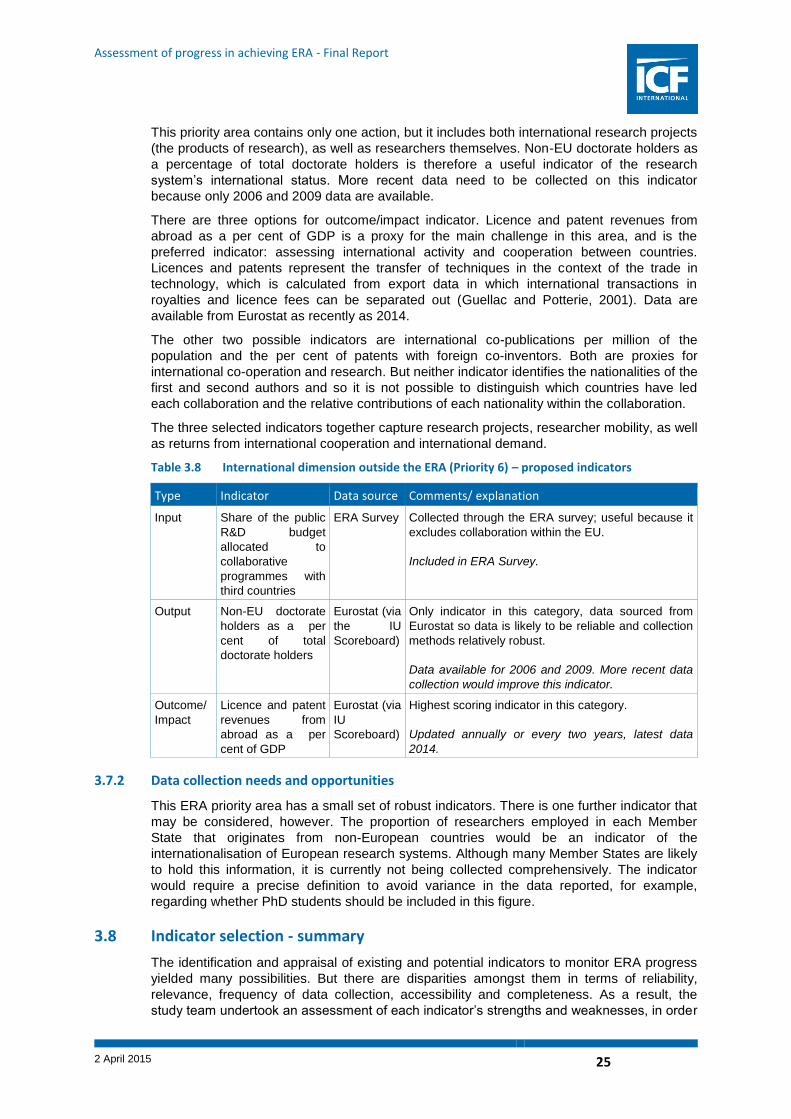
Assessment of progress in achieving ERA - Final Report
2 April 2015 25
This priority area contains only one action, but it includes both international research projects
(the products of research), as well as researchers themselves. Non-EU doctorate holders as
a percentage of total doctorate holders is therefore a useful indicator of the research
system’s international status. More recent data need to be collected on this indicator
because only 2006 and 2009 data are available.
There are three options for outcome/impact indicator. Licence and patent revenues from
abroad as a per cent of GDP is a proxy for the main challenge in this area, and is the
preferred indicator: assessing international activity and cooperation between countries.
Licences and patents represent the transfer of techniques in the context of the trade in
technology, which is calculated from export data in which international transactions in
royalties and licence fees can be separated out (Guellac and Potterie, 2001). Data are
available from Eurostat as recently as 2014.
The other two possible indicators are international co-publications per million of the
population and the per cent of patents with foreign co-inventors. Both are proxies for
international co-operation and research. But neither indicator identifies the nationalities of the
first and second authors and so it is not possible to distinguish which countries have led
each collaboration and the relative contributions of each nationality within the collaboration.
The three selected indicators together capture research projects, researcher mobility, as well
as returns from international cooperation and international demand.
Table 3.8 International dimension outside the ERA (Priority 6) – proposed indicators
Type Indicator Data source Comments/ explanation
Input Share of the public
R&D budget
allocated to
collaborative
programmes with
third countries
ERA Survey Collected through the ERA survey; useful because it
excludes collaboration within the EU.
Included in ERA Survey.
Output Non-EU doctorate
holders as a per
cent of total
doctorate holders
Eurostat (via
the IU
Scoreboard)
Only indicator in this category, data sourced from
Eurostat so data is likely to be reliable and collection
methods relatively robust.
Data available for 2006 and 2009. More recent data
collection would improve this indicator.
Outcome/
Impact
Licence and patent
revenues from
abroad as a per
cent of GDP
Eurostat (via
IU
Scoreboard)
Highest scoring indicator in this category.
Updated annually or every two years, latest data
2014.
3.7.2 Data collection needs and opportunities
This ERA priority area has a small set of robust indicators. There is one further indicator that
may be considered, however. The proportion of researchers employed in each Member
State that originates from non-European countries would be an indicator of the
internationalisation of European research systems. Although many Member States are likely
to hold this information, it is currently not being collected comprehensively. The indicator
would require a precise definition to avoid variance in the data reported, for example,
regarding whether PhD students should be included in this figure.
3.8 Indicator selection - summary
The identification and appraisal of existing and potential indicators to monitor ERA progress
yielded many possibilities. But there are disparities amongst them in terms of reliability,
relevance, frequency of data collection, accessibility and completeness. As a result, the
study team undertook an assessment of each indicator’s strengths and weaknesses, in order

Assessment of progress in achieving ERA - Final Report
2 April 2015 26
to select those best suited for ERA monitoring. Furthermore, given the breadth of each ERA
priority area and the actions within them, indicator choices were calibrated to reflect progress
in relation to all actions, where possible.
3.8.1 Selected input, output and outcome/impact indicators by priority area
Table 3.9 presents the final selection of input, output and outcome/impact indicators for each
of the ERA priorities. Each indicator is collected and updated with some degree of regularity
and is available from accessible and reliable sources. As such, the indicators selected
represent an indicator suite that can be used by a range of stakeholders to obtain a basic
overview of progress across priorities.
Table 3.9 Selected input, output and outcome/impact indicators by priority area
Priority Input Indicator Output Indicator Outcome/ Impact Indicator
Priority 1: more
effective national
research systems
Total GBAORD as a per
cent of GDP (OECD)
Share of national
GBOARD allocated
through project-based
funding (as opposed to
institutional funding)
(ERA Survey)
Number of patents per
total public R&D
expenditure (Eurostat)
Priority 2: optimal
transnational
cooperation and
competition
Per cent of MS
participating in the
development of at least
one of the RIs identified by
ESFRI (European
Research Area and
Innovation Committee
(ERAC))
Share of public funding
allocated to
transnational R&D
cooperation (Eurostat)
Cross-border ownership of
patents (OECD)
Priority 3: Open
Labour Market for
Researchers
Per cent of funding
available for research
mobility scholarships and
stipends of the total
funding for research
(MORE2, JRC)
Share of research
organisations with EC
HR Excellence in
Research
Acknowledgement (EC
web site, JRC)
Proportion of doctoral
candidates with a
citizenship of another EU
MS (IU Scoreboard,
pending)
Alternative: Researchers
working in the business
sector (Eurostat)
Priority 4: Gender
equality and
gender
mainstreaming in
research
Proportion of female PhD
(ISCED 6) graduates (She
Figures, based on
Eurostat)
Proportion of female
academic staff (She
Figures, based on data
from WiS database)
Proportion of women in
grade A (professor)
positions (She Figures)
Priority 5: Optimal
access to and
circulation and
transfer of scientific
knowledge
Share of funders funding
open access to
publications (ERA Survey)
R&D in HEIs / PROs
funded by business
(Eurostat)
Public / private co-
publication per million of
the population (CWTS and
Eurostat)
International
dimension outside
ERA (Priority 6)
Share of the public R&D
budget allocated to
collaborative programmes
with third countries (ERA
Survey)
Non-EU doctorate
holders as a per cent
of total doctorate
holders (Eurostat via
the IU Scoreboard)
Licence and patent
revenues from abroad as
a per cent of GDP
(Eurostat via the IU
Scoreboard)
This indicator suite is capable of highlighting whether for each ERA priority there is evidence
of resources being made available to achieve it (input), immediate observable results of such
efforts (outputs), and wider improvements that match the fundamental goals of each priority

Assessment of progress in achieving ERA - Final Report
2 April 2015 27
(outcomes/ impacts). The following points should be considered in the interpretation and
usage of the indicator suite.
■ Across inputs, outputs and outcomes / impacts there is no direct linear progression.
Doing so would involve having separate sets of input-output-outcome / impact indicators
for each action within each priority area (equalling a total of 57 indicators), but the
available indicators generally do not provide scope for this type of approach.
■ For some indicators, ‘more’ does not necessarily equal ‘better’. As such, the optimum
value for Members States to achieve is not necessarily 100 per cent. Setting targets for
each indicator is not within the scope of this study, but suitable targets need to be
decided upon for some indicators (e.g. all indicators for priority 4, input and output
indicators for priority 1).
■ For several indicators, especially those in priority areas 2 and 6, factors such as size,
native language or location of Member States can yield a natural advantage or
disadvantage. Whether to establish ways of controlling for these (e.g. through different
‘optimum’ scores) or to accept these differences as given in a large number of indicators
is an issue worth considering.
3.8.2 Indicator selection – one indicator per priority area
It is possible in principle to reduce the three selected indicators per priority to one. To ensure
consistency between the priority areas, these should be either the six input, output or
outcome / impact indicators. The outcome / impact indicators are recommended for
monitoring ERA progress because a lack of progress on any of them would suggest that
ERA-related policies and initiatives may not be having their desired effect and warrant further
investigation. The final set of selected indicators is provided in Table 3.10.
Table 3.10 Indicator selection – one indicator per priority area
Priority Indicator
Priority 1: more effective national research
systems
Number of patents per total public R&D
expenditure
Priority 2: optimal transnational cooperation and
competition
Cross-border ownership of patents
Priority 3: Open Labour Market for Researchers Proportion of doctoral candidates with citizenship
of another EU MS
Alternative: Researchers working in the business
sector
Priority 4: Gender equality and gender
mainstreaming in research
Proportion of women in grade A (professor)
positions
Priority 5: Optimal access to and circulation and
transfer of scientific knowledge
Public / private co-publication per million of the
population
International dimension outside ERA (Priority 6) Licence and patent revenues from abroad as a
per cent of GDP
Though this approach is straightforward and user-friendly, such a minimalist selection of
indicators is problematic because it is difficult to represent progress on what are very broad
ambitions by reference to a single, narrow indicator. For example, selecting input, output and
outcome / impact indicators for each priority area can provide insight into whether resources
have been invested in each priority, benefits are observable and elements of wider impacts
are observable, resulting in an overall ability to assess effectiveness in fulfilling ERA
priorities. Limiting indicators creates difficulties in terms of attributing positive effects to
efforts made. As such, the one outcome / impact indicator per ERA priority represents the

Assessment of progress in achieving ERA - Final Report
2 April 2015 28
minimum possible selection, but a set of three indicators across inputs, outputs and
outcomes / impacts per priority provides greater insight into ERA progress.
3.8.3 Data collection needs and opportunities
The analysis conducted of indicators across ERA priorities demonstrated that Eurostat,
OECD, the IU Scoreboard, She Figures, MORE2, and the ERA Survey provide information
that can be used for ERA progress monitoring. There are gaps in some areas but these do
not suggest the need for entirely new data collection exercises. The study team has
highlighted data collection needs across each priority area. This is primarily a task of refining
the ERA Survey, and working on approaches to achieve better response rates on specific
questions. This also includes the need for other sources to obtain data on some indicators
more regularly, as is the case with non-EU doctorate holders through Eurostat. With a full set
of complete and comprehensively updated data, composite indicators may be a future
possibility, but ultimately the variation among available indicators highlighted in this study
does not suggest this is currently a realistic option.

Assessment of progress in achieving ERA - Final Report
2 April 2015 29
4 The role of national roadmaps in achieving the ERA
Member States vary in their levels of ERA attainment, ambitions and resources, and in the
research systems’ scale and structure. National roadmaps that set country-specific paths to
ERA, and which define milestones and timelines, have a potentially important role in the
ERA monitoring framework. This task provides an assessment of that role and how
roadmaps could complement other components of the ERA monitoring system. The analysis
considered aspects of the roadmap specification relevant to the terms of reference. This
includes goal-setting, reporting (including report structure) and review processes.
This section sets out and reviews current efforts to design and implement national roadmaps
for achieving ERA objectives. It sets out the current political framework at EU level,
describes efforts and ambitions of national roadmaps and activities at Member State level
and suggests options to make the development of national roadmaps an integral part of the
ERA monitoring mechanism. The analysis suggests that for national roadmaps to provide
added value to existing monitoring activities, they should have a common structure whilst
allowing Member States flexibility in pace and scope of action. Advice and guidance on the
structure could be provided as part of the upcoming EU roadmap on ERA, which is currently
being prepared by ERAC in cooperation with the European Commission. A draft template for
national roadmaps is provided in A9.2, which could be complemented by further commentary
and guidance developed in partnership between the Commission, Member States and
stakeholders.
4.1 Political context at European level and steps towards a European roadmap
The Lisbon Treaty establishes a legal basis for the ERA as a shared responsibility between
the European Commission and Member States.12
This has expanded the options and
competencies for legislative action at EU level. The Commission has since 2013 included
research actions in the country-specific recommendations as part of the European Semester,
which is a review mechanism on Member States’ implementation of the EU’s economic
rules. In 2013, Members of the European Parliament (EP) also called for more binding legal
measures at EU level to speed up completion of the ERA (EP, 2013).
Member States insist on having autonomous national strategies (ERAC, 2014). Plans for
Member States to develop an EU roadmap in cooperation with the European Commission
were proposed by the Competitiveness Council in 2014 (Council of the European Union,
2014). An ERA roadmap at EU-level is expected in 2015, which will facilitate and
complement efforts at national level.
ERAC has repeatedly emphasised that Member State ownership and action should be at the
centre of ERA progress and taken into account in developing an EU roadmap. The
development of the EU roadmap should therefore be guided by the principle of ‘shared
responsibility’ and be built on contributions from Member States and the Commission. ERAC
has set out the following principles, which the Committee agrees should guide the
development of an EU roadmap: (ERAC, 2014b)
■ emphasise implementation along existing priority areas;
■ build on existing work by ERA groups (ESFRI, SFIC, High-level Group of Joint
Programming (GPC)) and stakeholders (Science Europe, European University
Association (EUA)); and
■ concentrate on joint understanding of goals and no prescription of goals.
The roadmap should set objectives for significant improvements in specific priority areas by
2020 and inform future monitoring exercises. The Competitiveness Council has selected a
12
Consolidated version of the Treaty on the functioning of the European Union, Article 182.5.

Assessment of progress in achieving ERA - Final Report
2 April 2015 30
number of ERA actions where significant improvements can still be made. (Council of the
European Union, 2014) These include:
■ the use of open calls for proposals based on international peer review;
■ the progress made by ESFRI and efforts to prioritise projects in the ESFRI roadmap;
■ aligning, where possible, national strategies and research programmes with the strategic
research agendas developed within the Joint Programme Initiatives to cope with major
societal challenges;
■ promoting wider uptake of innovative doctoral training principles;
■ using open, transparent and merit-based recruitment practices;
■ fostering mobility of researchers, and in particular between academia and industry;
■ mainstreaming gender equality and the gender dimension in R&D policies and
programmes;
■ supporting open access to scientific publications and developing an effective approach
for research data;
■ promoting and implementing e-Infrastructures; and
■ fostering effective knowledge transfer in research and innovation between the public and
private sectors.
4.2 State of play in Member States
Germany published a national roadmap in July 2014.13
Poland and France are in the
preparatory stages of developing their own national roadmaps. There are also some national
roadmaps for individual action lines (e.g. research infrastructures).14
Germany’s roadmap includes a set of specific guidelines on how ERA should be further
developed, which set the context and framework for the roadmap and can be understood as
a set of recommendations directed at EU policy-makers, and specifically at the Commission.
The guidelines highlight four aspects of future ERA development:
■ the specific context of Germany as having a strong science and technology foundation
for the further development of ERA based on scientific and technological excellence;
■ the diversity and respective strengths of the individual national research systems: in line
with opinions expressed in ERAC, the German guidelines stress diversity and
commitment by Member States as drivers and oppose any legal harmonisation at EU-
level or proposition of specific regulation by the Commission;
■ improving the effectiveness of the ERA and closing performance gaps between Member
States through a combination of excellence-driven research funding and complementary
sources, like the European Structural and Investment Funds (ESIF); and
■ strengthening the international dimension of ERA with regard to third countries.
The roadmap sets out problem areas, challenges, and a catalogue of objectives and
measures across the six ERA priority areas. It takes specific account of the German
research system (i.e. a federal system with shared competencies between federal
government and regional government), its variety of actors and specific market and industry
structure. Quantitative targets were only identified for priority areas 2.1 (transnational
13
Bundesministerium fuer Bildung und Forschung (2014), Strategy of the Federal Government on the European Research Area (ERA). 14
A list of national roadmaps for research infrastructures can be found here: http://ec.europa.eu/research/infrastructures/index_en.cfm?pg=esfri-national-roadmaps (accessed 2 February 2015).

Assessment of progress in achieving ERA - Final Report
2 April 2015 31
cooperation) and 4 (gender equality and gender mainstreaming). Under priority area 2.1, the
Federal Government aims for a 20 per cent participation rate by foreign partners in projects
funded by the Ministry of Education and Research. Under priority area 4, the Federal
Government aims to achieve a proportion of women in scientific executive committees of at
least 30 per cent. Information on how progress will be reported and final outcomes will be
reviewed is provided only partially for priority areas 1 (more effective national research
systems) and 2.2 (research infrastructures). Under priority area 1, the Excellence Initiative, a
programme funding first-rate, internationally visible research, will be evaluated by an external
expert group and a progress report on the Initiative will be presented. Both reports are
expected in 2016. Under priority area 2.2, the roadmap document indicates that regular
evaluations need to be performed both at strategic and operational levels.
The document does not provide an integrated set of quantitative targets or information on
how overall progress will be reported and reviewed. A report on progress is however
expected to be presented to parliament (Bundestag) at the end of the legislative period in
2017. An overview of the German roadmap on ERA is provided in Annex 9, Table A9.1.
In many priority areas, the German roadmap starts from a baseline of having an already
well-developed institutional setup. Germany also has a variety of funding and financing
instruments in place to cover most areas addressed by ERA priorities. Overall, the structure
and format of the German roadmap could be used to inform an EU roadmap and guidance
material on the development of national roadmaps in other countries. But the document
displays clear shortcomings regarding goal setting and progress monitoring.
4.3 Potential role of national roadmaps in the ERA monitoring framework
In principle, roadmaps can be useful tools for strategic planning and stakeholder buy-in.
National roadmaps on ERA could be a viable tool to show pathways towards progress,
define thematic priorities and showcase actions that take account of the specifics of national
research systems, in particular in areas where indicators might not be available or the
comparability across national systems does not enable reliable conclusions to be drawn from
quantitative data alone. In these cases, roadmaps are tools to progress in a specific area
through self-commitment.
National roadmaps could complement the ERA monitoring mechanism and in particular the
EU roadmap by showcasing individual pathways to progress. National roadmaps could also
be presented and reviewed in an extended peer review exercise, building on mutual learning
activities already performed in the context of ERAC.
Experiences with ERA-NETs, Joint Technology Initiatives and Article 185 initiatives suggest
that striking the right balance between developing a ‘standard model’ and ‘flexibility within
the model’ are crucial to preventing a fragmented landscape and preserving flexibility that
accounts for national specificities. For example, the Impact Assessment on Joint
Programming Initiative and first interim evaluations of Joint Technology Initiatives in the field
of Information and Communication Technologies identified a clear benefit in allowing for joint
agenda-setting in the field of R&D on a voluntary basis (Goetzeler et al., 2008).

Assessment of progress in achieving ERA - Final Report
2 April 2015 32
5 Role of peer reviews in ERA
This task considered the potential role of complementary approaches to support monitoring
and performance management mechanisms in the ERA. The study team examined the
potential role of expert peer review mechanisms through which experts meet to consider how
experience of other countries can help address particular challenges faced by a Member
State in advancing towards ERA goals.
This task provides two examples of peer review and challenge mechanisms from
international and EU policy and considers whether and where such mechanisms might be
applied to complement the ERA core indicators and national roadmaps.
This section summaries the results of two case study reports (provided in full in Annex 11)
and considers the potential role of Member State peer review in encouraging and monitoring
ERA progress.
5.1 An introduction to peer review
Peer reviews have been used to appraise the research and innovation systems of Member
States in ERA since 2006, however the structures and the processes behind the peer
reviews have varied. Member States would benefit from a more structured approach,
supported by appropriate administrative and thematic assistance and embedded in a wider
monitoring mechanism based on an EU ERA roadmap and national strategies on completing
ERA.
Peer review can be considered to be a specific form of mutual learning. The main types of
activity conducted in country-level peer review processes are:
■ fact-finding missions and expert visits by independent bodies and individual experts,
which carry out on-site missions to investigate specific events and establish facts; and
■ reporting and data collection including periodic reporting by participating countries to
independent bodies or expert groups who analyse submitted reports.
The OECD describes peer review as ‘an examination of one state’s performance or practices
in a particular area by other states […]’ (Pagani, 2002) with the ultimate goal of improving
policy making in the reviewed state and complying with established international standards
and principles. Peer reviews rely heavily on mutual trust amongst the countries involved and
the confidence of individual actors/representatives in the process. As a mechanism for
learning and driving change, peer review can:
■ contribute to a better understanding of Member State policies and identify transferable
practice;
■ improve efficiency and effectiveness of policies and implementation strategies; and
■ facilitate the transfer of key aspects of policies, institutional arrangements or funding
arrangements that have proven effective and efficient in their original context and are
relevant to other contexts.
In an ideal scenario, peer review provides positive peer pressure and incentives for reform
through:
■ formal recommendations and informal dialogue between peer countries;
■ creating a space for public scrutiny, comparisons and ranking amongst countries; and
■ creating impact on domestic public opinion, national administrations and policy-makers.
The effectiveness of peer review depends on factors that include (Pagani, 2002):
■ Value sharing amongst participating countries:
Assessment of progress in achieving ERA - Final Report
2 April 2015 33
Agreement amongst the participating countries on the standards or criteria against which
to evaluate performance. Common understanding is needed to prevent uncertainty or
backtracking during the process.
■ Adequate level of commitment by participating countries:
Both human and financial resources should be provided at an adequate level to allow
sufficient capacity for conducting the process. All participating countries should be
engaged as examiners, as active members of the collective body or committee, and as
subjects of the examination.
■ Mutual trust amongst participating countries:
A certain degree of trust and value sharing amongst the participants should be present
from the beginning to facilitate the disclosure of data, information and essential
documentation. Trust can be built throughout the process.
■ Credibility and ownership of the process:
The credibility of the peer review process is essential to its effectiveness and
attractiveness compared to other expert studies or policy reviews. A strong linkage can
be observed between the credibility of the process and its capacity to influence.
Ownership of the process should be ensured by involving participating countries both in
the structural design and the management of the peer reviews.
Peer review mechanisms commonly require administrative and scientific support including
the provision of a data repository in the form of a website or similar, administrative support to
ensure comparable formats for peer reports, fact-finding missions and the synthesis of main
outcomes in the form of seminars or workshops.
5.2 Previous peer reviews in the context of the ERA
There has been some prior use of peer review in the context of the ERA. Ten peer reviews
of nine different countries have been conducted; a comprehensive list of peer reviews
conducted in relation to the ERA is provided in Annex 10.15
This section analyses the
approach and method, the nature of recommendations produced in ERA peer reviews and
lessons for future ERA peer reviews.
5.2.1 Peer review practice in ERA
A first round of peer reviews was conducted prior to 2008 by the European Union committee
for scientific and technical research (CREST). These focused on reviewing the national
‘policy mix’16
(EC, 2009b) of research and innovation policy and aimed at assessing national
progress against the target of spending three per cent of the EU’s GDP on research, as
agreed during the Barcelona European Council in 2002 (European Council, 2002; EC, 2005).
The positive role that peer review could play in supporting the modernisation of national
research and innovation systems was noted by the Innovation Union initiative (EC, 2010).
ERAC (formerly CREST) conducted a second round of peer reviews from 2010 that built on
the Innovation Union Self-Assessment Tool (SAT), which provides a structure for Member
States to assess their innovation performance. The SAT consists of 10 criteria that can be
investigated by national ministries as part of a qualitative and quantitative self-assessment
(EC, 2010):
15
ERAC has also conducted three Mutual Learning Seminars in 2012, 2013 and 2014. The purpose of these events was to exchange and document experiences with current practices from other Member States while advancing towards ERA goals (Tsipouri, Georghiou and Lilischkis, 2013; European Council, 2014). 16
The conceptual model of ‘policy mix’ refers to “the idea that it is the combination of policy instruments interacting among each other […] which influences R&D, rather than instruments taken in isolation” (European Commission, 2009b).

Assessment of progress in achieving ERA - Final Report
2 April 2015 34
■ promoting research and innovation is considered to be an important policy instrument to
enhance competitiveness and job creation, address major societal challenges and
improve quality of life, and is communicated as such to the public;
■ design and implementation of research and innovation policies is steered at the highest
political level and based on a multi-annual strategy; policies and instruments are targeted
at exploiting current or emerging national/regional strengths within an EU context (‘smart
specialisation’);
■ innovation policy is pursued in a broad sense going beyond technological research and
its applications;
■ there is adequate and predictable public investment in research and innovation focused
in particular on stimulating private investment;
■ excellence is a key criterion for research and education policy;
■ education and training systems provide the right mix of skills;
■ partnerships between higher education institutes, research centres and businesses, at
regional, national and international level, are actively promoted;
■ framework conditions promote business investment in R&D, entrepreneurship and
innovation;
■ public support to research and innovation in businesses is simple, easy to access, and
high quality; and
■ the public sector itself is a driver of innovation.
The second round of peer reviews included five reviews of national research and innovation
systems based on the SAT, supported by Commission services and external consultants.
Three ‘SAT pilots’ were conducted, reviewing Belgium, Estonia and Denmark from 2010-12.
Two further reviews, on Spain and Iceland, were conducted on the basis of the three ‘pilots’.
The peer reviews recommended strategic actions on governance of the research and
innovation system or planning and prioritisation of high-level themes (e.g. stronger focus on
public-private cooperation in research, stronger support for university spin-offs). Very specific
recommendations can be found in the final report of the Spanish research and innovation
system. These included the establishment of a monitoring and evaluation system using
specific indicators proposed by the French peers involved in the review (Spanish Ministry of
Economy and Competitiveness, 2014). There is no conclusive evidence of how national
ministries responded to the recommendations and whether the recommendations were taken
into account in subsequent reforms of the national research and innovation systems.
The process used for peer reviews built on the Innovation Union’s Self-Assessment Tool
since 2010 is shown in Figure 5.1.

Assessment of progress in achieving ERA - Final Report
2 April 2015 35
Figure 5.1 Country-to-country peer review process in ERAC using the Innovation Union Self-Assessment Tool
Source: ICF International, based on Crasemann et al. (2012) and Rambøll (2012)
A workshop held in 2012 (Rambøll, 2012) summarised findings and discussed the utility of
the peer review tool based on SAT to monitor progress and identify challenges in completing
the ERA. The individual peer reviews on Denmark, Belgium and Estonia also provide some
insight into the overall process and initial feedback from government participants.
Capacity to support further peer reviews might be available through the Policy Support
Facility (PSF), which is currently being set up by the European Commission (EC, 2014b). It
aims to improve the design, implementation and performance review of national and regional
research and innovation policies, and to provide technical assistance and expert advice to
government authorities at different levels. The exact structure and services offered by the
PSF were not clear at the time of this study.
5.2.2 Lessons for the future of ERA
The workshop and evidence from the final reports of the peer reviews on Denmark, Belgium
and Estonia indicate that the ERAC peer-reviews based on the SAT have been viewed very
positively and were considered to provide further structure to the peer review process under
ERAC by participants and reviewed countries. Some lessons can therefore be drawn from
past ERAC peer reviews to enable systematic and efficient peer reviews of national research
and innovation policies in the future (Crasemann et al., 2012).
■ The peer-review method based on the SAT provides a flexible approach in terms of
thematic focus and organisation.
■ The quality of the recommendations and evidence produced relies on the input and
engagement of experts, government peers and stakeholders.
■ Some issues listed in the SAT are very broad and systemic, whilst the political interest
behind a peer review often is motivated by specific discussions on individual legislative
items or funding programmes.
■ There is limited integration with other policy fields (e.g. economy, employment, regional
development) since the structure used is built on the SAT Tool, which focuses on

Assessment of progress in achieving ERA - Final Report
2 April 2015 36
research and innovation policy. The SAT might neglect or miss essential topics and
issues that are addressed within the national research and innovation system.
■ The peer reviews conducted so far seem to be considered as singular activities. There is
no clear and simple process for Member States to express interest and have peer
reviews conducted.
5.3 Use of peer review in other policy areas
Country-to-country peer review and mutual learning mechanisms are in use in other areas of
EU policy and are used by other multi-lateral institutions. Two examples from the areas of
education and employment policy (in the OECD and EU) and one from EU agri-food policy
have been analysed to provide insight into how peer review mechanisms can be used. They
explain the peer review mechanism adopted and its concept, and identify lessons relevant to
the ERA. These inform recommendations provided in section 6.3.2.
The case studies were selected because they are well-established peer review mechanisms.
The education and employment examples have thematic relevance in relation to research
policy, as well as structural similarities (e.g. similar actors involved) and similarities in the
overall progress monitoring arrangements (i.e. similar complementary monitoring
instruments are available). Detailed case studies for the education and employment case
studies can be found in Annex 11.
5.3.1 OECD peer reviews in education and training
No other international organisation has used peer review as extensively as the OECD. The
OECD has an established peer review practice, which is used in many policy areas,
including education and learning. The reviews entail systematic examination and
assessment of a member country’s performance by other member countries, with the
ultimate goal of helping the reviewed country improve its policy making, adopt best practices,
and comply with established standards and principles (Pagani, 2002).
The peer review process in the area of education typically involves the following elements:
■ basis for proceeding, that is, decisions by the Education Policy Committee (EDPC, the
main policy-making body in OECD education policy), programmes agreed at ministerial
level or provisions in treaties and other legally binding documents;
■ an agreed set of principles, standards and criteria against which country performance is
assessed (e.g. policy recommendations and guidelines, specific metrics, indicators or
legally binding qualitative or normative principles);
■ designated actors to carry out the peer review: this typically includes the reviewed
country, the examiner or peer countries, the EDPC as a collective body and the OECD
secretariat which provides administrative support; and
■ a set of procedures leading to the final result and publishable material.
The examination is conducted on an advisory basis and the entire review mechanism is
based on mutual understanding17
of the countries involved in the review.
Typically the peer reviews are structured in three phases:
■ The preparatory phase involves review of background documents, self-assessment by
the country under review, preparation of documentation, guidance material,
questionnaires and data provided by the OECD secretariat.
17
Mutual understanding refers to a basis for proceeding; an agreed set of principles, standards and criteria against which the country’s performance will be reviewed; designated actors to carry out the review; and a set of procedures leading to the final result.

Assessment of progress in achieving ERA - Final Report
2 April 2015 37
■ The consultation phase consists of peer countries and the OECD secretariat reviewing
questionnaire responses and other data, carrying out on-site visits, consulting with
interest groups, civil society and academics. The OECD secretariat prepares the draft
final report and shares it with peer countries and the reviewed country.
■ During the assessment phase the draft final report is discussed in the EDPC, and
receives final amendments by peer countries or other delegates (e.g. other country
representatives, non-governmental organisations) and is adopted by EDPC. The final
report is published and disseminated through a press release.
By providing structured administrative support and working to an agreed and transparent set
of rules and processes, OECD peer reviews create a system of mutual accountability
(OECD, n.d.).
The OECD process benefits from an established institutional set-up built on strong
administrative support from the OECD secretariat and a well-defined set of principles,
standards and procedures. Peer reviews in the area of education policy are available on the
OECD website (OECD, n.d.).
5.3.1.1 Lessons for the future of ERA
The following lessons for the use of peer review on the ERA can be drawn from OECD
experiences in the area of education and training:
■ a secretariat can be used to reduce the burden of evidence-gathering and background
research on the reviewers, allowing experts to make more effective use of their time;
■ Member State involvement in the development of guiding principles, procedural
arrangements and resource commitments is critical to ensuring ownership and credibility
of the peer review mechanism;
■ continuous moderation of the process and agreed targets as well as established and
commonly accepted indicators provide for greater comparability and transparency of
individual peer reviews;
■ peer reviews only involving government officials and OECD staff may be biased
regarding the formulated recommendations and allow only for a limited level of criticism;
■ peer review processes can contribute to improvements in the host country and to the
definition of good practice for the community at large; and
■ publication of the results provides transparency.
5.3.2 EU employment policy
The European Employment Strategy (EES) is part of the EU's growth strategy (EC, 2014d).
The EES aims to create more and better jobs throughout the EU. A system of ‘peer reviews’
linked to the EES was set up in 1999. A revised Mutual Learning Programme (MLP) was
launched in 2005 in response to a request from the European Council to develop more
robust and integrated approaches to mutual learning in the area of employment policies.
MLP activities are aligned to the EU’s annual cycle of economic policy guidance (i.e. the
European Semester), including the European Semester’s specific work programme and
budget as well as the Country Specific Recommendations issued by the European
Commission each year. The MLP is managed by the European Commission’s Directorate-
General for Employment, which is supported by an external contractor to implement the
programme.
The MLP includes a range of activities such as thematic events, peer reviews, learning
exchanges and targeted dissemination events. The MLP also manages a database of labour
market practice containing examples of effective policies and measures within the context of
the EES.

Assessment of progress in achieving ERA - Final Report
2 April 2015 38
Peer reviews are used to assess the implementation of concrete policy measures on a given
topic. Peer reviews allow the exchange of experiences between a ‘host country’ and ‘peer
countries’. The host country presents, and wishes to gain feedback on an effective policy
(and associated good practice). ‘Peer countries’ are interested in learning from the host
example and potentially transferring it into their national setting – and in sharing their own
policy experiences with the host and other participating countries.
Thematic reviews are one specific type of event organised during the first semester of the
year before the negotiation of new Country Specific Recommendations. Each thematic
review focusing on a thematic grouping of Country Specific Recommendations follows a
common format in which Member States act as both reviewer and reviewee. Reviews focus
on recent policy developments introduced by Member States since the last review.
The MLP is based on a ‘tested and tried’ model, largely approved by participants and
enjoying continuous interest from Member States. Research currently undertaken by ICF18
suggests that approval of the MLP is largely due to:
■ the high political and public pressure for action in the wake of the economic crisis;
■ a formalised progress measurement system (European Semester, National Reform
Plans and Country Specific Recommendations as described above); and
■ a dedicated administrative and technical support mechanism provided through an
external contractor.
In this context, the MLP exerts an indirect influence on national policy making.
5.3.2.1 Lessons for the future of ERA
The following lessons for the use of peer review on the ERA can be drawn from EES
experiences in the area of employment policy:
■ a main strength of the EES Mutual Learning Programme is that the activities are run as a
programme with their own annual cycle closely aligned with the European Semester’s
work programme;
■ the formulation of national guidance and strategy including a corresponding feedback
mechanism at EU level through the European Semester have provided added-value to
the EES Mutual Learning Programme;
■ the availability of sufficient budget to provide for the external support service is a critical
success factor of the EES Mutual Learning Programme; and
■ the annual summary of peer reviews and thematic reviews conducted under the EES
Mutual Learning Programme, provided for in the Multilateral Surveillance Conclusions,
helps to strengthen ownership of the MLP in Member States, and increases peer-
pressure and mutual accountability between Member States.
Introducing a structured mutual learning programme in ERA could improve convergence
between Member States and bridge certain gaps in effective monitoring that the ERA
monitoring mechanism is currently lacking.
5.3.3 EU Task Force on the eradication of animal diseases
A Task Force on the eradication of animal diseases was created in 2000 following
recommendations made in the White Paper on Food Safety. Its specific objectives were to
improve ‘animal disease eradication’ and ‘the cost-benefit ratio of animal disease eradication
programmes co-financed by the Community’ (EC, 2012). It is maintained to assist Member
18
Study commissioned by the European Commission on comparison and assessment of the effectiveness and efficiency of different OMCs to propose innovative governance methods in the ET 2020 context.
Assessment of progress in achieving ERA - Final Report
2 April 2015 39
States to implement animal disease eradication programmes suitable for meeting set
objectives and allowing harmonisation of programmes across different Member States.
Task Force meetings are held in Brussels once or twice per year. They are attended by
representatives of the 28 Member States, the chairpersons of the Task Force’s expert
subgroups, and by Commission representatives (EC, 2012). A Commission official chairs the
meetings and membership is generally stable and consistent from meeting to meeting. All
aspects of the programmes can be discussed. The findings and recommendations of the
subgroups are delivered and presentations made relating to topics relevant to all diseases
subject to EU-funded measures.
Subgroups of thematic experts have been established for specific animal diseases. The Task
Force sub-groups feed information back to the plenary Task Force on the state of
programmes in individual Member States, including any specific problems they face.
Subgroup meetings take place in Member States where a programme for disease control
and eradication is being approved for co-financing by the Commission. The situation in that
country is presented and the subgroup puts forward advice on how it might be improved. The
chair and experts draft recommendations, and Member States are informed. As the
subgroups include representatives from other Member States, experience on successful
measures elsewhere can be put forward for consideration and serve as a basis for
recommendations. As the meetings take place within Member States, representatives from
public and private sector industries involved in these programmes can be present and get
involved.
Research conducted by ICF for the Commission suggests that Member States consider the
Task Force to be a useful mechanism that has brought added value to their programmes.
Research has found that national authorities value Task Force sub-groups’ input to the
design of programme plans.
Measures are often technical and require precise implementation procedures to be followed
in order to be effective. Failure to observe correct procedure can reduce the effectiveness of
a measure, potentially undermining the effectiveness of the programme. Task Force experts
provide detailed and practical advice about which measures should be implemented and
most importantly, in the opinion of the stakeholders, advice on how the measures should be
implemented.
In addition to technical support, the Task Force can provide host authorities with the support
to implement measures deemed necessary. The Task Force members were perceived to be
external experts independent of any particular agenda. This was considered to be especially
useful by national authorities when they were attempting to build consensus for novel or
revised measures. Drawing on the expertise of external experts with a track record in
successful programmes assisted the national authority in justifying proposed measures.
5.3.3.1 Lessons for the future of ERA
The following lessons for the use of peer review on the ERA can be drawn from Commission
experiences in the area of eradicating animal diseases:
■ the breadth of expertise of the visiting review team affects added-value and impact so it
is important to recruit the right people to the task;
■ the independence of external experts was considered very useful by national authorities
subject to reviews;
■ visits from the Task Force provide the opportunity to subject programmes to critical
challenge from recognised independent experts and can help in building consensus for
novel or revised measures;
■ the manner in which the review is conducted is important: it needs to provide critical
challenge but also be supportive and collaborative, and avoid an ‘audit’ or inquisitorial
approach;

Assessment of progress in achieving ERA - Final Report
2 April 2015 40
■ the peer review process can help to empower those in the recipient country who are
working for change; and
■ findings from individual reviews can be combined to produce guidance of relevance to
the EU as a whole.

Assessment of progress in achieving ERA - Final Report
2 April 2015 41
6 Conclusions and recommendations
Following the development of the methodological framework for the evaluation and
publication of the 2014 ERA Progress Report by DG RTD, the study team identified practical
and theoretical difficulties with the current ERA progress monitoring framework. Together
with feedback from Member States (e.g. responses to the Second Progress Report), this
suggested that there was a case for reviewing the current approach to see where and how it
could be improved.
For many ERA priority areas there is no agreed quantitative goal or target against which to
measure Member States’ situation or progress. Success, or minimum acceptable
performance, is undefined. In the absence of such goals the progress reports have
measured Member State performance with reference to an EU average. This approach
provides information about the situation across Member States but not whether the ERA has
been completed in that priority area. Setting goals and targets would enable an assessment
of progress made towards a desired goal for the ERA. But this kind of forward-looking
assessment cannot be made without defining the desired or expected end-result for the
ERA, i.e. the completion of the ERA, when the strategic objective will have been achieved.
The current monitoring framework would also benefit from greater clarity about overall ERA
system objectives and established goals for the system to meet. The lack of established
goals for the indicators and ultimately for the actions and priorities means that if the
evaluation had been undertaken, it would only have been able to describe progress in
relative rather than absolute terms – that is, it would enable an assessment of whether there
had been change from one period to the next but not whether individual countries and the
EU as a whole were making progress towards an overall objective.
Other issues identified include:
■ The current progress reporting system has been criticised by Member States for not
being able to recognise the diversity of Member States’ research systems and pathways
towards achieving ERA objectives.
Each Member State is starting from a different baseline, so while Member States’ results
for a given indicator are being reported and can be compared, in the absence of
contextual information about the size or structure of the Member State research systems
it is difficult to interpret the results – both at the Member State level and in terms of the
implications for the EU as a whole.
■ The current system often documents activity such as introducing new policy measures in
the domain of the ERA-priorities rather than measuring progress in terms of outcomes
and impacts.
The current reporting arrangements capture information on Member State actions and
activities that have relevance to a particular ERA priority area, but it is often not clear
what kind of impact the action/activity has had or will have on progress towards ERA
objectives.
■ Securing robust information to inform decision-making has proven difficult.
In 2013 and 2014 a survey instrument was distributed to RPOs and RFOs. Response
rates varied widely and for many Member States were too low for the results to be
regarded as representative.19
And without contextual information on the size and
structure of the Member State research system, it can be difficult to interpret the results.
19
There are few registers in the statistical offices of MS where RFO's and RPO's are included. For this reason the European Commission’s Directorate-General Education and Culture (DG EAC) has introduced the European Tertiary Education Register (ETER), a database of HEIs in Europe, currently including 36 countries and 2,673

Assessment of progress in achieving ERA - Final Report
2 April 2015 42
■ ERA progress reporting where additional data are required adds to the administrative
burdens on governments, RPOs, and RFOs in the Member States. Therefore, existing
data should be used as much as possible.
ERA progress reporting sits alongside other information gathering and reporting
mechanisms such as the National Reform Programmes and the European Semester.
■ The indicator set has been unstable due to changes in the composition of the set of
indicators.
ERA progress reporting could better support and link with other related initiatives,
particularly the European Semester and Innovation Union. It is difficult to gauge
progress, even within the constraints listed above, because the ERA indicators adopted
have changed from year-to-year and comparable data bridging a two-year period (or
longer) are not available for most indicators. The frequency and timing of ERA reporting
could be better tuned to the pace of change, the availability of data and the requirements
of users. It also could be better aligned with the European Semester and the Innovation
Union.
6.1 Indicators and suitable metrics to measure progress
The indicator appraisal conducted identified available data, geographic coverage and data
gaps, particularly for outputs and long-term impacts, which can be clearly linked to activities
and outputs under the individual ERA priorities.
Across the different ERA priorities, output and outcome/impact indicators are either difficult
to identify or, more often, overlap across individual inputs. Problems in linking individual
inputs to specific, long-term impacts are visible across all priority areas. There are also
issues related to the thematic breadth of some priority areas (e.g. priority area 3 – open
labour market for researchers), where outputs are very difficult to measure across all actions.
The study team has proposed a set of indicators, with one input, output and outcome /
impact indicator for each priority area, which reflect the best available data and are most
relevant to a given priority. Data availability can be improved in the future, and the team has
identified other indicators that could be used in the future where this is the case.
The indicator appraisal also showed a clear difference in Member State ownership between
data collection undertaken for the ERA and the Innovation Union Scoreboard. The indicators
proposed and future data collection should therefore be better integrated with work already
undertaken for the Innovation Union Scoreboard. Efforts should be made to reduce the
administrative burden as much as possible for Member States and relevant stakeholders
(RFOs and RPOs).
6.2 Desirable attributes of a future evaluation and monitoring system
The following attributes of an ERA evaluation and monitoring system have been identified as
particularly appealing by Member States and the Commission and should be considered in
future initiatives:
■ supporting performance management by focusing on identifying important gaps,
securing commitments to close them and tracking progress;
■ recognising the diversity of Member State research systems and pathways to ERA;
■ ensuring that indicators remain stable between reporting periods (and, as far as possible,
resilient to adjustments in the ERA priorities);
HEIs; 29 countries have provided a full set of data for 2,250 HEIs. ETER presents comparable information under headings such as numbers of staff and students, subject domains covered, research activity and expenditures.

Assessment of progress in achieving ERA - Final Report
2 April 2015 43
■ using robust indicators that are relevant to ERA priorities and which are based on
reliable and already-existing information as far as possible;
■ being proportionate and efficient, for example, by being well-integrated with other
information and analytical systems, minimising additional administrative burdens and
reporting at appropriate frequencies; and
■ integration with other relevant policy initiatives and reporting mechanisms (especially the
Innovation Union).
6.3 Towards an integrated approach to measuring ERA progress
Current monitoring arrangements and suitable indicators identified by the study team only
cover parts of the overall activities and link some inputs, outputs and impacts in each ERA
priority area. They also require complementary approaches to reflect Member State diversity
and encourage progress reporting. Building on the work already undertaken by ERAC, a
future integrated approach could include individual national roadmaps to allow for specific
focus on strengths and weaknesses of national systems and iterative performance review
against a core set of indicators accompanied by individual national objectives set out in
roadmaps.
6.3.1 Ensuring added value of national roadmaps
A draft of the EU-level ERA roadmap is expected to be discussed in 2015. The
recommendations developed in this study therefore aim to inform the discussion and
development of robust Member State roadmaps. National ERA roadmaps could provide for
flexible target setting, taking into account national specificities, if designed appropriately and
recognised by Member States as tools for achieving ERA progress.
The research undertaken for this study found that ERAC and the Commission should aim at
informing certain ‘framework conditions’ in developing guidance and advice on national
roadmaps as part of the European ERA roadmap. This would include a set of non-binding
recommendations and aim to establish a high level of mutual trust between Member States
and the Commission through clear and transparent discussion on and review of national
roadmaps within the context of ERAC.
To provide a future monitoring and progress measurement framework with national targets
and pathways towards completion of ERA, national roadmaps should however meet a
number of principal criteria that a European roadmap could set out, including:
■ clearly identifying relevant actors within the national research system and their role in
achieving progress;
■ a clear definition of specific problem areas and challenges which prevent the Member
State from implementing the ERA;
■ quantitative targets and actors responsible to reach these targets alongside the priority
areas proposed for an EU roadmap;
■ a timeline which plots individual activities and targets against a set timeframe;
■ a mechanism for progress reporting, including the actors responsible for progress
reports; and
■ a mechanism to review progress on a regular basis, including the actors that need to be
involved and planned frequency of review.
Further deliberation between the Commission and ERAC should reflect on the following
aspects:
■ the necessary level of robustness and detail of national roadmaps;

Assessment of progress in achieving ERA - Final Report
2 April 2015 44
■ resources that can realistically be invested at national level in design, monitoring and
reporting on national frameworks; and
■ how flexibility for Member States can be preserved.
6.3.2 Recommendations for future use of peer review and mutual learning in ERA
Study team analysis of the use of peer review in the ERA to date and the case study
examples suggest that a peer review mechanism could have a positive role to play in
completing the ERA if appropriately constructed, operated and resourced.
Future ERA peer reviews could be organised as a joint effort by the Commission and
Member States, built on the concept of ‘shared responsibility’ (TFEU Article 182.5) (EU,
2012). Member States can be encouraged to initiate the development of a common
approach and guidelines to establish a formalised and credible peer review system.
Available evidence also suggests that it can be helpful to identify a group responsible for
driving progress and identifying where progress is lagging. These could be either technical
experts on specific ERA priorities, an independent support service, or staff responsible for
supporting ERAC. The planned Policy Support Facility (PSF) could serve as a hub for
strategic intelligence and provide administrative support and guidance to policy makers,
participants and interviewees.
The peer review mechanism’s prospects for success are improved if it incorporates the
following elements and approaches:
■ Decisions on the design and implementation of a peer review programme and approval
of the outputs being taken by ERAC.
■ The peer review process needs to be properly documented and well understood by
Member States.
■ Member States need to be centrally involved in the development of guiding principles
and procedural arrangements. The Innovation Union self-assessment tool already in use
provides a starting point.
■ The process should be constructed and operated in a manner that engenders trust,
collaboration and openness. Peer reviews should provide critical challenge but also be
supportive and collaborative.
■ The scope of reviews and selection of reviewers could be organised based on the
principal ERA objectives or individual measures identified in the EU ERA roadmap in
2015.
■ A structured approach is needed to develop national roadmaps and a corresponding EU
feedback mechanism potentially linking into the European Semester.
■ The peer review teams should not be dominated by Member State policy administrators
but rather should include a mix of experts, including independent experts.
■ A more structured approach towards the provision of thematic and administrative support
and developing guidelines, templates and a structured knowledge management system
for collected data and analytical reports might encourage more Member States to
express an interest in being peer-reviewed.
■ An annual summary of peer reviews, drafted by ERAC (i.e. by the Member States
themselves) would strengthen ownership, provide guidance for the EU as a whole and
build mutual accountability between Member States.
■ The SAT might neglect or miss essential topics and issues that are addressed within the
national research and innovation system. A review of the SAT and the inclusion of
relevant overlapping policy fields might increase interest from Member States;

Assessment of progress in achieving ERA - Final Report
2 April 2015 45
■ The amount of preparatory material should be kept to a minimum to reduce
administrative burden of participating organisations.
■ Wider organisational learning effects can be achieved if the peer review results are
disseminated widely across relevant stakeholders in all EU Member States and
Associated Countries.
6.4 An illustrative rating system for progress reporting
Progress and performance at EU level could be demonstrated across ERA priorities through
the use of a ‘traffic light system’ similar to that used in the British Civil Service to track
performance. This could signal the status of progress towards ERA objectives and EU level
goals. Progress could be assessed against the goals defined under the EU roadmap.
Progress could be assessed against all ERA priorities or specific areas of action identified in
the roadmap.
An example of how this approach could be used in the ERA is provided in Table 6.1.
Table 6.1 Traffic light rating system for ERA progress
Performance Description Status
Taking all relevant information into account, the aggregate assessment is that this aspect of
the ERA is either complete or track for completion by the given deadline.
The available information suggests that achievement of this aspect of the ERA within the
given timetable is in doubt. There are issues to be addressed but the situation is not
irrecoverable providing the risks are addressed.
There are significant problems and achievement of this aspect of the ERA is not expected
within the given timetable. Progress objectives are not being met and actions is required.
This approach offers succinct and easily identifiable messages about the state-of-play at EU
level on ERA priorities. Traffic light ratings could be assigned by a team of individual experts,
who review data collected against the core indicator set and peer review reports.
G

Assessment of progress in achieving ERA - Final Report
2 April 2015 46
ANNEXES

Assessment of progress in achieving ERA - Final Report
2 April 2015 47
Annex 1 Study tasks and work completed against objectives
The study terms of reference set out six main tasks for the study. Table A1.1 outlines the original tasks
and the work undertaken by the study team to meet the study objectives for those tasks.
Table A1.1 Study tasks and work completed against study objectives
Task Original scope of work Status of original task for present study
Work completed to meet study objectives
1
Collect data on national
measures to fill gaps for the
2013 reporting period per ERA
action and MS / AC
Data gaps and missing
information were addressed
by DG RTD through
consultation with the MS.
Three ACs also provided
new measures.
Country experts from the study team reviewed
and checked the new measures, provided
comments on their validity and suggested
changes to DG RTD for inclusion in the 2014
Progress Report. New measures were
researched for those AC that did not provide
new measures. This information was
incorporated into the 2014 progress report.
2
Establish the baseline for AC in
cases where this had not yet
been done and revise and
update country fiches for MS
and AC with new or planned
ERA-related measures
The task was executed as
originally planned.
Country experts from the study team prepared
new AC fiches. Existing MS and AC fiches
were reviewed for consistency, formats were
standardised and data gaps filled where
possible. Country fiches are provided on the
DG RTD ERA website (EC, 2014c).
3
Develop and estimate policy
progress indicators for 2013
Policy progress indicators
for the 2013 period were
developed and estimated by
DG RTD.
The study team reviewed indicators that were
used in the 201 and 2014 reports and
identified and appraised additional indicators
that could be used instead of or to
complement existing indicators.
4
Develop the evaluation
framework to assess progress
An evaluation framework
was developed and tested
by the study team for the
2012-2013 period. The
evaluation could not be
undertaken as originally
envisioned.
A new evaluation framework was developed
for future progress evaluation. Study team
analysis and proposals for a new framework
are described in this report.
5
Prepare a methodological note
establishing the approach for
evaluating progress between
the 2013 and 2014 reporting
periods
A methodological note was
prepared as originally
planned.
Analysis arising from the preparation of the
methodological note is provided as annexes to
this report.
6
Evaluate progress of ERA
policies and actions
The evaluation could not be
completed as originally
envisioned – this task was
replaced by the
development of future
evaluation framework.
The study team developed a framework for
future evaluation and monitoring of the ERA,
which is set out in this report.

Assessment of progress in achieving ERA - Final Report
2 April 2015 48
Annex 2 Methodology to assess ERA progress
The original aim of this study was to provide an evaluation on progress in the achievement of ERA in
Member States and Associated Countries by reference to current and planned national policies in the
evaluation period (July 2012 to August 2014) for each ERA action. Progress was to be assessed at
EU level by ERA priority – as defined in the ERA communication ‘A Reinforced European Research
Area Partnership for Excellence and Growth’ (EC, 2012) – including actions derived from the
Commission Communication ‘Enhancing and focusing EU international cooperation in research and
innovation: A strategic approach’ as deemed necessary (EC, 2012c).
The study was intended to build on the first ERA-progress report (EC, 2013d) adopted by the
Commission in September 2013 and work undertaken by DG RTD for the second ERA-progress report
2014. The study was expected to assess the implementation of ERA actions by research funding
organisations, where relevant, but not assess implementation by research performing organisations.
The expectation was to base the evaluation almost entirely on information collected for the 2013 and
2014 progress reports, since these provided the most complete assessment available of initiatives
undertaken by Member States and Associated Countries. The evaluation was expected to use the
progress indicators as well as other evaluation methods and tools, where appropriate.
This annex explains the process that the study team developed to evaluate progress, the results of
applying the first three steps of the evaluation methodology, the limits of the available data and tools,
and gaps foreseen. Additional detail of the analysis is provided in Annex 3 - Annex 6.
A2.1 Overview of the evaluation method proposed
Our task was to evaluate the progress made since the first progress report towards the construction of
the ERA by assessing:
■ The measures and initiatives undertaken by Member States and Associated Countries; and
■ Any changes in inputs, outputs and outcomes across the ERA indicators.
The method was designed to accommodate the following sources of complexity:
■ Changes were made between the 2013 and 2014 assessments to the set of indicators on which
DG RTD has collected data.
A set of indicators was identified for the first ERA progress report. These indicators were used to
establish a baseline for measuring progress.
The ‘Methodological note: ERA Progress Indicators’ (EC, 2013) analysed the indicators used. The
report provided suggestions for the reformulation of several indicators, and the inclusion of new or
removal of indicators. As a result, some of the 2013 report indicators were excluded from the 2014
assessment, while others were reformulated. This means determination of progress since 2013
across the ERA as a whole cannot be achieved through a simple comparison of 2013 and 2014
indicator data.
■ Qualitative information on new measures and initiatives in Member States and Associated
Countries provides limited insight on progress.
The study team could not determine from the qualitative information supplied by Member States
and Associated Countries whether, and to what extent, the measure/initiative has been
implemented. Nevertheless, this information could have been relied upon for the evaluation where
comparable indicator data were lacking.
■ A forward-looking progress assessment is not possible because there are no goals set for
individual indicators or for actions/priorities.
The progress assessment would have benefitted from having reference goals and objectives set
for the indicators and actions/priorities. These would enable the review to comment on the
progress made towards a desired end state, or goal, for the ERA. But this kind of forward-looking

Assessment of progress in achieving ERA - Final Report
2 April 2015 49
assessment cannot be made without defining the desired or expected end-result for the ERA (i.e.
when the strategic objective will have been achieved).
The process proposed for the evaluation of progress is shown in Figure A2.1 and described below.
Figure A2.1 Flow Diagram for ERA Evaluation
A2.2 Step 1: Scope test
A2.2.1 Description of the scope test
Indicators in both reporting periods were assessed to determine whether they were being used to
demonstrate implementation of ERA actions by RPOs or by RFOs, by Member States or by others.
Indicators that refer to ERA implementation by RPOs were excluded from the evaluation as they are
out of scope. Further evaluation tests explained below were only applied to indicators within study
scope.
A2.2.2 Results of the scope test
There were 33 indicators used in the first reporting period and 60 in the second reporting period. Of
these, 22 indicators from the first reporting period and 35 from the second reporting period were
carried to Step 2. Annex 3 provides a complete list of the 2013 and 2014 indicators, with an indication
of whether they are within study scope.
Step 2: Consistency test
Compare progress indicators with indicators from the previous reporting period.
Are the indicators the same?
Step 5: Assess progress
Step 3: Data availability test
Check availability of data for new indicator in the previousreporting period.
Are the data available for both periods?
Step 3: Data availability test
Check availability of data for previous indicator in the newreporting period.
Are the data available for both periods?
Progress cannot be assessed
Step 1: Scope test
Check whether the indicators refer to implementation by RPOs.
Are the indicators in scope?
Indicators excluded from the study
Step 4: Assessment of other information
Review other available information
Can any (qualified) judgement on progress be made?

Assessment of progress in achieving ERA - Final Report
2 April 2015 50
A2.3 Step 2: Consistency test
A2.3.1 Description of the consistency test
Step 2 was a consistency test that compared the indicators within scope between the first and second
reports to determine those that remained the same or changed. There are two possible outcomes for
each indicator:
1. The indicator did not change.
2. The indicator changed.
The outcome affects the test applied in the next step of the process.
Where indicators had changed, the study team would have assessed whether the change was
‘substantive’ or ‘minor’; if the change was substantive, the indicators would be considered
incomparable, but if they were minor, the study team checked whether comparison across the two
periods was still possible so that those indicators could proceed to Step 3.
A2.3.2 Results of the consistency test
The consistency test showed that there were only six indicators that could have been directly used to
assess progress, covering only three of five priority areas (one indicator each for priority areas one
and three, and four indicators for priority area two). Annex 4 shows the indicators that remained
unchanged between the two reporting periods, which could have been directly compared to assess
progress.
A2.4 Step 3: Data availability test
A2.4.1 Description of the data availability test
Step 3 was an assessment of data availability for each indicator. The specific test applied to each
indicator varied according to the result of Step 2.
A2.4.1.1 Indicator was unchanged
The DG RTD ERA progress database was interrogated to determine whether it held data for both
reporting periods for the indicator in question. Where data for both periods were available then the
indicator progressed directly to Step 5. If not, then the indicator went to Step 4.
The DG RTD database is populated with data from OECD reports, EUROSTAT, RFO surveys, ESFRI,
She Figures and information provided by the Member States to DG RTD.
A2.4.1.2 Indicator changed
Where the indicator changed after the first reporting period, the ERA progress database and other
sources were interrogated to determine whether data were available for both reporting periods for the
old or the new or both iterations of the indicator.
A2.4.2 Results of the data availability test
Data sources for each indicator were assessed and an initial judgement made about the extent to
which indicators that had changed could have been used where data from the first reporting period
was available for new indicators or data from the second reporting period was available for old
indicators.
Some indicators changed between the first and second reporting period but matching pairs of
information from the two periods were available (information was available in either the first reporting
period for the new indicator or the second reporting period for the old indicator). An additional 37
indicators, detailed in Annex 5, Table A5.1- Table A5.5, might have been used to inform the progress
assessment on this basis. The status of the indicator appraisal is summarised in Figure A2.2.

Assessment of progress in achieving ERA - Final Report
2 April 2015 51
Figure A2.2 Summary of the indicator appraisal following the application of steps 1-3
Source: ICF (2014)
A summary of the results of steps 1-3 for each priority, by action and indicator is provided in Annex 3.
It shows where progress could have potentially been assessed based on available information and
where additional information would have been required to fill gaps.
At this stage in the evaluation, the study team reviewed the data collected for the 2014 Progress
Report and that collected in 2013. Indicators that relied on RFO survey data, particularly in 2014, were
largely considered to be unusable for the evaluation due to low response rates from funding
organisations and low comparability between respondents in 2013 and 2014. As most of the indicators
were based on RFO survey data, this eliminated the majority of available indicators across the priority
areas. This would have resulted in the following gaps in the analysis:
■ No indicators for actions under priority 1 (one indicator could have been used related to
outcomes);
■ No indicators for actions two and three under priority 2 (one indicator could have been used for
action one, two indicators for action four, and one outcome indicator);
■ No indicators for actions under priority 3 (two outcome indicators could have been used);
■ No indicators for actions under priority 4 (four outcome indicators could have been used); and
■ No indicators under actions two and four under priority 5 (one indicator each for actions one and
three could have been used).
A2.5 Step 4: Assessment of other information
Step 4 would have involved a review of information on new initiatives and measures provided by the
Member States and Associated Countries to determine whether information was available that was
relevant to specific actions that could have been used to judge progress between the first and second
reporting periods.
This information could have helped to fill gaps in assessing progress on ERA actions where
comparable indicator information was unavailable and to broaden and contextualise the evaluation
where indicator information was available. The information would have been used to indicate in
qualitative terms whether a country had taken steps towards an ERA action where indicator
information was unavailable. The study team expected a priori that the information available would not
necessarily have enabled determination of whether the initiative had been implemented or whether
there had been an impact on progress towards the priority.
0
10
20
30
40
50
60
70
80
90
Test 2 Test 3
Nu
mb
er o
f in
dic
ato
rs
Total Unchanged
Changed Changed but useable
Changed and subject to Test 4

Assessment of progress in achieving ERA - Final Report
2 April 2015 52
Step 4 was not undertaken, however, because earlier review and input to the country fiches for the
2014 Progress Report revealed that, as expected, the available qualitative information was insufficient
for most countries to determine whether the initiatives cited had been implemented or whether there
was progress made. The available information was also inconsistent across countries and therefore
largely incomparable.
A2.6 Step 5: Assess progress
The final step of the evaluation would have been a report on progress at two levels:
■ Progress at Member States and Associated Countries level since the first reporting period.
■ Overall EU progress against each ERA priority since the first reporting period.
Reporting on overall progress at EU level would have depended in large part on the degree to which
information on progress was (a) available and (b) comparable across Member States and Associated
Countries. The study team found that the available information was limited.
The 2009 Expert Group report on ERA indicators suggests that progress could incorporate available
information on other science and technology indicators. The advantage of these indicators is their
availability over a longer time period. They could therefore be used to put the ERA indicators into a
broader perspective.
Countries could also have been grouped based on common structural similarities, similar to the
scoreboard approach taken by other monitoring exercises at EU level such as the industrial
scoreboard or the IU scoreboard. They show how countries do from one year to the next based on a
limited set of indicators. The scoreboards group countries into four categories. Accordingly, progress
by actions and priorities could have been categorised by countries that are ‘leaders’, ‘followers’,
‘catching-up’, or ‘lagging’ (these categories are illustrative).
The changes could have been shown graphically rather than through quantitative figures or qualitative
description to avoid suggesting that progress can be measured precisely. Figure A2.3 provides an
illustration of a potential scoreboard approach.
Figure A2.3 Example of a scorecard
Source: Technopolis, adapted from EPSIS (2012)
However, this step as described is only theoretical, since the evaluation did not proceed beyond Step
3, and the initial assessment of data availability under Step 4.
A2.7 Summary of evaluation limits, risks and gaps
This section provides a short commentary on issues that arose in preparing the evaluation framework.
These were taken forward into the development of a future monitoring and evaluation framework.
A2.7.1 Lack of comparable indicators
The large number of changes made to the indicator set after the 2013 report means that if the
evaluation had proceeded under Steps 4 and 5, reporting on progress in 2014 against the 2013
baseline would have been directly feasible for only a small number of indicators.

Assessment of progress in achieving ERA - Final Report
2 April 2015 53
A2.7.2 Distortion effects arising from survey data
Using the RFO survey results to report on progress would have been problematic for several reasons:
there were numerous instances of responses from a small number of RFOs in a country or differences
in the numbers of RFOs between reporting periods which would have resulted in (potentially dramatic)
under- or over-reporting on progress in a country. One potential way to overcome this problem would
have been to use additional, qualitative information to assess progress that complemented the survey
data, but as reported above, the qualitative information available did not provide sufficient information
(e.g. on implementation or progress achieved) and it was not sufficiently comparable across Member
States for this purpose.
A2.7.3 Reliance on relative, rather than absolute progress assessments
It is also clear that the framework would benefit from greater clarity about overall ERA system
objectives and established goals for the system to meet. The lack of established goals for the
indicators and ultimately for the actions and priorities means that if the evaluation had been
undertaken, it would only have been able to describe progress in relative rather than absolute terms.
That is, it would have enabled an assessment of whether there had been change from one period to
the next but not whether individual countries or the EU as a whole made progress towards an overall
objective. This would have been even more difficult where the study team was only able to rely on
information on new measures or initiatives rather than on more measurable actions, outputs or
outcomes.
A2.7.4 Reliance on measuring inputs
Most of the ERA actions were being measured by inputs in the Member States and Associated
Countries rather than through outputs or outcomes for priorities 1 and 2. Output and outcome
indicators were available across a limited range of actions for priorities 3, 4, and 5. Progress measures
would be more robust by reference to activities and results over time (input, outputs and outcomes)
rather than through a focus on inputs.

Assessment of progress in achieving ERA - Final Report
2 April 2015 54
Annex 3 Outcome of scope test
A3.1 Priority 1 – more effective national research systems
Table A3.1 Priority 1 comparison of progress indicators and data sources
Action/ Outcome
Indicator - 2013 Source Scope (In/Out)
Indicator - 2014 Source Change (Y/N)
Scope (In/Out)
P1A1 Share of national GBAORD allocated as
project-based funding
MS /
OECD
In Share of national GBAORD allocated as
project based funding
MS /
OECD
N In
Share of institutional funding allocated on a
competitive basis
RFO
survey
In Indicator was not carried forward to
2014
Y
Indicator was not used in 2013 Share of project based research and
development budget allocated through
peer review
RFO
survey
Y In
P1A2 Share of institutions applying the core
principles for international peer review
RFO
survey
In Indicator was not carried forward to
2014
Y
Indicator was not used in 2013 Share of institutional funding allocated
based on institutional assessment
and/or evaluation
RFO
survey
Y In
Outcome Indicator was not used in 2013 Share of top 10 per cent scientific
publications
SCOPUS Y In
A3.2 Priority 2 – optimal transnational co-operation and competition
Table A3.2 Priority 2 comparison of progress indicators and data sources
Action/ Outcome
Indicator – 2013 Source Scope (In/Out)
Indicator – 2014 Source Change (Y/N)
Scope (In/Out)
P2A1 Indicator was not used in 2013 National public funding allocated to
transnationally coordinated R&D as per
cent of GBAORD
EUROSTAT Y In

Assessment of progress in achieving ERA - Final Report
2 April 2015 55
Share of national GBAORD allocated
to transnationally coordinated
research based on common priorities
RFO
survey
In National public funding allocated to joint
research agendas [within transnationally
coordinated R&D] as per cent of GBAORD
RFO survey N In
Assessment of the implementation of
joint research agendas addressing
grand challenges
RFO
survey
In Indicator not carried to 2014 Y
P2A2 Share of institutions applying
international peer review standards
RFO
survey
In Share of funders which can base their
project based research and development
funding decisions on peer reviews carried
out by non-national institutions
RFO survey Y In
Share of institutions mutually
recognizing international peer review
standards
RFO
survey
In Share of project based research and
development budget allocated through peer
review carried out by institutions outside
the country
RFO survey Y In
Assessment of the implementation of
mutual recognition of evaluations that
conform to international peer review
standards as a basis for national
funding decisions
RFO
survey
In Indicator not carried to 2014 Y
P2A3 Indicator was not used in 2013 Share of funder's research and
development budget dedicated to joint
defined research agendas with non-
national organisations
RFO survey Y In
Share of budget allocated to
transnational funding, specified by
model: Lead-Agency, Money-
Follows-Cooperation and Money-
Follows-Researcher and other
models
RFO
survey
In Share of funders research and
development budget allocated to
transnational cooperation through schemes
such as Lead-Agency, Money-Follows-
Cooperation and Money-Follows-
Researchers
RFO survey N In
P2A4 Rate of financial commitments to the
implementation (construction and
operation) of the ESFRI Roadmap
and to other global research
infrastructures of pan- European
MS /
ESFRI
In Share of cumulated GBAORD committed to
the construction and operation of the
ESFRI Roadmap
MS / ESFRI N In
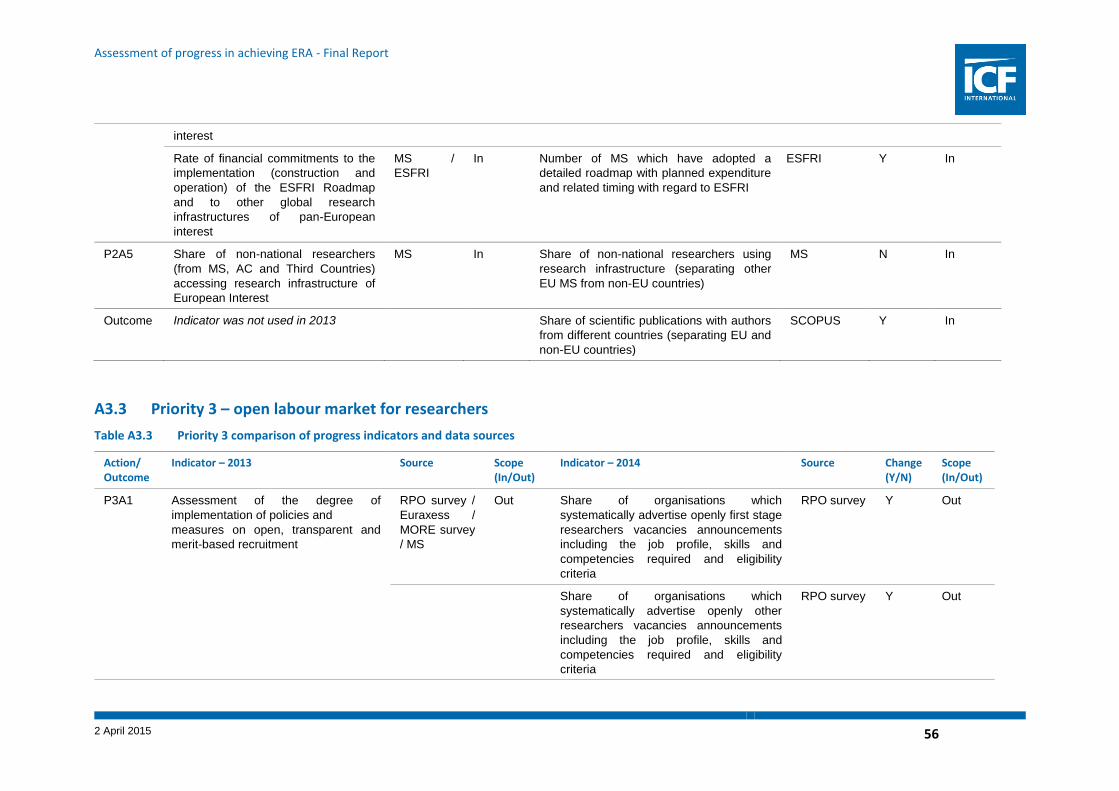
Assessment of progress in achieving ERA - Final Report
2 April 2015 56
interest
Rate of financial commitments to the
implementation (construction and
operation) of the ESFRI Roadmap
and to other global research
infrastructures of pan-European
interest
MS /
ESFRI
In Number of MS which have adopted a
detailed roadmap with planned expenditure
and related timing with regard to ESFRI
ESFRI Y In
P2A5 Share of non-national researchers
(from MS, AC and Third Countries)
accessing research infrastructure of
European Interest
MS In Share of non-national researchers using
research infrastructure (separating other
EU MS from non-EU countries)
MS N In
Outcome Indicator was not used in 2013 Share of scientific publications with authors
from different countries (separating EU and
non-EU countries)
SCOPUS Y In
A3.3 Priority 3 – open labour market for researchers
Table A3.3 Priority 3 comparison of progress indicators and data sources
Action/ Outcome
Indicator – 2013 Source Scope (In/Out)
Indicator – 2014 Source Change (Y/N)
Scope (In/Out)
P3A1 Assessment of the degree of
implementation of policies and
measures on open, transparent and
merit-based recruitment
RPO survey /
Euraxess /
MORE survey
/ MS
Out Share of organisations which
systematically advertise openly first stage
researchers vacancies announcements
including the job profile, skills and
competencies required and eligibility
criteria
RPO survey Y Out
Share of organisations which
systematically advertise openly other
researchers vacancies announcements
including the job profile, skills and
competencies required and eligibility
criteria
RPO survey Y Out

Assessment of progress in achieving ERA - Final Report
2 April 2015 57
Share of total vacancies published on
Euraxess Jobs Portal
RPO survey Out Share of organisations systematically
publishing vacancies in Euraxess for first
stage researchers
RPO survey Y Out
Share of organisations systematically
publishing vacancies in Euraxess for all
other researchers
RPO survey Y Out
P3A2 Assessment of the degree of
implementation (including financial
commitment) of policies and measures
supporting an enabling framework for
the implementation of the “HR Strategy
for Researchers"
RFO Survey In Share of funders supporting the uptake of
Code and Charter principles in line with
the HR Strategy
RFO
Survey
Y In
Assessment of the degree of
implementation (including financial
commitment) of policies and measures
supporting an enabling framework for
the implementation of the "HR Strategy
for Researchers"
RFO Survey In Share of institutions implementing the
Charter and Code principles in line with
the HR strategy where applicable
RPO survey Y Out
P3A3 Share of identified grants which are
portable across borders
RFO Survey In Share of funders whose majority of grants
are portable abroad
RFO
Survey
Y In
Share of national grants which are
accessible to non-residents
RFO Survey In Share of funders whose grants are
systematically accessible to research
organisations and researchers located
outside the country and not belonging to
intergovernmental organisations
RFO
Survey
Y In
P3A4 Share of stakeholder organisations
implementing doctoral training
programmes linking public and private
sectors
Share of PhD candidates participating
in innovative doctoral training
RPO survey /
Euraxess
Researchers'
Reports
Out Share of research performing
organisations systematically including
schemes or activities to expose PhD
students to industry/other relevant
employment sector
RPO survey Y Out
Assessment of the degree of
implementation (including financial
commitment) of policies and measures
RFO Survey In Share of research funding organisations
systematically providing support for the
implementation of structured doctoral
RFO
Survey
Y In

Assessment of progress in achieving ERA - Final Report
2 April 2015 58
supporting structured innovative
doctoral training programmes applying
the "Principles for Innovative Doctoral
Training"
training based on the Principles for
Innovative Doctoral Training
P3A5 Share of research institutions
implementing mobility programmes
between industry and academia
RPO survey Out Share of research performing
organisations systematically
implementing programmes and/or actions
to support researchers mobility outside
academia
RPO survey Y Out
Share of staff participating in mobility
programmes between industry and
academia
RPO survey Out
Outcome Share of researchers who feel that
recruitment procedures are
transparent, merit-based and open
MS /
Euraxess
Researchers'
Reports
In Share of researchers who feel that
recruitment procedures are open,
transparent and merit-based
MORE
SURVEY
N In
Share of non-national researchers Eurostat In Share of non-national researchers
(differentiating between other EU MS
from non-EU countries)
Eurostat Y In
Share of non-EU students in tertiary
education
EUROSTAT Y In
Share of non-EU doctoral holders EUROSTAT Y In
A3.4 Priority 4 – gender equality and gender mainstreaming in research
Table A3.4 Priority 4 comparison of progress indicators and data sources
Action/ Outcome
Indicator – 2013 Source Scope (In/Out)
Indicator – 2014 Source Change (Y/N)
Scope (In/Out)
P4A1 Indicator was not used in 2013 Share of funders supporting systematically
gender equality in research and the
inclusion of gender dimension in research
content
RFO Survey Y In
Indicator was not used in 2013 Share of research performing RPO survey Y Out

Assessment of progress in achieving ERA - Final Report
2 April 2015 59
organisations implementing recruitment
and promotion policies for female
researchers
Indicator was not used in 2013 Share of research performing
organisations which include the gender
dimension in research content
RPO survey Y Out
Indicator was not used in 2013 Share of funders including systematically
the gender dimension in research content
when allocating research and
development funding
RFO Survey Y In
Share of institutions which have
adopted and implement Gender
Equality Plans
RPO survey Out Share of research performing
organisations which have adopted Gender
Equality Plans
RPO survey N Out
P4A2 Indicator was not used in 2013 Share of gender-balanced recruitment
committees for leading researchers in
research performing organisations
RPO survey Y Out
Indicator was not used in 2013 Share of gender-balanced research
evaluation panels in research funding
organisations
RFO survey Y In
Outcome Share of female PHD graduates,
researchers, senior level in academic
position and in top positions
EUROSTAT In Share of female PHD graduates She Figures Y In
Share of female researchers She Figures Y In
Share of female senior researchers (grade
A) She Figures Y In
Share of females who are head of
organisation RPO survey Y In
A3.5 Priority 5 – Optimal access to and circulation and transfer of scientific knowledge
Table A3.5 Priority 5 comparison of progress indicators and data sources
Action/ Indicator - 2013 Source Scope Indicator – 2014 Source Change Scope

Assessment of progress in achieving ERA - Final Report
2 April 2015 60
Outcome (In/Out) (Y/N) (In/Out)
P5A1 Assessment of the degree of
development of MS strategies for
realising digital ERA in identification
services, provision of digital research
services and human resources
factors for supporting digital science
(eScience) approaches
MS In Indicator was not carried forward to 2014 Y
Indicator was not used in 2013 Share of funders funding systematically
open access to publications
RFO Survey Y In
Indicator was not used in 2013 Share of funders funding systematically
open access to data
RFO Survey Y In
Indicator was not used in 2013 Share of research performing
organisations making available on-line
and free of charge [publicly funded]
scientific research data systematically
RPO survey Y Out
P5A2 Indicator was not used in 2013 Share of funders supporting systematically
the implementation of knowledge transfer
as part of its institutional and/or project
based funding
RFO Survey Y In
Percentage of researchers in public
research organisations with
experience in the private sector
MORE
survey
Out Indicator was not carried forward to 2014 Y
Indicator was not used in 2013 Share of staff whose primary occupation is
in the private sector (in Full Time
Equivalents)
RPO survey Y Out
Indicator was not used in 2013 Share of research and development
budget financed by private sector
RPO survey Y Out
Number of research organisations
having a dedicated knowledge
transfer office
RPO survey Out Share of research performing
organisations having or using a structure
for knowledge transfer activities
RPO survey Y Out
Share of permanent staff (by RPO survey Out Share of research performing RPO survey Y Out

Assessment of progress in achieving ERA - Final Report
2 April 2015 61
category) employed in knowledge
transfer offices
organisations having dedicated staff
employed in knowledge transfer activities
P5A3 Indicator was not used in 2013 Share of funders R&D budget dedicated to
support the development and uptake of
digital research services
RFO Survey Y In
Share of MS implementing jointly
developed access and usage
policies for public e-infrastructures
MS In Share of research performing
organisations providing digital research
services (i.e. cloud services, research
collaboration platform, etc.)
RPO survey Y Out
P5A4 Indicator was not used in 2013 Share of funders research and
development budget dedicated to support
the development and uptake of federated
electronic identities
RFO Survey Y In
Indicator was not used in 2013 Share of research performing
organisations providing federated
electronic identities for their researchers
RPO survey Y Out
Rate of growth of academia held
patents licensed or sold to industry
RPO survey Out Rate of growth of patents held by
Research Performing Organisations RPO survey Y Out
Rate of growth of licences held by
Research Performing Organisations RPO survey Y Out
Rate of growth of licence income received
by Research Performing Organisations RPO survey Y Out
Rate of growth of the number of
Academia-Industry research training
contracts signed
RPO survey Out Rate of growth of collaborative
agreements with the private sector and/or
non-governmental sector
RPO survey Y Out
Outcome Indicator was not used in 2013 Share of co-patents held with non-national
institutions (differentiating between other
EU MS from non-EU countries)
RPO survey Y Out
Outcome Indicator was not used in 2013 Share of co-patents held with the private
sector RPO survey Y Out
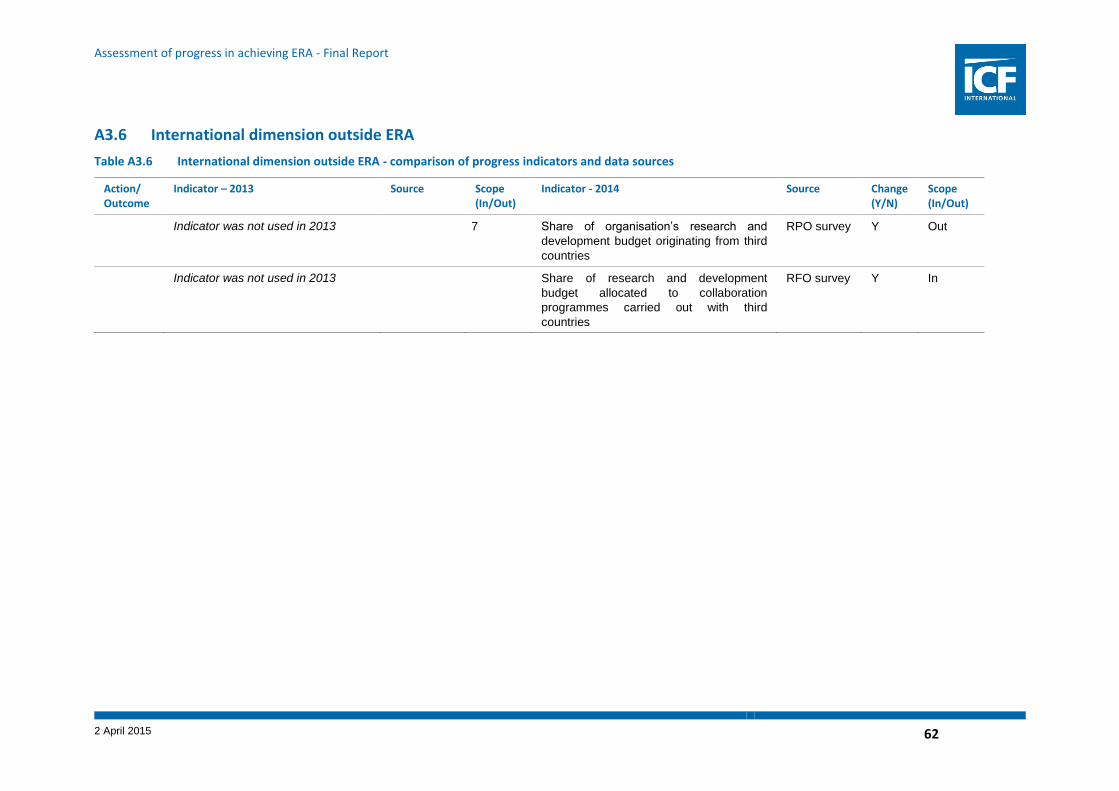
Assessment of progress in achieving ERA - Final Report
2 April 2015 62
A3.6 International dimension outside ERA
Table A3.6 International dimension outside ERA - comparison of progress indicators and data sources
Action/ Outcome
Indicator – 2013 Source Scope (In/Out)
Indicator - 2014 Source Change (Y/N)
Scope (In/Out)
Indicator was not used in 2013 7 Share of organisation’s research and
development budget originating from third
countries
RPO survey Y Out
Indicator was not used in 2013 Share of research and development
budget allocated to collaboration
programmes carried out with third
countries
RFO survey Y In

Assessment of progress in achieving ERA - Final Report
2 April 2015 63
Annex 4 Comparable indicators - 2013 and 2014
Table A4.1 Indicators that remain unchanged between 2013 and 2014
Priority Action Indicator - 2013 Indicator - 2014 Source
P1. More
effective
national
research
systems
A1. Competitive
funding through calls
for proposals
applying the core
principles of
international peer
review
Share of national
GBAORD allocated as
project-based funding
Share of national
GBAORD allocated as
projesct-based funding
MS /
OECD
P2. Optimal
transnational
co-operation
and
competition
A1. Implement joint
research agendas
Share of national
GBAORD allocated to
transnationally
coordinated research
based on common
priorities
National public funding
allocated to joint research
agendas [within
transnationally
coordinated R&D] as per
cent of GBAORD
RFO
survey
A3. Common funding
principles to make
national research
programmes
compatible,
interoperable (cross-
border) and simpler
for researchers
Share of budget allocated
to transnational funding,
specified by model: Lead-
Agency, Money- Follows-
Cooperation and Money-
Follows-Researcher and
other models
Share of funders research
and development budget
allocated to transnational
cooperation through
schemes such as Lead-
Agency, Money-Follows-
Cooperation and Money-
Follows-Researchers
RFO
survey
A4. Financial
commitments for the
construction and
operation of ESFRI,
national, regional
Research
infrastructures of
pan-European
interest
Rate of financial
commitments to the
implementation
(construction and
operation) of the ESFRI
Roadmap and to other
global research
infrastructures of pan-
European interest
Share of cumulated
GBAORD committed to
the construction and
operation of the ESFRI
Roadmap
MS /
ESFRI
A5. Access to
Research
Infrastructures of
pan-European
interest
Share of non-national
researchers (from MS, AC
and Third Countries)
accessing research
infrastructure of European
Interest
Share of non-national
researchers using
research infrastructure
(separating other EU MS
from non-EU countries)
MS
P3. Open
labour
market for
researchers
Outcome Share of researchers who
feel that recruitment
procedures are open,
transparent and merit-
based
Share of researchers who
feel that recruitment
procedures are open,
transparent and merit-
based
MORE
Survey
Note: the description of some of the indicators has changed between the two reporting periods, but the indicators
are assessed as equivalent.

Assessment of progress in achieving ERA - Final Report
2 April 2015 64
Annex 5 Indicator data availability 2013 and 2014
Table A5.1 Priority 1 - Data availability for indicators that changed between 2013 and 2014
Action/ Outcome
Indicator - 2013 Indicator - 2014 Source for 2013/2014
P1A1 Share of project based research and
development budget allocated through
peer review
RFO survey
P1A2
Share of institutions applying the
core principles for international peer
review
RFO survey
(similar data)
Share of institutional funding allocated
based on institutional assessment
and/or evaluation
RFO survey
Outcome Share of top 10 per cent scientific
publications
SCOPUS
Table A5.2 Priority 2 - Data availability for indicators that changed between 2013 and 2014
Action/ Outcome
Indicator – 2013 Indicator - 2014 Source for 2013/2014
P2A1
National public funding allocated to
transnationally coordinated R&D as
per cent of GBAORD
EUROSTAT
Assessment of the implementation
of joint research agendas
addressing grand challenges
RFO survey
P2A2
Share of institutions applying
international peer review standards
RFO survey
(similar data)
Share of funders which can base their
project based research and
development funding decisions on
peer reviews carried out by non-
national institutions
RFO survey
(similar data)
Share of institutions mutually
recognizing international peer
review standards
RFO survey
(similar data)
Share of project based research and
development budget allocated through
peer review carried out by institutions
outside the country
RFO survey
P2A3 Share of funder's research and
development budget dedicated to joint
defined research agendas with non-
national organisations
RFO survey
(similar data)
P2A4 Rate of financial commitments to the
implementation (construction and
operation) of the ESFRI Roadmap
and to other global research
infrastructures of pan-European
interest
MS / ESFRI

Assessment of progress in achieving ERA - Final Report
2 April 2015 65
Action/ Outcome
Indicator – 2013 Indicator - 2014 Source for 2013/2014
Number of MS which have adopted a
detailed roadmap with planned
expenditure and related timing with
regard to ESFRI
MS / ESFRI
Outcome Share of scientific publications with
authors from different countries
(separating EU and non-EU countries)
SCOPUS
Table A5.3 Priority 3 - Data availability for indicators that changed between 2013 and 2014
Action/ Outcome
Indicator - 2013 Indicator - 2014 Source for 2013/2014
P3A2 Assessment of the degree of
implementation (including financial
commitment) of policies and
measures supporting an enabling
framework for the implementation of
the “HR Strategy for Researchers"
RFO Survey
Share of funders supporting the uptake
of Code and Charter principles in line
with the HR Strategy
RFO Survey
P3A3 Share of identified grants which are
portable across borders
RFO Survey
(similar data)
Share of funders whose majority of
grants are portable abroad
RFO Survey
(similar data)
Share of national grants which are
accessible to non-residents
RFO Survey
(similar data)
Share of funders whose grants are
systematically accessible to research
organisations and researchers located
outside the country and not belonging
to intergovernmental organisations
RFO Survey
(similar data)
P3A4 Assessment of the degree of
implementation (including financial
commitment) of policies and
measures supporting structured
innovative doctoral training
programmes applying the
"Principles for Innovative Doctoral
Training"
RFO Survey
Share of research funding
organisations systematically providing
support for the implementation of
structured doctoral training based on
the Principles for Innovative Doctoral
Training
RFO Survey
(similar data)
Outcome Share of non-EU students in tertiary
education
EUROSTAT
Share of non-EU doctoral holders EUROSTAT

Assessment of progress in achieving ERA - Final Report
2 April 2015 66
Table A5.4 Priority 4 - Data availability for indicators that changed between 2013 and 2014
Action/ Outcome
Indicator - 2013 Indicator - 2014 Source for 2013/2014
P4A1 Share of funders supporting
systematically gender equality in
research and the inclusion of gender
dimension in research content
RFO Survey
Share of funders including
systematically the gender dimension
in research content when allocating
research and development funding
RFO Survey
(similar data)
Outcome
Share of female PHD graduates,
researchers, senior level in
academic position and in top
positions
EUROSTAT
Share of female PHD graduates EUROSTAT
Share of female researchers EUROSTAT
Share of female senior researchers
(grade A)
She Figures
Table A5.5 Priority 5 - Data availability for indicators that changed between 2013 and 2014
P5A1 Assessment of the degree of
development of MS strategies for
realising digital ERA in
identification services, provision of
digital research services and
human resources factors for
supporting digital science
(eScience) approaches
MS
Share of funders funding
systematically open access to
publications
RFO Survey
(similar data)
Share of funders funding
systematically open access to data
RFO Survey
(similar data)
P5A2 Share of funders supporting
systematically the implementation of
knowledge transfer as part of its
institutional and/or project based
funding
RFO Survey
(similar data)
P5A3 Share of funders R&D budget
dedicated to support the
development and uptake of digital
research services
RFO Survey
(similar data)
Share of MS implementing jointly
developed access and usage
policies for public e-infrastructures
MS
P5A4 Share of funders research and
development budget dedicated to
support the development and uptake
of federated electronic identities
RFO Survey
(similar data)

Assessment of progress in achieving ERA - Final Report
2 April 2015 67
Annex 6 Summary of evaluation progress, steps 1-3
This section summarises the evaluation status after the application of Steps 1-3 for each priority, by
action and indicator. It shows where progress could be assessed based on available information and
where other information would be required to fill the gaps.
A6.1.1 Priority 1 – more effective national research systems
The first ERA priority is to establish more effective national research systems in order to increase
competition and excellence within national borders and ensure the best and most effective funding
allocation.
The first priority consists of two actions:
■ (P1A1) Competitive funding through calls for proposals applying international peer review; and
■ (P1A2) Institutional funding-based on institutional assessment.
The evaluation status of ERA priority 1 is summarised in Table A6.1. It shows the results from applying
the tests in Steps 1-3 of the evaluation framework.
Table A6.1 Priority 1 - Evaluation status
Actions / Outcomes
Reference year
No. of indicators
Test 1 - No. of indicators in scope
Test 2 - No. of directly comparable indicators
Test 3 - No. of indicators for which info can be obtained in the other reporting period
Summary
P1A1 2013 2 2
1 0 Two indicators could be used
to assess progress 2014 2 2 1
P1A2 2013 1 1
0 1 Two indicators could be used
to assess progress 2014 1 1 1
Outcome 2013 0 n/a
n/a n/a One indicator could be used
to assess progress 2014 1 1 1
A6.1.2 Priority 2 – optimal transnational co-operation and competition
The second ERA priority is to establish a common research agenda, improve interoperability and
comparability of national programmes, and build effective pan-European research infrastructures.
The second priority consists of five actions:
■ (P2A1) Implement joint research agendas.
■ (P2A2) Mutual recognition of evaluations that conform to international peer-review standards.
■ (P2A3) Common funding principles to make national research programmes compatible,
interoperable (cross-border) and simpler for researchers.
The following two actions are specific to the priority area on ‘research infrastructure’:20
■ (P2A4) Financial commitments for the construction and operation of ESFRI, national, regional
Research infrastructures of pan-European interest; and
■ (P2A5) Access to Research Infrastructures of pan-European interest.
20
In the first progress report, ERA actions specific to research infrastructure were part of priority two ‘optimal transnational co-operation and competition’. The updated indicator list provided by DG RTD has classified the ERA actions specific to research infrastructure under the priority ‘research infrastructures’.

Assessment of progress in achieving ERA - Final Report
2 April 2015 68
The evaluation status of ERA Priority 1 is summarised in Table A6.2. It shows the results from
applying the tests in Steps 1-3 of the evaluation framework.
Table A6.2 Priority 2 - Evaluation status
Actions / Outcomes
Reference year
No. of indicators
Test 1 - No. of indicators in scope
Test 2 - No. of directly comparable indicators
Test 3 - No. of indicators for which info can be obtained in the other reporting period
Summary
P2A1 2013 2 2
1 1 3 indicators could be used to
assess progress 2014 2 2 1
P2A2 2013 3 3
0 2 4 indicators could be used to
assess progress 2014 2 2 2
P2A3 2013 1 1
1 0 2 indicators could be used to
assess progress 2014 2 2 1
P2A4 2013 2 2
1 1 3 indicators could be used to
assess progress 2014 2 2 1
P2A5 2013 1 1
1 0 1 indicator could be used to
assess progress 2014 1 1 0
Outcome 2013 0 n/a
n/a n/a 1 indicator could be used to
assess progress 2014 1 1 1
A6.1.3 Priority 3 – open labour market for researchers
The third ERA priority is to increase researcher mobility, training and attractive career development. It
contains five actions:
■ (P3A1) Open, transparent and merit based recruitment of researchers.
■ (P3A2) Researchers’ careers.
■ (P3A3) Cross-border access to and portability of national grants.
■ (P3A4) Support structured innovative doctoral training programmes; and
■ (P3A5) Support mobility between private and public sector.
The evaluation status of ERA priority 1 is summarised in Table A6.3. It shows the results from applying
the tests in Steps 1-3 of the evaluation framework.
Table A6.3 Priority 3 - Evaluation status
Actions / Outcomes
Reference year
No. of indicators
Test 1 - No. of indicators in scope
Test 2 - No. of directly comparable indicators
Test 3 - No. of indicators for which info can be obtained in the other reporting period
Summary
P3A1
2013 2 0
0
0 No indicator data to use for
assessment; other info.
sources need to be consulted 2014 4 0 0
P3A2 2013 2 2
0 1 2 indicators could be used to
assess progress 2014 2 1 1
P3A3 2013 2 2 0 2 4 indicators could be used to

Assessment of progress in achieving ERA - Final Report
2 April 2015 69
2014 2 2 2 assess progress
P3A4 2013 2 1
0 1 2 indicators could be used to
assess progress 2014 2 1 1
P3A5
2013 2 0
n/a
n/a No indicator data to use for
assessment; other info.
sources need to be consulted 2014 1 0 n/a
Outcome 2013 2 2
1 2 7 indicators could be used to
assess progress 2014 4 4 4
A6.1.4 Priority 4 – gender equality and gender mainstreaming in research
The fourth ERA priority aims to make better use of diverse scientific human resources as a way to
foster quality and relevance of research.
The fourth priority consists of two actions:
■ (P4A1) Foster cultural and institutional change on gender; and
■ (P4A2) Gender balance in decision making process.
The evaluation status of ERA priority 1 is summarised in Table A6.4. It shows the results from applying
the tests in Steps 1-3 of the evaluation framework.
Table A6.4 Priority 4 - Evaluation status
Actions / Outcomes
Reference year
No. of indicators
Test 1 - No. of indicators in scope
Test 2 - No. of directly comparable indicators
Test 3 - No. of indicators for which info can be obtained in the other reporting period
Summary
P4A1 2013 1 0
n/a n/a 2 indicators could be used to
assess progress 2014 5 2 2
P4A2 2013 0 n/a
n/a n/a 1 indicator could be used to
assess progress 2014 2 1 1
Outcome 2013 1 1
0 1 5 indicators could be used to
assess progress 2014 4 4 4
A6.1.5 Priority 5 – Optimal access to and circulation and transfer of scientific knowledge
The fifth ERA priority aims to improve access to and uptake of knowledge and facilitate innovation.
The fifth priority consists of four actions:
■ (P5A1) Open access for publications and data resulting from publicly funded research.
■ (P5A2) Open innovation (OI) and knowledge transfer (KT) between public and private sectors.
■ (P5A3) Harmonise policies for public e-infrastructures and associated digital research services;
and
■ (P5A4) Uptake of federated electronic identities.
The evaluation status of ERA priority 1 is summarised in Table A6.5. It shows the results from applying
the tests in Steps 1-3 of the evaluation framework.

Assessment of progress in achieving ERA - Final Report
2 April 2015 70
Table A6.5 Priority 5 - Evaluation status
Actions / Outcomes
Reference year
No. of indicators
No. of indicators in scope
No. of directly comparable indicators
No of indicators for which info can be obtained in the other reporting period
Summary
P5A1 2013 1 1
0 1 3 indicators could be used to
assess progress 2014 3 2 2
P5A2 2013 3 0
n/a n/a 1 indicator could be used to
assess progress 2014 5 1 1
P5A3 2013 1 1
0 1 2 indicators could be used to
assess progress 2014 2 1 1
P5A4 2013 2 0
n/a n/a 1 indicator could be used to
assess progress 2014 6 1 1
Outcome
2013 0 n/a
n/a
n/a No indicator data to use for
assessment; other info.
sources need to be consulted 2014 2 0 n/a
A6.1.6 International Dimension outside ERA
This priority takes into account the globalisation of knowledge and research and aims to build
international cooperation for research. This priority has one action:
■ Openness of Member State/Associated Country for international cooperation
The evaluation status of ERA priority 1 is summarised in Table A6.6. It shows the results from applying
the tests in steps 1-3 of the evaluation framework.
Table A6.6 International Dimension outside ERA - Evaluation status
Action / Outcome
Reference year
No. of indicators
No. of indicators in scope
No. of directly comparable indicators
No of indicators for which info can be obtained in the other reporting period
Summary
2013 0 n/a
0
n/a Baseline could be established
for this outcome, but not
progress

Assessment of progress in achieving ERA - Final Report
8 May 2 April 2015 71
Annex 7 ERA intervention logics
Figure A7.1 Intervention Logic – ERA Priority 1 – More effective national research systems
1. More effective national research systems
ERA Priorities(Objectives)
ERA Actions
1a. Competitive funding through calls for proposals applying international peer review
Activities
1b. Institutional funding-based on institutional assessment
increased share of competitively allocated funding through RFO in total RTD spending.
increased share of RTD budget allocated through peer review
Increases share of institutional funding allocated to RPOs based on institutional assessment and/or evaluation and performance-related indicators.
Outputs Outcomes Impacts
Increased number of high-impact scientific publications
Increased social impact of research
Increased number of patent applications and co-patents
Improve capacity and efficiency of national research systems
Higher degree of specialisation
Higher performance in scientific and commercial output
Less overlap in research and scientific profiles
Problem areas
Limited public resources for RTD
Insufficient competition in national research systems
Strong variation in share of competitively allocated funding across EU
Little institutional funding based on performance criteria
Strong overlap in research profiles of RFOs and RPOs, no specialisation.
MS/AC introduce qualitative performance goals for institutional funding mechanisms
MS/AC and RFOs design or amend national research and innovation strategies and funding mechanisms

Assessment of progress in achieving ERA - Final Report
8 May 2 April 2015 72
Figure A7.2 Intervention Logic – ERA priority 2 – Optimal transnational cooperation and competition

Assessment of progress in achieving ERA - Final Report
8 May 2 April 2015 73
Figure A7.3 Intervention Logic – ERA priority 3 – Open Labour Market for researchers
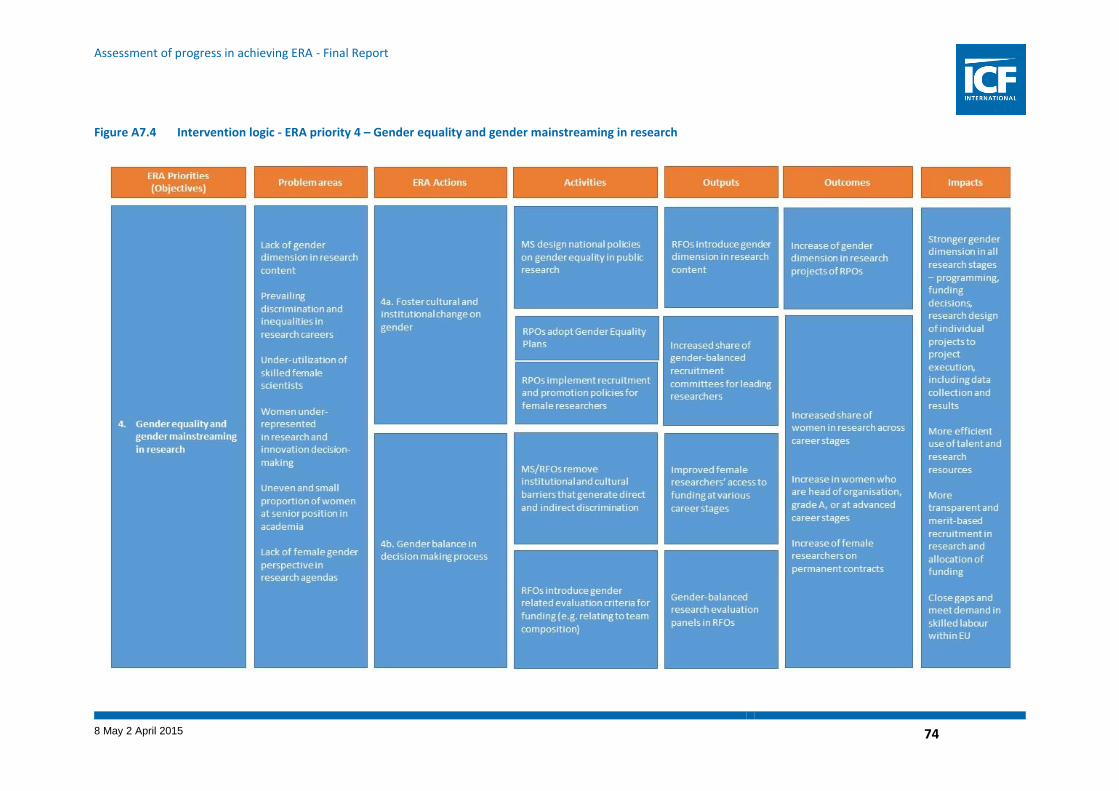
Assessment of progress in achieving ERA - Final Report
8 May 2 April 2015 74
Figure A7.4 Intervention logic - ERA priority 4 – Gender equality and gender mainstreaming in research

Assessment of progress in achieving ERA - Final Report
8 May 2 April 2015 75
Figure A7.5 Intervention logic - ERA priority 5 – Optimal access to and circulation and transfer of scientific knowledge

Assessment of progress in achieving ERA - Final Report
8 May 2 April 2015 76
Figure A7.6 Intervention logic - ERA priority International dimension outside ERA

Assessment of progress in achieving ERA - Final Report
2 April 2015 77
Annex 8 Indicator maps and indicator appraisal tables
This annex provides details of the indicator maps and indicator appraisals discussed in section 3.
Indicator maps and appraisals are provided together for each priority area. Indicator maps present the
complete set of indicators identified for the priority area alongside the priority’s actions, although
indicators should not be read directly against actions. A key to the indicator maps is provided in Table
A8.1. A table appraising each indicator is also provided. Table A8.2 provides the scoring system used
for the assessment. This is followed by an appraisal of the indicators suggested by DG RTD.
Table A8.1 Indicator maps - key
Map colour / shading
Yellow Indicators suggested by DG RTD for particular consideration. These are included in the wider indicator
appraisal, but additional appraisals with more detailed comments are also provided for these for each ERA
priority area.
Blue dots Indicators that have been used in ERA progress reports.
Grey dots Indicators that have been used in the Commission’s RPO survey. Assessment of these indicators is out of
scope for this study, but are presented here to demonstrate where information about research performing
organisations is being used to assess ERA progress.
Green i) Indicators which have been identified in reports prepared by expert groups reviewing the ERA monitoring
mechanisms (e.g. Doussineau et al., 2013; EC, 2008b, 2009, 2013b) (ii) indicators available from datasets
considered for this study (OECD, Eurostat, the Innovation Union Scoreboard, etc.); and (iii) indicators that
can be derived easily from the separate activities identified through the intervention logics. These
indicators could be useful to fill gaps in the monitoring framework, particularly in the measurement of
outputs and outcomes.
Table A8.2 Indicator scoring system
Criterion Scoring
Availability (frequency, timeliness)
Not available: 0
Low: 1
Medium: 2
High: 3
Reliability
Not at all: 0
Low: 2
Medium: 4
High: 6
Relevance
Not at all: 0
Low: 2
Medium: 4
High: 6
Completeness
Not at all: 0
Low: 1
Medium: 2
High: 3
Accessibility
Not at all: 0
Low: 1
Medium: 2
High: 3
Ability to assess the effectiveness of ERA
Not at all: 0
Low: 1
Medium: 2
High: 3
Overall score Sum of scores (out of 24)

Assessment of progress in achieving ERA - Final Report
8 May 2015 78
A8.2 Priority 1 – More effective national research systems
Figure A8.1 Priority 1 – potential input, output and outcome/impact indicators

Assessment of progress in achieving ERA - Final Report
8 May 2015 79
Table A8.3 Indicators Appraisal - Priority Area 1
Indicator Type Data Source Information collected (denominator/ numerator)
Availability (Frequency, timeliness)
Reliability Relevance Completeness Accessibility Ability to assess effectiveness of ERA
Score /24
Share of the
budget of R&D
project-based
funding allocated
through a peer
review process
Input This indicator is
not reported in
official STI
statistics,
nationally.
It has not so far
been collected
through ERA
surveys, but
could be included
in future surveys.
n/a n/a Future ERA
surveys could
produce data for
a majority of MS,
but robustness of
the estimates is
uncertain: data
are not gathered
nationally and
there are major
differences in
funding systems
and definition of
peer review
procedures.
Project-based
funding typically
allocated based
on peer review
n/a n/a Low
0 0 2 0 0 1 3
Share of the
national
institutional
funding allocated
on the basis of
institutional
assessments
Input Data collected
through the ERA
Survey 2014.
n/a High Data is obtained
through a survey,
1-2 year’s data
available; issues
include: (i) low
MS response
rates (ii) data are
not formally
reported in most
MS so survey
responses are
estimates and
(iii) variability in
the working
definitions used
in preparing
estimates.
The allocation of
institutional R&D
funding based on
past performance
is an accepted
means by which
to increase
effectiveness of
research
systems. But
there is no
evidence that a
greater share of
assessment-
based funding
leads to better
results.
The survey
collected data for
EU MS in 2013,
with 21 countries
providing a
response.
High Low

Assessment of progress in achieving ERA - Final Report
8 May 2015 80
Indicator Type Data Source Information collected (denominator/ numerator)
Availability (Frequency, timeliness)
Reliability Relevance Completeness Accessibility Ability to assess effectiveness of ERA
Score /24
3 2 2 2 3 1 13
Share of block
and institutional
funding allocated
using
performance-
based criteria, as
share of national
GBAORD
Input Data not
available
(Suggested by
ERA expert
group (2013))
Not available
Institutional
performance-based
funding (IPBF) /
GBAORD
n/a
Annual
n/a
Simple
estimations of
IPBF
n/a
Highly relevant
n/a
n/a
Possible for
ERAC
delegations to
make a rapid
assessment
n/a
Relevant, although
the results / target
would need careful
calibration
0 2 4 0 0 0 6
Total GBAORD
as per cent of
GDP
Input OECD Main
Science and
Technology
Indicators,
Eurostat
GBAORD / GDP Annual, time
series, one-
year or two-
year time lag
High
Medium
High
High
Could serve as an
input indicator for
measuring progress
of both ERA actions
within this priority
(competitive funding
based on calls for
proposals and
institutional funding
based on institutional
assessment).
3 6 4 3 3 0 19
Degree to which
MS use
international
experts in its peer
review
Input ERA Survey MS with provisions
for using the core
principles for
international peer
review / all MS
High Medium
High
High Medium
Could serve as an
indicator because
ERA survey assesses
ERA progress.
3 4 6 3 2 2 20
Degree to which
MS use
evaluation criteria
for allocating
Input ERA Survey RFOs using
appropriateness and
excellence as
evaluation criteria in
High
Medium
High
High
Medium
Could serve as an
indicator because
ERA survey assesses
ERA progress.

Assessment of progress in achieving ERA - Final Report
8 May 2015 81
Indicator Type Data Source Information collected (denominator/ numerator)
Availability (Frequency, timeliness)
Reliability Relevance Completeness Accessibility Ability to assess effectiveness of ERA
Score /24
project based
funding
the peer review / all
RFOs
3 4 6 3 2 2 20
Degree to which
MS institutional
funding is linked
to performance
Input ERA Survey MS with institutional
funding linked to
performance / All
MS
High Medium
High High Medium
Could serve as an
indicator because
ERA survey assesses
ERA progress.
3 4 6 3 2 2 20
Share of the
National
GBOARD
allocated through
project-based
funding (as
opposed to
institutional
funding)
Output Data collected
through the ERA
Survey 2014
Data formally
recorded in a
small number of
EU MS, so based
largely on
estimates
The survey
collected data for
the EU MS in 2013,
with 21 countries
providing a
response
Project-based funding
is an accepted means
by which to generate
competition among
researchers and
improve quality and
productivity overall.
3 4 6 2 3 3 21
Share of
competitive
funding vs. block
funding as share
of national
GBAORD
Output Eurostat
(gba_fundmod))
Institutional [block]
funding in MEURO /
total R&D
appropriations in
MEURO
2007 -
present
Medium
High
Low
High
Lack of evidence-
based target: ability to
measure
effectiveness is
therefore low; in
combination with
other indicators
medium to high.
2 4 6 1 3 2 18
atent applications
in grand
challenges per
billion GDP (in
Outcome/
Impact
OECD Total patents
(granted, EPO) /
patents granted by
grand challenge
Only total
patents
available;
disaggregated
High
Medium
2003-2010
(environmental
patents), all
patents <2000
High only for
environmental
patents. For other
grand challenges
Low effectiveness.
Focus is on one or
two grand challenges;
innovation output

Assessment of progress in achieving ERA - Final Report
8 May 2015 82
Indicator Type Data Source Information collected (denominator/ numerator)
Availability (Frequency, timeliness)
Reliability Relevance Completeness Accessibility Ability to assess effectiveness of ERA
Score /24
PPS Euro) data not
available
patents may not
be a useful output
measure
mainly from the
private sector and not
on ERA.
2 6 4 3 2 1 19
Number of
patents per total
public R&D
expenditure
Outcome/
Impact
Eurostat Number of patents
(applications at
EPO) / total public
R&D expenditure
<2000
High
High
High
High
Measures efficiency
of public spending for
innovation output.
High ability to
measure
effectiveness
3 6 6 3 3 3 24
Trademarks as
per cent GDP
Outcome/
Impact
OECD Science
and Technology
Outlook
Index of
performance
(number of
trademark
applications per
billion US dollars /
GDP at purchasing
power parity (PPP))
relative to the
median in the OECD
Available,
delay in the
data on
trademarks
(taken from
World
Intellectual
Property
Organisation
(WIPO))
Medium
High
Medium
High
Technology balance
of payments
measures
international
technology transfers:
licence fees, patents,
purchases and
royalties paid, know-
how, research and
technical assistance.
Related to GDP, it
can help to measure
the effectiveness.
2 4 6 2 3 2 19
Revealed
technological
advantage in bio-
and nano-
technology, ICT
and environment
Outcome/
Impact
OECD Science
and Technology
Outlook
Country’s share of
patents in a
particular technology
field / country’s
share in all patent
fields.
Available
annually
High
Medium
Medium
High
Provides an indication
of the relative
specialisation of a
given country in
selected technological
domains and is based

Assessment of progress in achieving ERA - Final Report
8 May 2015 83
Indicator Type Data Source Information collected (denominator/ numerator)
Availability (Frequency, timeliness)
Reliability Relevance Completeness Accessibility Ability to assess effectiveness of ERA
Score /24
The index is equal to
zero when the
country holds no
patent in a given
sector; is equal to 1
when the country’s
share in the sector
equals its share in
all fields (no
specialisation); and
above 1 when a
positive
specialisation is
observed. Only
economies with
more than 500
patents over the
period reviewed are
included.
on patent applications
filed under the Patent
Cooperation Treaty.
Can help to measure
effectiveness.
3 6 4 2 3 2 20

Assessment of progress in achieving ERA - Final Report
8 May 2015 84
Table A8.4 Priority 1 - appraisal of indicators suggested by DG RTD
Proposed Indicator Data source / Availability Relevance Robustness Conclusion
Share of the National
GBOARD allocated
through project-
based funding (as
opposed to
institutional funding)
This indicator is not reported in
official STI statistics, nationally.
The data have been collected
through the ERA Survey 2014.
The survey collected data for the
EU MS for 2013, with 21
countries providing a response
Project-based funding is an accepted means by which to
generate competition among researchers and improve
quality and productivity overall
Survey data collected over 1-2 years.
Data not formally recorded in many EU
MS, so based on estimates
Recommended
Share of the budget
of R&D project-based
funding allocated
through a peer
review process
This indicator is not reported in
official STI statistics, nationally.
Not collected through ERA
surveys, but could be included in
future surveys.
Project-based funding allocated following the use of peer
review, risk that it will be 100 per cent for everyone.
Some countries / funders may still rely on high-level
committees to determine winners and losers, without
recourse to formal peer review.
Adds little value over the metric ‘per cent of project
based funding’. Support to private R&D is generally not
awarded on a ‘peer review’ basis in the strict sense of
the term.
Not yet collected.
Additional question in future ERA
surveys could produce data for a
majority of EU MS, but the robustness
of the estimates is uncertain because
data are not being gathered and
reported nationally and there are major
differences in funding systems and
definition of peer review procedures.
Not
recommended
Share of the national
institutional funding
allocated on the
basis of institutional
assessments
This indicator is not reported in
official STI statistics, nationally.
The data have been collected
through the ERA Survey 2014.
The survey collected data for the
EU MS for 2013, with 21
countries providing a response.
The allocation of institutional funding for R&D based on
past performance is an accepted means by which to
increase effectiveness of research systems.
Institutional funding is a more powerful form of
intervention in a national research system, as compared
with project-based funding but it is more contentious as a
result.
There is a high degree of variability in national funding
systems, which makes this indicator less relevant.
If it is taken forward, the Commission will need consider
calibration of targets and international norms.
Data obtained through a survey, with
data for 1-2 years and with some
shortcomings in terms of: (i) MS
response rates (ii) data are not formally
reported in most MS so survey
responses are estimates and (iii)
variability in the working definitions
used in preparing estimates.
Not
recommended

Assessment of progress in achieving ERA - Final Report
8 May 2015 85
A8.3 Priority 2 – Optimal transnational cooperation and competition
Figure A8.2 Priority 2 – potential input, output and outcome/impact indicators

Assessment of progress in achieving ERA - Final Report
8 May 2015 86
Table A8.5 Indicators Appraisal - Priority Area 2
Indicator Type Data Source Information collected
(denominator/
numerator)
Availability
(Frequency,
timeliness)
Reliability Relevance Completeness Accessibility Ability to assess
effectiveness of
ERA
Score
/ 24
Share of national public
funding for R&D
transnationally co-
ordinated, expressed as a
percentage of GBOARD
Input Not collected n/a n/a The share of
national funding
where this condition
of transnational
coordination applies
would necessarily
be small, and
subject to so many
external factors as
to be meaningless
The involvement
of non-national
research
agencies /
partners in the
framing of
national research
priorities provides
a useful indication
of the extent to
which a country is
outward looking
and receptive to
international
perspectives and
priorities
n/a n/a
0 2 4 0 0 0 6
Share of the budget
allocated through a peer
review conducted by
foreign institutions
Input Not collected n/a n/a Low Relevance is
unclear; risk of
only identifying
structural
differences
between smaller
and larger
research systems
n/a n/a Low
0 2 2 0 0 0 4
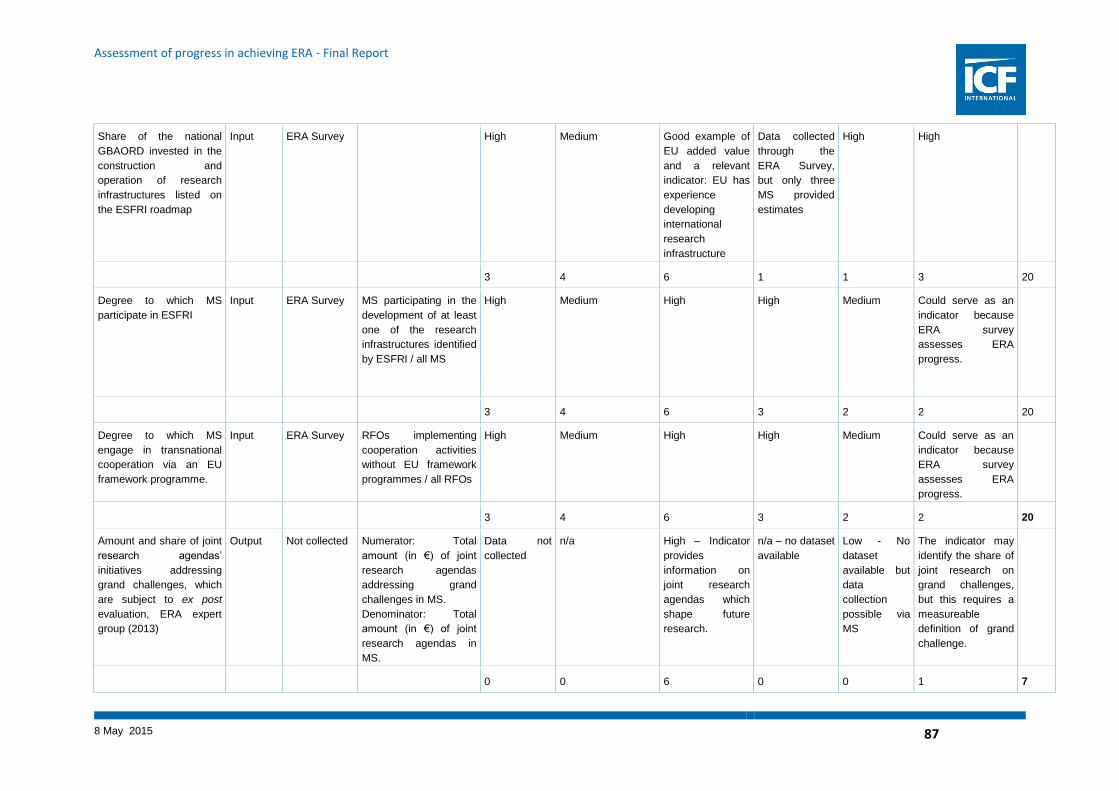
Assessment of progress in achieving ERA - Final Report
8 May 2015 87
Share of the national
GBAORD invested in the
construction and
operation of research
infrastructures listed on
the ESFRI roadmap
Input ERA Survey High Medium Good example of
EU added value
and a relevant
indicator: EU has
experience
developing
international
research
infrastructure
Data collected
through the
ERA Survey,
but only three
MS provided
estimates
High High
3 4 6 1 1 3 20
Degree to which MS
participate in ESFRI
Input ERA Survey MS participating in the
development of at least
one of the research
infrastructures identified
by ESFRI / all MS
High
Medium
High
High
Medium
Could serve as an
indicator because
ERA survey
assesses ERA
progress.
3 4 6 3 2 2 20
Degree to which MS
engage in transnational
cooperation via an EU
framework programme.
Input ERA Survey RFOs implementing
cooperation activities
without EU framework
programmes / all RFOs
High
Medium
High High
Medium
Could serve as an
indicator because
ERA survey
assesses ERA
progress.
3 4 6 3 2 2 20
Amount and share of joint
research agendas’
initiatives addressing
grand challenges, which
are subject to ex post
evaluation, ERA expert
group (2013)
Output Not collected Numerator: Total
amount (in €) of joint
research agendas
addressing grand
challenges in MS.
Denominator: Total
amount (in €) of joint
research agendas in
MS.
Data not
collected
n/a
High – Indicator
provides
information on
joint research
agendas which
shape future
research.
n/a – no dataset
available
Low - No
dataset
available but
data
collection
possible via
MS
The indicator may
identify the share of
joint research on
grand challenges,
but this requires a
measureable
definition of grand
challenge.
0 0 6 0 0 1 7

Assessment of progress in achieving ERA - Final Report
8 May 2015 88
Share of public funding
allocated to transnational
R&D cooperation, ERA
expert group (2013)
Output Eurostat Numerator: public
funding allocated to
transnational R&D
cooperation
Denominator: total
public funding on R&D
by MS
2007-2012 High
High - Indicator
provides
information on
share of
transnational R&D
funding
High
High
High – It indicates a
growth or decline
concerning
international
cooperation.
2 6 6 3 3 3 23
Share of national
GBAORD allocated to
transnationally
coordinated research
based on grand
challenges, ERA expert
group (2013)
Output Not collected Numerator: national
GBAORD allocated to
transnationally
coordinated research
based on grand
challenges
Denominator: total
national GBAORD of
MS
n/a –
Breakdown by
grand
challenges
not available
n/a
High - Indicator
provides
information on
share of
transnational R&D
funding on grand
challenges
n/a – No
dataset
available
Low - No
dataset
available but
data
collection
possible via
MS
Medium – High.
Variant of previous
indicator.
Breakdown by
grand challenges
may not be
necessary for
measuring ERA
effectiveness.
0 0 6 0 1 2 9
Financial commitments to
research infrastructures,
categorised as
‘approved’, ‘under review’
and ‘possible’ and by date
for expected decisions
regarding future funding,
ERA expert group (2013)
Output Data
collection
possible via
MS
Numerator: Total
national funding
earmarked for research
infrastructures
Denominator: Total
funding on national
infrastructures
n/a - data has
not been
collected yet
n/a yet
Medium – The
indicator provides
information on
financial
commitments for
research
infrastructure as
per cent of total
expenditure on
infrastructures
n/a – no dataset
available
Low - No
dataset
available but
data
collection
possible via
MS. Proxy
could be
developed
based on
Structural
Funds (SF)
appropriations
.
Medium – The
indicator is based
on the national
definition of
research
infrastructure; lacks
a common
definition.
Poor indicator of
ERA effectiveness
given large
discrepancies of
scale and scope of
existing research
infrastructures.
Requires demand

Assessment of progress in achieving ERA - Final Report
8 May 2015 89
analysis for
relevance.
0 0 4 0 1 2 7
List of national actions
designed to enhance
cross-border access of
scientific researchers,
ERA expert group (2013)
Output Data
collection
possible via
MS
List of actions and
regulations published
on government
research portal
n/a - Data has
not been
collected yet
n/a yet
Low – Indicator is
unclear on what
will be counted.
Counting does not
indicate
intensities.
n/a – No
dataset
available
Low - No
dataset
available but
data
collection
possible via
MS
Low - indicator
based on counting
measures and not
on intensities
0 0 2 0 1 1 4
Per cent of research
performers experiencing
problems accessing to
research infrastructure
Output ERA Survey Research performers
experiencing problems /
all research performers
High Medium
High High
Medium
Could serve as an
indicator because
ERA survey
assesses ERA
progress.
3 4 6 3 2 2 20
Number of preparatory-
phase ESFRI projects in
which each MS is
involved, ERA expert
group (2013)
Outcome/
Impact
Data
collection
possible
through
ESFRI
projects and
MS
Numerator: number of
preparatory-phase
ESFRI projects in which
MS are involved
Denominator: Total
number of transnational
infrastructure projects in
which MS are involved
See ESFRI
Roadmap
(update)
High
Medium – The
indicator is a
variant on
research
infrastructure /
ESFRI funding
High – Data is
collected via
ESFRI
High – Data is
available
through
ESFRI
High – Indicates
effectiveness of
ERA by better
allocating and
sharing resources.
2 6 4 3 3 3 21
Number of Outcome/ Numerator: Number of See ESFRI High Medium – The High – Data is High – Data is High – Indicates

Assessment of progress in achieving ERA - Final Report
8 May 2015 90
implementation phase
ESFRI projects in which
each MS is a partner,
ERA expert group (2013)
Impact implementation phase
ESFRI projects in which
each MS is involved.
Denominator: Total
number of transnational
infrastructure projects in
which MS are involved
Roadmap
(update)
indicator is a
variant on
research
infrastructure /
ESFRI funding
collected via
ESFRI
available
through
ESFRI
effectiveness of
ERA by better
allocating and
sharing resources.
2 6 4 3 3 3 21
Impact of internationally
mobile scientists, inflows
versus outflows
Outcome/
Impact
OECD
Science,
Technology
and Industry
Scoreboard
The scientific impact of
researchers moving
across countries is
measured by proxy
through the quality of
the journals they
publish in. Source-
normalised impact per
paper
(SNIP) is the ratio of a
journal’s average
citation count per paper
and the citation
potential of its subject
field.21
An impact value
higher than one
meansthat the median-
attributed SNIP for
authors of that
country/category is
above average.
Available
annually
High
Medium
High
High
Indicator is based
on citation impact
and changes in the
affiliation of
scientific authors.
Given its
international
dimension, it can
serve very well for
this ERA priority.
3 6 4 3 3 3 22
21
The citation potential represents the likelihood of being cited for documents in a particular field. Impact is estimated by calculating, for each author and mobility profile, the median across the relevant journals’ SNIP, over the entire period.

Assessment of progress in achieving ERA - Final Report
8 May 2015 91
International collaboration
in science and innovation
Outcome/
Impact
OECD
Science,
Technology
and Industry
Scoreboard
International co-
authorship of scientific
publications is based on
the share of articles
featuring authors
affiliated with foreign
institutions in total
articles produced by
domestic institutions.
Co-inventions are
measured as the share
of patent applications
with at least one
co-inventor located
abroad in total patents
invented domestically
Available
annually
High
High
High
High
Indicator is based
on co-authorship
and co-invention as
a percentage of
scientific
publications and
Patent Cooperation
Treaty (PCT)
applications.
A good indicator of
this priority area
given its
international
dimension.
3 6 6 3 3 3 24
Cross-border ownership
of patents
Outcome/
Impact
OECD
Science,
Technology
and Industry
Scoreboard
Foreign ownership of
domestic inventions is
measured as the share
of patents invented in
one country that is
owned by residents in
another country of total
patents invented
domestically.
Domestic ownership of
inventions from abroad
is measured as the
share of patents owned
by country residents
with at least one foreign
inventor of total patents
owned by country
residents.
Available
annually
High
Medium
High
High
A good indicator of
this priority area
given its
international
dimension.

Assessment of progress in achieving ERA - Final Report
8 May 2015 92
3 6 4 3 3 3 22
License and patent
revenues from abroad as
per cent of GDP
Outcome/
Impact
Eurostat
Numerator: License and
patent revenues from
abroad
Denominator: Annual
GDP of MS
Database of
policy
measures for
Innovation
Union
Scoreboard
available
since 2009
Medium
Medium – The
indicator
measures one
component of the
impact of R&D i.e.
revenues from
intellectual
property rights
(IPR)
Data available
for all MS
Datasets are
available in
accessible
format
Medium – The
indicator provides
important
information on
license and patent
revenues from
abroad which point
to the competitive
value of R&D
3 4 4 3 3 2 19
Technology balance of
payments as per cent
GDP
Outcome/
Impact
OECD
Science,
Technology
and Industry
Scoreboard
(Technology exports –
Technology imports) /
GDP
Available
annually
High
High
High
High
Could serve as an
indicator for this
priority because it
measures another
dimension of
internationalisation
in R&D.
3 6 6 3 3 3 24
International technology
flows of royalties and
licence fees
Outcome/
Impact
OECD
Science,
Technology
and Industry
Scoreboard
Annual growth rate Available
annually
High
Medium
High
High
Could serve as an
indicator for this
priority because it
measures another
dimension of
internationalisation
in R&D.
3 6 4 3 3 3 22

Assessment of progress in achieving ERA - Final Report
8 May 2015 93
Table A8.6 Priority 2 - appraisal of indicators suggested by DG RTD
Proposed Indicator
Data source / Availability Relevance Robustness Conclusion
Share of
national public
funding for R&D
transnationally
co-ordinated,
expressed as a
percentage of
the GBOARD22
This indicator is not reported in official
STI statistics, nationally.
The data have not been collected
previously through the ERA Survey,
but several international research
cooperation indicators have been
reported and as such this metric could
be collected / reported based on
i. Share of funder's R&D budget
dedicated to jointly defined research
agendas with non-national funders
(other EU), 2013 [RFO survey]
ii. Share of R&D budget allocated to
collaboration programmes carried out
with third countries, 2013.
The involvement of non-national research agencies /
partners in the framing of national research priorities
provides a useful indication of the extent to which a
country is outward looking and receptive to
international perspectives and priorities.
It may not be a great indicator however as very few
national bodies would be allowed legally to cede
authority over priority setting for national funds to non-
national agencies. This type of input could be tackled
through consultations and advisory mechanisms.
The share of national funding where this condition of
transnational coordination applies is likely to be small,
and subject to many external factors.
Not collected.
Additional question in future ERA RFO
surveys could provide data, but the
concept requires further definition. A
survey question may produce very few
responses (due to its difficulty to respond
to) as seen with questions used in the
ERA 2014 Facts and Figures report.
Reliability and comparability of the
estimates are also uncertain.
Not
recommended
Share of the
budget
allocated
through a peer
review
conducted by
foreign
institutions
This indicator is not reported in official
STI statistics, nationally.
The data have been collected through
the ERA Survey (see Graph 11: Share
of funders which can base their project
based R&D decisions on peer reviews
carried out by non-national funders,
2013, ERA Facts and Figures 2014)
The question could be posed in future
ERA Surveys
Relevance is unclear and there is a risk that the data
would only reveal structural differences between
smaller and larger research systems.
Smaller countries may make greater use of
international experts in peer review processes, for
projects, institutions and disciplines.
Larger countries by definition have a larger number of
resident experts of international standing, and will tend
to make much less use of non-residents or non-
national institutions in any peer review process.
While peer reviews may be being carried out by non-
Not collected.
The question in the ERA Survey could be
modified. But the existing ERA Survey
question relates to the possibility of using
non-national / non-resident institutions to
inform national funding decisions on R&D
projects.
The response rate would likely fall
dramatically if the question were brought in
line with the proposed indicator (share of
all national funding determined by non-
national peer review).
Not
recommended
22
N.B: The final selection of indicators includes ‘the share of funding allocated for transnational R&D’. Initially similar, the critical difference is the issue of allocation: this can
be measured and disclosed un-problematically, whereas the overall share of public funding that is in fact coordinated – irrespective of whether the funding was explicitly put in
place for this purpose – opens up many of the issues highlighted above.

Assessment of progress in achieving ERA - Final Report
8 May 2015 94
residents / non-nationals, their advice is not used to
define national budgets
Data variability (due to contextual and
structural differences) would be
problematic.
Share of the
national
GBAORD
invested in the
construction
and operation
of research
infrastructures
listed on the
ESFRI roadmap
This indicator is not reported in official
STI statistics, nationally.
The data have been collected through
the ERA Survey, but only three MS
provided estimates.
A good example of EU added value and a relevant
indicator.
The EU has experience of developing international
research infrastructure.
EU MS would need to commit to providing
this information.
Not
recommended

Assessment of progress in achieving ERA - Final Report
2 April 2015 95
A8.4 Priority 3 – Open labour market for researchers
Figure A8.3 Priority 3 – potential input, output and outcome/impact indicators

Assessment of progress in achieving ERA - Final Report
2 April 2015 96
Table A8.7 Indicators Appraisal - Priority Area 3
Indicator Type Data Source Information
collected
(denominator/
numerator)
Availability
(Frequency,
timeliness)
Reliability Relevance Completeness Accessibility Ability to assess
effectiveness of
ERA
Score
/24
Share of MS that have
provided guidance material
on open, transparent and
merit-based (OTM)
recruitment
Input ERA Progress
Report (2014)
Low
Medium
Low
Low
Results are
based on low
response rate,
thus low reliability
of the indicator.
0 0 2 1 1 1 5
Research funding available
for mobility scholarships and
stipends as a proportion of
the total funding for research
Input MORE2 Total available for
mobility of
researchers by
institution
Annual
financial plan
High
High
High
High / Medium
High – Funding
creates
opportunities for
mobility
3 6 6 3 2 3 23
Number of dual and joint
degrees as of total of
degrees by MS
Input MORE2, JRC Number of joint
degrees by MS.
The number of dual
and joint degrees
divided by total.
Annual
programme
Medium
Medium
Medium
Medium
High – dual and
joint programmes
provide
opportunities for
mobility
3 4 4 2 2 3 18
Share of job offers within the
national public research
system published on
EURAXESS or equivalent
websites
Output Not collected
(proxy
available and
approved by
WG
Monitoring of
ERA SGHRM,
published in
Researchers'
n/a Open publication
of appointments is
not equivalent to
appointments
being decided
based on merit
It also only relates
to the public
sector, where the
This indicator is
relevant to the
ERA objective,
and would be a
useful addition to
the portfolio of
metrics
n/a n/a n/a

Assessment of progress in achieving ERA - Final Report
2 April 2015 97
Reports) ERA objectives
are multi-sectoral
0 2 4 0 0 0 6
Share of organisations with
EC HR Excellence in
Research Acknowledgement
Output Data available
from the
Commission
website (also
reported in
JRC 2013)
Shares are not
calculated, although
they could be.
Periodically
updated
High
High
High
High
High
2 6 6 3 3 3 23
Joint research projects or
publications as a proportion
of the total number of
projects or publications
Output Data not
available,
indicator
suggested in
JRC 2012.
Number (per cent)
of joint research
projects. Dividing
the number of joint
research projects
by the total number
of the research
projects.
Not available
n/a
High
n/a
n/a
Medium – The
indicator is
relevant but has
to be assessed
against other
data
0 0 6 0 0 2 8
Researcher posts advertised
through EURAXESS
Output EURAXESS Updated
frequently,
statistics
available from
Commission
Services
High
Low
High
Given that no
qualitative
assessment of
the job vacancies
is provided and
the focus is
purely on
numbers, the
indicator’s ability
to assess ERA
effectiveness is
low.
2 6 2 0 3 1 14
Non-EU doctorate holders as Output Innovation Denominator: total Low – Two Medium Medium Low - only part High – Eurostat Latest dataset

Assessment of progress in achieving ERA - Final Report
2 April 2015 98
a per cent of total doctorate
holders
Scoreboard -
Eurostat
doctorate holders in
MS
Numerator: non-EU
doctorate holders in
MS
Eurostat
samples
available
(2006 and
2009)
of EU-28 MS
covered in
Eurostat
provides
several data
formats to
access primary
and aggregated
data
2009
2 2 2 2 2 2 12
Proportion of doctoral
candidates with citizenship of
another EU MS
Outcome/
Impact
IU
Scoreboard
indicator
Proportion of
doctoral candidates
in each MS with
citizenship of
another EU MS
High Medium High DG RTD’s
annual
‘Researchers
Report’ has
been carried
out annually for
several years,
and this
question has a
high response
rate and links
to what appear
to be robust
national
statistics
High High
3 4 6 3 3 3 22
Average amount of time
spent outside of academia
during PhD studies
Outcome/
Impact
MORE2
survey
Non-regular
survey
High
High
High
Limited
2 4 6 3 1 1 17
Share of researchers that
have worked abroad
Outcome/
Impact
MORE2 Non-regular
survey
High
High
High
Limited
2 6 6 3 1 1 19
Non-EU PhD students as a
per cent of total PhD students
Outcome/
Impact
Eurostat Number (per cent)
of international
Annual data
High
Medium
High
Medium
Medium – The
indicator will only

Assessment of progress in achieving ERA - Final Report
2 April 2015 99
PhDs. Dividing the
number of
international PhDs
by the total PhDs
provide data
about non-EU
mobility. Mobility
within EU would
be excluded.
3 6 4 3 1 1 18
Researchers per thousand
labour force, new doctoral
graduates overall and in S&E
per thousand labour force
Outcome/
Impact
Eurostat <2000
High
High
High
High
Limited for
assessing ERA,
focus on
innovation and
business sector
2 6 6 3 3 1 21
Researchers working in the
business sector
Outcome/
Impact
Eurostat <2000 High High High High
2 6 6 3 3 2 22
Share of researchers who
feel that mobility had positive
impacts on qualifications
Outcome/
Impact
MORE2 Non-regular
survey
High
High
High
Limited
1 4 6 3 1 3 18

Assessment of progress in achieving ERA - Final Report
2 April 2015 100
Table A8.8 Priority 3 - appraisal of indicators suggested by DG RTD
Proposed Indicator
Data source / Availability Relevance Robustness Conclusion
Share of job
offers within
the national
public
research
system
published on
EURAXESS
or equivalent
websites
This specific indicator is not reported in
official STI statistics, nationally.
The data have not been collected through
the ERA Survey.
Euraxess has data on researcher
recruitment, which could be used to profile
usage by country and by field.
Some EU MS with highly centralised
researcher HR functions may have data on
national recruitment / appointment numbers.
These data are not available for most EU
MS, and would need to be obtained through
surveys of RPOs. MORE2 has done similar
work, so it would be feasible albeit costly.
This indicator is relevant to the ERA objective, and would
be a useful addition to the portfolio of metrics.
But open publication of appointments is not equivalent to
appointments being decided based on merit; it only relates
to the public sector, where the ERA objectives are multi-
sectoral.
The MORE2 survey took a different approach, asking
researchers whether they judge recruitment to be OTM
(e.g. share of university-based researchers satisfied with
the extent to which research job vacancies are publicly
advertised and made known by their institution, Europe,
2012). This kind of question is problematic inasmuch as
individual job candidates have a necessarily narrow view
of a potential employer’s HR procedures. Nonetheless, this
kind of partiality applies across MS and so while the
results will be biased they are likely to be equally biased in
all EU MS.
The data have not been collected
through the ERA Survey.
An indicator could be created using
Euraxess data, however, that may be
too partial to be useful; many
employers publish job opportunities
on other ‘open’ web sites, at which
point the indicator may only reveal
the extent to which Euraxess is a
preferred communication channel for
researcher employers in different
countries / disciplines).
Re-running an RPO survey would be
more robust, but would be rather
costly and especially so if one wants
to capture both the public and private
sectors
Not
recommended
Proportion of
doctoral
candidates
with
citizenship of
another EU
MS (IU
Scoreboard
indicator)
This indicator is not reported in official STI
statistics, however OECD MS do report on
international student numbers within tertiary
education nationally, therefore the
proportion of research students in a country
can be compared with other countries.
The indicator is reported in the IU
Scoreboard, and is taken from DG RTD’s
annual ‘Researchers Report.’
The share of non-EU doctoral candidates as a percentage
of all doctoral candidates is a useful indicator of the
openness and attractiveness of a research system.
The focus on international students from other EU MS is of
special interest from the perspective of ERA, but it
excludes non-EU countries, including countries that are
driving growth in international student mobility (China,
India, Latin America, etc.) and well-established sources of
students from Japan and the US.
DG RTD’s annual ‘Researchers
Report’ has been carried out for
several years, and this question has
a high response rate and links back
to what appear to be robust national
statistics.
Recommended

Assessment of progress in achieving ERA - Final Report
2 April 2015 101
A8.5 Priority 4 – Gender equality and gender mainstreaming in research
Figure A8.4 Priority 4 – potential input, output and outcome/impact indicators

Assessment of progress in achieving ERA - Final Report
2 April 2015 102
Table A8.9 Indicators Appraisal - Priority Area 4
Indicator Type Data Source Information collected
(denominator/
numerator)
Availability
(Frequency,
timeliness)
Reliability Relevance Completeness Accessibility Ability to assess
effectiveness of
ERA
Score
/24
Share of national RPOs
which have adopted a gender
equality plan
Input ERA Survey Share of national
RPOs which have
adopted a gender
equality plan
High The presence of
a gender
equality plan
does not indicate
whether the plan
is enforced.
An input
indicator that
highlights a first
step that
institutions might
take towards
achieving
greater gender
equality.
The ERA
Survey collected
data for 2013.
The low
response rate to
this question
decreases the
robustness of
this indicator.
High Medium
3 2 6 2 3 2 18
Proportion of funding
allocated to projects that
integrate gender aspects in
science and technology
research (also known as
gender mainstreaming in
science / gender dimension
in research content)
Input Not available
n/a
n/a
Reliability
uncertain, given
that integration
of gender
aspects might
take many
different forms
Potentially
valuable
indicator of
gender
mainstreaming
n/a
Data not
collected
High – gender
dimension in
research gives
insight to
awareness of the
researchers and
the advances of
the field with
regards to gender
0 2 6 0 0 3 11
Number of applicants and
beneficiaries of research
funding by sex
Input She Figures,
based on WiS
database (DG
Research and
Innovation).
Number of
male/female
applicants
Annual data
High
High
Data not
available for all
MS
She Figures /
WiS database
(DG RTD).
High – Indicator
suggests the
degree to which
there is a gender
imbalance in

Assessment of progress in achieving ERA - Final Report
2 April 2015 103
research funding
applications, but
also reflects the
gender balance in
research
positions
3 6 6 2 3 3 23
Compound annual growth
rate of PhD (ISCED 6)
graduates, by sex
Input She Figures
(2013) based
on Eurostat -
Education
Statistics
(online data
code:
educ_grad5);
IT - MIUR-
Italian
Ministry of
Education
(2009-2010).
Percentage change Annual data
High
High – The
higher the
number of
graduates the
higher the
probability of
more female
researchers on
the labour
market
Data available
for all MS
Data are
accessible and
available
through
Eurostat and
She Figures
Medium – the
indicator has
assessed in
relation to other
indicators to give
a complete
picture of ERA
priorities (e.g.
actual
employment of
female
researchers after
graduation)
3 6 6 3 3 2 23
Proportion of female PhD
(ISCED 6) graduates
Input She Figures
(2013) based
on Eurostat -
Education
Statistics
(online data
code:
educ_grad5);
IT - MIUR-
Italian
Ministry of
Education
(2009-2010).
Female graduates /
male graduates
Annual data
High
High – The
higher the
number of
graduates the
higher the
probability of
more female
researchers on
the labour
market
Data available
for all MS
Data are
accessible and
available
through
Eurostat
and She
Figures
Medium – The
indicator has to
be assessed in
relation to other
indicators to give
a complete
picture of ERA
priorities (e.g.
actual
employment of
female
researchers after
graduation)

Assessment of progress in achieving ERA - Final Report
2 April 2015 104
3 6 6 3 3 2 23
Proportion of female PhD
student graduates in science
and technology
Input Eurostat Female graduates /
male graduates
Annual data
High
High – The
higher the
number of
graduates in
science and
technology, the
higher the
probability of
more female
researchers on
the labour
market
Data available
for all MS
Data are
accessible and
available
through
Eurostat
Medium – The
indicator has to
be assessed in
relation to other
indicators to give
a complete
picture of ERA
priorities (e.g.
actual
employment of
female
researchers after
graduation.
3 6 6 3 3 2 23
Share of gender-balanced
research evaluation panels
within funding organisations
Output ERA Survey Share of gender-
balanced research
evaluation panels
within funding
organisations
High Whilst greater
participation of
women in
research
evaluation
panels is
desirable, this
indicator would
not provide
information on
seniority in these
panels. Existing
inequalities of
status in the
research sector
may easily be
reproduced.
Introducing the
gender
dimensions into
the research
funding process
is a core aspect
of gender
mainstreaming
Current data
covers funders
who answered
the ERA survey
in 2014, which
represent 34 per
cent of total EU
GBAORD.
A higher
response rate
would make this
dataset more
robust.
High Medium
3 2 4 2 3 2 16

Assessment of progress in achieving ERA - Final Report
2 April 2015 105
Proportion of female
academic staff
Output She Figures,
based on data
from WiS
database (DG
Research and
Innovation).
Headcount of female
staff as a proportion
of male staff
Annual data
High
High
Data missing for
some MS
She Figures,
WiS database
(DG Research
and Innovation).
High – Indicator
reflects gender
balance in the
academic
workforce.
3 6 6 2 3 3 23
Share of female researchers
on temporary contracts vs.
non-temporary contracts
across career paths, JRC
Synthesis report (2013)
Output Eurostat.
Further data
can be
collected
through MS
Composite indicator
with partial data
available. Eurostat -
Share of women
researchers (FTE) for
all sectors.
There are no data on
type of contracts.
Eurostat
data
available
annually
Medium
Medium - This
indicator
highlights
employment
permanence and
security rather
than seniority,
an additional
element of
gender
imbalance in
research.
Eurostat data is
available for all
MS.
Eurostat data
are accessible
and available
through an
online platform
that can be
further
analysed.
Medium - The
indicator can
provide
information on
temporary and
permanent
researchers’
contracts to
strengthen the
gender dimension
in research
programmes.
3 4 4 3 3 2 19
Distribution of researchers in
the higher education sector,
by sex and age group
Output She Figures
Data includes R&D
expenditure and R&D
personnel for the
following categories:
business enterprise,
government, higher
education, and private
/ non-profit.
Annual data
since 2003
is available
on Eurostat
High
High - The
indicator
provides
information on
female
researchers
according to
different age
groups (<35
years, 35-44
years, 45-54
years, and 55+
years)
Data available
for all MS
Data are
accessible and
available
although
Eurostat
although ‘She
Figures’ are not
compiled in a
database but
provided in an
annual report.
High - In the
higher education
sector, the
greatest gender
differences are
observed in the
two extreme age
groups, among
the youngest
researchers aged
under 35 and
among those
above 55 years of

Assessment of progress in achieving ERA - Final Report
2 April 2015 106
age.
3 6 6 3 2 3 23
Distribution of researchers
across sector, by sex
Output She Figures R&D personnel data
is available (full-time
equivalent (FTE)), in
head count (HC), as a
per cent of
employment and as a
per cent of labour
force.
Annual data
since 2003
is available
on Eurostat
High
High – Indicator
measures
female
researchers
across four
broad sectors of
activity
Data available
for all MS
Data are
accessible and
available
through
Eurostat,
however ‘She
Figures’ are not
compiled in a
database but
provided in an
annual report.
High - Indicator
points to uneven
distribution of
female
researchers in the
higher education
sector,
government, the
business
enterprise sector
and the private
non-profit sector
3 6 6 3 2 3 23
Proportion of female
researchers in total labour
force
Output She Figures
based on
Eurostat -
Human
Resources in
Science and
Technology
(online data
code:
hrst_st_ncat).
Number of
male/female scientists
and engineers in the
total labour force
Annual data
since 2004
High
High – Indicator
measures
gender
differences in
the field of
science and
engineering
Data available
for all MS
Eurostat / She
Figures
High - Degree of
gender balance in
the distribution of
researchers in the
workforce.
3 6 6 3 3 3 24
Proportion of women
employed in knowledge-
intensive activities
Output She Figures
based on
Eurostat -
High-tech
industry and
Percentage
male/female
employed in
knowledge-intensive
Annual data
since 2003
High
Medium –
Indicator
measures the
presence of
women in
Data available
for all MS
Eurostat / She
Figures
Medium - An
activity is
classified as
knowledge-
intensive if

Assessment of progress in achieving ERA - Final Report
2 April 2015 107
knowledge-
intensive
services
(online data
code:
htec_kia_emp
2).
sectors knowledge-
intensive
activities
tertiary-educated
persons
employed
represent more
than 33 per cent
of the total
employment in
that activity.
Women score
higher than men
on this indicator.
3 6 4 3 3 2 21
Proportion of women in
Grade A (professor) positions
Outcome/
Impact
She Figures/
also reported
in ERA
Survey
The ERA survey
collects data on the
share of RPOs whose
heads are women.
She Figures captures
the proportion of
women in grade A
(professor) positions.
High High This is a highly
relevant
indicator.
Besides the
more general
aspect of overall
female
representation in
research, the
proportion of
high-level
positions
additionally
gives insight into
the extent of a
‘glass ceiling’.
The She Figures
data are
collected
regularly and
have overall
been identified
as robust.
High High
3 6 6 3 3 3 24
Proportion of female grade A
staff by main field of science
Outcome/
Impact
She Figures,
based on data
from WiS
database (DG
Headcount of female
staff as a proportion
of male staff
Annual data High High Data missing for
some MS
She Figures,
WiS database
(DG RTD).
High –
Indicator reflects
gender balance
and career

Assessment of progress in achieving ERA - Final Report
2 April 2015 108
RTD). progression in the
academic
workforce
3 6 6 2 3 3 23
Proportion of female heads of
institutions in the higher
education sector
Outcome/
Impact
She Figures,
based on data
from WiS
database (DG
RTD).
Headcount of female
heads of institutions
as a proportion of
male heads of
institutions
Annual data
High High Data missing for
some MS
She Figures,
WiS database
(DG RTD)
High – Indicator
reflects gender
balance and
career
progression in the
academic
workforce
3 6 6 2 3 3 23
Proportion of women on
boards
Outcome/
Impact
She Figures,
based on data
from WiS
database (DG
RTD).
Headcount of female
board members as a
proportion of male
board members
Annual data High High Data missing for
some MS
She Figures,
WiS database
(DG Research
and Innovation).
High - Indicator
for gender
balance in
leadership
3 6 6 2 3 3 23
Glass Ceiling Index Outcome/
Impact
She Figures,
based on data
from WiS
database (DG
RTD).
Headcount of female
staff as a proportion
of male staff
Annual data
High
High
Data missing for
some MS
She Figures,
WiS database
(DG RTD).
High - Indicator
reflects the
combined effect
of gender balance
in student
enrolment and the
degree to which
this population is
has access to
equal
opportunities
throughout their
career
progression

Assessment of progress in achieving ERA - Final Report
2 April 2015 109
3 6 6 2 3 3 23
Gender pay gap statistics
Outcome/
Impact
Eurostat,
tsdsc340
Per cent difference
between average
gross hourly earnings
of male and female
employees, as per
cent of male gross
earnings, unadjusted
form
Annual data High
High
Data available
for all MS
Eurostat
Low – In all
sectors gender
equal pay is a
priority. The
unadjusted
Gender Pay Gap
(GPG) represents
the difference
between average
gross hourly
earnings of male
paid employees in
enterprise and of
female paid
employees as a
percentage of
average gross
hourly earnings of
male paid
employees.
3 6 6 3 3 1 22
The proportion of
men/women researchers with
children
Outcome/
Impact
She Figures,
based on
Computations
by the
University of
Brussels,
Department of
Applied
Economics
(ULB /
DULBEA),
based on
2010 SILC
Female researchers
as a proportion of
male researchers
Annual data
High
Medium
Data available
for all MS
She Figures,
aggregate
figures / EU-
SILC micro data
Work/life balance
issues are of
particular concern
to researchers’
and their career
progression

Assessment of progress in achieving ERA - Final Report
2 April 2015 110
data.
3 6 4 3 3 3 22

Assessment of progress in achieving ERA - Final Report
2 April 2015 111
Table A8.10 Priority 4 - appraisal of indicators suggested by DG RTD
Proposed Indicator
Data source / Availability Relevance Robustness Conclusion
Share of
national
RPOs which
have adopted
a gender
equality plan
Data have been collected through
the ERA Survey 2014.
The Survey collected data for
2013.
An input indicator that highlights a first step that institutions
might take towards achieving greater gender equality.
The presence of a gender equality plan does not indicate
whether the plan is enforced.
The low response rate to this question decreases
the robustness of this indicator.
Not
recommended
Share of
gender-
balanced
research
evaluation
panels within
funding
organisations
Data have been collected through
the ERA Survey 2014.
The Survey has collected data for
2013.
Highlights gender equality in a particular area of the
research system, but also relates to gender
mainstreaming. It is of limited use for both areas, however:
whilst greater participation of women in research
evaluation panels is desirable, this indicator would not
provide information on seniority in these panels. Existing
inequalities of status in the research sector may easily be
reproduced.
Current data covers funders who answered the
ERA survey in 2014, which represent 34 per cent
of total EU GBAORD. A higher response rate
would make this dataset more robust.
Not
recommended
Share of
women in top
positions in
publicly
funded RPOs
Data are not collected.
The ERA survey collects data on
the share of RPOs whose heads
are women. She Figures captures
the proportion of women in grade
A (professor) positions.
This is a highly relevant indicator. Besides the more
general aspect of overall female representation in
research, the proportion of high-level positions additionally
gives a view of the extent of a ‘glass ceiling’.
Robustness varies depending on which data
source is used. The She Figures data are
collected regularly and have been identified as
especially robust.
Recommended

Assessment of progress in achieving ERA - Final Report
2 April 2015 112
A8.6 Priority 5 – Optimal access to and circulation and transfer of scientific knowledge
Figure A8.5 Priority 5 – potential input, output and outcome/impact indicators

Assessment of progress in achieving ERA - Final Report
2 April 2015 113
Table A8.11 Indicators Appraisal - Priority Area 5
Indicator Type Data Source Information collected
(denominator/
numerator)
Availability
(Frequency,
timeliness)
Reliability Relevance Completeness Accessibility Ability to assess
effectiveness of
ERA
Score
/24
Share of staff
employed by public
research
organisations
dedicated to
knowledge transfer
activities
(modification: share
of organisations that
has or uses a
structure for
knowledge transfer
activities)
Input The ERA survey
collects data on
the share of
organisations that
has or uses a
structure for
knowledge
transfer activities,
but this does not
include a
headcount
Share of organisations
that has or uses a
structure for knowledge
transfer activities
High Knowledge transfer
only constitutes one
part of this priority
area, and the potential
use of this indicator is
further limited by the
fact that an
organisation’s KT
activities might not
solely (or even
predominantly) flow
through official KT
channels.
High
High High High
3 4 6 3 3 3 22
Share of research
and development
budget financed by
the private sector
Input ERA Survey Share of research and
development budget
financed by the private
sector
High It is problematic to
express private sector
investment as a share
of the overall R&D
budget: reducing
government
investment would
artificially inflate this
indicator and,
conversely, additional
government
investment in R&D
would decrease it.
This indicator
would go some
way to showing
the extent of
transfer between
research and the
private sector.
The Survey
collected data for
2013
High Medium

Assessment of progress in achieving ERA - Final Report
2 April 2015 114
3 2 6 3 3 2 19
Share of R&D
public funding
involving routine
open access to
publications
(modification:
Share of funders
funding open
access to
publications)
Input ERA Survey Share of funders
funding open access to
publications
High Medium: approach to
open access (OA)
funding might vary
between funders
A relatively new
phenomenon,
open access
publication is an
essential
component of
ensuring
circulation,
access and
knowledge
transfer.
High High High
3 4 6 3 3 3 22
R&D in HEI’s /
PRO’s funded by
business
Output Eurostat Share of (GOVERD +
HERD) financed by the
business enterprise
sector
Latest 2012 Medium – data
depends on firms
polled
High Medium / Low Medium
Depends of the
firms that have
participated
2 2 4 2 3 2 18
Number and share
of national research
performing
organisations with
mandatory policies
for open access to
and preservation of
scientific
information , ERA
expert group (2013)
Output Data collection
possible via MS
Numerator: Number of
RPOs in MS with
mandatory OA policy
and preservation of
scientific information
Denominator: Total
number of RPOs in MS
n/a - Data not
collected
Medium – Requires
common
understanding of OA
policies for RPOs
High n/a – No dataset
available
Medium – No
dataset
available but
data collection
possible via MS
No available
dataset
0 4 6 0 0 0 10
Number and share
of research
performing
organisations with
interoperable and
Output Data collection
possible via MS
Numerator: Number of
RPOs with
interoperable and
federated repositories
n/a - Data not
collected
High
High
n/a – No dataset
available
Medium – No
dataset
available but
data collection
possible via
No available
dataset

Assessment of progress in achieving ERA - Final Report
2 April 2015 115
federated
repositories, ERA
expert group (2013)
in MS
Denominator: Total
number of RPOs in MS
MS.
0 6 6 0 1 0 12
Number and share
of research funders
and research
performing
organisations with
obligatory data
management plans,
ERA expert group
(2013)
Output Data collection
possible via MS
Numerator: Number of
RFOs and RPOs with
obligatory data
management plans in
MS
Denominator: Total
number of RFOs and
RPOs in MS
n/a - Data not
collected
Some form of data
management plan is
likely to be in place in
most RPOs –
qualitative distinctions
are likely to be
considerable.
Medium
n/a – No dataset
available
Medium – No
dataset
available but
data collection
possible via MS
No available
dataset
0 2 4 0 1 0 7
Non-EU doctorate
holders as a per
cent of total
doctorate holders
Output Innovation
Scoreboard -
Eurostat
Denominator: total
doctorate holders in MS
Numerator: non-EU
doctorate holders in MS
Low – Two
Eurostat
samples
available (2006
and 2009)
Medium Medium Low - Only part of
EU-28 covered in
Eurostat
High – Eurostat
provides
several data
formats to
access primary
and aggregated
data
Latest dataset
2009
2 2 2 2 2 2 12
Public-private co-
publication per
million of the
population
Outcome/
Impact
Innovation
Scoreboard –
CWTS and
Eurostat
Denominator – total
population
Numerator - Number of
public-private co-
authored research
publications. The
definition of the ‘private
sector’ excludes the
private medical and
health sector.
Publications are
assigned to the
Low
Medium
High
Medium
Medium
Captures public-
private linkages
and active
collaboration
activities. Does
not capture extent
of collaborations
or distinguish
between large
and small firms.

Assessment of progress in achieving ERA - Final Report
2 April 2015 116
country/countriesin
which the business
companies or other
private sector
organisations are
located
2 4 4 2 2 2 16
Firms cooperating
with HEI’s
Outcome/
Impact
CIS, Eurostat Per cent of all firms
polled
Latest 2010 Medium – Data
depend on firms polled
Medium Medium / Low Medium – 22
countries
included
Depends of the
firms that have
participated
2 2 2 4 2 2 14
Firms cooperating
with PRO’s
Outcome/
Impact
CIS, Eurostat Per cent of all firms
polled
Latest 2010 Medium – data
depends on firms
polled
High
Medium / Low
Medium – 22
countries
included
Depends of the
firms that have
participated
2 2 2 4 2 2 14
Share of open
access publications
compared to total
output of MS, ERA
expert group (2013)
Outcome/
Impact
National and
international OA
repositories,
national statistics
on scientific
publications
Numerator: Number of
OA scientific
publication in MS
Denominator: number
of scientific publications
in MS
n/a – Data are
not aggregated.
OA repositories
are updated on
a regular basis
and often
provide
statistical
information;
national
statistics on
scientific output
are available in
most MS
High
High
Medium -
Restricted to MS
which publish
national statistics
on scientific
publications and
MS represented
on OA repositories
Medium – No
dataset
available but
data collection
possible via MS
No available
dataset
1 6 6 2 0 0 15
Stock of doctorate
holders employed in
business
Outcome/
Impact
OECD careers of
doctorate holders
(CDH), United
Latest 2012
Medium Medium
Low – Infrequent
and sometimes
incomplete data
Low –
Infrequent
estimates made
Poor – Infrequent
estimates made,
limited to R&D

Assessment of progress in achieving ERA - Final Report
2 April 2015 117
enterprises Nations
Educational,
Scientific and
Cultural
Organization
(UNESCO)
Institute for
Statistics and
Eurostat
capacity of firms
polled
2 2 4 2 2 1 13
Teaching in HEI’s
performed by
people with their
primary job outside
the HEI / PRO
sector
Outcome/
Impact
FTE adjunct positions
in HEIs occupied by
people who have their
primary job in the
business enterprise
sector
Latest 2008
Low – Out of date.
Variations in
framework for
delivering this between
countries.
Medium Low – Difficult to
collect,
infrequently
collected
Low –
Infrequently
collected
Poor access to
data, data
collected too
infrequently
1 1 2 1 1 1 7

Assessment of progress in achieving ERA - Final Report
2 April 2015 118
Table A8.12 Priority 5 - appraisal of indicators suggested by DG RTD
Proposed Indicator
Data source / Availability Relevance Robustness Conclusion
Share of R&D
public funding
involving
routine open
access to
publications
These data are not reported in
official statistics.
However, there are some closely
related indicators in the ERA
survey, most notably ‘Share of
funders funding open access to
publications.’
A relatively new phenomenon, open access publication
is an essential component of ensuring circulation, access
to information and knowledge transfer.
One of the few areas that genuinely relates to all aspects
of this ERA priority.
The notion of ‘routine’ is unclear, and it may
be preferable to look at the funding
organisations rather than the share of R&D
funding – it is at the level of funding
organisations where policies on open access
are likely to occur.
Recommended,
specifically with
modification to ERA
survey.
Share of
research and
development
budget financed
by the private
sector
Data have been collected through
the ERA Survey 2014.
The Survey has collected data for
2013.
Shows the extent of transfer between research and
private sector.
It is problematic to express private sector
investment as a share of the overall R&D
budget: lowering government investment
would artificially inflate this indicator and
conversely, additional government investment
in R&D would decrease it.
Not recommended, but
could be modified.
Share of staff
employed by
public research
organisations
dedicated to
knowledge
transfer
activities
This data are not reported in
official statistics.
Could be included in future ERA
surveys.
The ERA survey collects data on
the share of organisations that
has or uses a structure for
knowledge transfer activities, but
this does not include a
headcount.
The ‘headcount’ concept is problematic because
institutions often pool their knowledge transfer activities
or use external KT facilities in some other form.
It is unclear whether the number of individuals involved
in the activities is necessarily a good indicator of their
effectiveness.
Knowledge transfer only constitutes one part of this
priority area, and the potential use of this indicator is
further limited by the fact that an organisation’s KT
activities might not solely (or even predominantly) flow
through official KT channels – researchers themselves
might conduct such activities themselves as well.
Not yet collected. Not recommended.
However, the ERA
survey’s enquiry into
the proportion of
institutions who either
have or use KT
structures resolves
some of the concerns
noted here.

Assessment of progress in achieving ERA - Final Report
2 April 2015 119
A8.7 International dimension outside ERA
Figure A8.6 International dimension outside ERA (Priority 6) – potential input, output and outcome/impact indicators

Assessment of progress in achieving ERA - Final Report
2 April 2015 120
Table A8.13 Indicators Appraisal – International dimension
Indicator Type Data Source Information collected
(denominator/
numerator)
Availability
(Frequency,
timeliness)
Reliability Relevance Completenes
s
Accessibility Ability to assess
effectiveness of ERA
Score
/24
Share of the public R&D
budget allocated to
collaborative programmes
with third countries
Input ERA Survey Share of the public R&D
budget allocated to
collaborative
programmes with third
countries
High Unclear whether the
data is based on
estimates or whether all
MS record this data
exactly.
High High High High
3 4 6 3 3 3 22
Share of funders’ R&D
budget going to third
countries as per cent of
GBAORD
Input OECD,
Eurostat, ERA
RFO Survey
(2014)
Denominator: Total
GBAORD in MS in
Euros
Numerator: Budget
reserved by RFOs to
collaboration with third
countries in Euros
High
Denominator
data is
available on
annual basis
via Eurostat
Numerator data
was collected
through ERA
surveys in 2014
Medium - Some issues
concerning definition of
the numerator. Budget
allocated to
programmes on
international
cooperation which will
fund both domestic and
third country
participants. There is a
risk of including
allocated budget which
remains in MS.
High High –
Eurostat data
available for
EU-28,
Iceland,
Switzerland
and Norway
High – Eurostat
provides several
data formats to
access primary and
aggregated data
High - Recent and
accessible data
available which is
highly relevant
3 4 6 3 3 3 22
Proportion of researchers
employed in each MS that
originate from non-European
Output Data not
available
n/a n/a Potentially different
understandings between
MS concerning for
instance whether PhD
Highly relevant
measure of the
degree of
n/a n/a High

Assessment of progress in achieving ERA - Final Report
2 April 2015 121
countries students should be
included in this figure
internationalisation
0 4 6 0 0 3 13
Non-EU doctorate holders as
a per cent of total doctorate
holders
Output Eurostat Denominator: total
doctorate holders in MS
Numerator: non-EU
doctorate holders in MS
Medium – Two
Eurostat
samples
available (2006
and 2009)
Medium High Low - Only
part of EU28
covered in
Eurostat
High – Eurostat
provides several
data formats to
access primary and
aggregated data
Latest dataset 2009
2 2 4 2 2 2 14
Share international research
collaboration at national level
Outcome/
Impact
EUA survey
of national
rector
conferences:
(2013)
Denominator: Number
of national rector
conferences across EU
Numerator: number of
national rector
conferences indicator
the existence of
international research
collaborations at
national level
Medium – Data
collection in
2013
Medium – Based on
membership survey of
University Association
(EUA). Not clear to what
extent findings can be
generalised /
extrapolated.
High
Low - No
information on
response
rate.
Low – No access to
primary data
No primary data
available, extent of
participation not clear.
2 2 4 1 0 1 10
Per cent of patents with
foreign co-inventors
Outcome/
Impact
OECD via the
EPO, United
States Patent
and
Trademark
Office
(USPTO),
PCT and
Triadic Patent
Families
(TPF)
Denominator: total
number of patents
Numerator: number of
patents with a foreign
co-inventor
Restricted country data
available (limited to
Australia, Canada,
Japan, Netherlands,
USA and EU-28).
Global data for
1999-2011 High Medium (due to
restricted data)
Medium (due
to restricted
data)
High – Available on
OECD
Relevant data from a
large number of
countries in easily
accessible format

Assessment of progress in achieving ERA - Final Report
2 April 2015 122
comparison available.
2 4 4 2 3 3 18
Licence and patent revenues
from abroad as a per cent of
GDP
Outcome/
Impact
Innovation
Scoreboard –
Eurostat,
OECD,
Denominator: GDP
Numerator: Export data
on international
transactions in royalties
and licence fees
High –
available 2014
High Medium High High
Medium - Recent data
from a large number of
countries
2 6 4 3 2 3 20
International scientific co-
publications per million of the
population
Outcome/
Impact
Innovation
Scoreboard –
World Bank,
Eurostat,
Scopus
Denominator: Total
population
Numerator: Number of
scientific publications
with at least one co-
author based abroad
(where abroad is non-
EU for the EU-28)
Medium – data
for 2005-2012,
most recent
year 2012
Medium High Medium –
data not
available for
Canada,
South Africa
and Australia
High
Medium - Recent data
from a large number of
countries
2 4 4 2 3 3 18

Assessment of progress in achieving ERA - Final Report
2 April 2015 123
Table A8.14 International dimension outside the ERA - appraisal of indicators suggested by DG RTD
Proposed Indicator Data source / Availability Relevance Robustness Verdict
Share of the public
R&D budget
allocated to
collaborative
programmes with
third countries
Data have been collected
through the ERA Survey 2014
The Survey has collected data
for 2013.
Input indicator: Many countries do not allocate anything
specifically to collaborative programmes with third
countries, but there may be other mechanisms used to
ensure greater collaboration.
Larger MS or those with more advanced research
environments may be better able to allocate budget shares
and attract collaboration, whereas others may opt to
engage with larger and more advanced research systems
in third countries to fulfil this priority.
Recently developed survey, 1-2 years of
data collected.
Unclear whether the data is based on
estimates or whether all MS record this
data exactly.
Recommended
for use
Proportion of
researchers
employed in each
MS that originate
from non-European
countries
This data are not reported in
official statistics.
It has not been collected
through ERA surveys, but could
be included in future surveys.
Highly relevant measure of the degree of
internationalisation
Not collected.
Potential issue with regard to different
understandings between MS concerning
for instance whether PhD students
should be included in this figure.
Do not
recommend
(subject to
availability)

Assessment of progress in achieving ERA - Final Report
2 April 2015 124
Annex 9 The German ERA roadmap and a template for national roadmaps
A9.1 An overview of the German ERA roadmap
Table A9.1 Overview of German guidelines and roadmap on ERA
Type of goal/objective
Type of measures Mechanisms to report progress
Review process
Guidelines for further shaping
the European Research Area
n.a. n.a. n.a. n.a.
National Roadmap on ERA
Priority 1: More effective
national research systems
Qualitative Legal measures, new or adapted programming and policy
development at national level, administrative measures in
RPOs
Quantitative evaluation of one
programme
No specific review process
foreseen
Priority 2.1: Optimal
transnational cooperation and
competition – Planning and
implementation of
transnational cooperation
Quantitative
and qualitative
New or adapted programming and policy development at
national level, administrative measures in RFOs and RPOs,
development of indicators
No specific progress reporting
foreseen
No specific review process
foreseen
Priority 2.2: Optimal
transnational cooperation and
competition – research
infrastructures
Qualitative New or adapted programming and policy development at
European and national level, administrative measures in
RFOs and RPOs
Regular evaluations at
strategic and operational level
in research infrastructures
Regular evaluations at
strategic and operational level
in research infrastructures
Priority 3: Open labour market
for researchers
Qualitative New or adapted programming and policy development at
national level, administrative measures in RFOs and RPOs
No specific progress reporting
foreseen
No specific review process
foreseen
Priority 4: Gender equality
and gender mainstreaming in
research
Quantitative
and qualitative
New or adapted programming and policy development at
national level, administrative measures in RFOs and RPOs
No specific progress reporting
foreseen
No specific review process
foreseen
Priority 5: Optimal circulation,
access to and transfer of
scientific knowledge
Qualitative New or adapted programming and policy development at
national level, administrative measures in RFOs and RPOs
No specific progress reporting
foreseen
No specific review process
foreseen
International dimension of the
ERA (Priority 6)
Qualitative New or adapted programming and policy development at
European level, administrative measures in RFOs and RPOs
No specific progress reporting
foreseen
No specific review process
foreseen

Assessment of progress in achieving ERA - Final Report
2 April 2015 125
A9.2 Draft template for national roadmaps on ERA
Figure A9.1 Draft template for national roadmaps on ERA
Roadmap on European Research Area
Member State
Lead ministry, contact
Date
Context and problem definition
Current situation and specifics of the national research system
Specific strengths, assets, problems weaknesses of the national research system
Who is affected by specific problems or weaknesses
Guidelines for national action on European Research Area
Guiding principles and rationale for action at national level
Strategic objectives of Member State for overall ERA development
Options
What are the policy options/scenarios which have been considered?
What legislative or ‘soft’ instruments/actions have been considered?
Mechanism for progress reporting and review
What information and data are to report progress against individual objectives outlined below?
What resources and administrative capacity is available to provide for an overall review of progress?
Timeline for overall progress reporting and review
ERA Priority 1: More effective national research systems
Context and problem definition
Current situation and specifics in relation to this ERA priority
Specific strengths and assets of the national research system in relation to this ERA priority
Specific problems or challenges in relation to this ERA priority
Who is affected by specific problems or challenges
Objectives
Specific qualitative and quantitative objectives under this ERA priority which are SMART where
possible (Specific Measurable Accepted Realistic Timely)
Timeline and major milestones to meet the objectives
Measures
Individual measures to achieve outlined objective including main actors and stakeholders as well clearly
describing the nature of the action (e.g. legislative’soft’ measures)

Assessment of progress in achieving ERA - Final Report
2 April 2015 126
ERA Priority 2: Optimal transnational cooperation and competition
Context and problem definition
Current situation and specifics in relation to this ERA priority
Specific strengths and assets of the national research system in relation to this ERA priority
Specific problems or challenges in relation to this ERA priority
Who is affected by specific problems or challenges
Objectives
Specific qualitative and quantitative objectives under this ERA priority which are SMART where
possible (Specific Measurable Accepted Realistic Timely)
Timeline and major milestones to meet the objectives
Measures
Individual measures to achieve outlined objective including main actors and stakeholders as well clearly
describing the nature of the action (e.g. legislative’soft’ measures)
ERA Priority 3: Open labour market for researchers
Context and problem definition
Current situation and specifics in relation to this ERA priority
Specific strengths and assets of the national research system in relation to this ERA priority
Specific problems or challenges in relation to this ERA priority
Who is affected by specific problems or challenges
Objectives
Specific qualitative and quantitative objectives under this ERA priority which are SMART where
possible (Specific Measurable Accepted Realistic Timely)
Timeline and major milestones to meet the objectives
Measures
Individual measures to achieve outlined objective including main actors and stakeholders as well clearly
describing the nature of the action (e.g. legislative’soft’ measures)
ERA Priority 4: Gender equality and gender mainstreaming in research
Context and problem definition
Current situation and specifics in relation to this ERA priority
Specific strengths and assets of the national research system in relation to this ERA priority
Specific problems or challenges in relation to this ERA priority
Who is affected by specific problems or challenges
Objectives
Specific qualitative and quantitative objectives under this ERA priority which are SMART where
possible (Specific Measurable Accepted Realistic Timely)
Timeline and major milestones to meet the objectives
Measures
Individual measures to achieve outlined objective including main actors and stakeholders as well clearly

Assessment of progress in achieving ERA - Final Report
2 April 2015 127
describing the nature of the action (e.g. legislative’soft’ measures)
ERA Priority 5: Optimal circulation, access to and transfer of scientific knowledge
Context and problem definition
Current situation and specifics in relation to this ERA priority
Specific strengths and assets of the national research system in relation to this ERA priority
Specific problems or challenges in relation to this ERA priority
Who is affected by specific problems or challenges
Objectives
Specific qualitative and quantitative objectives under this ERA priority which are SMART where
possible (Specific Measurable Accepted Realistic Timely)
Timeline and major milestones to meet the objectives
Measures
Individual measures to achieve outlined objective including main actors and stakeholders as well clearly
describing the nature of the action (e.g. legislative’soft’ measures)
ERA Priority 6: International Dimension of the European research Area
Context and problem definition
Current situation and specifics in relation to this ERA priority
Specific strengths and assets of the national research system in relation to this ERA priority
Specific problems or challenges in relation to this ERA priority
Who is affected by specific problems or challenges
Objectives
Specific qualitative and quantitative objectives under this ERA priority which are SMART where
possible (Specific Measurable Accepted Realistic Timely)
Timeline and major milestones to meet the objectives
Measures
Individual measures to achieve outlined objective including main actors and stakeholders as well clearly
describing the nature of the action (e.g. legislative’soft’ measures)
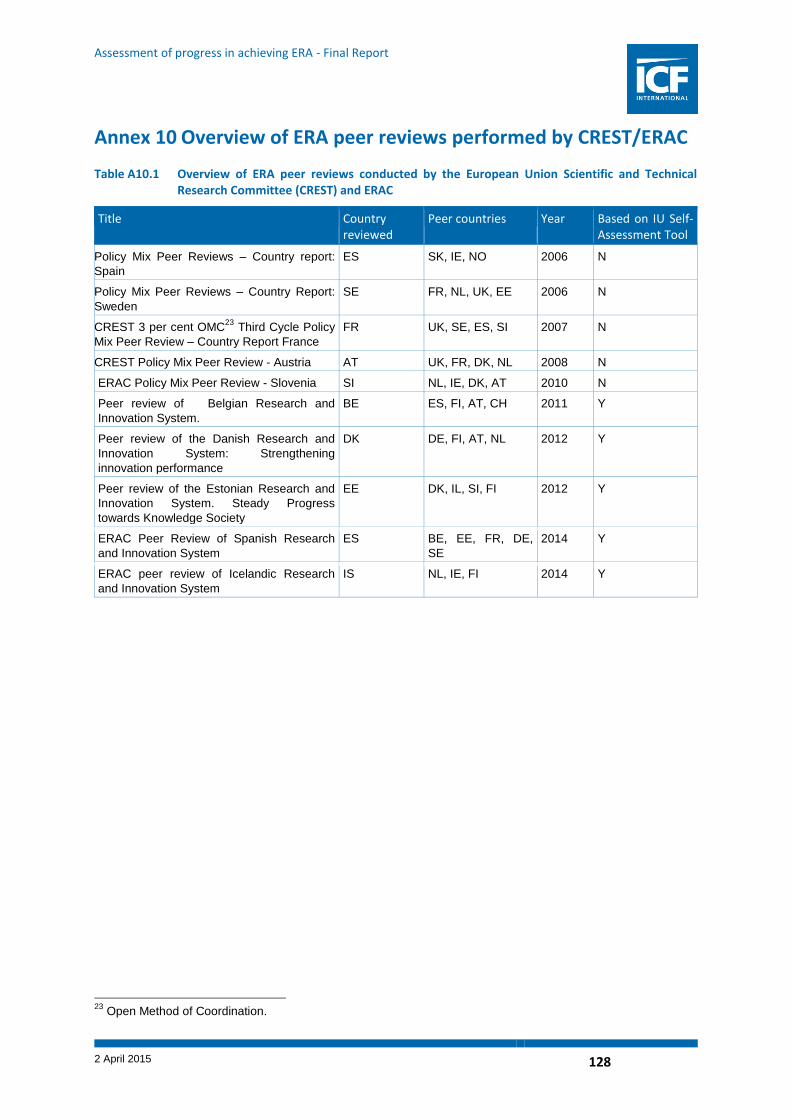
Assessment of progress in achieving ERA - Final Report
2 April 2015 128
Annex 10 Overview of ERA peer reviews performed by CREST/ERAC
Table A10.1 Overview of ERA peer reviews conducted by the European Union Scientific and Technical Research Committee (CREST) and ERAC
Title Country reviewed
Peer countries Year Based on IU Self-Assessment Tool
Policy Mix Peer Reviews – Country report:
Spain
ES SK, IE, NO 2006 N
Policy Mix Peer Reviews – Country Report:
Sweden
SE FR, NL, UK, EE 2006 N
CREST 3 per cent OMC23
Third Cycle Policy
Mix Peer Review – Country Report France
FR UK, SE, ES, SI 2007 N
CREST Policy Mix Peer Review - Austria AT UK, FR, DK, NL 2008 N
ERAC Policy Mix Peer Review - Slovenia SI NL, IE, DK, AT 2010 N
Peer review of Belgian Research and
Innovation System.
BE ES, FI, AT, CH 2011 Y
Peer review of the Danish Research and
Innovation System: Strengthening
innovation performance
DK DE, FI, AT, NL 2012 Y
Peer review of the Estonian Research and
Innovation System. Steady Progress
towards Knowledge Society
EE DK, IL, SI, FI 2012 Y
ERAC Peer Review of Spanish Research
and Innovation System
ES BE, EE, FR, DE,
SE
2014 Y
ERAC peer review of Icelandic Research
and Innovation System
IS NL, IE, FI 2014 Y
23
Open Method of Coordination.

Assessment of progress in achieving ERA - Final Report
2 April 2015 129
Annex 11 Case studies – Peer review and mutual learning mechanisms
This section presents two case studies of peer reviews which provide insight into how a similar
mechanism could be applied to the ERA. The case studies are drawn from the OECD’s education and
training policy and EU employment policy. They were selected on the basis that both are well-
established peer review mechanisms, with thematic relevance in relation to research policy, as well as
structural similarities (e.g. similar actors involved) and similarities in the overall progress monitoring
arrangements (i.e. similar complementary monitoring instruments are available). The two case studies
below are organised and analysed along five dimensions:
■ discussion of the relevant policy field;
■ description of the peer review mechanism/shared learning approach;
■ mechanisms present in the policy approach to measure progress and monitor the policy;
■ assessment of how peer review brought about change in the policy field; and
■ how the mechanism could be applied to the ERA.
The case studies discuss the extent to which similar success criteria are present in the context of
ERA.
A11.1 OECD education and training
A11.1.1 Discussion of the relevant policy field
The European Commission has highlighted the need for a highly-skilled EU workforce to compete in
terms of productivity, quality, and innovation in the context of an increasingly globalised and
knowledge-based economy (EC, 2015a). Education and training are important for both economic and
social progress. The OECD plays a significant role as a policy actor for its Member countries by
assisting them to develop effective, efficient and evidence-based policies for education and learning to
meet individual, social, cultural and economic objectives (OECD, n.d.a).
There are no common policy objectives or targets for OECD education policies. Instead, activities are
guided by a common strategic framework for skills policies (OECD 2012) which ‘help[s] countries to
identify the strengths and weaknesses of their existing national skills pool and skills systems,
benchmark them internationally, and develop policies for improvement’ (OECD, 2012).
The OECD acts on a legal basis through its founding convention, which enables binding decisions
concerning Member countries’ education policies. Article 5 of the OECD convention mandates the
OECD to take binding decisions concerning Member countries’ policies (see box).
Legal basis for OECD activities in the area of education policy
Extract from OECD convention (OECD, 2014a):
Article 1 (aims), (a) “to achieve the highest sustainable economic growth and employment and a rising standard of
living in Member countries” and;
Article 5: “In order to achieve its aims, the Organisation may:
(a) take decisions which, except as otherwise provided, shall be binding on all the Members;
(b) make recommendations to Members; and
(c) enter into agreements with Members, non-member States and international organisations.”

Assessment of progress in achieving ERA - Final Report
2 April 2015 130
OECD involvement in education policy began in 1968, when the Centre for Educational Research and
Innovation (CERI) was founded. It was originally funded by external sources, but is now funded by
Member countries.
The OECD directorate on education and skills leads work on addressing the challenges facing
education systems for its Member countries, including ways to improve the quality of teaching and
learning. The directorate also supports policy makers in Member countries by providing information
about the knowledge and skills needed for the 21st century labour market (OECD, 2014c). The
directorate currently has around 140 staff based in Paris.
The Education Policy Committee (EDPC), founded in 1970, is the main body within the OECD
directorate on education and skills (OEDC, 2014d). The Committee has nine sub-committees or
groups, amongst them the Board of Participating Countries for the Programme for the International
Assessment of Adults Competencies (PIAAC) and the Group of National Experts on Vocational
Education and Training (OECD, 2014d). The Education Policy Committee meets once a year. It is
composed of senior officials from the 34 OECD Member countries.
EDPC is responsible for overseeing the strategic direction, coherence, quality and communication of
OECD work on education carried out by the different education bodies of OECD. EDPC focusses
closely on labour market needs and education planning to meet those needs (Mahon and McBride,
2008). It is also responsible for disseminating policy advice, data and policy analysis to stakeholders in
OECD Member countries and beyond.
A11.1.2 Description of the peer review mechanism/shared learning approach
The OECD has an established peer review practice which has characterised the work of OECD in
multiple policy areas including education. A collection of peer reviews in the area of education policy
can be found on OECD’s website (OECD, n.d.c).
EDPC initiates, monitors and supports the peer review of education policies in Member countries by
providing thematic experts, providing feedback of its members on draft reports and supporting the
implementation of learning outcomes of peer reviews. The OECD secretariat supports the peer review
process with a wider administrative remit which includes the collection of background material and
country data, the preparation and conduct of the country assessment (questionnaires, surveys, site
visits) and overall guidance on procedures and principles of the peer review process.24
OECD’s peer reviews entail systematic examination and assessment of a Member country’s
performance by other Member countries, with the ultimate goal of helping the reviewed country
improve its policy making, adopt best practices and comply with established standards and principles
(Pagani, 2002). The peer review process typically involves the following elements:
■ a basis for proceeding, that is, decisions by the EDPC, programmes agreed at ministerial level or
provisions in treaties and other legally binding documents;
■ an agreed set of principles, standards and criteria against which the country performance is
assessed which could include, for example, policy recommendations and guidelines, specific
metrics, indicators or legally binding qualitative or normative principles;
■ designated actors to carry out the peer review which typically includes the reviewed country, the
examiner or peer countries, the EDPC as a collective body and the OECD secretariat which
provides administrative support; and
■ a set of procedures leading to the final result and publishable material.
24
The OECD secretariat supports the process by producing documentation and analysis, organising meetings and missions, stimulating discussion and maintaining continuity.

Assessment of progress in achieving ERA - Final Report
2 April 2015 131
The examination is conducted on an advisory basis and the entire review mechanism is based on
mutual understanding25
of the countries involved in the review.
Typically the peer reviews are structured in three phases:
■ a preparatory phase including a review of background documents, a self-assessment by the
country under review and the preparation of documentation, guidance material, questionnaires and
data by the OECD secretariat;
■ a consultation phase where peer countries and OECD secretariat consult responses to
questionnaire and data provided, carry out on-site visits, consult with interest groups, civil society
and academics. The OECD secretariat then prepares a draft final report and shares it with peer
countries and reviewed country; and
■ an assessment phase where the draft final report is discussed in the EDPC, receives final
amendments by peer countries or other delegates (other country representatives, non-
governmental organisations) and is adopted by EDPC. The final report is then published and
disseminated via a press release.
The final reports prepared by the OECD secretariat followed a common structure in order to ensure
comparability comprising:
■ an analytical section, which reviews country performance in detail and highlights individual
concerns or challenges;
■ an evaluation / summary section which proposes conclusions against the agreed set of principles
and criteria as well as recommendations for improvement; and
■ appendixes including: the composition of the review team, the agenda and dates of the on-site
visits.
There are eight different programmes on education under the directorate for education and skills
(OECD, n.d.b). Peer reviews are used across the different programmes for the purpose of mutual
learning across Member countries. A practical example is provided below, looking at a series of
reviews on the contribution of higher education institutions (HEI) in regional and city development
which were conducted under the remit of the OECD directorate for education and skills.
OECD reviews of higher education in regional and city development
OECD’s Programme on Institutional Management in Higher Education (IMHE) ran a peer review
exercise (2005-2012) to strengthen the contributions of HEIs to regional development by devising
steps to improve collaboration and mutual capacity building between HEIs and their regional
stakeholders and partners at different territorial levels.26
The project reviewed practice in 42 regions
across a variety of OECD countries and intended to (OECD, 2010):
■ provide an opportunity for dialogue between HEIs and national and regional government about
their contribution to the economic, social and cultural development of the region (including
knowledge exploitation by business, skills enhancement of the population, work with
disadvantaged communities, and engagement with the arts);
■ assist regional governments and their agencies, HEIs and other stakeholders to identify
appropriate roles and partnerships within their regions;
25
Mutual understanding refers to a basis for proceeding; an agreed set of principles, standards and criteria against which the country’s performance will be reviewed; designated actors to carry out the review; and a set of procedures leading to the final result. 26
An overview of reviews conducted and final reporting documents can be found at: http://www.oecd.org/edu/imhe/highereducationinregionalandcitydevelopment.htm

Assessment of progress in achieving ERA - Final Report
2 April 2015 132
■ provide policy advice on issues that emerge from the analysis;
■ lay the foundation for an international network for further discussion and exchange of ideas and
issues around good practice and self-evaluation techniques in HEIs’ regional engagement; and
■ produce a final report bringing together the individual reviews.
The key elements of the reviews were:
■ analysis of relevant background material and relevant research;
■ regional reviews against a set of agreed broad principles that include dialogue, stakeholder
collaboration, learning, and leadership commitment, consisting of:
– a joint self-evaluation by HEIs and regional stakeholders;
– a site visit by an international team of experts (organised by the region in conjunction with
IMHE); and
– a peer review report and joint response from the region and its institutions.
■ analysis and synthesis by the project task group.
The peer review was carried out by a team of four to five reviewers comprising two international
experts, one national expert and one or two members of the IMHE. It consisted of a visit of seven
days to the region under review. It was organised by the regional government in conjunction with the
IMHE staff at OECD. The visit included meetings with senior policy makers in key ministries, regional
and local governments, agencies, HEIs, organisations representing HEIs, groups representing
academic staff and students, business and industry, and researchers with a particular expertise in
territorial and higher education development.
Subsequent to the visits a peer review report was prepared. The report drew together the review
team’s observations and analyses on region-specific policy issues. The report highlighted examples
of innovative approaches with the goal of promoting cross-national (regional) exchange of good
practices and provided recommendations for HEIs as well as regional stakeholders.
A11.1.3 Mechanisms present in the policy approach to measure progress and monitor the policy
OECD peer reviews are embedded in a wider progress monitoring system, which builds on a number
of elements. This is presented here to provide context and allow judgement on the transferability of
OECD peer review methods to the European Research Area.
As OECD does not set targets, monitoring in the classical sense does not take place, and no
monitoring documents in the strict sense of the word are produced. OECD’s mechanisms for progress
measurement in the area of education therefore consist of a combination of peer reviews (as
described above), collecting and reviewing data for established indicators27
and continuous
communication and reporting on individual countries as well as comparative cross-country analysis.
There is no obligation on Member countries to contribute to OECD work and report progress against
metrics or indicators developed, but as members finance the work through their membership of OECD,
they are naturally interested in contributing to OECD activities. The main actions are outlined below.
The OECD Indicators of Education Systems (INES) programme has developed a robust set of
indicators to provide information on the state of education around the world. These indicators cover
performance of education systems in the OECD’s 34 Member countries, as well as a number of
partner countries (OECD, 2013a).
These indicators provide information on:
■ the entire national education system of participating countries;
27
For example, the PISA survey (Programme for international Student Assessment) http://www.oecd.org/pisa/

Assessment of progress in achieving ERA - Final Report
2 April 2015 133
■ all levels of education, including early childhood education, primary and secondary education,
tertiary education, and adult education and training;
■ different types of students, including students from different age groups and social backgrounds;
■ different kinds of education, including public education, government-dependent and independent
private; and
■ education, vocational education and training, special education programmes, and other
specialised programmes.
These indicators are the main quantitative metric of measuring and monitoring progress in education
policy and are used in most surveys and country reviews. They are under continuous review and have
been in place since 1998 (OECD, 2013a).
All indicators are published annually in Education at a Glance: OECD Indicators, (EaaG) the INES
programme’s flagship publication, which was first published in 1992. Education at a Glance contains
data from OECD Member countries and other G20 countries who can provide comparable data.
Beside the organisational links to policy, the presentation of the indicators in EaaG is linked to policy
through an organising framework that situates each indicator in a three-dimensional framework
consisting of:
■ actors: individual learners and teachers, instructional settings and learning environments,
educational service providers, and the education system as a whole;
■ targets: learning outcomes for individuals or countries, policy levers or circumstances that shape
these outcomes, or antecedents or constraints that set policy choices into context; and
■ policy issues: quality of educational outcomes and educational provision, issues of equity in
educational outcomes and educational opportunities, and the adequacy and effectiveness of
resource management.
Besides EaaG, the indicators are presented in country notes of 4-5 pages which present and
contextualise main indicators. The notes highlight specific areas of success and challenge. The notes
are accompanied by interactive country profiles, where the user can customise the selection of
indicators and compare countries.
Education at a Glance Highlights, which are produced annually, gives a snapshot of the internationally
comparable data in EaaG. It presents key charts and tables on education levels, student numbers, the
economic and social benefits of education, education financing, and school environments.
The Education Indicators in Focus is also released each month highlighting specific indicators in EaaG
with a view to current public discussions of relevance for education policies and educational reform.
A11.1.4 Assessment of how peer review brought about change in the policy field
Most reviews of the policy impact of OECD peer reviews in the area of education tend to focus on a
single programme (most frequently Programme for International Student Assessment (PISA)) or a
single country. These reviews tend to be critical of the assumptions underlying OECD education policy
and initiatives but acknowledge a normative and qualitative impact on discussions and goal-setting at
national level. In general however, independent research on the policy impact of OECD’s initiatives is
scarce. A review of OECD publications, websites and studies suggest the following main impacts of
the OECD’s peer reviews in the field of education policy:
■ use and re-use at national level of indicators, metrics and guidelines established;
■ discussion and use of advice on policy reforms at national level and implementation advice
provided in the peer review reports; and
■ use of peer review data and reports by independent researchers and stakeholders, who can
access reports and databases for a fee, therefore feeding into a national debate on education
systems.

Assessment of progress in achieving ERA - Final Report
2 April 2015 134
There is some evidence of the policy impact for OECD’s wider programmes and activities in the area
of education. For example, research from 2011 and 2012 showed that PISA has become accepted as
a reliable instrument for benchmarking student performance worldwide, and that PISA results have
had an influence on policy reform in the majority of participating countries/economies (Breakspear,
2012).
The OECD peer review on higher education in regional and city development discussed above has
helped policy makers from the participating regions in a number of ways.28
The peer reviews together
with self-evaluation of HEIs have helped government and HEI staff to understand regional challenges
and barriers, portrayed policy reform option and provided a comprehensive understanding of:
■ the contribution of HEIs’ research to regional innovation;
■ the role of teaching and learning in the development of human capital and skills;
■ the contribution of HEIs to social, cultural and environmental development; and
■ the role of HEIs in building regional capacity to act in an increasingly competitive global economy.
A11.1.5 Transferability of peer review mechanism and lessons for ERA
Lessons for ERA
■ A secretariat can be used to reduce the burden of evidence-gathering and background research on the reviewers, allowing experts to make more effective use of their time.
■ Member State involvement in the development of guiding principles, procedural arrangements and resource commitments is critical to ensure ownership and credibility of the peer review mechanism.
■ Continuous moderation of the process and agreed targets as well as established and commonly accepted indicators provide for higher comparability and transparency of individual peer reviews.
■ Peer reviews only involving government officials and OECD staff maybe biased regarding the formulated recommendations and allow only for a limited level of criticism.
■ Peer review processes can contribute to improvements in the host country and to the definition of good practice for the community at large.
■ Publication of the results provides transparency.
The role of OECD in supporting and facilitating policy-design for its Member countries can be seen as
similar as that of the Commission for its Member States for ERA, although they operate in different
institutional and legislative environments. Both the EU and the OECD try to drive activities through an
analytical and moderating role based on input from Member countries. The European Commission has
the additional lever of making legislative proposals, whilst the OECD peer review process builds to a
larger extent on the high credibility of the process. The actors involved in the peer review for the
OECD directorate on education and skills are quite similar to actors represented in ERAC and
activities around ERA, namely Member States’ research and education ministries and stakeholders
from the higher education sectors.
The OECD process benefits strongly from an established institutional set-up which is built around
strong administrative support from the OECD secretariat and an established set of indicators and
monitoring instruments. Size and context of peer review by the Commission for ERA will have to be
adopted depending on support and resources made available by Member States and the Commission.
28
See presentations at the OECD Roundtable on Higher Education in Regional and City Development 2012: Universities for skills, entrepreneurship, innovation and growth: http://www.oecd.org/edu/imhe/oecdroundtableuniversitiesforskillsentrepreneurshipinnovationgrowth-preliminaryagenda.htm

Assessment of progress in achieving ERA - Final Report
2 April 2015 135
Another aspect to consider is the involvement of stakeholders beyond government representatives.
The OECD peer reviews involve only government officials and OECD staff, although both in education
and research policy, stakeholders such as HEIs, RPOs and RFOs take a strong role in shaping policy
and funding programmes at the national level. In the context of ERA, the European Commission has
signed a joint declaration with six stakeholder organisations representing HEIs, RPOs and RFOs. 29
It will also be critical to build trust and confidence to ensure shared ownership of the peer review
process. The OECD process has achieved this through formalisation of the process based on
continuous input of participating countries. Furthermore, the OECD process has already built a long
track record of successfully conducted peer reviews which has enabled high interest by stakeholders
and participating countries. Judging from the currently rather moderate Member State interest in peer
reviews visible in ERAC documents,30
the establishment of a structured peer review process in ERA
will have less resources available and be in a more difficult starting position. It is therefore paramount
to ensure an open exchange and joint agreement of the guiding principles, procedural arrangements
and resource commitments between the Commission and Member States.
A11.1.6 Recommendations for the future of ERA
Recommendations
■ Through the European Research and Innovation Committee (ERAC), an established committee of member state representatives already exists. ERAC should receive further administrative and expert support to ensure comparability, appropriate participation and regularity of peer reviews; and ensure the establishment and management of appropriate quantitative metrics, procedural and methodological guidance.
■ Thematic and methodological guidance could be provided through the European roadmap on ERA, which is scheduled to be published in 2015 and will include a number of priority areas where national actions can bring about substantial progress. Administrative support should be provided either through permanent staff in the ERAC secretariat, at DG RTD or via external experts.
■ Broad involvement of stakeholder organisations without an established process and accompanying guidelines would potentially complicate the peer review process. Once peer reviews in ERA have been given a clearer direction and a formalised process and administrative support is established, it could be envisaged to follow-up each peer review with a dissemination event supported by the stakeholder organisations and involve stakeholder organisations as reviewers in themes where changes and activities at institutional level promise to be particularly effective.
■ To ensure an open exchange and joint agreement of the guiding principles, procedural arrangements and resource commitments between the Commission and Member States, independent and external moderation of necessary discussions and negotiations in ERAC would provide substantial added value.
29
Conference of European Schools for Advanced Engineering Education and Research (CESAER), European Association of Research and Technology Organisations (EARTO), European University Association (EUA), League of European Research Universities (LERU), NordForsk and Science Europe. 30
See ERAC meeting documents here http://www.consilium.europa.eu/policies/era/erac?lang=de ; European Commission note to ERAC members and observers on peer reviews envisaged by the end of 2013 (Ares(2013)511215 - 26/03/2013).

Assessment of progress in achieving ERA - Final Report
2 April 2015 136
A11.2 EU Employment policy
A11.2.1 Discussion of the relevant policy field
Employment is a building block of the EU's growth strategy (EC, 2014d) alongside innovation,
education, social inclusion and climate/energy. The European employment strategy (EES) aims to
create more and better jobs throughout the EU.
While Member States remain fully responsible both in terms of the design and implementation of their
employment policies, the EES provides a framework for discussion, common priority setting, review
and evaluation and mutual learning to guide and improve the performance of national employment
policies31
.
As well as promoting a co-ordinated policy approach, the EES also emphasises the importance of a
continuous dialogue between key stakeholders, namely national governments, regional/local
authorities, social EU institutions, social partners, civil society and other actors to build broad-based
support for reforming national employment policies.
The current legal basis for the EES is provided in Title IX ‘Employment’ (Articles 145 to 150) of the
Treaty on the Functioning of the European Union. Since its launch in 2007, the EES has continuously
developed and has been integrated within broader strategies, including the Europe 2020 strategy.
The governance of the EES is based on the continuous exchange of information between the
Commission (DG Employment, Social Affairs & Inclusion (DG EMPL)), the European Council and the
Employment, Social Policy, Health and Consumer Affairs (EPSCO) Council, with an important role
played by its advisory Employment Committee (EMCO). The governance of the EES includes the
following main elements, which are aligned to the EU’s annual cycle of economic policy guidance
(European Semester):
■ employment guidelines providing common priorities and targets for employment policies;
■ submission of National Reform Programmes by national governments;
■ release of a Joint Employment Report (Commission/Council) annexed to the Annual Growth
Survey, which is based on assessment of the employment situation in Europe, implementation of
the Employment Guidelines and examination of the draft National Reform Programmes; and
■ country-specific recommendations based on assessment of the National Reform Programmes.
The employment guidelines underpinning the EES activities outline common objectives for the
employment policies of Member States and EU-level targets. The employment guidelines have been
integrated within a broader set of guidelines for economic policies (integrated guidelines) since 2005
(EC, 2011a).
The employment guidelines are set against a number of EU headline targets from the Europe 2020
strategy. National governments are invited to set their own country targets, as a contribution to each of
the EU headline targets (EU, n.d.). Practical implementation of the EES is supported by the European
Employment Observatory (EEO)32
and the Mutual Learning Programme.
A11.2.2 Description of the peer review mechanism/shared learning approach
A system of ‘peer reviews’ linked to the EES was set up for the first time in 1999. A revised Mutual
Learning Programme (MLP) was launched in 2005 in response of a request from the European
Council to develop more robust and integrated approaches to mutual learning in the area of
employment policies.
31 ‘[T]he European Employment Strategy has provided a framework for coordinating job creation policies, similar to the framework for economic policy, and with the same aim of converging towards jointly set, verifiable, regularly updated targets’ (EC, 2013a).
32 A network of experts which produces research and analysis on the EU’s labour market and employment:
http://ec.europa.eu/social/main.jsp?catId=1086&langId=en

Assessment of progress in achieving ERA - Final Report
2 April 2015 137
The MLP is a central tool of the European Employment Strategy, based on provisions of Article 149 of
the Treaty on the Functioning of the European Union. The legal basis provides for the EU to “adopt incentive measures designed to encourage cooperation between Member States and to support their action in the field of employment through initiatives aimed at developing exchanges of information and best practices, providing comparative analysis and advice as well as promoting innovative approaches and evaluating experiences”.
The MLP therefore aims to
■ support, coordinate and encourage mutual learning between EU Member States in order to assist
progress towards the common objectives outlined in the Employment Guidelines;
■ encourage mutual learning opportunities resulting in policy influence at the EU and national levels;
and
■ disseminate the results of the MLP and their contributions to the EES to wider audiences.
The MLP includes the following activities:
■ thematic events – seminars on a specific policy theme at the start of the year;
■ peer reviews – in-country reviews throughout the year aimed at government representatives,
informed and supported by independent academics;
■ learning exchanges – aimed at small groups of national representatives to share experiences in
relation to a specific policy issue;
■ dissemination seminars – held at the end of each year to disseminate the MLP’s results; and
■ a database of labour market practice – containing examples of effective policies and measures
within the context of the EES.
Similar to the overall EES structure, activities of the MLP are aligned to the EU’s annual cycle of
economic policy guidance (European Semester), including the European Semester’s specific work
programme and budget. The MLP is managed by DG EMPL C.1, which is supported by an external
contractor to implement the programme.
Activities organised under the MLP are both case-driven and problem-driven: while Member States
volunteer to present a certain policy (or attend an event), the topic should be of strategic importance at
both the national and EU levels. MLP activities take place throughout the year.
Input from DG EMPL and the external contactor in charge of the programme is critical in shaping the
content of activities, as well as stimulating exchange amongst Member States. DG EMPL targets
topics for which the demand for mutual learning activities is expected to be high (e.g. in the area of
youth employment policies) and proactively invites countries to make proposals and/or express an
interest. Small-scale events (i.e. involving a limited number of participants) are the most popular
amongst government representatives, as they offer more opportunities for exchange and in-depth
discussions. Some barriers for participation clearly identified include the lack of staff/time and
language barriers (as English is used as the main working language).
The thematic coverage of MLP activities focuses on key areas of the EES and Europe 2020 strategy
in order to feed into existing policy processes and themes present in the National Reform
Programmes.
The two main activities potentially relevant to the ERA monitoring mechanism, the peer reviews and
thematic events, are described in further detail below.

Assessment of progress in achieving ERA - Final Report
2 April 2015 138
A11.2.2.1 Peer reviews as part of the Mutual Learning Programme33
Peer reviews are used to assess the implementation of concrete policy measures on a given topic.
Peer reviews allow the exchange of experiences between a ‘host country’ who presents and wishes to
gain feedback on an effective policy (and associated good practice), and ‘peer countries’ who are
interested in learning from the host example and potentially transferring it into their national setting;
and sharing their own policy experiences with the host and other participating countries. The process
is therefore very much based on a two-way exchange.
The peer review takes place in a host country, with representatives from up to 10 peer countries. DG
EMPL invites Member States (via EMCO) and other participating countries to host a review on a
voluntary basis. Once host countries are decided, DG EMPL sends out invitations to participate via
EMCO. Each country is represented by a national government official, along with an independent
expert appointed by the MLP support team. Another independent expert is also appointed to prepare a
Thematic Discussion Paper, which presents the topic in a wider policy context, drawing on country
experiences beyond those represented at the Peer Review. Delegations from the Commission and the
MLP support team also attend the Peer Reviews, making the total participation between 25 and 35
people.34
The peer review takes place over one and a half days, involving presentations on the host country
policy example, a brief round table of the peer countries’ experiences, followed by a number of
working group discussions to facilitate mutual exchange and learning.
Where appropriate, the peer reviews also include a study visit organised by the host country, whereby
participants can see the direct application and impact of policy on the ground.
The main tasks of the host country are to:
■ summarise the policy example in a one-to-two page ‘fiche’, which is circulated with the invitation;
■ contribute to the development of the thematic content and agenda of the peer review, in
collaboration with the Commission and MLP support team;
■ provide a venue and support the practical arrangements on site, i.e.: catering; and
■ give presentations and chair the proceedings, where appropriate, on the day.
The main tasks of the support team includes:
■ assist the host country in developing the thematic content and agenda of the peer review;
■ appoint, brief and quality assure the work of the independent experts;
■ liaise and coordinate with the participating Member States, including the collection of relevant
background materials;
■ provide logistical support;
■ assist all the contributors in preparing their inputs and presentations;
■ chair and/or facilitate the discussions on the day, if needed; and
■ prepare and circulate a final report of the discussions and findings.
Travel and accommodation of all participants (except representatives of the host country delegation)
and experts’ fees are covered by the MLP budget; the host country covers costs linked to venue,
subsistence and if relevant, language interpretation.
33
Mutual Learning Programme - Summary guidance on the Peer Reviews: DG Employment, Social Affairs and Inclusion. 34
European Commission DG EMPL: Mutual Learning Programme. Summary guidance on the Peer Reviews. http://ec.europa.eu/social/BlobServlet?docId=11398&langId=en
Assessment of progress in achieving ERA - Final Report
2 April 2015 139
A11.2.2.2 Thematic reviews in the Employment OMC committee (EMCO) of the European Council
Thematic reviews are one specific type of thematic event organised during the first semester of the
year before the negotiation of new Country Specific Recommendations (CSRs). Each thematic review
focusing on a thematic grouping of CSRs follows a common format where Member States act as both
reviewers and reviewees. Reviews focus on recent policy developments introduced by Member States
since the last review. Country fiches synthesising prior CSRs and measures are developed to prepare
for the review. The European Commission also prepares a horizontal analysis for each thematic area
across all Member States.
From January to April 2013, seven thematic reviews were held on seven different topics, including:
active labour market policies and public employment services; tax wedge on labour; labour market
participation; employment protection legislation and labour market functioning; wages; female labour
market participation; and, employment and education and transition to work.
The outcome of the process is the publication of the EMCO Multilateral Surveillance Draft
Conclusions.35
This document provides for each review a summary of national challenges, recent
policy developments and a joint EMCO opinion. The final outcome of each country examination is the
conclusion from EMCO on progress made on addressing the CSRs.
A11.2.3 Mechanisms present in the policy approach to measure progress and monitor the policy
The EES MLP is embedded in a wider progress monitoring system, which builds on a number of
elements. This is presented here to provide context and allow judgement on the transferability of MLP
methods and instruments to the European Research Area.
There is a sophisticated and multilateral progress measurement system in place in the area of EU
employment policy. Member States described and assessed the actions they undertake to achieve
Europe 2020 objectives and implement the Employment Guidelines as part of their National Reform
Programmes or NRPs, a document which presents the country’s policies and measures to sustain
growth and jobs and to reach the Europe 2020 targets.
At EU level, different tools are used by the Commission to assess and monitor progress made by
Member States on an annual basis. The main tool is the Annual Growth Survey, which sets out the
EU’s priorities for the coming year to boost growth and job creation and opens the yearly European
Semester. At the end of each European Semester, the European Commission also issues sets of
country-specific recommendations.
DG EMPL has developed different sets of indicators to monitor employment policies at national level
for different programmes. These sets of indicators have provided a monitoring mechanism to evaluate
the progress of employment policy in the Member States, which is brought together in the Europe
2020 Joint Assessment Framework, which includes two elements relevant for the employment policy
area:
■ monitoring and assessment of the main challenges under the employment guidelines through a
three-step methodology including a quantitative and qualitative assessment; and
■ quantitative monitoring of progress towards the EU headline and related national targets.
As an annex to the Annual Growth Survey, the EPSCO produces an annual Employment Performance
Monitor (EPM), which presents a yearly stock-taking of the employment-relevant components of the
Joint Assessment Framework above and challenges in each Member State.
A11.2.4 Assessment of how the MLP brought about change in the policy field
The MLP is based on a ‘tested and tried’ model, largely approved by participants and enjoying
continuous interest from Member States. Research currently undertaken by ICF36
suggests that the
35
Available at: http://ec.europa.eu/social/main.jsp?catId=115&langId=en 36
Study commissioned by the European Commission on Comparison and assessment of the effectiveness and efficiency of different OMCs to propose innovative governance methods in the ET 2020 context.

Assessment of progress in achieving ERA - Final Report
2 April 2015 140
approval for the MLP largely due to 1) the high political and public pressure for action in the wake of
the economic crisis and 2) a highly formalised progress measurement system (European Semester,
National Reform Plans and Country Specific Recommendations as described above) and 3) a
dedicated administrative and technical support mechanism provided through an external contractor. In
this context, the MLP exerts an indirect influence on national policy making.
The MLP has been found to have helped EES to contribute to and shape domestic reform in the EU,
for instance by influencing beliefs and mind sets despite strong structural barriers to the convergence
of national employment policies (Heidenreich, 2009). A recent evaluation of the MLP has found that
whilst the overall structure and relevance of the MLP activities is good, transferability of information
from thematic review seminars to policy practice of participants is limited, as, amongst other things,
key stakeholders (social partners, NGOs and businesses) were often absent from discussions. Peer
reviews were in contrast seen as the more valued and significant aspect of the MLP and were more
likely to lead to policy transfer and practical learning outcomes in the participating organisations, but
improvements could be made to the reduce the volume of preparatory material for participants and the
dissemination of results (Ecorys, 2013).
The specific impact on national policies varies from awareness-raising and identification of key issues
to more substantial changes in policy approaches. The main added value of the process is the
comparison with other countries to identify strengths and weaknesses of national policies under
review. The MLP provides policy direction beyond obvious issues arising in national debate. It can
help to overcome national reluctance towards reform as well as resolve deadlocks in contentious
national debates.
A specific strength of the EMCO thematic reviews is that EMCO publishes Multilateral Surveillance
Draft Conclusions. These are comprehensive summaries of thematic reviews and are drafted by
Member States themselves. This creates positive peer-pressure and ensures that the European
Commission is not the only ‘evaluator’ in the process. According to research currently undertaken by
ICF,37
the peer reviews described above are the main and most effective sharing and learning tools
within the EES.
A11.2.5 Transferability of peer review mechanism and lessons for ERA
Lessons for ERA
■ A strength of the EES Mutual Learning Programme is that the activities are run as a programme with its own annual cycle closely aligned with the European Semester’s work programme.
■ The formulation of national guidance and strategy including a corresponding feedback mechanism at the European level through the European Semester have provided added-value to the EES Mutual Learning Programme.
■ The availability of sufficient budget to provide for the external support service is a critical success factor of the EES Mutual Learning Programme.
■ The annual summary of peer reviews and thematic reviews conducted under the EES Mutual Learning Programme, provided for in the Multilateral Surveillance Conclusions, helps to strengthen ownership of the MLP in Member States, increases peer-pressure and mutual accountability between Member States.
EU employment policies have direct and indirect linkages with themes addressed by ERA. Gender
inequality carries major implications on productivity and skill losses across all business sectors and
needs to be addressed across the economy. A strong knowledge and skill base, supported by
effective national research systems and well-functioning technology transfer between academia and
37
Study commissioned by the European Commission on Comparison and assessment of the effectiveness and efficiency of different OMCs to propose innovative governance methods in the ET 2020 context.

Assessment of progress in achieving ERA - Final Report
2 April 2015 141
industry, will in most cases have a positive impact on levels of employment and employability of
people with access to this knowledge and corresponding skills.
In EU employment policy, the MLP has been a key mechanism for the implementation and
understanding of EES. The MLP has enabled EES to prioritise and target specific policies proposed by
the European Commission, and agreed by national governments.
First mutual learning exercises have been undertaken through the European Research Area and
Innovation Committee (ERAC) in a format similar to the thematic events under the employment MLP,
aiming at developing a mutual understanding of national strategies in specific aspects of innovation
and research policy. Currently however, ERA is missing comparable national guidance and a
corresponding feedback mechanism as is present in EES through the European Semester
mechanism.
Challenges in implementation will be comparable to the ones experienced in EES. These include
potential language barriers and the inherent limitations of exclusively involving government or ministry
staff in the exercise. A certain degree of social desirability bias should be assumed in this context. In
case of further peer review or mutual learning activities in ERA, it would be worthwhile to reflect on this
and understand the benefits, challenges and administrative capacity needed for involving independent
experts or the stakeholder organisations that have signed a joint declaration on ERA completion with
the European Commission.38
From the descriptive analysis of the MLP above, it becomes clear that the need to free up budget for
external or internal administrative support is a key success factor. One of the main strengths of the
MLP is that the activities are run as a programme with its own annual cycle closely aligned with the
European Semester’s work programme, budget and an external support service.
In conclusion, introducing a structured mutual learning programme in ERA could improve convergence
between Member States and bridge certain gaps in effective monitoring that the ERA monitoring
mechanism is currently lacking.
A11.2.6 Recommendations for the future of ERA
Recommendations
■ A more structured approach using an ERA roadmap for Europe and corresponding national strategies could provide a baseline against which peer reviews and thematic reviews similar to EES could be implemented.
■ The dedicated administrative support provided through the MLP support service should be replicated in ERA, for example, through further support to ERAC, but would need an extensive review of the current monitoring and reporting mechanisms and their timeliness against national agenda setting through ERA roadmaps. The peer reviews conducted by ERAC on the basis of the Self-Assessment Tool already provide for an agreed structure. This would need to be complemented with commonly agreed processes and in-depth guidance, as ensured by the support team under the employment MLP.
■ A further tool which could be introduced in ERA is an annual summary of peer reviews/thematic reviews conducted drafted by ERAC (i.e. by the Member States themselves), similar to the Multilateral Surveillance Conclusions produced by EMCO. This would strengthen ownership of the ERA monitoring mechanism in Member States and increase peer-pressure and mutual accountability between Member States.
■ The amount of preparatory material should be kept to a minimum to reduce administrative burden of participating organisations.
38
Conference of European Schools for Advanced Engineering Education and Research (CESAER), European Association of Research and Technology Organisations (EARTO), European University Association (EUA), League of European Research Universities (LERU), NordForsk and Science Europe.

Assessment of progress in achieving ERA - Final Report
2 April 2015 142
■ Wider organisational learning effects can be achieved if the peer review results are disseminated widely across relevant stakeholders in all EU Member States and Associated Countries.

Assessment of progress in achieving ERA - Final Report
2 April 2015 143
Annex 12 References
■ Alslev Christensen, T., Freireich, S., Kolar, J. and Nybergh, P., 2012. Peer-Review of the Estonian
Research and Innovation System. Steady Progress Towards Knowledge Society. Expert Group
Report prepared for the European Research Area Committee.
■ Archambault, E., Amyot, D., Deschamps, P., Nicol, A., Provencher, F., Rebout, L. and Roberge,
G., 2014. Proportion of Open Access Papers Published in Peer Reviewed Journals at the
European and World Levels, 1996-2013. RTD-B6-PP-2011-2: Study to develop a set of indicators
to measure open access, Science-Metrix.
■ Breakspear, S., 2012. The Policy Impact of PISA. An exploration of the normative effects of
international benchmarking in school system performance.
■ Council of the European Union, 2014. Conclusions of the Competitiveness Council, 21 February
2014.
■ Crasemann, W., Lehto, P., Starzer, O., van der Zwan, A., Cunningham, P. and Halme, K., 2012.
Peer review of the Danish Research and Innovation System. Strengthening innovation
performance, http://ec.europa.eu/research/innovation-
union/pdf/erac/dk__peer_review_report__2012.pdf
■ Deloitte, 2014. Researchers’ report 2014,
http://ec.europa.eu/euraxess/pdf/research_policies/Researchers per cent20Report per
cent202014_FINAL per cent20REPORT.pdf
■ Dinges, M., Bouttier, R., Schiffbänker, H., Holzinger, F., van der Giessen, A., Lehenkari, J.,
Deschryvere, M., Kuittinen, A., and Rammer, C., 2014. Analysis of the ERA state of play in
Member States and Associated Countries: Focus on priority areas,
http://ec.europa.eu/research/era/pdf/era-
communication/analysis_of_the_state_of_play_of_era_vf20140826.pdf
■ Doussineau, M., Marinelli, E., Chioncel,, M., Haegeman, K., Carat, G. and Boden, M., 2013. ERA
communication synthesis report,
http://publications.jrc.ec.europa.eu/repository/bitstream/JRC85253/ipts_erasynthesisreport_final.p
df
■ Ecorys, 2013. Evaluation of the Mutual Learning Programme within the European Employment
Strategy.
■ ERA SGHRM, 2013. Using the Principles for Innovative Doctoral Training as a Tool for Guiding
Reforms of Doctoral Education in Europe,
http://ec.europa.eu/euraxess/pdf/research_policies/SGHRM_IDTP_Report_Final.pdf
■ ERAC, 2014a. Opinion on the 2014 ERA Progress Report. 30 October 2014. ERAC 1213/14,
http://era.gv.at/object/document/1488
■ ERAC, 2014b. Note from the ERAC Steering Board on Developing an ERA Roadmap: possible
ways forward. 17 May 2014, ERAC 1207/14,
http://era.gv.at/object/document/1348/attach/eraroad6.pdf
■ EC, 2003. The ‘ERA-NET’ Scheme. Supporting cooperation & coordination of national or regional
research programmes, http://ec.europa.eu/research/fp6/pdf/era-net-leaflet_en.pdf
■ EC, 2005. Communication from the Commission to the Council and the European Parliament -
Common Actions for Growth and Employment : The Community Lisbon Programme.
(COM(2005)330 final), http://eur-lex.europa.eu/legal-content/EN/TXT/?uri=CELEX:52005DC0330
■ EC, 2007. Green Paper. The European research Area: New Perspectives (COM(2007) 161 final).
■ EC, 2008a. Commission Staff Working Document. Accompanying Document to the
Communication from the Commission to the Council, the European Parliament, the European
Economic and Social Committee and the Committee of the Regions towards Joint Programming in
http://publications.jrc.ec.europa.eu/repository/bitstream/JRC85253/ipts_erasynthesisreport_final.pdf

Assessment of progress in achieving ERA - Final Report
2 April 2015 144
Research: Working together to tackle common challenges more effectively. Impact Assessment,
(COM(2008) 468 final), http://ec.europa.eu/research/era/docs/en/ec-joint-programming-6.pdf
■ EC, 2008b. Report of the ERA Expert Group. Challenging Europe’s Research: Rationales for the
European Research Area (ERA).
■ EC, 2009a. ERA indicators and monitoring. Expert Group Report,
http://ec.europa.eu/research/era/pdf/era_indicators&monitoring.pdf
■ EC, 2009b, Policy Mixes for R&D in Europe.
http://www.eurosfaire.prd.fr/7pc/doc/1249471847_policy_mixes_rd_ue_2009.pdf
■ EC, 2010. Communication from the Commission to the European Parliament, the Council, the
European Economic and Social Committee and the Committee of the Regions. Europe 2020
Flagship Initiative. Innovation Union. COM(2010) 546 final,
http://ec.europa.eu/research/innovation-union/pdf/innovation-union-communication_en.pdf
■ EC, 2011a. Guidelines for employment policies,
http://europa.eu/legislation_summaries/employment_and_social_policy/community_employment_p
olicies/em0040_en.htm
■ EC, 2011b. Principles for Innovative Doctoral Training,
http://ec.europa.eu/euraxess/pdf/research_policies/Principles_for_Innovative_Doctoral_Training.p
df
■ EC, 2012a. Areas of untapped potential for the development of the European Research Area
(ERA). Analysis of the response to the ERA Framework public consultation.
■ EC, 2012b. Commission Staff Working Document. Impact assessment accompanying the
document Communication from the Commission to the European Parliament, the Council, the
European Economic and Social Committee and the Committee of Regions. A Reinforced
European Research Area Partnership for Excellence and Growth,
http://ec.europa.eu/research/era/pdf/era-communication/era-impact-assessment_en.pdf
■ EC, 2012c. Communication from the Commission to the European Parliament, the Council, the
European Economic and Social Committee and the Committee of the Regions. Enhancing and
focusing EU international cooperation in research and innovation: A strategic approach.
(COM(2012) 497),
http://ec.europa.eu/research/iscp/pdf/policy/com_2012_497_communication_from_commission_to
_inst_en.pdf
■ EC, 2012d. Communication from the Commission to the European Parliament, the Council, the
European Economic and Social Committee and the Committee of the Regions. A Reinforced
European Research Area Partnership for Excellence and Growth. (COM(2012)392 final),
http://ec.europa.eu/euraxess/pdf/research_policies/era-communication_en.pdf
■ EC, 2013a. Communication from the Commission to the European Parliament and the Council.
Strengthening the social dimension of the Economic and Monetary Union. COM(2013) 690 final,
http://eur-lex.europa.eu/LexUriServ/LexUriServ.do?uri=COM:2013:0690:FIN:EN:PDF
■ EC, 2013b. Exploration of the implementation of the Principles for Innovative Doctoral Training in
Europe.
■ EC, 2013c. Recommendations on the Implementation of the ERA Communication by Member
States and by the European Commission. Report of the Expert Group 2013,
http://ec.europa.eu/research/era/pdf/era_progress_report2013/expert-group-support.pdf
■ EC, 2013d. Report from the Commission to the Council and the European Parliament. European
Research Area Progress report 2013, COM (2013) 637 final.
■ EC, 2013e. She figures 2012. Gender in Research and Innovation. Statistics and Indicators,
http://ec.europa.eu/research/science-society/document_library/pdf_06/she-figures-2012_en.pdf

Assessment of progress in achieving ERA - Final Report
2 April 2015 145
■ EC, 2014a. Commission Staff Working Document. European Research Area. Facts and figures
2014. Accompanying the document Communication from the Commission to the Council and the
European Parliament: European Research Area Progress Report 2014, SWD(2014) 280 final,
http://ec.europa.eu/research/era/pdf/era_progress_report2014/era_facts&figures_2014.pdf
■ EC, 2014b. Communication from the Commission to the European Parliament, the Council, the
European Economic and Social Committee and the Committee of the Regions. Research and
innovation as sources of renewed growth, http://ec.europa.eu/research/innovation-union/pdf/state-
of-the-union/2013/research-and-innovation-as-sources-of-renewed-growth-com-2014-339-final.pdf
■ EC, 2014c. Communication from the Commission to the Council and the European Parliament.
European Research Area Progress Report 2014, COM(2014) 575 final,
http://ec.europa.eu/research/era/pdf/era_progress_report2014/era_progress_report_2014_commu
nication.pdf
■ EC, 2014d. Europe 2020 targets, http://ec.europa.eu/europe2020/europe-2020-in-a-
nutshell/targets/index_en.htm
■ EC, 2014e. Strategic Forum for International Science and Technology Cooperation,
http://ec.europa.eu/research/iscp/index.cfm?pg=sfic
■ EC, 2015a. Education and training for growth and jobs,
http://ec.europa.eu/education/policy/strategic-framework/growth-jobs_en.htm
■ EC, 2015b. The EURAXESS Jobs Portal, http://ec.europa.eu/euraxess/index.cfm/general/about
■ EC, n.d.a. ERAWATCH, http://erawatch.jrc.ec.europa.eu/
■ EC, n.d.b. RESAVER - A Pan-European Pension Fund,
http://ec.europa.eu/euraxess/index.cfm/rights/resaver
■ EU, 2012. Consolidated version of the Treaty on the Functioning of the European Union, http://eur-
lex.europa.eu/legal-content/EN/TXT/PDF/?uri=CELEX:12012E/TXT&from=EN
■ EU, n.d. Overview of the Europe 2020 targets, http://ec.europa.eu/europe2020/pdf/targets_en.pdf
■ European Council, 2000. Lisbon European Council 23 and 24 March 2000. Presidency
Conclusions, http://www.europarl.europa.eu/summits/lis1_en.htm
■ European Council, 2002. Presidency conclusions. Barcelona European Council 15 and 16 March
2002, http://ec.europa.eu/invest-in-research/pdf/download_en/barcelona_european_council.pdf
■ European Council, 2014. Agenda of 2014 ERAC Mutual Learning Seminar on research and
Innovation Policies,
http://www.consilium.europa.eu/media/2722438/final_agenda_erac_mls_2014__2_.pdf
■ EP, 2013. Towards a Maastricht for Research.
■ Finne, H., Day, A., Piccaluga, A., Spithoven, A., Walter, P. and Wellen, D., 2011. A Composite
Indicator for Knowledge Transfer: Report from the European Commission’s Expert Group on
Knowledge Transfer Indicators, http://ec.europa.eu/research/innovation-union/pdf/kti-report-
final.pdf
■ Goetzeler, M., Arden, W., Dormoy, J.-L., Jansz, M., Luukkonen, T., de Prost, C., Sangiovanni-
Vincentelli, A. And Wright, C. D., 2013. Second Interim Evaluation of the ARTEMIS and ENIAC
Joint technology Initiatives. May 2013. Final report. A report prepared for the European
Commission DG Communications Networks, Content & Technology.
■ Guellec, D. and Potterie, B., 2001. The internationalization of technology analyzed with patent
data. Research Policy 30, 1253 – 1266.
■ German Federal Government, 2014. Strategy of the Federal Government on the European
Research Area (ERA). Guidelines and National Roadmap,
http://www.bmbf.de/pubRD/ERA_Strategy_englisch.pdf

Assessment of progress in achieving ERA - Final Report
2 April 2015 146
■ Haegeman, K., Harrap, N., Boden, M. and Oezbolat, N., 2014. Added value of transnational
research programming: lessons from longstanding programme collaborations in Europe
■ Haegeman, K., Marinelli, E., Perez, S. E., Carat, G., Degelsegger, A., Weiss, G. and Warnke, P.,
2012. ERA fabric map, first edition, http://ec.europa.eu/research/social-sciences/pdf/vera-era-
project-report_en.pdf
■ Heidenreich, M., 2009. Changing European Employment and Welfare Regimes: The Influence of
the Open Method of Coordination.
■ Hollanders, H. and Es-Sadki, N., 2014. Innovation Union Scoreboard 2014,
http://ec.europa.eu/enterprise/policies/innovation/files/ius/ius-2014_en.pdf
■ IDEA Consult, 2013. Support for continued data collection and analysis concerning mobility
patterns and career paths of researchers. Deliverable 8 – Final report MORE2,
http://ec.europa.eu/euraxess/pdf/research_policies/more2/Final per cent20report.pdf
■ Mahon, R., and McBride, S. 2008. The OECD and Transnational Governance,
http://www.ubcpress.ca/books/pdf/chapters/2008/OECDandTransnationalGovernance.pdf
■ Mitsos, A., Bonaccorsi, a., Caloghirou, Y., Allmendinger, J., Georghiou, L., Mancini, M. And
Sachwald, F., 2012. High-level Panel on the Socio-Economic Benefits of the European research
Area – final report, http://ec.europa.eu/research/era/pdf/high-level-panel-report_en.pdf
■ Nauwelaers, C., Boekholt, P., Mostert, B., Cunningham, P., Guy, K., Hofer, R. and Rammer, C.,
2009. Policy Mixes for R&D in Europe. UNU-MERIT, April 2009. A study commissioned by the
European Commission – Directorate-General for Research,
http://www.eurosfaire.prd.fr/7pc/doc/1249471847_policy_mixes_rd_ue_2009.pdf
■ OECD, 2010. Supporting the contribution of higher education institutions to regional development -
Design and implementation.
■ OECD, 2012. Better skills, better jobs, better lives. A strategic approach to skills policies,
http://skills.oecd.org/documents/OECDSkillsStrategyFINALENG.pdf
■ OECD, 2013a. Education at glance 2013, OECD indicators, http://www.oecd-
ilibrary.org/education/education-at-a-glance-2013_eag-2013-en
■ OECD, 2013b. Science, Technology and Industry Scoreboard 2013,
http://www.oecd.org/sti/scoreboard-2013.pdf
■ OECD, 2014a. Convention on the Organisation for Economic Co-operation and Development,
Paris 14th December 1960;
http://www.oecd.org/general/conventionontheorganisationforeconomicco-
operationanddevelopment.htm
■ OECD, 2014b. Main Science and Technology Indicators Volume 2014/1.
■ OECD, 2014c. OECD work on education and skills 2013-14, http://www.oecdmybrochure.org/edu
■ OECD, 2014d. On-Line Guide to OECD Intergovernmental Activity,
http://webnet.oecd.org/OECDGROUPS/Bodies/ListByDirectorateView.aspx?book=true
■ OECD, n.d.a. OECD Higher Education Programme IMHE,
http://www.oecd.org/edu/imhe/#d.en.192220
■ OECD, n.d.b. OECD Work on Education: Programmes, http://www.oecd.org/edu/programmes.htm
■ OECD, n.d.c. Reviews of national policies for education, http://www.oecd-
ilibrary.org/education/reviews-of-national-policies-for-education_19900198
■ OEDC, n.d.d. The OECD’s peer review process, http://www.oecd.org/site/peerreview
■ Pagani, F. 2002. Peer review: a tool for co-operation and change, An Analysis of an OECD
Working Method, http://www.oecd.org/investment/anti-bribery/anti-briberyconvention/1955285.pdf

Assessment of progress in achieving ERA - Final Report
2 April 2015 147
■ Rambøll, 2012. ERAC peer review lessons. Presentation at the ERAC meeting on 15.6.2012
■ Rossi, G. 2013. Proposal to ESFRI on “Indicators of pan-European relevance of research
infrastructures”. Giorgio Rossi on behalf of the Expert Group on Indicators, October 1st, 2013,
http://ec.europa.eu/research/infrastructures/pdf/FI13_46_14_ESFRI per
cent20Indicators_report_4.pdf
■ Spanish Ministry of Economy and Competitiveness, 2014. ERAC peer review of Spanish research
and innovation system. Final report.
■ Tsipouri, L., Georghiou, L. and Lilischkis, S., 2013. Report on the 2013 ERAC Mutual Learning
Seminar on Research and Innovation Policies, http://ec.europa.eu/research/innovation-
union/pdf/erac/final_report_from_the_2013_erac_mutual_learning_seminar.pdf
■ Vertesy, D. and Tarantola, S., 2012. Composite Indicators of Research Excellence. JRC Scientific
and Policy reports,
https://ec.europa.eu/jrc/sites/default/files/reqno_jrc72592_deliverable3_res_exc.pdf per cent5B1
per cent5D.pdf


