Final Report Shoreline Movement along the Texas … MOVEMENT ALONG THE TEXAS GULF COAST, 1930’s to...
62
Shoreline Movement along the Texas Gulf Coast, 1930’s to 2012 Jeffrey G. Paine, Tiffany Caudle, and John Andrews GLO Contract Number 09-074-000 CEPRA Project No. 1563 Work Order No. 7776. Final Report Prepared for General Land Office under contract no. 09-074-000. Final Report Bureau of Economic Geology Scott W. Tinker, Director Jackson School of Geosciences The University of Texas at Austin Austin, Texas 78713-8924 August 2014 August 2014
Transcript of Final Report Shoreline Movement along the Texas … MOVEMENT ALONG THE TEXAS GULF COAST, 1930’s to...

Shoreline Movement along the Texas Gulf Coast, 1930’s to 2012
Jeffrey G. Paine, Tiffany Caudle, and John Andrews
GLO Contract Number 09-074-000CEPRA Project No. 1563Work Order No. 7776.
Final Report Prepared for General Land Office under contract no. 09-074-000.
F inal Repor t
Bureau of Economic Geology Scott W. Tinker, Director
Jackson School of Geosciences The University of Texas at Austin Austin, Texas 78713-8924
August 2014August 2014

Page intentionally blank

SHORELINE MOVEMENT ALONG THE TEXAS GULF COAST,
1930’s to 2012
by
Jeffrey G. Paine, Tiffany L. Caudle, and John R. Andrews
Bureau of Economic GeologyJohn A. and Katherine G. Jackson School of Geosciences
The University of Texas at AustinUniversity Station, Box X
Austin, Texas 78713
Corresponding [email protected]
(512) 471-1260TBPG License No. 3776
Final Report Prepared for the General Land Office under Contract No. 09-074-000, Work Order No. 7776.
August 2014

Page intentionally blank

iiiiii
CONTENTS
Abstract . . . . . . . . . . . . . . . . . . . . . . . . . . . . . . . . . . . . . . . . . . . . . . . . . . . . . . . . . . . . . . . . . . vii
Introduction . . . . . . . . . . . . . . . . . . . . . . . . . . . . . . . . . . . . . . . . . . . . . . . . . . . . . . . . . . . . . . . . .1
Relative Sea Level . . . . . . . . . . . . . . . . . . . . . . . . . . . . . . . . . . . . . . . . . . . . . . . . . . . . . . . . .4
Tropical Cyclones . . . . . . . . . . . . . . . . . . . . . . . . . . . . . . . . . . . . . . . . . . . . . . . . . . . . . . . . .7
Methods . . . . . . . . . . . . . . . . . . . . . . . . . . . . . . . . . . . . . . . . . . . . . . . . . . . . . . . . . . . . . . . . . . . .9
Sources of Shorelines. . . . . . . . . . . . . . . . . . . . . . . . . . . . . . . . . . . . . . . . . . . . . . . . . . . . . .13
Positional Verification . . . . . . . . . . . . . . . . . . . . . . . . . . . . . . . . . . . . . . . . . . . . . . . . . . . . .15
Texas Gulf Shoreline Change through 2012 . . . . . . . . . . . . . . . . . . . . . . . . . . . . . . . . . . . . . . .21
Recent Gulf Shoreline Movement, 1950’s to 2012 and 2000 to 2012. . . . . . . . . . . . . . . . .24
Upper Texas Coast (Sabine Pass to San Luis Pass) . . . . . . . . . . . . . . . . . . . . . . . . . . . . . . .30
Brazos and Colorado Headland (San Luis Pass to Pass Cavallo) . . . . . . . . . . . . . . . . . . . .32
Central Texas Coast (Pass Cavallo to Packery Channel) . . . . . . . . . . . . . . . . . . . . . . . . . . .35
Lower Coast (Padre Island and Brazos Island) . . . . . . . . . . . . . . . . . . . . . . . . . . . . . . . . . .38
Late Pleistocene to Holocene Context . . . . . . . . . . . . . . . . . . . . . . . . . . . . . . . . . . . . . . . . . . . .41
Using Postglacial Rates to Predict Shoreline Movement . . . . . . . . . . . . . . . . . . . . . . . . . . . . .44
Conclusions . . . . . . . . . . . . . . . . . . . . . . . . . . . . . . . . . . . . . . . . . . . . . . . . . . . . . . . . . . . . . . . .45
Acknowledgments . . . . . . . . . . . . . . . . . . . . . . . . . . . . . . . . . . . . . . . . . . . . . . . . . . . . . . . . . . .47
References . . . . . . . . . . . . . . . . . . . . . . . . . . . . . . . . . . . . . . . . . . . . . . . . . . . . . . . . . . . . . . . . .48
TABLES
1. Tropical cyclones affecting the Texas coast between 1990 and 2013 . . . . . . . . . . . . . . . . .8
2. Shoreline vintages and types used to calculate Gulf shoreline change rates. . . . . . . . . . .10
3. Net shoreline and land-area change between the 1930’s and 2012 for the Texas Gulf shoreline, major geomorphic areas, and coastal counties . . . . . . . . . . . . . . . . . . . . . . . . .23
4. Net shoreline and land-area change between the 1950’s and 2012 for the Texas Gulf shoreline, major geomorphic areas, and coastal counties . . . . . . . . . . . . . . . . . . . . . . . . .26
5. Net shoreline and land-area change between 2000 and 2012 for the Texas Gulf shoreline, major geomorphic areas, and coastal counties . . . . . . . . . . . . . . . . . . . . . . . . .28
6. Late Pleistocene and Holocene net shoreline retreat rates for the Texas coast . . . . . . . . .43

iviv
FIGURES
1. Map of the Texas coastal zone showing principal geomorphic features and coastal counties . . . . . . . . . . . . . . . . . . . . . . . . . . . . . . . . . . . . . . . . . . . . . . . . . . . . . . . . . . . . . . . .2
2. Sea-level trend at selected Texas tide gauges through 2014 and “global” rates . . . . . . . . .5
3. Sea-level trend at Galveston Pleasure Pier, 1908 to 2014 . . . . . . . . . . . . . . . . . . . . . . . . . .6
4. Positional comparison sites for the shoreline proxy extracted from the 2012 airborne lidar survey. . . . . . . . . . . . . . . . . . . . . . . . . . . . . . . . . . . . . . . . . . . . . . . . . . . . . . . . . . . . .12
5. Coverage map of the February 2012 airborne lidar survey . . . . . . . . . . . . . . . . . . . . . . .14
6. Shoreline position comparison at Galveston Island State Park site BEG02 . . . . . . . . . . .16
7. Shoreline position comparison at Matagorda Peninsula site MAT02 . . . . . . . . . . . . . . . .16
8. Shoreline position comparison at Mustang Island site MUI03 . . . . . . . . . . . . . . . . . . . . .18
9. Shoreline position comparison at northern Padre Island site NPI08 . . . . . . . . . . . . . . . . .18
10. Shoreline position comparison at southern Padre Island site SPI08 . . . . . . . . . . . . . . . . .19
11. Shoreline position comparison at Sea Rim State Park site SRSP . . . . . . . . . . . . . . . . . . .20
12. Shoreline position comparison on Bolivar Peninsula at Crystal Beach site BPCB. . . . . .20
13. Shoreline position comparison at Follets Island site BEG08. . . . . . . . . . . . . . . . . . . . . . .21
14. Net rates of long-term change for the Texas Gulf shoreline calculated from shoreline positions between the 1930’s and 2012 . . . . . . . . . . . . . . . . . . . . . . . . . . . . . . . . . . . . . . .22
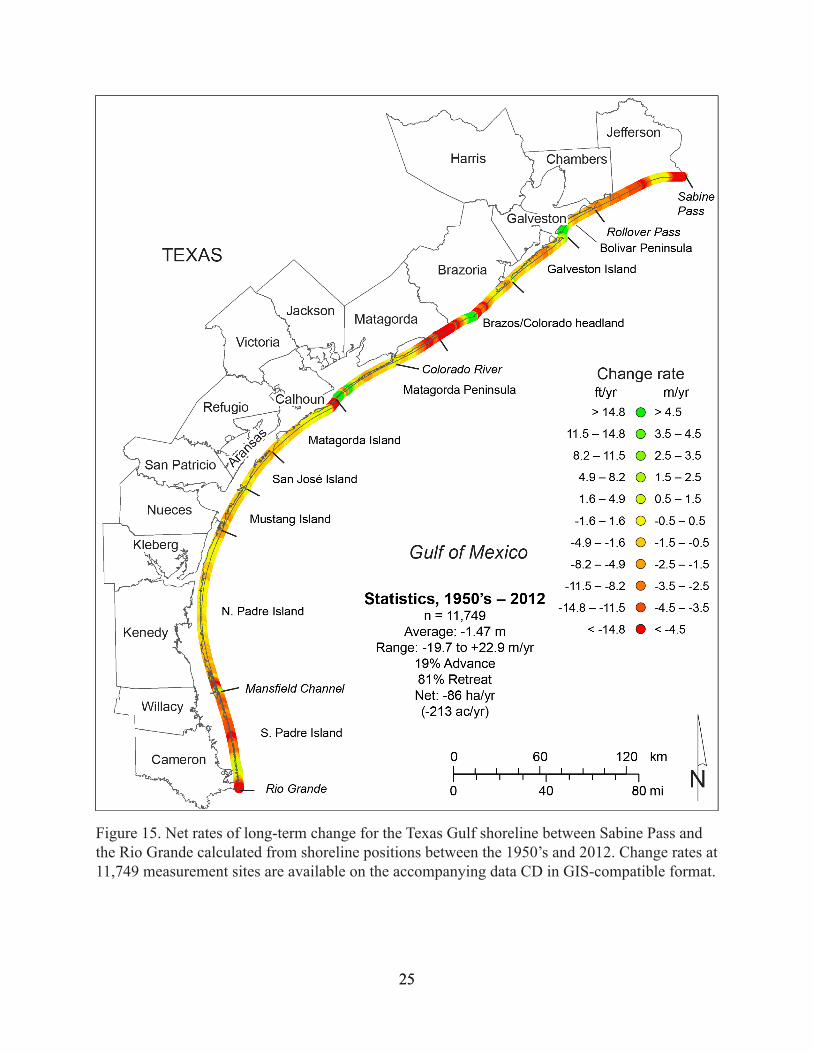
15. Net rates of long-term change for the Texas Gulf shoreline calculated from shoreline positions between the 1950’s and 2012 . . . . . . . . . . . . . . . . . . . . . . . . . . . . . . . . . . . . . . .25
16. Net rates of long-term change for the Texas Gulf shoreline calculated from shoreline positions between 2000 and 2012 . . . . . . . . . . . . . . . . . . . . . . . . . . . . . . . . . . . . . . . . . . .27
17. Comparison of net rates of shoreline movement for the Texas Gulf shoreline calculated between the 1930’s and 2012, the 1950’s and 2012, and 2000 and 2012. . . . . . . . . . . . . .29
18. Net rates of long-term change for the upper Texas Gulf shoreline between Sabine Pass and San Luis Passbetween the 1930’s and 2012 . . . . . . . . . . . . . . . . . . . . . . . . . . . . . . . .30
19. Net rates of long-term change for the Texas Gulf shoreline along the Brazos and Colo rado headland between the 1930’s and 2012. . . . . . . . . . . . . . . . . . . . . . . . . . . .33
20. Net rates of long-term change for the central Texas Gulf shoreline between Pass Cavallo and the Packery Channel area between the 1930’s and 2012. . . . . . . . . . . . . . . .36
21. Net rates of long-term change for the lower Texas Gulf shoreline along Padre Island between the 1930’s and 2012 . . . . . . . . . . . . . . . . . . . . . . . . . . . . . . . . . . . . . . . . . . . . . .39

vv
22. Postglacial Gulf of Mexico sea-level curves . . . . . . . . . . . . . . . . . . . . . . . . . . . . . . . . . . .41
23. Major bathymetric contours on the Texas continental shelf . . . . . . . . . . . . . . . . . . . . . . .42
24. Relationship between postglacial rates of relative sea-level rise and approximate shoreline retreat rates . . . . . . . . . . . . . . . . . . . . . . . . . . . . . . . . . . . . . . . . . . . . . . . . . . . . .46

vivi
Page intentionally blank

viivii
ABSTRACT
Long-term rates of Gulf shoreline movement along the Texas coast have been determined
through 2012 from a series of shoreline positions that includes those depicted on aerial pho-
tographs from the 1930’s to 2007, ground GPS surveys, and airborne lidar surveys in 2000
and 2012. Net rates of long-term shoreline movement measured at 11,749 sites spaced at 50 m
(164 ft) along the 590 km (367 mi) of Texas shoreline fronting the Gulf of Mexico average
1.26 m/yr (4.1 ft/yr) of retreat. Net shoreline retreat occurred along 80 percent of the Texas Gulf
shoreline, resulting in an estimated net land loss of 5,907 ha (14,597 ac) since 1930 at an aver-
age rate of 72 ha/yr (178 ac/yr). Average rates of change are more recessional on the upper Texas
coast (-1.7 m/yr [5.5 ft/yr] east of the Colorado River) than they are on the central and lower
coast (-1.0 m/yr [3.2 ft/yr] from the Colorado River to the Rio Grande).
Areas undergoing significant net retreat include: (1) the muddy marshes on the upper Texas coast
between High Island and Sabine Pass; (2) segments on the sandy barrier-island shoreline on
Galveston Island; (3) most of the combined fluvial and deltaic headland constructed by the Bra-
zos and Colorado rivers; (4) sandy, headland-flanking Matagorda Peninsula west of the Colorado
River; (5) San José Island, a sandy barrier island on the central Texas coast; and (6) the northern
end and much of the southern half of Padre Island, a sandy barrier island on the lower coast.
Significant net shoreline advance occurred (1) adjacent to the jetties that protect dredged chan-
nels at Sabine Pass, Bolivar Roads, and Aransas Pass; (2) near tidal inlets at the western ends of
Galveston Island and Matagorda Peninsula; (3) at the mouth of the Brazos River; (4) along most
of Matagorda Island; and (5) on central Padre Island.
Shoreline change rates were also determined for shorter periods (1950’s to 2012 and 2000 to
2012) to assess change in rates over time. Net shoreline movement rates measured from the
1950’s to 2012 average 1.47 m/yr (4.8 ft/yr) of retreat for the entire coast, slightly higher than the
1930’s to 2012 rates. Rates measured for the most recent period (2000 to 2012) are lower than
those calculated for longer periods, averaging 1.18 m/yr (3.9 ft/yr) of retreat. Long-term rates
estimated from historical shoreline positions are significantly lower than late Pleistocene to early
Holocene rates that range from 3 to 55 m/yr (8 to 181 ft/yr) estimated from bathymetric contour
shoreline proxies and past sea-level positions, but are similar to mid- to late Holocene retreat
rates of 0.1 to 1.7 m/yr (0.4 to 5.4 ft/yr). A statistical relationship between postglacial relative

viiiviii
sea-level rise rates and retreat rates calculated from the bathymetric shoreline proxy suggests that
each millimeter per year of sea-level rise translates to 0.8 to 1.8 m/yr (3 to 6 ft/yr) of shoreline
retreat. This relationship provides an empirical approach to estimating future shoreline retreat
rates under sea-level rise scenarios that may be similar to those observed during postglacial sea-
level rise.
Shoreline change rates were calculated using the latest coast-wide airborne lidar data acquired in
February 2012. Updated rates include the effects (erosion, deposition, and recovery) associated
with Hurricane Ike, which struck the upper Texas coast in September 2008 and significantly al-
tered beach and dune morphology and shoreline position. The next update of long-term shoreline
change rates will be based on shorelines position extracted from coast-wide airborne lidar data
scheduled to be acquired in 2015.

11
INTRODUCTION
The Texas coastal zone (fig. 1) occupies a dynamic geologic environment. Shoreline position is
a critical parameter that reflects the balance among several important processes, including sea-
level rise, land subsidence, sediment influx, littoral drift, and storm frequency, intensity, and
recovery. Because the Texas coast faces ongoing developmental pressures as the coastal popula-
tion swells, an accurate and frequent analysis of shoreline movement serves as a planning tool
to identify areas of habitat loss, better quantify threats to residential, industrial, and recreational
facilities and transportation infrastructure, and help understand the natural and anthropogenic
causes of shoreline change.
The latest trends in shoreline change rates are a critical component in understanding the potential
impact that sea level, subsidence, sediment supply, and coastal engineering projects might have
on the coastal population and sensitive coastal environments such as beaches, dunes, and wet-
lands. Rapidly eroding shorelines threaten habitat and recreational, residential, transportation,
and industrial infrastructure and can also significantly increase the vulnerability of communities
to tropical storms. Periodic analyses of shoreline position, rates of movement, and factors con-
tributing to shoreline change give citizens, organizations, planners, and regulators an indication
of expected future change and help determine whether those changes are accelerating, decelerat-
ing, or continuing at the same rate as past changes.
Historical change rates for the Texas Gulf shoreline were first determined by the Bureau of
Economic Geology (Bureau) in the 1970’s and presented in a series of publications separated at
natural boundaries along the 590 km (367 mi) of shoreline (Morton, 1974, 1975, 1977; Morton
and Pieper, 1975a, 1975b, 1976, 1977a, 1977b; Morton and others, 1976). This publication series
presented net long-term change rates determined from shoreline positions documented on 1850
to 1882 topographic charts published by the U.S. Coast and Geodetic Survey (Shalowitz, 1964)
and aerial photographs acquired between about 1930 and 1975. Rates of change for the entire
Gulf shoreline were updated through 1982 based on aerial photographs (Paine and Morton, 1989;

22
Figure 1. Map of the Texas coastal zone showing principal geomorphic features and coastal counties. Line segments extending seaward from the shoreline mark boundaries between major geomorphic features (barrier islands, peninsulas, deltaic headlands, and strandplains).

33
Morton and Paine, 1990). Updates for subsets of the Texas Gulf coast include the upper coast be-
tween Sabine Pass and the Brazos River through 1996 (Morton, 1997), the Brazos River to Pass
Cavallo (Gibeaut and others, 2000) and Mustang and northern Padre Island (Gibeaut and oth-
ers, 2001) through 2000. Shoreline positions in 2000–2001, established using an airborne lidar
topographic mapping system, were used in Bureau studies and as part of a Gulf-wide assessment
of shoreline change that included the Texas coast (Morton and others, 2004). Coast-wide rates
of historical shoreline change were last updated using 2007 aerial photographs, the most recent
coast-wide coverage predating Hurricane Ike in 2008 (Paine and others, 2011, 2012). Short-term
shoreline movement, and its relationship to long-term trends, was determined from annual shore-
line positions extracted from airborne lidar surveys conducted in 2010, 2011, and 2012 (Paine
and others, 2013).
This report describes the 2012 update to long-term shoreline movement rates that were pub-
lished in various formats and displayed online by the Bureau. Those rates were calculated from
selected shoreline vintages that began in most areas with the 1930’s aerial photographs and
included Gulf-shoreline-wide aerial photographs acquired through 2007, ground-based GPS
surveys conducted in select areas during the mid-1990s, and coast-wide airborne lidar surveys
acquired in 2000. For the lidar surveys, we use the 0.6-m (2.0 ft) msl elevation contour extracted
from digital elevation models (DEMs) as the shoreline proxy. This contour best matches the wet
beach/dry beach shoreline position interpreted from aerial photographs. We chose the February
2012 airborne lidar survey data because it allowed more than three years of recovery following
landfall of Hurricane Ike, a Category 2 hurricane that struck the upper Texas coast in September
2008 and had significant impact on beach morphology and shoreline position. We anticipate that
the next update of short- and long-term rates will follow a planned 2015 airborne lidar survey of
the Texas Gulf shoreline.

44
Relative Sea Level
Changes in sea level relative to the ground surface have long been recognized as a major con-
tributor to shoreline change (e.g. Bruun 1954, 1962, 1988; Cooper and Pilkey, 2004). Rising sea
level inundates low-relief coastal lands causing shoreline retreat by submergence, and elevates
dynamic coastal processes (currents and waves) that can accelerate shoreline retreat by physi-
cal erosion. Changes in relative sea level include both changes in the ocean-surface elevation
(eustatic sea level) and changes in the elevation of the ground caused by subsidence or uplift.
Eustatic sea-level change rates, established by monitoring average sea level at long-record tide
gauge stations around the world and more recently using satellite altimetry, vary over a range of
about 1 to 4 mm/yr. Gutenberg (1941) calculated a eustatic rate of 1.1 mm/yr from tide gauge
data. Estimates based on tide gauge data since then have ranged from 1.0 to 1.7 mm/yr (Gornitz
and others, 1982; Barnett, 1983; Gornitz and Lebedeff, 1987; Church and White, 2006), although
Emery (1980) supported a higher global average of 3.0 mm/yr that is comparable to more recent
globally averaged, satellite-based rates. Attempts to remove postglacial isostatic uplift or subsid-
ence and geographical bias from historical tide gauge records resulted in eustatic estimates as
high as 2.4 mm/yr (Peltier and Tushingham, 1989). Recent studies that include satellite altim-
etry data acquired since 1993 indicate that global rates of sea-level rise average 2.8 mm/yr, or
3.1 mm/yr with postglacial rebound removed (Cazenave and Nerem, 2004). Much of this recent
rise is interpreted to arise from thermal expansion of the oceans with a possible contribution
from melting of glaciers and polar ice (FitzGerald and others, 2008; Cazenave and Nerem, 2004;
Leuliette and Miller, 2009).
In major sedimentary basins such as the northwestern Gulf of Mexico, eustatic sea level rise is
exacerbated by subsidence. Published rates of relative sea-level rise measured at tide gauges
along the Texas coast are higher than eustatic sea-level rates (Swanson and Thurlow, 1973; Lyles
and others, 1988; Penland and Ramsey, 1990; Paine, 1991, 1993), ranging from 3.4 to 6.5 mm/yr
between 1948 and 1986 for the Galveston Pier 21, Rockport, and Port Isabel tide gauges. These
gauges represent single points along the coast and may not be representative of relative sea-level

55
rise along the entire coast. Geodetic releveling data obtained from the National Geodetic Survey
at benchmarks along the Texas coast from Galveston Bay to Harlingen show local variation in
subsidence rates that would produce average rates of relative sea-level rise ranging from about 2
to more than 20 mm/yr. Despite the wide range, most of the rates fall within the range observed
for the long-term Texas tide gauges, suggesting that the gauges are representative regional indi-
cators of relative sea-level rise (Paine, 1991, 1993).
The most recent relative sea-level rise rates from selected Texas tide gauges range from 2.07 to
6.29 mm/yr (fig. 2). These rates were calculated from data acquired by the National Oceanic and
Atmospheric Administration through May 2014 from periods of record that begin between 1908
(Galveston Pier 21) and 1963 (Port Mansfield). The highest rates (above 5 mm/yr) are calculated
Figure 2. Sea-level trend at selected Texas tide gauges through 2014 and “global” rates deter-mined from tide-gauge and satellite data. Texas tide-gauge data from National Oceanic and Atmospheric Administration.

66
for upper and central Texas coast tide gauges at Galveston (Pier 21), Sabine Pass, and Rockport.
The lowest rate (2.07 mm/yr) is calculated for Port Mansfield, which also has the shortest record.
The remaining gauges (Port Isabel, north Padre Island, and Freeport) have rates between 3.79
and 4.35 mm/yr.
Galveston Pier 21 has the longest period of record. Long-term rate of sea-level rise calculated
from monthly averages of sea level between April 1908 and May 2014 (fig. 3) is 6.29 mm/yr.
Sea-level rise at this gauge has not been constant; calculations of average rate of change over
a rolling 19-year window (chosen to match the duration of the 19-year National Tidal Datum
Epoch and centered on the mid-date) show multiyear oscillations in average rate that range from
1.0 to 13.3 mm/yr (fig. 3). The most recent rates (since about 1990) are 2.2 to 4.8 mm/yr, among
Figure 3. Sea-level trend at Galveston Pleasure Pier, 1908 to 2014. Black line is monthly aver-age sea level. Gray line is the average sea level measured over a 19-year period (the tidal datum epoch) and plotted at the center date of the period. Data from National Oceanic and Atmospheric Administration.

77
the lowest observed at the gauge, and are similar to satellite altimetry-based eustatic rates for the
same period.
Tropical Cyclones
There are numerous examples of the significant impact that tropical cyclones (tropical storms
and hurricanes) have on the Texas Gulf shoreline (e.g. Price, 1956; Hayes, 1967; Morton and
Paine, 1985). These include tropical storms (sustained winds between 62 and 118 km/hr, or 39
and 73 mi/hr) and hurricanes that are classified following the Saffir/Simpson system (Simpson
and Riehl, 1981). Category 1 hurricanes have sustained winds of 119 to 143 km/hr (74 to
95 mi/hr); Category 2: 154 to 177 km/hr (96 to 110 mi/hr); Category 3: 178 to 209 km/hr (111 to
130 mi/hr); Category 4: 210 to 249 km/hr (131 to 155 mi/hr); and Category 5: greater than
249 km/hr (155 mi/hr). In general, minimum central pressures decrease as the categories in-
crease, as does pressure- and wind-driven storm surge. Two critical parameters that influence the
erosion potential of a tropical cyclone are surge height and surge duration: generally, the longer
sea level is elevated above normal during storm passage, the greater the potential for redistribu-
tion of sediment eroded from the beach. Beach and dune recovery after storm passage is a pro-
cess that includes several distinct stages and can take years (Morton and Paine, 1985; Morton
and others, 1994). The ending date (2012) for this update of shoreline change rates was chosen to
allow more than three years for recovery from Hurricane Ike (2008), which was a large Category
2 storm that severely eroded upper Texas coast beaches and dunes
Historical lists (Roth, 2010) and records maintained by the National Oceanic and Atmospheric
Administration indicate that 64 hurricanes and 57 tropical storms have struck the Texas coast
from 1850 through 2013. On average, four hurricanes and four tropical storms make landfall
in Texas per decade. The longest hurricane-free period in Texas extended nearly 10 years from
October 1989 to August 1999 (Roth, 2010).

88
From 1993 through 2013, the period most applicable to this study, 18 tropical cyclones have
crossed the Texas coast (table 1). This includes 12 tropical storms and 6 hurricanes that ranged in
strength from Category 1 to Category 3 at landfall. Only 1 hurricane and 4 tropical storms affect-
ed Texas during the 1990’s. Since 2000, there have been to 5 hurricanes and 8 tropical storms, a
frequency that is close to the historical average. The most severe storms in the last two decades
were Hurricane Bret, a former Category 4 storm that weakened before landfall on Padre Island in
August 1999; Hurricane Rita, a Category 5 storm that weakened to Category 3 before landfall in
the Sabine Pass area in September 2005; and Hurricane Ike, once a Category 4 storm that heavily
impacted upper Texas coast beaches as a very large Category 2 storm associated with an unusu-
ally high and long-duration storm surge in September 2008. The most recent storms prior to the
Table 1. Tropical cyclones affecting the Texas coast between 1990 and 2013. TS = tropical storm; H = hurricane; number following H designates numeric strength according to the Saffir/Simpson scale (Simpson and Riehl, 1981). Data from the National Oceanic and Atmospheric Administra-tion and Roth (2010).
Year Category Name Begin date End date Landfall area1993 TS Arlene 6/18/1993 6/21/1993 North Padre Island1995 TS Dean 7/28/1995 8/2/1995 Freeport1998 TS Charley 8/21/1998 8/24/1998 Aransas Pass1998 TS Frances 9/8/1998 9/13/1998 Matagorda Island1999 H4 Bret 8/18/1999 8/25/1999 Padre Island (weakened)2001 TS Allison 6/5/2001 6/17/2001 Freeport2002 TS Bertha 8/4/2002 8/9/2002 North Padre Island2002 TS Fay 9/5/2002 9/8/2002 Matagorda Peninsula2003 H1 Claudette 7/8/2003 7/17/2003 Matagorda Peninsula2003 TS Grace 8/30/2003 9/2/2003 Galveston Island2005 H5 Rita 9/18/2005 9/26/2005 Sabine Pass (H3 at landfall)2007 TS Erin 8/15/2007 8/17/2007 San José Island2007 H1 Humberto 9/12/2007 9/14/2007 Upper Texas coast2008 H2 Dolly 7/20/2008 7/25/2008 South Padre Island2008 TS Edouard 8/3/2008 8/6/2008 Upper Texas coast2008 H4 Ike 9/1/2008 9/15/2008 Galveston (H2 at landfall)2010 TS Hermine 9/5/2010 9/9/2010 Rio Grande area2011 TS Don 7/27/2011 7/29/2011 Baffin Bay area (TD at landfall)

99
2012 shoreline position included in this update were Tropical Storm Hermine (September 2010)
and Tropical Storm Don (July 2011). Hermine made landfall on the northeastern coast of Mexico
near Matamoros on September 7, 2010, accompanied by winds of 110 km/hr (68 mi/hr) and
surge heights of 0.5 to 1.0 m (1.6 to 3.3 ft) along the south Texas coast near the landfall area
(Avila, 2010). Don weakened to a tropical depression as it made landfall along Padre Island
National Seashore just northeast of Baffin Bay on July 30, 2011 (Brennan, 2011). The maximum
recorded surge height was 0.6 m (2.0 ft) at Bob Hall Pier (Brennan, 2011).
METHODS
Long-term shoreline change rates were calculated by including the 2012 lidar-derived shoreline
(Paine and others, 2013) into the set of shoreline positions that has been used to determine long-
term Texas Gulf shoreline change rates presented in the Bureau’s shoreline change publication
series. Shoreline rates presented in the publications before 2000 were listed as net, or average,
rates of change between two end-point dates. More recently, rates have been calculated using
linear regression analysis of all included shoreline positions. In the 2012 update, we present both
rates in the data files, but generally discuss net values in this report because we include shorter
monitoring periods with fewer shoreline positions. In most cases, these rates are similar and
either rate could be used. At measurement sites where the coefficient of determination (goodness
of fit) for the calculated linear regression rate is low, net or average rates may be preferred.
Long-term shoreline change rates were calculated following several steps, including:
(1) importing the 2012 shoreline position (extracted as the 0.6 m [2.0 ft] msl contour from
a 1-m resolution digital elevation model) into a geographic information system data
base (ArcGIS, v. 10.0);
(2) checking the consistency of the 0.6 m (2.0 ft) msl contour (Gibeaut and others, 2000,
2001, 2002; Gibeaut and Caudle, 2009) with the position of the wet- and dry-beach

1010
boundary as depicted on 2012 National Agricultural Inventory Program (NAIP) georef-
erenced aerial photographs;
(3) selecting the shoreline vintages to use in the calculation of change rates (table 2),
which include the earliest photograph-derived shoreline from the 1930's Tobin aerial
photographs along with geographically extensive coastal photography from the 1950’s,
1960’s, 1974, 1990’s, and 2007; GPS-derived shoreline positions from 1996; and
shoreline positions from airborne lidar surveys conducted in 2000 and 2012;
Table 2. Shoreline vintages and types used to calculate Gulf shoreline change rates for each Texas county having shoreline on the open Gulf of Mexico. “A” denotes shorelines mapped as the wet beach/dry beach boundary on aerial photographs. “G” denotes shorelines mapped us-ing ground-based GPS instruments. “L” denotes shoreline position extracted from airborne lidar surveys. “p” denotes partial coverage. Counties shown on fig. 1.
County Shoreline Dates and TypesJefferson 1930 A 1955-
57 A1974 A 1982 A 1996 G 2000 L 2007 A 2012 L
Chambers 1930 A 1957 A 1974 A 1982 A 1996 G 2000 L 2007 A 2012 LGalveston 1930-
34 A1956-57 A
1964-65 A
1970 A,p
1996 G 2000 L 2007 A 2012 L
Brazoria 1930-34 A,p
1956 A 1965 A 1974 A 1995 A 2000 L 2007 A 2012 L
Matagorda 1930-37 A
1956 A 1965 A 1974 A 1991 A 2000 L 2007 A 2012 L
Calhoun 1937 A 1956-57 A
1965 A 1974 A 1995 A 2000 L 2007 A 2012 L
Aransas 1931-37 A
1958 A 1965 A 1974 A 1995 A 2000 L 2007 A 2012 L
Nueces 1937 A 1958-59 A
1965 A 1974 A 1990 A 1995 A 2000 L 2007 A 2012 L
Kleberg 1937-38
1956-59
1974 A,p
1995 A 2000 L 2007 A 2012 L
Kenedy 1937-38 A
1969 A 1974 A 1995 A 2000 L 2007 A 2012 L
Willacy 1937 A 1960 A 1975 A 1995 A 2000 L 2007 A 2012 LCameron 1934-
37 A1960 A 1969 A 1974 A 1991
A,p1995 A 2000 L 2007 A 2012 L

1111
(4) creating shore-parallel baselines from which shore-perpendicular transects were cast
at 50-m intervals along the shoreline using the GIS-based extension software Digital
Shoreline Analysis System (DSAS; Thieler and others, 2009);
(5) calculating rates of change and associated statistics for the 1930’s to 2012, the 1950’s
to 2012, and 2000 to 2012 periods using the transect locations and the selected shore-
lines within DSAS; and
(6) determining the intersection of the transect lines with the 2012 shoreline and creating
GIS shape files containing the rates, statistics, and period of shoreline change mea-
surements and the measurement transects bounded by the most landward and seaward
historical shoreline position for each measurement site.
Rates were calculated as linear regression rates and as net (average) rates. Where regression co-
efficients of determination are relatively high, rates calculated using the linear regression method
can be interpreted to reasonably express the movement of the shoreline. Where coefficients are
low and fitting errors are high, regression rates may not reasonably reflect the movement of the
shoreline. In these cases, net rates that represent the simple average rate of change, calculated by
dividing the movement distance divided by the elapsed time, are preferred.
Shoreline positions extracted from 2012 lidar data were verified by comparing the 0.6-m (2.0 ft)
msl shoreline proxy contour with the wet- and dry-beach boundary as shown on georeferenced
2012 NAIP aerial photographs. We also used beach profiles and GPS-mapped shorelines ac-
quired for the Bureau’s Texas High School Coastal Monitoring Program (THSCMP; Caudle and
Paine, 2012) near the dates of the lidar survey to compare the observed wet beach/dry beach
positions at long-term monitoring sites on Galveston Island, Follets Island, Matagorda Peninsula,
Mustang Island, and Padre Island (fig. 4).
Shorelines used to calculate updated long-term rates included dates chosen for earlier calcula-
tions. These may exclude older shorelines in some areas where major engineered structures have
impacted shoreline change.

1212
Figure 4. Positional comparison sites for the shoreline proxy extracted from the 2012 airborne lidar survey. Sites at Galveston Island, Matagorda Peninsula, Mustang Island, and northern and southern Padre Island include beach GPS surveys conducted by the Texas High School Coastal Monitoring Program (Caudle and Paine, 2012).

1313
Sources of Shorelines
As documented in previous Bureau publications, mapped shorelines from the 1800’s to 1990
were originally optically transferred to common paper 7.5-minute topographic base maps. The
1996 shoreline (upper coast only) was surveyed using differentially corrected GPS data acquired
from a GPS receiver mounted on a motorized vehicle (Morton and others, 1993; Morton, 1997).
The 2000 and 2012 shorelines were surveyed using an Optech ALTM 1225 airborne laser terrain
mapping instrument (lidar). Laser range data were combined with differentially corrected air-
craft position determined from GPS and an inertial measurement unit to determine land-surface
position and elevation. Shoreline position was extracted from the lidar-derived digital eleva-
tion model at a elevation of 0.6 m (2.0 ft) above mean sea level (msl). The 2007 shoreline was
mapped digitally within a GIS by digitizing the wet beach/dry beach boundary as depicted on
high-resolution, georeferenced aerial photographs taken in 2007 (Paine and others, 2011).
The 2012 lidar-derived shoreline was surveyed between February 14 and 26 (fig. 5). Four
passes of laser-range data were combined with aircraft position and orientation determined from
ground- and aircraft-based GPS and an inertial measurement unit to determine land-surface posi-
tion and height above the GRS80 ellipsoid. The Geiod99 model was applied to convert elevation
values from height above the ellipsoid to elevations with respect to the North American Vertical
Datum 88 (NAVD88). Shoreline position was extracted from the lidar-derived DEM at an eleva-
tion of 0.67 m (2.2 ft) NAVD88, which is equivalent to about 0.6 m (2.0 ft) msl (Gibeaut and
Caudle, 2009).
Shorelines were selected for change-rate analysis to conform with shorelines chosen for earlier
calculations of shoreline change rate, to generally exclude older shorelines in some areas where
major engineered structures have impacted shoreline change, and to give regular intervals be-
tween shorelines along a given transect. The software DSAS (Digital Shoreline Analysis System,
version 4.3, Thieler and others, 2009) was installed on ArcGIS 10.0 to facilitate calculation and
GIS-based analysis of shoreline change.

1414
Figure 5. Coverage map of the February 2012 airborne lidar survey showing flight dates (Paine and others, 2013).

1515
Positional Verification
The georeferencing of shoreline position is one of the principal sources of potential error in de-
termining long-term shoreline change rates (Anders and Byrnes, 1991; Crowell and others, 1991;
Moore, 2000). Georeferencing of the 2012 airborne lidar survey data was checked by (a) com-
paring ground GPS-derived and lidar-derived locations and elevations at calibration targets flown
during each flight and (b) comparing equivalent natural and constructed features common to
2012 airborne lidar survey data and georeferenced NAIP photographs taken in 2012.
A third positional check, which addressed the relative position of the shoreline proxy (0.6 m
[2.0 ft] msl elevation contour) and the wet-beach/dry-beach boundary, was accomplished by
superimposing the lidar-derived shoreline proxy and GPS-based, wet-beach/dry-beach boundary
data acquired in late 2011 and early 2012 by the THSCMP (where available) on georeferenced
2012 NAIP imagery. These comparisons, in some cases from imagery and ground-based GPS
data acquired within a few weeks of the lidar survey date, generally showed good agreement
(within a few meters) between boundaries interpreted from imagery and ground-based data and
those extracted from lidar data. Small discrepancies in the position of the lidar-derived shoreline
and the wet-beach/dry-beach boundary are likely to reflect real differences in beach morphology
between the dates of the lidar survey and those of the imagery and ground-based GPS surveys in
these dynamic environments.
Comparisons of lidar-extracted shoreline and wet-beach/dry-beach positions were conducted
for THSCMP beach profile sites at Galveston Island State Park, Matagorda Peninsula, Mustang
Island, and northern and southern Padre Island (fig. 4). At Galveston Island State Park (fig. 6),
the GPS-based wet-beach/dry-beach boundary mapped on December 11, 2011 at station BEG02
generally coincides with both the boundary between the wet and dry beach evident on the NAIP
imagery taken on June 1, 2012 and the lidar-derived shoreline proxy at 0.6 m (2.0 ft) msl.
On Matagorda Peninsula (site MAT02, figs. 4 and 7), there is good agreement between the lidar-
extracted shoreline from the February 2012 survey and the position of the wet-beach/dry-beach

1616
Figure 6. Shoreline position comparison at Galveston Island State Park site BEG02 (fig. 4). Shorelines include the wet-beach/dry-beach boundary mapped on December 11, 2011 by THSC-MP students and staff using ground GPS and the 0.6 m (2.0 ft) msl shoreline proxy extracted from airborne lidar data acquired in February 2012, superimposed on NAIP imagery acquired on June 1, 2012.
Figure 7. Shoreline position comparison at Matagorda Peninsula site MAT02 (fig. 4). Shorelines include the wet-beach/dry-beach boundary mapped on September 22, 2011 and September 21, 2012 by THSCMP students and staff using ground GPS and the 0.6 m (2.0 ft) msl shoreline proxy extracted from airborne lidar data acquired in February 2012, superimposed on NAIP imagery acquired on April 24, 2012.

1717
boundary as shown on aerial photographs acquired on April 24, 2012. A THSCMP GPS-based
survey of the wet-beach/dry-beach boundary acquired five months before the lidar survey agrees
well with the lidar-derived shoreline position, but similar data acquired about seven months after
the lidar survey show a position generally a few meters seaward of the lidar-derived shoreline.
This difference is likely a result of normal shoreline advance during summer.
Lidar, imagery, and GPS comparisons on Mustang Island (site MUI03, figs. 4 and 8) show good
agreement between the lidar-extracted shoreline from the February 2012 survey and the wet-
beach/dry-beach boundary evident on NAIP imagery acquired on April 23, 2012. GPS surveys of
the shoreline acquired by the THSCMP students in January and May 2012 both indicate a shore-
line position seaward of the lidar-extracted shoreline, suggesting that the students mapped the
wet-beach/dry-beach boundary in May (reasonably close to the lidar-based shoreline) and possi-
bly mapped the water’s edge in January.
On northern Padre Island (site NPI08, figs. 4 and 9), a GPS survey of the wet-beach/dry-beach
boundary acquired by THSCMP students on January 27, 2012 coincides with the 0.6-m (2.0-ft)
msl shoreline extracted from lidar data acquired in February 2012. A more seaward position of
the wet-beach/dry-beach boundary might have been interpreted from the NAIP imagery acquired
on April 23, 2012 in the southern part of the image (fig. 9), whereas a more landward position of
the wet-beach/dry-beach boundary might have been interpreted from the imagery in front of the
structure shown on the northern part of the image. This is an example of an area where it is evi-
dent that the lidar-extracted contour is a more consistent boundary than the wet-beach/dry-beach
boundary depicted on aerial photographs.
On southern Padre Island (site SPI08, figs. 4 and 10), there is excellent positional agreement
among the 2012 lidar-extracted shoreline, the wet-beach/dry-beach boundary as depicted on
NAIP aerial imagery acquired on April 23, 2012, and the wet-beach/dry-beach line surveyed by
THSCMP students using GPS in September 2012. The wet-beach/dry-beach boundary surveyed
using GPS in September 2011 coincides with the shoreline position indicated by other methods

1818
Figure 8. Shoreline position comparison at Mustang Island site MUI03 (fig. 4). Shorelines in-clude the water’s edge (January 25, 2012) and the wet-beach/dry-beach boundary (May 8, 2012) mapped by THSCMP students and staff using ground GPS and the 0.6 m (2.0 ft) msl shoreline proxy extracted from airborne lidar data acquired in February 2012. Shorelines are superimposed on NAIP imagery acquired on April 23, 2012.
Figure 9. Shoreline position comparison at northern Padre Island site NPI08 (fig. 4). Shorelines include the wet-beach/dry-beach boundary (January 27, 2012) mapped by THSCMP students and staff using ground GPS and the 0.6 m (2.0 ft) msl shoreline proxy extracted from airborne lidar data acquired in February 2012. Shorelines are superimposed on NAIP imagery acquired on April 23, 2012.

1919
on the northern part of the image, but significantly diverges from them on the southern part of
the image (fig. 10). This is most likely a real difference in beach morphology, possibly related to
nearshore bar migration and beach-accretion processes.
We compared lidar-extracted shoreline positions to imagery at three other upper coast sites where
beach surveys were not available. These comparisons were conducted at Sea Rim State Park (site
SRSP, fig. 4), Crystal Beach on Bolivar Peninsula (site BPCB), and Follets Island (site BEG08).
At Sea Rim State Park, the extracted 0.6-m (2.0-ft) shoreline determined from airborne lidar
data acquired in February 2012 coincides well with the wet-beach/dry-beach boundary depicted
on NAIP aerial imagery acquired on May 22, 2012 (fig. 11). At Crystal Beach, the shoreline at
0.6-m (2.0-ft) elevation extracted from airborne lidar survey data acquired in February 2012
also closely coincides with the wet-beach/dry-beach boundary depicted on NAIP aerial imagery
acquired on May 22, 2012 (fig. 12). On Follets Island, agreement remains good between lidar-
Figure 10. Shoreline position comparison at southern Padre Island site SPI08 (fig. 4). Shore-lines include the wet-beach/dry-beach boundary mapped on September 27, 2011 and September 26, 2012 by THSCMP students and staff using ground GPS and the 0.6 m (2.0 ft) msl shoreline proxy extracted from airborne lidar data acquired in February 2012. Shorelines are superimposed on NAIP imagery acquired on April 23, 2012.

2020
Figure 12. Shoreline position comparison on Bolivar Peninsula at Crystal Beach site BPCB (fig. 4). The 0.6 m (2.0 ft) msl shoreline proxy extracted from February 2012 lidar data is super-imposed on NAIP imagery acquired on May 22, 2012.
Figure 11. Shoreline position comparison at Sea Rim State Park site SRSP (fig. 4). The 0.6 m (2.0 ft) msl shoreline proxy extracted from February 2012 lidar data is superimposed on NAIP imagery acquired on May 22, 2012.

2121
derived shoreline position and the wet-beach/dry-beach boundary on imagery acquired on June
1, 2012 (fig. 13). Similar reasonable agreement between lidar-extracted shoreline position and
shoreline features depicted on aerial imagery acquired near the dates of the 2012 lidar survey was
observed along all segments of the Texas coast.
TEXAS GULF SHORELINE CHANGE THROUGH 2012
Rates of long-term Gulf shoreline change, calculated from multiple shoreline positions between
the 1930’s and 2012 (fig. 14), averaged 1.26 m/yr (4.1 ft/yr) of retreat (table 3) for net-rate and
1.29 m/yr (4.2 ft/yr) for linear regression-rate calculations. Updated rates were calculated at
11,749 sites along the entire Texas coast spaced at 50 m (164 ft). Net retreat occurred at 9,410
sites (80 percent) and advance occurred at 2,338 sites (20 percent). The average change rate
is nearly identical to the average change rate determined for the most recent previous update
(retreat at 1.24 m/yr (4.1 ft/yr) through 2007; Paine and others, 2011, 2012). Shorelines along
the upper Texas coast (from the mouth of the Colorado River to Sabine Pass) generally retreated
Figure 13. Shoreline position comparison at Follets Island site BEG08 (fig. 4). The 0.6 m (2.0 ft) msl shoreline proxy extracted from February 2012 lidar data is superimposed on NAIP imagery acquired on June 1, 2012.

2222
Figure 14. Net rates of long-term change for the Texas Gulf shoreline between Sabine Pass and the Rio Grande calculated from shoreline positions between the 1930’s and 2012. Change rates at 11,749 measurement sites are available on the accompanying data CD in GIS-compatible format.

2323
Table 3. Net shoreline and land-area change between the 1930’s and 2012 for the Texas Gulf shoreline, major geomorphic areas, and counties with shoreline on the Gulf of Mexico. Counties are listed from upper to lower coast (fig. 14).
Area No.Net rate (m/yr)
Std. dev. (m/yr)
Range (m/yr)
Area change
rate (ha/yr)
Area change
(ha)All Texas sites 11,749 -1.26 2.93 -16.8 to 20.5 -72.0 -5,907
Geomorphic AreasSabine Pass to Rollover Pass
1345 -2.94 2.66 -11.7 to 9.3 -19.8 -1,623
Bolivar Peninsula 543 0.41 2.72 -1.8 to 14.6 +1.1 +92Galveston Island 930 -0.27 1.85 -2.7 to 6.5 -1.3 -104Brazos/Colorado headland 1258 -2.08 5.48 -13 to 20.5 -13.1 -1,072Matagorda Peninsula 1591 -1.00 2.83 -10.3 to 20.1 -7.9 -652Matagorda Island 1120 -0.74 3.80 -16.8 to 16.1 -4.1 -340San José Island 620 -0.74 0.47 -1.6 to 0.4 -2.3 -189Mustang Island 575 -0.34 0.61 -1.9 to 3.2 -1.0 -81N. Padre Island 2404 -0.82 0.98 -4.5 to 1.1 -9.9 -808S. Padre Island 1359 -2.27 1.91 -7.5 to 3.4 -15.4 -1,263
CountiesJefferson Co. 1,042 -3.34 2.90 -11.7 to 9.3 -17.4 -1,426Chambers Co. 36 -2.25 0.17 -2.5 to -1.9 -0.4 -33Galveston Co. 1,740 -0.25 2.13 -2.7 to 14.6 -2.1 -176Brazoria Co. 924 -0.43 5.49 -7.1 to 20.5 -2.0 -164Matagorda Co. 1,926 -1.98 3.38 -13 to 20.1 -19.1 -1,565Calhoun Co. 1,134 -0.73 3.77 -16.8 to 16.1 -4.1 -340Aransas Co. 609 -0.76 0.46 -1.6 to 0.4 -2.3 -189Nueces Co. 667 -0.37 0.61 -1.9 to 3.2 -1.2 -102Kleberg Co. 707 -0.52 0.47 -1.7 to 0.3 -1.8 -151Kenedy Co. 1,522 -0.80 0.88 -4.5 to 0.9 -6.1 -500Willacy Co. 428 -2.62 1.28 -4.5 to 3.4 -5.6 -460Cameron Co. 1,014 -2.26 2.11 -7.5 to 3.2 -11.5 -940

2424
at greater rates than those on the central and lower coast. Average change rates were retreat at
1.7 m/yr (5.5 ft/yr) for the upper coast and retreat at 1.0 m/yr (3.2 ft/yr) for the central and lower
coast.
Notable extensive areas of relatively high long-term retreat rates include the Sabine Pass to
Rollover Pass area, an area on Galveston Island west of the seawall, the fluvial and deltaic
headland of the Brazos and Colorado rivers, Matagorda Peninsula west of the Colorado River,
San José Island, northern Padre Island, and most of the southern half of Padre Island (fig. 14).
Areas of general net shoreline advance are found on the upper coast near the Sabine Pass and
Bolivar Roads jetties, at the western tip of Galveston Island, adjacent to the mouth of the Brazos
River, toward the western end of Matagorda Peninsula, on the central Texas coast along much of
Matagorda Island and near Aransas Pass, and on Padre Island near Baffin Bay and the southern
end of the island (fig. 14).
Closely spaced measurement sites allow estimates of land loss to be made (fig. 14 and table 3).
The annual rate of land loss along the Texas Gulf shoreline, updated from the 1930’s through
2012, is 72 ha/yr (178 ac/yr). Total Texas Gulf shoreline land loss from 1930 through 2012 is
estimated to be 5,907 ha (14,597 ac).
Recent Gulf Shoreline Movement, 1950’s to 2012 and 2000 to 2012
One approach to assess whether shoreline movement rates are increasing, decreasing, or remain-
ing constant over time is to compare long-term rates with rates measured over progressively
shorter and more recent periods. Coast-wide data on shoreline position are available from aerial
imagery acquired in the 1930’s and 1950’s and from airborne lidar surveys conducted in 2000
and 2012. Following this approach, we have augmented the long-term rates (1930’s to 2012,
fig. 14 and table 3) with additional analyses for two more-recent periods: the 1950’s to 2012
(fig. 15 and table 4) and 2000 to 2012 (fig. 16 and table 5).
2525
Figure 15. Net rates of long-term change for the Texas Gulf shoreline between Sabine Pass and the Rio Grande calculated from shoreline positions between the 1950’s and 2012. Change rates at 11,749 measurement sites are available on the accompanying data CD in GIS-compatible format.

2626
Table 4. Net shoreline and land-area change between the 1950’s and 2012 for the Texas Gulf shoreline, major geomorphic areas, and counties with shoreline on the Gulf of Mexico. Counties are listed from upper to lower coast (fig. 15).
Area No.Net rate (m/yr)
Std. dev. (m/yr)
Range (m/yr)
Area change
rate (ha/yr)
Area change
(ha)All Texas sites 11,749 -1.47 3.17 -19.7 to 22.9 -86.3 -4,918
Geomorphic AreasSabine Pass to Rollover Pass
1,345 -3.68 3.27 -15.2 to 9.3 -24.7 -1,409
Bolivar Peninsula 543 -0.68 1.98 -2.7 to 6.3 -1.8 -105Galveston Island 930 -0.96 1.25 -3.6 to 5.6 -4.5 -255Brazos/Colorado headland 1,258 -1.50 5.75 -16.9 to 22.9 -9.5 -539Matagorda Peninsula 1,591 -0.87 3.17 -13 to 20.1 -6.9 -395Matagorda Island 1,120 -1.14 4.55 -19.7 to 21.2 -6.4 -364San José Island 620 -1.00 0.48 -1.8 to 0.3 -3.1 -176Mustang Island 575 -0.86 0.86 -2.8 to 3.7 -2.5 -141N. Padre Island 2,404 -0.88 1.06 -5 to 1.4 -10.6 -602S. Padre Island 1,359 -2.39 2.05 -7.4 to 5.7 -16.3 -927
CountiesJefferson Co. 1,042 -3.98 3.65 -15.2 to 9.3 -20.7 -1,181Chambers Co. 36 -3.36 0.11 -3.6 to -3.2 -0.6 -34Galveston Co. 1,740 -1.12 1.57 -3.6 to 6.3 -9.7 -555Brazoria Co. 924 0.29 5.59 -7.1 to 22.9 1.3 76Matagorda Co. 1,926 -1.85 3.69 -16.9 to 20.1 -17.8 -1,014Calhoun Co. 1,134 -1.14 4.52 -19.7 to 21.2 -6.5 -369Aransas Co. 609 -0.99 0.48 -1.8 to 0.3 -3.0 -172Nueces Co. 667 -0.87 0.87 -2.8 to 3.7 -2.9 -165Kleberg Co. 707 -0.42 0.72 -2.1 to 0.6 -1.5 -85Kenedy Co. 1,522 -0.92 0.89 -4.9 to 0.5 -7.0 -399Willacy Co. 428 -2.63 1.94 -5 to 5.7 -5.6 -321Cameron Co. 1,014 -2.42 2.08 -7.4 to 1.5 -12.3 -700

2727
Figure 16. Net rates of long-term change for the Texas Gulf shoreline between Sabine Pass and the Rio Grande calculated from shoreline positions between 2000 and 2012. Change rates at 11,749 measurement sites are available on the accompanying data CD in GIS-compatible format.

2828
Table 5. Net shoreline and land-area change between 2000 and 2012 for the Texas Gulf shoreline, major geomorphic areas, and counties with shoreline on the Gulf of Mexico. Counties are listed from upper to lower coast (fig. 16).
Area No.Net rate (m/yr)
Std. dev. (m/yr)
Range (m/yr)
Area change
rate (ha/yr)
Area change
(ha)All Texas sites 11,749 -1.18 3.51 -38.9 to 30.4 -69.3 -831
Geomorphic AreasSabine Pass to Rollover Pass
1,345 -4.66 3.52 -15.9 to 2.8 -31.4 -376
Bolivar Peninsula 543 -0.66 1.57 -10.5 to 4.5 -1.8 -22Galveston Island 930 0.98 2.80 -5.1 to 24.9 4.6 55Brazos/Colorado headland 1,258 -1.34 5.12 -38.9 to 16.5 -8.5 -101Matagorda Peninsula 1,591 -0.57 3.85 -11.7 to 19.4 -4.5 -54Matagorda Island 1,120 -1.24 4.91 -15.9 to 4.8 -6.9 -83San José Island 620 1.08 1.48 -4 to 12.7 3.3 40Mustang Island 575 0.08 1.87 -4 to 30.4 0.2 3N. Padre Island 2,404 -1.14 1.19 -5 to 11 -13.7 -165S. Padre Island 1,359 -1.57 1.61 -6.6 to 2.9 -10.7 -128
CountiesJefferson Co. 1,042 -5.18 3.80 -15.9 to 2.8 -27.0 -324Chambers Co. 36 -3.96 0.72 -5.6 to -2.9 -0.7 -9Galveston Co. 1,740 -0.10 2.63 -10.5 to 24.9 -0.9 -11Brazoria Co. 924 -0.18 5.07 -36.2 to 16.5 -0.8 -10Matagorda Co. 1,926 -1.26 4.11 -38.9 to 19.4 -12.1 -146Calhoun Co. 1,134 -1.18 4.92 -15.9 to 12.7 -6.7 -80Aransas Co. 609 1.03 1.34 -4 to 3.4 3.1 38Nueces Co. 667 0.36 2.31 -4 to 30.4 1.2 14Kleberg Co. 707 -0.93 0.35 -2 to 0.7 -3.3 -39Kenedy Co. 1,522 -1.36 0.62 -4.9 to 0.7 -10.4 -124Willacy Co. 428 -1.87 1.37 -5.5 to 2.4 -4.0 -48Cameron Co. 1,014 -1.52 1.74 -6.6 to 2.9 -7.7 -92

2929
Overall, change trends are similar for the progressively shorter monitoring periods (figs. 14, 15,
and 16). Major areas of shoreline retreat and advance are nearly the same, although average rates
of change differ among the periods for the entire coast as well as for major geomorphic features
(fig. 17). Average retreat rate for the entire coast is higher for the 1950’s to 2012 period (retreat at
1.47 m/yr [4.8 ft/yr]) than it is for the 1930’s to 2012 period (retreat at 1.26 m/yr [4.1 ft/yr]), but
the average rate for 2000 to 2012 (retreat at 1.18 m/yr [3.9 ft/yr]), the most recent period moni-
tored, is lower than longer-term rates. Percentages of sites advancing or retreating show a similar
pattern: the shoreline retreated at slightly more sites between the 1950’s and 2012 (81 percent)
than it did from the 1930’s to 2012 (80 percent), but the shoreline retreated at fewer sites during
the most recent monitoring period between 2000 and 2012 (67 percent). Estimated land-loss rates
Figure 17. Comparison of net rates of shoreline movement for the Texas Gulf shoreline between Sabine Pass and the Rio Grande calculated from shoreline positions between the 1930’s and 2012, the 1950’s and 2012, and 2000 and 2012. Also shown are net rates for major geomorphic units along the coast.

3030
are 86 ha/yr (213 ac/yr) between the 1950’s and 2012, but fall to 69 ha/yr (171 ac/yr) (slightly
below the longest-term rate of 72 ha/yr [178 ac/yr]) for the 2000 to 2012 monitoring period.
Upper Texas Coast (Sabine Pass to San Luis Pass)
The upper Texas coast extends from Sabine Pass at the Texas–Louisiana border to San Luis
Pass at the southwestern end of Galveston Island (figs. 14 and 18), a distance of about 141 km
(88 mi). Major natural geomorphic features and shoreline types are (1) the generally shore-par-
Figure 18. Net rates of long-term change for the upper Texas Gulf shoreline between Sabine Pass and San Luis Pass (Jefferson, Chambers, and Galveston counties) calculated from shoreline posi-tions between the 1930’s and 2012 (table 2).

3131
allel beach ridges and intervening swales in the Sabine Pass area, (2) thin, discontinuous sandy
beaches that veneer the retreating low, muddy marsh deposits between High Island and Sea Rim
State Park, (3) the broad, sandy beach and dune system on Bolivar Peninsula, and (4) the sandy
barrier-island system at Galveston Island. Major engineered structures that have affected the
sediment budget and shoreline change rates include major jetty and dredged channel systems at
Sabine Pass and Bolivar Roads, a shallow (1.5 m [5 ft]) dredged channel across Bolivar Penin-
sula at Rollover Pass, and the seawall and groin system on the eastern part of Galveston Island.
At Sabine Pass, the south jetty extends about 4 km (2.5 mi) from the shoreline and protects a
channel maintained at a depth of 12 m (40 ft). The Sabine Pass jetties and channel isolate the
upper Texas coast from potential easterly sources of longshore sediment. The Bolivar Roads
channel, maintained at a depth of 14 m (45 ft), is protected by jetties that extend 7.6 km (4.7 mi)
(north jetty) and 3.9 km (2.4 mi) (south jetty) from the shoreline. The jetties and channel serve to
compartmentalize the upper Texas coast by blocking longshore transport of sand between Bolivar
Peninsula and Galveston Island.
Nearly 84 percent of the measurement sites on the upper Texas coast (2,355 of 2,818) showed net
shoreline retreat from the 1930’s through 2012. Net rates at individual measuring points on the
upper Texas coast range from retreat at 11.7 m/yr (38.5 ft/yr) to advance at 14.6 m/yr (47.8 ft/yr).
Net land loss since 1930 is estimated to be 1,623 ha (4,010 ac) between Sabine Pass and Roll-
over Pass and 104 ha (258 ac) on Galveston Island (table 3). There was a net land gain of 92 ha
(226 ac) on Bolivar Peninsula west of Rollover Pass. Long segments of retreating shorelines
extend from near Sabine Pass to High Island, between High Island and Gilchrist, along Bolivar
Peninsula southwest of Crystal Beach, and on Galveston Island from the west end of the seawall
to near San Luis Pass (fig. 18). Areas of net advance are limited, but include a short shoreline
segment adjacent to the south jetty at Sabine Pass, a 3-km (2-mi)-long segment at McFaddin
National Wildlife Refuge, shoreline segments adjacent to the north and south jetties at Bolivar

3232
Roads, and the southwestern end of Galveston Island extending 1 to 2 km (0.6 to 1.2 mi) from
San Luis Pass.
The shoreline between Sabine Pass and Rollover Pass has the highest rate of net shoreline retreat
(2.9 m/yr [9.7 ft/yr]) observed on the Texas coast between the 1930’s and 2012 (table 3). Con-
versely, Bolivar Peninsula and Galveston Island have among the lowest net rates of shoreline
movement since the 1930’s: there is net shoreline advance at 0.4 m/yr (1.4 ft/yr) on Bolivar Pen-
insula, whereas Galveston Island shorelines retreated at a low net rate of 0.3 m/yr (0.9 ft/yr). In
these areas, shoreline advance adjacent to the Bolivar Roads jetties offsets shoreline retreat far-
ther from the jetties. On Galveston Island, for example, the east beach area adjacent to the jetty
advanced at a net rate of 3.8 m/yr (12.5 ft/yr) between the 1930’s and 2012, whereas Galveston
Island shorelines west of the seawall retreated at average net rates of 1 m/yr (3.2 ft/yr) during the
same period.
Comparisons of long-term (1930’s to 2012) rates with those from shorter and more recent pe-
riods indicate relatively high and accelerating rates of retreat on the upper coast between Sa-
bine Pass and Rollover Pass (average rates of retreat at 4.7 m/yr [15.3 ft/yr] along this segment
between 2000 and 2012 are the highest for the period on the entire coast; fig. 17) and slowly
retreating shorelines on Bolivar Peninsula that show little change between values calculated for
the 1950’s to 2012 and 2000 to 2012. As a whole, average retreat rates on Galveston Island have
been higher since the 1950’s than they were since the 1930’s, but the shoreline underwent net
advance from 2000 to 2012.
Brazos and Colorado Headland (San Luis Pass to Pass Cavallo)
Between San Luis Pass and Pass Cavallo lies the headland of the Brazos and Colorado river
deltas and flanking barrier peninsulas: Follets Island and Matagorda Peninsula (figs. 14 and 19).
This segment includes about 143 km (89 mi) of Gulf of Mexico shoreline. Major geologic fea-
tures are (1) the Brazos and Colorado deltaic headland, consisting of semiconsolidated, muddy

3333
and sandy sediments deposited by the Brazos and Colorado rivers and overlain by a discontinu-
ous, thin veneer of sandy beach deposits; (2) Follets Island, a narrow, sandy barrier peninsula
extending northeastward from the Brazos headland toward San Luis Pass; and (3) Matagorda
Peninsula, a narrow, sandy barrier peninsula extending southwestward from the Colorado head-
land toward Pass Cavallo. Sediments eroded by waves at the headland contribute sand to the
flanking barrier peninsulas. In addition, the Brazos and Colorado rivers historically brought sedi-
Figure 19. Net rates of long-term change for the Texas Gulf shoreline along the Brazos and Colorado headland between San Luis Pass and Pass Cavallo (Brazoria and Matagorda counties) calculated from shoreline positions between the 1930’s and 2012 (table 2).

3434
ment to the coast from their large drainage basins. The drainage basin of the Brazos River covers
more than 116,000 km2 (45,300 mi2) in Texas and eastern New Mexico, but its capacity for car-
rying sediment to the coast during major floods has been reduced by completion of several dams
and reservoirs between 1941 and 1969 (Possum Kingdom, Whitney, Granbury, and DeCordova
Bend). The drainage basin of the Colorado is nearly as large (103,000 km2) [41,600 mi2], but its
sediment load has also been reduced by nine dams completed in the upper and central basins be-
tween 1937 and 1990 (Buchanan, Inks, Tom Miller, Mansfield, Wirtz, Starcke, Thomas, Lee, and
Ivie) and diversion into Matagorda Bay. This segment of Gulf shoreline has been compartmental-
ized by jetties and dredged channels. Between Quintana and Surfside Beach, the Freeport jetties
extend about 1000 m (3,300 ft) from the shoreline to reduce dredging needs of the Freeport Ship
Channel, which has been dredged to a depth of 14 m (45 ft). On Matagorda Peninsula, shorter
jetties extend 140 to 240 m (460 to 790 ft) seaward from the mouth of the Colorado River. The
Matagorda Ship Channel, maintained at a depth of 11 m (36 ft) near the southwestern end of
Matagorda Peninsula, is flanked by jetties that extend 880 m (2,900 ft) (north jetty) and 1,600 m
(5,250 ft) (south jetty) into the Gulf.
There was net shoreline retreat at 2,370 of 2,850 measurement sites (83 percent) between San
Luis Pass and Pass Cavallo between the 1930’s and 2012. Net rates of change through 2012
ranged from retreat at 13.0 m/yr (42.5 ft/yr) to advance at 20.5 m/yr (67.4 ft/yr). Notable areas of
long-term shoreline retreat include Follets Island, the Brazos headland between Surfside Beach
and the mouth of the Brazos River and from Matagorda Peninsula southwest of Sargent Beach
to the San Bernard National Wildlife Refuge, and a segment of Matagorda Peninsula south-
west of the Matagorda Ship Channel (fig. 19). Shorelines having net advance are limited to a
6-km (3.7-mi)-long segment southwest of the mouth of the Brazos River and short segments on
Matagorda Peninsula, including a 5.5-km (3.4-mi)-long segment adjacent to the north jetty at the
Matagorda Ship Channel and a 2-km (1.2-mi)-long segment at the southwestern tip of Matagorda
Peninsula.

3535
Average net movement on the Brazos/Colorado headland (including Follets Island) between the
1930’s and 2012 was 2.1 m/yr (6.8 ft/yr) (table 3), translating to a net land-loss rate of 13.1 ha/yr
(32.3 ac/yr). Total land loss on the headland since 1930 is estimated to be 1,072 ha (2,650 ac)
(table 3). Decelerating rates of movement were measured along the headland between the 1950’s
and 2012 (1.5 m/yr [4.9 ft/yr]), with the trend continuing between 2000 and 2012 (1.3 m/yr
[4.4 ft/yr]) (fig. 17). Average long-term retreat rates are lower on Matagorda Peninsula and are
decelerating over time; net retreat rates of 1.0 m/yr (3.3 ft/yr) between the 1930’s and 2012 de-
clined to 0.9 m/yr (2.9 ft/yr) between the 1950’s and 2012 and 0.6 m/yr (1.9 ft/yr) between 2000
and 2012 (fig. 17). Land-loss rates on Matagorda Peninsula are estimated at 7.9 ha/yr (19.6 ac/yr)
between the 1930’s and 2012. Total Matagorda Peninsula land loss between 1930 and 2012 is
estimated to be 652 ha (1,610 ac).
Central Texas Coast (Pass Cavallo to Packery Channel)
Gulf shorelines along the central Texas coast between Pass Cavallo and Packery Channel include
those on three sandy barrier islands: Matagorda Island, San José Island, and Mustang Island
(figs. 14 and 20). These generally sand-rich islands are characterized by broad, sandy beaches
and dune systems that reflect the position of the islands within a longshore current convergence
zone between the Brazos/Colorado and Rio Grande fluvial and deltaic headlands. The natural
boundaries between these three islands are Cedar Bayou, a tidal inlet between Matagorda and
San José islands, and Aransas Pass, a tidal inlet between San José and Mustang Islands. No rivers
reach the Gulf within this segment.
Engineered structures that have compartmentalized the nearshore system are (1) the Matagorda
Ship Channel and jetties that restrict sediment transport to Matagorda Island from the northeast,
and (2) the jetties at Aransas Pass, which protect the dredged, 14-m (47-ft) deep Corpus Christi
Ship Channel. These jetties extend 1100 to 1200 m (3600 to 3950 ft) gulfward from the shore-
line, interrupting longshore sand exchange between Mustang Island and San José Island. Smaller
structures with possible local effects include the closed Fish Pass on Mustang Island, where

3636
the former dredged channel is filled but short jetties that extend about 150 m (500 ft) from the
shoreline remain; and Packery Channel, a newly constructed shallow channel between Mustang
Island and Padre Island that has been dredged to a nominal depth of 3 m (10 ft) and is protected
by jetties that reach 300 m (1,000 ft) (north jetty) and 365 m (1,200 ft) (south jetty) seaward of
the Gulf shoreline.
Figure 20. Net rates of long-term change for the central Texas Gulf shoreline between Pass Cavallo and the Packery Channel area (Calhoun, Aransas, and Nueces counties) calculated from shoreline positions between the 1930’s and 2012 (table 2).

3737
Long-term Gulf shoreline change rates within this segment of the Texas coast were calculated
at 2,410 sites over a distance of 121 km (75 mi) between Pass Cavallo and the southern end of
Mustang Island (table 3; fig. 20). Net shoreline change rates calculated from the 1930’s to 2012
averaged retreat at 0.74 m/yr (2.4 ft/yr) for Matagorda Island, retreat at 0.74 m/yr (2.4 ft/yr) for
San José Island, and retreat at 0.34 m/yr (1.1 ft/yr) for Mustang Island. Annual rates of land loss
estimated from these updated rates are 4.1 ha/yr (10.3 ac/yr) on Matagorda Island, 2.3 ha/yr
(5.7 ac/yr) on San José Island, and 1.0 ha/yr (2.4 ac/yr) on Mustang Island. Estimated total land
loss along the Gulf shoreline since 1930 is 340 ha (841 ac) on Matagorda Island, 189 ha (467 ac)
on San José Island, and 81 ha (200 ac) on Mustang Island.
The majority of measuring sites underwent net shoreline retreat (1,567 of 2,410; 65 percent).
Net rates at individual sites ranged from retreat at 16.8 m/yr (55.2 ft/yr) to advance at 16.1 m/yr
(52.9 ft/yr). Nearly half the Gulf shoreline of Matagorda Island has advanced since the 1930’s,
albeit at low rates except along a short segment where the island has migrated toward Pass
Cavallo at its northeastern end. Sites along short shoreline segments (1.4 to 3.3 km [0.9 to 2 mi]
long) near the north and south jetties at Aransas Pass recorded minor net shoreline advance.
Highest rates of net retreat (more than 3 m/yr [10 ft/yr]) were measured along a 6-km (3.7-mi)-
long segment of Matagorda Island near Pass Cavallo. Net retreat rates greater than 1 m/yr
(3.3 ft/yr) were measured along all of San José Island except the southernmost 7 km (4.3 mi) of
the island, along a 5-km (3-mi)-long segment in the middle part of Mustang Island, and along the
southern tip of Mustang Island. Net retreat rates elsewhere were less than about 1 m/yr (3 ft/yr).
Net rates of retreat on Matagorda Island are higher for the more recent monitoring periods
than they are for the longer-term period. From the 1930’s to 2012, the average retreat rate
was 0.7 m/yr (2.4 ft/yr), which increased to 1.1 m/yr (3.7 ft/yr) from the 1950’s to 2012 and
to 1.2 m/yr (4.1 ft/yr) from 2000 to 2012 (fig. 17). Trends on San José Island are inconsistent;
retreat rates are higher for the 1950’s to 2012 (1.0 m/yr [3.3 ft/yr]) than they are for the 1930’s to
2012 (0.7 m/yr [2.4 ft/yr]), but shorelines advanced at an average net rate of 1.1 m/yr (3.5 ft/yr)

3838
over the most recent period (2000 to 2012, fig. 17). On Mustang Island, average rates of change
were lower than they were on San José Island, but followed a similar pattern: most rapid average
retreat occurred between the 1950’s and 2012 (0.9 m/yr [2.8 ft/yr]). During the most recent pe-
riod (2000 to 2012), Mustang Island was one of three geologic features on the Texas coast having
net shoreline advance (fig. 17).
Lower Coast (Padre Island and Brazos Island)
The lower coast segment encompasses 183 km (114 mi) of Gulf shoreline within Kleberg,
Kenedy, Willacy, and Cameron counties (figs. 14 and 21), where shoreline change rates were
calculated at 3,671 sites. The principal natural geomorphic feature in this area is Padre Island, a
long Holocene barrier island that broadens from a narrow peninsula at Brazos Santiago Pass to a
broad, sandy barrier island having a well-developed dune system throughout most of its length.
The Rio Grande enters the Gulf of Mexico within this segment and has created a large fluvial
and deltaic headland that forms the southern boundary of a regional longshore current cell that
is bounded on the north by the Brazos/Colorado headland. The Rio Grande has a large drainage
basin (471,900 km2) that extends into Mexico, New Mexico, and Colorado, but dams constructed
on the middle and lower parts of the basin in 1954 (Falcon) and 1969 (Amistad), combined with
extensive irrigation use of Rio Grande water on the coastal plain, has reduced the sediment deliv-
ered to the coast.
Most of Padre Island is undeveloped, except for intensive development at its northern extremity
and at the southern tip of the island (the city of South Padre Island). Engineering structures that
have affected shoreline position include (1) the jetties and associated ship channel at Brazos San-
tiago Pass, where the 13-m (44-ft) deep channel is flanked by jetties that reach 870 m (2850 ft)
(north jetty) and 490 m (1600 ft) (south jetty) into the Gulf; and (2) the shallower Port Mansfield
Channel and its 620-m (2,030 ft) north jetty and 140-m (460 ft) south jetty that protect the 5-m
(15-ft) deep channel.

3939
Figure 21. Net rates of long-term change for the lower Texas Gulf shoreline along Padre Island (Kleberg, Kenedy, Willacy, and Cameron counties) calculated from shoreline positions between the 1930’s and 2012 (table 2).

4040
Net shoreline change rates average retreat at 0.82 m/yr (2.7 ft/yr) on northern Padre Island (Man-
sfield Channel to Packery Channel) and 2.27 m/yr (7.4 ft/yr) on southern Padre Island and Bra-
zos Island (Mansfield Channel to the Rio Grande) (fig. 21, table 3). Estimated net land loss since
1930 is 808 ha (1,997 ac) for northern Padre Island and 1,263 ha (3,122 ac) for southern Padre
Island and Brazos Island.
Despite the location of much of Padre Island in a longshore drift convergence zone, the shore-
line retreated at 3,118 of 3,671 measurement sites (85 percent). Net change rates at individual
sites ranged from advance at 3.4 m/yr (11.1 ft/yr) to retreat at 7.5 m/yr (24.5 ft/yr). Net advanc-
ing shorelines include two nearly 5-km (3-mi)-long segments adjacent to the north and south
jetties at Brazos Santiago Pass, a 12-km (7-mi)-long segment in the Little Shell Beach area on
Padre Island National Seashore near Baffin Bay, a 4-km (2.5-mi)-long segment on the northern
part of Padre Island National Seashore, and a 1-km (0.6-mi)-long segment adjacent to the south
jetty at Mansfield Channel (fig. 21). Highest rates of net retreat (greater than 3 m/yr [10 ft/yr])
were measured along a 7-km (4-mi)-long segment north of the Mansfield Channel jetties, along a
22-km (14-mi)-long segment in northern Cameron County, and along 3-km (2-mi)-long segment
south of Brazos Santiago Pass on Brazos Island.
Shoreline movement along northern Padre Island has become more recessional over time
(fig. 17). The net long-term retreat rate of 0.8 m/yr (2.7 ft/yr) between the 1930’s and 2012 in-
creased to 0.9 m/yr (2.9 ft/yr) between the 1950’s and 2012. The highest net retreat rate for north-
ern Padre Island was measured between 2000 and 2012, the most recent monitoring period. Net
retreat rates are higher on southern Padre Island and Brazos Island, but show a different temporal
trend; rates measured for the 1930’s to 2012 and the 1950’s to 2012 are similar (2.3 and 2.4 m/yr
[7.4 and 7.9 ft/yr]), but the net retreat rate measured during the most recent period (2000 to 2012)
is lower than that for longer periods (fig. 17).

4141
LATE PLEISTOCENE TO HOLOCENE CONTEXT
Estimates of shoreline-change rates over recent geologic intervals can provide a longer-term
context for historical rates documented from maps, aerial photographs, beach surveys, and
airborne surveys acquired over many decades. One simple approach to estimating net change
rates since the end of the last glacial maximum about 20 thousand years ago (ka), when sea level
was several hundred feet lower than it is today (fig. 22), is to use shelf bathymetric contours (fig.
23) as a proxy for shoreline position at past sea-level elevations. Rates of postglacial shoreline
change can be estimated by measuring the shore-normal distance between selected bathymetric
contours on the Texas shelf and the present shoreline position and dividing by the elapsed time
Figure 22. Postglacial Gulf of Mexico sea-level curves (Balsillie and Donoghue, 2004, 2009; Millilken and others, 2008) and approximate rates of relative sea-level rise between 16 and 14 ka, 14 and 13 ka; 13 and 11 ka; 11 and 10 ka; 10 and 8 ka, 8 and 7 ka, and 7 ka to present.

4242
Figure 23. Major bathymetric contours on the Texas continental shelf and transect locations where postglacial net and interval shoreline migration rates are estimated using bathymetric con-tours as a shoreline proxy. Bathymetric data generalized from Holcombe and Arias (2009).

4343
since sea level was at those elevations (table 6). Subsidence, which is likely to vary spatially and
temporally, is a substantial source of possible error for this approach. Nevertheless, the impact
of subsidence on the rates is partly offset by the fact that the Gulf of Mexico sea-level curves
(Balsillie and Donoghue, 2004, 2009; Milliken and others, 2008) have also been constructed
without correcting for the effects of subsidence. Holocene shelf sedimentation is another source
of error that can be significant (particularly within major incised valleys on the inner continental
shelf), but is presumed to be minimal in the context of generalized bathymetric contours extend-
ing along the entire continental shelf.
This order-of-magnitude approach yields estimated net retreat rates between 16 ka and the pres-
ent that range from about 5 to 13 m/yr (16 to 41 ft/yr, table 6), reflecting rapid sea-level rise
rates and rapid general shoreline retreat during the late Pleistocene and early Holocene. Higher
long-term rates are calculated for the upper coast than for the lower coast. Beginning at about
10 ka, net rates generally decrease along the entire coast as the beginning shoreline position date
Table 6. Late Pleistocene and Holocene net shoreline retreat rates for the Texas coast estimated by assuming water depth (fig. 23) approximates shoreline position at past sea-level positions (fig. 22). Effects of subsidence, sedimentation, and erosion are neglected and are significant sources of error. Sea-level ages and elevations are from northern Gulf of Mexico sea level curves published by Balsillie and Donoghue (2004, 2009) and Milliken and others (2008).
Net rate to present (m/yr) Interval rate from previous position (m/yr)
Elev. (m
msl)
Age (ka)
Sabine Pass
Brazos/Colorado
N. Padre Island
S. Padre Island
Sabine Pass
Brazos/Colorado
N. Padre Island
S. Padre Island
-7 7 -1.0 -0.2 -0.1 -0.1 -6.3 -2.0 -0.7 -0.8-10 8 -1.7 -0.4 -0.2 -0.2 -33.1 -9.5 -4.4 -5.8-20 10 -7.9 -2.3 -1.0 -1.3 -55.2 -40.3 -26.7 -18.3-40 11 -12.2 -5.7 -3.4 -2.9 -13.6 -13.2 -8.2 -16.2-60 13 -12.4 -6.9 -4.1 -4.9 -28.4 -8.6 -12.6 -13.9-80 14 -13.6 -7.0 -4.7 -5.6 -4.9 -3.7 -5.6 -2.5-100 16 -12.5 -6.6 -4.8 -5.2 - - - -

4444
becomes younger; but the trend of higher retreat rates on the upper coast and lower rates on the
lower coast is consistent for each period. From 11 ka to present, for example, estimated retreat
rates ranged from 3 m/yr (9 ft/yr) along the southern Padre Island transect to 12 m/yr (40 ft/yr)
along the Sabine Pass transect. From 8 ka to present, net rates decreased to 0.2 m/yr (0.6 ft/yr)
on Padre Island and 1.7 m/yr (5 ft/yr) at Sabine Pass. Published sea-level curves for the northern
Gulf of Mexico (Balsillie and Donoghue, 2004, 2009; Milliken and others, 2008) show a reduc-
tion in rates of sea-level rise that began between about 8 and 10 ka that coincides with lower
estimated rates of postglacial shoreline retreat.
Shoreline change rates can also be estimated for discrete intervals within the general postgla-
cial sea-level rise by comparing past successive sea-level positions and generalized bathymetric
contours as a shoreline proxy (table 6). These data show that estimated net retreat rates were very
high before 8 ka, ranging from 3 to 55 m/yr (8 to 181 ft/yr) depending on the interval and loca-
tion (upper coast rates are generally significantly higher than middle- and lower-coast rates). The
highest rates of shoreline retreat occurred between 11 ka and 10 ka, when rates ranged between
18 m/yr (60 ft/yr) along the southern Padre Island transect and 55 m/yr (181 ft/yr) along the
Sabine Pass transect. Rates between 8 and 7 ka lowered significantly to 0.7 to 6.3 m/yr (2 to
21 ft/yr), as did those since 7 ka (0.1 to 1 m/yr [0.4 to 3.3 ft/yr]). In this context, historical retreat
rates averaging 1.7 m/yr (5.5 ft/yr) on the upper Texas coast and 1.0 m/yr (3.2 ft/yr) on the lower
Texas coast (calculated from shoreline positions between the 1930’s and 2012) are significantly
lower than late Pleistocene to early Holocene retreat estimates during times of rapid postglacial
sea-level rise and are similar to retreat rates estimated since the mid-Holocene when sea-level
rise rates decreased.
USING POSTGLACIAL RATES TO PREDICT SHORELINE MOVEMENT
Over postglacial rates of relative sea-level rise that range from 1 to 20 mm/yr at millenial scales
(fig. 22), there is a reasonably good empirical relationship (r2 values of 0.48 to 0.78) between
rates of relative sea-level rise and net retreat rates for the upper, upper-middle, lower-middle, and

4545
lower coast (fig. 24). The best-fit rate of retreat per millimeter per year of sea-level rise increases
from south to north along the Texas coast, ranging from 0.8 m/yr (2.8 ft/yr) on the lower coast
to 1.8 m/yr (5.9 ft/yr) on the upper coast (fig. 24). These relationships can perhaps be used to
predict approximate rates of shoreline retreat that would be expected under various sea-level rise
scenarios. At historical rates of relative sea-level rise, for example (2 to 4 mm/yr on the lower
and lower-middle coast, 3 to 5 mm/yr on the upper-middle coast, and 5 to 7 mm/yr on the upper
coast), observed retreat rates of 2 to 4 m/yr (7 to 13 ft/yr) for the lower coast and 1 to 2 m/yr (3
to 7 ft/yr) for the lower-middle coast match predicted rates well (fig. 24c, d). Observed historical
retreat rates of 6 to 8 m/yr (20 to 26 ft/yr) for the upper-middle coast are higher than the post-
glacial relationship would predict, but fall between the postglacial retreat rates calculated for the
8 to 7 ka period (4 mm/yr) and the 10 to 8 ka period (5 mm/yr) (fig. 24b). For the upper coast,
historical rates of retreat at 3 to 7 m/yr (10 to 23 ft/yr) are lower than those predicted by the
postglacial relationship (fig. 24a), but are nearly identical to the calculated postglacial retreat rate
observed for the 8 to 7 ka period when sea-level rose at a similar rate (4 mm/yr).
CONCLUSIONS
Long-term rates of Texas Gulf shoreline change have been updated through 2012 from a series
of shoreline positions that includes those from aerial photography from the 1930’s through 2007,
ground GPS surveys from the mid-1990s, and airborne lidar surveys conducted in 2000 and
2012.
In the 20 years preceding the most recent shoreline position considered in this report (1993 to
2012), there were 12 tropical storms and six hurricanes that made landfall on the Texas coast,
including seven on the upper coast, five on the central coast, and six on the lower coast. Tropical
cyclone frequency was 0.9 per year, which is near the historical incidence of 0.8 per year. Rela-
tive sea-level rise rates at Galveston for the period were at the low end of historically observed
rates (3.4 to 4.1 mm/yr).

4646
Figure 24. Relationship between postglacial rates of relative sea-level rise (fig. 22) and approxi-mate shoreline retreat rates for (a) the upper-coast, (b) upper-middle coast, (c) lower-middle coast, and (d) lower-coast transects (fig. 23). Boxed areas represent historical retreat rates and historical sea-level rise rates.

4747
Change rates calculated at 11,749 sites spaced at 50-m intervals averaged net retreat at 1.26 m/yr
(4.1 ft/yr) through 2012. Average change rates were more recessional on the upper Texas coast
(-1.7 m/yr [5.5 ft/yr]) than they were on the central and lower coast (-1.0 m/yr [3.2 ft/yr]). Annu-
al rates of land loss along the Texas Gulf shoreline average 72 ha/yr (178 ac/yr). Total estimated
land loss since 1930, when aerial photography-based shoreline monitoring became possible, is
estimated to be 5,907 ha (14,597 ac). Coastwide, net rates of shoreline retreat are higher for the
1950’s to 2012 monitoring period (1.5 m/yr [4.8 ft/yr]) than they are for the longer-term monitor-
ing period (1930’s to 2012). For the most recent (and shortest) monitoring period, the net retreat
rate is 1.2 m/yr (3.9 ft/yr), lower than net rates for both longer-term periods.
Historical shoreline retreat rates calculated from shoreline positions determined from aerial pho-
tographs and ground and airborne surveys, when compared to longer-term rates estimated from
bathymetric contour shoreline proxies and past sea-level positions, are significantly lower than
late Pleistocene to early-Holocene retreat rates of 2.5 to 55.2 m/yr (8 to 181 ft/yr) but are similar
to retreat rates of 0.1 to 1.7 m/yr (0.4 to 5.4 ft/yr) estimated since the mid-Holocene. Postglacial
rates of retreat per millimeter per year of relative sea-level rise range from 0.8 m/yr for the lower
coast to 1.8 m/yr for the upper coast. This relationship can be used to estimate future rates of
Gulf shoreline retreat under many different sea-level rise scenarios.
Shoreline position extracted from the 2012 airborne lidar survey was chosen to update shoreline
movement rates because it was the most recent coast-wide survey that allowed more than three
years for recovery after Hurricane Ike (2008), which caused significant shoreline change on the
upper Texas coast. The next update will use shoreline position extracted from a planned 2015
airborne lidar survey of the Texas Gulf shoreline.
ACKNOWLEDGMENTS
This project was supported by Contract No. 09-074-000, Work Order No. 7776 from the General
Land Office of Texas (GLO) to the Bureau of Economic Geology, The University of Texas at

4848
Austin. Jeffrey G. Paine served as the principal investigator. The project was funded through the
Coastal Erosion Planning and Response Act (CEPRA) program administered by the GLO. Kevin
Frenzel (GLO) served as project manager. Kevin Frenzel and Kim McKenna provided review
comments that improved the report.
REFERENCES
Anders, F. J., and Byrnes, M. R., 1991: Accuracy of shoreline change rates as determined from maps and aerial photographs: Shore and Beach, v. 59, p. 17-26.
Avila, L. A., 2010, Tropical Storm Hermine (AL102010): Tropical Cyclone Report, National Hurricane Center, 17 p.
Balsillie, J. H., and Donoghue, J. F., 2009, Chapter 4: Northern Gulf of Mexico sea-level history for the past 20,000 years: in Holmes, C.W., ed., The Gulf of Mexico, Its Origin, Waters, Biota and Human Impacts: Vol. 1, Geology: Corpus Christi, TX, Harte Research Institute for Gulf of Mexico Studies, p. 53–69.
Balsillie, J. H., and Donoghue, J. F., 2004, High resolution sea-level history for the Gulf of Mexico since the last glacial maximum: Florida Geological Survey, Report of Investigations No. 103, 65 p.
Barnett, T. P., 1983, Global sea level: estimating and explaining apparent changes: in Magoon, O. T., and Converse, H., editors, Coastal Zone ‘83, Proceedings of the Third Symposium on Coastal and Ocean Management, v. 3, p. 2777-2783.
Brennan, M. J., 2011, Tropical Storm Don (AL042011): Tropical Cyclone Report, National Hur-ricane Center, 15 p.
Bruun, P., 1954, Coastal erosion and development of beach profiles: Technical Memorandum, v. 44, Beach Erosion Board, U. S. Army Corps of Engineers, 82 p.
Bruun, P., 1962, Sea-level rise as a cause of shore erosion: Proceedings, American Society of Civil Engineers, Journal of the Waterways and Harbors Division, v. 88, p. 117-130.
Bruun, P., 1988, The Bruun rule of erosion by sea-level rise: a discussion of large-scale two- and three-dimensional usages: Journal of Coastal Research, v. 4, p. 627-648.
Caudle, Tiffany, and Paine, J. G., 2012, Pre-college student involvement in Texas coastal re-search: Gulf Coast Association of Geological Societies Transactions, v. 62, p. 27‒38.
Cazenave, A., and Nerem, R. S., 2004, Present-day sea level change: observations and causes: Reviews of Geophysics, v, 42, RG3001, doi: 1029/2003RG000139, 20 p.
Church, J. A., and White, N. J., 2006, A 20th century acceleration in global sea-level rise: Geo-physical Research Letters, v. 33: L01602, doi: 10.1029/2005GL024826.
Cooper, J. A. G., and Pilkey, O. H., 2004, Sea-level rise and shoreline retreat: time to abandon the Bruun Rule: Global and Planetary Change, v. 43, p. 157-171.

4949
Crowell, M., Leatherman, S. P., and Buckley, M. K., 1991, Historical shoreline change: error analysis and mapping accuracy: Journal of Coastal Research, v. 7, no. 3, p. 839-852.
Emery, K. O., 1980, Relative sea levels from tide-gauge records: Proceedings, National Academy of Sciences, USA, v. 77: p. 6968-6972.
FitzGerald, D. M., Fenster, M. S., Argow, B. A., and Buynevich, I. V., 2008, Coastal impacts due to sea-Level rise: Annual Review of Earth and Planetary Sciences, v. 36, p. 601-647.
Gibeaut, J. C., and Caudle, Tiffany, 2009, Defining and mapping foredunes, the line of vegeta-tion, and shorelines along the Texas Gulf Coast: Texas A&M University Corpus Christi, Harte Research Institute and The University of Texas at Austin, Bureau of Economic Geol-ogy, final report prepared for the Texas General Land Office contract no. 07-005-22 and National Oceanic and Atmospheric Administration award no. NA06NOS4190219, 14 p.
Gibeaut, J. C., Gutierrez, Roberto, and Hepner, Tiffany, 2002, Threshold conditions for episodic beach erosion along the southeast Texas coast: Gulf Coast Association of Geological Societ-ies Transactions, v. 52, p. 323-335.
Gibeaut, J. C., Hepner, Tiffany, Waldinger, Rachel, Andrews, John, Gutierrez, Roberto, Trem-blay, T. A., and Smyth, Rebecca, 2001, Changes in Gulf shoreline position, Mustang and North Padre Islands, Texas: Bureau of Economic Geology, The University of Texas at Aus-tin, Report to the Texas Coastal Coordination Council and the General Land Office, contract no. 00-002r, 29 p.
Gibeaut, J. C., White, W. A., Hepner, Tiffany, Gutierrez, Roberto, Tremblay, T. A., Smyth, R. A., and Andrews, John, 2000, Texas Shoreline Change Project: Gulf of Mexico shoreline change from the Brazos River to Pass Cavallo: Bureau of Economic Geology, The Univer-sity of Texas at Austin, Report to the Texas Coastal Coordination Council and the General Land Office, contract no. NA870Z0251, 32 p.
Gornitz, V., Lebedeff, S., and Hansen, J., 1982, Global sea level trend in the past century: Sci-ence, v. 215, p. 1611-1614.
Gornitz, V., and Lebedeff, S., 1987, Global sea-level changes during the past century: in Nummedal, D., Pilkey, O. H., and Howard, J. D., editors, Sea level fluctuation and coastal evolution: Society of Economic Paleontologists and Mineralogists Special Publication 41, p. 3-16.
Gutenberg, B., 1941, Changes in sea level, postglacial uplift, and mobility of the Earth’s interior: Geological Society of America Bulletin, v. 52, p. 721-772.
Hayes, M. O., 1967, Hurricanes as geological agents: case studies of hurricanes Carla, 1961, and Cindy, 1963: The University of Texas at Austin, Bureau of Economic Geology Report of Investigations No. 61, 54 p.
Holcombe, T. L., and Arias, C., 2009, Bathymetry of Texas-Louisiana continental shelf and coastal regions compatible with geographic information systems – bathymetry (version 2): Department of Oceanography, Texas A&M University.
Leuliette, E. W., and Miller, L., 2009, Closing the sea level rise budget with altimetry, Argo, and GRACE: Geophysical Research Letters, v. 36, L04608, doi:10.1029/2008GL036010.

5050
Lyles, S. D., Hickman, L. E., Jr., and Debaugh, H. A., Jr., 1988, Sea level variations for the United States, 1855-1986: National Ocean Service, Rockville, Maryland, 182 p.
Milliken, K. T., Anderson, J. B., and Rodriguez, A. B., 2008, A new composite Holocene sea-level curve for the northern Gulf of Mexico: in Anderson, J.B., and Rodriguez, A. B., eds., Response of Upper Gulf Coast Estuaries to Holocene Climate Change and Sea-Level Rise: Geological Society of America Special Paper 443, p. 1–11, doi: 10.1130/2008.2443(01).
Moore, L. J., 2000, Shoreline mapping techniques: Journal of Coastal Research, v. 16, no. 1, p. 111-124.
Morton, R. A., 1974, Shoreline changes on Galveston Island (Bolivar Roads to San Luis Pass), an analysis of historical changes of the Texas Gulf Shoreline: The University of Texas at Austin, Bureau of Economic Geology Geological Circular 74-2, 34 p.
Morton, R. A., 1975, Shoreline changes between Sabine Pass and Bolivar Roads: The University of Texas at Austin, Bureau of Economic Geology Geological Circular 75-6, 43 p.
Morton, R. A., 1977, Historical shoreline changes and their causes, Texas Gulf Coast: Gulf Coast Association of Geological Societies Transactions, v. 27, p. 352–364. Reprinted as Bureau of Economic Geology Geological Circular 77-6, 13 p.
Morton, R. A., 1997, Gulf shoreline movement between Sabine Pass and the Brazos River, Texas: 1974 to 1996: Bureau of Economic Geology Geological Circular 97-3, 46 p.
Morton, R. A., Leach, M. P., and Cardoza, M. A., 1993, Monitoring beach changes using GPS surveying techniques: Journal of Coastal Research, v. 9, p. 702-720.
Morton, R. A., Miller, T. L., and Moore, L. J., 2004, National assessment of shoreline change, part 1: historical shoreline changes and associated coastal land loss along the U.S. Gulf of Mexico: U.S. Geological Survey Open-File Report 2004-1043, 42 p.
Morton, R. A., and Paine, J. G., 1985, Beach and vegetation-line changes at Galveston Island, Texas: erosion, deposition, and recovery from Hurricane Alicia: The University of Texas at Austin, Bureau of Economic Geology Geological Circular 85-5, 39 p.
Morton, R. A., and Paine, J. G., 1990, Coastal land loss in Texas: an overview: Transactions, Gulf Coast Association of Geological Societies, v. 40, p. 625-634.
Morton, R. A., Paine, J. G., and Gibeaut, J. C., 1994, Stages and durations of post-storm beach recovery, southeastern Texas coast, U.S.A.: Journal of Coastal Research, v. 10, p. 884–908.
Morton, R. A., and Pieper, M. J., 1975a, Shoreline changes on Brazos Island and South Padre Island (Mansfield Channel to mouth of the Rio Grande), an analysis of historical changes of the Texas Gulf shoreline: The University of Texas at Austin, Bureau of Economic Geology, Geological Circular 75-2, 39 p.
Morton, R. A., and Pieper, M. J., 1975b, Shoreline changes in the vicinity of the Brazos River delta (San Luis Pass to Brown Cedar Cut): The University of Texas at Austin, Bureau of Economic Geology Geological Circular 75-4, 47 p.

5151
Morton, R. A., and Pieper, M. J., 1976, Shoreline changes on Matagorda Island and San Jose Island (Pass Cavallo to Aransas Pass): The University of Texas at Austin, Bureau of Eco-nomic Geology Geological Circular 76-4, 42 p.
Morton, R. A., and Pieper, M. J., 1977a, Shoreline changes on Mustang Island and North Padre Island (Aransas Pass to Yarborough Pass): The University of Texas at Austin, Bureau of Economic Geology Geological Circular 77-1, 45 p.
Morton, R. A., and Pieper, M. J., 1977b, Shoreline changes on central Padre Island (Yarborough Pass to Mansfield Channel): The University of Texas at Austin, Bureau of Economic Geol-ogy Geological Circular 77-2, 35 p.
Morton, R. A., Pieper, M. J., and McGowen, J. H., 1976, Shoreline changes on Matagorda Pen-insula (Brown Cedar Cut to Pass Cavallo): The University of Texas at Austin, Bureau of Economic Geology Geological Circular 76-6, 37 p.
Paine, J. G., 1991, Late Quaternary depositional units, sea level, and vertical movement along the central Texas coast: Ph. D. dissertation, University of Texas at Austin, Austin, Texas, 256 p.
Paine, J. G., 1993, Subsidence of the Texas coast: inferences from historical and late Pleistocene sea levels: Tectonophysics, v. 222, p. 445–458.
Paine, J. G., Caudle, Tiffany, and Andrews, John, 2013, Shoreline, beach, and dune morphody-namics, Texas Gulf coast: Bureau of Economic Geology, The University of Texas at Austin, Final Report prepared for General Land Office under contract no. 09-242-000-3789, 64 p.
Paine, J. G., Mathew, S., and Caudle, T., 2011, Texas Gulf shoreline change rates through 2007: Bureau of Economic Geology, The University of Texas at Austin, report prepared under General Land Office contract no. 10-041-000-3737 and National Oceanic and Atmospheric Administration award no. NA09NOS4190165, 38 p. + CD-ROM.
Paine, J. G., Mathew, Sojan, and Caudle, Tiffany, 2012, Historical shoreline change through 2007, Texas Gulf coast: rates, contributing causes, and Holocene context: GCAGS Journal, v. 1, p. 13-26.
Paine, J. G., and Morton, R. A., 1989, Shoreline and vegetation-line movement, Texas Gulf Coast, 1974 to 1982: The University of Texas at Austin, Bureau of Economic Geology Geo-logical Circular 89-1, 50 p.
Peltier, W. R., and Tushingham, A. M., 1989, Global sea level rise and the greenhouse effect: might they be connected?: Science, v. 44, p. 806-810.
Penland, S., and Ramsey, K., 1990, Sea-level rise in Louisiana and the Gulf of Mexico: 1908-1988: Journal of Coastal Research, v. 6, no. 2, p. 323-342.
Price, W. A., 1956, Hurricanes affecting the coast of Texas from Galveston to the Rio Grande: U.S. Army Corps of Engineers Beach Erosion Board, Technical Memorandum No. 78, 35 p.
Roth, David, 2010, Texas hurricane history: National Weather Service, Camp Springs, Marlyand, 83 p. http://origin.hpc.ncep.noaa.gov/research/txhur.pdf
Shalowitz, A. L., 1964, Shore and beach boundaries: U.S. Department of Commerce, Publica-tion 10-1, 749 p.

5252
Simpson, R. H., and Riehl, H., 1981, The hurricane and its impact: Baton Rouge, Louisiana State University Press, 398 p.
Snay, R., Cline, M., Dillinger, W., Foote, R., Hilla, S., Kass, W., Ray, J., Rohde, J., Sella, G., and Soler, T., 2007, Using global positioning system-derived crustal velocities to estimate rates of absolute sea level change from North American tide gauge records: Journal of Geophysi-cal Research, v. 112, B04409, doi: 10.1029/2006JB004606, 11 p.
Swanson, R. L., and Thurlow, C. I, 1973, Recent subsidence rates along the Texas and Louisi-ana coast as determined from tide measurements: Journal of Geophysical Research, v. 78, p. 2665-2671.
Thieler, E. R., Himmelstoss, E. A., Zichichi, J. L., and Ergul, Ayhan, 2009, Digital Shoreline Analysis System (DSAS) version 4.0 — An ArcGIS extension for calculating shoreline change: U.S. Geological Survey Open-File Report 2008-1278.