Final Report San Francisco Quality Culture · PDF fileFinal Report San Francisco Quality...
48
Final Report San Francisco Quality Culture Series Prepared For: San Francisco Health Plan 201 Third St., 7th Floor San Francisco, CA 94103 (415) 547-7818 www.sfhp.org Prepared By: Center for the Health Professions, University of California, San Francisco 3333 California St., Suite 410 San Francisco, CA 94118 415-476-8181 www.futurehealth.ucsf.org The San Francisco Quality Culture Series was supported by a grant from the Gordon and Betty Moore Foundation. www.moore.org 3/20/2012
Transcript of Final Report San Francisco Quality Culture · PDF fileFinal Report San Francisco Quality...

Final Report
San Francisco Quality Culture Series Prepared For: San Francisco Health Plan 201 Third St., 7th Floor San Francisco, CA 94103 (415) 547-7818 www.sfhp.org Prepared By: Center for the Health Professions, University of California, San Francisco 3333 California St., Suite 410 San Francisco, CA 94118 415-476-8181 www.futurehealth.ucsf.org The San Francisco Quality Culture Series was supported by a grant from the Gordon and Betty Moore Foundation. www.moore.org
3/20/2012

San Francisco Quality Culture Series
1
Table of Contents
Introduction .................................................................................................................................................................................... 2
Program Leadership .................................................................................................................................................................... 2
Participants ..................................................................................................................................................................................... 3
Organizations ............................................................................................................................................................................ 3
Teams ........................................................................................................................................................................................... 3
Individuals .................................................................................................................................................................................. 4
Program Elements ........................................................................................................................................................................ 4
Learning Sessions .................................................................................................................................................................... 4
Quality Improvement Project ............................................................................................................................................. 5
Coaching ...................................................................................................................................................................................... 6
Webinars ..................................................................................................................................................................................... 6
Microsoft Office Skills Classes ............................................................................................................................................ 7
“Management 101” Books & Trainings ........................................................................................................................... 7
Evaluation ........................................................................................................................................................................................ 8
Structure ...................................................................................................................................................................................... 8
Results .......................................................................................................................................................................................... 8
Perceptions of Program .................................................................................................................................................... 8
Individual and Team Changes..................................................................................................................................... 12
Clinic Changes ................................................................................................................................................................... 14
Evaluation Summary ........................................................................................................................................................... 26
Key Lessons Learned ................................................................................................................................................................ 27
Conclusion .................................................................................................................................................................................... 29
APPENDICES ................................................................................................................................................................................ 31
A: Detailed Learning Session Agendas ......................................................................................................................... 31
B: Measure Set Document ................................................................................................................................................. 38
C: BCCQ: Clinic Capacity for Quality Assessment..................................................................................................... 44
D: Team Development Survey Comparison Report ................................................................................................ 47

San Francisco Quality Culture Series
2
Introduction San Francisco clinics face unique challenges in delivering quality care for a growing population of under- and uninsured people. These challenges require clinic leadership teams to be equipped with effective skills and competencies to respond to the rapidly changing health care environment. Studies on high-performing organizations frequently name leadership commitment and alignment as key foundations for success, as well as the ability to lead effectively as a team. In an analysis of leadership effectiveness data from nearly 35,000 people working in health care, the Center for Creative Leadership (CCL) identified the ability to lead employees and to work in teams as the top priority for leadership development in the healthcare sector.1 Redwood Community Health Coalition (RCHC), a consortium of clinics in four North Bay counties, created the original Quality Culture Series based on the Intermountain Health quality improvement training program. 2 RCHC saw a dramatic acceleration of improvement in several areas and attributes their success to the fact that the entire leadership team attended all sessions and effectively spread what was learned through training their clinic staff. Medical directors from three San Francisco agencies, San Francisco Department of Public Health - Community Oriented Primary Care (SFDPH-COPC), San Francisco Community Clinic Consortium (SFCCC) and San Francisco Health Plan conceived the San Francisco Quality Series based on the RCHC model. The intent of the San Francisco Quality Culture Series (SFQCS) was to build the capacity of San Francisco clinic leadership teams to create a clinic environment where quality is championed in every regard, through the development of knowledge and skills in the areas of teamwork, leadership, management and the Model for Improvement.
Program Leadership The development and implementation of the program was a collaborative effort, achieved through a partnership between the following: Program Advisors The medical directors from the three San Francisco partner agencies noted above served as program advisors, providing strategic direction and vision throughout the duration of the program. Their high level of engagement and commitment was essential to both obtaining by-in and securing commitment from all clinic teams, as well as ensuring that the program was appropriately tailored and delivered in a manner that resonated with San Francisco safety net clinics. Program Office The Center for the Health Professions (The Center) administered the program and oversaw all day-to-day operations. The Center worked closely with the program advisors and learning session faculty in the development of the learning session structure and curriculum materials. The Center was responsible for tracking program progress and overseeing the evaluation process.
1 Center for Creative Leadership, 2010: Addressing the Leadership Gap in Healthcare. Available at http://www.ccl.org/leadership/research/sharing/index.aspx#whitePapers 2 http://intermountainhealthcare.org/qualityandresearch/institute/courses/atp/Pages/home.aspx

San Francisco Quality Culture Series
3
“Going to QCS was really good - for the first time in 15 years I felt valued as a manager. Principal Clerks aren’t even called managers.”
- Principle Clerk
Lead Coach The lead coach coordinated the development of the theory and measurement strategy for each of the quality improvement project topic areas, and managed the data from all 21 quality improvement projects. This role served as the central contact for all program coaches, ensuring the coach perspective was represented in the program planning. Program coaches, learning session faculty, and San Francisco Health Plan health improvement staff served as advisors to the program when needed.
Participants
Organizations 25 leadership teams enrolled at the start of the program in January 2011: 23 from clinics, and 2 administrative leadership teams from SFCCC and SFDPH –COPC. Prior to the start of the first learning session, each team member was required to sign a memorandum of understanding (MOU) indicating agreement with the program requirements and his/her commitment to attend all learning sessions and leading a quality improvement project. Early in the program, two clinic teams withdrew due to organizational changes. 21 primary care clinics and the 2 leadership teams completed all program elements. The clinic affiliations for the final 21 clinic teams were as follows:
SFDPH – Community Oriented Primary Care 11
SFDPH – Hospital Based Clinics 5
San Francisco Community Clinic Consortium 4
Other – Hospital Based 1
Teams Team size ranged from 3 – 6 members based on the size of the clinic. The composition of the teams also varied depending on clinic affiliation. For example, clinic teams affiliated with SFCCC were generally comprised of the executive director, medical director, clinic or administrative director, and QI manager. Clinics affiliated with the SFDPH were generally comprised of a medical director, a second physician leader, nurse manager, and principal clerk. Additional team members representing social work or behavioral health positions were included depending on the clinic’s scope of services.
While there was some staff turnover over the course of the program year, the composition remained the same for the majority of teams. The most significant modifications occurred among the SFDPH-COPC clinics as 3 clinic teams experienced a change in medical director.
San Francisco Quality Culture Series
4
Individuals
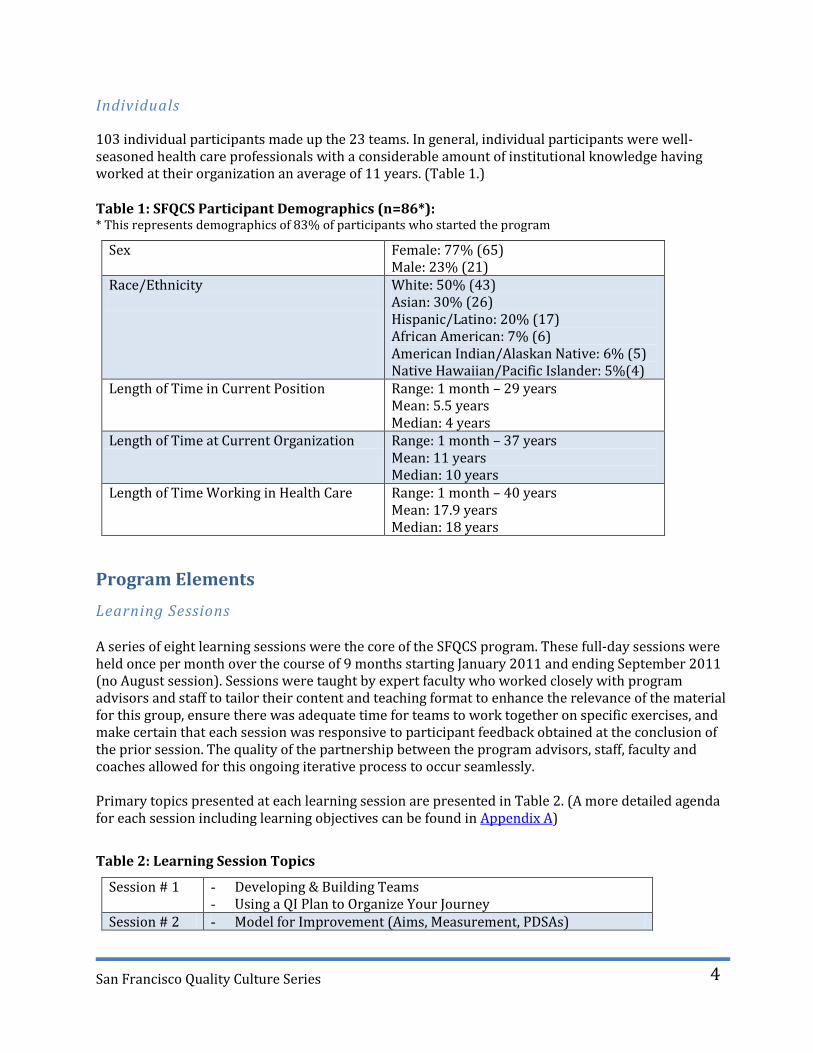
103 individual participants made up the 23 teams. In general, individual participants were well-seasoned health care professionals with a considerable amount of institutional knowledge having worked at their organization an average of 11 years. (Table 1.) Table 1: SFQCS Participant Demographics (n=86*): * This represents demographics of 83% of participants who started the program
Sex Female: 77% (65) Male: 23% (21)
Race/Ethnicity
White: 50% (43) Asian: 30% (26) Hispanic/Latino: 20% (17) African American: 7% (6) American Indian/Alaskan Native: 6% (5) Native Hawaiian/Pacific Islander: 5%(4)
Length of Time in Current Position Range: 1 month – 29 years Mean: 5.5 years Median: 4 years
Length of Time at Current Organization Range: 1 month – 37 years Mean: 11 years Median: 10 years
Length of Time Working in Health Care Range: 1 month – 40 years Mean: 17.9 years Median: 18 years
Program Elements
Learning Sessions A series of eight learning sessions were the core of the SFQCS program. These full-day sessions were held once per month over the course of 9 months starting January 2011 and ending September 2011 (no August session). Sessions were taught by expert faculty who worked closely with program advisors and staff to tailor their content and teaching format to enhance the relevance of the material for this group, ensure there was adequate time for teams to work together on specific exercises, and make certain that each session was responsive to participant feedback obtained at the conclusion of the prior session. The quality of the partnership between the program advisors, staff, faculty and coaches allowed for this ongoing iterative process to occur seamlessly. Primary topics presented at each learning session are presented in Table 2. (A more detailed agenda for each session including learning objectives can be found in Appendix A)
Table 2: Learning Session Topics
Session # 1 - Developing & Building Teams - Using a QI Plan to Organize Your Journey
Session # 2 - Model for Improvement (Aims, Measurement, PDSAs)

San Francisco Quality Culture Series
5
Session # 3 - Project Management - Teaching QI
Session # 4 - Communication - Working With and Through Others - Managing and Leading Change
Session # 5 - Fundamentals of Operations Management* - Sustainability and Reliability
Session # 6 - Making the Business Case for Change - Giving and Receiving Feedback - Decision Making
Session # 7 - High Performing Teams - Emotional Intelligence - Managing Conflict
Session # 8 - Developing a QI Training Plan - Spread and Sustainability
* The operations morning session was cancelled due to a last minute faculty emergency and will be taught instead in May 2012 as an alumni session. The morning of Session 5 was dedicated to structured work on project reports, with coaches available for technical assistance.
In addition to the topics noted above, each learning session included other activities to facilitate the sharing of challenges, successes, and best practices among teams. Attendance at the learning sessions was extraordinary, especially considering the intensity of the program:
91% overall attendance rate 100% of teams had at least 2 members at every session 100% of individuals attended at least 6 out of 8 sessions
Quality Improvement Project As part of their participation in the program, each team was required to undertake a quality improvement project in one of four strategic priority areas for the San Francisco safety net: 1) improving appointment access, 2) achieving Meaningful Use of Electronic Health Records (EHR)as a tool for quality and safety, 3) improving the patient experience, and 4) integrating behavioral health into primary care. Teams were asked to indicate their preferred topic prior to the start of the program. The breakdown of topic areas among the 21 clinic teams were as follows:
Improving Access 11
Meaningful Use of EHR 7
Improving the Patient Experience 2
Integrating Behavioral Health into Primary Care 1 Teams were asked to select their project measures from a suite of required and optional measures for each topic area; the set of measures for each topic was created by the coaches with input from the program advisors. (See Appendix B for Measures Set Document.) Some teams modified the measure

San Francisco Quality Culture Series
6
set to fit with their internal priorities or their data collection capacity, which sometimes lead to a less than uniform set of final measures. Each team shared their project data with their respective coach according to the terms established by the coach and clinic team at the start of the program. Teams were required to submit data to the Program Office on a quarterly basis. It was the expectation that clinic teams would continue to work on their project after the program officially ended. Project “completion,” vis-à-vis the guidelines for program participation, was defined as each team having completed the following:
1.) Project Charter, adapted from a template developed by the Institute for Healthcare Improvement, asked teams to outline the following: the aim of their project and why was it important; the measures to be tracked and the plan to collect the data; and the activities they would undertake including potential PDSA cycles, project timeframe, and communication plan. In addition, to help reinforce messages and exercises from the first learning session regarding the formation of teams, the charter included an area for teams to indicate their team values and their overall purpose.
2.) Baseline data submitted to coach and program office. 3.) Quarterly reports, including progress on project measures, submitted to coach and program
office. 4.) 10 hours of intersession coaching with assigned QI coach. 5.) Final data and narrative report submitted to coach and program office.
Coaching Each team was assigned a coach to provide them with additional guidance in the execution of their quality improvement project. In addition to assisting teams with the mechanics of their projects, many coaches also helped their team reflect on the content delivered at the learning session and helped teams navigate leadership, management, and team dynamic issues that arose during the course of the program. With the exception of two teams who had a coach in a remote location, the coaching was done in person whenever possible. All coaches had expertise in the Model for Improvement and the implementation of quality improvement initiatives in clinic settings. To the extent possible, coaches were assigned to clinics based on their familiarity with the clinic and their expertise in the chosen topic areas. Each team was asked to use at least 10 hours of coaching and was allowed to use up to 25 hours over the course of the program year. Due to availability of extra funds towards the end of the program, some clinics extended their hours past the 25 hour maximum.
The summary of coaching hours used is as follows:
% of clinics reaching 10 hr minimum 100%
Range of hours used 10.25 hrs – 28.25 hrs
Mean hours used 20.6 hrs.
Webinars Recognizing that many teams were in need of additional content knowledge and support specific to

San Francisco Quality Culture Series
7
their quality improvement project topic and outside of what could be provided during learning sessions and by their coach, two webinar series were held addressing key knowledge and skill gaps related to improving appointment access and preparing for EHR implementation. The Improving Access Webinar Series provided content and a shared approach to improving access to appointments. The 6-part series was held over a period of 4 months and was led by one of the coaches with expertise in this area. Forty-six SFQCS team members participated in the webinar series - the topics for the 6 webinars were as follows:
Webinar # 1 Advanced Access: What’s it all About? Webinar # 2 Measurement Webinar – Review access measures Webinar # 3 Establishing Patient Panels and Promoting Continuity Webinar # 4 Advanced Access; How to Make it Work Part 1 Webinar # 5 Advanced Access; How to make it Work Part 2 Webinar # 6 Open Forum The EHR Preparation Webinar Series provided additional content on critical techniques and processes related to preparation for and implementation of EHRs. The 3-part series was held over a period of 3 months and was led by one of the meaningful use coaches. Thirty-six SFQCS team members participated in the following webinars:
Webinar #1 Chart Abstraction: an overview of techniques, recommendations and best practices for populating the electronic chart with key information from the paper chart before, during and after “go-live.”
Webinar #2 Workflow Redesign: an overview of how process analysis and process mapping can support efficiencies.
Webinar # 3 Implementation and Training Strategies: a presentation of several ways to introduce the EHR into “production,” the benefits and challenges of each approach relative to training, access and provider productivity.
Microsoft Office Skills Classes Half-day trainings in Microsoft Excel, PowerPoint, and Word & Email Handling were offered to all SFQCS participants outside of the 8 learning sessions. These three in-person classes were offered on a first-come first-serve basis and were taught by a Certified Microsoft Office Instructor. 23 people participated in the Excel class; 19 participated in the PowerPoint class; and 15 participated in the Word and Email handling class.
“Management 101” Books and Trainings Each participant received 5 management books along with structured interactive training around the core concept presented in the books. The books and exercises were designed to teach basic skills in running effective meetings (Patrick Lencioni, Death by Meeting), using metrics as a tool to improve accountability and morale (Patrick Lencioni, Three Signs of a Miserable Job), basic time management (David Allen, Getting Things Done), effective recruitment and hiring (Geoff Smart, Who) and building effective teams (Patrick Lencioni, Five Dysfunctions of a Team).

San Francisco Quality Culture Series
8
Evaluation
Structure The program was evaluated in the areas of participant perception of the program, individual and team changes, and clinic level changes (Table 3).
Table 3: Evaluation Elements
LEVEL WHAT WAS ASSESSED MECHANISM
Participant Perceptions of Program
Quality and value of individual learning sessions.
Learning session evaluations completed by individuals
Quality and value of coach Coaching evaluation completed by each team
Quality and value of overall program
Program evaluations completed by individuals
Narrative reports completed by each team.
Individual and Team Changes
Employee engagement Gallup 12
Team functioning Team Development Survey
Individual program evaluations
Narrative reports completed by each team
Clinic Changes Clinic capacity for quality
BCCQ Clinic Capacity for Quality Assessment
Individual program evaluations
Narrative reports completed by each team
Training sessions for staff Narrative reports completed by each team
Quality improvement project metrics
Quality improvement project data collected by team and submitted to program office
There are limitations to the evaluation data to keep in mind. First, as with most leadership program evaluations, the degree to which participants can distinguish between improvements due to their participation in SFQCS and other outside factors is not always clear. Secondly, with the exception of the data related to the quality improvement projects, data are self-reported. However, given the high response rate across evaluation activities, we feel the results present an accurate story about SFQCS.
Results
Perceptions of Program
Learning Sessions – Participant Feedback Individual participants completed session evaluations at the conclusion of each of the 8 learning sessions. Participants rated each individual session and associated faculty member(s) on 7 domains, and the overall learning session on 3 domains. There were a total of 15 individual sessions spread over the 8 learning sessions. The mean ratings for

San Francisco Quality Culture Series
9
4.24
4.43
4.13
4.19
4.25
4.03
4.14
1 2 3 4 5
Effectiveness of Presentation
Speaker's Knowledge
Liklihood of Behavior Change
Met Learning Objectives
Practical Value
Organization & Pace
Quality of Content
Mean Rating
Individual Sessions
5 - Excellent
4 - Very Good
3 - Good
2 - Fair
1 -Poor
4.18
4.22
4.24
1 2 3 4 5
Overall Quality of LearningSession
Overall Quality of Speakers
Selection of Topics
Mean Rating
Entire Learning Session
5 - Excellent
4 - Very Good
3 - Good
2 - Fair
1 -Poor
all 7 items across the 15 sessions were very high, falling between 4 (very good) and 5 (excellent). (Figure 1) The most highly rated sessions were Giving and Receiving Feedback and Decision-Making. Participants also rated the overall sessions very highly, with the mean of the 3 items assessed across all 8 sessions also falling between 4 and 5. (Figure 2)
Figure 1: Ratings of 15 individual sessions included in the 8 learning sessions
Figure 2: Overall ratings of each of the 8 learning sessions
Overall Program – Participant Feedback At the conclusion of the last learning session, participants were asked to rate the overall quality of the entire program, as well as the degree to which they believed the culture of quality at their clinic had improved as a result of their teams’ participation. Culture of quality was defined as follows: “The culture of the clinic is one that champions quality in all regards. The clinic can successfully adopt new practices, protocols and technologies that optimize clinical quality, patient and employee satisfaction, operational efficiencies and revenue.”
100% of participants who completed the evaluation rated the quality of the program as very good or

San Francisco Quality Culture Series
10
Strongly Disagree
0%
Disagree 0%
Neither Disagree or Agree
3%
Agree 45%
Strongly Agree 52%
Poor 0%
Fair 0% Good
0%
Very Good 48%
Excellent 52%
excellent (Figure 3), and 97% of participants agreed or strongly agreed that their teams’ participation helped to improve the culture of quality at their clinic. (Figure 4) Figure 3: Overall Quality of Program (N= 67) Figure 4: Improved Culture of Quality (N=66)
Additional feedback about the program was obtained at the last learning session as well as from the final narrative reports submitted by all teams in January 2012. Key themes were as follows:
Most Helpful Aspects
Knowledge and skills that helped enhance teamwork and strengthened team effectiveness.
Having protected time at learning sessions for the team to work on clinic issues together.
Tangible tools and resources, including the books that helped teams apply the learning session content.
Opportunity to network with other clinics and creation of a sense of unity among the safety net clinics.
Suggestions for Improvement
Too much content. More depth, less breadth.
More opportunities for different or more staff to participate.
More coach involvement. More coaching hours and/or having coaches at every learning session.
More opportunities for interaction and discussion among clinic teams at learning sessions.
“When I first heard about the opportunity to participate in the SFQCS, I knew our management team couldn’t pass it up. To instill a culture of quality in our clinic has always been a goal of mine, but I struggled with how to go about it. SFQCS not only gave us the knowledge and tools we needed, but it also transformed the members of our management team in a way that we would not have been able to achieve on our own, into a team of champions for high quality practice. Seeing how we really could change things for the better, and being given the time to dream big—together—was exactly what our clinic leadership needed. We’re starting to see the fruits as we pass on our training to our staff. We’re going beyond just identifying and complaining about problems, to doing something actively to solve them.
- Medical Director

San Francisco Quality Culture Series
11
“We found encouragement and objectivity of a person outside of the management team, who knew our goal and our dynamics very helpful. We love the idea of ongoing coaching.”
- Clinic Team
Coaching – Participant Feedback
At the conclusion of the program, each individual team completed an evaluation of their coach. Teams were asked to rate their level of agreement with 10 items including key areas where practice coaching has shown to be of benefit.3 While a few teams did not have a positive experience with their coach, overall, teams rated their coaches highly and felt that they were integral to the success of their QI projects. (Table 4) Table 4: Results of Coach Evaluation
Our QCS coach… Strongly Disagree
(1)
Disagree(2) Neither (3) Agree (4) Strongly Agree
(5)
Mean
...helped our team apply the content provided at the 8 SFQCS learning sessions.
0 1 3 10 7 4.10
...encouraged our team to test changes that we may not have done on our own.
0 1 3 10 7 4.10
...helped extend the perspective of our team by providing outside experiences and sharing information from other clinic settings.
1 0 2 7 11 4.29
...helped us build a better and more effective team.
1 2 4 8 6 3.76
...was committed to our team's success.
0 0 3 6 12 4.43
...bonded with our team through his/her motivation and encouragement
0 3 2 4 11 4.15
...empowered our team by setting the stage and then giving us permission to do things on our own.
0 1 2 9 8 4.20
...was a valuable resource because of his/her knowledge and expertise in the specific strategy we chose to work on.
1 0 3 6 11 4.24
...helped hold our team accountable to SFQCS deliverables.
0 0 1 10 10 4.43
...was integral to the successful execution of our SFQCS QI project.
1 2 2 5 11 4.10
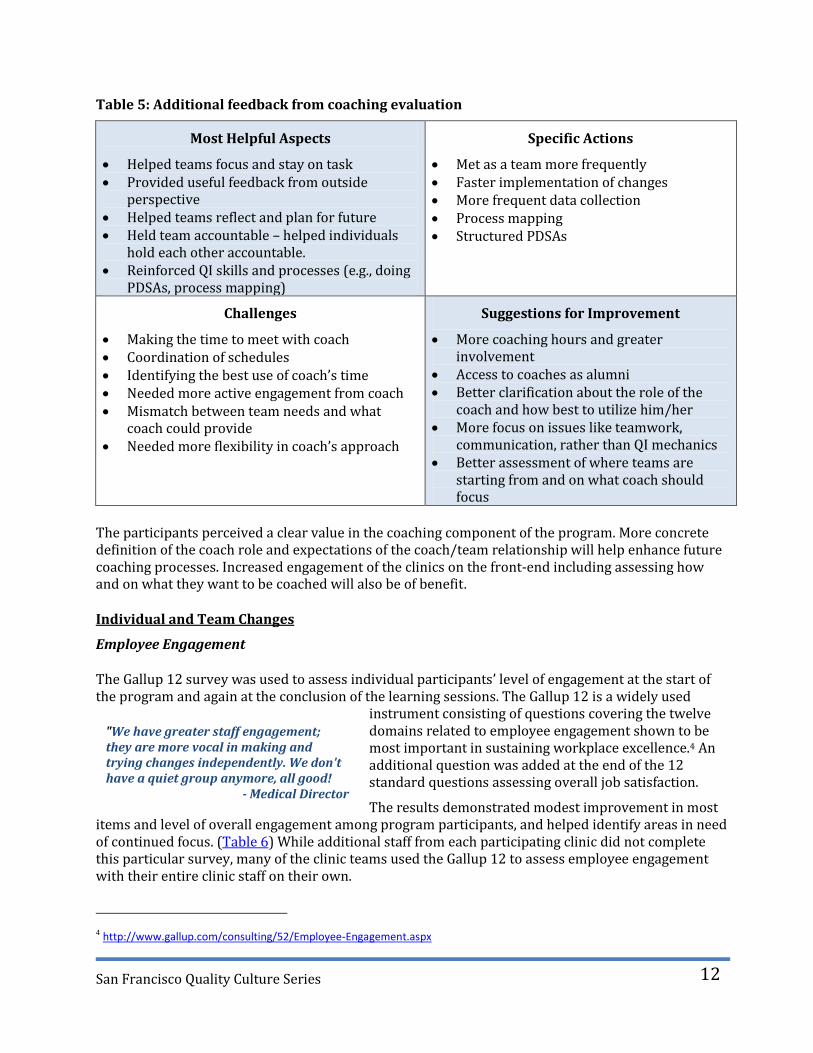
Teams also commented on the most helpful aspect of having a coach, what specific actions they took because of their coach, what challenges they faced with their coach, and how the coaching component of the program could be improved. (Table 5)
3 Coleman, K., Pearson, M., Wu, S. Integrating Chronic Care and Business Strategies in the Safety Net: A Practice
Coaching Manual. 2009. Agency for Healthcare Research and Quality.
San Francisco Quality Culture Series
12
"We have greater staff engagement; they are more vocal in making and trying changes independently. We don't have a quiet group anymore, all good!
- Medical Director
Table 5: Additional feedback from coaching evaluation
Most Helpful Aspects
Helped teams focus and stay on task Provided useful feedback from outside
perspective Helped teams reflect and plan for future Held team accountable – helped individuals
hold each other accountable. Reinforced QI skills and processes (e.g., doing
PDSAs, process mapping)
Specific Actions
Met as a team more frequently Faster implementation of changes More frequent data collection Process mapping Structured PDSAs
Challenges
Making the time to meet with coach Coordination of schedules Identifying the best use of coach’s time Needed more active engagement from coach Mismatch between team needs and what
coach could provide Needed more flexibility in coach’s approach
Suggestions for Improvement
More coaching hours and greater involvement
Access to coaches as alumni Better clarification about the role of the
coach and how best to utilize him/her More focus on issues like teamwork,
communication, rather than QI mechanics Better assessment of where teams are
starting from and on what coach should focus
The participants perceived a clear value in the coaching component of the program. More concrete definition of the coach role and expectations of the coach/team relationship will help enhance future coaching processes. Increased engagement of the clinics on the front-end including assessing how and on what they want to be coached will also be of benefit. Individual and Team Changes
Employee Engagement The Gallup 12 survey was used to assess individual participants’ level of engagement at the start of the program and again at the conclusion of the learning sessions. The Gallup 12 is a widely used
instrument consisting of questions covering the twelve domains related to employee engagement shown to be most important in sustaining workplace excellence.4 An additional question was added at the end of the 12 standard questions assessing overall job satisfaction.
The results demonstrated modest improvement in most items and level of overall engagement among program participants, and helped identify areas in need of continued focus. (Table 6) While additional staff from each participating clinic did not complete this particular survey, many of the clinic teams used the Gallup 12 to assess employee engagement with their entire clinic staff on their own.
4 http://www.gallup.com/consulting/52/Employee-Engagement.aspx

San Francisco Quality Culture Series
13
“The management team is functional and much more cohesive, beginning to take ownership for the overall direction, functioning and outcomes in the clinic.”
- Clinic Team
Table 6: Pre/Post results of employee engagement survey
Team Functioning (Team Development Survey) The Campbell-Hallam Team Development Survey (Vangent) (TDS) was used to assess the functioning of each clinic team. This instrument asked team members to report how they felt about issues such as innovation, organizational support and mission clarity, among others, and measured 19 dimensions of team functioning falling under 4 main themes: resources, improvement, efficiency, team success. The TDS was administered prior to the start of the learning sessions as well as 10 months later following the final learning session.
Each team received a comprehensive report on their results from the initial assessment at the first learning session. At the conclusion of the program, each team received a comprehensive report on their results from the follow-up assessment in addition to a comparison report indicating their team’s change in each of the 19 dimensions.
A comparison report was also generated for the aggregate of all teams. (Figure 5) As a group, there was improvement in 18 out of 19 dimensions, with the largest improvement (5 points) seen in Mission Clarity (“our purpose is clear”), Information (“we get the information we need”), Team Assessment (“we seek ways to improve our team”) and the overall index score. (See Appendix D for copy of report)
Even though there was not a 100% response rate for the pre and post surveys, each team met the minimum number of respondents to generate individual team results.
* Items were rated on a scale of 1 (strongly disagree) to 5 (strongly agree) Time 1 (N=87)
Time 2 (N=96)
Change
I know what is expected of me at work. 4.23 4.25 .02
I have the materials and equipment I need to do my work right. 3.43 3.47 .04 At work, I have the opportunity to do what I do best every day. 3.61 3.66 .05
In the last seven days, I have received recognition or praise for doing good work.
3.45 3.58 .13
My supervisor, or someone at work, seems to care about me as a person.
4.24 4.20 -.04
There is someone at work who encourages my development. 3.67 3.91 .24
At work, my opinions seem to count. 4.15 4.26 .11
The mission/purpose of my organization makes me feel my job is important.
4.28 4.43 .15
My co-workers are committed to doing quality work. 4.16 4.04 -.12 I have a best friend at work. 2.97 3.36 .39
In the last six months, someone at work has talked to me about my progress.
3.33 3.71 .38
In the last year, I have had opportunities at work to learn and grow. 4.16 4.38 .22
Overall Engagement 3.88 3.94 .06
My organization is a better place to work than it was twelve months ago.
3.54 3.86 .32

San Francisco Quality Culture Series
14
Figure 5: Pre/Post Comparison of Team Development Survey Aggregate (N=96; N=89)
In the last learning session evaluation and in their final reports, participants were also asked to identify the most important changes in their team resulting from their participation in the program. Key themes most frequently referenced were as follows:
Enhanced communication Improved meetings in terms of frequency and effectiveness Greater cohesion Increased focus and commitment to quality improvement
Clinic Changes
Clinic Capacity for Quality Each clinic’s capacity for quality was assessed using a tool developed by the Building Clinic Capacity for Quality (BCCQ) Program. The BCCQ program adapted it from several different instruments including the Chronic Illness Care Survey v. 3.5, Quality Culture Series Health Center Culture Of Quality Assessment, Tools for Quality Program Community Clinic CDMS Adoption Self-Assessment, and the Doctor’s Office Quality – Information Tech EHR Readiness Assessment. The intent of the tool
“Before we had the experience of attending SFQCS, our management team did not really function like a team. It was a management group who met to exchange information and put out fires and try to figure out how to get the two main clinic groups to ‘get along’. Although all were committed to the clinic, there was no framework for tackling issues together. Now we have added a clinician and are using many of the teamwork tools and processes we learned at SFQCS.”
- Nurse Manager

San Francisco Quality Culture Series
15
“Our infrastructure for QI is dramatically expanded. We have new IT tools, new data management and reporting processes and standards, and a refined ability to test and manage change.”
- Clinic Team
was to measure clinics’ level of preparation in twelve areas related to quality. Clinics were rated on their level of preparedness (1 – Not yet prepared to 6 – Highly prepared) on 12 items (Table 7). Together with their coach, each team completed the assessment prior to the start of the program in December 2011 and once again following the conclusion of the program in December 2012. (See Appendix C for copy of instrument). Table 7: Questions from the Clinic Capacity for Quality Assessment
# Question
1 Organization wide vision for quality improvement
2 Strategic planning and implementation of quality improvement, population health management and workflow efficiency initiatives
3 Management of quality improvement initiatives and chronic care coordination
4 Management reports show organizational performance
5 Staff appreciation of importance and understanding of the use of data and information flow
6 Clinician involvement in quality improvement initiatives
7 Patient involvement in chronic care treatment
8 Development and sharing of best practices and standards for quality improvement
9 Training plans involving quality improvement processes and staff understanding of these processes
10 Integration and use of data elements necessary to manage chronic care
11 Frequency of data driven decision making
12 UDS and OSHPD and other data reporting requirements
* Question #12 referred to UDS and OSHPD reporting. Because the individual DPH clinics are not responsible for this (DPH does it on behalf of all clinics) all DPH clinics were rated as 3.5 on both the pre and post assessments.
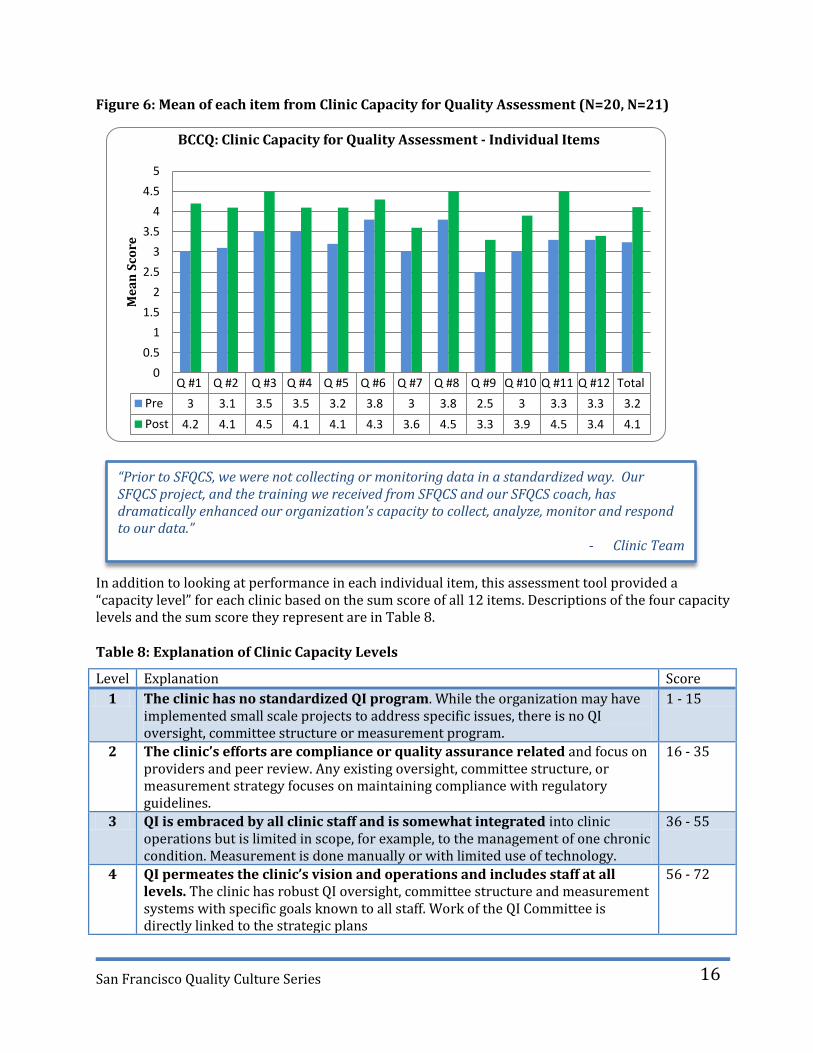
It is important to note that there were instances where a high-performing clinic viewed the assessment through a more critical lens than a less experienced clinic. While there were no clinics with scores that were substantially different from what was anticipated, the subjective nature of this instrument should be considered when reviewing raw scores and comparing clinic by clinic performance. It is most useful to look at the change in clinic scores from pre to post test. Across all clinics, there was improvement in the mean score of each of the 12 items. (Figure 6) The greatest improvements (1.2 pts) were in the areas of organization-wide vision for QI (Q#1) and the degree to which data is used to drive decision-making (Q#11).
San Francisco Quality Culture Series
16
Q #1 Q #2 Q #3 Q #4 Q #5 Q #6 Q #7 Q #8 Q #9 Q #10 Q #11 Q #12 Total
Pre 3 3.1 3.5 3.5 3.2 3.8 3 3.8 2.5 3 3.3 3.3 3.2
Post 4.2 4.1 4.5 4.1 4.1 4.3 3.6 4.5 3.3 3.9 4.5 3.4 4.1
0
0.5
1
1.5
2
2.5
3
3.5
4
4.5
5
Me
an
Sco
re
BCCQ: Clinic Capacity for Quality Assessment - Individual Items
“Prior to SFQCS, we were not collecting or monitoring data in a standardized way. Our SFQCS project, and the training we received from SFQCS and our SFQCS coach, has dramatically enhanced our organization's capacity to collect, analyze, monitor and respond to our data.”
- Clinic Team
Figure 6: Mean of each item from Clinic Capacity for Quality Assessment (N=20, N=21)
In addition to looking at performance in each individual item, this assessment tool provided a “capacity level” for each clinic based on the sum score of all 12 items. Descriptions of the four capacity levels and the sum score they represent are in Table 8. Table 8: Explanation of Clinic Capacity Levels
Level Explanation Score
1 The clinic has no standardized QI program. While the organization may have implemented small scale projects to address specific issues, there is no QI oversight, committee structure or measurement program.
1 - 15
2 The clinic’s efforts are compliance or quality assurance related and focus on providers and peer review. Any existing oversight, committee structure, or measurement strategy focuses on maintaining compliance with regulatory guidelines.
16 - 35
3 QI is embraced by all clinic staff and is somewhat integrated into clinic operations but is limited in scope, for example, to the management of one chronic condition. Measurement is done manually or with limited use of technology.
36 - 55
4 QI permeates the clinic’s vision and operations and includes staff at all levels. The clinic has robust QI oversight, committee structure and measurement systems with specific goals known to all staff. Work of the QI Committee is directly linked to the strategic plans
56 - 72

San Francisco Quality Culture Series
17
Level 1 Level 2 Level 3 Level 4
Pre 0 9 11 1
Post 0 0 17 3
0
2
4
6
8
10
12
14
16
18
# o
f C
lin
ics
BCCQ: Clinic Capacity for Quality Assessment - Capacity Levels
At follow-up, there was also an increase in the number of clinics characterized as level 3 and 4, with no clinics remaining at level 2. (Figure 7)
Figure 7: Capacity Level of Clinics Pre and Post
Overall, a total of 11 clinics moved up at least one level, 8 clinics maintained their level and 1 clinic moved down a level. (Figure 8) The clinic that moved from a 4 to a 3 was going through an EHR rollout during the program period. This impacted their ability to address certain aspects of the capacity assessment as effectively as they were at the start of the program.
Figure 8: Capacity Level Change from Pre to Post
“Instead of planning and planning and planning some more to accommodate and to anticipate every pitfall, we have learned it is ok and even more valuable to just try as is and then make revisions as necessary. Data is now viewed as something positive, something that validates the hard work we are doing.”
- Clinic Team

San Francisco Quality Culture Series
18
90%
71%
33%
57%
19% 33% 33% 29%
52%
0%10%20%30%40%50%60%70%80%90%
100%
Teams Training other Clinic Staff
% of Teams
"....the entire SFQCS was a wonderful experience for the entire team. And I mean the entire team, as the learned lessons have been spread throughout the organization.”
- Executive Director
In the last learning session evaluation and in their final reports, participants were also asked to identify the most important changes in their clinic resulting from their participation in the program. Key themes most frequently referenced were as follows:
Increased staff involvement in QI initiatives including broader use of PDSA cycles. Greater buy-in and motivation for change Enhanced orientation to data and its use in decision-making Improved staff satisfaction
Bringing the Training Home The intent of this program was not only to provide teams with knowledge and skills to make needed changes back at their clinics, but to also encourage and support them in their efforts to train other staff using the learning session content. At the conclusion of the program, each clinic team was asked to indicate what types of trainings they had completed with other clinic staff since the start of the program and to provide detail about how it was delivered. All 21 clinics completed trainings in at least 1 topic area (Range 1-8; Mean 4.3), with the majority of teams having completed trainings in the Model for Improvement, Teamwork, Communication, and Managing Conflict. (Figure9) Figure 9: Clinic Trainings on Learning Session Content
“Our clerical and registration staff have commented that they feel a part of the clinic and the clinic-wide efforts to improve the quality of care for our patients and are applying their experience and expertise to improving our workflows and care.”
- Clinic Team

San Francisco Quality Culture Series
19
0
5
10
15
20
25
30
35
40
45
50
55
60
Baseline Q1 Q2 Q3
Da
ys
Time to Third Next Appointment
All Clinics Average
Highest Performer
Lowest Performer
Quality Improvement Project Metrics
All 21 clinic teams successfully completed their QI projects as defined by the criteria noted earlier. There was variability in terms of project rigor and the degree to which clinics met their project goals. This was due in part to the fact that clinics were encouraged to be ambitious in their goal setting, which sometimes resulted in teams not meeting goals, even though they made significant improvements. Variability in project success was also a result of the ongoing program emphasis on building skills in leadership, management, operations and QI, with the project functioning as “homework” and a way to practice those skills, rather than as an end in itself. Throughout the program, SFQCS leadership continued to emphasize the importance of building the team and skills of the leaders, and advised the teams not to let the demands of the project distract them from building these skills and finding ways of spreading the trainings to their staff. The leadership team felt that this emphasis would ultimately have more lasting impact than that of a single one-year project. Nevertheless, despite a lesser emphasis on project outcomes, there was still a great deal of improvement in key measures across all teams. Results for specific measure outcomes are below. Access and Patient Satisfaction Among teams focusing on access or patient satisfaction, there was improvement in 4 out of 6 measures across all clinics. (Figures 10– 17) These two topic areas were combined since there was overlap in measures used (e.g., cycle time).
Figure 10: Time to Third Next Available (N=5 Clinics)

San Francisco Quality Culture Series
20
0%
10%
20%
30%
40%
50%
60%
70%
80%
90%
100%
Baseline Q1 Q2 Q3
% o
f N
o-S
ho
ws
No Show Rate
All Clinics Average
Highest Performer
Lowest Performer
Figure 11: Time to Third Next Available w/o Outlier (N=4 Clinics)
Figure 12: No show rate (N=5 Clinics)
0
5
10
15
20
25
30
35
40
45
50
55
60
Baseline Q1 Q2 Q3
Time to Third Next Appointment
All Clinics Average
Highest Performer
Lowest Performer

San Francisco Quality Culture Series
21
25
45
65
85
105
125
145
165
185
205
225
245
Baseline Q1 Q2 Q3
Min
ute
s
Cycle Time
All Clinics Average
Highest Performer
Lowest Performer
25
45
65
85
105
125
145
165
185
205
225
245
Baseline Q1 Q2 Q3
Cycle Time Primary Care Clinics
All Clinics Average
Highest Performer
Lowest Performer
Figure 13: Cycle Time (N=4 Clinics) * The lowest performer and outlier above was an urgent care clinic because they reported on cycle time for patients with acute ankle injuries that required triage and sometimes required X-rays or splinting. Primary Care Cycle time below is much shorter.
Figure 14: Cycle Time for Primary Care Clinics Only (N=3 Clinics)

San Francisco Quality Culture Series
22
0%
5%
10%
15%
20%
25%
30%
35%
40%
45%
50%
Baseline Q1 Q2 Q3
% o
f v
isit
s w
/ o
n t
ime
sta
rt
On Time Start
All Clinics Average
50%
55%
60%
65%
70%
75%
80%
85%
90%
95%
100%
Baseline Q1 Q2 Q3
Patient Satisfaction with Clinician
All Clinics Average
Highest Performer
Lowest Performer
Figure 15: On time start (N=1 Clinic) Figure 16: Patient Satisfaction with Clinician (N=1)

San Francisco Quality Culture Series
23
0%
10%
20%
30%
40%
50%
60%
70%
80%
90%
100%
Baseline Q1 Q2 Q3
BMI Entered Electronically
All Clinics Average
Highest Performer
Lowest Performer
50%
55%
60%
65%
70%
75%
80%
85%
90%
95%
100%
Baseline Q1 Q2 Q3
Patient Satisfaction with Clinic
All Clinics Average
Highest Performer
Lowest Performer
Figure 17: Patient Satisfaction with Clinic (N=1) Meaningful Use of EHR All clinics were in pre- implementation of an EHR until August 2011. Thus, measurement was primarily focused on improving electronic documentation in other HIT systems. Among teams focusing on demonstrating meaningful use of EHRs, there was substantial improvement in 4 electronic documentation measures (BMI, blood pressure, smoking and problem list) while other measures, such as documentation of allergies, were near goal at the onset of the project and remained stable throughout the year. (Figures 18 – 21)
Figure 18: Electronic documentation of BMI (N= 4 Clinics)

San Francisco Quality Culture Series
24
0%
10%
20%
30%
40%
50%
60%
70%
80%
90%
100%
Baseline Q1 Q2 Q3
Smoking Status Entered Electronically
All Clinics Average
Highest Performer
Lowest Performer
0%
10%
20%
30%
40%
50%
60%
70%
80%
90%
100%
Baseline Q1 Q2 Q3
Blood Pressure Entered electronically
All Clinics Average
Highest Performer
Lowest Performer
Figure 19: Electronic Documentation of Blood Pressure (N=6 Clinics) Figure 20: Electronic Documentation of Smoking Status (N=6 Clinics)

San Francisco Quality Culture Series
25
Figure 21: Electronic Documentation of Problem List (N=3 Clinics)
Integrated Behavioral Health
The one team that worked on behavioral health measures had operational challenges and was not able to meet their goal of creating a process for a warm hand-off between primary care and behavioral health. This organization was in a unique situation as they do not truly have an outpatient clinic in place; they were invited to SFQCS to build leadership capacity with the goal of having them become a primary care site in the future, once they have the infrastructure in place. Team Reflections on Project In their final reports, clinic teams were asked to reflect on what factors helped and prevented them from making desired improvements in their projects. Key themes most frequently referenced are below. (Table 9) As signified by the arrows, four of the same factors were noted as facilitators and barriers to improvement. This helps underscore the perceived importance of these items and the need for continued reinforcement.
Table 9: Factors that Helped and Prevented Project Improvements
Factors that Helped
Increased buy-in and support across clinic staff
More meetings and protected time Better staffing Leadership Enhanced team functioning & commitment Improved methods for data collection
Factors that Prevented
Lack of buy-in from staff and resistance to change.
Competing priorities Limited staffing Leadership transition Limited resources
0%
10%
20%
30%
40%
50%
60%
70%
80%
90%
100%
Baseline Q1 Q2 Q3
Problem List Electronically
All Clinics Average
Highest Performer
Lowest Performer

San Francisco Quality Culture Series
26
"PDSA has become more of a 'household word' in clinic life."
- Clinic Team
“SFQCS helped our team understand the importance of integrating quality into all aspects of work at our clinic and highlighted the essential role that leadership must play in fostering a quality culture. In addition, the program provided the tools and professional development opportunities required to turn these lessons into action at our own organization. We would not have progressed so far in our quality journey without the support of the San Francisco Quality Culture Series.”
- Quality Improvement Manager
Teams also shared what they felt was the most important concept or skill presented during the learning sessions that they were able to successfully apply to the implementation of their project, as well as what they would do differently to accelerate improvement if they were starting their project over. Key themes most frequently referenced are below. (Table 10) Table 10: Learning Session Content Application & What to Do Different if Starting Over
Application from Learning Session
Content and process for teaching staff How, what, when of PDSAs Communication Project management High functioning teams
What to do Differently
More effort towards training staff Start PDSAs sooner and do them faster Greater involvement of more staff Simplify the aim
Evaluation Summary As noted earlier in this report, when looking at clinic results in aggregate, there was improvement in team functioning, clinic capacity for quality, and employee engagement. Figure 22 demonstrates individual team improvement in those same areas, along-side team performance related to their project. 67% (14) of teams demonstrated improvement in their own team effectiveness and employee engagement scores, and 78% (16) of teams improved in their clinic capacity for quality score. As shown in Figure 22, the “Meaningful Use” teams had better project performance overall compared to teams focusing on one of the three other project topics. This can likely be attributed to several factors - the measures were better defined, the data collection was more immediate and more available (by definition the teams were working on electronic capture of data so they had more data, faster than some other teams that had to collect data manually or wait for a central report) and the behavior change was often simpler because it primarily relied on medical assistant behavior change rather than changes in multiple parts of the clinic (e.g., cycle time or TTNA). As mentioned earlier, teams were encouraged to be ambitious in their goal setting, which contributed to less than optimal results regarding attainment of project measure goals. While only 19% (4) of teams met all of their project goals and 43% (9) teams met at least one goal, the majority of teams saw improvement in at least one key measure, with most of those teams coming very close to meeting at least one goal.

San Francisco Quality Culture Series
27
Figure 22: Crosswalk of clinic performance on program assessments and project measures.
Impro
vem
ent -
Tea
m Fu
nctio
ning
Impro
vem
ent -
Clin
ic Cap
acity
for Q
uality
Impro
vem
ent -
Em
ploye
e Eng
agem
ent
Met
all P
roje
ct G
oals
Met
at l
east
1 P
roje
ct G
oal
Impro
vem
ent i
n all M
easu
res
Impro
vem
ent i
n at L
east 1
Mea
sure
Acc
ess
Clinic # 1 x x x x
Clinic # 2 x x x x x
Clinic # 3 x x
Clinic # 4 x x x
Clinic # 5 x x
Clinic # 6 x x x
Clinic # 7 x x x
Clinic # 8 x x x x
Clinic # 9 x x x
Clinic # 10 x x
Clinic # 11 x x x x
Clinic # 12 x x x x x x x
Clinic # 13 x x x
Clinic # 14 x x x x x x x
Clinic # 15 x x x
Clinic # 16 x x
Clinic # 17 x x x
Clinic # 18 x x x x x x
Clinic # 19 x x x x
Clinic # 20 x x x x x x x
IBH Clinic # 21 x x x x
67% 76% 67% 19% 43% 24% 90%
Acc
ess
Mea
nin
gfu
l Use
PE
Key Lessons Learned The combination of the learning sessions, coaching, and practical application to a quality improvement project was synergistic. While each element by itself was unlikely to have been successful, together they helped spur important changes across safety net clinics. Key programmatic lessons, including suggestions for what to do differently, are as follows:

San Francisco Quality Culture Series
28
Learning Sessions
Never underestimate how much time teams need to work on problems together. Clinics need substantial time to work together as a team including participation in interactive, engaging activities. We tried to abide by the general rule of having no longer than 10 minutes of presentation without having an activity where the team worked together to solve a problem or work through an issue. Even though we were very cognizant of that rule, teams always asked for more structured team time for planning without distractions.
Likewise, teams also found tremendous value and benefit in the opportunity to network with and learn from other clinics and indicated their desire for even more. Opportunities for networking and sharing across clinics should be built into learning sessions as much as possible.
Participants responded well to structure – structured activities, structured homework, reminders, and detailed instruction. This also includes a structure for closing the loop to make sure deliverables are met, of which there should have been more.
The concept of accountability, and associated training tools, should be introduced as early in the program as possible and be continually be reinforced throughout the year.
More emphasis on the “train the trainer” aspect of the program was needed including additional time dedicated during the learning sessions on the “how” of training key concepts and skills. Homework assignments related to training staff including opportunities to report back on experiences at subsequent sessions would have provided more skill building opportunities. The “homework” aspect would also reinforce participants’ accountability to program expectations (i.e. clinic teams training all staff).
There was a lot of feedback about the sequencing of learning session content and a clear desire to have several different topics presented first. Launching the program with a two-day session might help address the need to cover a lot of material up-front. As part of the two-day session, a more comprehensive session on developing a QI plan would also be of benefit.
Coaching
Coaches provided an additional push to clinic teams and were an important component of the program. However, there was a lack of clarity about the coach role and how clinic teams should best utilize their coach. A more comprehensive introduction of coaching at the start of the program, including modeling of a coach/clinic relationship, would have helped encourage clinics to make better use of the coaching resource.
There was also a need for more clarity about the coach role among the coaches themselves, as there was a lot of variability in terms of what they expected from their clinic teams. More structured roles and clear expectations among the coaches would likely have helped them hold their clinic teams more accountable. A kick-off for the coaches would help ensure the coaches were starting on the same page.
Quality Improvement Project
Projects could have been tightened up by decreasing the number of topics and having more clinics working on similar projects. This would have also helped facilitate the process of sharing strategies and lessons learned across clinics.
There would also have been a benefit to having clinics measure things in the same way. Required measures were established but clinic teams were not always held accountable to meeting those requirements leading to slippage in measure standardization. Lastly, defining effective measures was challenging, made even more so by the breadth of projects.

San Francisco Quality Culture Series
29
“SFQCS changed the focus and tone of our medical directors meeting. We no longer have a group of people griping about blaming individuals for chaos. We talk about system fixes to system problems. It has elevated the level of discussion dramatically, and created momentum for system change.”
- Medical Director, SFDPH-COPC
Leadership Structure
The structure for implementing the program was effective. A partnership consisting of a steering committee representing leadership of all involved clinics with leadership authority, a dedicated project manager to pull together all of the details, and a dedicated lead coach to manage the project data, serve as the central contact for coaches and ensure some uniformity of coach expectations, was essential. Establishing the lead coach role earlier in the planning process would have helped clarify expectations among coaches earlier on and provided additional expertise in planning and leading collaboratives.
The relationship of the two medical directors from SFDPH-COPC and SFCCC with their respective clinics was different due to the nature of the organizations they represent. The structure of SFDPH-COPC was such that its medical director had clear authority and built-in communication channels among the SFDPH-COPC clinics, whereas with SFCCC clinics, their medical director did not. This was somewhat of a hindrance for the SFCCC medical director and his ability to effectively maintain by-in and hold SFCCC clinic teams accountable for program deliverables. Setting up an explicit role for the SFCCC medical director that would give him authority over the SFCCC clinics for the purpose of this program only, would have been helpful.
Environment
While the following factors in the environment were largely out of the control of program, they did impact the ability of some teams to make and sustain needed changes in their clinic settings.
For the public sector clinics, the combination of unionization and civil service makes rapid change more difficult. Changes in job descriptions and roles happen slowly with city budgetary requirements contributing to the slowness. Leadership is unable to incentivize based on merit, and in civil service hiring is based on scores and tests rather than cultural fit. This can make the implementation of many of the suggested strategies for improving clinic culture extremely difficult.
Several of the participating clinics were going through EHR implementation during the course of the program year. This process is highly disruptive to clinic operations and is often the one and only priority for clinic leadership, providers, and staff.
Conclusion The year-long San Francisco Quality Culture Series was a transformative experience for clinic leadership teams. The excellent attendance rate, active engagement and program ratings across clinic participants demonstrate the high value they placed on their experience. This perceived value also translated to real changes. Almost all clinics reported improvements in their clinic’s capacity for quality, the majority of teams saw improvements in team effectiveness and engagement, and almost all clinics saw improvement in at least one project measure. In addition, leadership teams continue to bring the content home and report increased engagement and participation in quality improvement activities across clinic staff. People cannot drive quality improvements without being able to manage people, change, and conflict,

San Francisco Quality Culture Series
30
among other leadership, teamwork, and management skills. Thus, the fusion of the learning session content (management training, leadership development, quality improvement basics) with training (train the trainer skills for adult learners) and technical assistance (shoulder-to-shoulder help applying the concepts to the realities of the clinics) was particularly effective. In addition, bringing managers to a common foundation of office skills and management techniques eliminated the validity of excuses such as “I don’t do excel.” There is a clear shift in leadership across the safety net from a “blame-focus” to “systems focus” and teams across clinics have been strengthened by this process. A ripple effect was created that is changing how leaders view and shape their responses to problems. Opportunities for networking and sharing of best practices, and the creation of a leadership structure within a larger organization has led to greater role identification in a larger team of leaders. This experience has fostered a sense of safety net cohesion and unity across clinic teams. Organizations within a small city that once didn’t know about each other now identify as “we are the safety net.”

San Francisco Quality Culture Series
31
Appendices
Appendix A: Detailed Learning Session Agendas
SESSION 1 SETTING THE STAGE January 11, 2011 Time Topic/Session Learning Objectives 8:00am Breakfast &
Registration
8:30am to 9:00am
Welcome, Introductions, & SFQCS Overview
1. Describe the background that led to the development of SFQCS.
2. Explore the vision and investment of the Foundation 3. Describe the program elements and structure 4. Define the goals and expectations of QCS 5. Understand program administration and resources – what’s
available and how to access it 6. Understand the ground rules and group norms for the
sessions. 9:00am to 9:45am
The Health Care Environment / Why We Are Here
1. Describe the health care reform, public health and environmental trends impacting the safety net.
2. Identify your organization’s pain points 3. Have a deeper understanding of why team is participating
9:45 to 10 am Break 10:00 to 12:00 pm
Developing and Building Teams
1. Understand what makes a great team 2. Identify when to use teams 3. Identify the different types of teams and when to use them 4. Understand the stages of team formation and the associated
leadership style you need to use for each one 5. How to run teams effectively – what contributes to effective
teams and what hinders them
12:00 to 1:00 pm
Lunch
1:00 to 2:15pm
Team Time Review Team Development Survey results and debrief with team.
2:15 to 2:30 pm
Break
2:30 to 4:00 pm
Using a Quality Improvement Plan to Organize Your Journey
1. Understand the purpose and primary elements of a QI Plan 2. Consider how to develop key elements of your clinics’ QI
Plan
4:00 to 4:25 pm
QI Projects Overview 1. Understand QI project expectations and timelines 2. Understand the purpose of coaching and coaching guidelines. 3. Introduction to all QI coaches
4:25 to 4:40 pm
Wrap up and expectations for next session/Complete session evaluation
Homework: 1) Think about an improvement project you have done in the
past and come prepared to share it at the next session. 2) Review the MFI 3) Bring draft AIM statement to next session 4) Introduce reading assignment #1 – Getting Things Done
4:40 to 5:00pm
Coaches available for questions

San Francisco Quality Culture Series
32
SESSION 2 THE MODEL FOR IMPROVEMENT February 9, 2011
Time Topic/Session Learning Objectives 8:00 am Breakfast 1) Apply the elements of a change model with rapid
cycle improvement to your SFQCS projects 2) Choose your SFQCS project measures and begin
your data collection plan. 3) Align the aims, measures, and change ideas for
your SFQCS project. 4) Plot and analyze data over time to use it as a guide
when making decisions. 5) Plan your next text of change for your SFQCS
project.
8:30 to 8:45am Welcome and Introductions
8:45 to 9:50 am Experience an
Improvement Model, Focus Your Aim
9:50 to 10:05am Break 10:05 to 10:40 am Aim Statements
10:40 to 12:15 pm Selecting Measures
12:15 to 1:00 pm Lunch
1:00 – 1:15 pm Intersession Reading Assignment
1:15 – 2:30 pm Using Aims and Measures to Plan Your Work
3:15 – 3:30 pm Break 3:30 – 4:10 pm Using Data to Drive
Improvements, Part 2 4:10 – 4:50 pm Small & Fast: How to Get
Started Testing Changes 4:50 to 5:00 pm Wrap-up & Expectations
for Next Session Introduce reading assignment #2 (Death by Meeting) to be discussed at next session

San Francisco Quality Culture Series
33
SESSION 3 PROJECT MANAGEMENT & TEACHING QUALITY IMPROVEMENT March 8, 2011 Time Topic/Session Learning Objectives 8:00 am Breakfast
8:30 to 9:00 am
Welcome and Introductions / Discussion of Reading Assignment #2 (Death by Meeting)
1. Summary of key concepts from reading 2. Team discussion of key concepts
9:00 to 9:30 am Report out
Report out on PDSAs. 2 Tables report out to each other, playing the role of consultant and client getting feedback. Focus on how to give feedback that is engaging.
9:30 to 10:45 am
Project Management
1. Explain project management terminology, procedures, and techniques.
2. Design, develop, and document project plans. 3. Describe the tools of project management. 4. Monitor and track projects to maintain control. 5. Develop ideas to enhance project teamwork.
10:45 to 11:00 am Break
11:00 to 12:30 pm Project Management Con’t
12:30 to 1:15 pm Lunch TABLE TOPICS 1:15 to 3:00 pm
Teaching Quality Improvement
1. Understand the tools leaders have to change the culture of an organization
2. Describe the role of self-efficacy in developing a culture of quality.
3. Review a sample curriculum for teaching QI to your staff, and describe the likely challenges you will encounter.
4. Acquire an understanding of the core principles of adult learning.
5. Practice using some basic techniques that facilitate adult learning.
6. Understand the circumstances when different techniques are most useful.
3:00 – 3:15 pm Break
3:00 to 4:45 pm Teaching Quality Improvement Continued
4:45 to 5:00 pm Wrap-up & expectations for next session
Homework: 1) Introduce reading assignment #3(Three Signs of a Miserable Job) to be discussed at next session.

San Francisco Quality Culture Series
34
SESSION 4 – INFLUENCING OTHERS & CHANGE MANAGEMENT April 13, 2011 Time Topic/Session Learning Objectives 8:00 Breakfast 8:30 to 9:00am Welcome / Discussion of
Reading Assignment #3 (Three Signs of a Miserable Job)/ Ice Breaker
1. Summary of key concepts from reading 2. Team discussion of key concepts
9:00 to 11:30 am Effective Communication 1. List the core elements of effective communication and difficult conversations
2. Identify personal communication strengths and development needs
3. Develop a plan to apply today's learning to their immediate work
11:30 to 12:15 pm Lunch 12:15 to 2:30pm Talent Management:
Working With and Through Others
1. Learn how to best motivate and develop others 2. Learning to apply Situational Leadership model 3. Properly delegate tasks to others 4. Gain support for your work and be more successful
influencing others
2:30 to 2:45pm Break 2:45 to 4:15pm Managing and Leading
Change 1. Understand the role of the leadership in organizational change 2. Use three frameworks for understanding how people respond to change 3. Understand the key management roles/responsibilities in the Change Management process.
4:15 to 4:30 pm Wrap-up & expectations for next session
Homework: 1) Introduce reading assignment #4(WHO – The A Method for Hiring) to be discussed at next session. 2) Pre-reading for May 10 operations management session.

San Francisco Quality Culture Series
35
SESSION 5 OPERATIONS MANAGEMENT & SUSTAINABILITY and RELIABILITY May 10, 2011 Time Topic/Session Learning Objectives 8:00 am Breakfast 8:30 to 8:45 am Welcome & Introductions Discussion of reading assignment #4 - WHO 8:45 to 1:00 pm Fundamentals of
Operations Management for Healthcare Organizations
1. Understand operations management and its benefits 2. Describe the essential elements for effective operational
planning 3. Apply the steps for operational planning to your own
setting
1:00 to 2:00 pm Lunch 2:00 to 3:00 pm Team Time / Application
of Operations Session
3:00 to 3:15 pm Break 3:15 to 4:45 pm Sustainability &
Reliability 1. Understand ways to hold gains for your improvement work 2. Plan your activities as a team to sustain what you’ve
successfully built
4:45 to 5:00 pm Wrap-up & Expectations for next session
Homework: Participants will be asked to complete template summarizing progress on project thus far to share at next learning session.
SESSION 6 BUSINESS CASE for CHANGE & FEEDBACK and DECISION MAKING June 8, 2011 Time Topic/Session Learning Objectives 8:00 am Breakfast 8:30 to 8:45 am Welcome & Introductions 8:45 to 9:45 am Speed Sharing Activity
9:45 – 10:00 am Break 10:00 to 12:30 pm
Business Case for Change
1. Understand the process for creating change. 2. Develop tools for effective communication. 3. Learn how to create a financial model for new services,
programs, staff. 4. Practice going from idea to action plan.
12:30 to 1:45 pm Working Lunch Teams display quarter report storyboards – scavenger hunt activity.
1:45 to 2:45 pm Giving and Receiving Feedback
1. Learn how to properly give feedback – both positive and constructive
2. Identify when NOT to give feedback 3. Enhance ability to accept feedback and put it to good use
2:45 to 3:00pm Break
3:00 to 4:45 pm Decision Making
1. Identify different types of decisions 2. Recognize which decision making method is most
appropriate to employ. 4:45 to 5:00 pm Wrap-up & expectations
session Introduce reading assignment #5 (5 Dysfunctions of a Team) to be discussed at next session

San Francisco Quality Culture Series
36
SESSION 7 HIGH PERFORMING TEAMS July 12, 2011 Time Topic/Session Learning Objectives 8:00 am Breakfast 8:30 to 8:45 am Welcome 8:45 to 9:45 am Quantitative Speed
Sharing Activity
9:45 to 10:00 am Break 10:00 to 12:00pm High Performing Teams
& Emotional Intelligence 1. Identify the challenges your team faces 2. Understand ways to take your team performance to the
next level 3. Employ the concept of EI to yourself and to your team
12:00 to 1:00 pm Lunch 1:00 to 2:30 pm Reflection on Behavior
Changes 1. Utilize the rich SFQCS content, 2. Execute behavior changes resulting from SFQCS learnings. 3. Quantify what team’s have accomplished, and 4. Plan how teams can continue to do behaviors they do well
and those they want to see done more often.
2:30 to 2:45 pm Break
2:45 to 4:45pm Managing Conflict 1. Identify the sources of conflict in your environment 2. Understand how conflict can be positive as well as
destructive 3. Recognize the 5 styles of conflict management 4. Understand when to use each one for maximum results
4:45 to 5:00 pm Wrap-up and expectations for next session
Overview of project presentations to be delivered at next session.

San Francisco Quality Culture Series
37
SESSION 8 TEACHING QI II, SPREAD and SUSTAINABILITY, & CELEBRATING SUCCESSES September 14, 2011 Time Topic/Session Learning Objectives 8:00 am Breakfast 8:30 to 8:45 am Welcome 8:45 to 9:00 am Ice Breaker 9:00 to 10:35 am Teaching QI/ Developing
a QI Training Plan 1. Build a QI curriculum for 2011/2012 using SFQCS
material 2. List steps needed to develop and execute training for
their staff 10:35 to 10:55 am Quarterly Report
Summary
10:55to 11:05 am Break 11:05 to 11:45 am Poster Session Scavenger hunt by team. Identify at least 2 things you want to
steal. Write them down and be prepared to share. 11:45 to 12:30 pm Lunch 12:30 to 1:30 pm Sharing activity
1. Each team stands up and commits to doing 1 thing in the
next 6 months (can come from scavenger hunt). Each team gets 30 seconds (20 min: 12:30 – 12:50)
2. Team dyads – answer the what, when, how, and who. Give team permission to be critical, give constructive criticism. (Provide teams with commitment template) (20 min: 10 min each team; 12:50 – 1:10)
3. Accountabilibuddy pair-up (20 min; 1:10 – 1:30)
1:30 to 1:45 pm Break 1:45 to 3:30 pm Spread & Sustainability 1. Apply spread theory to management work of
implementing key changes across clinic staff and providers
2. Measure the spread of better practices in your clinic 3. Implement best practices to maintain improvement after
a concerted effort to make specific changes.
3:30 to 3:45 pm Break
3:45 to 4:00 pm Overview of remaining evaluation activities & deliverables
4:00 to 5:00 pm Graduation/Celebration and Closing

San Francisco Quality Culture Series
38
Appendix B: Measure Set Document
MEANINGFUL USE Readiness Criteria: All are Required 1. Project Management:
Project Charter Developed and Implemented a. Aim established b. Measures chosen c. Roles/responsibilities defined/assigned d. High level timeline developed e. Communication plan defined and implemented f. Risks and risk mitigation strategies identified
2. Project Management Structures defined and Implemented a. Meetings scheduled at least twice a month b. Issue management process in place c. Decision making processes defined
3. Technology/Data Skills Readiness Assessments Plan in place to address gaps in skills, capacity, resources and processes.
Milestones and Measures: Reporting on at least 3 Measures or Milestones Required
1. Electronic documentation for 4 or more of the following: a. Allergies b. BP c. Weight d. Height e. BMI 5 f. As indicated by age/gender:
o Smoking o Pap o Mammogram o Colon cancer screening
g. Problem List (highly recommended!) Numerator: All of the patients who have the indicated screen.
Denominator: All active patients who should have the indicated screening (i.e. all patients for Allergies, Ht. Wt., BMI and Problem List, women eligible for mammogram etc.). Run the report on the last day of the month.
2. Data Abstraction Plan Created
Milestone: Plan to include: a. Data elements by patient type (adult, pediatric, diabetic, etc.) that need to be entered into the EHR at start up b. Method for data entry for each element (manual, electronic conversion and mapping) c. Process map/workflow analysis for manual entry of information on complicated patients (how will charts be
selected to abstract before go live, who will do it, when will they do it etc.). d. Identification of information to be scanned, both before go-live and on an ongoing basis. e. Plan for ongoing data abstraction after go live.
5 Proposed UDS Requirements BMI
Age 2-17, weight assessment (BMI recorded) and diet and physical activity counseling. Age 18+ BMI recorded and if underweight or overweight, a follow-up plan documented.

San Francisco Quality Culture Series
39
3. Develop Workflows for 3 Alerts / Clinical Decision Support Milestone: Clinical guidelines in place that will alert staff when a screening test is due for HCM or a test or referral for chronic illness care. Possible examples include: a. Flu shot (for most patients ) b. Pap smear every 2 years for women 21-65 etc. c. Workflow analysis will include
o Who will look at the alerts (clinicians or nursing staff)? o Are there standing orders for MA/MEA or nurse to execute on the alerts? o What is the policy/procedure for unfulfilled alerts or bypassing alerts?
4. Develop Workflow for Medication Reconciliation Milestone: Includes decisions about: a. When Medication Reconciliation will occur b. Who will do the reconciliation c. Clinician involvement etc. d. Necessary tools developed. e. Necessary training developed
5. Computerized Provider Order Entry (CPOE) Rx Percent permissible prescriptions written that are transmitted electronically using certified EHR technology (>40%)
Numerator: All prescriptions transmitted electronically
Denominator: All non-narcotic prescriptions. Run the report on the last day of the month.
6. Chart Abstraction6 % of Active Patient Charts Abstracted
Numerator: Charts completely abstracted according to clinic definition
Denominator: All patients who meet the clinic’s definition of active patients. Run the report on the last day of the month.
7. Medication List7
Numerator: The number of patients who have a medication (or indication that the patient is not currently taking any) recorded as structured data. Meaningful Use guidelines are at least 80%.
Denominator: The number of unique patients seen by the provider during the month.
8. Smoking Status8
Numerator: Percent with smoking status documented in electronic chart
Denominator: Number of active patients 13 (or 18) years old or older. Run the report on the last day of the month.
6 If clinics choose to measure chart abstraction, need to decide if it makes more sense to do number of charts abstracted rather than a rate. 7 If clinic chooses to measure Medication List or Medication Reconciliation they will need to create specifications that match their data collection capabilities. 8 Proposed UDS 2011 Requirement Tobacco Age 18+ : Queried about tobacco use in previous 23 months (age may change to 13+). All users receive “cessation intervention” (advised to quit). Documented.

San Francisco Quality Culture Series
40
ACCESS Readiness Criteria: All are Required 1. Project Management:
Project Charter Developed and Implemented a. Aim established b. Measures chosen c. Roles/responsibilities defined/assigned d. High level timeline developed e. Communication plan defined and implemented
2. Project Management Structures defined and Implemented a. Meetings scheduled at least twice a month b. Issue management process in place c. Decision making processes defined
3. Empanelment policies in place
Milestones and Measures: Reporting on first two measures is Required
1. EMPANELMENT Percentage of patients with identified PCP in practice management system
Numerator: All patients with an identified PCP
Denominator: All patients assigned to the clinic 2. THIRD NEXT AVAILABLE APPOINTMENT
Number of days patients wait for a primary care provider appointment
Specs: On a set measurement day each week, count the number of days between now and the third next available regular return appointment for each individual provider. Do not count “same-day” or “OA” or other special reserved appointment slots that are blocked out in advance. QCS Improvement Advisors recommend you count calendar days instead of business days when counting TNAA. Whichever way you measure, please note your measurement clearly and be consistent week to week
Optional Milestones and Measures:
3. SHOW RATE Percentage of patients who keep their scheduled appointment
Numerator: Total number of appointments kept by patients in the month that just ended. Exclude cancellations that happen 24 hours or more in advance. Denominator: Total number of scheduled patients, excluding walk-ins, in the month that just ended.
4. PANEL SIZE Percentage measure: current panel size compared to total clinic capacity
Numerator: Total number of patients assigned to the clinic
Denominator: Total panel capacity for the clinic, based on total provider FTE
5. CONTINUITY Percentage of patient visits where patients see their own primary care provider
Numerator: For each provider, the number of visits that quarter by his or her panel patients to him/her during the three months in the quarter (instead of to some other provider). Denominator: For each provider, the total number of primary care visits to the clinic or practice by his or her panel patients in the three months of the quarter (where any provider was seen).
6. DAILY DEMAND Specs: Count the number of new appointments generated in a day, from patients calling in and walking in (external demand) and from follow-ups scheduled as patients leave that day’s appointment (internal demand).

San Francisco Quality Culture Series
41
7. DAILY SUPPLY Specs: Count the total number of appointments available (both filled and unfilled) each day for each provider.
(Total all providers’ supply to see the daily supply for the whole clinic, and total for all days that the clinic is open to see supply for the week.)
8. DAILY ACTIVITY Specs: Count the number of appointments that occurred for each provider in the day (as opposed to how many were supposed to occur).
9. CYCLE TIME Time in minutes from check in to check out. If a patient arrives early for their appointment, time starts at their scheduled appointment time.
Specs: Data Collection Method: Measure the cycle time for 15 random patients on your clinic’s busiest day of the week. (Start early enough in the day so you are guaranteed to get cycle time for 15 patients.) Start out measuring every week. Each time you measure, use the same day and start time.
Note: Busiest days and start times may be different for different clinics-within-the-clinic. For example, Mondays at 10 a.m. for your adult clinic, but Wednesdays at 2 p.m. for your pediatric clinic.
PATIENT EXPERIENCE Readiness Criteria: All are Required 1. Project Management:
Project Charter Developed and Implemented a. Aim established b. Measures chosen c. Roles/responsibilities defined/assigned d. High level timeline developed e. Communication plan defined and implemented
2. Project Management Structures defined and Implemented a. Meetings scheduled at least twice a month b. Issue management process in place c. Decision making processes defined
Milestones and Measures: Reporting on at least the first 7 of the following CAHPS questions Required
1. How well did provider X listen carefully to you? 2. How well did provider X give you easy-to-understand instructions about taking care of your health problems or
concerns 3. The extent to which provider X involved you in decisions about your care
Numerator: Report what % of those surveyed responded Very Good or Excellent
Denominator: Monthly sample of a minimum of 30 patients using Provider interaction questions from CAHPS
4. How often did you get an appointment as soon as you thought you needed? 5. How often did you see this doctor within 15 minutes of your appointment
Numerator: Report what % of those surveyed responded Usually or Always
Denominator: Monthly sample of a minimum of 30 patients using Provider interaction questions from CAHPS 6. Global Rating of the Experience
How well were needs met in this visit Specs: Report what % of those surveyed responded Very Good or Excellent
7. Provider Rating 0 to 10 Specs: Report what % of those surveyed gave a 8, 9 or 10

San Francisco Quality Culture Series
42
Optional Questions9
8. The extent to which provider X spent enough time with you 9. How familiar provider X was with your medical history
Numerator: Report what % of those surveyed gave a Very Good or Excellent
Denominator: Monthly sample of a minimum of 30 patients using Provider interaction questions from CAHPS
INTEGRATED BEHAVIORAL HEALTH Readiness Criteria: All are Required 1. Project Management:
Project Charter Developed and Implemented a. Aim established b. Measures chosen c. Roles/responsibilities defined/assigned d. High level timeline developed e. Communication plan defined and implemented
2. Project Management Structures defined and Implemented a. Meetings scheduled at least twice a month b. Issue management process in place c. Decision making processes defined
Milestones and Measures: Reporting on a minimum of 2 Measures of Milestones is Required
1. Communication Milestone: Communication Policies between Primary care and Behavioral Health developed to include referrals, responses to referrals, care plan etc.
2. Warm Handoff10
Milestone: Policies and Procedures developed for same day “Warm Handoffs” between Primary Care and
Behavioral Health.
3. Documentation Milestone: Policies and Procedures developed for documentation sharing and internal access to records.
4. Scheduling for Behavioral Health
Milestone: Policies and Procedures developed for scheduling Behavioral Health staff. 5. Number of Patients Visits Completed by the Behavioral Health professional
Specs: Last day of the month run a report of Number of patient visits completed by the Behavioral Health professional
6. Warm Handoffs to Behavioral Health
Specs: Last day of the month run a report of Number of Warm Handoffs from Primary care to Behavioral Health
9 Supplemental measures: https://www.cahps.ahrq.gov/cahpskit/CG/CGChooseQx4P.asp
10
Warm Hand off defined as same day Behavioral Health visit without prior appointment; by request of Primary Care staff who
communicate the issues to Behavioral Health staff preferably in the presence of the patient.

San Francisco Quality Culture Series
43
7. Show Rate BH Percentage of patients who keep their scheduled appointment
Numerator: Total number of appointments kept by patients in the month that just ended. Exclude cancellations that happen 24 hours or more in advance.
Denominator: Total number of scheduled patients, excluding walk-ins, in the month that just ended.
8. Echo Survey 11
Numerator: Responding “Usually” or “Always” to selected questions from the ECHO Survey.
Denominator: Monthly sample of a minimum of 30 patients
11
ECHO Survey for Adults
https://www.cahps.ahrq.gov/cahpskit/files/251a_ECHO_mco_v3_eng_ad.pdf
ECHO Survey for Children
https://www.cahps.ahrq.gov/cahpskit/files/254_ECHO_mco_v3_eng_child.pdf

San Francisco Quality Culture Series
44
Appendix C: BCCQ Clinic Capacity for Quality Assessment*
Elements Not Yet Prepared
1……………..2
Moderately Prepared
3……………..4
Highly Prepared
5………………..6
Score
(1 – 6)
1
Organization-
wide vision for
quality
improvement…
has not been translated
into specific goals and
strategies. Current QI
work is driven by
individual clinicians
and/or external factors
such as funding
opportunities and
compliance
requirements.
is being incorporated
into a program reflecting
the organization’s short-
and long term strategy,
targeted at improving
specific, limited clinical
measures and patient
satisfaction.
is incorporated into the
organization’s short and
long-term strategy,
informing a program with
measurable objectives tied
to clinical outcomes, and
patient satisfaction.
2
Strategic
planning and
implementation
of quality
improvement,
population
health
management
and workflow
efficiency
initiatives…
is limited to executive
discussion around a
specific event, project,
or timeframe. A formal
plan may exist, but may
not be updated on a
periodic basis.
are driven by a
department or specific
individuals, but is not a
pervasive focus. Efforts
may be specific to one
department or target
population, using data to
inform clinical,
operational, and
financial objectives.
permeate all aspects of the
organization. QI planning
involves buy-in across
departments, long-term
financial planning and
resource assessment, and
accountability tied to
incentives.
3
QI initiatives
(workflow
efficiencies,
population-
based analysis
and clinical
process
interventions)
and chronic care
coordination are
managed…
on an ad hoc basis;
physicians decide which
best practices to
incorporate into their
daily work at their
discretion.
by individuals with
appropriate training;
physicians share best
practices with peers and
let each individual
decide what to include.
Decisions made on a
patient-by-patient basis.
by an integrated team
where QI initiatives and
chronic care is coordinated
across departments,
patients, information
systems, etc. Team meets
regularly.
4
Current
management
reports show
organizational
performance…
only, with no
benchmark comparisons
and no trending over
time.
compared with results
from external data
sources, but reports are
focused in one
area/topic.
compared with statistical
norms from external
benchmarking data,
including dashboard
indicators and trended data
over months, quarters
and/or years.
5
Staff appreciate
the importance
of data and
information
flow in the
patient care
process by
showing an
understanding of
…
the general idea, but
have not been formally
educated on their role in
relation to data and
information flow.
their role in the patient
care process, but have
not been educated about
the importance of data
and information flow.
end-to-end data and
information flow and their
role in the patient care
process.

San Francisco Quality Culture Series
45
Elements Not Yet Prepared
1……………..2
Moderately Prepared
3……………..4
Highly Prepared
5………………..6
Score
(1 – 6)
6
Clinician
involvement in
QI programs
consists of...
one clinician advocate
who drives QI initiatives
across the organization;
rarely engages
physicians in efficiency
and quality initiatives.
one clinician/provider
who engages other
clinicians in QI
activities.
Accountability
for/management of
specific patient
populations is not
necessarily enforced.
providers across all levels
communicating the value
of, and engaging other
providers in, improving
care for patients, ensuring
team accountability, and
using data for point of care-
decision making.
7
Patients are
involved in their
chronic care
treatment...
through receipt of
patient educational
materials.
through assessment and
self-management goals
that are documented in a
standardized manner.
through regular assessments
provided with treatment
plans monitored by
clinicians and tracked
within an information
system. Behavior change is
supported through training
and clinical educators.
Services such as peer
support are available
through the clinic.
8
Best practices
and standards
for QI...
are gathered from
attendance at
conferences, learning
collaboratives, or
educational sessions.
are developed by a QI
lead and validated
through attendance at
clinical care and data-
related meetings, such
as consortium/network
or medical director
gatherings.
are developed by a cross-
organizational team, based
on industry-accepted
measures. Clinic executives
lead discussions of best
practices or trends with
community and peer
meetings, e.g., gatherings
with consortium/network,
medical directors or health
information technology
executives.
9
Training plans
involving QI
processes and
staff
understanding of
these processes
…
involve on-the-job
technology training for
clinical and admin staff
as needed, e.g., in
conjunction with a new
system implementation.
Staff is familiar with
these
processes/principles.
are being developed or
are part of orientation,
acknowledging the
current use of
technology and skill-set
gaps of clinicians and
key staff. Periodic audits
of data are used to
inform training needs.
are part of all staff's
orientation. Training
acknowledges the current
use of technology and
addresses skill-set gaps
across the organization.
Staff are empowered to
offer innovations to make
process flow
improvements.
10
Data elements
necessary to
manage chronic
care such as
patient
demographics,
wait times,
populations,
diagnoses, lab
results and
problems...
reside in separate silos
and are not clearly
identifiable or are
manually collected.
Relationship between
data fields and elements
necessary for clinicians
to track is unclear.
are identified and
tracked using both paper
and information systems
(e.g., PMS). Linking
data across systems
requires manual effort.
Error checking and data
validation instill in staff
a moderate level of
confidence in the
accuracy of reports.
are clearly identifiable,
accessible across systems
and integrated together to
inform management, guide
treatment plans, identify
problems and track patient
progress. Error checking
and data validation instill in
staff a high level of
confidence in the accuracy
of reports.

San Francisco Quality Culture Series
46
Elements Not Yet Prepared
1……………..2
Moderately Prepared
3……………..4
Highly Prepared
5………………..6
Score
(1 – 6)
11
Relative to
decision-
making, data is
…
not used regularly to
prevent or solve
problems.
viewed as one
component of decision-
making, but is not
viewed as a preventative
tool.
a key part of the
management mindset and
viewed as critical to
preventing problems,
improving efficiencies and
care delivery.
12
UDS, OSHPD
and other
reporting
requirements
are…
produced manually.
Only federally or state
mandated reports are
produced in accordance
with required timelines.
partially produced by
mining data from
current information
systems on a scheduled
basis (annually to
quarterly).
produced by mining data
from current information
systems on a scheduled
basis (quarterly to
monthly).
The original BCCQ Clinic Capacity for Quality Assessment Tool was created by Community Partners in July 2010 for the Building Clinic Capacity for Quality (BCCQ) Program, adapting the language from the following resources: the Building Clinic Capacity for Quality Phase I Assessment, Assessing Chronic Illness Care Survey v. 3.5, Quality Culture Series Health Center Culture Of Quality Assessment, Tools for Quality Program Community Clinic CDMS Adoption Self-Assessment, and the Doctor’s Office Quality – Information Tech EHR Readiness Assessment The BCCQ Project is sponsored by Blue Shield of California Foundation, Kaiser Permanente, L.A. Care Health Plan, and UniHealth Foundation.
*

CAMPBELL-HALLAM™ TEAM DEVELOPMENT SURVEY (TDS™) RESULTS
2010 43 48 39 43 49 54 50 50 53 51 52 51 51 49 52 54 53 52 49
2011 44 53 41 47 52 56 55 54 55 53 55 56 54 52 54 55 53 55 54
TIM
E A
ND
ST
AF
FIN
G
We
hav
e en
ou
gh
tim
e an
d p
eop
le
INF
OR
MA
TIO
N
We
get
th
e in
form
atio
n w
e n
eed
MA
TE
RIA
L R
ES
OU
RC
ES
We
hav
e th
e ri
gh
t to
ols
an
d s
pac
e
OR
GA
NIZ
AT
ION
AL
SU
PP
OR
T
Ou
r o
rgan
izat
ion
su
pp
ort
s u
s
SK
ILL
S
We
are
skil
led
CO
MM
ITM
EN
T
We
wo
rk h
ard
MIS
SIO
N C
LA
RIT
Y
Ou
r p
urp
ose
is
clea
r
TE
AM
CO
OR
DIN
AT
ION
We
are
org
aniz
ed a
nd
eff
icie
nt
TE
AM
UN
ITY
We
wo
rk t
og
eth
er i
n h
arm
on
y
IND
IVID
UA
L G
OA
LS
I h
ave
clea
r g
oal
s
EM
PO
WE
RM
EN
T
We
are
tru
sted
an
d s
up
po
rted
TE
AM
AS
SE
SS
ME
NT
We
seek
way
s to
im
pro
ve
the
team
INN
OV
AT
ION
We
try
new
an
d c
reat
ive
app
roac
hes
FE
ED
BA
CK
We
lear
n h
ow
we
are
do
ing
RE
WA
RD
S
I am
rew
ard
ed f
or
do
ing
wel
l
LE
AD
ER
SH
IP
We
hav
e ef
fect
ive
lead
ersh
ip
SA
TIS
FA
CT
ION
I li
ke
bei
ng
on
th
is t
eam
PE
RF
OR
MA
NC
E
We
are
per
form
ing
wel
l
OV
ER
AL
L I
ND
EX
HISTORICAL COMPARISON FOR: Center for Health Professions - Group
© 1992, 1994, DAVID P. CAMPBELL, PhD. All rights reserved.
This form, and its contents, may not be duplicated in any manner without written permission from the publisher.
Published by VANGENT, INC., 4250 N. Fairfax Drive, Suite 1200, Arlington, VA 22203.
The Campbell-Hallam Team Development Survey instrument is one of the Campbell Development Surveys by David P. Campbell, PhD.
"Campbell-Hallam Team Development Survey," "TDS," and "Campbell Development Surveys" are trademarks owned by David P. Campbell, PhD.
Very High
STA
ND
AR
D S
CO
RE
RESOURCESKey Elements of Success
EFFICIENCYUsing Resources Well
IMPROVEMENTLearning, Growing, Staying Healthy
SUCCESSSatisfaction & Performance
High
Mid-Range
Low
Very Low
Survey Version: ET1.1193
35
40
45
50
55
60
65
2010 2011