Final Report Research Methods, Group 4
22
1 BKM07GM Research Methods Rotterdam School of Management, Erasmus University December 2013 Group 04 Lianka Bruijnen 401057 Pauline Joris 401264 Péter Káplár 402848 Pedro Luis Barrera Albarello 400503 Homeowners’ Willingness to Switch from Fixed Energy Tariffs to Real-Time Tariffs in the Netherlands Abstract Real time energy tariffs, which take into consideration the fluctuating costs and energy supply that occur throughout the day and adjust the tariff accordingly, are attributed to have several benefits, including the incentive to shift usage to off-peak times, thus leveling off demand and increasing system capacity, which leads to increased grid stability. This report aims to define the factors that influence people’s willingness to switch to real time tariffs. It studies the relation between attitude towards renewable energy, flexibility and subjective norms, and the willingness to switch to real time tariffs, while taking into account the place of birth and place of residence. Several interviews were done in a qualitative research and a survey was conducted among homeowners (N=43) in the Netherlands. A model was generated based upon a literature review and the interviews. A quantitative analysis was set up to test these hypotheses. The findings confirm a relation between flexibility and willingness to switch to real time tariffs, and between subjective norms and the willingness to switch to real time tariffs, and the latter relationship is influenced by other variables. Attitude towards renewable energy was not found to be related to willingness to switch in the total sample, however, it seems to be moderated by respondents’ place of residence. Keywords: real time tariffs, renewable energy, willingness to switch, attitude, flexibility, subjective norms, Netherlands
-
Upload
pedro-luis-barrera-albarello -
Category
Documents
-
view
216 -
download
2
description
Research methods
Transcript of Final Report Research Methods, Group 4

1
BKM07GM Research Methods
Rotterdam School of Management, Erasmus University
December 2013
Group 04
Lianka Bruijnen 401057
Pauline Joris 401264
Péter Káplár 402848
Pedro Luis Barrera Albarello 400503
Homeowners’ Willingness to Switch from Fixed Energy Tariffs to Real-Time Tariffs in the Netherlands
Abstract
Real time energy tariffs, which take into consideration the fluctuating costs and energy supply that occur throughout the day and adjust the tariff accordingly, are attributed to have several benefits, including the incentive to shift usage to off-peak times, thus leveling off demand and increasing system capacity, which leads to increased grid stability. This report aims to define the factors that influence people’s willingness to switch to real time tariffs. It studies the relation between attitude towards renewable energy, flexibility and subjective norms, and the willingness to switch to real time tariffs, while taking into account the place of birth and place of residence. Several interviews were done in a qualitative research and a survey was conducted among homeowners (N=43) in the Netherlands. A model was generated based upon a literature review and the interviews. A quantitative analysis was set up to test these hypotheses. The findings confirm a relation between flexibility and willingness to switch to real time tariffs, and between subjective norms and the willingness to switch to real time tariffs, and the latter relationship is influenced by other variables. Attitude towards renewable energy was not found to be related to willingness to switch in the total sample, however, it seems to be moderated by respondents’ place of residence.
Keywords: real time tariffs, renewable energy, willingness to switch, attitude, flexibility, subjective norms, Netherlands

2
INTRODUCTION
Widespread is the view amongst
economists that a number of problems of
economic nature, such as reduced
efficiency, undue cross-subsidization, and
the bargaining power of wholesale energy
suppliers stem in the energy industry from
flat pricing, which is the way the majority of
retail energy consumers pay their bills for
energy usage (Borenstein, 2012; Popov,
2012). Primarily, flat tariffs cannot meet
two out of the four general goals of any
tariff design (revenue adequacy, efficiency,
stability, and avoiding undue cross-
subsidization), because consumers are
shielded from the fluctuations in wholesale
prices, and such insulation results in prices
that can diverge considerably from
efficient levels and leads to substantial
cross subsidies (Borenstein, 2012; Popov,
2012).1,2 Further, time-insensitive flat
tariffs do not create incentives for retail
users to respond to short term energy
imbalances, but, on the other hand,
suppliers must meet the demand needs at
all costs, which gives remarkable
bargaining power to wholesale energy
suppliers (Borenstein, 2012; Popov, 2012).
The growing use of renewable energy puts
another kind of pressure on energy
providers. As Popov (2012) explains, the
1 As Borenstein (2012:7) explains, “flat rate tariffs
result in a form of inter-household group pooling of
revenue responsibility. Just as with insurance,
however, all customers do not necessarily impose the
same average costs on the system. If rates do not
recognize these differences it results in cross-
subsidies and inefficient incentives.” 2 Cross-subsidies exist between those who consume
at peak, or in high-cost locations, or in a period in
output of renewable energy generators is
intermittent and highly dependent on
weather conditions. As it is very costly to
store energy, a large share of renewable
energy sources, without the adjustment of
energy demand, may endanger grid
stability and jeopardize the smooth supply,
making it a very difficult and expensive
challenge for the supply side to meet real
time demand.
To solve these problems, it seems
inevitable to involve the demand side of
the market (Popov, 2012). This can be
possible by introducing different types of
energy tariffs3 (Verhagen, 2012), of which
we now focus on real time tariffs. While flat
rate tariff can be conceived as consumers
paying a risk premium to be protected
against the real fluctuating cost of
consuming electricity, in the case of real
time tariffs this risk premium is eliminated
and consumers are exposed to price
fluctuation. Real time tariffs are attributed
to have several benefits, including the
incentive to shift usage to off-peak times,
thus leveling off demand and increasing
system capacity, which leads to increased
grid stability and lowers the need for
investment in reserve generation capacity.
Further, they offer the possibility to save
which retail prices are not adequate to cover
wholesale costs, versus those who consume off-
peak, or in low-cost locations, or in a period in which
retail prices are set above costs to make up for
previous shortfalls. (Borenstein, 2012) 3 E.g. time of use rate, critical peak pricing, real time
pricing day ahead rate, real time pricing real time
rate, etc.

3
on electricity consumption4. (Borenstein,
2012; Popov, 2012) However, drawbacks of
real-time tariffs – the risk that the
electricity bill may fluctuate more, and that
more cognitive efforts are needed to
handle the changing prices – make it
particularly challenging for energy
providers to promote it (Popov, 2012,
Verhagen, 2012) The focus of attention in
this report therefore is on what factors
drive homeowners’ willingness to switch
from fixed energy tariffs to real time tariffs.
PROPOSED MODEL
Research background Previous research on
the topic of willingness to switch to real
time tariffs such as Popov (2012) examined
the influence of regulatory focus, need for
cognition, risk taking attitude, and attitude
towards renewable energy. Popov (2012)
found that people with a positive attitude
towards renewable energy have a
significantly higher
preference for the
choice of green energy
tariffs. Ajzen’s theory of
planned behaviour
(2006) on the other hand
showed perceived
control and subjective
norms are also
influencing willingness
to switch from flat tariffs
to real time tariffs. Both
conclusions have been
4 Other benefits include the integration of
intermittent energy generation resources, such as
wind or solar power, and the potential improvement
taken into account while generating the
model.
Interviews The interviews conducted in the
qualitative part of this research have been
partly in line with previously stated
variables and have pointed out other
examples of influential factors that lead to
people’s willingness to switch to real time
tariffs. For example in the interviews the
notion that people adjust their behaviour
to the attitude within social groups that
people relate to, such as family and friends
was backed up. This is referred to as
subjective norms, as found by Ajzen.
Furthermore it was perceived that in the
case of real time tariffs, flexibility in daily
routines could affect people’s willingness
to switch to real time tariffs since they are
time constrained. From the interviews it
became clear that moderators such as
place of residence, which would be either
in the city or the countryside, can also be of
in the cost-effectiveness of electric vehicles.
(Borenstein, 2012) Figure 1 : Model

4
influence on the attitude and flexibility This
is mainly because governmental
regulations on for example separating
trash can differ and are less strict in cities
than in the countryside. Place of birth on
the other hand influences subjective norms
as it is culturally related.
Proposed Model and Hypotheses The
model takes into account the most
important variables that impact one’s
willingness to switch to real time tariffs.
The model consists of 3 explanatory
variables, 2 interacting variables and the
dependent variable: willingness to switch
from fixed tariffs to real time tariffs. The
explanatory variables are: Attitude towards
renewable energy, Subjective norms and
Flexibility. In the model (Figure 1), all
explanatory variables are assumed to
positively influence the dependent
variable.
The first variable taken into account is the
attitude towards renewable energy. Based
on Popov (2012), who found that a positive
attitude towards the environment
positively influenced the willingness to
switch to real time tariffs, in the model it is
assumed that:
H1: A positive attitude towards renewable
energy will increase the willingness to
switch to real time tariffs.
The nature of real time tariffs requires that
flexibility is included in the model. Fixed
tariffs do not influence the time of use of
electricity, but as soon as the price of
energy consumption is time dependent,
people will be required to take more
consideration in their scheduling of
different activities. The interviews
suggested that limited flexibility can
decrease people’s willingness to switch to
real time tariffs because it is not possible
for them to change daily routines to
cheaper time periods and thus their
electricity bill would increase.
H2: Flexibility in daily routines is positively
related to the willingness to switch to real
time tariffs.
The third relation in the model is based on
Ajzen’s theory of planned behaviour which
indicates that people are likely to adjust
their behaviour to the behaviour of those
they feel closely affiliated to, such as
friends or family. So if they feel a social
pressure to switch to real time tariffs they
will be more likely to do so.
H3: The perceived social pressure to use
renewable energy will increase the
willingness to switch to real time tariffs.
Apart from the variables directly related to
the dependent, two more moderating
variable were taken into consideration,
namely the place of birth and place of
residence. Place of residence moderates
the relation between attitude towards the
renewable energy and the willingness to
switch to real time tariffs, because city
residences do not have the time or take the
effort to actually do something to benefit
the environment. The place of birth on the
other hand interacts with the relation
between social norms and the dependent,
since it can differ among cultures.
H4: The positive influence of attitude
towards renewable energy on willingness
to switch to real time tariffs is expected to
be larger for those living in the countryside
than for those living in the city.

5
H5: The positive influence of subjective
norms on the willingness to switch to real
time tariffs is expected to be related to
place of birth.
Place of residence may also be in a direct
causal relation to flexibility, it is assumed
that people who live in cities are often less
flexible because of their more hectic life
and 9 to 5 work jobs. Therefore the last
hypothesis is:
H6: The flexibility in daily routines is higher
for those living in the countryside than
those living in the city.
METHOD
Interviews and online survey
As explained in the model, this study aims
at evaluating the willingness of
homeowners in the Netherlands to switch
from fixed tariffs to real-time tariffs. In
order to gather enough information and
data for the subsequent analysis, both
interviews and an online survey were
carried out. The survey was carried out in
the Netherlands and accordingly, different
cities were surveyed, with predominance
for Amsterdam and Leiden. The surveying
took part in a two-phase process: first the
interviews and then the online survey. Two
persons were interviewed in order to
conduct a pilot. After the analysis of the
transcriptions, some questions were
adapted or removed. It appeared that
some questions, although interesting and
relevant for our survey, were not well
perceived by the respondents. Four more
interviews were then carried out to
evaluate the adapted questionnaire and to
have a first insight of what factors are
important for the willingness to switch to
real-time tariffs. In light of these results,
the proposed model was refined, the
hypotheses were adapted, and the online
survey was made. Survey items were
generated to reflect variables in our
conceptual model: Attitude towards
renewable energy (ATRE), Subjective
norms and Flexibility. As depicted in Table
1, each theme was associated with various
categories.
The questionnaire, given in Appendix I,
starts with a short introduction explaining
the goal and the survey to the
interviewees, and includes a short
explanation about real-time tariffs. The
first questions were demographic
questions including age, gender, place of
birth, the place where respondents have
been raised up, place of residence, and
level of education. Demographic variables
were expected to have no direct
relationship with willingness to switch to
real time tariffs, but to moderate the effect
of other variables. The last part of the
questionnaire consists of six-point Likert
scale questions. Scale items were
Themes Categories
SES - Age education, cultural background - Living circumstance - Willingness to switch depending on profitability
Attitude towards renewable energy
- Green awareness - Willingness to change for the environment
Subjective norms - Influence of friends and family’s attitude - Influence of society norms - Influence of education
Flexibility - Daily routines - Willingness to adapt these routines
Table 1 : Interview scales

6
generated for assessing respondents’
flexibility in scheduling their daily routines.
The scale measuring respondents’ attitude
toward renewable energy was retrieved
from Popov (2012) and the scale assessing
the effect of perceived subjective norms
has been made by adapting items from the
Consumer health informatics research
resource and from Ajzen (2010). The
questions were mixed together.
The scale analysis and the analysis of the
results was carried out with SPSS version
20.0.
Data analysis
During scale analysis, each respondent’s
mean on the items within that scale was
computed for each scale, after reflecting
reverse items. Scales ranged from 1
(strongly agree) to 6 (strongly disagree). On
the attitude scale, high scores indicate
strong support for the use of renewable
energy. On the flexibility scale, high scores
represent a high ability of respondents to
have flexible daily schedule. On the
subjective norms scale, high scores
represent high perceived social pressure to
use renewable energy. Scales’ internal
consistency was tested by calculating
scales’ Cronbach’s alpha. Items that
lowered scales’ internal consistency were
excluded. The resulting Cronbach alpha
coefficients can be seen in table 2.
The analysis of the flexibility scale led to the
removal of the item 7 (“I am never at home
on weekdays between 9am to 5pm”), the
analysis of the Social Norm and of the
attitude led respectively to the removal of
the items 19 (“Most people like me would
switch from flat energy tariffs to real time
tariffs”) and 26 (“I separate my trash”) –
leading to increases in the corresponding
Cronbach’s alpha and thus in the reliability
of the survey.
Scale Cronbach’s alpha
Flexibility 0.568
Social Norms 0.615
Attitude 0.792
Survey 0.626
Table 2 : Cronbach’s
alpha
Sample
The target group is homeowners currently
living in the Netherlands, which were
considered to be the Dutch population
aged above 20 years. The numbers used
were retrieved from the Centraal Bureau
Statistiek (CBS) and are for 2009. The
population of the Netherlands is 16 485
787 persons among which 76.1% are older
than 20 years. The variance of the
population is difficult to assess, the formula
used is retrieved from the works of Air
University (2002) and is as follows:
Where n is the minimal sample size
required, N is the studied population, Z is
the corresponding value of the standard
distribution and d is the precision level.
Computing the formula with the correct
values, and for a precision level of 5% gives
n= 399 which is higher than the number of
responses received. Given the 43 answers

7
that were considered in this study, the
sample studied is not at all representative
of the Dutch adult population. As a
consequence, no conclusion drawn for the
sample can be extended to the population.
Given the context of this survey,
conducting a random survey was
complicated, thus the snowball sampling
method was used. The snowball sampling
consists of the utilization of social networks
that exist between members of a target
population to build a sample (UCGS, 2013).
The process is as follows: the survey is sent
to a first sample called the “seed” which
will in turn contact other respondents,
creating several waves of answers which
can be seen on Fig.1 illustrating the
response rate to the online survey.
Because of this technique, however some
sample bias can be observed. Indeed, all
the respondents have a good level of
education.
Univariate Outcomes
The sample size was N = 43 and the results
from the demographic variables such as
gender, age and place of birth can be seen
in Table 3. From the 43 persons who
completed the survey, 28 where female
and 15 were male. It can be seen that a
large majority of the respondents were
female as a result of one of the bias of the
sampling method. Indeed, the survey was
sent to a group of entrepreneurial women.
Due to the two extremely different
populations utilized as “seed”, the age of
the respondents is not limited to one age
group. The mean age of our sample is 37
years (SE = 2.365). The age group of 20 to
29 years is more represented. This is a
result of the sampling method used, as one
of the seed group was made of
international students.
Frequency Percent
Gender Female 28 65.1
Male 15 34.9
Age [20;30[ 24 55.9
[30;40[ 3 6.9
[40;50[ 4 9.3
[50;60[ 7 16.3
[60;70[ 5 11.6
Place
of birth
Outside
NL
12 27.9
Inside
NL
31 72.1
Sample 43 100
Table 3: Control variables
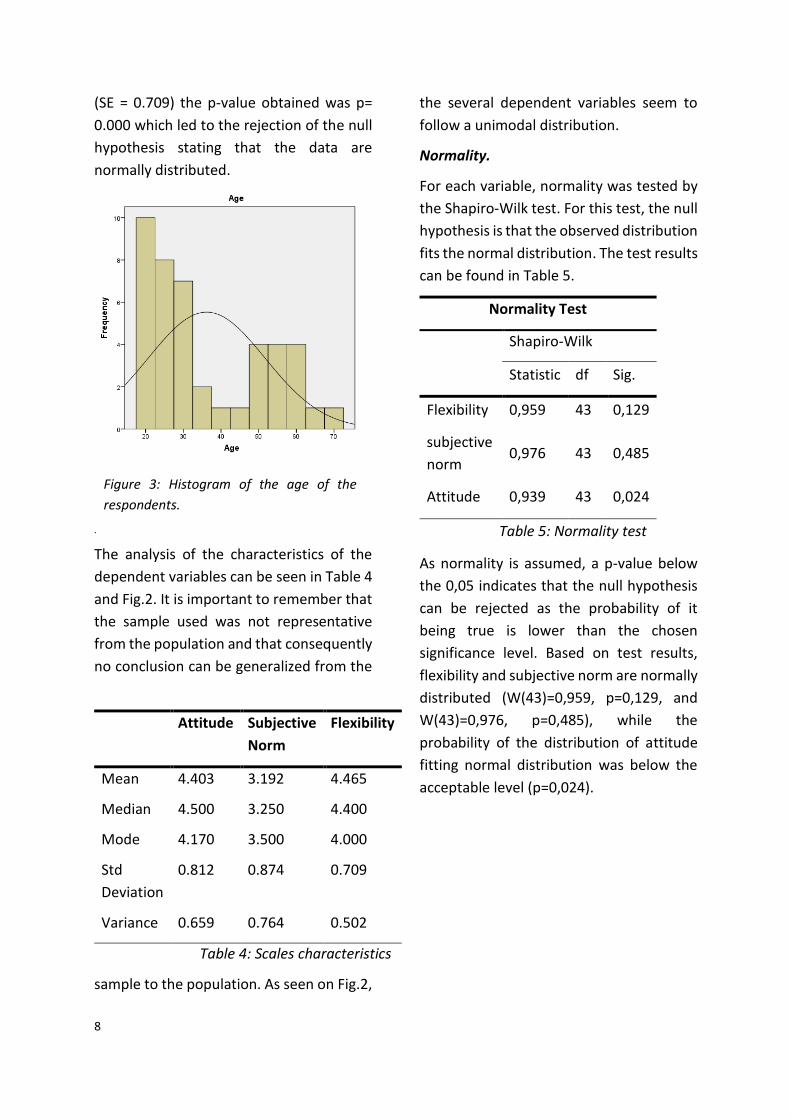
The distribution obtained for the age of the
participants can be seen on Fig.3. Visually,
it can already be seen that there is few
chances that the distribution will be
normal. A Shapiro-Wilk’s test (p <0.05) and
a visual inspection of the Q-Q plots and the
box plots showed that the age was not
normally distributed with a skewness of
0.691 (SE = 0.361) and a kurtosis of -1.013
Figure 2: Daily responses to the
survey
8
(SE = 0.709) the p-value obtained was p=
0.000 which led to the rejection of the null
hypothesis stating that the data are
normally distributed.
.
The analysis of the characteristics of the
dependent variables can be seen in Table 4
and Fig.2. It is important to remember that
the sample used was not representative
from the population and that consequently
no conclusion can be generalized from the
sample to the population. As seen on Fig.2,
the several dependent variables seem to
follow a unimodal distribution.
Normality.
For each variable, normality was tested by
the Shapiro-Wilk test. For this test, the null
hypothesis is that the observed distribution
fits the normal distribution. The test results
can be found in Table 5.
Normality Test
Shapiro-Wilk
Statistic df Sig.
Flexibility 0,959 43 0,129
subjective
norm 0,976 43 0,485
Attitude 0,939 43 0,024
Table 5: Normality test
As normality is assumed, a p-value below
the 0,05 indicates that the null hypothesis
can be rejected as the probability of it
being true is lower than the chosen
significance level. Based on test results,
flexibility and subjective norm are normally
distributed (W(43)=0,959, p=0,129, and
W(43)=0,976, p=0,485), while the
probability of the distribution of attitude
fitting normal distribution was below the
acceptable level (p=0,024).
Attitude Subjective
Norm
Flexibility
Mean 4.403 3.192 4.465
Median 4.500 3.250 4.400
Mode 4.170 3.500 4.000
Std
Deviation
0.812 0.874 0.709
Variance 0.659 0.764 0.502
Table 4: Scales characteristics
Figure 3: Histogram of the age of the
respondents.

9
Figure 4: Histogram of the scales [mean items]
10
Bivariate outcomes
Correlations. The assumed relationship
between attitude towards the use of
renewable energy, flexibility, subjective
norms, and willingness to switch, were
assessed by a correlation analysis. As the
calculation of the Pearson correlation
coefficient requires the joint normality of
the associated variables, and the attitude
explanatory variable departed from
normality according to the Shapiro-Wilk
test, Spearman’s rank correlation
coefficient was used to assess the assumed
relationship between respondents’
willingness to switch and each explanatory
variable. The null hypotheses for H1, H2
and H3 was that there is no linear
relationship between the variables, that is,
H: ρ=0, while the alternative hypotheses
are: H1: ρ>0, H2: ρ>0 H3: ρ>0. The
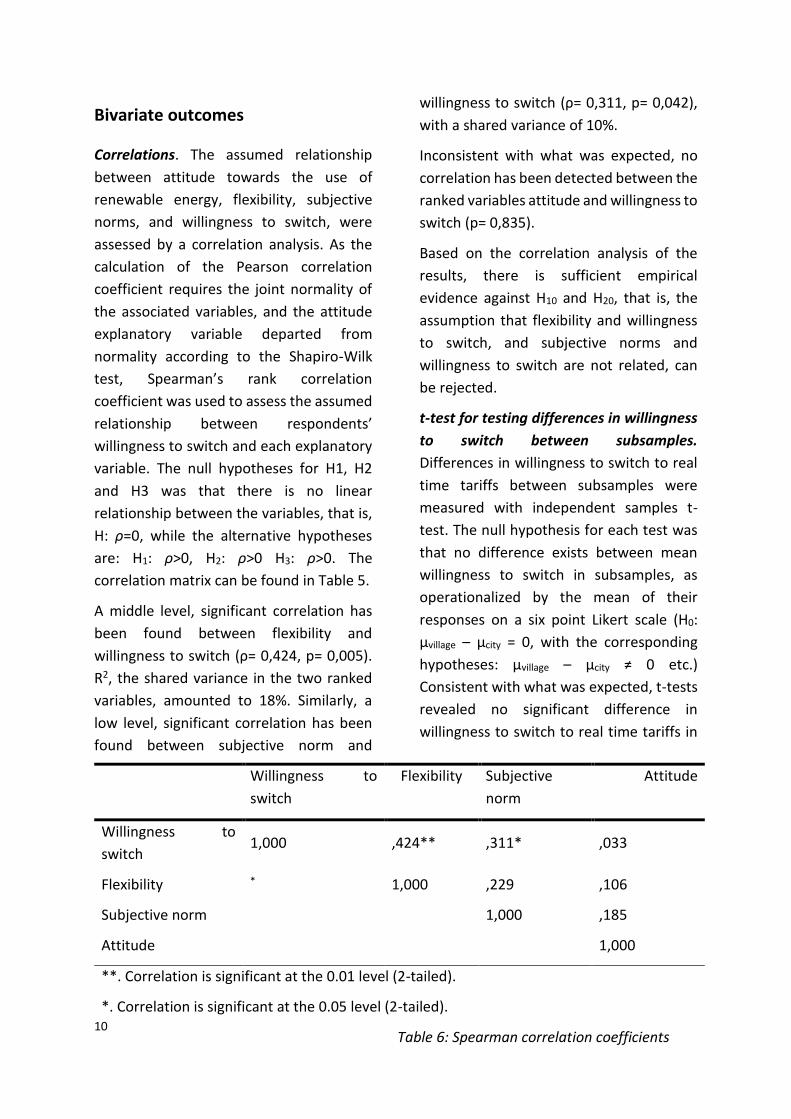
correlation matrix can be found in Table 5.
A middle level, significant correlation has
been found between flexibility and
willingness to switch (ρ= 0,424, p= 0,005).
R2, the shared variance in the two ranked
variables, amounted to 18%. Similarly, a
low level, significant correlation has been
found between subjective norm and
willingness to switch (ρ= 0,311, p= 0,042),
with a shared variance of 10%.
Inconsistent with what was expected, no
correlation has been detected between the
ranked variables attitude and willingness to
switch (p= 0,835).
Based on the correlation analysis of the
results, there is sufficient empirical
evidence against H10 and H20, that is, the
assumption that flexibility and willingness
to switch, and subjective norms and
willingness to switch are not related, can
be rejected.
t-test for testing differences in willingness
to switch between subsamples.
Differences in willingness to switch to real
time tariffs between subsamples were
measured with independent samples t-
test. The null hypothesis for each test was
that no difference exists between mean
willingness to switch in subsamples, as
operationalized by the mean of their
responses on a six point Likert scale (H0:
µvillage – µcity = 0, with the corresponding
hypotheses: µvillage – µcity ≠ 0 etc.)
Consistent with what was expected, t-tests
revealed no significant difference in
willingness to switch to real time tariffs in
Willingness to
switch
Flexibility Subjective
norm
Attitude
Willingness to
switch 1,000 ,424** ,311* ,033
Flexibility * 1,000 ,229 ,106
Subjective norm 1,000 ,185
Attitude 1,000
**. Correlation is significant at the 0.01 level (2-tailed).
*. Correlation is significant at the 0.05 level (2-tailed).
Table 6: Spearman correlation coefficients
11
subsamples based on demographic
variables: gender (t(41)=-0,441, p=0,661)
place of birth (t(41)=-0,077, p=0,939), and
place of residence (t(41)=-0,178, p=0,860).
It was further hypothesized that there is a
significant difference in respondents’
flexibility based on place of residence. This
was tested with an independent sample t-
test, with the null hypothesis being that
there is no difference in the flexibility of
respondents in the two subsamples, as
operationalized by the mean (H0: µvillage –
µcity=0). Inconsistent with what had been
expected, the null hypothesis cannot be
rejected below the required 5% probability
of error based on the test result, thus H6
has been rejected.
Correlation within subsamples. The same
correlation analyses as outlined above
were used to explore the relationships of
attitude, and subjective norms to
willingness to switch to real-time tariffs
within subsamples of place of residence
and place of birth.
Within the two subsamples of place of
residence, salient differences have been
found in the relationship between attitude
and willingness to pay: while no correlation
has been detected between attitude and
willingness to switch (p= 0,113) in the city
subsample, a very strong and significant
correlation has been found between
attitude and intention to switch (ρ=0,838,
p<0,001) in the village subsample, with
70% shared variance in the ranked
variables. This suggests that the
relationship between attitude and
willingness to switch may not be linear but
is moderated by respondents’ place of
residence. This implies that, consistent
with H4, an increase in attitude towards
the use of renewable energy is only
accompanied by an increase in willingness
to switch in the part of the population that
lives in villages.
Within the two subsamples of place of
birth, the correlation analysis also revealed
differences in the relationship between
subjective norm and willingness to switch.
While a middle level, significant correlation
has been found between subjective norm
and willingness to switch in respondents
who were born in the Netherlands (ρ=0,39,
p=0,044), with 16% shared variance the
ranked variables, no significant correlation
has been detected in the subsample
consisting of respondents born outside of
the Netherlands (p=0,463). This suggests
that the null hypothesis of H5 holds can be
rejected, although the opposite direction
was hypothesized.

12
REGRESSION ANALYSIS
In order to evaluate the effect that the
independent variables have on the
dependent variables, two models were
used and three control dummy variables
were included: gender (dFemale), place of
birth (dPlaceofbirth) and in which location
the people live (dlocationlive).
As it can be seen in table 8, in the first
model all the variables were included:
attitude (mean_attitude), flexibility
(mean_flexibility), subjective norms
(mean_subjective_norm) and the three
control variables just mentioned. Since the
significance (Sig. F Change) is 11,5%, which
is above level of significance of 5%, the null
hypothesis cannot be rejected (H0: βj=0),
which means that the predictors could
have no effect in the model. Thus asecond
model was ran in which the non control
variables were excluded obtaining a
significance of 2,2% which is below the
level of significance of 5%. There is thus
sufficient statistical evidence to reject the
null hypothesis (H0), proving that changes
in the model affect the dependent variable.
Regression Results : Willingness to change
Model I Model II
Intercept 0.747
(1.759)
4.627
(0.533)
dFemale -0.254
(0.374)
-0.185
(0.407)
dPlaceofbirth 0.128
(0.384)
0.046
(0.419)
dLocationlive 0.185
(0.421)
-0.067
(0.437)
mean_flexibility 0.621
(0.263)
mean_subjective_
norm
0.364
(0.208)
-
mean_attitude -0.053
(0.226)
-
R² 1.135 -
Rmse 43 -
N 0.006
Table 8: Regression Results.
This is to say that the non-control variables
are a meaningful addition to our model, as
changes in the predictor’s value are related
to changes in the response variable.
Model R R Square Adjusted R
Square
Std. Error
of the
Estimate
Change Statistics
R Square
Change F Change df1 df2
Sig. F
Change
1 ,486a ,237 ,109 1,135 ,237 1,859 6 36 ,115
2 ,078b ,006 -,070 1,244 -,231 3,623 3 36 ,022
a. Predictors: (Constant), mean_attitude, dFemale, mean_flexibility, dPlaceofbirth,
mean_subjetive_norm, dLocationlive
b. Predictors: (Constant), dFemale, dPlaceofbirth, dLocationlive
Table 7. Model Summary

13
Therefore the non control variables cannot
be excluded of the model.
In Table 8 the results of the regression
analysis model are shown, the numbers in
parenthesis under the coefficients are the
standard errors related to the coefficients
(numbers that are not in parenthesis), n
represents the number of observations,
Rmse the standard error of the regression
and finally R2 represents the coefficient of
correlation, which according to Newbold et
al. (2010) can be interpreted as the
percentage of variability in the dependant
variable (willingness) that is explained by
the regression equation, vary from 0 to 1,
in this case is equal to 0,237, this is to say
that the model has a moderate explanatory
power.
The results indicate that the conditional
estimates of the effects of the predictor
variables (excluding the control variables)
are as follows:
1. An increase of one unit in the mean of
the flexibility leads to an expected
increase in the willingness by 0,621
units.
2. An increase of one unit in the mean of
the subjective norms leads to an
expected increase in the willingness by
0,364 units.
3. An increase of one unit in the mean of
the attitude leads to an expected
decrease in the willingness by 0,053
units.
It is necessary to emphasize that these
coefficient estimates are valid only for a
model with all previous predictor variables
included.
Before analyzing the model, it is necessary
to make sure that there is no
multicollinearity between the independent
variables. Since all the correlations of the
variables are below 0.425 there is enough
statistical information to conclude that
there is no multicollinearity.
To better understand the accuracy of these
effects two things can be done: construct
conditional 95% confidence intervals or
calculate the p-value of each variable and
compare them to level of significance, in
this case 5%. For the purposes of this report
both things were done using SPSS, the
results are shown in Table 8.
The null hypothesis (H0: βj=0) can be
rejected if the p-value of the variables is
below the level of significance (p-
value<0.05), or if the confidence interval
contains the number zero. If the null
hypothesis cannot be rejected that means
that the β is not different from zero.
In this case the results for the p-value (Sig.)
are consistent with the results of
the confidence interval, this is to say that
they are the same for each variable, which
means that the method chosen is
indifferent to the results.
Only in the case of the variable flexibility,
denoted as mean_flexibility, there is
sufficient statistical information to reject
the null hypothesis, since the interval does
not include the number zero, thus it can be
said that is statistically significant. On the
other hand in the case of the control
variables, the attitude and the subjective
norms there is not enough statistical
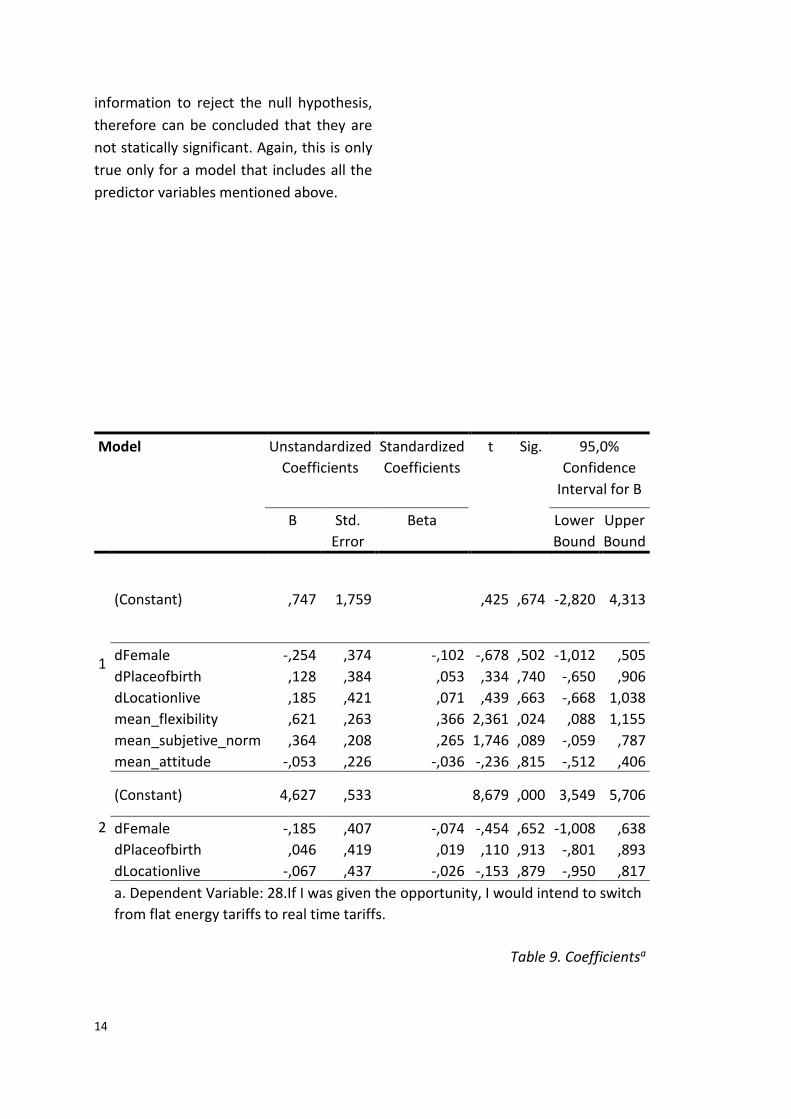
14
information to reject the null hypothesis,
therefore can be concluded that they are
not statically significant. Again, this is only
true only for a model that includes all the
predictor variables mentioned above.
Model Unstandardized
Coefficients
Standardized
Coefficients
t Sig. 95,0%
Confidence
Interval for B
B Std.
Error
Beta Lower
Bound
Upper
Bound
1
(Constant) ,747 1,759
,425 ,674 -2,820 4,313
dFemale -,254 ,374 -,102 -,678 ,502 -1,012 ,505
dPlaceofbirth ,128 ,384 ,053 ,334 ,740 -,650 ,906
dLocationlive ,185 ,421 ,071 ,439 ,663 -,668 1,038
mean_flexibility ,621 ,263 ,366 2,361 ,024 ,088 1,155
mean_subjetive_norm ,364 ,208 ,265 1,746 ,089 -,059 ,787
mean_attitude -,053 ,226 -,036 -,236 ,815 -,512 ,406
2
(Constant) 4,627 ,533
8,679 ,000 3,549 5,706
dFemale -,185 ,407 -,074 -,454 ,652 -1,008 ,638
dPlaceofbirth ,046 ,419 ,019 ,110 ,913 -,801 ,893
dLocationlive -,067 ,437 -,026 -,153 ,879 -,950 ,817
a. Dependent Variable: 28.If I was given the opportunity, I would intend to switch
from flat energy tariffs to real time tariffs.
Table 9. Coefficientsa
15
CONCLUSION
This report researched respondents’
willingness to switch to real time tariffs
motivated by its importance for the use of
renewable energy. It aimed to determine
which variables have an influence on
people’s willingness to switch tariffs by
taking into account respondents’ attitude
toward renewable energy, flexibility in
their daily routines and social pressure they
perceive to use renewable energy.
Moderating factors such as the type of
respondents’ place of residence and their
cultural background were also taken into
account. Both qualitative and quantitative
analyses have been performed. A literary
review of existing research had been done
as well as interviews with several home
owners to define the model. A survey was
then carried out among homeowners in the
Netherlands with a total number of
respondents of N= 43. A quantitative
analysis of the results was then performed
to test the hypotheses.
In the present report, H1 and H6 have been
rejected based on the bivariate tests and
H2, H3 and H4 have been confirmed.
Although the null hypothesis of H5 has
been rejected, the opposite direction was
hypothesized than what the data
suggested. This means that in the sample
studied, attitude towards renewable
energy did not influence respondents’
willingness to switch to real time tariffs, but
flexibility and subjective norms were
moderately related to it did. No significant
difference has been found in the level of
flexibility related to the place of residence,
however, place of residence does
moderate the relation between attitude
towards renewable energy and willingness
to switch to real time tariffs. Place of birth,
or cultural differences, have been found to
have an influence on the relation between
subjective norms and the dependent.
People that were born in the Netherlands
show a higher probability to switch
because of subjective norms than those
from outside the Netherlands. This is
against previous assumptions that were
made thinking Dutch people would be
more individualistic and be less influenced
by subjective norms. The regression
analysis has shown that subjective norms
are moderated by the other variables, and
that flexibility has a significant effect on
willingness to switch, but the regression
analysis did not confirm the other
hypotheses, since there was not enough
statistical information.
A potential explanation for the attitude not
having been significantly related to
intention to switch is social conformity:
respondents tended to answer more
positively to questions regarding their
attitude to renewable energy, the
distribution of the answers is skewed to the
positive side and does not fit normal
distribution.
The fact that there were not many
significant outcomes in the regression
analysis can be due to several limiting
factors, especially in sampling, that were
present in this research. First of all the
sample size of 43 respondents is very small
to be representative of the population and
this limits the validity of statements
inferred from this sample. Secondly the
sample used was not representative of the
whole population considering the use of

16
the non-probability snowball method
which limits respondents to the same social
groups, which is reflected in highly
educated people and women being
overrepresented in the sample.
In the interviews some other factors
where spotted but not taken into account
in this report. One thing that came out was
that money is an issue when deciding to
switch or not. When consumers perceive
their bill to increase because of the switch
to real time tariffs they would be less
willing to switch than when they were
presented with options to lower their
energy bills. Secondly the government can
have great influence on people’s attitudes
towards the environment by making them
more aware, for example by implementing
regulations such as that for trash
separation. Through subsidies they can
incentivize those who fear an increase in
their energy bill and reward those who are
acting environmentally conscious.
In conclusion, in this research only limited
statistical information was available to get
a clear view of the hypotheses. The only
variable that was found to be significantly
effecting willingness to switch to real time
tariffs was respondents’ flexibility. A
broader and more elaborative research on
the topic could increase the validity of the
output.
REFERENCES
Air University (2002). Sampling and Surveying Handbook. Retrieved from: http://www.au.af.mil/au/awc/awcgate/edref/smpl-srv.pdf
Ajzen, I. (2006), Constructing a theory of planned behavior questionnaire, TPB Questionnaire Construction. Taken from: http://people.umass.edu/~aizen/pdf/tpb.measurement.pdf, 12-12-2013.
Borenstein, S. (2013, Published online: 2012) Effective and Equitable Adoption of Opt-In Residential Dynamic Electricity Pricing. Review of Industrial Organization, 42(2), 127-160.
Centraal Bureau Statistiek (2010). Population: key figures, 05 April 2013. Retrieved from: http://statline.cbs.nl/StatWeb/publication/default.aspx?VW=T&DM=SLEN&PA=37296eng&D1=a&D2=0%2c10%2c20%2c30%2c40%2c58-59&HD=090302-1045&LA=EN&HDR=G1&STB=T
Consumer health informatics research resource. Subjective norm. Consulted on Dec 2013, 1st. Retrieved from : http://chirr.nlm.nih.gov/subjective-norm.php
Fishbein, M., & Ajzen, I. (2010). Predicting and changing behavior: The reasoned action approach. New York: Psychology Press.
Newbold et al. (2013), Statistics for Business and Economics, Pearson Education Limited
Popov, S. (2012). The choice of an electricity tariff at one-person household. Rotterdam school of management, Rotterdam, The Netherlands.
UCGS (2013). Snowball Sampling. Consulted on Dec 2013 1st, Retrieved from: http://www.fort.usgs.gov/landsatsurvey/SnowballSampling.asp
Verhagen, E. (2012). The impact of framing on consumer selection of energy tariffs. Rotterdam school of management, Rotterdam, The Netherlands.

17
APPENDIX I: Online survey form
Online survey: Real-time tariffs
Please take a few minutes to tell us what you think about the possibility of switching from flat
energy tariffs to real time tariffs. There is no right or wrong answers; we are merely interested
in your personal opinions. In response to the questions below, please list the thoughts that
come immediately to your mind.
We will start with general information in order to evaluate your profile and we will then move
on to the main topic of our subject: to assess the willingness of Dutch people to switch to real-
time tariffs.
This second part of the survey is a scale survey. You will be presented several affirmations.
You should rate them from 1 to 6 with 1 meaning "I completely disagree" to 6 meaning "I
totally agree".
The information given will remain strictly confidential the statistical results however will be
used to produce a report on the subject.
Thank you for your participation.
Haut du formulaire
1.What is your age?
2.What is your gender?
o Female
o Male
3.Where were you born?
4.Where were you raised?
5.In which city of the Netherlands do you currently live?
6.What is your level of education?

18
7.I am never at home on weekdays between 9am to 5pm
1 2 3 4 5 6
Select a value from a range of 1 to 6.
8.Using renewable energy does not make any difference to me
1 2 3 4 5 6
Select a value from a range of 1 to 6.
9.Using renewable energy in my household would make me feel better about myself
1 2 3 4 5 6
Select a value from a range of 1 to 6.
10.If all my family/friends switched from flat energy tariffs to real time tariffs, I would do so
as well
1 2 3 4 5 6
Select a value from a range of 1 to 6.
11.I would stick to my daily routine even if it costs me money
1 2 3 4 5 6
Select a value from a range of 1 to 6.
12.I would agree to program the utilisation of my dishwasher with a time switch

19
1 2 3 4 5 6
Select a value from a range of 1 to 6.
13.I have strict daily routines
1 2 3 4 5 6
Select a value from a range of 1 to 6.
14.Using renewable energy is not worth the price I would have to pay
1 2 3 4 5 6
Select a value from a range of 1 to 6.
15.According to my family/friends, it is very important for me to help the environment as
much as I can
1 2 3 4 5 6
Select a value from a range of 1 to 6.
16.Most people who are important to me would disapprove of my switch from flat energy
tariffs to real time tariffs
1 2 3 4 5 6
Select a value from a range of 1 to 6.
17.If all my neighbors switched from flat energy tariffs to real time tariffs, I would do so as
well

20
1 2 3 4 5 6
Select a value from a range of 1 to 6.
18.I am confident that I can switch from fixed to real time tariffs without major
problems/without major discomfort
1 2 3 4 5 6
Select a value from a range of 1 to 6.
19.Most people like me would switch from flat energy tariffs to real time tariffs
1 2 3 4 5 6
Select a value from a range of 1 to 6.
20.Whether the energy used in my household is renewable is of no concern to me
1 2 3 4 5 6
Select a value from a range of 1 to 6.
21.I think the government should force people to switch from flat energy tariffs to real time
tariffs
1 2 3 4 5 6
Select a value from a range of 1 to 6.
22.My degree of concern about using renewable energy influences my decisions about energy
consumption
1 2 3 4 5 6

21
Select a value from a range of 1 to 6.
23.I am a flexible person
1 2 3 4 5 6
Select a value from a range of 1 to 6.
24.If I was given the opportunity, I would intend to switch from flat energy tariffs to real time
tariffs
1 2 3 4 5 6
Select a value from a range of 1 to 6.
25.I don't have enough money to use renewable energy
1 2 3 4 5 6
Select a value from a range of 1 to 6.
26.I separate my trash
1 2 3 4 5 6
Select a value from a range of 1 to 6.
27.I think that real-time tariffs is a good idea
1 2 3 4 5 6
Select a value from a range of 1 to 6.
28.I am concerned with the environment and the future of the planet.

22
1 2 3 4 5 6
Select a value from a range of 1 to 6.
Appendix II: Interview quotes
I just switched from [energy provider] Nuon to essent. I switched to essent because somebody
told me it is the cheapest one and it also has green energy.
Well I still think the idea behind the real time tariffs is not good. Because making it more
expensive during dinner time, you can’t expect people at work all day to change their
schedule.
[My friends] are not members of green peace, but there is knowledge about it. I can’t say that
they all are in favor of it or use it but they know that it is important.
For us [real time tariffs] will not be cheaper to go up during those peak hours which is in the
morning and after 17. So we will probably not use the low prices during those hours because
we are just not at home.
I think there always has to be a choice. Some people don’t have a choice if they work on a 9 to
17 basis. So it’s ok to implement [real time tariffs] but then there has to be a reward as well
because they will have a higher cost of living.
I think it’s important to educate children for a better environment
I think that it’s normal for the people from the villages [to be aware of environmental issues]
as they ‘re closer to nature, they see more green in their daily lives. People, children raised in
cities, they don’t care too much, because they see trash all the time.