FINAL REPORT€¦ · report does not indicate endorsement by the Department of Defense, nor should...
60
FINAL REPORT Development of Chromium-Free Welding Consumables for Stainless Steels SERDP Project WP-1415 FEBRUARY 2009 J.C. Lippold G.S. Frankel The Ohio State University This document has been approved for public release.
Transcript of FINAL REPORT€¦ · report does not indicate endorsement by the Department of Defense, nor should...

FINAL REPORT Development of Chromium-Free Welding Consumables
for Stainless Steels
SERDP Project WP-1415
FEBRUARY 2009
J.C. Lippold G.S. Frankel The Ohio State University This document has been approved for public release.

This report was prepared under contract to the Department of Defense Strategic Environmental Research and Development Program (SERDP). The publication of this report does not indicate endorsement by the Department of Defense, nor should the contents be construed as reflecting the official policy or position of the Department of Defense. Reference herein to any specific commercial product, process, or service by trade name, trademark, manufacturer, or otherwise, does not necessarily constitute or imply its endorsement, recommendation, or favoring by the Department of Defense.

StandardPrescribed by ANSI Std. Z39.18 Form 298 (Rev. 8/98)
REPORT DOCUMENTATION PAGE Form Approved OMB No. 0704-0188
The public reporting burden for this collection of information is estimated to average 1 hour per response, including the time for reviewing instructions, searching existing data sources, gathering and maintaining the data needed, and completing and reviewing the collection of information. Send comments regarding this burden estimate or any other aspect of this collection of information, including suggestions for reducing the burden, to the Department of Defense, Executive Services and Communications Directorate (0704-0188). Respondents should be aware that notwithstanding any other provision of law, no person shall be subject to any penalty for failing to comply with a collection of information if it does not display a currently valid OMB control number. PLEASE DO NOT RETURN YOUR FORM TO THE ABOVE ORGANIZATION.
1. REPORT DATE (DD-MM-YYYY) 04-02-2009
2. REPORT TYPE Final 3. DATES COVERED (From - To) Jan 2005 - Sep 2009
5a. CONTRACT NUMBER 4. TITLE AND SUBTITLE Development of Chromium-Free Welding Consumables for Stainless Steels
5b. GRANT NUMBER
5c. PROGRAM ELEMENT NUMBER
5d. PROJECT NUMBER WP-1415
6. AUTHOR(S) J.C. Lippold and G.S. Frankel
5e. TASK NUMBER
5f. WORK UNIT NUMBER
7. PERFORMING ORGANIZATION NAME(S) AND ADDRESS(ES) The Ohio State University2041 College Rd.Columbus, OH 43210
8. PERFORMING ORGANIZATION REPORT NUMBER
10. SPONSOR/MONITOR'S ACRONYM(S) SERDP
9. SPONSORING/MONITORING AGENCY NAME(S) AND ADDRESS(ES) SERDP901 North Stuart Street, Suite 303Arlington, VA 22203
11. SPONSOR/MONITOR'S REPORT NUMBER(S)
12. DISTRIBUTION/AVAILABILITY STATEMENT
13. SUPPLEMENTARY NOTES
14. ABSTRACT Stainless steel components are often joined by welding when fabricated into structures. Fusion welding of these steels results in the formation of carcinogenic Cr(VI) in the weld fumes as a result of the Cr content of the commonly used filler metals. This is a significant health hazard for the welders and necessitates protective gear or expensive ventilation systems to meet the stringent Permissible Exposure Limit for chromate set by OSHA. This project developed a Cr-free consumable for welding 304 austenitic stainless steel that provides mechanical properties and corrosion resistance comparable to the commonly used Cr-bearing consumables. A weld wire of composition Ni-7.5Cu-1Ru-0.5Ti worked well in gas metal arc and gas tungsten arc welding operations. For shielded metal arc welding, coated electrodes with cores wires of composition Ni-7.5Cu-4Ti-1Ru performed well. The performance characteristics of these welds were excellent, including mechanical properties and corrosion resistance. Essentially no Cr was detected in the weld fume.
i
1. Table of Contents 1. Table of Contents................................................................................................................. i 2. List of Acronyms ................................................................................................................ ii 3. List of Figures .................................................................................................................... iii 4. List of Tables ..................................................................................................................... vi 5. Acknowledgements............................................................................................................. 1 6. Executive Summary ............................................................................................................ 2 7. Objectives ........................................................................................................................... 4 8. Background......................................................................................................................... 4 9. Materials and Methods........................................................................................................ 7 10. Results and Accomplishments .......................................................................................... 11 11. Conclusions....................................................................................................................... 48 12. Appendices........................................................................................................................ 50

ii
2. List of Acronyms
ANSI American National Standards Institute AWS American Welding Society BOP Bead on plate CR Cooling rate DDC Ductility dip cracking DDCTR Ductility dip cracking temperature range ECORR Corrosion potential EB Breakdown potential EP Pitting potential ERP Repassivation potential EDS Energy dispersive spectroscopy FGR Fume generation rate GMAW Gas metal arc welding GTAW Gas tungsten arc welding HAZ Heat affected zone LTE Long term exposure MCD Maximum crack distance OCP Open circuit potential OSHA Occupational Safety and Health Administration OSU Ohio State University PEL Permissible exposure limit Rp Polarization resistance SCC Stress corrosion cracking SCE Saturated calomel electrode SCTR Solidification cracking temperature range SEM Scanning electron microscopy SMAW Shielded metal arc welding SS Stainless steel SS-DTA Single sensor differential thermal analysis SSRT Slow strain rate testing STF TEM
Strain-to-fracture Transmission electron microscopy
TS Travel speed XPS XRD
X-ray photoelectron spectroscopy X-ray diffraction

iii
3. List of Figures Figure 1 Mechanical properties of the Ni-Cu, Ni-Cu-Pd, and Ni-Cu-Ru welds.
Figure 2 Optical micrograph of weld metal microstructures of Ni-Cu-Ru weld metal, A) III-W1 deposited on 304L using the GTAW process, B) IV-E-B4 deposited on 304L using the SMAW process.
Figure 3 Varestraint test schematic and plan view of Ni-Cu-Pd test sample showing solidification and ductility dip cracking regions.
Figure 4 Measured (SS-DTA) and calculated (Thermo-Calc Scheil) solidification temperature range of Ni-Cu-Pd weld metal as a function of dilution by SS 304L.
Figure 5 Hot ductility behavior of Ni-Cu-Pd weld metal.
Figure 6 Hot ductility behavior of Ni-Cu-Ru and Ni-Cu-Pd weld metals.
Figure 7 Ductility dip cracking behavior for Ni-Cu-Pd and Ni-Cu-Ru weld metals.
Figure 8 Fume generation rates of Ni-Cu-Pd and Ni-Cu SMAW electrodes and two stainless steel welding electrodes and bulk fume composition of Ni-Cu and E308-16 fume. Welding heat inputs are indicated next to electrode type.
Figure 9 XRD spectra for welding fume collected during SMAW, A) Ni-Cu, B) E308-16.
Figure 10 Cyclic polarization curves for Ni-Cu-Pd and SS308L GTA welds.
Figure 11 Polarization curves for SMA welds.
Figure 12 Crevice formed on Ni-8Cu weld. The lower right was on the base metal and the upper left was on the weld.
Figure 13 Long term exposure testing of SMAW samples in 0.1 M NaCl. a) Corrosion potential, b) Polarization resistance.
Figure 14 Polarization curves for SMAW welds at 5% dilution.
Figure 15 Cyclic polarization curves for Ni-7.6Cu-1.3Pd and Ni-8Cu welds in 0.1 M NaCl.
Figure 16 SEM images of crevices on Ni-8Cu weld. A) one crevice on base metal, b) crevice on weld metal
Figure 17 Crevice on weld metal of Ni-7Cu-1.5Pd weld
Figure 18 Polarization curves for as-cast buttons.

iv
Figure 19 Electrochemical data for as-cast buttons. a) corrosion potential, b) breakdown potential, c) repassivation potential.
Figure 20 Effects of Cl- concentration, Ru content, and dilution on corrosion, breakdown, and repassivation potentials.
Figure 21 Corrosion, breakdown and repassivation potentials for as-cast buttons as a function of dilution, Ni-10Cu-0.5Ru: x, Ni-10Cu-1Ru: filled triangles. Also shown are results for BOP welds at 50% dilution, Ni-10Cu-0.5Ru: open diamonds, Ni-10Cu-1Ru: open squares.
Figure 22 Polarization curves on as-cast buttons containing WC.
Figure 23 Cyclic polarization curves for as-cast buttons made from Ni-Cu-Ru welding wire with different amounts of dilution as indicated.
Figure 24 Critical potentials for Ni-Cu-Ru buttons at different dilutions of SS304L. Data with x symbols are for buttons fabricated from NiCuRu wire starting material and filled triangles are for buttons fabricated from pure elements. Data previously reported for bead-on-plate (BOP) welds shown for comparison.
Figure 25 Immersion tests on NiCuRu button samples at different dilutions. Samples immersed in 1000 ppm NaCl, a) OCP b) Rp.
Figure 26 Cyclic polarization curve for Ni-Cu-Ru GTA weld in 0.1 M NaCl.
Figure 27 Cyclic polarization curves for Ni-Cu-Ru GTAW base metal, weld metal, and whole weld including base and weld metal regions.
Figure 28 SEM Image of the crevice on base metal of Ni-Cu-Ru weld.
Figure 29 Cyclic polarization curves for layers of Ni-Cu-Ru SMAW welds.
Figure 30 Polarization resistance of immersed sample for 500 hours.
Figure 31 Cyclic polarization curves for generation IV Ni-Cu-Ru SMAW welds.
Figure 32 Optical images of atmospheric corrosion samples. a) SS308 GTA weld after 16 months, b) Ni-Cu GTA weld after 16 months, c) Ni-Cu-Pd GTA weld after 16 months, d) Ni-Cu-Ru SMAW weld after 9 months.
Figure 33 SSRT stress-strain curves for SS304 under various conditions.
Figure 34 SEM pictures of SS 304 in 25wt% NaCl at pH1.5 under strain rate of 3*10-7 s-1. a) scale bar = 200 um. b) scale bar = 500 um.
Figure 35 Slow strain rate testing curves for generation II Ni-Cu-Pd welds in air and solution, pH 1.5 25wt% NaCl. Both were performed at a strain rate of 3 x 10⁻⁷ s-1.
v
Figure 36 Slow strain rate testing curves for generation III Ni-Cu-Ru welds in air and solution, pH 1.5 25wt% NaCl. Strain rate was 3 x 10⁻⁷ s-1.
Figure 37 SEM pictures of generation III Ni-Cu-Ru GTAW welds. a) Sample in air, scale bar = 20 um. b) Sample in solution, scale bar = 500 um. c) Sample in solution in base metal region (top right of image b), scale bar = 200 um. d) Sample in solution in weld metal region (bottom left of image b), scale bar = 50 um.
Figure 38 Slow strain rate testing curves for generation IV Ni-Cu-Ru SMAW welds in air and solution. Strain rate was 3 x 10⁻⁷ s-1.
Figure 39 SEM pictures of generation IV Ni-Cu-Ru SMAW welds in solution, different morphologies are observed on sample surface. a) Intergranular fracture, scale bar = 100 um. b) Transgranular fracture, scale bar = 50 um. c) Lower magnification image, scale bar = 500 um. d) Ductile region at lower right of image c, scale bar = 20 um.

vi
4. List of Tables
Table 1 Consumable Nomenclature
Table 2 Consumable Designations and Descriptions
Table 3 Composition (wt-%) of Ni-Cu and Ni-Cu-Pd weld metal deposits, Ni-Cu-Ru core wires, and Type 304L base material .
Table 4 Welding Conditions used with Ni-Cu-Pd and Ni-Cu-Ru Bare Wire Electrodes
Table 5 Measured mechanical properties of Ni-Cu, Ni-Cu-Pd and Ni-Cu-Ru weld metals.
Table 6 SCTR and DDC-TR Values for Ni-Cu, Ni-Cu-Pd, and Ni-Cu-Ru Weld Metals and a Number of Austenitic Stainless Steels and Ni-base Alloys based on the Varestraint Test.
Table 7 Average values of potentials measured on SMA welds
Table 8 Summary of crevice corrosion tests, replicate data separated by commas.
Table 9 Composition of metal cations in passive film (%).
Table 10 Average Potentials for Ni-Cu-Ru Bead on Plate Welds with 50% dilution
Table 11 Critical potentials measured from multiple potentiodynamic polarization experiments on as-cast buttons of Ni-Cu-Ru with different amounts of dilution. Potentials given in mV SCE.
Table 12 Critical potentials measured from replicate potentiodynamic polarization experiments on the base metal and weld metal zones of Ni-Cu-Ru GTA welds, as well as for whole welds including both base and weld metal. Potentials given in mV SCE.
Table 13 Critical potentials measured from multiple potentiodynamic polarization experiments on different layers of Ni-Cu-Ru SMA welds. Potentials given in mV SCE.
Table 14 Critical potentials measured from replicate potentiodynamic polarization
Table 15 OCP and Rp values of the 3 types of welds.
Table 16 Reduction in area for SSRT of SS304 under various conditions.
Table 17 Comparison of mechanical properties of 304L and welded samples
1
5. Acknowledgements This investigation was a collaborative effort between the Welding Engineering Program and the Fontana Corrosion Center at OSU. Much of the work reported here was conducted by three graduate students: Yeong Ho Kim from the Materials Science and Engineering (MSE) Department completed his PhD in 2005, Jeff Sowards from the Welding Engineering Program and Dong Liang from MSE will both complete their PhDs in early 2009. The support of Dr. Boian Alexandrov, a Research Scientist in the Welding Engineering Program, was also critical to the success of this project. Our partners at Euroweld Ltd. and Electrode Engineering are also recognized for their diligence in the development of an electrode coating for the SMAW electrode. Finally, the PIs acknowledge the support and guidance provided by the SERDP program office. This project was initiated under the guidance of Chuck Pellerin and later overseen by Bruce Sartwell. We are grateful for the sustaining SERDP support of this project.

2
6. Executive Summary This project began as a SERDP seed grant (PP-1346) that was initially funded in FY2003. The initial goal of the project was to demonstrate the feasibility of reducing or eliminating hexavalent-Cr, or Cr(VI), during the welding of stainless steels by the development of a novel Cr-free consumable. Stainless steels are usually selected as a material of construction for their corrosion resistance. When they are fabricated into structures, stainless steel components are often joined by welding. To ensure that the welds exhibit sufficient corrosion resistance, filler metals matching or exceeding the chromium (Cr) content of the base metal must be used. The Cr content of Types 304 and 308 stainless steels, the most commonly used stainless steel and the filler metal used to weld it, respectively, is 18-20 wt%. Fusion welding of these steels results in the formation of carcinogenic Cr(VI) in the fumes. This is a significant health hazard for the welders and necessitates considerable expense for ventilation systems. In some conditions relevant to DOD interests, such as cramped ship interiors, it is extremely difficult to ventilate effectively. Furthermore, the recent reduction in the Permissible Exposure Limit (PEL) for chromate in welding fume from 52 to 5 μg/m3, has further exacerbated the situation. Recent discussions have considered further reductions in the PEL. It was the objective of this project to develop a Cr-free consumable for welding austenitic stainless steel that provides mechanical properties and corrosion resistance comparable to the Cr-bearing consumables that are currently used. The approach to solving this problem considers that, if stainless steel (SS) is to be welded with a filler metal that is different in composition than the base metal, then the corrosion of the welded structure will be controlled by the phenomenon of galvanic corrosion. Furthermore, passive metals such as stainless steels usually corrode in a localized nature. In addition, any replacement consumable must exhibit mechanical properties that meet or exceed the consumable it replaces, exhibit good weldability, and have comparable operability for use in a range of applications. Based on these issues, a number of design requirements were imposed:
1. The breakdown and repassivation potentials of the weld metal should be higher than the corrosion potential of the SS substrate to prevent localized attack of the weld metal.
2. If possible, the corrosion potential of the weld metal should be slightly higher than that of the SS substrate so that the weld metal is cathodically protected.
3. The strength and ductility of the welds must meet or exceed minimum requirement for the base metals they join.
4. Weldability, including susceptibility to various forms of cracking during welding, should be within the range of comparable consumables.
5. The operating characteristics of the consumable should be such that it can be readily used in applications requiring manual, semi-automatic, and fully automated welding processes.
While the issue of consumable cost was also considered, this became secondary to the criteria listed above since reduction or elimination of Cr(VI) was the primary goal of the project. This required selection of a Ni-base consumable that carries a severe material cost penalty.

3
Four generations of consumables were developed to meet the design requirements listed above. These can be summarized as follows. A chart showing the consumable development process is provided in Appendix 1.
Generation I – This was a nominal Ni-8.0Cu-0.2Pd bare wire consumable that was designed based on the results of corrosion tests on small button melts. This wire was made from a small (~ 1 lb.) ingot melted at Ames Lab. Generation II – These were nominal Ni-7.5Cu and Ni-7.5Cu-1Pd coated electrodes that were produced by Special Metals Welding Products Company. The Cu and Pd were added to the coating rather than the core wire. It was found that the transfer of substantial Pd across the arc was difficult with these electrodes. Generation III – This was a nominal Ni-7.5Cu-1Ru-0.5Ti bare wire that was melted by Haynes International. Ru replaced Pd as a lower cost alternative. Attempts to use this composition as a core wire for coated electrodes were unsuccessful due to porosity and operability problems. This wire worked very well for GTAW and GMAW applications. Generation IV – This was a nominal Ni-7.5Cu-4Ti-1Ru composition that was developed as a core wire for the coated electrodes (SMAW). The higher Ti relative to Gen III effectively eliminated the porosity and operability problems.
Thus, the final target weld metal composition that meets the design requirements for strength and corrosion resistance is nominally Ni-7.5Cu-1Ru-0.5Ti. As noted above this composition is achieved in the coated electrode by over-alloying the core wire with Ti; the core wire has 4%Ti whereas the deposited metal has only 0.5%Ti as most of the Ti is lost in the arc.
Table 1. Consumable nomenclature.
Consumable Type I-W1 Ni-Cu-Pd wire II-E1 Ni-Cu electrode II-E2 Ni-Cu electrode II-E3 Ni-Cu-Pd electrode III-W1 Ni-Cu-Ru wire III-E-A1 III-E-A2 Ni-Cu-Ru electrode
III-E-B1 III-E-B2 III-E-B3
Ni-Cu-Ru electrode (0.5Ti, 0.5Al core wire)
IV-E-B4 IV-E-B5
Ni-Cu-Ru electrode (4.0 Ti, 0.5Al core wire)

4
7. Objectives The primary objectives of this project were the following.
1. Develop a Cr-free welding consumable for fusion welding of stainless steels that will significantly reduce or eliminate the formation of hexavalent chromium, Cr(VI), in the welding fume.
2. Using the Ni-Cu system as a baseline, adjust the Cu content and use other alloying additions to insure corrosion compatibility with common austenitic stainless steels, such as Types 304 and 304L.
3. Determine the mechanical properties of the weld metal deposited using both coated electrodes (SMAW) and bare wire (GTAW and GMAW).
4. Determine the weldability of the deposited weld metal using conventional weldability test techniques. These tests indicate the tendency for weld metal cracking during fabrication.
5. Evaluate the operability of the electrode, including the fume generation rate. 6. Determine the corrosion resistance of welded structures. 7. Measure the Cr(VI) content of the optimized filler metal in both the coated electrode and
bare wire forms.
8. Background Corrosion resistance is an important consideration in developing Cr-free consumables for stainless steels, since stainless is generally used in corrosive environments. If the welds are susceptible to corrosion, then the benefit of using a stainless steel is lost and cheaper alternatives with comparable mechanical properties will suffice. Stainless steel derives its corrosion resistance from the addition of Cr; steel becomes stainless when it contains greater than about 12% Cr. The “stainless” nature is a result of the spontaneous formation of an extremely thin (a few nm in thickness) passive oxy-hydroxide film that is very rich in Cr. The corrosion resistance of stainless steel continues to improve with increasing Cr content, and most of the austenitic stainless steels, such as Type 304 and 304L contain a minimum of 18 wt% Cr. Nickel is added (8-12%) to stabilize the austenite phase for improved mechanical properties. The corrosion issue associated with passive metals such as stainless steels and Al alloys is that the passive film is susceptible to localized breakdown and accelerated attack, which can take the form of pits, crevices or cracks (if the material is stressed). Localized corrosion of stainless steel typically occurs in chloride-containing environments. Improvements in localized corrosion resistance are obtained by adding 2-3% Mo to the 304 composition, resulting in type 316 SS. Because of the corrosion susceptibility associated with heat-affected zones and with segregation and second phase formation in the fusion zone, welds are usually the sites of corrosion attack in welded structures. This can often be exacerbated by the presence of residual stresses, which tend to accelerate the attack. Therefore, it is common to use over alloy the weld filler metal with Cr. For example, 304 SS is typically welded with 308 SS consumables containing 19-22% Cr.

5
Obviously, the use of filler metals higher in Cr increases the level of Cr(VI) that forms in the welding fume. While it is possible to eliminate welding fume by utilizing a solid-state welding processes such as friction welding or friction stir welding, these processes are limited in their application and cannot be used for field construction or repair. The most practical approach for eliminating Cr(VI) generation during fusion welding of stainless steels is to use a filler metal that is Cr-free. Since over 95% of the welding fume is generated in the welding arc (and not from evaporation off the surface of the molten pool), eliminating Cr from the consumable is the most effective way of controlling Cr(VI) formation. Therefore, the goal of this project was to develop a Cr-free filler metal that would be a drop-in replacement for conventional SS welding consumables. This would require that such a consumable would have compatible corrosion properties and meet minimum mechanical properties relative to Type 304 base metal. Localized corrosion and galvanic corrosion If SS is to be welded with a filler metal that is different in composition, then the corrosion of the welded structure will be controlled by galvanic corrosion. Furthermore, the mode of corrosion of passive metals such as stainless steels is usually localized in nature, such as pitting corrosion. Therefore, to understand the approach used in this project, it is necessary to understand some fundamental aspects of localized corrosion and galvanic corrosion. As described above, SS exhibits corrosion resistance because of the presence of a thin Cr-rich oxy-hydroxide film, the so-called passive film that forms spontaneously on the surface. However, SS, like other passive metals, is susceptible to localized corrosion in aggressive chloride-containing environments. Localized corrosion in the form of pits and crevices will initiate above a characteristic breakdown potential in a given environment. Localized corrosion will tend not to initiate below this potential, and one design criterion for preventing localized corrosion is to require that the corrosion potential stay lower than the breakdown potential. However, localized corrosion can propagate at potentials lower than the breakdown potential, but not below a characteristic repassivation potential. Therefore, a more conservative design criterion is that the corrosion potential must stay below the repassivation potential. When two different metals are electrically coupled (as are a weld and base metal) and exposed to the same environment, galvanic interactions will occur. The more active metal (or less-noble metal, i.e. the one with the lower corrosion potential in that environment) will undergo accelerated attack and the more noble metal will be protected. This galvanic protection is a form of cathodic protection and is the mechanism explaining how a steel substrate is protected from corrosion by the Zn coating in a galvanized structure. Sacrificial protection of steel hulls by Mg anodes is now old technology. One key aspect in galvanic coupling is the area ratio of the two metals. It can be shown that ia, the anodic current density or corrosion rate of the anode or less noble metal, depends upon the ratio of the areas of the cathode and anode, Ac and Aa, and the current density at the cathode, ic, according to:

6
c
a
ca i
AAi = (1)
The galvanic potential will also depend upon the area ratios. If one area is significantly larger than the other, then the galvanic potential of the couple is pinned at the uncoupled corrosion potential of the larger metal. For a welded stainless steel structure, the area of the weld metal is much less than the area of the substrate being welded, which means that the potential of the weld will be set by the corrosion potential of the stainless steel in the particular environment. If the weld metal is less noble than the stainless steel, the galvanic coupling will result in an increase in the potential of the weld. This can result in aggressive attack of the weld if the stainless steel corrosion potential is above the breakdown potential of the weld, or if the less noble weld metal does not passivate and dissolves actively. However, if the weld metal is noble relative to the stainless steel, then the galvanic coupling will result in cathodic protection of the weld metal by the stainless steel. Mechanical properties Any replacement filler metal for conventional austenitic stainless steel filler metals, such as Type 308 and 308L, must meet the minimum requirements of the base metal strength level and exhibit adequate ductility. In the case of Type 304 stainless steel, the minimum strength requirements are 25 ksi (170 MPa) yield strength and 70 ksi (480 MPa) ultimate tensile strength. The minimum ductility (tensile elongation) of Type 304 in the annealed condition is on the order of 40%. Type 308 filler metal exhibits weld metal strength on the order of 50 ksi (345 MPa) yield strength and 75 ksi (520 MPa) tensile strength, with ductility in the range from 30-40 %. Thus, any replacement consumable should exceed base metal minimum values and approximate, as closely as possible, the properties of the stainless steel filler metal. In summary, the design criteria for a new Cr-free filler metal for stainless steels are the following:
• The breakdown and repassivation potentials of the weld metal should be higher than the corrosion potential of the SS substrate to prevent localized attack of the weld metal.
• If possible, the corrosion potential of the weld metal should be slightly higher than that of the SS substrate so that the weld metal is cathodically protected.
• Yield strength in the range from 25-50 ksi (170-345 Mpa), tensile strength on the order of 70 ksi (480 Mpa), and tensile ductility in the range from 30-40% elongation.

7
9.0 Materials and Methods 9.1 Electrode Production Welding consumables used in this study were developed in an iterative manner to achieve the optimum deposit composition and minimize harmful fabrication-related issues. Two types of welding consumables were used during experimentation: bare wire electrodes used for the gas tungsten arc welding (GTAW) process and coated electrodes used for the shielded metal arc welding (SMAW) process. These are defined using the generation scheme based on the type of consumable, as shown in Appendix 1. Based on this generation scheme individual consumable types are designated, as provided in Table 2. These designations are used throughout the document to identify the consumables.
Table 2. Consumable designations and descriptions.
Consumable Type Description Producer I-W1 Ni-Cu-Pd wire Ames Lab II-E1 Ni-Cu electrode Ni 200 core wire II-E2 Ni-Cu electrode Ni 209 core wire II-E3 Ni-Cu-Pd electrode Ni 209 core wire
Special Metals
III-W1 Ni-Cu-Ru wire Additions of 0.5Ti, 0.5 Al Haynes Alloys III-E-A1 Coating A1 III-E-A2 Ni-Cu-Ru electrode Coating A2 Special Metals
III-E-B1 Coating B1 III-E-B2 Coating B2 III-E-B3
Ni-Cu-Ru electrode (0.5Ti, 0.5Al core wire) Coating B3
Electrode Engineering
IV-E-B4 Coating B4 IV-E-B5
Ni-Cu-Ru electrode (4.0 Ti, 0.5Al core wire) Coating B5
Electrode Engineering
The majority of the testing in this study was conducted using the Generation III bare wire Ni-Cu-Ru consumable III-W1, the coated electrodes II-B (Ni-Cu), II-C (Ni-Cu-Pd), and IV-B3 (Ni-Cu-Ru). The compositions of the Ni-Cu and Ni-Cu-Pd weld deposits and the Ni-Cu-Ru core wires are provided in Table 3. Note that these are undiluted compositions and represent the composition of the deposited weld metal without mixing with the Type 304L base metal. 9.2 Welding Procedures Since this study focused on the development of consumables for use with the austenitic stainless steels, Type 304L stainless steel was used as the primary base material. A variety of tests were performed that required the use of different plate and groove geometries. SMA welds were produced using 3.2 mm diameter Generation II, III, and IV welding electrodes on 6.4 mm and (0.25 in) and 9.5 mm (0.375 in) Type 304L base metal. Welding current was maintained in the range of 120-130 amps, voltage between 24-25 volts, and travel speed at approximately 2.5 mm/s (6 in/min) for all welded samples produced with the SMAW consumables. GTA welds

8
were performed using both the I-W1 (Ni-Cu-Pd) and III-W1 (Ni-Cu-Ru) bare wire consumables. The welding parameters used to prepare these weld are listed in Table 4. All GTA welding was performed on a Jetline Sidebeam Carriage with automatic arc voltage control (set to 10% sensitivity) using a Miller Dynasty 300 LX power supply.
Table 3. Composition (wt-%) of Ni-Cu and Ni-Cu-Pd weld metal deposits, Ni-Cu-Ru core wires, and Type 304L base material.
Type Ni-Cu Ni-Cu-Pd Ni-Cu-Ru Ni-Cu-Ru
Designation II-E2 II-E3 III-W1 IV-B3 Type 304L
C 0.022 0.016 0.014 0.019 0.03 Mn 0.32 0.147 - - 1.24 Si 0.7 0.108 - 0.1 0.37 Fe 0.09 0.008 - - Balance Cr 0.01 0.04 - - 18.09 Cu 8.01 4.94 8.20 7.78 - Ni Balance Balance Balance Balance 8.08 Al 0.07 0.05 0.56 0.83 - Ti 1.56 0.9 0.53 4.31 - S 0.001 0.005 <0.001 <0.02 - P 0.003 0.005 <0.005 <0.02 -
Other 0.2Pd 1.36 Ru 1.11Ru
Table 4. Parameters for gas tungsten arc welding of Ni-Cu-Pd and Ni-Cu-Ru bare wire consumables.
Welding Parameter Value Welding Current, amps 200 Welding Voltage, volts 13.5 Travel Speed, mm/s (in/min) 2.1 (5) Wire Feed Speed, mm/s (in/min) 25.4 (60) Shielding Gas/Flow Rate (ft3/hr) Ar/25
9.3 Mechanical Testing Mechanical properties of welds were determined by tensile testing, guided bend testing, and Vickers microhardness tests. Tensile and bend specimens were tested according to the ANSI/AWS B4.0 standard. Extension rate was maintained at 0.085 mm/s (0.2 in/min) during testing. Guide bend testing was performed using a Richards 3HR bender. Bend testing was performed around 19.1 mm (0.75 in) radius die block. Microhardness testing was performed using a Leco M-400-H1 testing machine.

9
9.4 Weldability Testing Weldability testing consisted of Transverse Varestraint testing for weld solidification cracking, Gleeble strain-to-fracture testing for ductility-dip cracking, and Gleeble hot ductility testing for HAZ liquation cracking. A Gleeble® Model 3800 equipped with data acquisition was used for the hot ductility and strain-to-fracture testing. Details of these tests have been reported elsewhere. (See references in Appendix 3) 9.5 Phase Transformation and Solidification Analysis Select compositions were created using a button melting system to evaluate phase transformations that occur in the weld metal. A range of dilution conditions was selected to represent the range of conditions seen in actual welds. Low dilution buttons ideally represent multipass welds whereas high dilution buttons represent high dilution weld deposits such as V-groove single pass welds. The button melting system consists of a water cooled copper hearth and a GTA torch. Quartz glass surrounds the crucible and the enclosed air-tight volume is evacuated of atmosphere by creating a positive pressure of Ar or other shielding gas, which displaces gas inside the chamber. The gas shields the molten sample from atmospheric contamination, and also stabilizing the GTA welding arc. Time-temperature data was analyzed with single sensor differential thermal analysis (SS-DTA) software for analysis of phase transformations. This technique is different from the traditional DTA technique in that the reference temperature curve is generated by a mathematical function instead of a single phase reference material that does not undergo a phase change. The generated cooling curve is compared to the acquired cooling curve and the point of deviation is determined to be the transformation temperature. The software fits the analytical model to the acquired cooling curve then calculates the deviation from the modeled curve. Phase changes are observed where the deviation of the measured curve from the reference curve is observed due to endothermic or exothermic reactions. This technique is described in detail elsewhere. (See references in Appendix 3). Since the weld metals in this study are fully austenitic and do not undergo solid-state phase transformations like many steels, this techniques was principally applied to determine the solidification temperature range. The liquidus, solidus, and eutectic temperatures were determined using button melting in conjunction with SS-DTA. 9.6 Fume Analysis The fume analysis procedure used during this study involved the collection of welding fume from various generations of the developed consumables using several techniques and the characterization of the collected fume with XRD, SEM, TEM, and EDS. Collection techniques included bulk fume collection with a fume hood, collection with an electrical low pressure cascade impactor, and direct collection onto TEM collection substrates. Incorporating a variety of characterization techniques into the fume study allowed for a more complete analysis on the size, morphology, chemical nature, and composition of fume particles.

10
9.7 Corrosion Testing A number of different corrosion tests were employed to characterize the corrosion and cracking resistance of the materials and welded structure. 9.7.1 Cyclic potentiodynamic polarization tests. Cyclic potentiodynamic polarization (CPP) testing of most metals in NaCl solution reveals two characteristic potentials related to pitting corrosion. The higher one, the pitting potential, EP, is the potential above which pits will initiate and grow during the upward potential scan. The repassivation potential, ERP, is lower than EP and is the potential below which pits stop growing during the reverse scan. As a result, a cyclic experiment involving an upward scan to a potential above the pitting potential and then a downward scan past repassivation results in a polarization curve with a positive hysteresis, i.e. a higher current measured during the back scan than during the forward scan. These two characteristic potentials have been used for years to determine the pitting susceptibility of metals and their alloys. Generally speaking, the higher the values of EP and ER, the more resistant the material is to pitting corrosion. The breakdown potential, EB, is a more general term used for the point of current increase, as the increase can result from pitting, crevice corrosion, intergranular corrosion, or some redox reaction. CPP testing was performed in aerated 0.1M NaCl solution at a sweep rate of 0.167 mV/s. Samples were mounted in epoxy and polished to 600 grit. The epoxy/metal edge was coated with black wax to minimize crevice corrosion. The sample was immersed for up to 1 h prior to starting the scanning to allow for stabilization of the OCP. The breakdown potential was taken as the potential when the current density reached 10-4 A/cm2 on the upward scan, whereas the repassivation potential was taken as the potential at the current density of 10-5 A/cm2 on the downward scan. After the experiment, the sample was removed from the cell and subjected to analysis under an optical microscope. 9.7.2 Crevice corrosion tests. Crevice corrosion tests were performed on welded samples machined to 1” by 2” with a ¼” hole centered at the boundary between the weld metal and base metal to attach the crevice-forming washer. In this way, some of the washer feet were on the weld, some on the heat affected zone, and some on the base metal for each sample. The sample surface was first polished to 600 grit. The crevice forming washers were made from Teflon and machined according to ASTM G78. A torque of 80 N.m was applied to the crevice washers using a bolt. Teflon tape was used to cover the washer feet to prevent microchannel effects from the machining marks on the crevice former as detected in early experiments. Samples were then immersed into aerated 500 or 1000 ppm Cl- solutions (using NaCl) for 31 days. After experiments, stylus profilometry was used to detect the depth of the crevice corrosion, followed by SEM and EDS analysis. 9.7.3 Long term exposure tests. Long term exposure tests in 0.1 M NaCl were performed on welded samples 1” by 2” in size. The sample surface was polished to 600 grit. A Pt wire was spot welded onto the samples to hang them in the solution and to provide electrical contact for electrochemical measurements. The connection spot and the wire were covered with red lacquer to prevent galvanic coupling. The corrosion potential and polarization resistance were measured daily during immersion. Polarization resistance was measured by scanning the potential from -

11
20 to +20 mV relative to the corrosion potential at a rate of 0.167 mV/s. The slope dE/di at the corrosion potential is the polarization resistance, which is inversely proportional to the corrosion rate. 9.7.4 Slow strain rate tests. Slow strain rate testing (SSRT) was performed to assess the susceptibility to stress corrosion cracking (SCC). Tensile specimens were made according to ASTM standard E8M. The gauge length of rod samples was 1 in with a diameter of 0.16 in and the surface was polished to 1 μm to prevent micro cracks. A strain rate of 3 x10⁻⁷ or 1 x 10⁻⁶ s-1 was used. Testing was performed at the open circuit potential in 25 wt% NaCl solution at pH 1.5 and in air for comparison. After experiments, the fracture surface was examined by SEM. 9.7.5 Atmospheric corrosion test. Atmospheric exposure tests were performed on welded samples. Samples were prepared with area of 2” by 2” polished to 600 grit. The samples were mounted at an angle of about 45° on the roof of MacQuigg Lab in Columbus, OH, exposing them to a typical Midwest urban environment. Periodically, the samples were taken down from the roof and subjected to various analyses such as SEM, EDS, and optical microscopy.
9.8 Characterization Various characterization techniques were employed for the metallurgical investigations and welding fume studies. Optical metallography was performed exclusively for weld deposits and weldability samples. Scanning electron microscopy (SEM) was used for examination of weld deposits, weldability samples, fractography, and examination of welding fume particle morphology. Transmission electron microscopy (TEM) was used to examine welding fume particles below approximately 300 nanometers in diameter. X-ray diffraction (XRD) was used on bulk fume samples to determine phases present in the fume, and to determine secondary phases in buttons made (to simulate welds of different dilutions) with the new consumable. Lastly, computational methods were employed to evaluate phase transformations of weld deposits and buttons, and to simulate welding fume formation.
10.0 Results and Accomplishments 10.1 Welding Studies 10.1.1 Coated Electrodes for Shielded Metal Arc Welding SMA welds were produced using 0.125-in. (3.2 mm) Ni-Cu, Ni-Cu-Pd, and Ni-Cu-Ru welding electrodes on 0.25-in. (6.4 mm) thick Type 304L base metal. These welds were performed manually. Welding current was maintained in the range of 120-130 amps, voltage between 24-25 volts, and travel speed at approximately 6 in/min (2.5 mm/s) for all welded samples. Grooves were machined into the Type 304L plate and welded with the Ni-Cu and Ni-Cu-Pd electrodes to achieve all-weld-metal deposits in the grooves. These welds were machined into samples for mechanical, weldability, and corrosion testing. All-weld-metal deposits were produced on a chilled copper hearth to determine the actual (undiluted) filler metal composition of the Ni-Cu, Ni-Cu-Pd, and Ni-Cu-Ru

12
electrodes. These compositions along with the 304L plate used for sample production were shown previously in Table 3. The Generation II electrodes (Ni-Cu-Pd type) used either a Ni200 or Ni209 core wire and attempted to transfer Cu and Pd to the weld deposit by making additions to the coating. The “recovery” of both Cu and Pd in the weld deposit was lower than anticipated and did not meet the original weld metal composition targets. From Table 3 for the Ni-Cu-Pd consumable, note that the Cu level of 4.94 wt% and Pd level of 0.2 wt% are well below the target values of 7.5 wt% and 1.0 wt%, respectively. The Ni200 core wire also resulted in some weld metal porosity. This was eliminated by the use of the Ni209 core wire which contains additions of Ti and Al. The Generation III electrodes (Ni-Cu-Ru type) used core wires that contained the primary alloy additions of Cu and Ru. This required that special heats of the Ni-Cu-Ru composition be prepared by Haynes International. The first of these consisted of a core wire with composition Ni-8.2Cu-1.36Ru-0.56Al-0.53Ti-0.014C. Attempts by both Special Metals and Electrode Engineering to develop an electrode coating that was suitable for this core wire were largely unsuccessful. The most significant problem was weld porosity and a variety of coating formulations (III-E-A1, A2, B1, B2, and B3) were used to try to reduce the porosity levels. The original intent in adding Ti and Al to the core wire was to control the porosity, but the levels added were insufficient. In order to solve the porosity problem, a second core wire composition containing 4.3 wt% Ti was melted by Haynes International. These represent the Generation IV electrodes. This level of Ti successfully eliminated porosity in the weld deposit. 10.1.2 Bare Wire Electrodes for Gas Tungsten Arc and Gas Metal Arc Welding. Welds were also prepared using bare wire (uncoated) electrodes of the Ni-Cu-Pd type (Generation I) and the Ni-Cu-Ru type (Generation III). Both of these wires performed quite well. Some porosity was encountered with the I-W1 wire, but this was associated with some surface contamination residual from wire processing. The III-W1 wire performed exceptionally well and no porosity was associated with welds made with this wire. The welding parameters used for preparation of welds with this wire were provided in Table 4. 10.2 Mechanical Properties Double V-groove weld deposits were made on 90° prepared grooves in 0.25-in. (6.4 mm) thick 304L plate. Dilution levels for the various welds were maintained between approximately 30 and 50% for all samples. Both dogbone samples for tensile testing and bend samples for guided bend testing were machined from these plates. Bend testing revealed the presence of microcracks in the weld metal of the Ni-Cu and Ni-Cu-Pd deposits although samples still passed the requirements of AWS D1.6:1999/4.6.5. The Ni-Cu-Ru samples were free from microcracks. Tensile testing results are shown in Table 5 and plotted in Figure 1. In all cases, the weld metal exceeded the minimum values of strength, elongation, and reduction of area for Type 304L and approached or exceeded values for E308L-16 SMA weld deposits.

13
Table 5. Measured mechanical properties of Ni-Cu, Ni-Cu-Pd and Ni-Cu-Ru weld metals.
Weld Metal
Base Metal
Failure Location
0.2% Proof Stress, Mpa
Tensile Strength,
Mpa
Elongation, %
Reduction in Area, %
Ni-Cu 304L Weld metal 307 597 33.2 43.0
Ni-Cu-Pd 304L Weld metal 263 531 31.7 52.9
Ni-Cu-Ru 304L Weld Metal 279 540 52.0 54.0
304L Minimum Values 170 480 40 50 E308L-16 Typical Values 455 517 35 -
0
200
400
600
800
1000
304L Minimum
Ni-Cu Weld Metal
Ni-Cu-Pd Weld Metal
Ni-Cu-Ru Weld Metal
E308L-15 Weld Metal
Stre
ss (M
Pa)
Yield Strength (0.2%)
Tensile Strength
0
20
40
60
80
100
304L Minimum
Ni-Cu Weld Metal
Ni-Cu-Pd Weld Metal
Ni-Cu-Ru Weld Metal
E308L-15 Weld Metal
Per
cent
(%)
Elongation (%)
Reduction in Area (%)
Figure 1. Mechanical properties of the Ni-Cu, Ni-Cu-Pd, and Ni-Cu-Ru welds.

14
10.3 Weld Metal Microstructure The weld metal microstructure of all the Cr-free consumable deposits consisted of austenite with evidence of second phase precipitation along solidification grain and subgrain (cell or dendrite) boundaries. Representative weld metal microstructures for the Ni-Cu-Ru consumables are shown in Figure 2. The second phase precipitates, which were analyzed with SEM/EDS had a composition corresponding to Ti(C,N)-type carbonitrides as well as various metallic oxides rich in Ti and Al. The presence of high angle, migrated grain boundaries were also observed in the weld metal as shown in Figure 2.
a) b)
Figure 2. Optical micrograph of weld metal microstructures of Ni-Cu-Ru weld metal, a) III-W1 deposited on 304L using the GTAW process, b) IV-E-B4 deposited on 304L using the SMAW process. 10.4 Weldability Testing Weld cracking issues are typically associated with a loss of ductility at elevated temperature. Several weldability test techniques were used to examine weld cracking phenomena including the Transverse Varestraint test, and the Gleeble-based hot-ductility and strain-to-fracture tests. The Varestraint test was designed to evaluate and rank susceptibility to solidification cracking. Hot ductility testing provides an overall indication of the strength and ductility of the material at elevated temperatures and can be used to determine the onset of liquation. The hot ductility “signature” that is developed can be used to evaluate the weldability of both base metals and weld metals. The strain-to-fracture test was developed to determine susceptibility to ductility dip cracking (DDC), which is a solid state cracking phenomenon typically found in high restraint welds of Ni-based alloys. 10.4.1 Solidification Cracking Evaluation Varestraint testing consists of traversing a gas tungsten arc weld over the desired weld metal composition. Strain is applied transverse to the welding direction by bending the sample over a die block with fixed radius during the weld. This induces crack formation, which can be measured after the weld cools. Using the maximum crack distance (MCD), weld travel speed, (TS) and cooling rate (CR), which is acquired with a

15
thermocouple plunged into the weld pool, the solidification cracking temperature range (SCTR) can be calculated according to SCTR = (MCD/TS)*CR. This value is commonly used to compare the solidification cracking susceptibility of different alloys. Figure 3 shows a Varestraint sample plan view with two distinct regions of cracking. The region of solidification cracking (SC) is labeled and another region of cracking occurring in the solid-state is labeled as DDC. Based on these measurements and the cooling rate data collected from the plunged thermocouple, the temperature ranges over which the two types of cracking occurred are listed in the Table 6. This table also contains SCTR data for other stainless steels and Ni-base alloys.
tR
t+
=2
ε
t
R
Tt
tRt+
=2
ε
t
R
Tt
Plan View: Transverse Varestraint Specimen (7% Strain)
Ductility Dip CrackingSolidification Cracking
MCD
Figure 3. Varestraint test schematic and plan view of Ni-Cu-Pd test sample showing solidification and ductility dip cracking regions.
Table 6. SCTR and DDC-TR Values for Ni-Cu, Ni-Cu-Pd, and Ni-Cu-Ru weld metals and a number of austenitic stainless steels and Ni-base alloys based on the Varestraint test.
Material SCTR (°C) DDC-TR (°C) Ni-Cu 111 ± 7 855 - 1055 Ni-Cu-Pd 109 ± 6 770 - 1140 Ni-Cu-Ru 132 920-1130 Type 308L SS 30 Not observed Ni Alloy 617 85 NM Type 310 SS 140 NM Hastelloy X 190 NM Ni Alloy 625 210 NM NM – while ductility dip cracking was observed in these weld metals, the temperature range was not measured
The solidification behavior was simulated with the Thermo-Calc Scheil-Gulliver module and verified with SS-DTA. Solidification is important to consider since the solidification temperature range can affect the solidification cracking susceptibility. Secondary phases can also form during solidification, which may affect mechanical or corrosion properties. Therefore, it is important to predict the solidification temperature ranges and phases that may form. Figure 4 compares the results of simulations and measurements. Both showed that increasing dilution of

16
the Ni-Cu-Pd electrodes with SS 304L increases the solidification temperature range of the weld metal by stabilizing MC-type carbides at lower temperatures. The widening of the solidification temperature range may increase solidification cracking susceptibility, suggesting that it might be important to control dilution levels during welding with these electrodes. It should be noted, however, that no solidification cracks were observed during sample preparation with the experimental electrodes.
1000
1100
1200
1300
1400
1500
1600
-10 0 10 20 30 40 50 60
Dilution by 304L, %
Solid
ifica
tion
rang
e, °
C
SS-DTA
TC-Scheil
TL-eff
TS-eff
1000
1100
1200
1300
1400
1500
1600
-10 0 10 20 30 40 50 60
Dilution by 304L, %
Solid
ifica
tion
rang
e, °
C
SS-DTA
TC-Scheil1000
1100
1200
1300
1400
1500
1600
-10 0 10 20 30 40 50 60
Dilution by 304L, %
Solid
ifica
tion
rang
e, °
C
1000
1100
1200
1300
1400
1500
1600
-10 0 10 20 30 40 50 60
Dilution by 304L, %
Solid
ifica
tion
rang
e, °
C
SS-DTA
TC-Scheil
TL-eff
TS-eff
Figure 4. Measured (SS-DTA) and calculated (Thermo-Calc Scheil) solidification temperature range of Ni-Cu-Pd weld metal as a function of dilution by SS 304L. Based on both the SCTR data (Table 6) and the solidification temperature range data (Figure 4), the solidification cracking susceptibility of the Cr-free weld metals can be considered to be moderate. Under low to moderate restraint conditions, no cracking would be expected. Under high restraint conditions, such as in thick section welds, some cracking might occur. This behavior is consistent with the absence of cracking in the weld samples made under low restraint conditions in this investigation. 10.4.2 Hot Ductility Testing The hot ductility test is widely used to evaluate the weldability of Ni-base alloys and stainless steels. Hot ductility samples were machined from Ni-Cu-Pd and Ni-Cu-Ru weld metal deposited on 304L and tested in the Gleeble® 3800 thermo-mechanical simulator. The dilution level of the weld deposits was approximately 40%. Samples were heated to the desired test temperature at a heating rate of 111°C/sec and then pulled at a crosshead speed of 25.4 mm/s until failure. Reduction in area (%RA) was then determined and used as a measure of elevated temperature ductility. Using this technique for a range of temperatures, an on-heating hot ductility curve was produced as shown in Figure 5. The samples reached a point of zero ductility (zero necking during testing) at 1300°C, which is considered the nil-ductility temperature (NDT). At this temperature, grain boundaries are covered with a continuous liquid film resulting in a complete loss of ductility. An additional test was performed on-heating called the nil-strength temperature (NST) test. A 25-kg load was placed on the sample and it was heated until failure. The value for NST represents the

17
temperature at which sufficient grain boundary liquid is present to allow failure at very low loads. On-cooling hot ductility tests were performed by heating the samples to a temperature of approximately 1315°C (midway between NDT and NST) and then cooling to a predetermined temperature before pulling the sample to failure. This curve is also shown in Figure 5. The temperature at which the sample recovers some ductility is termed the ductility recovery temperature (DRT). The difference between the NST and DRT is considered the crack susceptible region (CSR) as shown in the weld schematic. The Ni-Cu-Pd weld deposits had a CSR of approximately 33°C, which represents the temperature range the weld metal may be susceptible to cracking phenomena such as liquation cracking in the HAZ of a multi-pass weld.
0
5
10
15
20
25
30
35
40
800 900 1000 1100 1200 1300 1400
Temperature (°C)
%R
A
On-heatingOn-cooling
NDT, DRT ˜1300°C
NST = 1333°CDDTR = 850 – 1150°C
from 1315°C
0
5
10
15
20
25
30
35
40
800 900 1000 1100 1200 1300 1400
Temperature (°C)
%R
A
On-heatingOn-cooling
NDT, DRT ˜1300°C
NST = 1333°CDDTR = 850 – 1150°C
from 1315°C
WELD
On-heatingHAZ
On-coolingHAZ
T
tHAZ Thermal Cycle
NDT
NST DRT
CSR
NDTDRT
NST
NST - NDTNST - DRT
WeldDirection
WELD
On-heatingHAZ
On-coolingHAZ
T
tHAZ Thermal Cycle
NDT
NST DRT
CSR
NDTDRT
NST
NST - NDTNST - DRT
WeldDirection
0
5
10
15
20
25
30
35
40
800 900 1000 1100 1200 1300 1400
Temperature (°C)
%R
A
On-heatingOn-cooling
NDT, DRT ˜1300°C
NST = 1333°CDDTR = 850 – 1150°C
from 1315°C
0
5
10
15
20
25
30
35
40
800 900 1000 1100 1200 1300 1400
Temperature (°C)
%R
A
On-heatingOn-cooling
NDT, DRT ˜1300°C
NST = 1333°CDDTR = 850 – 1150°C
from 1315°C
WELD
On-heatingHAZ
On-coolingHAZ
T
tHAZ Thermal Cycle
NDT
NST DRT
CSR
NDTDRT
NST
NST - NDTNST - DRT
WeldDirection
WELD
On-heatingHAZ
On-coolingHAZ
T
tHAZ Thermal Cycle
NDT
NST DRT
CSR
NDTDRT
NST
NST - NDTNST - DRT
WeldDirection
Figure 5. Hot ductility behavior of Ni-Cu-Pd weld metal. Note that the on-heating hot ductility curve also shows what may be a ductility dip in the temperature range of 850° to 1150°C. This range corresponds to the solid-state cracking range (770° to 1140°C) found during Varestraint testing of Ni-Cu-Pd weld deposits. Hot ductility results for the Ni-Cu-Ru weld metal (III-W1) from GTA welds are shown in Figure 6 and compared to the Ni-Cu-Pd results from Figure 5. The on-heating hot ductility behavior for the Ni-Cu-Ru weld metal is clearly superior to that of the Ni-Cu-Pd SMAW deposit and the on-cooling ductility also shows improvement. In both cases the hot ductility behavior suggests that

18
these weld metals should be resistant to liquation cracking based on the narrow NST-DRT temperature range.
Figure 6. Hot ductility behavior of Ni-Cu-Ru and Ni-Cu-Pd weld metals. 10.4.3 Solid-state Cracking Evaluation The Strain-to-Fracture (STF) test was specifically designed to evaluate elevated temperature, solid-state cracking of weld metal. This test was used to evaluate the susceptibility of both the Ni-Cu-Pd and Ni-Cu-Ru weld metals to DDC. GTA spot welds were created in the center of a dogbone tensile sample of weld metal samples to create a reproducible microstructure. The samples were heated to the desired test temperature and held for 10 seconds before being strained to a predetermined displacement (strain). This was repeated at several strain levels at three test temperatures (850, 950, and 1050°C) within the DDC temperature range predicted by the Varestraint and hot ductility tests. A DDC envelope was then developed by determining the threshold strain to initiate cracking at each test temperature. The threshold strains are shown in Figure 7. The threshold strain for Type 304L stainless steel is shown for comparison. Based on these results (and those from the Varestraint tests – Table 6), it would be expected that the Ni-Cu-Ru weld metal might have moderate susceptibility to DDC. Its behavior is comparable to Filler Metal 82, a widely used Ni-base consumable that exhibits low to moderate susceptibility to DDC. The Ni-Cu-Pd weld metal exhibits a relatively low threshold strain for cracking (~ 2%) and may be somewhat susceptible to DDC under high restraint welding conditions.

19
Figure 7. Ductility dip cracking behavior for Ni-Cu-Pd and Ni-Cu-Ru weld metals. 10.5 Fume Analysis Fume was collected with a modified American Welding Society (AWS) type fume collection hood according to AWS/ANSI F1.2:1999. Fume was collected on 0.3 μm pore size glass fiber filters. X-ray diffraction studies were performed on the bulk fume filters and wet chemistry (conforming to ISO 3613 standard) tests were performed to measure Cr (VI) concentrations in the fume. SEM/EDS was used to determine bulk fume composition. Fume generation rates (FGR) of Ni-Cu, Ni-Cu-Pd, and E308-16 (3.2 mm) SMAW electrodes are reported in Figure 8. A flux cored electrode E308LT1-1 is also included for comparison. The Ni-Cu and Ni-Cu-Pd electrodes have FGR values approximately double that of the E308-16 electrode for similar welding heat inputs. However, wet chemistry tests for Cr(VI) content revealed that the Ni-Cu-Pd fume contained approximately 0.02 wt-% Cr(VI) whereas the E308-16 fume contained 2.6 wt-% Cr(VI). A simple calculation indicates that the Cr (VI) generation rate of the E308-16 consumable is approximately 60 times higher than the Ni-Cu-Pd for similar welding conditions. Note that from the bulk fume compositions measured with EDS, the chromium content of the fume dropped by a factor of approximately 20.

20
Element Ni-Cu (Wt-%) E308-16 (Wt-%)F 17.5 -
Na 38.8 0.8Mg 0.2 0.0Si 3.0 8.7Cl 0.3 1.0K 2.3 45.8
Ca 5.0 3.1Ti 5.1 5.1Cr 0.5 9.7Mn 0.6 7.0Fe 1.1 9.0Ni 15.6 -Cu 9.9 -
**Note that Oxygen was also present in fume from bothelectrodes.
Average Welding Fume Composition**0.632
0.555
0.410
0.198
0.0
0.1
0.2
0.3
0.4
0.5
0.6
0.7
E308-16 (0.68kJ/mm)
Ni-Cu-Pd (0.61kJ/mm)
Ni-Cu (0.73kJ/mm)
E308LT1-1(1.46 kJ/mm)
Fum
e ge
nera
tion
rate
(g/m
in)
2.6 wt-%Cr+6
0.02 wt-%Cr+6
0.6320.555
0.410
0.198
0.0
0.1
0.2
0.3
0.4
0.5
0.6
0.7
E308-16 (0.68kJ/mm)
Ni-Cu-Pd (0.61kJ/mm)
Ni-Cu (0.73kJ/mm)
E308LT1-1(1.46 kJ/mm)
Fum
e ge
nera
tion
rate
(g/m
in)
2.6 wt-%Cr+6
0.02 wt-%Cr+6
Figure 8. Fume generation rates of Ni-Cu-Pd and Ni-Cu SMAW electrodes and two stainless steel welding electrodes and bulk fume composition of Ni-Cu and E308-16 fume. Welding heat inputs are indicated next to electrode type. X-ray diffraction results for the Ni-Cu and E308-16 SMAW welding fume are shown in Figure 9. Based on this, the following phases/compounds for the Ni-Cu fume ranked in descending order by magnitude of the diffraction peak intensity is as follows: NaF, (Ni,Cu)O, Ni, Na3(AlF6), MgAl2O4. The E308-16 fume contained the following compounds ranked from highest intensity to lowest: Fe3O4, K2(Cr,Mn,Fe)O4, NaF. It is the K2CrO4 compound that contains chromium in the 6+ valence state. This compound is essentially eliminated in the Ni-Cu and Ni-Cu-Pd fume since there is little chromium available to react and form this compound, resulting in the drastic reduction of Cr(VI).

21
a)
b)
Figure 9. XRD spectra for welding fume collected during SMAW, a) Ni-Cu, b) E308-16.

22
10.6 Corrosion Studies The work in the area of corrosion performed during the seed grant and the early part of this study focused on the electrochemical behavior of Ni-Cu alloys, with the goal of identifying alloy compositions that met the corrosion-related design criteria described above. A Cu content of 5-10% was found to have optimal properties, and the addition of about 1% Pd improved the properties further. The effects of dilution with SS304 and of microstructure were investigated. This early work was performed on button samples and bead-on-plate welds. The first two generations of welding consumables were designed based on the results of these early studies. The corrosion evaluations of welded samples created using the various generations of consumables are reported in this section. Potentiodynamic polarization, crevice corrosion tests, long term immersion tests, and stress corrosion cracking tests were performed. Also reported are studies on button samples exploring the replacement of Pd with Ru. 10.6.1 Generation I W1: Ni-Cu-Pd Gas Tungsten Arc Welds Ni-Cu-Pd GTAW and 308L GTA welds on SS304L base metal were fabricated in the OSU Welding Engineering Laboratory and machined for cyclic potentiodynamic polarization (CPP) tests. Weld metals with two levels of base metal dilution (approximately 16 and 32%) were evaluated. The weld metal to base metal area ratio was about 1:2. The samples were polished through 600 grit and rinsed with deionized water. After polishing, samples were put in a dessicator before the start of cyclic polarization tests in 0.1 M NaCl. Typical polarization curves for 308L and Ni-Cu-Pd GTA welds are shown in Figure 10. The Ni-Cu-Pd welds exhibit a lower breakdown but higher repassivation potential than those of SS308L welds. Also, the corrosion potential and breakdown potential slightly increased with dilution for both welds. Compared to Ni-Cu alloys, stainless steel has a higher breakdown potential and lower repassivation potential. The breakdown potential is the potential where stable pits start to grow, causing the current density to increase dramatically. The repassivation potential is the potential where the pits repassivate and current density drops. The lower repassivation is a more conservative parameter in designing to prevent localized corrosion since localized corrosion is highly unlikely below the repassivation potential. The lower repassivation potential reflects the higher susceptibility of stainless steel to crevice corrosion relative to Ni-Cu alloys. For the Ni-Cu-Pd welds, pits were found exclusively in the weld metal, whereas pits were found randomly on both the weld and base metal for 308L welds. This is can be explained by the difference in base metal and weld metal breakdown potentials. SS308 and SS304 have similar breakdown potentials so the pits will tend to occur randomly both on base metal and weld metal for SS308L weld during a potentiodynamic scan. However, since SS304 has a higher breakdown potential than Ni-Cu-Pd alloy, the pits will preferentially occur on the weld metal for the Ni-Cu-Pd weld.

23
-0.2
-0.1
0
0.1
0.2
0.3
0.4
0.5
0.6
10-11 10-9 10-7 10-5 10-3
Pote
ntia
l (V SC
E)
Current Density (A/cm2)
Ni-7.6Cu-1Pd (32% dilution)
Ni-7.6Cu-1Pd (16% dilution)
308L SS (32% dilution)
308L SS (16% dilution)
Figure 10. Cyclic polarization curves for Ni-Cu-Pd and SS308L GTA welds. 10.6.2 Generation II: Ni-Cu and Ni-Cu-Pd Welds SMAW samples fabricated from the consumables supplied by Special Metals and 304L base metal as described above were tested in 0.1 M NaCl using CPP tests. Welds of two dilutions were tested, 10% (Generation II E1) and 50% (Generation II E2 and E3), respectively. The welding consumables were made using Ni209 rod and coating containing Cu and Pd. The welds had considerable porosity, which affected the mechanical properties, but regions free of porosity existed and corrosion tests were performed in these regions. The weld to base metal area ratio of these samples was again kept at 1:2. Typical polarization curves are shown in Figure 11. Average values of the corrosion, breakdown, and repassivation potential for each weld are shown in Table 7. It is clear that the higher Pd additions increased the critical potentials by up to 60 mV. All Ni-Cu alloys have higher repassivation potentials than that of 308L which means a better resistance to crevice corrosion. However, the breakdown potential for Ni-Cu/304L was lower than for 308L/304L. Again, all pits were found on welds for all Ni-Cu alloys while they were randomly distributed on both weld and base metal for 308L. The beneficial effect from Pd could be even better at lower dilution. Crevice corrosion tests were performed on samples from the SMAW welds as described in the experimental section. In summary, crevice formers were attached to the samples, which were immersed at open circuit in chloride solutions. Replicate experiments were performed for each condition, and will be referred to below as samples 1 and 2.

24
-0.2
0
0.2
0.4
0.6
0.8
10-10 10-9 10-8 10-7 10-6 10-50.00010.0010.01
Pote
ntia
l (m
VS
CE)
Current density (A/cm2)
Ni-8CuNi-5Cu-0.24Pd
Ni-7.6Cu-1.3Pd
308L
Figure 11. Polarization curves for SMA welds.
Table 7. Average values of potentials in mV SCE measured on SMA welds.
Ecorr Eb Erp
Ni-8Cu -134.1 246.9 51.1
Ni-5Cu-0.24Pd -134.4 264 64.4
Ni-7.6Cu-1.3Pd -116.3 279 110.1
308L -132.8 572.2 -49 For Ni-8Cu in 500 ppm Cl-, all crevices were on the weld for sample 1 while sample 2 showed no crevice attack. Crevices were several μm deep for the Ni-4Cu alloy. This is relatively shallow compared with crevice depths on stainless steel, which were up to 30 μm deep. For Ni-8Cu in 1000 ppm Cl-, all crevices were on the weld for sample 1 and sample 2 had one crevice that was partly on the weld and partly on the base metal. Crevice depths were deeper than in 500 ppm Cl- solution. However, the crevice depth on the weld was much shallower than on the base metal. Significant enrichment of Cu on the crevice surface was not observed. For Ni-5Cu-0.24Pd in 500 ppm Cl-, no crevices were found on either sample. In 1000 ppm Cl-, all crevices were on the weld for sample 1, and sample 2 had one crevice partly on the weld and partly on the base metal. One crevice was found on the weld for the 308L sample in 500 ppm Cl-, but crevice depth was much deeper than for the Ni-5Cu-0.24Pd samples in 1000 ppm Cl- solution. Crevices were found on both the weld and base metal for 308L in 1000 ppm Cl- along with lots of pits

25
inside the crevice area. The crevice depth, which was up to 30 μm, was much deeper than that in 500 ppm Cl- solution. Ni-7.6Cu-1.3Pd generated two crevices on the weld, but they were shallow compared with crevices on other welds. Table 8 summarizes all the information regarding crevice corrosion experiments.
Table 8. Summary of crevice corrosion tests, replicate data separated by commas.
Deepest Crevice Depth Measured (μm) Number of Crevices Crevice
Positions Ni-8Cu (500ppm Cl- ) 2, 0 3, 0 W
Ni-8Cu (1000ppm Cl-) 7, 30 3, 6 W, BM and W Ni-5Cu-0.24Pd (500ppm Cl-) 0, 0 0, 0 N/A
Ni-5Cu-0.24Pd (1000ppm Cl-)
5, 3 5, 1 W, BM and W
Ni-7.6Cu-1.3Pd (1000ppm Cl-)
3, 3.4 2, 1 W, W
308L (500ppm Cl-) 10, 13 1, 2 W, W
308L (1000ppm Cl-) 27, 30 5, 4 BM and W In summary, Ni-8Cu showed deeper crevice depth than Ni-5Cu-0.24Pd and Ni-7.6Cu-1.3Pd but still shallower than that of 308L. Ni-7.6Cu-1.3Pd exhibited the fewest crevice sites and the shallowest crevice depth among all three welds which could be attributed to the relatively high Pd content. 308L had deepest crevice depth – much deeper than Ni-Cu alloys in both solutions. The number of crevice sites and deepest crevice depth increased with increasing Cl- concentration. The crevice corrosion test results were in agreement with cyclic polarization test results in which the breakdown potentials of Ni-Cu alloys were lower than that of base metal, and the repassivation potentials were higher. Pd addition to Ni-Cu alloys showed beneficial effect and 308L was more susceptible to crevice attack. The crevices in the tests described above exhibited patterns associated with the machining marks on the surface of the crevice former. Another series of tests was performed using a ceramic crevice former covered with Teflon tape. No patterns were observed in these crevices, and the results were similar to the earlier tests. For a Ni-8Cu weld in aerated 1000 ppm Cl- solution, five crevice sites were observed. One crevice site was partly on the base metal and partly on the weld, as shown in Figure 12. The crevice depth was up to 40 μm on the base metal and only 6-8 μm on the weld. Small particles, identified by EDS as Ti-rich, were observed on the crevice sites. A crevice test on a Ni-7.6Cu-1.3 Pd weld found only 1 crevice site, which was on the base metal.

26
Figure 12. Crevice formed on Ni-8Cu weld. The lower right was on the base metal and the upper left was on the weld.
Long term exposure tests in 0.1 M NaCl were performed on SMAW samples (without crevice formers) as described above. Corrosion potential and polarization resistance were measured daily. Both pits and possible intergranular attack were found for the Ni-8Cu sample. Pits were observed on both weld and base metal for 308L. More visible pits were found on 308L welds than for Ni-5Cu-0.24Pd and possible IGC was found on the weld. Compared with Ni-5Cu-0.24Pd, the Ni-8Cu exhibited reduced corrosion resistance. Figure 13 shows that the Ni-5Cu-0.24Pd weld had a more-noble corrosion potential than the Ni-8Cu and 308L welds. The Pd addition increased the Ni-Cu alloy corrosion potential and improved passivity in agreement with the polarization test results. The polarization resistance of all alloys reached the MΩ-cm2 range immediately after immersion, reflecting their passivity. The polarization resistance of the 308L weld remained the lowest and the NiCuPd weld the highest. In summary, the Ni-5Cu-0.24Pd weld showed better corrosion resistance compared with Ni-8Cu and 308L in the immersion test.
-500
-400
-300
-200
-100
0
100
0 100 200 300 400 500
OC
PSC
E
Time (hrs)
Ni-5Cu-0.24Pd
Ni-8Cu
308L
0
1 106
2 106
3 106
4 106
5 106
0 100 200 300 400 500
Rp
(Ω c
m2 )
Time (hrs)
Ni-5Cu-0.24Pd
Ni-8Cu
308L
(a) (b)
Figure 13. Long term exposure testing of SMAW samples in 0.1 M NaCl. A) Corrosion potential, b) Polarization resistance.

27
SMA welds with low dilution (5%) exhibited lower breakdown potential and repassivation potential than with 50% dilution, Figure 14. Decrease of breakdown potential is expected due to lower levels of Cr and Fe in the weld metal. However, the reason for the lower repassivation potential is unclear. The results of repassivation potentials were confirmed by potentiostatic tests.
-0.2
-0.1
0
0.1
0.2
0.3
10-10 10-9 10-8 10-7 10-6 10-5 0.00010.001
Pote
ntia
l (m
VS
CE)
Current density (A/cm2)
Ni-5Cu-0.24Pd Ni-8Cu
Figure 14. Polarization curves for SMAW welds at 5% dilution. A Ni-Cu weld was immersed in concentrated boiling nitric acid, and the weld was completely dissolved after 2 days, indicating that the Ni-Cu alloy is not suitable for use in oxidizing acid environments. Exposures to reducing acid solutions, 1 M HCl and 1.84 M H2SO4, were also performed. Corrosion attack was only found on the base metal (SS304) in HCl solution. In the H2SO4 solution the color of the weld metal surface changed to brown which could suggest Cu enrichment in the weld metal. The base metal was not attacked in this solution. Cyclic polarization tests in aerated 0.1 M NaCl solution were performed on Ni-8Cu and Ni-7.6Cu-1.3Pd welds. Both were made by GTAW and had a dilution of 20-25%. The Pd-containing weld was fabricated by GTA melting of a generation II SMAW consumable placed in the weld groove as a means of getting a higher Pd content in the weld since Pd was not transferring from the electrode coating during SMA welding. The polarization curves in Figure 15 show that the open circuit potential (OCP), breakdown potential, and repassivation potential of the Ni-7.6Cu-1.3Pd weld are all higher than those of the Ni-8Cu weld. These results are consistent with previous results that showed the addition of Pd improves the corrosion properties of the Ni-Cu alloy. Crevice corrosion tests were also performed on these two types of welds. Generally speaking, the three crevice sites on the Ni-8Cu weld were shallow with average depth of 4-6 μm. However, a part of one crevice site part located on the base metal had a depth about 27 μm. In contrast, the other part of the crevice located on the weld surface had attack depth less than 10 μm. SEM images of the crevices generated on the Ni-8Cu weld μm are shown in Figure 16. The crevice on the base metal (Figure 16a) is much deeper and extensive than that formed on the weld metal (Figure 16b).

28
Figure 15. Cyclic polarization curves for Ni-7.6Cu-1.3Pd and Ni-8Cu welds in 0.1 M NaCl.
a) b)
Figure 16. SEM images of crevices on Ni-8Cu weld. A) one crevice on base metal, b) crevice on weld metal For the crevice corrosion test on the Ni-7.6Cu-1.3Pd weld, all nine crevice sites were located on the weld metal with maximum attack depth about 2-3 μm. An SEM image of the crevice is shown in Figure 17. It is interesting that no crevices formed on the base metal. However, the crevices on the weld metal were very shallow relative to those that typically form on the SS304L base metal. These crevice corrosion tests results are consistent with the higher repassivation potential of Ni-7.6Cu-1.3Pd relative to Ni-8Cu welds and show that the Ni-7.6Cu-1.3Pd welds have better crevice corrosion resistance. This again shows that the addition of Pd improves crevice corrosion resistance.

29
Figure 17. Crevice on weld metal of Ni-7Cu-1.5Pd weld The composition of the passive oxide film on a Ni-8Cu weld with about 50% dilution was studied using x-ray photoelectron spectroscopy (XPS). The sample was abraded to a surface finish of 600 grit and then polarized in 0.1 M NaCl for 10 min at 0 V SCE, which is in the passive range. After passivation, the samples were rinsed with distilled water and dried. XPS analysis was performed on four spots; two in the base metal and two in the weld metal. Average values from the two measurements at each location are reported in Table 9, which shows the percentage of metal cation in the passive oxide film. The accuracy of XPS measurements is on the order of several percent. So the small content of Cu in the base metal and Cr in the weld metal could be artifact. Nonetheless, it is clear from Table 9 that the content in the passive film of Fe oxide and Cr oxide decreased while Ni oxide and Cu oxide increased from base metal to weld.
Table 9. Composition of metal cations in passive film (%).
Element Base metal Weld metal Cu 3.4 5.1 Ni 11.1 67.1 Fe 69.7 26.3 Cr 15.8 1.5
10.6.3 Pd Replacement. As described above, the addition of Pd to Ni-10Cu was beneficial for corrosion resistance. However, Pd is very expensive and adds considerable cost to the alloy even at a fraction of a percent concentration. Therefore, efforts were focused on finding a more affordable replacement for Pd. Ruthenium (Ru) is the cheapest platinum group metal. Additions of Ru have been found to increase the corrosion resistance of passive metals such as stainless steel, Ti, and Cr. Other elements such as tungsten (W), silver (Ag), and titanium (Ti) were also investigated. Buttons with 1% and 0.5% Ru addition were made by electric arc melting under Ar and then air cooling. The following compositions were fabricated: Ni-5Cu, Ni-10Cu, Ni-10Cu-5W, Ni-10Cu-

30
1Ru, and Ni-10Cu-0.5Ru. The samples were mounted in epoxy, and the sample/epoxy edges were sealed with black wax to prevent crevice corrosion. The cyclic polarization test was performed in aerated 0.1M NaCl solution at a scan rate of 10mV/min. Figure 18 shows the results for the 5 as-cast alloy buttons. The Ni-5Cu and Ni-10Cu buttons behaved similarly, though the repassivation potential of the 10Cu alloy was much higher. The addition of 1 % W increased the passive current and decreased the breakdown potential. Samples with 1-5% Ag exhibited many pores on the polished cross-section. In contrast, addition of Ru improved the corrosion behavior of Ni-Cu alloy. Figure 19 shows the corrosion, breakdown and repassivation potentials for Ni-10Cu-1Ru, and Ni-10Cu-0.5Ru as-cast buttons. The higher Ru alloy exhibited increased corrosion, breakdown, and repassivation potentials. Also shown in these figures for comparison are data for Ni-10Cu-1Pd. The alloy with 0.5% Ru exhibited a similar breakdown potential and much higher repassivation potential than the alloy with 1% Pd. This is advantageous from an economical viewpoint, since the Ru is cheaper and less is needed. Adding 2 or 1% Ti to an alloy containing Ru at a 2:1 weight ratio provided no additional improvement in corrosion properties.
-0.3
-0.2
-0.1
0
0.1
0.2
0.3
10-11 10-10 10-9 10-8 10-7 10-6 10-5 10-4 0.001
Ni-5CuNi-10CuNi-10Cu-5WNi-10Cu-RuNi-10Cu-0.5Ru
Pot
entia
l (V SC
E)
Current Density (A/cm2) Figure 18. Polarization curves for as-cast buttons.
-170
-160
-150
-140
-130
-120
-110
-10 0 10 20 30 40 50 60
OC
P (m
V SCE)
Dilution
Ni-10Cu-0.5Ru
Ni-10Cu-1Ru
Ni-10Cu-1Pd
180
200
220
240
260
280
-10 0 10 20 30 40 50 60
Eb
Dilution
Ni-10Cu-1Pd
Ni-10Cu-1Ru
Ni-10Cu-0.5Ru
40
60
80
100
120
140
160
-10 0 10 20 30 40 50 60
Erp
(mV
SCE)
Dilution
Ni-10Cu-Pd
Ni-10Cu-1Ru
Ni-10Cu-0.5Ru
a) b) c)w
Figure 19. Electrochemical data for as-cast buttons. a) corrosion potential, b) breakdown potential, c) repassivation potential.

31
Electrochemical experiments were also performed on homogenized buttons of Ni-10Cu-1Ru and Ni-10Cu-0.5Ru with 0% and 20% dilution by SS304. Homogenization was accomplished by cold rolling to a 75% reduction, heating at 1050oC for 1 h in an evacuated glass tube, and water quenching. The breakdown potentials of the homogenized samples were higher than for the as-cast buttons by only 20-40 mV for both 0% and 20% dilution. The small improvement following homogenization suggests that only a minor extent of Cu microsegregation was present in the as-cast buttons. Electrochemical tests were performed on as-cast Ni-10Cu-1Ru and Ni-10Cu-0.5Ru buttons with dilutions of 0, 20 or 50% in aerated solutions containing 105, 350, 1050, 3500, 10,500, or 35,000 ppm Cl-, Figure 20. Eb increased and Erp increased with increasing dilution level up to 20% and then decreased at high dilution. For all the samples, corrosion potentials were lower than both the breakdown and repassivation potentials, indicating good resistance to localized corrosion even in the high chloride concentration electrolytes. Eb and Erp decreased with increasing Cl- concentration and the difference between Eb and Erp decreased with increasing Cl- concentration. The corrosion potential showed little dependence on Cl- concentration and a weak dependence on the dilution level. The effects of Ru are similar to those found previously for Pd. The corrosion potentials of Ni-10Cu-Ru and Ni-10Cu-0.5Ru are higher than that of 304SS, and the repassivation potentials of the Ni-10Cu-Ru and Ni-10Cu-0.5Ru are much higher than that of 304L. Though the breakdown potential of 304L SS is higher than that of Ni-10Cu-Ru and Ni-10Cu-0.5Ru at low chloride concentration, it approaches that of Ni-10Cu-1Ru and Ni-10Cu-0.5Ru at higher chloride concentration.
-200
-100
0
100
200
300
400
500
600
100 1000 104 105
Pot
entia
l (m
V SC
E)
Cl- Concentration (ppm)
Eb
Erp
OCP
Ni-10Cu-0.5Ru-20%
Ni-10Cu-0.5Ru
Ni-10Cu-0.5Ru-50%Ni-10Cu-1RuNi-10Cu-1Ru-20%Ni-10Cu-1Ru-50%
Figure 20. Effects of Cl- concentration, Ru content, and dilution on corrosion, breakdown, and repassivation potentials. To further investigate the possible replacement of Pd by Ru, simulated welds were made using the Bead on Plate (BOP) technique. Slugs of Ni-10Cu with 0.5 or 1% Ru were placed into holes in 304L and melted using the GTAW process. The dilutions of these welds were found using EDS to be about 50%. Polarization tests were performed with samples having weld to base metal area ratio of 1:2. Results of the polarization tests of Ni-Cu-Ru BOP samples are summarized in Table 10. At 50% dilution the BOP welds with 0.5 or 1% Ru exhibited better corrosion behavior than the 1% Pd addition. The BOP and button samples with 50% dilution exhibited similar results, Figure 21.

32
Table 10. Average potentials in mV SCE for Ni-Cu-Ru bead on plate welds with 50% dilution.
Alloy Ecorr Eb Erp Ni-10Cu-0.5Ru -133.1 240.4 136.3
Ni-10Cu-Ru -119.44 285.62 151.9
-200
-100
0
100
200
300
400
0 10 20 30 40 50
Pote
ntia
l (m
VS
CE)
Dilution
Eb
Erp
OCP
Ni-10Cu-1Ru-as cast
Ni-10Cu-0.5Ru-as cast
Ni-10Cu-1Ru-BOP
Ni-10Cu-0.5Ru-BOP
Figure 21. Corrosion, breakdown and repassivation potentials for as-cast buttons as a function of dilution, Ni-10Cu-0.5Ru: x, Ni-10Cu-1Ru: filled triangles. Also shown are results for BOP welds at 50% dilution, Ni-10Cu-0.5Ru: open diamonds, Ni-10Cu-1Ru: open squares. In another attempt to find an inexpensive replacement for the noble metals Pd or Ru to improve the corrosion properties of Ni-Cu, tungsten carbide (WC) was investigated. WC has been used to replace Pd in Ti alloys. Owing to its high melting point of 2870oC, it will stay in the powder form during welding because the temperature of the welding torch is usually below 2000oC. Samples were made by gas tungsten arc process with a protective Ar gas at 0% dilution. Cyclic polarization tests were performed in aerated 0.1M NaCl solution at a scan rate of 10 mV/min. WC additions were found to be very beneficial to the passivity of Ni-Cu alloys. Both breakdown and repassivation potentials increased with 1% WC addition, but more WC addition did not result in further improvement, Figure 22. The hardness of alloys with WC additions (70-130 HV) was found to be higher than those with Ru (54-68 HV), which would be expected for a microstructure with dispersed hard particles. Such dispersion-strengthened alloys can also exhibit low ductility, which would likely be a major problem for welds containing WC.

33
-0.3
-0.2
-0.1
0
0.1
0.2
0.3
10-11 10-10 10-9 10-8 10-7 10-6 10-5 10-4 0.001
Pote
ntia
l (m
VSC
E)
Current density (A/cm2)
Ni-10Cu-1WCNi-10Cu-3WC
Figure 22. Polarization curves on as-cast buttons containing WC. 10.6.4 Generation III: Ni-Cu-Ru Welds. Electrochemical tests were performed on button samples that were made by gas tungsten arc melting of generation III W1 welding wire of primary concentration Ni-8.2Cu-1.36Ru. This wire was made by casting an ingot and then working it to a diameter of 3.15 mm. Different dilutions (0%, 25% or 50%) were achieved by melting 304L stainless steel chips together with pieces of the Ni-Cu-Ru wire. Cyclic polarization testing was performed on these button samples in aerated 0.1 M NaCl solution, Figure 23. The experimental data are summarized Table 11. The breakdown potential tends to increase with increasing dilution, which might be due to an increase in Cr content. The repassivation potential correspondingly decreases with increasing dilution. Essentially, as dilution increases, the weld metal composition approaches that of stainless steel and behaves more like stainless steel. The OCP of 0% dilution buttons are much higher than the rest of buttons. Figure 24 shows a comparison of critical potentials measured for three types of samples: buttons made from the Ru-containing welding wire, buttons made from pure Ni, Cu, and Ru at a composition of 89Ni-10Cu-1Ru, and bead-on-plated welds made by melting pure elements into a hole in 304L SS. The results are very similar indicating that the presence of the minor alloying elements in the weld wire (such as Ti and Al) has limited effect on the corrosion properties of the weld.
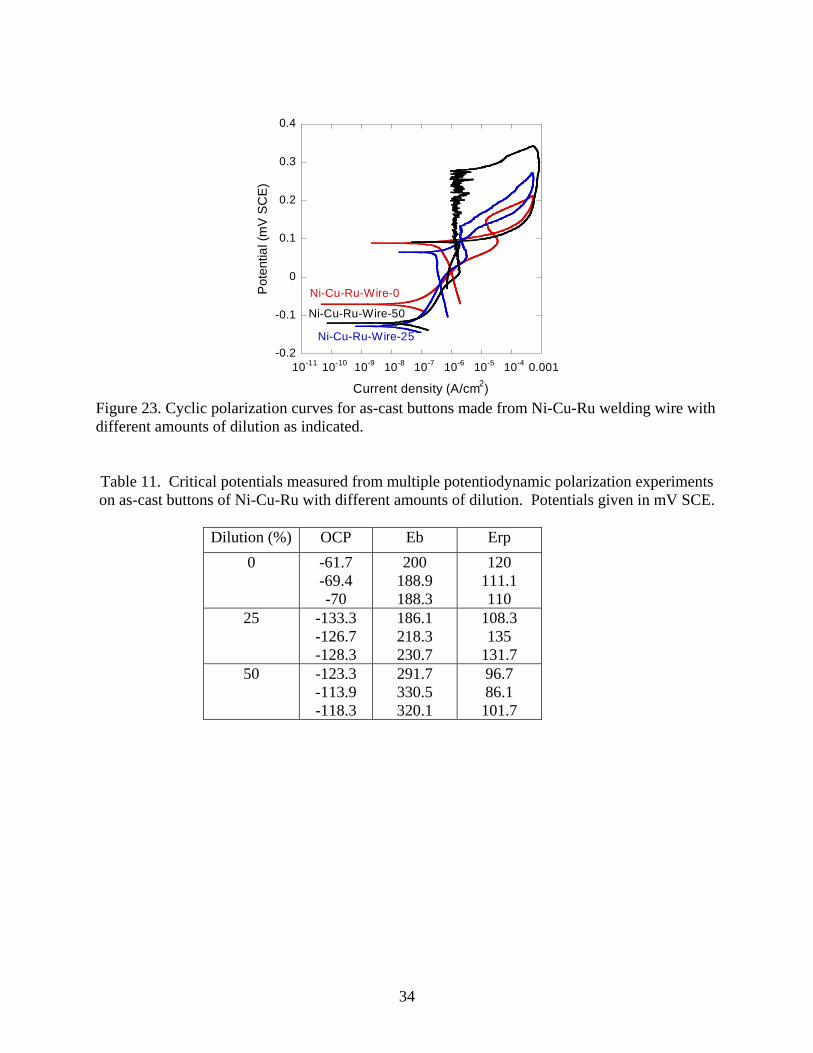
34
-0.2
-0.1
0
0.1
0.2
0.3
0.4
10-11 10-10 10-9 10-8 10-7 10-6 10-5 10-4 0.001
Pot
entia
l (m
V S
CE
)
Current density (A/cm2)
Ni-Cu-Ru-Wire-50
Ni-Cu-Ru-Wire-0
Ni-Cu-Ru-Wire-25
Figure 23. Cyclic polarization curves for as-cast buttons made from Ni-Cu-Ru welding wire with different amounts of dilution as indicated. Table 11. Critical potentials measured from multiple potentiodynamic polarization experiments on as-cast buttons of Ni-Cu-Ru with different amounts of dilution. Potentials given in mV SCE.
Dilution (%) OCP Eb Erp 0 -61.7
-69.4 -70
200 188.9 188.3
120 111.1 110
25 -133.3 -126.7 -128.3
186.1 218.3 230.7
108.3 135
131.7 50 -123.3
-113.9 -118.3
291.7 330.5 320.1
96.7 86.1 101.7

35
-200
-100
0
100
200
300
400
0 10 20 30 40 50 60
Pot
entia
l (m
V S
CE
)
% Dilution
Eb
Erp
OCP
BOP
Figure 24. Critical potentials for Ni-Cu-Ru buttons at different dilutions of SS304L. Data with x symbols are for buttons fabricated from NiCuRu wire starting material and filled triangles are for buttons fabricated from pure elements. Data previously reported for bead-on-plate (BOP) welds shown for comparison. Long time immersion tests were also performed on the NiCuRu button samples described above. The button samples were cold rolled to a reduction of 75%. Then they were connected with a Pt wire using spot welding and hung in aerated 1000 ppm NaCl solution for approximately 700 hours. The corrosion potential and polarization resistance, Rp, (inversely proportional to corrosion rate) were measured daily, Figure 25. The OCP decreased with increasing dilution, with the 25% dilution sample exhibiting an increase in OCP over the first several days. The Rp values were all similar in magnitude, with a tendency for higher Rp at higher dilution. These results were consistent with the potentiodynamic polarization test results.
-150
-100
-50
0
50
100
150
0 100 200 300 400 500 600 700
OC
P (m
V S
CE
)
Time (h)
0%
25%
50%
0
5 104
1 105
1.5 105
2 105
0 100 200 300 400 500 600 700
Rp
(ohm
s-cm
2 )
Time (h)
0%
25%
50%
a) b) Figure 25. Immersion tests on NiCuRu button samples at different dilutions. Samples immersed in 1000 ppm NaCl, a) OCP b) Rp.

36
Electrochemical tests were performed on generation III-E Ni-Cu-Ru GTA welds with dilution of around 30%. Cyclic polarization tests were performed in aerated 0.1 M NaCl solution, Figure 26. The breakdown potential of the Ni-Cu-Ru weld was found to be higher than that of Ni-Cu-Pd SMA weld and also higher than that of Ni-10Cu-1Ru button. However, the repassivation potential was lower. Meanwhile, the OCP of the Ni-Cu-Ru GTA weld was similar to those of the other welds. After the CPP experiment, pits were found on both the weld and base metal, which might explain the relatively low repassivation potential. This is different than Ni-Cu-Pd SMA weld and Ni-10Cu-1Ru button, for which pits exclusively occurred on the weld surface, and is evidence of the corrosion resistance of the weld material.
-0.2
-0.1
0
0.1
0.2
0.3
0.4
10-10 10-9 10-8 10-7 10-6 10-5 10-4 10-3
Pot
entia
l (V
SCE)
Current density (A/cm2) Figure 26. Cyclic polarization curve for Ni-Cu-Ru GTA weld in 0.1 M NaCl. It is very interesting that the pits were found both on the base and weld metal. Cyclic polarization tests were performed on base metal and Ni-Cu-Ru GMA weld metal separately to determine the reason. Electrochemical tests were performed on Ni-Cu-Ru GTA welds with dilution of around 30% in aerated 0.1 M NaCl solution. Since exposure of only base metal or weld metal was desired, the other part was covered by black wax. The edge of the sample was also covered by black wax to prevent crevice corrosion. The cyclic polarization curves of both base and weld are shown in Figure 27. A summary of OCP, Eb and Erp values is shown in Table 12. The OCP values for base and weld metals were very similar, which means galvanic interaction is minimized in this case. Furthermore, the breakdown potential of base metal was similar to that of the Ni-Cu-Ru weld metal, around 360 mVSCE. Also, the value of breakdown potential for both the base metal and Ni-Cu-Ru weld metal was close to that of Ni-Cu-Ru weld as a whole piece. Based on these observations, a possible explanation for the occurrence of pits on both base and weld could be developed. Since base and weld metal have very similar breakdown potential, pits could occur randomly on both base and weld metal as the potential was ramped up. Meanwhile, the repassivation potential for the Ni-Cu-Ru weld metal was higher than that of the SS304L base metal. The repassivation potential of Ni-Cu-Ru weld as a whole piece is about 0 mVSCE which is similar to that of base metal. Hence, it can be concluded that the low repassivation potential for the Ni-Cu-Ru weld as a whole piece was due to the pits on the base metal surface. Since pits appeared on both weld and base metal regions, the potential had to be

37
stepped down to the low repassivation potential for the base metal to stop the growth of pits there.
-0.2
-0.1
0
0.1
0.2
0.3
0.4
0.5
10-10 10-9 10-8 10-7 10-6 10-5 10-4 10-3 10-2
Pote
ntia
l (V
SCE)
Current density (A/cm2)
Whole
Base
Weld
Figure 27. Cyclic polarization curves for Ni-Cu-Ru GTAW base metal, weld metal, and whole weld including base and weld metal regions. Table 12. Critical potentials measured from replicate potentiodynamic polarization experiments
on the base metal and weld metal zones of Ni-Cu-Ru GTA welds, as well as for whole welds including both base and weld metal. Potentials given in mV SCE.
OCP Eb Erp Base -132 410 35 -135 380 23 -140 360 25 Weld -120 340 95 -140 300 73 -128 362 82 -131 310 80 Whole -129 316 -33 -140 323 -22 -127 326 -10
Crevice immersion tests were also performed on the Ni-Cu-Ru GTA weld. The sample was connected to a Pt wire by spot welding and hung in aerated 1000 ppm NaCl solution for around 500 hours. A crevice forming washer was used to create a crevice on the sample surface. After the experiment, only one crevice site was found, and the attack was on the base metal, similar to what has been observed for Ni-Cu-Pd welds, Figure 28.

38
Figure 28. SEM Image of the crevice on base metal of Ni-Cu-Ru weld SMA welds made with the Generation III Ni-Cu-Ru consumable were multipass with three layers, so samples were cut from each layer in the weld deposit. The dilution levels were 22%, 7%, and 4% for layers 1, 2, and 3, respectively. The OCP and breakdown potential Eb increased with dilution level as expected, Figure 29. The results are summarized in Table 13. The repassivation potential Erp also increased with dilution, which is contrary to expectations based on previous data. As dilution increases, weld meld will mix with base metal so the OCP and breakdown potential should increase as the weld metal behaves more like the SS304 base metal. However, since the repassivation potential of the base metal is lower than that of the weld metal, the repassivation should decrease as dilution increases.
-0.2
-0.1
0
0.1
0.2
0.3
10-9 10-8 10-7 10-6 10-5 10-4 10-3
Pote
ntia
l (V
vs.
SC
E)
Current density (A/cm2)
Layer 2
Layer 3
Layer 1
Figure 29. Cyclic polarization curves for layers of Ni-Cu-Ru SMAW welds.
BASE METAL WELD

39
Table 13. Critical potentials measured from multiple potentiodynamic polarization experiments
on different layers of Ni-Cu-Ru SMA welds. Potentials given in mV SCE.
OCP Eb Erp -63 170 146 Layer 1 -110 180 133
-185 158 68 Layer 2 -138 168 71 -150 151 60 Layer 3 -166 128 54
10.6.5 Generation IV: Ni-Cu-Ru with Ti, Al, C additions. Generation IV SMAW samples were first polished to 600 grit then ultrasonically rinsed. Long time immersion tests were performed on Ni-Cu-Ru SMA welds in aerated 0.1M NaCl solution. OCP and Rp were measured daily to monitor the corrosion properties of the new weld. The immersion time was around 500 h. Oscillations in Rp values were observed during the whole exposure, but they generally increased in the early exposure period and then gradually decreased with time, and remained higher than that at the start, Figure 30. This trend reflects an initial passivation process followed by a gradual activation. Crevice corrosion tests were also performed on these welds. Samples were first polished to 600 grit and then ultrasonically rinsed. A torque of about 90 N·m was applied on the crevice washers. Samples were immersed in 1000 ppm Cl- containing solutions for 21 days. After immersion, samples were taken out and subjected to optical and electron microscope analysis. Overall, only one very shallow crevice was observed on the weld metal. Electrochemical tests were performed on generation IV Ni-Cu-Ru SMA welds with dilution of around 30% polished to 600 grit in aerated 0.1 M NaCl solution, Figure 31. As can be seen from Table 14, the OCP, breakdown potential and repassivation potential are similar to those of Ni-Cu-Ru GTAW. The pits were found on both weld and base metal for those samples that show lower repassivation potential.
0
20
40
60
80
100
0 100 200 300 400 500 600
Rp
(koh
m.c
m2 )
Time (h) Figure 30. Polarization resistance of immersed sample for 500 hours.

40
-0.4
-0.3
-0.2
-0.1
0
0.1
0.2
0.3
0.4
10-10 10-9 10-8 10-7 10-6 10-50.00010.0010.01P
oten
tial (
V v
s. S
CE
)
Current density (A/cm2) Figure 31. Cyclic polarization curves for generation IV Ni-Cu-Ru SMAW welds. Table 14. Critical potentials measured from replicate potentiodynamic polarization experiments
on Ni-Cu-Ru SMA welds. Potentials given in mV SCE.
OCP Eb Erp -127 200 -22 -167 276 -46 -160 203 77 -146 253 -44 -140 186 -47 -122 221 26 -158 233 -23
10.6.6 Atmospheric Corrosion. Atmospheric exposure tests were performed on four welded samples: 308L weld, generation II Ni-8Cu weld, generation II Ni-7.6Cu-1.3Pd weld, and generation III Ni-Cu-Ru GTA weld. All samples were welded with SS304 base metal at a dilution of about 50%. The samples were put on the roof of MacQuigg Laboratory on the campus of Ohio State University in Columbus, OH for exposure to a typical Midwest urban environment. The first three samples were exposed starting November 2006 and the Ni-Cu-Ru weld since August 2007. They were checked regularly and photographed. It should be noted that the reflective surfaces were difficult to capture by photography. After 6 months of atmospheric exposure, the first three welds showed no sign of corrosion, which is also true of the Ni-Cu-Ru weld after 9 months. Starting at about 9 months, the Ni-Cu and Ni-Cu-Pd welds have gradually exhibited increasing signs of corrosion on the weld regions while the 308 weld shows less coloration than the other two. Close inspection of samples indicates that some reaction product can be observed on one side of the Ni-Cu and Ni-Cu-Pd samples after 16 months exposure. Optical microscopy examination at a higher magnification of the surfaces of the three samples after 16 months exposure provides a more detailed view of the reaction, Figure 32. Pits were found on the Ni-Cu weld, some on the Ni-Cu-Pd weld, and fewer on the 308L weld. From visual inspection, it can be concluded that Ni-Cu weld is more susceptible to atmospheric corrosion than Ni-Cu-Pd. This is also consistent with polarization and long term exposure results.

41
Some of the samples from atmospheric exposure tests (Ni-Cu, Ni-Cu-Pd, and 308L weld) were subsequently tested in aerated 0.1 M NaCl solution. The OCP and polarization resistance of these three samples were measured, Table 15. It can be seen that the SS308L weld exhibited the highest OCP. Meanwhile, the base metal in both Ni-Cu and Ni-Cu-Pd welds showed lower OCP than the weld metal in both welds which is an indication that base metal is more active and the weld metal is nobler. Hence, the active base metal will protect the noble weld metal. Moreover, the Rp value for SS308L is much lower than for the Ni-Cu welds and Ni-Cu-Pd, indicating a much higher corrosion rate. Even though fewer pits were observed on the SS surface, they seem to be large and maybe deep. The Rp value for Ni-Cu-Pd weld is higher than that of Ni-Cu, which is in line with atmospheric corrosion test results. The Rp values of the Ni-Cu and Ni-Cu-Pd welds (with base metal) upon repolishing and immersion into the 0.1 M chloride solution were 42 and 69 kΩ⋅cm2, respectively. Comparison with the values measured after long term atmospheric exposure in Table 15 indicates that the exposure increased the corrosion resistance. Despite the generation of some small pits on the surface, the formation of a surface layer resulted in a net protection of the samples.
a) b)
c) d) Figure 32. Optical images of atmospheric corrosion samples. A) SS308 GTA weld after 16 months, b) Ni-Cu GTA weld after 16 months, c) Ni-Cu-Pd GTA weld after 16 months, d) Ni-Cu-Ru SMAW weld after 9 months.

42
Table 15. OCP and Rp values of the 3 types of welds.
OCP (mV SCE) Rp (kΩ⋅cm2) 308L – base metal 16 11
308L – base and weld 55 54 Ni-Cu – base metal -95 361
Ni-Cu – base and weld -88 249 Ni-Cu-Pd – base metal -74 352
Ni-Cu-Pd – base and weld 4 463 10.6.7 SCC Susceptibility Evaluation. Slow strain rate testing (SSRT) was performed to assess the susceptibility to stress corrosion cracking (SCC). Strain rates of 3 x10⁻⁷ and 1 x 10⁻⁶ s-1 were used. The results for non-welded SS304L are summarized in Figure 33 and Table 16. The ductility of SS304L in air is extremely high, as determined both by the elongation to fracture and the %RA. In neutral 25% NaCl solution only a small decrease in ductility is observed. However, in 25 wt% NaCl at pH 1.5, SSRT indicates that SS304L is quite susceptible to SCC. The elongation and %RA are greatly reduced and SEM images of the fracture surface indicate brittle transgranular fracture, Figure 34. The embrittlement is greater at slower strain rate.
Table 16. Reduction in area for SSRT of SS304 under various conditions.
Conditions %RA 3x10⁻⁷ in 25wt% NaCl pH 1.5 17.6 3x10⁻⁷ in 25wt% NaCl pH 1.5 19 1x10⁻⁶ in 25wt% NaCl pH 1.5 28.1
3x10⁻⁷ in 25wt% NaCl 51.6 1x10⁻⁶ in air 53.9
Figure 33. SSRT stress-strain curves for SS304 under various conditions.

43
a) b)
Figure 34. SEM pictures of SS 304 in 25wt% NaCl at pH1.5 under strain rate of 3*10-7 s-1. a) scale bar = 200 um. b) scale bar = 500 μm. SSRT samples were fabricated from generation II Ni-Cu-Pd SMA welds according to ASTM E8M as described in the experimental part of this report. The welds had a composition of about 4.94% Cu and 0.24% Pd. The low Cu and Pd content resulted from poor transfer of material from the coating that was around a Ni209 core wire. Samples were tested in air and 25 wt% NaCl at pH 1.5, at a strain rate of 3x10⁻⁷ s-1, Figure 35. In air, the ductility was quite large, but the sample tested in solution exhibited much lower strength and ductility, indicating susceptibility to SCC. After the experiment, the fracture surfaces were examined by SEM to determine the fracture modes. Fracture occurred in the weld region in both environments. The sample tested in air exhibited dimples on the fracture surface, which is an indication of ductile fracture. The sample tested in 25 wt% NaCl at pH 1.5 exhibited brittle transgranular features. Even though Ni and its alloys are usually not very susceptible to SCC, elements such as Fe and Cr mixed with weld metal due to dilution may be the main reason for the susceptibility of the Ni-Cu-Pd weld.
Figure 35. Slow strain rate testing curves for generation II Ni-Cu-Pd welds in air and solution, pH 1.5 25wt% NaCl. Both were performed at a strain rate of 3 x 10⁻⁷ s-1.

44
Generation III Ni-Cu-Ru GTAW welds and generation IV Ni-Cu-Ru SMAW welds were also subjected to SSRT. Figure 36 shows that, for generation III Ni-Cu-Ru GTAW welds, the ductility in air was much lower than that observed for the SS304L sample and the generation II Ni-Cu-Pd welded samples. This might be associated with defects in the welds, which ultimately led to the development of the generation IV consumables. Nonetheless, both the tensile strength and the strain were lower in solution than in air, which is a sign of SCC. Figure 37 shows the surface morphology after SSRT in solution. Two distinctive morphologies are evident on the fracture surface: a ductile zone with dimples and a brittle zone. EDS analysis indicated that the brittle fracture zone had high Fe and Cr, and naked eye observation indicated that the brittle fracture occurred in the base metal near the weld, likely the HAZ. EDS analysis of the ductile fracture zone indicated a high content of Ni and Cu, suggesting that it was the weld zone. Therefore, despite the relatively low ductility of the generation III welds, SSRT in a corrosive environment resulted in fracture at the HAZ as a result of an embrittlement of this region. Figure 37a shows the typical fracture surfaces for Ni-Cu, Ni-Cu-Ru welds in air, which have a lot of dimples indicative of ductile fracture. Figure 37b-d exhibit the fracture surface of the sample in solution, with most of the fracture surface on the base metal (SS304L), and the surface showing cleavage instead of dimples, Figure 37c. Figure 37d shows the small part of fracture surface that went through the weld metal. In this region the fracture was ductile as indicated by the dimples on the fracture surface. Figure 38 shows the SSRT curves for generation IV Ni-Cu-Ru SMAW welds in air and in solution. As described above, the mechanical properties of the generation IV welds were better than those of the generation III welds. SSRT in air indicated a larger ductility than for generation III, but not as large as for generation II for reasons that are not understood, but might be related to differences in the SS304L base metal. Similar to Ni-Cu-Ru GTAW welds, the fracture occurred in the weld region in air because the weld metal has lower tensile strength compared to base metal. The fracture surface of this sample in air was ductile. Figure 38 indicates a lower ductility for the sample tested in solution, but the decrease is less than for the other weld samples indicating a smaller drop-off in properties as a result of SCC. The sample in solution fractured totally in the base metal unlike the generation III Ni-Cu-Ru GTAW sample in solution, which had a small weld part on the fracture surface. Figure 39 shows the fracture surface morphologies after experiment in solution. Figures 39a and b indicate that both intergranular and transgranular brittle fracture was observed. As shown in the low magnification image of Figure 39c and the higher magnification image in Figure 39d, a small region of dimples was also observed on the fracture surface. Unlike the fracture in the generation III weld, EDS analysis indicated that both the ductile and brittle regions were SS304 base metal. The ductile region was probably just the overload fracture after the load bearing section decreased Table 17 exhibits the mechanical properties of the samples from SSRT. The largest change in properties from air to solution was for the SS304L sample, indicating a large susceptibility of this alloy to SCC in this aggressive solution. The generation IV weld exhibited the smallest decrease in ductility in solution relative to air, indicating a relatively high resistance to SCC. Furthermore, it can be noted that all the mechanical properties decreased compared to high strain rate tensile test results, which were presented above.

45
Figure 36. Slow strain rate testing curves for generation III Ni-Cu-Ru welds in air and solution, pH 1.5 25wt% NaCl. Strain rate was 3 x 10⁻⁷ s-1.
a) b)
c) d)
Figure 37. SEM pictures of generation III Ni-Cu-Ru GTAW welds. a) Sample in air, scale bar = 20 μm. b) Sample in solution, scale bar = 500 μm. c) Sample in solution in base metal region (top right of image b), scale bar = 200 μm. d) Sample in solution in weld metal region (bottom left of image b), scale bar = 50 μm.

46
Figure 38. Slow strain rate testing curves for generation IV Ni-Cu-Ru SMAW welds in air and solution. Strain rate was 3 x 10⁻⁷ s-1.
a) b)
c) d)
Figure 39. SEM pictures of generation IV Ni-Cu-Ru SMAW welds in solution, different morphologies are observed on sample surface. a) Intergranular fracture, scale bar = 100 μm. b) Transgranular fracture, scale bar = 50 μm. c) Lower magnification image, scale bar = 500 μm. d) Ductile region at lower right of image c, scale bar = 20 μm.

47
Table 17. Comparison of mechanical properties of 304L and welded samples.
Weld Metal
Base Metal Environment Failure
Location 0.2% Proof Stress, MPa
Ultimate Tensile Strength, MPa
Elongation, %
air 550 750 117 N/A solution 304L 300 380 20
air Weld metal 500 650 90 Gen II
Ni-Cu-Pd SMAW solution Weld
metal 260 410 46
air Weld metal 257 369 20 Gen III
Ni-Cu-Ru GTAW solution Base &
Weld 257 351 14
air Weld Metal 296 446 23.8 Gen IV
Ni-Cu-Ru SMAW
304L
Solution Base Metal 281 416 20.6

48
11.0 Conclusions
1. Chromium-free welding consumables were successfully developed based on both the Ni-Cu-Pd and Ni-Cu-Ru systems. These consumables were in the form of both coated electrodes for shielded metal arc welding (SMAW) and bare wire electrodes for gas tungsten arc and gas metal arc welding (GTAW and GMAW).
2. The performance characteristics of the Ni-Cu-Ru wire for GTAW and GMAW were excellent. Welds were free of porosity and cracking.
3. Coated electrodes based on the Ni-Cu-Ru system required a core wire containing approximately 4.0 wt% Ti in order to avoid weld porosity.
4. The strength of both the Ni-Cu-Pd and Ni-Cu-Ru welds exceeded the minimum requirements for Type 304L stainless steel. The tensile strength of both filler metals was comparable to Type 308L SS filler metal.
5. There was essentially no chromium detected in the fume of the Ni-Cu electrodes and compounds containing Cr(VI) were nearly completely eliminated.
6. Both the Ni-Cu-Pd and Ni-Cu-Ru weld metals exhibited moderate susceptibility to weld solidification cracking, based on the results of the Varestraint test. No solidification cracking was observed in any of the weld deposits prepared during this investigation.
7. The Ni-Cu-Pd and, to a lesser extent, the Ni-Cu-Ru weld metals exhibited potential susceptibility to solid-state, ductility dip cracking. It is expected that this may be an issue only under welding conditions where the restraint is exceptionally high. No ductility dip cracks were observed in any of the welds made during this investigation.
8. Based on the hot ductility test results, it is expected that the weld metal liquation cracking susceptibility of these filler metals during multipass welding will be quite low.
9. In general, the weldability of the Ni-Cu-Pd and Ni-Cu-Ru filler metals is comparable to that of other Ni-base consumables and it is expected that crack-free welds can be produced in most applications.
10. Regarding corrosion, the Ni-Cu Ni-Cu-Pd, and Ni-Cu-Ru consumables result in welds with satisfactory performance in environments typical for Type 304 SS service such as dilute chlorides and non-oxidizing acids. Their corrosion potentials are close to that of SS304 and their repassivation potentials are much higher, indicating a good resistance to crevice corrosion. Crevice corrosion tests have supported this interpretation.
11. Ni-Cu and Ni-Cu-Pd GTA welds exhibited better corrosion properties than SMA welds which could be due to the different welding process.
12. Addition of small amount of Pd or Ru in Ni-Cu alloy improved the corrosion properties of the weld. Ru performs as well as Pd, but is a fraction of the cost.
13. Ni-Cu-Ru GTA welds exhibited excellent corrosion properties in various standard corrosion tests. Cyclic polarization results showed that the base metal and weld have similar breakdown potential while the repassivation potential of weld is higher than that of base metal. Pits were found both on base metal and weld metal which can be explained

49
by the similar breakdown potential. Crevice corrosion results revealed that Ni-Cu-Ru GTA welds have very good immunity to crevice corrosion compared to SS308L welds and SS304 since crevice sites were only identified on base metal.
14. The Generation IV Ni-Cu-Ru SMAW welds exhibit similar results as Ni-Cu-Ru GTA welds from various corrosion tests such as cyclic polarization tests, crevice corrosion tests and long time exposure tests.
15. Atmospheric corrosion tests in typical midwest (central Ohio) weather showed that the Ni-Cu weld is more susceptible to atmospheric corrosion than Ni-Cu-Pd. This is also consistent with polarization and long term exposure results. Meanwhile, SS308L weld exhibited less area of corrosion compared to other welds. However, measurements of corrosion rate in solution after atmospheric exposure showed that both Ni-Cu and Ni-Cu-Pd welds have a smaller corrosion rate compared to SS308L welds.
16. Slow strain rate testing show that SS304L has very good ductility compared to Ni-Cu, Ni-Cu-Pd, and Ni-Cu-Ru welds in air. However, SS304 is very susceptible to Stress Corrosion Cracking (SCC) in aggressive solution. Ni-Cu, Ni-Cu-Pd, and Ni-Cu-Ru showed less susceptibility than SS304. Among all the welds, Ni-Cu-Ru exhibited the best resistance to SCC since the welds fractured in the base metal HAZ.

50
12.0 Appendices
1. Summary of Consumable Development 2. List of Theses and Dissertations 3. List of Papers, Patents and Awards
Appendix 1. Summary of Consumable Development Process
Ni-Cu
Special Metals SMAW Electrodes
Ni-209 core wire. Cu, Pd additions to coating.
Ni-200 core wire.Cu addition to coating.
Ni-7.5Cu-1Ru-0.5Ti-0.5Al-0.02C
Ni-Cu-Ru (Haynes Casting I)
Ni-Cu
Ni-Cu-Pd
Ni-Cu-RuNi-Cu-Ru core wire. Coating A1.
Ni-Cu-RuNi-Cu-Ru core wire. Coating B1.
Euroweld SMAW Electrodes
Ni-Cu-RuNi-Cu-Ru core wire. Coating B2.
Ni-Cu-RuNi-Cu-Ru core wire. Coating B3.
Ni-Cu-Pd
Ames Lab
Ni-Cu-PdGTAW/GMAW wire.
Generation I
Generation II
Generation III
Ni-7.5Cu-1Ru-4Ti-0.5Al-0.02C
Ni-Cu-Ru (Haynes Casting II)
Ni-Cu-RuNi-Cu-Ru core wire. Coating B3.
Ni-Cu-RuNi-Cu-Ru core wire. Coating A2.
Reduced to 0.045-in. wire for GTAW/GMAWIII-BW
Ni-Cu-Ru core wire, flux coatings: 11584, 11595, 11607
Generation IV
II-A
II-B
II-C
III-A1
III-A2III-B1
III-B2
III-B3
IV-B3
IV-11584IV-11595IV-11607

51
Appendix 2. List of Theses and Dissertations
1. G. Guaytima, 2004. A Study of Ni-Cu Weld Metals for Joining Austenitic Stainless Steels, M.S. Thesis, The Ohio State University, Columbus, OH.
2. Y.H. Kim, 2005. Chromium-free Consumable for Welding Stainless Steel: Corrosion Perspective, Ph.D Dissertation, The Ohio State University, Columbus, OH.
3. J.W. Sowards, 2009. Development of Chromium-free Consumable for Joining Stainless Steels, Ph.D Dissertation, The Ohio State University, Columbus, OH.
4. D. Liang, 2009. Environmental and Alloying Effects in Corrosion of Metals and Alloys, Ph.D. Dissertation, The Ohio State University, Columbus, OH.
Appendix 3. List of Papers in Technical Journals and Proceedings, Patents, and Awards Papers:
1. J.C. Lippold, G. Guaytima, G.S. Frankel, and Y.H. Kim, "Development of Ni-Cu Filler Metals for Joining Austenitic Stainless Steels," Stainless Steel World 2004, KCI Publishing BV, Zutphen, The Netherlands, pp. 140-148.
2. Y.H. Kim, G.S. Frankel, G, Guaytima, and J.C. Lippold, 2006. Cr-free consumables for welding stainless steel, Part 1: Monel Filler Metal, Corrosion, 62(1):44-53.
3. Y.H. Kim, G.S. Frankel, and J.C. Lippold, 2006. Cr-free consumables for welding stainless steel, Part 2: Optimization of alloy composition based on corrosion behavior, Corrosion, 62(2):109-120.
4. Yeong Ho Kim, G. S. Frankel, and J. C. Lippold. 2006. Development of a Chromium-free Consumable for Austenitic Stainless Steels: Effect of Dilution and the Behavior of Bead-on-Plate Welds, ISIJ International, 46, 698-704.
5. Y.H. Kim, G.S. Frankel, and J.C. Lippold, 2006. Effect of Noble Element Alloying on Passivity and Passivity Breakdown of Nickel, Passivity 9, P. Marcus, ed., Elsevier.
6. J.W. Sowards, B.T. Alexandrov, J.C. Lippold, D. Liang, and G.S. Frankel. 2007. Development of a Cr-free Shielded Metal Arc Consumable for Stainless Steel. Stainless Steel World 2007, KCI Publishing BV, Zutphen, The Netherlands.
Patent: 1. G.S. Frankel and J.C. Lippold, “Chromium-Free Welding Consumable,” U.S. Patent
7,425,229, issued 9/16/08. Awards:
1. SERDP Project of the Year, 2007 2. Yeong Ho Kim, 2nd Place, Mars Fontana Student Poster Award in Corrosion Engineering, NACE
Corrosion2004, New Orleans. 3. Dong Liang, 1st Place, Mars Fontana Student Poster Award in Corrosion Engineering, NACE
Corrosion2008, New Orleans.