Final Report - Open Development Mekong
60
Oxfam Hongkong May 2006 Final Report
Transcript of Final Report - Open Development Mekong

Oxfam Hongkong
May 2006
Final Report

Executive Summary This study is the first attempt to provide background information on the bamboo sector in Laos in general, and in Houaphan and Xiengkhouang Province in particular. Furthermore we try to analyse the socio-demographic profile of the host communities in the study area as well as analyze different income sector including bamboo sector of farm household in the study area. The study was conducted in two provinces, namely Houaphan (District: Viengxay and Xiengkhor) and Xiengkhouang (Districts: Phaxay and Kham). 12 villages in the two provinces were chosen for the field study. Data gathering involved 134 respondents consisting of farmers (115), village heads (12), trader (1), DAFO staff (4), and PAFO staff (2). In addition, group discussion was done in each village in the two study provinces. The number of the group discussion (7-35 participants) was 24 for the two study provinces. Here we have tried to quantify the different income sectors including bamboo sectors by using data from household surveys, group discussion and key informants interview and by looking at the income situation of the farm household in the two provinces. We employed a multi-method approach, namely participant observation, individual depth interviewing, group interviewing, and documentary research. The advantage of this method is that it can benefit from triangulation, which involves choosing different methods based on their individual strengths and compatibility (Fontana and Frey, 1998; Huberman and Miles, 1998; this study). Moreover, used in combination, these methods can help strengthen the consistency and validity of the data, improving their reliability and contextual value (Denzin and Lincoln, 1998; Huberman and Miles, 1998). As Robert Yin (1989) pointed out “with triangulation, the potential problems of construct validity can be addressed, because the multiple sources of evidence essentially provide multiple measures of the same phenomenon”. By decomposing different methods for income estimation, we are able to find out the income situation. This method of moment’s technique allows us to construct the income sheets for households in the two provinces. The study of the bamboo survey in Houaphan Province found that the total bamboo areas in Viengxay District are approximately 54,382 ha in the upper mixed deciduous forest (UMD) and 1,140 ha for the pure bamboo forest. (PB). In contrast, the total bamboo areas in Xiengkhor District are 17,920 ha for UMD and 10,059 ha for pure bamboo forest. As a consequence, by quantifying the average number of culms per hectare (from sample plots analysis), the total numbers of culms in PB in Viengxay is 4.6 million, while those in Xiengkhor are 40.7 million. For UMD, the numbers of culms in Viengxay District are 496 million, and those in Xiengkhor are 163 million in UMD. By looking at the overall result of the Houaphan Province, it becomes clear that the total bamboo area in UMD is
vi

508,368 ha which consists of 4.6 billion culms, while that in pure bamboo forest is 17,870 ha that consists of approximately 72.4 million culms in the province. Similar to the situation in Houaphan Province, the analysis of Xiengkhouang shows that the total area of the upper mixed deciduous in Phaxay District is 21,304 ha. As a consequence, by quantifying the average number of culms per hectare combined with the bamboo area per district, the total numbers of culms for Phaxay are 65,989, 000 in UMD. Pure bamboo forest does not appear in Phaxay District. By looking at the overall result of the province, it indicates that with the total bamboo area in upper mixed deciduous in Xiengkhouang Province of 461,737.00 ha, it consists of 1.4 billion bamboo culms, while in pure bamboo forest of 1,337 ha, it consists of approximately 5.4 million culms. The study found that the most commonly cultivated species are Bamboo Loung, and Bamboo Phang (Bamboo D. lonoifimbriatus) in Xiengkhouang and Houaphan Province. The purpose of the planting is only for domestic use. From the analysis of the sample plot 3 and 4, it is obvious that the average number of culms that farmer can realize is 2,832 culms per ha. The calculations in Table 13 show the land value (land rent) in agricultural farm productions from the standpoint of the households in the Houaphan region. If one tried to find out the profitability of these sectors from the standpoint of the households by running calculations for different farm sectors, in case that the households use the cost of labor from outside, one might only end up with negative land values or the land values (the profit) is not desirable for farmers, meaning that it would be more profitable to let the land lie idle or transfer it to some other uses. However, most of the farm households in this region used their own labor and input in the production process, while others used the labor from their relatives. Recalculations by considering their own labor cost, and own inputs to production process reveal that the farm households in this region are faced with positive land values. In addition, one of the surprising findings found that the cash income that derived from the bamboo sector has contributed the highest part of the total cash income of the average household in Viengxay District after that from livestock sector. The calculations in Table 13 also indicate that the income from the upland rice sector (Shifting cultivation) is not desirable for the farm households in the Houaphan region. This problem has to be mentioned here, since rice is the main food intake of the rural households in Laos in general and Houaphan Province in particular. The rice yields are extremely low due to the enforcement of the shifting cultivation stabilization program enforced by the government which allows the shorter fallow of the rotation. This leads to the cause of degraded soil. The empirical investigation shows that average farm household of five people produces less than 1000 kg of rice p.a. while they consume about 1500 kg p.a. (Foppes J., Ketphanh, S. 1997). Therefore, a majority of the households in this region have not enough rice for basic consumption. Usually, the time of rice shortage begins from late January on wards after a month of rice harvesting in November. In order to get enough rice for their basic consumption in one accounting year,
vii

they have to produce more income from selling their livestock, bamboo harvesting in Viengxay District, and crop farming (corn, soybean, etc.) in Xiengkhor District, and these are used to trade for rice to alleviate annual food shortages. From the analysis in Table 16, it shows that the families of Viengxay District have more free time than those of Xiengkhor District. While the families of Viengxay District spend their time on harvesting bamboo from natural forest for cash income, those of Xiengkhor spend their time on shifting cultivation, corn and bean cultivation for their cash income. The average income of the Viengxay household is approximately 10 million Kip per year, whilst that of the Xiengkhor household is relatively higher, making up over 14 million kip per year. The analysis also found that the biggest part of the average farm household income from the two districts derives from livestock productions, which consist of cattle raising, pigs, poultries, and fish raising. As mentioned above, it is an interesting finding that the average cash income of the family in Viengxay District from bamboo harvest is ranking second, while that in Xiengkhor District from Bamboo harvest is zero due to the fact that there is no trade of bamboo in this region. Bamboo is only used for domestic consumption. Some farmers slashed and burn the pure bamboo forest in order to establish their crop farming because of the income incentives from them. No doubt, the proportion of the bamboo forest will decrease substantially. Therefore, it is recommended that relevant authorities should consider this problem carefully. Perhaps, a possible solution could be making efforts to create the management plan for the sustainable use of the bamboo resources in the region. Such required efforts are to start with providing the awareness on the importance of the bamboo resource, and especially getting the households involved in the decision making during the land allocation process. One important finding of this study found that the economies of Kham District in Xiengkhouang Province relies heavily on the paddy rice sector (non-cash income), and farm garden sectors, i.e. garlic, banana, vegetable, and watermelon garden. This result is a further confirmation of the empirical study of DAFO report (2005). As can be seen clearly from the household analysis of the study (Table 27), the proportion of the income from the paddy rice sector is the largest and is on average one third of the total household income of Kham District region. Though the result of the analysis has proved that the bamboo sectors in Viengxay District in particular and in other regions in general has high potential for increasing the income condition of the Viengxay region, there are some constraints which hinder its extension. On one hand, the majority of the households in the region have relied only natural bamboo forest without proper management intervention from PAFO or DAFO, and on the other hand, their holding size of bamboo plantation is very few. Therefore, it is very important for the central government to carefully think about the over exploitation of bamboo resource in the natural forest that might exist. A possible solution could be providing policy incentives for enlarging the bamboo plantation. However, this matter should be carefully solved, since there are many factors involved in enlarging the plantation of the farm household. For instance, the credit capital is one of the most important means to enlarge the plantation. In addition, there should have the
viii
opportunities for farm households to have special educational programme, such as training courses, or study tours in other regions that have experiences with this subject matter. One of the key findings from village studies and the self-assessment of Project field teams found that the majority of the farmers are willingness to invest and enlarge their bamboo plantation, especially the local farmers in Viengxay District in Houaphan Province. However, they are still concerned with problems mentioned above. The entry points for overcoming the constraints are provision of the capital credit, management of bamboo resources, skills training, marketing and diversification of products. In this study, we have not touched on the input market studies (services, goods or materials that are used by bamboo producers as necessary part of their faming/business activities, i.e., Agro chemicals/fertilisers, transportation, storage, processing equipment, etc.) since in Laos in general and in the study areas in particularly, the bamboo sector is still in the iniate stage, and the market inputs have not existed yet. In a concluding remark it is tempting to say something about the importance of the kinds of our analyses. Such empirical investigation does not show whether a prevailing or contemplated central government policy is wrong or right, but how political measures work, and what their economic rewards are. Even though such kind of analysis is the first attempt in Laos in general and Houaphan and Xiengkhouang region in particular, it is hoped that the relevant authorities should consider or base their decisions upon these findings.
ix

Table of Contents
Table of Contents .............................................................................................................. x
List of Tables ................................................................................................................... xii
List of Figures................................................................................................................ xiii
Abbreviations ................................................................................................................. xiv
1 Introduction............................................................................................................... 1
1.1 General Background........................................................................................... 1
1.2 Bamboo Resources in Context of Laos ............................................................... 1
1.3 Purpose of the Study ........................................................................................... 2
1.4 Project Members of NUOLs................................................................................ 2
2 Methodology .............................................................................................................. 3
2.1 Triangulation ...................................................................................................... 3
2.2 Quantitative Evaluation...................................................................................... 4 2.2.1 Sampling Framework.................................................................................. 4 2.2.2 Data Processing and Analysis..................................................................... 6
3 RESULTS .................................................................................................................. 7
3.1 Geography of the Study Area, Houaphan Province............................................ 7 3.1.1 Geographical location and Bamboo Resource............................................ 7 3.1.2 Result of Bamboo Survey in Viengxay District ......................................... 7 3.1.3 Result of Bamboo Survey in Xiengkhor District ...................................... 12 3.1.4 Estimation of Bamboo Resources in Houaphan Province ........................ 14 3.1.5 Resource Endowments.............................................................................. 17 3.1.6 Bamboo Luong Plantation ........................................................................ 19 3.1.7 Financial Analysis of Farm Households: Earning, Cost, Economies ....... 21 3.1.8 Summaries of Working Calendar of all Farm and Off-farm sector of Viengxay and Xiengkhor District ............................................................................. 26
3.2 Geography of the Study Area, Xiengkhouang Province ................................... 28 3.2.1 Geographical Location.............................................................................. 28 3.2.2 Result of Bamboo Survey in Phaxay District ........................................... 28
Bamboo D. lonoififmriatus Plantation in Phaxay and Kham District3.2.3 ....... 32 3.2.4 Estimation of Bamboo Resources in Xiengkhouang Province. ................ 34 3.2.5 Description of the study villages in Phaxay and Kham District ............... 35 3.2.6 Resource Endowments.............................................................................. 37 3.2.7 Financial Analysis of Farm Households: Earning, Cost, Economies ....... 39 3.2.8 Summaries of Working Calendar of all Farm and Off-farm Sector of Kham and Phaxay District. ....................................................................................... 42
x

3.3 Policy and Institutional Arrangements ............................................................. 44
3.4 Market participation and Farmer organization of the bamboo sector............. 45
4 DISCUSSIONS AND CONCLUSIONS................................................................ 46
REFERENCES................................................................................................................ 50
xi

List of Tables PageTable 1 Sampling for Farmer Survey in Houaphan and Xiengkhouang
Provinces 05
Table 2 Land use type of Viengxay district 07Table 3 Summary of average data of sample plot in Viengxay and
Xiengkhor District, Houaphan Province. 11
Table 4 Land use type of Xiengkhor District 12Table 5 Estimation of the density of bamboo plantation (Bamboo.
Loung) 14
Table 6 Bamboo resources in all Districts in Houaphan Province 15Table 7 Characteristics of the Study Villages 16Table 8 Size of the surveyed households in the selected villages in
Houaphan Province 17
Table 9 Labor unit of the interviewed households in the selected villages in Houaphan 18
Table 10 Total areas of the surveyed farms in the selected villages in Houaphan Province 18
Land use proportions of the interviewed households Table 11 19Table 12 Bamboo Luong Plantation (production) of the interviewed
households 20
Table 13 Income sheet of an average household unit in Viengxay District in Houaphan Province. 22
Table 14 Quantities of NTFPs collected by an average farm household Table 15 Revenue and cost of the NTFPs sector of an average household 25Table 16 Summaries of average farm household income and Working Calendar
of all Farms and Off-farm sector of Viengxay and Xiengkhor District. 27Table 17 Land use type of Phaxay district 28Table 18 Summary of average data of sample plot in Phaxay District,
Xiengkhoung Province. 31
Table 19 Bamboo D. Lon. Plantation (production) of the interviewed households 32
Table 20 Land Use Type of Xiengkhouang Province 34Table 21 Estimation of Bamboo Resource in Xiengkhouang Province 35Table 22 Characteristics of the Study Villages 36Table 23 Size of the surveyed households in Phaxay and Kham District. 37Table 24 Labor unit of the interviewed households in Phaxay and Kham
District. 38
Table 25 Total areas of the surveyed farms in Phaxay and Kham District. 38Table 26 Farmland use proportions of the interviewed households in
Phaxay and Kham 39
Table 27 Income sheet of an average household unit in Kham District, Xiengkhouang Province 41
Table 28 Summaries of average farm household income and Working Calendar of all Farms and Off-farm sector of Kham and Phaxay 43
xii

List of Figures Page
Figure 1 General map of Lao PDR and surrounding countries. 01
03Figure 2 Convergence of Multiple Sources of Evidence
04Figure 3 Sampling Framework
08Figure 4 Land Use Map of Houaphan Province
09Figure 5 Land Use Map of Viengxay Houaphan Province
13Figure 6 Land Use Map of Xiengkhor District, Houaphan Province
29Figure 7 Land Use Map of Xiengkhouang Province
30Figure 8 Land Use Map of Phaxay District
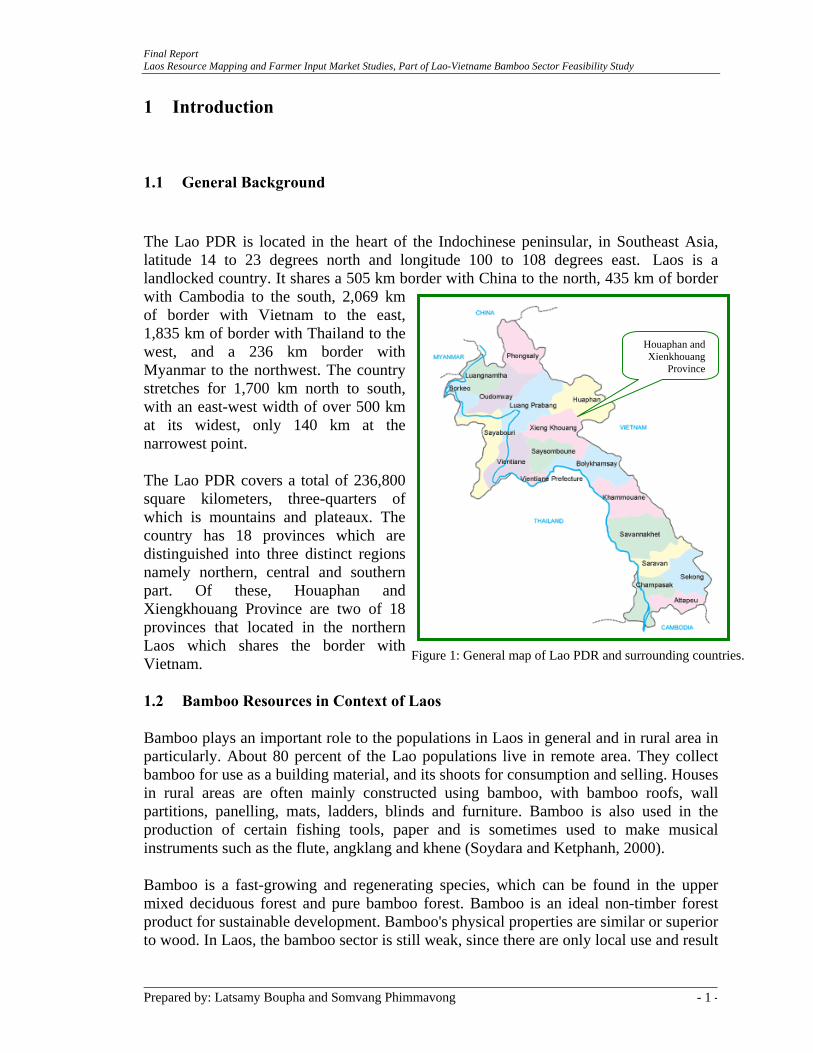
33Figure 9 Land Use Map of Kham District
xiii

Abbreviations
ADB Asian Development Bank Ban Village DAFO District Agriculture and Forestry Office PAFO Provincial Agriculture and Forestry Office DOF Department of Forestry GOL Government of Laos Ha Hectare HH Household IUCN World Conservation Union Kg Kilogram Kip Laos currency (1 US$= 10.400 Kip in December 2003) Km Kilometers NTFPs Non-timber forest products P.A. Per Annum PB Pure Bamboo Forest UMD Upper Mixed Deciduous Forest
xiv
Final Report Laos Resource Mapping and Farmer Input Market Studies, Part of Lao-Vietname Bamboo Sector Feasibility Study
Prepared by: Latsamy Boupha and Somvang Phimmavong - 1
1 Introduction
1.1 General Background
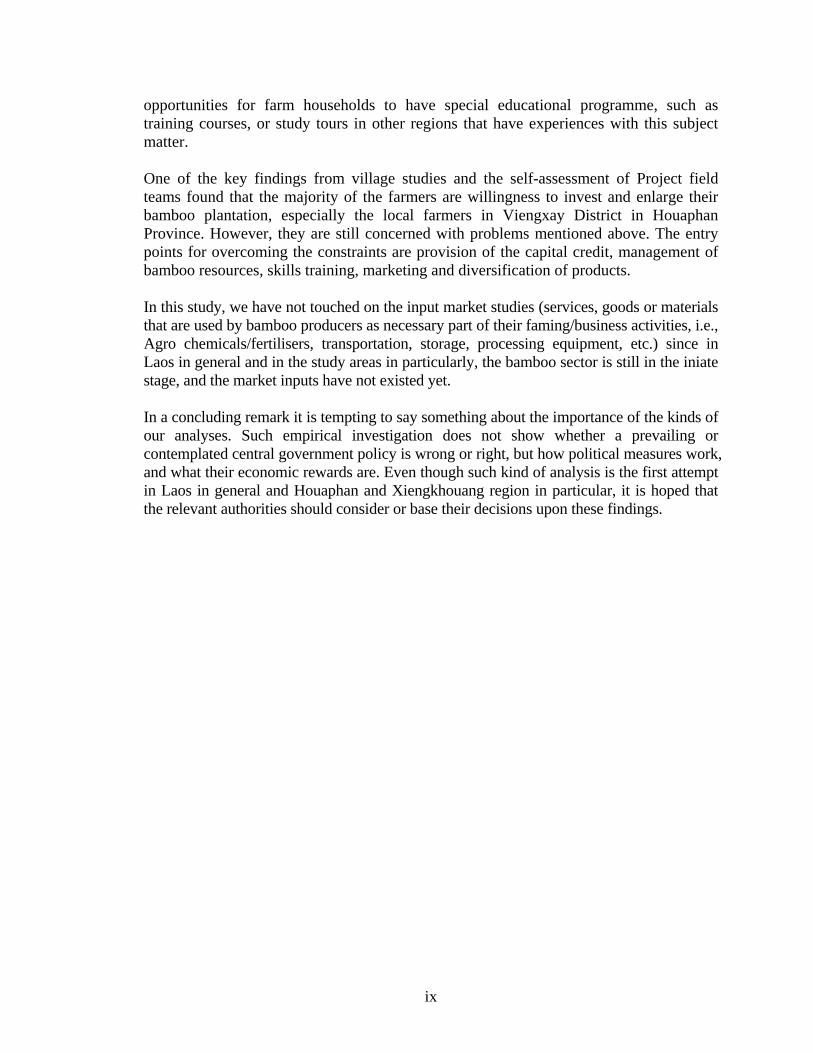
The Lao PDR is located in the heart of the Indochinese peninsular, in Southeast Asia, latitude 14 to 23 degrees north and longitude 100 to 108 degrees east. Laos is a landlocked country. It shares a 505 km border with China to the north, 435 km of border with Cambodia to the south, 2,069 km of border with Vietnam to the east, 1,835 km of border with Thailand to the west, and a 236 km border with Myanmar to the northwest. The country stretches for 1,700 km north to south, with an east-west width of over 500 km at its widest, only 140 km at the narrowest point.
Figure 1: General map of Lao PDR and surrounding countries.
The Lao PDR covers a total of 236,800 square kilometers, three-quarters of which is mountains and plateaux. The country has 18 provinces which are distinguished into three distinct regions namely northern, central and southern part. Of these, Houaphan and Xiengkhouang Province are two of 18 provinces that located in the northern Laos which shares the border with Vietnam.
Houaphan andXienkhouang
Province
1.2 Bamboo Resources in Context of Laos
Bamboo plays an important role to the populations in Laos in general and in rural area in particularly. About 80 percent of the Lao populations live in remote area. They collect bamboo for use as a building material, and its shoots for consumption and selling. Houses in rural areas are often mainly constructed using bamboo, with bamboo roofs, wall partitions, panelling, mats, ladders, blinds and furniture. Bamboo is also used in the production of certain fishing tools, paper and is sometimes used to make musical instruments such as the flute, angklang and khene (Soydara and Ketphanh, 2000).
Bamboo is a fast-growing and regenerating species, which can be found in the upper mixed deciduous forest and pure bamboo forest. Bamboo is an ideal non-timber forest product for sustainable development. Bamboo's physical properties are similar or superior to wood. In Laos, the bamboo sector is still weak, since there are only local use and result
-

Final Report Laos Resource Mapping and Farmer Input Market Studies, Part of Lao-Vietname Bamboo Sector Feasibility Study
Prepared by: Latsamy Boupha and Somvang Phimmavong - 2
in slightly process in the development of bamboo sector. However, China has achieved great progress in the development of bamboo sector. Many products from bamboo from China appear in the international markets. For instance, new products based on bamboo charcoal, vinegar and extracts of bamboo leaves, including medicinal products, natural pesticides, beverages, daily toiletries etc., have great development potential. Bamboo shoots have huge market potential as natural, high-fiber food. Concerning to the bamboo situation in Laos, many bamboo resources were harvested and exported to the neighbouring countries, especially Vietnam with a very little return to the Lao local people. Moreover, there have been very few studies which have been investigated in the bamboo forest in Laos. Therefore, it is an imperative to conduct this study.
1.3 Purpose of the Study The Study is the initial Phase of an envisaged multi-year initiative to support the development of the bamboo sector in Vietnam and Laos. The longer term objective is to develop a diversified bamboo based economic sector in the Vietnam-Laos cross-border mountain areas, centred around the provinces of Thanh Hoa and Nghe An in Vietnam, and Houaphan and Xieng Khouang in Laos, and bringing economic, social and environmental benefits to the poor communities, and to expand this idea to other areas in the region. The specific objectives of the Study are to:
1 To evaluate the potential of the bamboo sector in Laos 2 To identify the scale and scope of the sector and the likely benefits accruing to
sections of the value chain, including the various targeted poor groups of Laos; 3 To develop and evaluate sector development scenarios through the mapping of
opportunities, risks and constraints; 4 To develop plans for subsequent stages of intervention, including priority
interventions and their nature and scale, and a proposed scoping and staging of subsequent phases of the bamboo sector development.
1.4 Project Members of NUOLs
1. Dr. Latsamy Bouapha Project Team Leader 2. Mr. Somvang Phimmavong Vice-Project Team Leader 3. Mr. Somphone Nedthongsavanh GIS expert and survey specialist 4. Mr. Oudone Sichalern Survey Specialist 5. Mr. Metmany Soukhavong Survey Specialist 6. Mr. Phongsong Wangneng Survey Specialist 7. Joost Fooppes Project senior supervisor
-

Final Report Laos Resource Mapping and Farmer Input Market Studies, Part of Lao-Vietname Bamboo Sector Feasibility Study
Prepared by: Latsamy Boupha and Somvang Phimmavong - 3
2 Methodology
2.1 Triangulation This study utilised a multi-method approach. The main quantitative methods used were focus groups meeting, individual depth interviewing, group interviewing, and documentary review. It is rather evident that in many circumstances multi-method approaches benefit from triangulation, which involves choosing different methods based on their individual strengths and compatibility (Fontana and Frey, 1998; Huberman and Miles, 1998, Somvang Phimmavong, 2004).
Archival records
Documents Open-ended interviews
Observations (direct and
indirect participant)
Focused interviews Structured
interviews and surve
ys
Source: Yin, Robert K. (1994) 93 pp.
Figure 2: Convergence of Multiple Sources of Evidence
Moreover, used in combination, these methods can help strengthen the consistency and validity of data, improving their reliability and contextual value (Denzin and Lincoln, 1998; Huberman and Miles, 1998).
In this study, the researchers followed the advice of Yin (1989) strictly. They believed that “With triangulation, the potential problems of construct validity can be addressed, because the multiple sources of evidence essentially provide multiple measures of the same phenomenon”.
-

Final Report Laos Resource Mapping and Farmer Input Market Studies, Part of Lao-Vietname Bamboo Sector Feasibility Study
Prepared by: Latsamy Boupha and Somvang Phimmavong - 4
2.2 Quantitative Evaluation
2.2.1 Sampling Framework The study was based on two provinces of Northern Laos, namely: Houaphan and Xiengkouang. Two districts from each province were chosen for the field study, namely Viengxay, Xiengkhor in Houaphan, and Phaxay and Kham District in Xiengkhouang Province
PROVINCES (2)
A. Houaphan B. Xiengkhouang
DISTRICTS (4)
A. Viengxay B. Xiengkhor C. Phaxay D. Kham
VILLAGES (12)
• 3 villages (A) • 3 villages (B) • 3 villages (C) • 3 villages (D)
Figure 3: Sampling Framework In designing the survey, twelve villages were chosen from the two provinces by using selective samplings. The survey was conducted by the researcher team from Faculty of Forestry, National University of Laos with the help of the local staff of Provincial Agriculture and Forestry Office working as Research Assistants (RAs). Based on the lists of households from the headmen of each village, a simple random method was used to select the respondents, 10 farm household out of the total households from each selected village was picked at random. The detail of the sampling appears in Table 1. Primary data was collected through the questionnaires. There are approximately 115 farmers which were interviewed in the two provinces. Besides the farmer interviews, the staff of Provincial Agriculture and Forestry Office (PAFO), District Agriculture and Forestry Office (DAFO), traders were interviewed during the field investigation. The questionnaires used in this study were modified from GRET model, however a major adaptation was changed in order to reflect the reality of the situation in the Lao PDR. The greatest proportion of the respondents is from Ban. Thoum (33 per cent), whereas the smallest proportion is from Ban. Hap (6 per cent). After excluding the missing values, the
-

Final Report Laos Resource Mapping and Farmer Input Market Studies, Part of Lao-Vietname Bamboo Sector Feasibility Study
Prepared by: Latsamy Boupha and Somvang Phimmavong - 5
total sample size amounts to 115 households with equivalent to 13 per cent of the total household. A total of 5 observations are excluded, most of which had missing values. Table 1: Sampling for Farmer Survey in Houaphan and Xiengkhouang Provinces
Province District Villages selected Total number of households
No. and (%) of households
sampled
Phoun Mai 59 10 (17)
Deui 95 10 (11) Viengxay
Naphoung 35 10 (29)
Sobxay 78 10 (13)
Hap 156 10 (6) HO
UA
PHA
N
Xiengkhor
Sobsan 145 10 (7)
KhongOm 66 10 (15)
Viengkham 94 10 (11) Kham
Phiengkob 51 10 (20)
Naphia 49 10 (20)
Nasome 56 10 (18)
XIE
NG
KO
UA
NG
Phaxay
Thoum 30 10 (33)
Missing Values 5
Total 914 115 (13) Note: Figure in parentheses denote percentages of total household numbers
Source: Field investigation 2006. Data on the cost of labor, management costs, and other input costs of different household income sectors from paddy rice, upland rice farm and non-timber forest products (NTFPs), livestock, bamboo sectors, etc. were collected from group discussion by using working calendar of all farm activities, and the household observation. The price of wage and the farm products were obtained through local market. The data used to develop the representative natural bamboo forest was derived from a field investigation by establish sampling plot in each District. The size of sampling plot is 20 x 20 m. The data of the sample plots namely number of clumps, diameter, lengths, thickness, etc. were collected through the data form. The last input data of bamboo survey was calculated by using Microsoft Excel program, then continuous analyzing and setting Land use map separated by District.
-

Final Report Laos Resource Mapping and Farmer Input Market Studies, Part of Lao-Vietname Bamboo Sector Feasibility Study
Prepared by: Latsamy Boupha and Somvang Phimmavong - 6
.
2.2.2 Data Processing and Analysis All calculations of household income were based on price and costs that were prevalent in 2005-2006. The currency “Lao Kip (Kip)” is used in the analysis and is not converted to US$ because of the different purchase power with same US$ in different countries, Laos, USA or other countries. In addition, all the data in this study is in constant Kip of 2005 and all the monetary terms occurred in before 2005 are converted in Kip in 2005 using average inflation rate. All the financial data processing is applied using various statistical and non-statistical tools. Statistical packages, mainly Microsoft Excel for Windows, available at the Faculty of Forestry Computer Centre are used in this process. Thanks to the facilities of Excel Workbook, the calculation of different income sectors could be repetitive and allows keeping track of the operations.
-

Final Report Laos Resource Mapping and Farmer Input Market Studies, Part of Lao-Vietname Bamboo Sector Feasibility Study
Prepared by: Latsamy Boupha and Somvang Phimmavong - 7
3 RESULTS
3.1 Geography of the Study Area, Houaphan Province
3.1.1 Geographical location and Bamboo Resource Houaphan is one of the northern provinces of Laos (See figure 4). This province shares the borders with Vietnam in the north, the south and the east, with Xiengkhouang and Luangphabang in the west. The total land area of the province covers about 1,750,566 ha. (National Statistics, 2004). The distance between Houaphan and Vientiane is approximately 650 Km. Twelve ethnicities makes the province’s population of approximately 280, 780; among them Thai Khao, Thai Deng, Thai Dam, Thai Lu, Phuan, Khamu, Hmong, Lao phong, Sila, Mien, Punoy, and Vietnamese (Census, 2005). The province has 8 District, which consist of 784 villages. The total number of households in the province is 43,288 household with the average of 6.5 people per household. In Viengxay, there are approximately 130 villages (5753 households) with the population of 35,272, while in Xiengkhor, there are only 62 villages or 4253 households with the population of 26814. The districts selected for the present investigation are Viengxay and Xiengkhor District. These two Districts have border with Thanh Hoa and Nghe An Province of Vietnam.
3.1.2 Result of Bamboo Survey in Viengxay District o oViengxay District lies within the longitude of 104 03’ and 104 43’ E, and the latitude of
20o 08’ and 20o 42’ N. The elevation is from 700-1250m (See figure 5). Approximately 80% of the district area is mountainous. The District shares the border with Vietnam in the east, with Sopbao and Vietname in the north, with Xamneu on the west and south western with Xamtay District on the south. The total area of Viengxay is 165,499.88 ha, which was classified into the different 10 land use types, namely Upper Mixed Deciduous, Coniferous Forest, Mixed Broad-Leaved and Coniferous, Unstocked Forest, Ray, Schrub, Rice paddy; Grass land and Water. Of these, the bamboo shares the proportion of 0.69 per cent of the total area. Table 2: Land use type of Viengxay district
Land Use Type Area (ha) % Area Upper Mixed Deciduous 54,382.34 32.86Coniferous Forest 111.30 0.07Mixed Broad-Leaved and Coniferous 204.19 0.12Bamboo 1139.60 0.69Unstocked Forest 76126.14 46.00Ray 16006.98 9.67Schrub 2180.22 1.32Rice Paddy 7489.72 4.53Grassland 7840.27 4.74Water Bodies 19.13 0.01Total 165,499.88 100.00
Source: Lao National Forest Inventory Data Base, DOF, 2004
-

Final Report Laos Resource Mapping and Farmer Input Market Studies, Part of Lao-Vietname Bamboo Sector Feasibility Study
Figure 4: Map of Land use type of Houaphan Province
Figure 4: Land Use Map of Houaphan Province
Prepared by: Latsamy Boupha and Somvang Phimmavong - 8 -

Final Report Laos Resource Mapping and Farmer Input Market Studies, Part of Lao-Vietname Bamboo Sector Feasibility Study
Figure 5: Land Use Map of Viengxay Houaphan Province
Figure 5: Map of Land use type of Viengxay Houaphan Province
Prepared by: Latsamy Boupha and Somvang Phimmavong - 9 -

Final Report Laos Resource Mapping and Farmer Input Market Studies, Part of Lao-Vietname Bamboo Sector Feasibility Study
Prepared by: Latsamy Boupha and Somvang Phimmavong - 10
In designing the bamboo survey, 4 sample plots were selected in Viengxay District. Of these, two plots are natural bamboo forest, and others are plantation, which is cultivated by the local villagers near their house and farm land. The sample plots for natural bamboo forest are 400 square meters (20m x 20m), which are located in the upper mixed deciduous forest in the south of Viengxay District in Houaphan Province. The detail and the result of the analysis are as follows: A. Sample plot No. 1 The sample plot is about 4.5 kilometers from Phounmai Village, which is about 100 meter from the main road to the east. The sample plot lies within the altitude of 720 m, and the slope of 55%. The bamboo in this area was harvested and exported to Vietnam in the last 2 years, thus the present bamboo culms are not very big. The result of the analysis appeared in Table 2 shows that the dominant bamboo species found are only Bamboo Kouane, which covers 100 per cent of the total area of the sample plot. The result also illustrates that there are 85 clumps, which consist of 811 culms in the sample plot. Of these, the bamboo age one year old consists of 90 culms, while age 2-3 years old 721 culms. The bamboo in Laos in general and in Houaphan Province in particularly is almost sympodial with the average distance between clumps measured of 1, 46 m on an average. The average diameter of clump is 95 cm, which varies from 30-250 cm. Similar to their lengths; the study found that the average length of bamboo culms measured is almost 7 m with the standard deviation of 159. In addition, stem diameter varies from 1.5 to 6 cm with the standard deviation of 0.97. The average section length is 63.50 cm with the maximum of 80 cm and the minimum of 43 cm. The bamboo thickness is on average 0.37 cm, which varies from 0.2 to 3.5 cm. B. Sample plot No2 The sample plot is approximately 2 kilometers away from Deui Village, which is about 100 meter from the main road to the east. The sample plot lies within the altitude of 511 m, and the slope of 20 per cent. Bamboo Koune is the only dominant species in the Plot. Unlike Plot 1, this plot is quite high density. The overviews in Table 3 shows that the number of clumps in Plot 1 is greater than that of Plot 2. Likewise, the number of culms in plot 2 is 580, which slightly smaller than that of Plot 1. The average length of the stem in this Plot is 2,040 cm with standard deviation of 848, which is much longer than those of Plot 1. The stem diameter of Plot 2 doubles that of Plot 1, while the thickness of Plot 2 is 0.54, which is much thicker than that of Plot 1. By looking at the overall result of two natural bamboo sample plot, it becomes clear that the quality of bamboo resources in Plot 2 is much better than those in Plot 1. This might
-

Final Report Laos Resource Mapping and Farmer Input Market Studies, Part of Lao-Vietname Bamboo Sector Feasibility Study
Prepared by: Latsamy Boupha and Somvang Phimmavong - 11
owing to the fact that there are no any logging activities in Plot 2 whilst the logging in Plot 1 did exist in the last two year. Table 3: Summary of average data of the sample plot in Viengxay and Xiengkhor District, Houaphan Province.
C. Sample plot No 3 The sample plot 3 is a bamboo plantation, which is located in the north east of Deui Village. They were planted around paddy field, along Phoun River. The Elevation of the plot is 391 m with the slope of 3 per cent. The sample plot is 22 x 22 m. The local name of this species is Mai Loung. Local villagers use them for making a house and garden fence. Some sold them and exported to Vietnam in the last few year. In this plot, the number of clump is only 3 with the total number of 82 culms. There are 17 culms for bamboo age 17 and 67 for bamboo age more than 2.
No. of Culms
Plot No. No. of Clump
s 1
year
2-3 year
Total No. of
Culms
Distance Between Clumps
(Cm)
Clumps Diameter
(Cm)
Length (Cm)
Stem Diameter
(Cm)
Section Length (Cm)
Thickness (Cm)
Natural Bamboo Kouane in Mixed Deciduous Forest in Viengxay District
85 90 721 811 146 95 695 3.3 63.79 0.37 Mean
Maximum - - - - 400 250 900 6.00 80.00 3.50
Minimum - - - - 40 30 60 1.50 43.00 0.20 1
- - - - 64 52 159 0.97 9.95 0.35 Std.
15 80 500 580 231 311 2040 6.30 77.08 0.54 Mean
Maximum - - - - 800 600 2260 6.85 78.25 0.70
Minimum - - - - 50 100 0 5.73 76.00 0.40
2
- - - - 187.42 143 848 0.56 1.13 0.15 Std.
Bamboo Loung (Plantation) in Viengxay District
Mean 3 3 17 67 82 816.67 433 1423 11.0 40.0 1.40
Mean 4 10 27 79 131 810.00 430 1424 9.04 40.0 1.40
Natural Bamboo Xang in Pure Bamboo Forest in Xiengkhor District
Mean 5 9 25 137 162 444 316 800 3.50 40 0.35
Source: Own team investigation, 2006
-

Final Report Laos Resource Mapping and Farmer Input Market Studies, Part of Lao-Vietname Bamboo Sector Feasibility Study
Prepared by: Latsamy Boupha and Somvang Phimmavong - 12
The average distance between clump is 8.16 m, and the average diameter of clump is 4.33 m. This species are the biggest culms of all sample plots with the average length of 14.23 m. The average diameter is also large measured 11 cm. While the average length of section is 40 cm, its thickness is approximately 1,4 cm. D. Sample plot No 4 The sample plot 4 is also located in Deui Village. The plot size is 16.5 m x 20 m. The species planted is Bamboo Loung, which were planted in hilly area with the slope of 50 per cent, and the altitude of 466 m. There are 10 clumps which consist of 131 culms. The average distance between clumps is about 8 meter with the average diameter of clump of 4.30 m. The average length of the stem is 14.24 m with the average diameter of stem of 9.04 cm, and average length of section is 40 cm. The thickness is exactly the same size like Plot 3.
3.1.3 Result of Bamboo Survey in Xiengkhor District The bamboo resources in Xiengkhor District are dominantly covered by pure bamboo forest, which cover approximately 12.34 per cent of the total land use. From the finding of NAFRI bamboo cover about 45-60 per cent in UMD (NAFRI, 2004). Likewise, the land cover in Xiengkhor was classified into the different 10 land use types, namely Upper Mixed Deciduous, Coniferous Forest, Mixed Broad-Leaved and Coniferous, Unstocked Forest, Ray, Scrub, Rice paddy; Grass land and Water (See figure 6). Table 4: Land use type of Xiengkhor District
Land Use Type Area (ha) % Area Upper Mixed Decidious 17919.74 21.98Coniferous Forest 127.38 0.16Mixed Broad-Leaved and Coniferous 106.20 0.13Bamboo 10058.64 12.34Unstocked Forest 26619.46 32.65Ray 17662.78 21.67Rice Paddy 5209.45 6.39Grassland 2757.28 3.38Water Bodies 1059.08 1.30Total 81520.01 100.00
Source: Lao National Forest Inventory Data Base, DOF, 2004
-

Final Report Laos Resource Mapping and Farmer Input Market Studies, Part of Lao-Vietname Bamboo Sector Feasibility Study
Figure 6: Land Use Map of Xiengkhor District, Houaphan Province
Figure 6: Land Use Map of Xiengkhor District Houaphan
Prepared by: Latsamy Boupha and Somvang Phimmavong - 13 -

Final Report Laos Resource Mapping and Farmer Input Market Studies, Part of Lao-Vietname Bamboo Sector Feasibility Study
Prepared by: Latsamy Boupha and Somvang Phimmavong - 14
E. Sample Plot No 5 Plot 5 is situated in the pure bamboo, which is far away from Hab village to south west about 4 kilometers. The distance from the main road is approximately 3 km with the altitude of 697 m and the slope of 60 per cent. The sample plot is 20 x 20 m. B. striata Lodd. ex Lundl. (B. vulgaris) found is the only dominant species in this area. The local name is Mai Xang. The result indicates that there are the total numbers of 9 clumps which consist of 162 culms. Of these, 25 culms were one year old, while other 137culms are 2-3 years. The average distance between clumps is 4.4 m with the clump diameter of 3.16 m. The length of this species is 8 m with the average stem diameter of 3.5 cm. It is noticeable that the average length of section of this plot is the same dimension as the plot 3, and plot 4. However, thickness of this plot is the smallest measured only 0.35 cm.
3.1.4 Estimation of Bamboo Resources in Houaphan Province
3.1.4.1 Bamboo Plantation The most commonly cultivated species are Bamboo Loung, and Bamboo Phang (Bamboo D. lonoifimbriatus) in Xiengkhouang and Houaphan Province. The purpose of the planting is domestic use. For instance, farmer uses bamboo round poles for house construction, fencing, etc. Table 5 shows the estimation of the density of bamboo plantation in Viengxay District in Houaphan Province. From the analysis of Plot 3 and 4, it is obvious that the average number of culms that farmer can realize is 2832 culms per ha. By comparing the two sample plot, it shows that the number of culms in Plot 3 is fewer than that in Plot 4 due to the fact that the local villagers harvested some bamboo poles for their domestic consumption. Table 5: Estimation of the density of bamboo plantation (Bamboo. Loung)
Description Sample Plot No. 3 Sample Plot No. 4 Estimated Average
Culms per Ha Plot area (m2) 484 330 No. of culms in the sample plot 82 131 Total culms per ha 1694 3970 2832
Source: Own investigation, 2006.
3.1.4.2 Natural Bamboo Forest in Houaphan Province Table 6 summarizes the bamboo area, average number of culms per ha, and the estimated volume of bamboo resources in Houaphan Province. For bamboo area of each District in Houaphan Province, the results are estimated by using the data analysis from Bamboo survey during the field together with using the data base from Forest Inventory and Planning Division, DOF (2004).
-

Final Report Laos Resource Mapping and Farmer Input Market Studies, Part of Lao-Vietname Bamboo Sector Feasibility Study
Prepared by: Latsamy Boupha and Somvang Phimmavong - 15
The analysis shows that the average number of culms per ha in the upper mixed deciduous is 4 times greater than that in the pure bamboo forest in Viengxay and Xiengkhor District in particular, and in other districts of Houaphan Province in general. As a consequence, by quantifying the average number of culms per hectare combined with the bamboo area per district, the total numbers of culms in Viengxay are 4.6 million (PB), and 496 million (UMD) while those in Xiengkhor are 40.7 million (PB and 163 million (UMD). By looking at the overall result of Houaphan Province, it becomes clear that the total bamboo area in UMD is 508,368 ha which consists of 4.6 billion culms, while that in PB is 17,870 ha that consists of approximately 72.4 million culms in the province. Table 6: Bamboo Resources in all Districts in Houaphan Province
* Bamboo Area per
district (ha) ¶Average number of
culms per ha Total number of culms
(1000 Culms)
Province District
Upper Mixed
Deciduous Pure
Bamboo
Upper Mixed
Deciduous Pure
Bamboo
Upper Mixed
Deciduous Pure
Bamboo Houameuang 73,802 1,614 17388 4050 673,700 6,537
Xamtay 111,445 3,716 17388 4050 1,017,319 15,049
Xamneua 80,759 1,173 17388 4050 737,207 4,750
Xiengkhor 17,920 10,059 17388 4050 163,579 40,737
Viengxay 54,382 1,140 17388 4050 496,426 4,615
Viengthong 140,434 114 17388 4050 1,281,941 461
HO
UA
PHA
N
Sopbao 29,626 55 17388 4050 270,436 223
Total 508,368 17,870 - - 4,640,608 72,372Note: * the result is based on the data base from Lao National Forest Inventory, 2004. Bold lettesr refer to the study location Source: Field Investigation, 2006.
3.1.4.3 Description of the Study Villages in Viengxay and Xiengkhor District Some characteristics of the study villages are shown as Table 7. Some of key finding from village studies and the data analysis of project field teams can be summarized as follows:
-

Final Report Laos Resource Mapping and Farmer Input Market Studies, Part of Lao-Vietname Bamboo Sector Feasibility Study
Table 7: Characteristics of the Study Villages in Houaphan Province
Viengxay District Xiengkhor District
Ban. Phoun mai Ban. Deui
Ban. Naphoung
Ban. Sobxay Ban. Hap Ban. Sobsan
1969 Over 200 years 1935 Over 200 years Over 200 years Over 500 years Settlement
472 m 393 m 494 m 297 m 248 m 259 m Attitude
Paved road 6, 8 Km from Nameo border
2 Km unpaved road from main road
All year round, Paved road 6
All year round, Paved road 6 All year, Paved road 6 All year round, Paved road 6 Access/Season
Viengxay, 2 hour by car
Close to the district Viengxay, 1 hour by car Viengxay, 1.5 hour by car Close to the district Close to the district District Centre
689 (368 female) 328 (168 female) 554 (260 female) 190(102 female) 472 (235 female) - Population (HHs)
Tai kao and tai dam
1Ethnicity Tai deng Tai deng1 Tai deng1 Tai kao (Buddhism) Tai kao (Buddhism) 1
Completed primary and secondary
Completed primary school
Completed primary and secondary school
Completed primary and secondary school Completed primary school Completed primary school Education
Sickness common Sickness common Sickness common Better off Better off Better off Health
Medecines Viengxay Hospital or in Vietnam
Medecines Viengxay Hospital or in Vietnam
Medecines Viengxay Hospital or in Vietnam
Close to hospital Close to hospital Close to hospital Facilities
0.75 ha/HH 0.77 ha/HH 1.1 ha/HH 1.7 ha/HH 1.15 ha/HH 1.34 ha/HH Cultivated land 2.68 ton/ha (paddy
rice) 2.96 ton/ha (paddy rice) 3.75 ton/ha (paddy rice) 2.00 ton/ha (paddy rice) 3.13 ton/ha (paddy rice) 3.95 ton/ha Rice production
Some HH Some HH Some HH No Very Few HH Few HH Rice deficit
Mai Kone, Loung, D. lonoifimbriatus, Schizostachyum,
B. tulda Roxb., G. albociliata Munro & Kurz, etc.
B. striata Lodd. ex Lundl. (B. vulgaris), D. brandisii Kurz, B. nutans Wall. ex
Munro, etc
Same as Sobxay
Bamboo species occurred Same as Phounmai Same as Phoumai Same as Sobxay
Sources : Faculty of Forestry, NUOLs, 2006.
Tai deng, tai dam, and tai kao are the sub ethnic groups of Lao-Tai Language Family (Department of ethnics, 2005) 1
Prepared by: Latsamy Boupha and Somvang Phimmavong - 16 -

Final Report Laos Resource Mapping and Farmer Input Market Studies, Part of Lao-Vietname Bamboo Sector Feasibility Study
Prepared by: Dr. Latsamy Boupha and Somvang Phimmavong Faculty of Forestry, National University of Laos, Lao PDR
17
3.1.5 Resource Endowments
3.1.5.1 Labor Household Size One of the most important criteria of the farm households’ method of farm operation in the study area is their size, i.e. the number of persons who procure family subsistence directly from the farm operations. Table 8 highlights an overview of the average number of family members in the selected villages in Viengxay District and Xiengkhor in Houaphan Province. Accordingly, 58 households were surveyed (10 per cent of all households). Table 8: Size of the surveyed households in the selected villages in Houaphan Province
Average number of members per household
District Villages selected
Total number of households
No. and (%) of
households sampled
Mean Max. Min.
Phoun Mai 59 8 (17) 7.63 13 5
Deui 95 10 (11) 6.7 12 4
Viengxay
Naphoung 35 10 (29) 6.8 11 4 Sobxay 78 10 (13) 6.8 12 5 Hap 156 10 (6) 6.6 10 3
Xiengkhor
Sobsan 145 10 (7) 4.4 7 2 2 Districts 6 villages 568 58 (10.2) 6.4 - - Note: Figure in parentheses denote percentages of total household numbers Source: Own investigation (2006) It becomes clear that on average 6 persons are living in each household. There is only a small difference between the average sizes of the households from different villages. The number of household members, however, varies from 2 to 13 persons. The minimum size in Phoun Mai exceeds that of the other villages as households of this village have more children than those of other villages. Working Capacity of Households Working capacity is the second most important feature of the farm households. It is expressed in terms of the number of labor (workforce) and depends on the size and composition of the households. The total working capacity of the households results from family members and the external laborers. Family members form the main source of working forces of the household. It is imperative to ascribe a distinct labor unit or

Final Report Laos Resource Mapping and Farmer Input Market Studies, Part of Lao-Vietname Bamboo Sector Feasibility Study
Prepared by: Dr. Latsamy Boupha and Somvang Phimmavong Faculty of Forestry, National University of Laos, Lao PDR
18
equivalent to different family members in order to determine household working capacity. The result of the interview illustrates that the average own workforce of the surveyed households is 2.4 labor unit. Table 9: Labor unit of the interviewed households in the selected villages in Houaphan
Average labor units per household District Villages selected
Mean Max. Min. Phoun Mai 2.7 6 1 Deui 2.4 4 2
Viengxay
Naphoung 3.6 6 2 Sobxay 2.3 4 1 Hap 1.8 3 1
Xiengkhor
Sobsan 1.9 3 1 2 Districts 6 villages 2.4 - - Source: Own investigation (2006) There is significant difference between the average numbers of households’ labor units in the six villages. In Viengxay District, there are more average labor units per household than in Xiengkhor District. The biggest number of labor unit is almost 4 in Naphoung village, and about 3 in Phoun mai village. In contrast, the number of labor unit in Xiengkhor District is less since their family members were out for working outside the region (Based on the result from the group discussion, 2006).
3.1.5.2 Land Use The holding sizes of the families vary with the size of the family, the time period of settlement and the availability of arable or potentially cultivable land in the village. The size of farmlands per household has been summarized in Table 10 below. The analysis shows that the average holding size of a household is 1.1 ha. Table 10: Total areas of the surveyed farms in the selected villages in Houaphan Province
Average farm area per household (ha)
District Villages selected
Mean Max. Min. Phoun Mai 0.8 1.7 0.3 Deui 0.7 2 0.1
Viengxay
Naphoung 0.8 1.5 0.4 Sobxay 1.7 3.3 0.1 Hap 1.2 2 0.5
Xiengkhor
Sobsan 1.3 2.6 0.1

Final Report Laos Resource Mapping and Farmer Input Market Studies, Part of Lao-Vietname Bamboo Sector Feasibility Study
Prepared by: Dr. Latsamy Boupha and Somvang Phimmavong
2 Districts 6 villages 1.1 - - Source: Own investigation (2006) The families of the Sobxay village posses the biggest farmland area on average. Furthermore, it reveals that the holding sizes of the household in Xiengkhor District is greater that those of Viengxay District on an average since this is attributed to the fact that the households of Xiengkhor District have more area in connection with the corn, soil bean farm, which were introduced in this District recently. The use of the available land area varies from village to village, from family to family, and from district to district. (see Table 11). It becomes evident that the biggest proportion of the holding size in all the selected villages is dedicated to paddy rice. Garden, and planted forest is ranking second. Due to the enforcement of the shifting cultivation (upland rice) stabilization program enforced by government, Naphoung Village does not have upland rice area any more, whilst other areas remain practicing upland rice. Table 11: Land use proportions of the interviewed households
Faculty of Forestry, National University of Laos, Lao PDR
19
Table 6: Land use proportions of the interviewed households While the families of Viengxay District dedicate a small portion of their land areas to fish pond, those of Xiengkhor do not practice at all. In contrast, the families of Xiengkhor District cultivated corn and bean as the cash income, which is exported to Vietnam, whilst those of Viengxay District do not have at all. The entry ‘Others’ refers to the size of fallows, grazing land (unplanted land) owned by each family, in this analysis, it is not really evaluated. However, from the village head interviews, it is estimated that each household own these kinds of land more than 1 ha.
3.1.6 Bamboo Luong Plantation The bamboo plantation in Houaphan Province is generally simple in nature, small scale,
Proportion of farmland area per household (ha) District Villages selected
Paddy rice
Upland rice
Aquaculture
(Garden, planted forest)
Corn and bean
Others
Phoun Mai 0.32 0.14 0.006 0.31 0 NA Viengxay
Deui 0.27 0.18 0.014 0.29 0 NA
Naphoung 0.59 0.00 0.012 0.19 0 NA Sobxay 0.42 0.92 0 0.34 0.33 NA Xiengkhor Hap 0.56 0.20 0 0.37 0.36 NA Sobsan 0.56 0.30 0 0.37 0.19 NA
2 Districts 6 villages NA 0.45 0.29 0.01 0.31 0.15 Source: Own investigation (2006)

Final Report Laos Resource Mapping and Farmer Input Market Studies, Part of Lao-Vietname Bamboo Sector Feasibility Study
Prepared by: Dr. Latsamy Boupha and Somvang Phimmavong
and not well organized for the market. The purpose of the plantation is the domestic consumption by using bamboo round poles and the bamboo handicraft. From the analysis of Table 12 below, it reveals that the average holding size of bamboo plantation of the families in Houaphan Province is 247 m2 per household with approximately 18 clumps per household. The families of Deui village have the biggest holding size of bamboo plantation on average. It is obvious that the number of bamboo clumps per household in Deui Village double that of bamboo clumps in other surveyed villages. As mentioned above, the purpose of plantation is only for domestic consumption, however only in Deui village, bamboo Loung were sold to Vietnamese trader for exporting to Vietnam last year,
however in this present year, villagers refused to sell their bamboo since the price is too low for them.
Faculty of Forestry, National University of Laos, Lao PDR
20
Table 12: Bamboo Luong Plantation (production) of the interviewed households Note: HH refers to Household. Source: Own investigation (2006) It is estimated that if the average farm household in the surveyed villages have area of 1 ha bamboo Luong plantation, about 439 culms could be harvested from their plantation.
Bamboo Luong District Villages selected Bamboo
area per household
(m2)
Number of bamboo
clumps per HH
No. of culms sold per HH
per year (culms)
No. of culms consumed
per HH per year (culms)
Average of culms
harvested per ha
Phoun Mai
218.00 17.60 0 14.10 634.10 Viengxay
Deui 373.20 31.10 19.00 20.70 593.10
Naphoung 198.00 16.10 0 11.80 646.90 Sobxay 212.80 13.30 0 5.60 271.32 Xiengkhor Hap 235.20 14.70 0 5.90 249.18 Sobsan 246.40 15.40 0 6.10 240.35
2 Districts 6 villages 247.27 18.03 3.17 10.70 439.16

Final Report Laos Resource Mapping and Farmer Input Market Studies, Part of Lao-Vietname Bamboo Sector Feasibility Study
Prepared by: Dr. Latsamy Boupha and Somvang Phimmavong Faculty of Forestry, National University of Laos, Lao PDR
21
3.1.7 Financial Analysis of Farm Households: Earning, Cost, Economies of Viengxay District, Houaphan Province
Table 13 summarizes the revenues and costs for different income sectors of the households, which is called “the household income sheet”. This income sheet represents the income formation of the average farm household in Viengxay District, Houaphan Province. All prices reflect 2005 costs, harvesting outputs, and so forth. For paddy rice, upland rice farm sector, their gross revenues are estimated on the quantities of rice produced each year combined with the rice price that exists in the local market of the region. Similar to livestock and the NTFPs2 sector, they are calculated on a basis of the quantities produced combined with the local market price. It should be noted the price of bamboo is the price that villager selling to Vietnamese trader excluding the village tax. Furthermore, the wage price, which is obtained through the employment sector, is not really evaluated but fixed at 20,000 Kip per day as an average, which is what a farm household could earn from both the local wage market. The analysis shows that among the item ‘gross revenues’ from different sectors, Livestock (cattle, pigs, poultries, and fish) have contributed the greatest portion, which cover almost half of the total gross revenue (5,063,000 Kip p.a.), whilst Upland rice farm the lowest part making up only 3 per cent of the total gross revenue. It is noticeable that the gross income from selling bamboo culms to the Vietnamese trader is also significant (16) making up 1,667,000 Kip of the entire income, most of which is cash income. In addition, the proportion of the total gross revenue from paddy rice, NTFPs, and employment sectors brings in 19 per cent, 9 per cent, and 4 per cent to the total gross revenue of each sector, respectively. Since the majority of households use their own labor for the production of all sectors, as explained earlier, the cost of labor 3 is estimated on the basis of labor requirement combined with prices of the regional labor market for each sector. The labor requirement for farm production was scrutinized during the field research, i.e. the calendar of farm production was used in group discussion in order to generate the number of workload of each farm sector. The result shows that the labor requirement for paddy rice, upland rice farm are identical to each other. The total labor required for producing all income sectors amounts to 2,397,000 Kip per the average household p.a. Of these, the proportion of labor requirement for paddy rice is
2 NTFPs income sheet are demonstrated carefully in Table 7 3 The investigation of the cost of labor requirement for each farm sector was based on the consultation with the member of Faculty of Forestry, NUOL (cf. Xayvongsa, 2001), and the researcher’s investigation in the case study.

Final Report Laos Resource Mapping and Farmer Input Market Studies, Part of Lao-Vietname Bamboo Sector Feasibility Study
Prepared by: Dr. Latsamy Boupha and Somvang Phimmavong
the highest part of the entire cost, whilst that for collecting NTFPs3 is the highest part after paddy rice. Since the household spends much more time p.a. on producing income from this sector than from other sectors, and another reason is that collecting NTFPs is usually high time consuming. In contrast, the proportion of labor requirement for the upland rice sector is the least, and is on average less than 12% of the entire labor cost because of its small holding size of farmland. In the analysis, the costs of labor incurred in the production process of livestock sector, i.e. the cost of labor raising, feed inputs to livestock were ignored due to its complexities and difficulties to derive values. Similar to the cost incurred in bamboo and employment sector, they are ignored in the analysis.
Table 13: Income sheet of an average household unit in Viengxay District in Houaphan Province.
Average Revenue and Cost per Household (Kip per year)
Faculty of Forestry, National University of Laos, Lao PDR
22
Items Paddy rice (Kip/0,40
ha)
Upland rice farm
(Kip/0.08 ha)Bamboo Livestock® Employ-
ment§ NTFPs Sum
Gross Revenue
1,939,000 276,000 1,667,000 5,063,000 386,000 953,000 10,284,000 (19) (3) (16) (49) (4) (9) (100)
1,228,000 284,000 - - - 885,540 2,397,000 Labor (51) (12) (0) (0) (0) (37) (100) 32,000 9,000 0 0 0 41,000 Seeds 0 (78) (22) () (0) (0) (100)
Land tax (livestock tax)
20,000 4,000 0 44,000 0 68,000 0 (29) (6) (0) (65) (0) (100)
Capital costs
243,000 56,000 0 10,000 0 0 309,000 (79) (18) (0) (3) (0) (0) (100)
Balance 416,000 -77,000 1,667,000 5,013,000 386,000 67,460 7,472,000 (Land rent) (6) (-1) (22) (67) (5) (1) (100)
Income* 1,919000 (19)
272,000 (3)
1,667,000 (16)
5,013,000 (49)
386,000 (4)
953,000 (9)
10,220,000 (100)
1,939,000 276,000 1,667,000 5,063,000 386,000 953,000 10,284,000 ¶ Sum (Σ) (19) (3) (16) (49) (4) (9) (100) Note: Figures in parentheses denote percentages. §employment means the income of households from temporary jobs during off-farm season. *means that income of the average household, which represents the net calculated income including the cost of land rent, own labor and own capital, and Sum¶ is the sum of all costs. ® means the summary of income and cost from cattle, pigs, poultries, and fish. (Exchange rate: 1 US. Dollar = 10,400 Kip on November 2006)
Source: Own calculation based on data from field research, 2006.

Final Report Laos Resource Mapping and Farmer Input Market Studies, Part of Lao-Vietname Bamboo Sector Feasibility Study
Prepared by: Dr. Latsamy Boupha and Somvang Phimmavong Faculty of Forestry, National University of Laos, Lao PDR
23
The costs of seed is estimated by the quantities of rice used for each sector combined with local price of rice (1 kg of rice =2,000 Kip). It reveals that almost all of the households in the region use their own seed for the farm production. The cost of farmland tax is indicated as entailing the same cost for both paddy rice and upland rice farm. Similar to Livestock sectors, cattle tax is only levied at a rate of 18,000 Kip per head per year, with the rest of the livestock exempted from tax. Bamboo tax is levied at the cost of 5 Kip per 1 kg of splitting bamboo. This tax income goes directly to the village development fund. The capital cost or ‘a normal return to the capital’ is calculated on the basis of the total capital combined with the interest of the borrowing rate of 19 per cent p.a., which is obtained from Agriculture Promotion Bank The analysis shows that the capital cost of paddy rice sector is the highest part (79%). According to the model calculation, the entries under ‘balance’ or net income represent the land values or the income streams from each sector. It is shown that from the standpoint of the average farm household, the income streams from paddy rice, bamboo, livestock, employment, and NTFPs sectors are 416,000 Kip, 1,667,000 Kip, 5,013,000 Kip, 386,000 Kip, and 67,000 Kip respectively, while only that of upland rice sector is faced with negative land rent, owing to the fact that the labor for this production is relatively time consuming. It is surprising that the proportion of the bamboo sector's balance (net income) is the highest part after livestock sector. The item ‘income’ means the real income of the average farm household including their own labor, own inputs to the production. In the study area, almost all of the farm households used their own labor for farm production (paddy rice, upland rice farm, etc.), while others use labor from their relatives. Additionally, very few hired other poor farmers in the region. Therefore, in this analysis, the income of the average household is therefore: Labor cost + Seeds + Capital costs + Balance = Average Household Income (AHI) As can be seen under the entries ‘income’, the average household is faced with positive land values for all sectors. Of these, most of the income is derived from the livestock sector, which takes over half of the total income. The average household procures 16 per cent of the total income from bamboo sector, while the income from the upland rice and employment sector plays a slightly important role for the entire income formation of the average farm household, since the enforcement of land and forest allocation policy, which prohibit the farm household to practice the shifting cultivation (upland rice). It is also important to mention that rural households in the region have very small proportion of farmland size, and moreover, the rice productivity is not desirable due to lack of technology, i.e. poor method of soil improvement, pest attack. As a consequently, almost households in this region have not enough rice for their own family consumption. Usually, the time of rice shortage begins from late January on wards after a few months

Final Report Laos Resource Mapping and Farmer Input Market Studies, Part of Lao-Vietname Bamboo Sector Feasibility Study
Prepared by: Dr. Latsamy Boupha and Somvang Phimmavong Faculty of Forestry, National University of Laos, Lao PDR
24
of rice harvesting in November. In order to get enough rice4 for their own consumption in one accounting year, they have to produce more income especially from Livestock and bamboo sector and other sources in order to exchange or sell it for rice. Income formation from non-timber forest products The income sheet of the NTFPs sector is demonstrated in detail in Table 15 owing to the fact that its values are very complex and difficult to understand. To quantify the revenues and costs incurred in the production process (collecting NTFPs), different methods were utilized in the study, namely group discussion, participant observation, household interviews as well as interviews with key-informants. Table 14 shows the top four NTFPs, which are currently produced (collected) by all of the households in Viengxay District on a daily basis. In fact, rural households produce much more different income sources from NTFPs than those mentioned here; however, it is impossible for the researcher to investigate all sources of NTFPs due to the time and financial constraints. Therefore, the researcher has narrowed and selected only the most collected NTFPs (Top 4 NTFPs) as rendered in Table 14. Criteria used and discussed by villagers for ranking NTFPs are importance as a food resource, income source, or other inputs to the household. The study shows that the average household spends about one day (8 hours) to catch one and a half kg of fish, equivalent to 187 grams (g) per one hour only in the rainy season. However, the figure is lower in the dry season, with about 0.8 kg produced per day, equivalent to 100 g produced per hour as shown in Table 4 below: Table 14: Quantities of NTFPs collected by an average farm household
Ability of household to collect NTFPs in one day or 8 hours (kgs) Practices Rainy season Dry season
Fish, frog, aquatic insects, etc. 1.5 0.8
Cardamom 4 6
30 branch root climb 5 5
Wild Vegetable 7 4 Source: Own calculation based on data from Household Survey, 2006 Table 15 presents the income sheet of NTFPs sector of an average household in Viengxay District. The revenues of the NTFPs were estimated on the basis of the quantities of NTFPs produced combined with the prices that could be found in the local market (Viengxay market). Due to the fact that this region is located along a Lao PDR Highway (Street number 6 north), most of quantities of NTFPs could be sold and exported to Vietnam. It should be noted that in the analysis, the costs of the NTFPs sector are 4 Rice is the main food intake of rural farm households in Laos in general and in Viengxay district in particular.

Final Report Laos Resource Mapping and Farmer Input Market Studies, Part of Lao-Vietname Bamboo Sector Feasibility Study
Prepared by: Dr. Latsamy Boupha and Somvang Phimmavong Faculty of Forestry, National University of Laos, Lao PDR
25
measured non-cash while those of revenue are measured in cash income that received after the selling of NTFPs. The analysis shows that the average household spends about 6 hours per week in the rainy season and 5 hours per week in the dry season to catch fish, frogs, and other aquatic insects. As a consequence, by quantifying the abilities (quantities) of a household to collect NTFPs (Table 14) combined with time spent for collecting, he would able to produce about 5 kg of fish per month during the rainy season and over 2 kg during the dry season. Table 15: Revenue and cost of the NTFPs sector of an average household
Time spent collecting
NTFPs in hours per week
NTFPs collected in Kgs per month
Description Rainy Season
a
Dry Season
b
Rainy Season
Dry Season
Annual Cost (Kip)
Annual Revenue (Kip)
Fish, frogs, aquatic insects, etc. (Aver. 1 kg = 16,000 Kip).
6.1 4.87 4.575 2.435 387,540 638,720
Wild Vegetable (Aver. 1 kg = 1000 Kip). 12.4 3 24.8 6 498,000 166,000
30 branch root tree (Aver. 1 Kg = 4,000 Kip)
NA NA NA NA - 66,000
Cardamom (Aver. 1 Kg = 7,000 Kip) NA NA NA NA - 82,280
Balance 67,460
Sum 953,000 953,000
Note: a, b means that there are 5 months in the rainy season from May until September and 7 months in the dry season during the rest of year. NA = Non-applicable. Source: Own calculation based on data from Household Survey, 2006 In one accounting year, the cost of fish collecting is calculated by time consumed p.a., combined with the wage price5 of 16,000 Kip per day as mentioned above, and the result shows that the average household spends a total of 378,000 Kip/year in order to realize the annual fish revenue of 638,720 Kip p.a. The revenues from collecting wild vegetables are three times lower than the costs of producing them. This is because collecting these two kinds of NTFPs are extremely time-consuming, and the prices are relatively low. In addition, the revenues from cardamom and 30 branch roots are calculated which is based on the quantities produced by an 5 Wage price of collecting NTFPs are taken from the local wage of the region, fixed at 20,000 Kip per day

Final Report Laos Resource Mapping and Farmer Input Market Studies, Part of Lao-Vietname Bamboo Sector Feasibility Study
Prepared by: Dr. Latsamy Boupha and Somvang Phimmavong Faculty of Forestry, National University of Laos, Lao PDR
26
average household combined with the purchase price in the local market. Both productions are cash income for the farm household in this region. Their revenues amount to 66,000 Kip p.a. and 82,000 Kip per household respectively. The entry under ‘balance’ means the income streams obtained through the NTFPs sector. It is obvious that the average household faces low positive income land rent, since the cost of labor is relatively high. Nevertheless, the household uses its own labor in the production. Therefore, AHI would be equal to the sum of the cost of labor and the income balance, as written below: AHI = 378,000 + 498,000+ (67,000) = 953,000 Kip per year (non cash and cash income) It is now obvious that the contribution of NTFPs to the total income of the average household is the slight part (10%).
3.1.8 Summaries of Working Calendar of all Farm and Off-farm sector of Viengxay and Xiengkhor District
Table 16 illustrates the summaries of the holding size, net income, and working calendar of all farms and off-farm sector of the average farm household in Viengxay and Xiengkhor District, Houaphan Province. The analysis shows that the number of man days spent per household in July is the highest for Viengxay District, whereas in October for Xiengkhor District. From the analysis, it shows that the families of Viengxay District have more free time than those of Xiengkhor District. While the families of Viengxay District spend their time on harvesting bamboo from natural forest for cash income, those of Xiengkhor spend their time on shifting cultivation, corn and bean cultivation for their cash income. The average income of the Viengxay household is approximately 10 million Kip per year, whilst that of the Xiengkhor household is relatively higher, making up over 14 million kip per year. The Table also shows that the biggest part of the average farm household income from the two districts derives from livestock productions, which consist of cattle raising, pigs, poultries, and fish raising. As mentioned above, it is an interesting finding that the average cash income of the family in Viengxay District from bamboo harvest is ranking second, while that in Xiengkhor District from Bamboo harvest is zero, but labor selling is ranking second.

Final Report Laos Resource Mapping and Farmer Input Market Studies, Part of Lao-Vietname Bamboo Sector Feasibility Study
Prepared by: Dr. Latsamy Boupha and Somvang Phimmavong Faculty of Forestry, National University of Laos, Lao PDR
27
Months (Number of man days each month)
Activities
Aver. Farm area
(1000kip)
Av. Income per day per
HH (1000kip) 1 2 3 4 5 6 7 8 9 10 11 12
Rice-field 0.40 1,919 0 0 0 4 4 8 22 4 2 12 12 16 Upland rice 0.08 272 0 2 2 1 3 2 2 2 2 6 1 0 Bamboo harvest* NA 1,667 4 4 3 3 3 4 3 3 4 4 4 4 Collect other NTFPs NA 953 8 4 4 4 4 4 4 4 0 4 4 4 Livestock NA 5,023 Labor selling NA 386 2 2 2 2 1 2 1 2 1 1 1 2 Sub-Total 0.48 10,220 14 12 11 14 15 20 32 15 9 27 22 26
Viengxay
Sub-Total Labor per HH 2.93 NA 88 88 88 88 88 88 88 88 88 88 88 88Rice-field 0.51 2,981 0 0 0 5 5 10 28 5 3 15 15 20 Upland rice 0.54 1,710 0 16 11 8 21 14 12 12 12 43 5 0 Corn farm 0.07 281 Bean farm 0.22 961 4 4 3 3 3 4 3 3 4 4 4 4 Collect NTFPs (incl. bamboo shoot) NA 1,616 8 4 4 4 4 4 4 4 0 4 4 4 Livestock NA 4,430 NA NA NA NA NA NA NA NA NA NA NA NA Labor selling NA 3,646 2 2 2 2 1 2 1 2 1 1 1 2 Sub-Total 1.34 15,625 14 26 20 22 34 35 48 26 20 67 30 30
Xiengkhor
Sub-Total Labor per HH 2.00 NA 60 60 60 60 60 60 60 60 60 60 60 60
Note: * income from selling bamboo to Vietnamese trader is 38,640 Kip per day on average. HH= household; NA= Non-applicable Source: Own Investigation, 2006.
Table 16: Summaries of average farm household income and Working Calendar of all Farms and Off-farm sector of Viengxay and Xiengkhor District.

Final Report Laos Resource Mapping and Farmer Input Market Studies, Part of Lao-Vietname Bamboo Sector Feasibility Study
28Prepared by: Dr. Latsamy Boupha and Somvang Phimmavong
3.2 Geography of the Study Area, Xiengkhouang Province
3.2.1 Geographical Location
XiengKhouang province is located in the Northeastern part of the Laos with a population of 196,000. The province is a rugged mountainous province (See figure 7). The Provincial capital, Phonsavanh is located some 500 km by road from the national capital of Vientiane. Administratively the province is divided into seven 8 districts: Phaxay, Khoune, Phonsavanh, Nong Hai, Kham, Mork, Phou Koud, and Thathom District. The former chief-city was Phouane, now called Khoune. The total land area of the province covers about 1,391,581 ha (Lao National Forest Inventory Data Base, DOF, 2004). The distance between Houaphan and XiengKhouang is approximately 400 Km.
The Districts selected for the present investigation are Phaxay and Kham District. Kham District has border with Vietnam while Phaxay District has border with the Special Zone Xaysomboun.
3.2.2 Result of Bamboo Survey in Phaxay District Phaxay District is situated in western part of Xiengkhouang (see Figure 8). It lies within the longitude of 102o 50’ – 102o 22’ E and Latitude of 19o o 06’ – 19 28’ N. The elevation varies from 820-2050 m. About 70 per cent of the total area is mountainous area, which is the peak of the Lao PDR. The District has the border with Khoune District in the east, with Pek in the north, with Phoukout in the east, and Vientiane and Borikhamxay Province in the south. The total area of Phaxay is 99163.49 ha . According to the classification of land use type in 2004, it was classified in 11 types namely Upper Dry Evergreen, Upper Mixed Deciduous; Coniferous Forest; Mixed Broad-Leaved and Coniferous; Unstocked Forest; Ray, Scrub, Rice paddy; Grass land and Water. The detail appears in Table 17 below. Table 17: Land use type of Phaxay district
Land Use Type Area (ha) % Area Upper Dry Evergreen 1550.26 1.56Upper Mixed Decidious 21303.93 21.48Coniferous Forest 484.43 0.49Mixed Broad-Leaved and Coniferous 703.36 0.71Unstocked Forest 50363.96 50.79Ray 732.90 0.74Savannah 27.66 0.03Rice Paddy 5470.29 5.52Other Agriculture Land 138.96 0.14Grassland 18376.00 18.53Swamp 11.74 0.01Total 99163.49 100.00Source: Lao National Forest Inventory Data Base, DOF, 2004

Final Report Laos Resource Mapping and Farmer Input Market Studies, Part of Lao-Vietname Bamboo Sector Feasibility Study
Figure 7: Land Use Map of Xiengkhouang Province
29Prepared by: Dr. Latsamy Boupha and Somvang Phimmavong

Final Report Laos Resource Mapping and Farmer Input Market Studies, Part of Lao-Vietname Bamboo Sector Feasibility Study
Figure 8: Land Use Map of Phaxay District
30Prepared by: Dr. Latsamy Boupha and Somvang Phimmavong

Final Report Laos Resource Mapping and Farmer Input Market Studies, Part of Lao-Vietname Bamboo Sector Feasibility Study
Prepared by: Dr. Latsamy Boupha and Somvang Phimmavong - 31
In this province the sample plot was conducted in Thoum village in Phaxay District. The sample plots for natural bamboo forest are 400 square meters (20m x 20m), which is located in the upper mixed deciduous forest in the south of Phaxay District. The detail and the result of the analysis are as follows: F. Sample plot No. 6 The sample plot is about 5 km away from Thoum village to south direction. The distance from the road is about 50 m. The plot lies within the altitude of 1200 m and the slope of 55 per cent. Table 18: Summary of average data of sample plot in Phaxay District, Xiengkhoung Province.
The result of the analysis appeared in Table 18 shows that the dominant bamboo species found are only Mai Hok ( D. brandisii Kurz), which covers around the total area of the sample plot. The result also illustrates that there are 85 clumps or equivalent to 246 culms in the sample plot. Of these, the bamboo age one year old consists of 29 culms, while age 2-3 years old (206 culms). The average distance between clumps measured is about 2.5 m with the standard deviation of 82. The average diameter of clump is 248 cm, which varies from 0.8 to 5 m. Similar to their lengths; the study found that the average length of bamboo culms measured is almost 14 m with the standard deviation of 127. In addition, the stem diameter varies from 7 to 9.5 cm with the standard deviation of 0.83. The average section length is 36 cm with the maximum of 37 cm and the minimum of 35 cm. The bamboo thickness is on average 1.88 cm, which varies from 1.7 - 2.1 cm.
No. of Culms Plot No. No. of
Clumps
1 year
2-3 year
Total No. of
Culms
Distance Between Clumps
(Cm)
Clumps Diameter
(Cm)
Length (Cm)
BB Diameter
(Cm)
SectionLength (Cm)
Thickness
(Cm)
85 29 206 236 246.25 248 1406 7.66 35.8 1.88Mean
Max. - - - - 350 500 1600 9.5 37 2.1
Min. - - - - 100 80 1250 7 35 1.71
- - - - 82 135 127 0.83 0.69 0.14Std.
Source: Own team investigation, 2006
-

Final Report Laos Resource Mapping and Farmer Input Market Studies, Part of Lao-Vietname Bamboo Sector Feasibility Study
Prepared by: Dr. Latsamy Boupha and Somvang Phimmavong - 32
3.2.3 Bamboo D. lonoififmriatus Plantation in Phaxay and Kham District The bamboo plantation in Xiengkhouang Province is generally simple in nature, small scale, which is slightly bigger than in Houaphan, and it is not well organized for the market. Similar to the situation in Houaphan, the purpose of the plantation is the domestic consumption by using bamboo round poles and the bamboo handicraft. From the analysis, it reveals that the average holding size of bamboo plantation of the families in Xiengkhouang Province is 264 m2 per household with approximately 20 clumps per household. The families of the Nasom village have the biggest holding size of bamboo plantation on average. It is also obvious that the number of bamboo clumps per household in Nasom Village double that of bamboo clumps in other surveyed villages. It is estimated that if the average farm household in the surveyed villages have 1 ha of bamboo D. lonoififmriatus plantation, about 661.1 culms could be harvested from their plantation. Table 19: Bamboo D. lonoififmriatus Plantation (production) of the interviewed households
Bamboo D. lonoififmriatus District Villages selected Bamboo
Note: HH refers to Household. Source: Own investigation (2006)
area per househol
d (m2)
Number of bamboo
clumps per HH
No. of culms sold per HH
per year (culms)
No. of culms consumed
per HH per year (culms)
Average of culms
harvested per ha
Thoum 260.4 21.7 0 26.9 1109.9 Phaxay
Naphia 236.4 19.7 0.0 18.0 621.3
Nasom 326.00 27.2 0 22.4 617.0 KhongOm 280.8 23.4 0 29.0 1129.0 Kham Viengkham 235.20 14.7 0 5.9 249.2 Phiengkob 246.40 15.4 0 6.10 240.4
2 Districts 6 villages 264.2 20.4 0.0 18.1 661.1
-
Final Report Laos Resource Mapping and Farmer Input Market Studies, Part of Lao-Vietname Bamboo Sector Feasibility Study
Prepared by: Dr. Latsamy Boupha and Somvang Phimmavong - 33
Figure 9: Land Use Map of Kham District
-

Final Report Laos Resource Mapping and Farmer Input Market Studies, Part of Lao-Vietname Bamboo Sector Feasibility Study
Prepared by: Latsamy Boupha and Somvang Phimmavong - 34
3.2.4 Estimation of Bamboo Resources in Xiengkhouang Province. Similar to the situation in Houaphan Province and other region of Laos, Bamboo resources in Xiengkhouang are found in both UMD and the pure bamboo forest. As can be seen from Table 20, with the total UMD forest of 461737, the minimum bamboo density varies from 45 per cent to 60 per cent. Pure bamboo forest shares only 0.1 per cent or equivalent 1,337 ha of the total land area. Table 20: Land Use Type of Xiengkhouang Province
Land Use Type Area (ha) % Area Upper Dry Evergreen 12606.25 0.91Lower Dry Evergreen 274.75 0.02Upper Mixed Decidious 461,737.00 33.25Coniferous Forest 14210.00 1.02Mixed Broad-Leaved and Coniferous 36780.50 2.65Bamboo 1,337.00 0.10Unstocked Forest 634815.00 45.71Ray 45452.25 3.27Coniferous Forest 24.00 0.00Savannah 7790.75 0.56Scrub 3046.00 0.22Rice Paddy 48597.25 3.50Other Agriculture Land 139.25 0.01Barren Land and Rock 6.75 0.00Grassland 120745.75 8.70Swamp 12.25 0.00Urban or Built up area 91.50 0.01Perenial Crop 50.75 0.00Water Bodies 933.75 0.07Total 1388650.75 100.00
Source: Lao National Forest Inventory Data Base, DOF, 2004
Table 21 summarizes the bamboo area, average number of culms per ha, and the estimated volume of bamboo resources in Xiengkhouang Province. The analysis shows that the total area of the upper mixed deciduous in Phaxay District is 21,304 ha in Phaxay District. As a consequence, by quantifying the average number of culms per hectare combined with the bamboo area per district, the total numbers of culms for Phaxay are 66 million in UMD. Pure bamboo forest does not appear in Phaxay District.
- Faculty of Forestry, National University of Laos, Lao PDR

Final Report Laos Resource Mapping and Farmer Input Market Studies, Part of Lao-Vietname Bamboo Sector Feasibility Study
Prepared by: Latsamy Boupha and Somvang Phimmavong - 35
By looking at the overall result, it becomes clear that with the total bamboo area in upper mixed deciduous in Xiengkhouang Province of 461,737.00 ha, it consists of 1.4 billion bamboo culms, while in pure bamboo forest, the number is 1,337 ha, which consists of approximately 5.4 million culms. Table 21: Estimation of Bamboo Resource in Xiengkhouang Province
Average Area of Bamboo Resource
(ha) Average number of
culms per ha
Average number of culms per District Area (1000 Culms)
District/Province
Upper Mixed
Decidious Pure
Bamboo
Upper Mixed
Decidious Pure
Bamboo
Upper Mixed
Decidious Pure
Bamboo
Phaxay 21,304 0 5900 4050 65,989 -
Xieng khouang 461,737 1,337 5900 4050 1,430,230 5,415
Source: Field study, 2006.
3.2.5 Description of the study villages in Phaxay and Kham District Some characteristics of the study villages are shown as Table 22. Some of key finding from village studies and the data analysis of project field teams can be summarized as follows:
- Faculty of Forestry, National University of Laos, Lao PDR

Final Report Laos Resource Mapping and Farmer Input Market Studies, Part of Lao-Vietname Bamboo Sector Feasibility Study
Table 22: Characteristics of the Study Villages in Xiengkhouang Province
Phaxay District Kham District
Naphia Nasom Thoum KhongOm Viengkham Phiengkob
Over 200 years Long times ago Long times ago 1945 Over 400 years 1975 Settlement
1136 m 1180 m 1153 m 635 m 753 m 685 m Attitude
Paved road 6 Dry Dry, poor road Good road access Good road access Good road access Access/Season
Phaxay District, 1 hour by car
Phaxay District, 1 hour by car
Phaxay District, 3 hour by car District Centre
251 (125 female) 272 (154 female) 169 (80 female) 285 (133) 656 (322 female) 395 (186 female) Population (HHs)
Mon-Khmer, and tai kao
Mon-Khmer, and tai kao Tai kao (Buddhism) Tai kao (Buddhism) Tai kao (Buddhism) Ethnicity
Completed Primary School
Completed Primary School
Completed Primary School
Completed Primary School No schools. Primary 1-2 Education
Sickness common Sickness common Sickness common - - Sickness common Health
Pek or Phaxay District Hosp.
Pek or Phaxay District Hosp.
Kham District Hosp. Pek District Hosp. Kham District Hosp. Kham District Hosp. Facilities
2.24 ha/HH 1.65 ha/HH 1.46 ha/HH 1.79 ha/HH 1.62 ha/HH 1.61 ha/HH Cultivated land
4.26 ton/ha (Paddy rice)
4.03 ton/ha (Paddy rice)
2.78 ton/ha (Paddy rice)
3.75 ton/ha (Paddy rice) 3.59 ton/ha (Paddy rice) 4.22 ton/ha (Paddy rice) Rice production
No No No No No No Rice deficit
D. brandisii Kurz, Mai Kone, Loung, D. lonoifimbriatus, Schizostachyum, B. tulda Roxb., G. albociliata Munro & Kurz, etc.
D. brandisii Kurz,Mai Kone, Loung, D. lonoifimbriatus,
Schizostachyum, B. tulda Roxb., G. albociliata Munro & Kurz, etc.
D. brandisii Kurz, Mai Kone, Loung, D. lonoifimbriatus,
Schizostachyum, B. tulda Roxb., G. albociliata Munro & Kurz, etc.
Same as Phaxay District
Same as Phaxay District
Same as Phaxay District
Bamboo Occurred (planted and natural)
Sources: Faculty of Forestry, NUOLs, 2006.
Prepared by: Latsamy Boupha and Somvang Phimmavong - 36 - Faculty of Forestry, National University of Laos, Lao PDR

Final Report Laos Resource Mapping and Farmer Input Market Studies, Part of Lao-Vietname Bamboo Sector Feasibility Study
Prepared by: Latsamy Boupha and Somvang Phimmavong - 37
3.2.6 Resource Endowments
3.2.6.1 Labor Household Size Table 23 shows an overview of the average number of family members in the selected villages in Phaxay and Kham District in Xieng Khouang Province. The total households sampled in two Districts are 56 (16 % of all households). Table 23: Size of the surveyed households in Phaxay and Kham District.
Average number of members per household
District Villages selected
Total number of households
No. and (%) of
households sampled
Mean Max. Min.
Thoum 66 10 (15) 6.1 11 4
Naphia 94 10 (11) 7.0 11 5 Phaxay Nasome 51 10 (20) 6.1 10 3 KhongOm 49 10 (20) 7.0 11 5 Viengkham 56 10 (18) 7.4 10 4 Kham Phiengkob 30 10 (33) 7.0 12 3
Missing values 4 2 Districts 6 villages 346 56 (16) 6.8 - - Source: Own investigation (2006) From the analysis it illustrates that on average 7 persons are living in each household. There is only a small difference between the average sizes of the households from different villages. The number of household members, however, varies from 3 to 12 persons. There is the similar average number of members per household in Naphia, KhongOm and Phiengkob village. Working Capacity of the Households Table 24 shows the labor unit of the interviewed households in the selected villages in Phaxay and Kham District. The result of analysis shows that there is minor difference between the average numbers of households’ labor units in the six villages. The average labor units per household in the 2 District are almost 3. Even though Thoum and Naphia villages have similar average figures, the maximum and minimum of the labor units per household are different from each other.
- Faculty of Forestry, National University of Laos, Lao PDR

Final Report Laos Resource Mapping and Farmer Input Market Studies, Part of Lao-Vietname Bamboo Sector Feasibility Study
Prepared by: Latsamy Boupha and Somvang Phimmavong - 38
Table 24: Labor unit of the interviewed households in Phaxay and Kham District.
Average labor units per household District Villages selected
Mean Max. Min. Thoum 2.5 6 1 Phaxay Naphia 2.5 3 2 Nasome 2.9 4 2 KhongOm 2.6 4 2 Kham Viengkham 3.4 5 2 Phiengkob 3.1 4 2
2 Districts 6 villages 2.8 - - Source: Own investigation (2006)
3.2.6.2 Land Use Similar to Houaphan Province, the holding sizes of the families vary with the size of the family, the time period of settlement and the availability of arable or potentially cultivable land in the village. The size of farmlands per household has been summarized in Table 25 below. The analysis shows that the average holding size of a household is 1.7 ha., which is bigger than that of the household in Houaphan Province. Table 25: Total areas of the surveyed farms in Phaxay and Kham District.
Average farm area per household (ha)
District Villages selected
Mean Max. Min. Thoum 1.5 1.8 1.0 Phaxay Naphia 2.2 7.4 0.6 Nasome 1.6 2.3 0.8 KhongOm 1.8 4.6 0.6 Kham Viengkham 1.6 2.6 0.7 Phiengkob 1.6 3.0 0.8
2 Districts 6 villages 1.7 - - Source: Own investigation (2006) The families of the Naphia village posses the biggest farmland area on average (2.2 ha) with maximum of 7 and minimum of 0.6. Furthermore, it reveals that the holding size of the household in Phaxay District is as many as those of Kham District on an average. The use of the available land area varies from village to village, from family to family, and from district to district. (see Table 26). Likewise, it becomes evident that the biggest
- Faculty of Forestry, National University of Laos, Lao PDR

Final Report Laos Resource Mapping and Farmer Input Market Studies, Part of Lao-Vietname Bamboo Sector Feasibility Study
Prepared by: Latsamy Boupha and Somvang Phimmavong - 39
proportion of the holding size in all the selected villages is dedicated to paddy rice, making up 1 ha per average household. It is noticeable that the family members of Phaxay District did not practice shifting cultivation due to the enforcement of shifting cultivation law. Table 26: Farmland Use Proportions of the Interviewed Households in Phaxay and Kham Table 6: Land use proportions of the interviewed households The entry ‘Others’ refers to the size of fallows, grazing land owned by each family, in this analysis, it is not really evaluated. However, from the village head interviews, it is estimated that each household poses more than 1 ha of fallow and grazing land (unplanted land), which is similar to the situation in Houaphan Province.
3.2.7 Financial Analysis of Farm Households: Earning, Cost, Economies of Kham District, Xiengkhouang Province
Table 27 summarizes the revenues and costs for different income sectors of the households, which are called “the household income sheet”. This income sheet represents the income formation of the average farm household in Kham District, Xiengkhouang Province. All prices reflect 2005 costs, harvesting outputs, and so forth. For paddy rice, upland rice farm sector, their gross revenues are estimated on the quantities of rice produced each year combined with the rice price that exists in the local market of the Kham District. Similar to livestock and the NTFPs sector, they are calculated on a basis of the quantities produced combined with the local market price. Furthermore, the wage price, which is obtained through the employment sector, is not really evaluated but fixed at 20,000 Kip per day as an average, which is what a farm household could earn from the local wage market.
Proportion of farmland area per household (ha)
District
Villages selected
Paddy rice
Upland rice and Banana
Aquaculture
(Orange, Cassava
farm, etc.)
Corn and vegetable,
garlic
Others
Thoum 0.97 0.00 0.04 0.19 0.3 NA Naphia 1.20 0.20 0.02 0.42 0.42 NA Phaxay Nasome 1.47 0.00 0.04 0.13 0.05 NA KhongOm 0.99 0.31 0.00 0.17 0.31 NA Viengkham 0.98 0.33 0.12 0.00 0.31 NA Kham Phiengkob 0.68 0.79 0.00 0.00 0.16 NA
2 Districts
6 villages 1.0 0.3 0.0 0.2 0.3
NA
Source: Own investigation (2006)
- Faculty of Forestry, National University of Laos, Lao PDR

Final Report Laos Resource Mapping and Farmer Input Market Studies, Part of Lao-Vietname Bamboo Sector Feasibility Study
Prepared by: Latsamy Boupha and Somvang Phimmavong - 40
The analysis shows that among the item ‘gross revenues’ from different sectors, Paddy rice with area of 0.88 ha has contributed the greatest portion, which cover one-third of the total gross revenue (6,302,000 Kip p.a.), whilst NTFPs the lowest part making up only 2 per cent of the total gross revenue. The income from livestock is ranking second. It is noticeable that the gross income from farm garden is also significant (21) making up almost 4 million Kip of the entire income, most of which is cash income. In addition, the proportion of the total gross revenue from employment, and upland rice sectors brings in 13 per cent, 8 per cent, and 4 per cent to the total gross revenue of each sector, respectively. Similar to the situation in Houaphan Province, since the majority of households use their own labor for the production of all sectors, as explained earlier, the cost of labor6 is estimated on the basis of labor requirement combined with prices of the regional labor market for each sector. The labor requirement for farm production was scrutinized during the field research, i.e. the calendar of farm production was used in the group discussion in order to generate the number of workload of each farm sector. The result shows that the labor requirement for paddy rice, upland rice farm, and farm garden are identical to each other. The total labor required for producing all income sectors amounts to 7,157,000 Kip per the average household p.a. Of these, the proportion of labor requirement for paddy rice is the highest part of the entire cost, whilst that for collecting NTFPs is the lowest part. In the analysis, the costs of labor incurred in the production process of livestock sector, i.e. the cost of labor raising, i.e. feed inputs to livestock were ignored due to its complexities and difficulties to derive values. Similar to the cost incurred in bamboo and employment sector, they are ignored in the analysis. The costs of seed is estimated by the quantities of rice used for each sector combined with local price of rice (1 kg of rice =2,000 Kip). Almost all of the households in the region use their own seed for the farm production. The cost of farmland tax is indicated as entailing the same cost for both paddy rice and upland rice farm. Similar to Livestock sectors, cattle tax is only levied at a rate of 18,000 Kip per head per year, with the rest of the livestock exempted from tax. The capital cost or ‘a normal return to the capital’ is calculated on the basis of the total capital combined with the interest of the borrowing rate of 19 per cent p.a., which is obtained from Agriculture Promotion Bank The analysis shows that the capital cost of paddy rice sector is the highest part (45%). According to the model calculation, the entries under ‘balance’ or net income represent the land rents or the income streams from each sector. It is shown that from the standpoint of the average farm household in Kham District, the income streams from paddy rice, upland rice, farm garden, livestock, employment, and NTFPs sectors are 2,400,000 Kip, -1,124,000 Kip, 1,847,000 Kip, 4,145,000 Kip, 2,520,000 Kip, - 174,000 Kip respectively, while only those of upland rice and NTFPs sector are faced with negative land rent, owing to the fact that the labor for this production is relatively time consuming. It is noticeable that the net income from selling livestock is the highest part of the total income.
- Faculty of Forestry, National University of Laos, Lao PDR

Final Report Laos Resource Mapping and Farmer Input Market Studies, Part of Lao-Vietname Bamboo Sector Feasibility Study
Table 27: Income sheet of an average household unit in Kham District, Xiengkhouang Province Average Revenue and Cost per Household (Kip per year)
Faculty of Forestry, National University of Laos, Lao PDR
41
Items Paddy rice (Kip/0,88 ha)
Upland rice farm
(Kip/0.32 ha)
Farm garden© Livestock® Employ-
ment§ NTFPs Sum
6,302,000 1,464,000 3,970,000 4,261,000 2,520,000 360,000 18,877,000 Gross Revenue (33) (8) (21) (23) (13) (2) (100) 3,166,000 2,111,000 1,346,000 - - 534,000 7,157,000 Labor (44) (29) (19) (0) (0) (7) (100)
71,000 46,000 291,000 0 0 408,000 Seeds 0 (17) (11) (71) (0) (0) (100) Land tax (livestock tax)
42,000 18,000 147,000 98,000 0 305,000 0 (14) (6) (48) (32) (0) (100) 623,000 413,000 339,000 19,000 0 0 1,394,000 Capital costs (45) (30) (25) (1) (0) (0) (100)
Balance 2,400,000 -1,124,000 1,847,000 4,145,000 2,520,000 -174,000 9,614,000 (Land rent) (25) (-12) (19) (43) (26) (-2) (100)
Income* 6,260,000 (34)
1,446,000 (8)
3,823,000 (21)
4,164,000 (22)
2,520,000 (14)
360,000 (2)
18,573,000 (100)
6,302,000 1,464,000 3,970,000 4,261,000 2,520,000 360,000 18,877,000 ¶ Sum (Σ) (33) (8) (21) (23) (13) (2) (100) Note: Figures in parentheses denote percentages. §employment means the income of households from temporary jobs during off-farm season. *means that income of the average household, which represents the net calculated income including the cost of land rent, own labor and own capital, and Sum¶ is the sum of all costs. © ® refers to the sum of income from banana, onion, vegetable and watermelon farm means the summary of income and cost from cattle, pigs, poultries, and fish. (Exchange rate: 1 US. Dollar = 10,400 Kip on November 2006) Source: Own calculation based on data from field research, 2006.
Prepared by: Dr. Latsamy Boupha and Somvang Phimmavong

Final Report Laos Resource Mapping and Farmer Input Market Studies, Part of Lao-Vietname Bamboo Sector Feasibility Study
Prepared by: Dr. Latsamy Boupha and Somvang Phimmavong Faculty of Forestry, National University of Laos, Lao PDR
42
The item ‘income’ means the real income of the average farm household including their own labor, own inputs to the production. In the study area, almost all of the farm households used their own labor for farm production (paddy rice, upland rice farm, etc.), while others use labor from their relatives. Additionally, very few hired other poor farmers in the region. Therefore, in this analysis, the real income of the average household is therefore: Labor cost + Seeds + Capital costs + Balance = Average Household Income (AHI) As can be seen under the entries ‘income’, the average household is faced with positive land rents for all sectors. Of these, most of the income is derived from the paddy rice sector, which takes a third of the total income (34%). The average household procures 21 per cent of the total income from farm garden sector, while the income from the upland rice and NTFPs sector plays a slightly important role for the entire income formation of the average, since the enforcement of land and forest allocation policy, which prohibit the farm household to practice the shifting cultivation (upland rice). The result of the analysis also reveals that the rural households in the region have larger proportion of farmland size than in Houaphan Province, and moreover, the rice productivity is more desirable due to the fact that in this region, there are support from international organization which provides support in term of technology, i.e. method of soil improvement, credit supply. As a consequently, almost households in this region have enough rice for their own family consumption, and then many families can sell their rice and livestock for cash income. Looking at the overall result, it becomes clear that the total real income measured is 18,878,000 Kip per household or equivalent to 2,697,000 Kip ($259) per person.
3.2.8 Summaries of Working Calendar of all Farm and Off-farm Sector of Kham and Phaxay District.
Table 28 illustrates the summaries of the holding size, net income, and working calendar of all farms and off-farm sector of the average farm household in Kham and Phaxay District, Xiengkhouang Province. The analysis shows that the number of man days spent per household in October is the highest for Kham District (69 man-days). During this time, the family of Kham District spends their time in garlic, watermelon farm. However, in Phaxay, the families of Phaxay District spend their time for paddy rice sector in June, thus their main income derives from paddy rice sector. From the analysis, it shows that the households in Kham District obtain the greatest net income from paddy rice as the non-cash return, and from farm garden as the biggest part of the cash income. In this District, the net income from Livestock sector is ranking second, while the net income from employment sector is also high, making up 2.5 million per average household. Likewise, the farmers of the Phaxay District also procure the greatest net income through paddy rice sector, and then from livestock sector. The net income from NTFPs sector is very small proportion, which is the lowest part comparing to Kham District or all study areas.

Final Report Laos Resource Mapping and Farmer Input Market Studies, Part of Lao-Vietname Bamboo Sector Feasibility Study
Prepared by: Dr. Latsamy Boupha and Somvang Phimmavong Faculty of Forestry, National University of Laos, Lao PDR
43
Months (Number of man days each month)
Activities
Aver. Farm area
(1000kip)
Av. Income per day per
HH (1000kip) 1 2 3 4 5 6 7 8 9 10 11 12
Paddy rice 0.88 6,260 0 0 0 11 12 22 18 19 3 3 35 35 Upland rice 0.32 1,446 0 10 6 5 13 9 7 7 7 25 3 0 Farm garden* 0.40 3,823 12 13 14 11 8 2 2 2 2 13 11 27 Collect other NTFPs NA 360 3 3 3 2 2 2 2 2 2 2 2 2
Livestock NA 4,164 NA NA NA NA NA NA NA NA NA NA NA NA Labor selling, petty trading NA 2,520 7 7 6 6 5 5 5 5 5 5 5 5
Sub-Total 1.6 18,573 22 33 29 35 40 40 34 35 19 48 57 69
Kham
Sub-Total Labor per HH 3.00 NA 90 90 90 90 90 90 90 90 90 90 90 90
Paddy rice 1.20 9,197 0 0 0 0 18 92 48 17 17 35 52 0 Banana farm 0.22 51 3 3 2 2 2 3 2 3 2 3 3 3 Orange, cassava farm 0.74 557 0 0 0 2 4 2 2 2 3 3 2 2
Corn, vegetable, and fruit tree 0.77 324 0 0 2 2 3 5 5 6 11 17 0 0
Collect NTFPs NA 81 1 1 1 1 0 0 0 0 0 0 0 0 Livestock NA 5,502 NA NA NA NA NA NA NA NA NA NA NA NA Labor selling NA 1,336 7 7 6 6 5 5 5 5 5 5 5 5 Sub-Total 1.34 17,048 11 11 11 13 32 107 62 33 38 63 62 10
Phaxay
Sub-Total Labor per HH 2.62 NA 78.6 78.6 78.6 78.6 78.6 78.6 78.6 78.6 78.6 78.6 78.6 78.6
Note: * refers to the sum of income from banana, onion, vegetable and watermelon farm. HH= household; NA= Non-applicable Source: Own Investigation, 2006.
Table 28: Summaries of average farm household income and Working Calendar of all Farms and Off-farm sector of Kham and Phaxay District.

Final Report Laos Resource Mapping and Farmer Input Market Studies, Part of Lao-Vietname Bamboo Sector Feasibility Study
Prepared by: Dr. Latsamy Boupha and Somvang Phimmavong Faculty of Forestry, National University of Laos, Lao PDR
44
3.3 Policy and Institutional Arrangements Key issues in the village related to natural resource management are tenure and equity, particularly access and use rights of natural resources. Thrusts of government are to control logging and settle shifting cultivation through decentralization and partnership with villages (Tsechalicha and Gilmour 2000). 187,000 families (30% of the population) still depended on shifting cultivation in the mid 1990s and it remains a key and complex issue in rural villages. A number of recent natural resource policy reviews are available (Raintree and Soydara in press, Tsechalicha and Gilmour 2000, Gilmour et al. 2000). We will therefore summarise (rather than detail) the key stages in law and policy development related to natural resource management from 1975. Before 1975, the scope of forest policy development was limited due to the ongoing war. From 1975-1989 the government concentrated on trying, largely unsuccessfully, to restrict shifting cultivation. Nine State Forestry Enterprises were also established at this time to undertake responsibilities in logging and forest management (Decree 74 on Forest Management, 1979). In 1980, the government declared 1st June would be National Tree Planting Day (Tsechalicha and Gilmour 2000). In 1989 the first national forestry conference was convened and made recommendations towards a shift from forest exploitation towards forest restoration, preservation and reforestation (Decree 117/CM on Management, Use of Forest and Forest Land). In 1991 (Decree 67/PM) the government banned logging in all national forests. This was only partially effective (ibid.). In 1997, a ‘2020 vision’ was developed by the Department of Forestry, with the aim of increasing forest cover from less than 47% currently, to 70% by 2020. This vision identified a number of priorities, including allocating land to rural families, developing alternatives to shifting cultivation; and it also incorporated the development of National Biodiversity Conservation Areas (NBCAs) (Ingles et al. 1998). The procedures for the establishment and management of NBCAs were made in 1993 under Decree 164/PM. The principal current legislation dealing with the devolution of rights, management and use of forest lands to the village level are the Forest Law (1996), the Land Law (1997), the Agriculture Law (1998) and the Environmental Law (1998). These laws provide an intention to decentralise and implement participatory natural resource management (Sawathvong undated). The Government assigned land use rights to individuals and households through land allocation program; in which a part of production forestry lands was allocated to the villages for long-term use by local village authorities who are key persons who take care with the fixed purposes designed by the government, but they have no right to sell those lands because land is still national asset. Regarding to the new policy has somehow encouraged people to stop the shifting cultivation (planting rice in the uphill area). As a consequence, some people stop the

Final Report Laos Resource Mapping and Farmer Input Market Studies, Part of Lao-Vietname Bamboo Sector Feasibility Study
Prepared by: Dr. Latsamy Boupha and Somvang Phimmavong Faculty of Forestry, National University of Laos, Lao PDR
45
shifting cultivation and start to plant corn, bean for cash income instead. In the study area, it shows that some farmers cut and burn the bamboo forest and convert them into corn, bean farm, and upland rice farm, since in these areas, bamboo resource are not economic like in Viengxay District. Even in Viengxay District, farmer slash and burn the bamboo forest which is far away from the road. Recently, the local government of the study province has enforced the law not destroying the bamboo forest, since they aware of the economic value of bamboo resource exporting to Vietnam since 2001 and the Vietnamese investors are planning to establish the bamboo factories in Houaphan and Xiengkouang Province. At present, bamboo forest resources are available both in bamboo forest type and upper mix deciduous forest type. They are collected at no cost from the government forest reserves. However, collectors must pay tax to the village administration, for instance in Viengxay District, the village tax cost 5 Kip per 1 kg of splitting bamboo Koune. Under the New Economic Mechanism Reforms from 1989, greater involvement of the private sector is taking place in Laos. Privatization of all main means of production in the Lao economy was being taken in the policy arenas that are encouraging the participation of the private sectors as well as the communities to own land and natural resources including bamboo forest, and forest. In addition, the Government of Laos has tried to create a good environment for the foreign direct investment since 1989. Once such policy changes are instituted, local villagers and commercial investors will have access to resources that would enable investment in for example establishing bamboo plantations. From the study, it show that a majority of interviewed households are willingness to invest in the bamboo plantation, if the capital credit is available and there are market for bamboo sectors. With regarding to these issues, local villagers are extremely requiring the support from the both the government and internal organization in term of financial and technical support.
3.4 Market participation and Farmer organization of the bamboo sector The market participation is that the system of Bamboo marketing firstly involves interaction from managing bodies at various levels of government (PAFO), in the process of issuing quotas, and in the management and monitoring of trade. These bodies generally do not come into direct contact with the Bamboo and so is not part of “the chain” as such. They are, however, crucial in the marketing system. Once getting the formal permission letter from PAFO with the given quota, the trader, accompanied with PAFO, and DAFO staff often coordinate with heads of the villages in order to get labor for bamboo harvesting. Usually, the head of village will get paid with the cash advance of about 3,000,000 Kip per village from the trader as the deposit. Then the head of village informs his village members regarding to the harvesting quota allowed by the government that they can harvest. Therefore, the bamboo harvesting in this district is quite competitive among the village members that result in over exploitation of the natural bamboo resources.

Final Report Laos Resource Mapping and Farmer Input Market Studies, Part of Lao-Vietname Bamboo Sector Feasibility Study
Prepared by: Dr. Latsamy Boupha and Somvang Phimmavong Faculty of Forestry, National University of Laos, Lao PDR
46
Farmer organization is quite informal. Villagers have formed their own structure as follows. Usually, heads of the villages are key contact persons (mediator) between harvesters/farmers (village members) and the traders. For example, in Viengxay District, there is only one trader (Le minh Chau) who came and bought the bamboo usually Bamboo Kouan from the District. The head of the village often announce the quantity of bamboo demanded by the trader when orders came in the village. The price of bamboo is 210 Kip per Kg (Price in 2005), which will go to the household income. Of these, 5 Kip will be taxed and kept in the village development fund. 4 DISCUSSIONS AND CONCLUSIONS
This study is the first attempt to provide background information on the bamboo sector in Laos in general, and in Houaphan and Xiengkhouang Province in particular. Furthermore we try to analyse the socio-demographic profile of the host communities in the study area as well as analyze different income sector including bamboo sector of farm household in the study area. The study was conducted in two provinces, namely Houaphan (District: Viengxay and Xiengkhor) and Xiengkhouang (Districts: Phaxay and Kham). 12 villages in the two provinces were chosen for the field study. Data gathering involved 134 respondents consisting of farmers (115), village heads (12), trader (1), DAFO staff (4), and PAFO staff (2). In addition, group discussion was done in each village in the two study provinces. The number of the group discussion (7-35 participants) was 24 for the two study provinces. Here we have tried to quantify the different income sectors including bamboo sectors by using data from household surveys, group discussion and key informants interview and by looking at the income situation of the farm household in the two provinces. We employed a multi-method approach, namely participant observation, individual depth interviewing, group interviewing, and documentary research. The advantage of this method is that it can benefit from triangulation, which involves choosing different methods based on their individual strengths and compatibility (Fontana and Frey, 1998; Huberman and Miles, 1998; this study). Moreover, used in combination, these methods can help strengthen the consistency and validity of the data, improving their reliability and contextual value (Denzin and Lincoln, 1998; Huberman and Miles, 1998). As Robert Yin (1989) pointed out “with triangulation, the potential problems of construct validity can be addressed, because the multiple sources of evidence essentially provide multiple measures of the same phenomenon”. By decomposing different methods for income estimation, we are able to find out the income situation. This method of moment’s technique allows us to construct the income

Final Report Laos Resource Mapping and Farmer Input Market Studies, Part of Lao-Vietname Bamboo Sector Feasibility Study
Prepared by: Dr. Latsamy Boupha and Somvang Phimmavong Faculty of Forestry, National University of Laos, Lao PDR
47
sheets for households in the two provinces. The study of the bamboo survey in Houaphan Province found that the total bamboo areas in Viengxay District are approximately 54,382 ha in the upper mixed deciduous forest (UMD) and 1,140 ha for the pure bamboo forest. (PB). In contrast, the total bamboo areas in Xiengkhor District are 17,920 ha for UMD and 10,059 ha for pure bamboo forest. As a consequence, by quantifying the average number of culms per hectare (from sample plots analysis), the total numbers of culms in PB in Viengxay is 4.6 million, while those in Xiengkhor are 40.7 million. For UMD, the numbers of culms in Viengxay District are 496 million, and those in Xiengkhor are 163 million in UMD. By looking at the overall result of the Houaphan Province, it becomes clear that the total bamboo area in UMD is 508,368 ha which consists of 4.6 billion culms, while that in pure bamboo forest is 17,870 ha that consists of approximately 72.4 million culms in the province. Similar to the situation in Houaphan Province, the analysis of Xiengkhouang shows that the total area of the upper mixed deciduous in Phaxay District is 21,304 ha. As a consequence, by quantifying the average number of culms per hectare combined with the bamboo area per district, the total numbers of culms for Phaxay are 65,989, 000 in UMD. Pure bamboo forest does not appear in Phaxay District. By looking at the overall result of the province, it indicates that with the total bamboo area in upper mixed deciduous in Xiengkhouang Province of 461,737.00 ha, it consists of 1.4 billion bamboo culms, while in pure bamboo forest of 1,337 ha, it consists of approximately 5.4 million culms. The study found that the most commonly cultivated species are Bamboo Loung, and Bamboo Phang (Bamboo D. lonoifimbriatus) in Xiengkhouang and Houaphan Province. The purpose of the planting is only for domestic use. From the analysis of the sample plot 3 and 4, it is obvious that the average number of culms that farmer can realize is 2,832 culms per ha. The calculations in Table 13 show the land value (land rent) in agricultural farm productions from the standpoint of the households in the Houaphan region. If one tried to find out the profitability of these sectors from the standpoint of the households by running calculations for different farm sectors, in case that the households use the cost of labor from outside, one might only end up with negative land values or the land values (the profit) is not desirable for farmers, meaning that it would be more profitable to let the land lie idle or transfer it to some other uses. However, most of the farm households in this region used their own labor and input in the production process, while others used the labor from their relatives. Recalculations by considering their own labor cost, and own inputs to production process reveal that the farm households in this region are faced with positive land values. In addition, one of the surprising findings found that the cash income that derived from the bamboo sector has contributed the highest part of the total cash income of the average household in Viengxay District after that from livestock sector. The calculations in Table 13 also indicate that the income from the upland rice sector

Final Report Laos Resource Mapping and Farmer Input Market Studies, Part of Lao-Vietname Bamboo Sector Feasibility Study
Prepared by: Dr. Latsamy Boupha and Somvang Phimmavong Faculty of Forestry, National University of Laos, Lao PDR
48
(Shifting cultivation) is not desirable for the farm households in the Houaphan region. This problem has to be mentioned here, since rice is the main food intake of the rural households in Laos in general and Houaphan Province in particular. The rice yields are extremely low due to the enforcement of the shifting cultivation stabilization program enforced by the government which allows the shorter fallow of the rotation. This leads to the cause of degraded soil. The empirical investigation shows that average farm household of five people produces less than 1000 kg of rice p.a. while they consume about 1500 kg p.a. (Foppes J., Ketphanh, S. 1997). Therefore, a majority of the households in this region have not enough rice for basic consumption. Usually, the time of rice shortage begins from late January on wards after a month of rice harvesting in November. In order to get enough rice for their basic consumption in one accounting year, they have to produce more income from selling their livestock, bamboo harvesting in Viengxay District, and crop farming (corn, soybean, etc.) in Xiengkhor District, and these are used to trade for rice to alleviate annual food shortages. From the analysis in Table 16, it shows that the families of Viengxay District have more free time than those of Xiengkhor District. While the families of Viengxay District spend their time on harvesting bamboo from natural forest for cash income, those of Xiengkhor spend their time on shifting cultivation, corn and bean cultivation for their cash income. The average income of the Viengxay household is approximately 10 million Kip per year, whilst that of the Xiengkhor household is relatively higher, making up over 14 million kip per year. The analysis also found that the biggest part of the average farm household income from the two districts derives from livestock productions, which consist of cattle raising, pigs, poultries, and fish raising. As mentioned above, it is an interesting finding that the average cash income of the family in Viengxay District from bamboo harvest is ranking second, while that in Xiengkhor District from Bamboo harvest is zero due to the fact that there is no trade of bamboo in this region. Bamboo is only used for domestic consumption. Some farmers slashed and burn the pure bamboo forest in order to establish their crop farming because of the income incentives from them. No doubt, the proportion of the bamboo forest will decrease substantially. Therefore, it is recommended that relevant authorities should consider this problem carefully. Perhaps, a possible solution could be making efforts to create the management plan for the sustainable use of the bamboo resources in the region. Such required efforts are to start with providing the awareness on the importance of the bamboo resource, and especially getting the households involved in the decision making during the land allocation process. One important finding of this study found that the economies of Kham District in Xiengkhouang Province relies heavily on the paddy rice sector (non-cash income), and farm garden sectors, i.e. garlic, banana, vegetable, and watermelon garden. This result is a further confirmation of the empirical study of DAFO report (2005). As can be seen clearly from the household analysis of the study (Table 27), the proportion of the income from the paddy rice sector is the largest and is on average one third of the total household income of Kham District region. Though the result of the analysis has proved that the bamboo sectors in Viengxay District

Final Report Laos Resource Mapping and Farmer Input Market Studies, Part of Lao-Vietname Bamboo Sector Feasibility Study
Prepared by: Dr. Latsamy Boupha and Somvang Phimmavong Faculty of Forestry, National University of Laos, Lao PDR
49
in particular and in other regions in general has high potential for increasing the income condition of the Viengxay region, there are some constraints which hinder its extension. On one hand, the majority of the households in the region have relied only natural bamboo forest without proper management intervention from PAFO or DAFO, and on the other hand, their holding size of bamboo plantation is very few. Therefore, it is very important for the central government to carefully think about the over exploitation of bamboo resource in the natural forest that might exist. A possible solution could be providing policy incentives for enlarging the bamboo plantation. However, this matter should be carefully solved, since there are many factors involved in enlarging the plantation of the farm household. For instance, the credit capital is one of the most important means to enlarge the plantation. In addition, there should have the opportunities for farm households to have special educational programme, such as training courses, or study tours in other regions that have experiences with this subject matter. One of the key findings from village studies and the self-assessment of Project field teams found that the majority of the farmers are willingness to invest and enlarge their bamboo plantation, especially the local farmers in Viengxay District in Houaphan Province. However, they are still concerned with problems mentioned above. The entry points for overcoming the constraints are provision of the capital credit, management of bamboo resources, skills training, marketing and diversification of products. In this study, we have not touched on the input market studies (services, goods or materials that are used by bamboo producers as necessary part of their faming/business activities, i.e., Agro chemicals/fertilisers, transportation, storage, processing equipment, etc.) since in Laos in general and in the study areas in particularly, the bamboo sector is still in the initial stage, and the market inputs have not existed yet. In a concluding remark it is tempting to say something about the importance of the kinds of our analyses. Such empirical investigation does not show whether a prevailing or contemplated central government policy is wrong or right, but how political measures work, and what their economic rewards are. Even though such kind of analysis is the first attempt in Laos in general and Houaphan and Xiengkhouang region in particular, it is hoped that the relevant authorities should consider or base their decisions upon these findings.

Final Report Laos Resource Mapping and Farmer Input Market Studies, Part of Lao-Vietname Bamboo Sector Feasibility Study
Prepared by: Dr. Latsamy Boupha and Somvang Phimmavong Faculty of Forestry, National University of Laos, Lao PDR
50
REFERENCES Denzin, N.K. and Y.S. Lincoln (eds.). 1998. Collecting and Interpreting Qualitative
Materials. Sage, Thousands, CA, USA. Department of Ethnics 2005, The Ethnics Groups in Lao PDR, Lao National Front for
Construction, Vientiane, Lao PDR. Fontana, A. and J.H. Frey 1998. Interviewing. The Art of Science. Pages 47-73 In N.K.
Denzin and Y.S. Lincoln (eds.), Collecting and Interpreting Qualitative Materials. Sage, Thousand Oaks, CA, USA.
Foppes J., Ketphanh, S. 1997. “The use of Non Timber Forest Products in Lao PDR”,
paper presented at the International Workshop on Sustainable Management of Non-Wood Forest Products, UPM, Serdang, Selangor, Malaysia, 14-17 October 1997.
Holbrook, B. 1996. Shopping around: focus group research in North London. Area
28(2):137-142. Huberman, A.M. and M.B. Miles. 1998. Data Management and Analysis Methods.
Methods of Collecting and Analyzing Empirical Materials. Pages 179-207 In N.K. Denzin and Y.S. Lincoln (eds.), Collecting and Interpreting Qualitative Materials. Sage, Thousand Oaks, CA, USA.
Nurse and Soydara, 2002. Conservation and Development Finding the Linkages, Lessons
Learned in Collaborative Management for the Sustainable Use of Non Timber Forest Products in Lao PDR, IUCN Vientiane, Laos
Phimmavong, S. 2004. Impact of Industrial Tree Plantation (BGA Forestry Plantation
Company) on Distribution of Income in Central Laos, Master thesis at Institute of Internal Forestry and Forest products, Dresden University of Technology, Germany
Tsechalicha, Xiong and Don Gilmour (2000). Forest rehabilitation in Lao PDR. Issues and Constraints. IUCN, December 2000. 31 p.
Yin, Robert K. 1989: Case Study Research: Design and Methods. Sage, Newbury Park, London, New Delhi.