Final Report on the Costs and Benefits of Paid … Paid Family Leave.pdf · Final Report on the...
29
Final Report on the Costs and Benefits of Paid Family and Medical Leave in the District of Columbia Workspace No WS108383 November 12, 2015 Jeffrey Hayes, PhD Institute for Women’s Policy Research [email protected]
-
Upload
truongkien -
Category
Documents
-
view
214 -
download
0
Transcript of Final Report on the Costs and Benefits of Paid … Paid Family Leave.pdf · Final Report on the...

Final Report on the Costs and Benefits of Paid Family and
Medical Leave in the District of Columbia
Workspace No WS108383
November 12, 2015
Jeffrey Hayes, PhD
Institute for Women’s Policy Research

1
EXECUTIVE SUMMARY
It has been more than 22 years since the federal Family and Medical Leave Act (FMLA) was
signed and eligible workers received some job protections when they need to take time (up to 12 weeks)
to care for their own health, a new child, or their families. FMLA does not require, however, that
employers compensate their employees for this time. In three states – California, New Jersey, and Rhode
Island – existing temporary disability insurance (TDI) systems were expanded to provide paid family
leave through a social insurance program. In many state and local jurisdictions across the country,
legislatures are considering proposals to provide paid family and medical leave, but few have TDI
systems in place and would need to build a new social insurance system.
This report provides cost estimates for a series of policy scenarios for private employers in the
District of Columbia and other employers of DC residents based on existing policy ideas and representing
a range of eligibility criteria and benefit levels. It uses an existing simulation model that estimates leave-
taking behaviors for workers and the characteristics of the leaves they take under different program
designs. The costs of leaves are divided into three categories: costs of program benefits, wages paid by
employers to the workers out on leave, and the value of uncompensated time for workers.
Policy scenarios are compared to a baseline model for the current policy climate, which is one
where some workers receive compensation while taking leave, but there is no program benefit. We find
that DC private employers pay about $123.3 million per year for family and medical leaves taken by their
employees, but private employees working in DC take the equivalent of $415.2 million annually in
uncompensated leave. Under the three alternative paid leave policy scenarios examined in detail in this
report, the cost for the new wage replacement benefits ranges from $30.8 million to $150.9 million per
year. These new benefits reduce the amount of uncompensated time taken by workers by at least $10.6
million up to $84.4 million.
The results highlight the importance of program design issues such as eligibility criteria, number
of days or weeks benefits may be received, and reasons for accessing program benefits. More generous
program designs perform better at reducing the levels of uncompensated leave taken by more vulnerable
groups and reduce one aspect of labor market inequality. The report concludes with some additional notes
on financing and cost estimates for program start-up and administration.

2
INTRODUCTION
In September 2014 the U.S. Department of Labor Women’s Bureau grant program awarded a
total of $500,000 to support paid leave feasibility studies in three states and the District of Columbia.
These grants provided resources to research and analyze how paid leave programs can be developed and
implemented. The goal was to improve workplace support for working families with policies that reflect
the realities of the 21st Century workforce.
DC proposed to build on the experiences of states with established paid family leave programs
(California, New Jersey, and Rhode Island), along with studies conducted by the federal government and
other research institutions. The research is designed to contribute robust, actionable findings to the
national, paid family leave conversation with three research goals:
FINANCING AND BENEFIT MODELING
IWPR modeled eligibility rules, program durations, and benefit levels to provide cost estimates
for benefits in DC. Eligibility rules and benefit distribution modeling will dovetail with the
economic impact analysis, as economic gains to workers and businesses are directly related to
benefits built into the paid family leave program.
ECONOMIC IMPACT ANALYSIS
IWPR also provided distributional analyses of the impacts of a paid family and medical leave
program on those working in DC by economic and demographic characteristics, such as age,
gender, race and ethnicity, and family income. Previous research on the likely impacts of leave
programs on workers was reviewed as a part of this effort.
COST-BENEFIT STUDY
Positive economic impacts on workers and businesses represent the societal benefits of the
program, while the financing and paid benefit components of the program yield societal costs.
This study explores the societal costs estimated in light of expected societal benefits and
discusses how those might be distributed between stakeholders to maximize societal benefits.
PREVIOUS RESEARCH
Economic Benefits of Paid Leave
Paid leave provides benefits for both employers and workers. Paid leave is associated with
improved productivity, reduced employee turnover, improved morale, and increased employee loyalty
(Milkman and Appelbaum 2013). Improved employee loyalty and retention are often substantial benefits
to employers because they can ultimately reduce the excess costs of training and hiring new employees. A
comprehensive literature review of 30 quantitative case studies on the cost of turnover estimated that the
median cost to replace an employee is 21 percent of his or her salary (Boushey and Glynn 2012a).

3
For workers, paid leave is correlated with stronger labor force attachment (Rossin-Slater, Ruhm,
and Waldfogel 2011) and greater economic security (Boushey and Glynn 2012b). Women who reported
taking paid leave after the birth of a child were more likely to be working 9 to 12 months later compared
to women who did not take leave at all (Sheperd-Banigan, M., and JF Bell 2014). Women who take paid
family leave of 30 days or longer are also significantly more likely to report wage increases in the year
following a child’s birth than are women who take no leave at all (Houser and Vartanian 2012). Women
who took paid family leave were 40 percent less likely to be receiving food stamps and 39 percent less
likely to receive forms of public assistance in the year after the birth of a child than a woman who
returned to work without taking leave at all (Houser and Vartanian 2012).
Research is also taking a closer look at the impact that paid leave, or the lack-there-of, has on
working adults who are caring for older parents, disabled spouses, or children with chronic health issues
or special health needs. The demands of caregiving significantly impact those employees’ physical and
mental health as well as their economic well-being (Earle and Heymann 2011). Adults who take unpaid
leave to care for a parent have a significant effect on the economy. Based on the 2008 panel of the Health
and Retirement Survey, the total aggregate amount of lost wages, pensions, and social security as a result
of unpaid leave taken by caretakers across their lifetime is estimated to be about $3 trillion (Metlife
Mature Market Institute 2011). These lost wages experienced by caregivers disproportionately affect
women compared with men over their lifetime.
Most workers will have caregiving responsibilities at one time or another or become injured or ill
themselves. Access to paid leave can help reduce absenteeism in the long run, while it also increases
employee morale and reduces turnover.
Health Benefits of Paid Leave
Access to paid time off to care for family members means working caregivers do not have to use
their own sick leave or vacation leave to meet family needs. Paid leave allows caretakers peace of mind
that they will be able to deal with any of their own health complications that may arise without losing pay.
Earle and Heymann (2011) provide evidence that paid leave (both paid family leave and paid sick days)
substantially or entirely offsets the negative mental and physical effects reported by people caring for
children with special needs.
Several studies suggest that longer leaves from work after the birth of a child are correlated with
improved maternal mental health, especially reductions in depressive symptoms and parenting stress. For
example, Chatterji, Markowitz, and Brooks-Gunn (2013) find that among working mothers, the
relationship between work hours and depression is primarily driven by women working full time during
the 3 months after childbirth. Chatterji and Markowitz (2012) find women with a spouse that did not take
leave after the birth of a baby experienced higher levels of depressive symptoms as new mothers. Any
amount of work in the 3 months after childbirth is, however, associated with increased parenting stress
(Chatterjii et al. 2013).

4
Family leave following the birth of a child also has positive effects on the health of young
children, rates of breastfeeding, and fathers’ involvement with their babies (Gomby and Pei 2009).
Evidence suggests that new mothers who choose to delay returning to work are likely to breastfeed for
longer than new mothers who return to work within 1 to 6 weeks. Longer maternity leaves are associated
with higher odds of breastfeeding among full-time workers, especially full-time workers who do not hold
managerial positions, lack job flexibility, or experience psychosocial distress (Guendelman et al. 2009).
Extending paid postpartum leave and flexibility in working conditions for women has positive effects on
breastfeeding women (Guendelman et al. 2009).
Evidence suggests that paid leave may also improve utilization and compliance with well-baby
preventive care recommendations. Mothers with access to some form of paid leave, most often paid
vacation leave, took their children to more well-baby visits than other working mothers (Hamman 2011).
Employer Experience with Leave Programs
Most businesses (56 percent) covered by the federal FMLA report that dealing with planned
longer-term family and medical leaves is either ―very easy‖ or ―somewhat easy‖ (Klerman et al. 2012).
Research on California’s paid family leave program (Appelbaum and Milkman 2011) finds that after
more than five years’ experience with paid family leave, the vast majority of employers reported that it
had a minimal impact on their business operations. Most employers reported that paid family leave had
either a ―positive effect‖ or ―no noticeable effect‖ on productivity, profitability/performance, turnover,
and employee morale. Further, small businesses were less likely than larger establishments (those with
more than 100 employees) to report any negative effects (Appelbaum and Milkman 2011). Based on in-
depth interviews with employers in New Jersey, Lerner and Appelbaum (2014) conclude that the state’s
Family Leave Insurance program had little impact on employers’ business practices following its
implementation in 2009.
WORKER LEAVE IN THE DISTRICT OF COLUMBIA
The District of Columbia has three leave policies already in effect. First, DC’s Family and
Medical Leave Act requires employers with 20 or more employees to provide the right to take up to 16
weeks of family leave and 16 weeks of medical leave in a 24-month period to their employees for the
birth, adoption, or foster placement of a child; to care for a family member with a serious health condition;
or the employee’s own serious health condition. While DC’s policy covers more workers and provides
more time than the federal FMLA, it is similar to the FMLA in that it does not provide or require any
wage replacement.
Second, under the Accrued Sick and Safe Leave Act of 2008, DC employers must provide
eligible employees with 3 to 7 days of paid leave that can be used for the employee’s or a family
member’s physical or mental illness, injury, or medical condition; time for the employee’s or a family
member’s medical care, diagnosis, or preventive medical care; or time for the employee or a family
member who is a victim of stalking, domestic violence, or abuse to get medical attention, use services,
seek counseling, relocate, take legal action, or take steps to enhance health and safety. The amount of
leave depends on the size of the employer, with smaller employers (1-24 employees) required to provide

5
up to three days per year, employers with 25 to 99 employees required to provide up to five days per year,
and employers with 100 or more employees required to provide up to seven days per year.
Finally, employees of DC government may receive up to 8 weeks of fully paid leave in a 12
month period for the birth or adoption of a child, or to care for a family member with a serious health
condition. (For their own health needs or conditions, employees of DC government accrue at least 13 days
of fully paid sick leave per year on a full time basis, and part-time employees receive a prorated number
of days. This is a separate allotment than the 8 weeks provided under the government’s paid family leave
benefit.)
SIMULATION MODEL
In order to better understand the costs and benefits of expanding paid leave in DC, several
scenarios based on state or federal proposals were identified by IWPR and DC DOES for this study. The
cost estimation strategy is to apply a simulation model developed by IWPR and researchers at the Labor
Research Center, University of Massachusetts, Boston. The model uses the U.S. Department of Labor’s
(DOL) 2000 Family and Medical Leave Act survey to estimate leave taking behavior and leave
characteristics, which are then applied according to work characteristics, to a larger and more current
sample of workers in the DC labor force using a sophisticated strategy. This model allows the estimation
of the number of leaves, the characteristics of the leaves (length, wage replacement), and the
characteristics of workers taking leaves.
Specifically, the model:
Estimates probabilities of taking a leave (or multiple leaves) by type of leave, eligibility, and
important demographic characteristics of the leave-taker.
Estimates length of leave taking by type of leave and degree to which there is employer pay.
Simulates paid program leave taking behavior based on family income levels and the
existence and level of employer-paid leave benefits.
Allows for an analysis of leave takers by gender, age, marital status, race, ethnicity, family
income, and other demographic characteristics, both in the absence of a program and with a
new plan.
Estimates the amount of lost wages, employer pay to workers while on leave, and paid leave
program benefits for all leave takers.
Figure 1 shows a simplified diagram of the complex series of decisions and behaviors that a worker might
go through for a single reason that he or she might need to take leave from work: a new child. Each broad
reason for needing leave (own health conditions, maternity-related disability, bonding with a new child,
children’s healthcare needs, spouse’s healthcare needs, or parents’ healthcare needs) is modeled
separately with a similar series of decisions and leave characteristics estimated.

6
FIGURE 1: SIMPLIFIED EXAMPLE OF NEW CHILD LEAVES
Need a NEW
CHILD leave?
Out of
sample
Take a NEW
CHILD leave?
Number of leaves
Duration of leaves
Weekly EMPLOYER
payments without paid
leave
Weekly EMPLOYER
payments + Program
benefits from paid leave
Would take a leave if paid
leave implemented
Number of leaves
Duration of leaves
Leave
Needed, but
Not Taken
Weekly program benefits from
paid leave
Total NEW CHILD leave
costs under paid leave
program
No
Yes
No Yes
No
Yes
With FMLI
Without FMLI

7
DATA USED
The simulation model is based on:
2000 Department of Labor Family and Medical Leave Act Survey data for the estimation
of behavioral models
The 2012-2014 Current Population Survey Annual Social and Economic Supplements for
the DC area labor force characteristics, and
2013 American Community Survey for adjusting results for the commuting patterns of
workers in the DC area by age, race/ethnicity, gender, education, and occupation.
Additional data from the agencies administering family and medical leave insurance programs in
California and New Jersey were used for estimating the program take-up rates that are specified by the
analyst as an input to the simulation models. In the simulation model, the take-up rate represents the
fraction of persons eligible for the paid leave program who will participate. The model allows this
fraction to be reduced further based on the program benefit level. The higher the benefit level relative to
the next best alternative (which is either employer pay or nothing, if the leaver does not receive any pay),
the greater the probability of participating in the program. Claims data from California and New Jersey
are also used to estimate program growth over the first five years in DC.
Claims data from California and New Jersey were compared to state level labor force estimates of
the workers with the need for family and medical leaves to estimate program participation in those two
states. Federal data used for estimating the state-level number of workers with family events that could
require leave taking are taken from:
2013 American Community Survey to estimate the number of workers with a child under age
one in the household for the population at risk of needing a new child leave
2012-2014 Current Population Surveys Outgoing Rotation Groups for estimating the number
of workers per year who were absent from work during the survey reference week for (1)
Own illness/injury/medical problems, (2) Other family/personal obligation, or (3) Maternity
leave to estimate the need for leaves for own serious health conditions, family care demands,
and maternity-related disability, respectively.
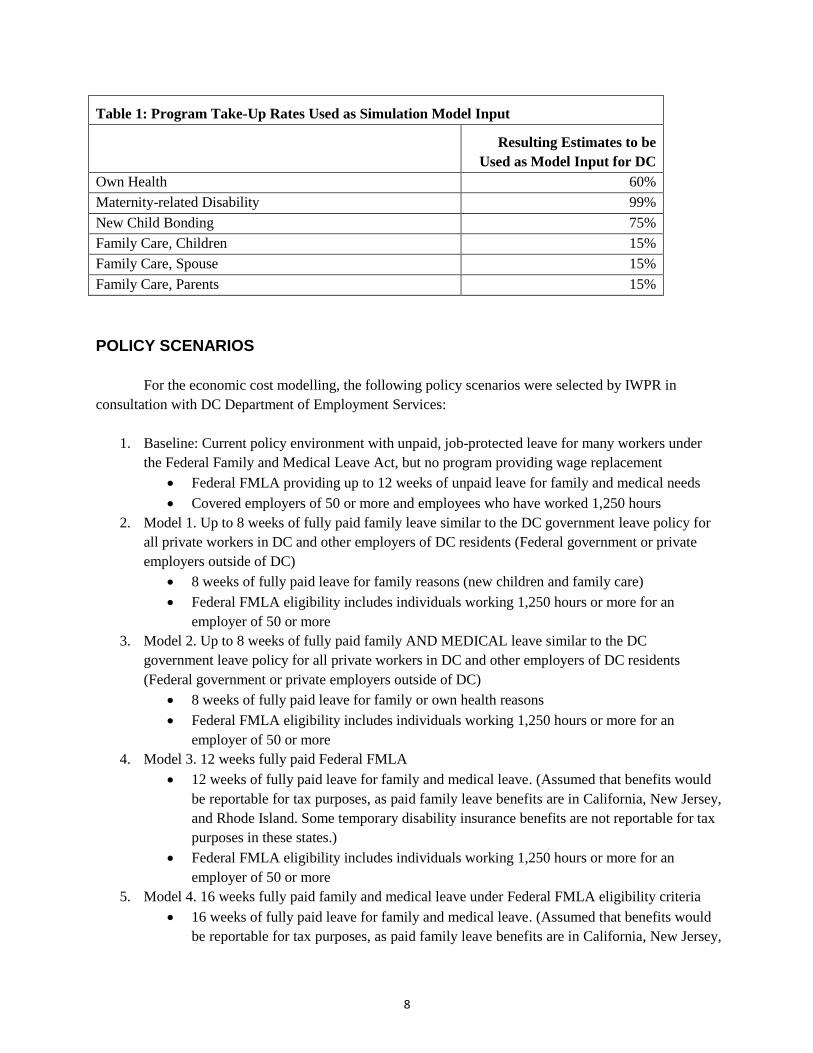
The estimates of take-up rates from this step were used in a second round of simulation models to
see how well they predicted the reported claims data from California and New Jersey. Based on this
second round of analysis, the take-up rate for own health reasons was increased slightly (from 55 percent
to 60 percent). Expected take-up rates for leaves around new children were also increased (from 36
percent to 99 percent for maternity-related disability and from 50 percent to 75 percent for new child
bonding). The final take-up rates used in specifying the simulation models estimated for the cost of family
and medical leave benefits in DC are shown in Table 1.
8
Table 1: Program Take-Up Rates Used as Simulation Model Input
Resulting Estimates to be
Used as Model Input for DC
Own Health 60%
Maternity-related Disability 99%
New Child Bonding 75%
Family Care, Children 15%
Family Care, Spouse 15%
Family Care, Parents 15%
POLICY SCENARIOS
For the economic cost modelling, the following policy scenarios were selected by IWPR in
consultation with DC Department of Employment Services:
1. Baseline: Current policy environment with unpaid, job-protected leave for many workers under
the Federal Family and Medical Leave Act, but no program providing wage replacement
Federal FMLA providing up to 12 weeks of unpaid leave for family and medical needs
Covered employers of 50 or more and employees who have worked 1,250 hours
2. Model 1. Up to 8 weeks of fully paid family leave similar to the DC government leave policy for
all private workers in DC and other employers of DC residents (Federal government or private
employers outside of DC)
8 weeks of fully paid leave for family reasons (new children and family care)
Federal FMLA eligibility includes individuals working 1,250 hours or more for an
employer of 50 or more
3. Model 2. Up to 8 weeks of fully paid family AND MEDICAL leave similar to the DC
government leave policy for all private workers in DC and other employers of DC residents
(Federal government or private employers outside of DC)
8 weeks of fully paid leave for family or own health reasons
Federal FMLA eligibility includes individuals working 1,250 hours or more for an
employer of 50 or more
4. Model 3. 12 weeks fully paid Federal FMLA
12 weeks of fully paid leave for family and medical leave. (Assumed that benefits would
be reportable for tax purposes, as paid family leave benefits are in California, New Jersey,
and Rhode Island. Some temporary disability insurance benefits are not reportable for tax
purposes in these states.)
Federal FMLA eligibility includes individuals working 1,250 hours or more for an
employer of 50 or more
5. Model 4. 16 weeks fully paid family and medical leave under Federal FMLA eligibility criteria
16 weeks of fully paid leave for family and medical leave. (Assumed that benefits would
be reportable for tax purposes, as paid family leave benefits are in California, New Jersey,

9
and Rhode Island. Some temporary disability insurance benefits are not reportable for tax
purposes in these states.)
Federal FMLA eligibility includes individuals working 1,250 hours or more for an
employer of 50 or more
6. Model 5. 16 weeks fully paid family and medical leave under DC FMLA eligibility criteria
16 weeks of fully paid leave for family and medical leave. (Assumed that benefits would
be reportable for tax purposes, as paid family leave benefits are in California, New Jersey,
and Rhode Island. Some temporary disability insurance benefits are not reportable for tax
purposes in these states.)
DC FMLA eligibility includes individuals working 1,000 hours or more for an employer
of 20 or more
The number of leaves taken and the number of leaves accessing program benefits are shown in
Table 2. Under the current policy, an estimated 72,127 family and medical leaves per year are taken. The
results for subsequent model specifications show that when wage replacement is provided, workers will
take more leaves. Under the range of proposals modeled, DC’s private employers would see an increase
of 2,000 to 4,000 leaves per year. Many of the total leaves taken are short and would not qualify for
benefits under a one-week waiting period used for model estimates. (Benefit waiting periods are used in
the states with paid leave programs.)
Table 2: Estimated Number of Leaves Taken and Number Accessing Program Benefits Under Different
Program Designs, Employed by Private Employers in DC
DC Private Employers Total Leaves Taken Leaves Accessing
Program Benefits
Baseline: Current Policy 72,127 NA
Model 1: 8 Weeks Family, Full Pay, Federal FMLA Eligibility 73,057 5,176
Model 2: 8 Weeks Family and Medical, Full Pay, Federal FMLA
Eligibility 74,715 15,947
Model 3: 12 Weeks, Full Pay, Federal FMLA Eligibility 73,798 14,979
Model 4: 16 Weeks, Full Pay, Federal FMLA Eligibility 73,943 14,739
Model 5: 16 Weeks, Full Pay, DC FMLA Eligibility 75,277 18,901
Source: IWPR estimates for private employers in DC based on IWPR/LRC Family and Medical Leave Simulation
Model.
* Eligibility for paid leave benefits in Models 1-4 is based on Federal FMLA (working 1,250 hours for an employer
of 50 or more workers); eligibility for benefits in Model 5 is DC FMLA (working 1,000 hours for an employer of 20
or more workers).
Table 3 shows the estimated values of three wage bases using the 2012-2014 Current Population
Survey Annual Social and Economic Supplement (CPS), 2013 American Community Survey (ACS), and
Quarterly Census of Employment and Wages (QCEW). These are used to express program costs relative
to the value of earnings to estimate a premium level that would be necessary to pay for the leave benefits.

10
The first wage base is DC’s unemployment insurance taxable earnings calculated as the total of the first
$9,000 of wages paid to each employee. The second wage base is based on Social Security taxable
earnings calculated as the total of the wages paid to each employee up to $118,500. The third wage base
is the total of all earnings reported. The CPS provides information on total earnings, number of hours
usually worked each week and the number of weeks worked in the year, and an indicator of the total
employment for the respondent’s employer in the previous year. The ACS is used to adjust the estimates
to account for commuting patterns between DC and other states. Finally, the QCEW was used to assist in
the estimation of workers employed by employers of 20 or more for Model 5. (The CPS identifies
employers by size groups and individuals working for employers of 10 to 49 employees were randomly
assigned to 10 to 19 and 20 to 49 based on the proportion of DC employers in each group using the
QCEW.)
Table 3: Estimated Wage Bases (Millions of dollars) for Private Employers in DC and Other
Employers of DC Residents
Federal FMLA Eligible DC FMLA Eligible
(Millions $s)
DC Private
Employment
Other Employment
of DC Residents
(Federal and
Private Employers
Outside of DC)
DC Private
Employment
Other Employment
of DC Residents
(Federal and
Private Employers
Outside of DC)
DC Unemployment
Insurance $3,338.4 $814.9 $3,710.7 $869.5
Social Security $23,477.6 $6,800.9 $25,103.7 $7,070.3
Total Earnings $27,836.7 $8,026.3 $29,793.2 $8,357.6
Source: IWPR analysis of 2012-2014 Current Population Survey Annual Social and Economic Supplement.
RESULTS
The costs of leaves taken under the current status quo and the five alternative policy scenarios are
shown in Tables 4-9 along with their distribution of the cost across employers, employees, and a proposed
paid leave program. Tables 4-9 show the costs for leaves taken from private employment based in DC in
the top panel and the costs for other leaves DC residents might take when employed by the Federal
government or an employer outside of the District in the lower panel. The discussion focuses on the costs
of family and medical leave for DC private employees. Costs of each are shown in millions of dollars and
as a percentage of the three taxable wage bases (see Table 3 for taxable wage bases). (DC government
employees have not been included in any of the cost estimates even when the proposed policy (e.g.,
Models 4 or 5) might provide more leave than they receive under current benefit programs.)
Table 4 estimates the number of leaves and total costs by type of leave under current policies for
DC private employers and other employers of DC residents. The majority of leaves are for the worker’s
own health and these leaves account for the majority of the leave costs. Private DC employees generate
leave time valued at $538.5 million and of this their employers are providing $123.3 million (about 23
percent) in wage benefits within a calendar year. DC residents working for other types of employers
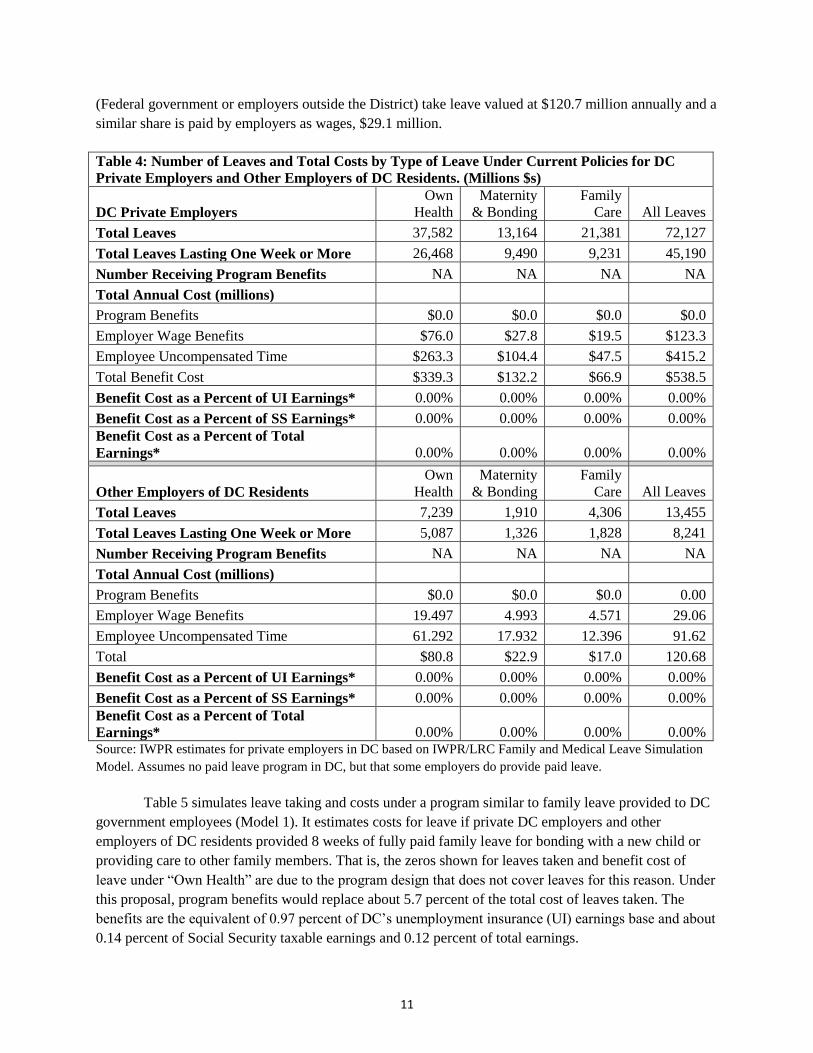
11
(Federal government or employers outside the District) take leave valued at $120.7 million annually and a
similar share is paid by employers as wages, $29.1 million.
Table 4: Number of Leaves and Total Costs by Type of Leave Under Current Policies for DC
Private Employers and Other Employers of DC Residents. (Millions $s)
DC Private Employers
Own
Health
Maternity
& Bonding
Family
Care All Leaves
Total Leaves 37,582 13,164 21,381 72,127
Total Leaves Lasting One Week or More 26,468 9,490 9,231 45,190
Number Receiving Program Benefits NA NA NA NA
Total Annual Cost (millions)
Program Benefits $0.0 $0.0 $0.0 $0.0
Employer Wage Benefits $76.0 $27.8 $19.5 $123.3
Employee Uncompensated Time $263.3 $104.4 $47.5 $415.2
Total Benefit Cost $339.3 $132.2 $66.9 $538.5
Benefit Cost as a Percent of UI Earnings* 0.00% 0.00% 0.00% 0.00%
Benefit Cost as a Percent of SS Earnings* 0.00% 0.00% 0.00% 0.00%
Benefit Cost as a Percent of Total
Earnings* 0.00% 0.00% 0.00% 0.00%
Other Employers of DC Residents
Own
Health
Maternity
& Bonding
Family
Care All Leaves
Total Leaves 7,239 1,910 4,306 13,455
Total Leaves Lasting One Week or More 5,087 1,326 1,828 8,241
Number Receiving Program Benefits NA NA NA NA
Total Annual Cost (millions)
Program Benefits $0.0 $0.0 $0.0 0.00
Employer Wage Benefits 19.497 4.993 4.571 29.06
Employee Uncompensated Time 61.292 17.932 12.396 91.62
Total $80.8 $22.9 $17.0 120.68
Benefit Cost as a Percent of UI Earnings* 0.00% 0.00% 0.00% 0.00%
Benefit Cost as a Percent of SS Earnings* 0.00% 0.00% 0.00% 0.00%
Benefit Cost as a Percent of Total
Earnings* 0.00% 0.00% 0.00% 0.00% Source: IWPR estimates for private employers in DC based on IWPR/LRC Family and Medical Leave Simulation
Model. Assumes no paid leave program in DC, but that some employers do provide paid leave.
Table 5 simulates leave taking and costs under a program similar to family leave provided to DC
government employees (Model 1). It estimates costs for leave if private DC employers and other
employers of DC residents provided 8 weeks of fully paid family leave for bonding with a new child or
providing care to other family members. That is, the zeros shown for leaves taken and benefit cost of
leave under ―Own Health‖ are due to the program design that does not cover leaves for this reason. Under
this proposal, program benefits would replace about 5.7 percent of the total cost of leaves taken. The
benefits are the equivalent of 0.97 percent of DC’s unemployment insurance (UI) earnings base and about
0.14 percent of Social Security taxable earnings and 0.12 percent of total earnings.

12
Table 5: Number of Leaves and Total Costs by Type of Leave for Up to 8 Weeks of Fully Paid
Family Leave for DC Private Employers and Other Employers of DC Residents. (Model 1)
DC Private Employers
Own
Health
Maternity
& Bonding
Family
Care All Leaves
Total Leaves 36,969 13,684 22,404 73,057
Total Leaves Lasting One Week or More 25,988 9,583 9,625 45,196
Number Receiving Program Benefits NA 4,428 748 5,176
Mean Duration of Benefit Receipt (Days) NA 28.0 12.6 25.8
Total Annual Cost (millions)
Program Benefits $0.0 $28.5 $2.3 $30.8
Employer Wage Benefits $49.1 $15.7 $16.6 $81.3
Employee Uncompensated Time $288.0 $82.1 $55.8 $425.8
Total $337.1 $126.3 $74.6 $537.9
Benefit Cost as a Percent of UI Earnings* 0.00% 0.90% 0.07% 0.97%
Benefit Cost as a Percent of SS Earnings* 0.00% 0.13% 0.01% 0.14%
Benefit Cost as a Percent of Total
Earnings* 0.00% 0.11% 0.01% 0.12%
Other Employers of DC Residents
Own
Health
Maternity
& Bonding
Family
Care All Leaves
Total Leaves 7,529 1,916 4,479 13,924
Total Leaves Lasting One Week or More 5,282 1,320 1,898 8,500
Number Receiving Program Benefits NA 710 123 833
Mean Duration of Benefit Receipt (Days) NA
0 30.3 10.9 27.4
Total Annual Cost (millions)
Program Benefits $0.0 $7.3 $0.5 $7.8
Employer Wage Benefits $12.1 $3.0 $4.6 $19.7
Employee Uncompensated Time $71.9 $16.4 $16.4 $104.8
Total $84.1 $26.7 $21.6 $132.3
Benefit Cost as a Percent of UI Earnings* 0.00% 0.94% 0.06% 1.00%
Benefit Cost as a Percent of SS Earnings* 0.00% 0.11% 0.01% 0.12%
Benefit Cost as a Percent of Total
Earnings* 0.00% 0.10% 0.01% 0.10% Source: IWPR estimates for private employers in DC based on IWPR/LRC Family and Medical Leave Simulation
Model. Fully paid leave for up to 8 weeks for family care needs or new child bonding. Benefit eligibility determined
by Federal FMLA. * Benefit costs as a percent of taxable payroll include 5 percent of estimated benefits for
administrative costs.
Re-estimating the simulations in Table 5, but including leaves taken for a worker’s own health
needs (Model 2), results in the costs shown in Table 6. Including leaves for the worker’s own health
increases the estimated cost of providing benefits to private DC employees from $30.8 million to $93.6
million. The cost of leave benefits is equivalent to about 2.9 percent of UI taxable earnings for private DC
employers and 3.3 percent for other employers of DC residents. Program benefits under this proposal

13
would require revenue equivalent to about 0.42 percent of taxable earnings up to the Social Security
maximum ($118,500) or 0.35 percent of all earnings reported by covered workers.
Table 6: Number of Leaves and Total Costs by Type of Leave for Up to 8 Weeks of Fully Paid
Family and Medical Leave for DC Private Employers and Other Employers of DC Residents
(Model 2).
DC Private Employers
Own
Health
Maternity
& Bonding
Family
Care All Leaves
Total Leaves 38,234 13,727 22,755 74,715
Total Leaves Lasting One Week or More 27,014 9,881 9,566 46,461
Number Receiving Program Benefits 10,579 4,616 752 15,947
Mean Duration of Benefit Receipt (Days) 22.4 27.6 13.0 23.4
Total Annual Cost (millions)
Program Benefits $60.3 $30.6 $2.7 $93.6
Employer Wage Benefits $51.1 $17.4 $17.8 $86.3
Employee Uncompensated Time $235.1 $87.8 $55.4 $378.3
Total $346.5 $135.8 $75.9 $558.2
Benefit Cost as a Percent of UI Earnings* 1.90% 0.96% 0.08% 2.94%
Benefit Cost as a Percent of SS Earnings* 0.27% 0.14% 0.01% 0.42%
Benefit Cost as a Percent of Total
Earnings* 0.23% 0.12% 0.01% 0.35%
Other Employers of DC Residents
Own
Health
Maternity
& Bonding
Family
Care All Leaves
Total Leaves 7,552 1,903 4,540 13,995
Total Leaves Lasting One Week or More 5,400 1,326 1,968 8,695
Number Receiving Program Benefits 2,311 776 148 3,235
Mean Duration of Benefit Receipt (Days) 22.8 29.7 11.1 24.0
Total Annual Cost (millions)
Program Benefits $17.0 $7.8 $0.7 $25.5
Employer Wage Benefits $12.6 $2.7 $4.2 $19.5
Employee Uncompensated Time $60.5 $15.0 $12.2 $87.7
Total $90.2 $25.5 $17.1 $132.8
Benefit Cost as a Percent of UI Earnings* 2.19% 1.01% 0.09% 3.29%
Benefit Cost as a Percent of SS Earnings* 0.26% 0.12% 0.01% 0.39%
Benefit Cost as a Percent of Total
Earnings* 0.22% 0.10% 0.01% 0.33% Source: IWPR estimates for private employers in DC based on IWPR/LRC Family and Medical Leave Simulation
Model. Fully paid leave for up to 8 weeks for own health conditions, family care needs, or new child bonding.
Benefit eligibility determined by Federal FMLA. * Benefit costs as a percent of taxable payroll include 5
percent of estimated benefits for administrative costs.
Table 7 models a proposal for providing full wage replacement for all eligible leave taken under
the Federal FMLA, up to 12 weeks annually (Model 3). Full wage benefits were specified rather than
partial, such as two-thirds under the Federal FAMILY Act, under the assumption that benefits paid for

14
family leave might be reportable for tax purposes as they are in California, New Jersey, and Rhode Island.
(Benefits paid under the states’ disability programs may not be considered taxable under some
circumstances.) The cost for family and medical leave benefits paid to DC private workers for 12 weeks
of leave under Model 3 ($114.0 million) are $20.4 million more than for 8 weeks of leave under Model 2
Table 7: Number of Leaves and Total Costs by Type of Leave for Up to 12 Weeks of Fully Paid
Family and Medical Leave for DC Private Employers and Other Employers of DC Residents
(Model 3).
DC Private Employers
Own
Health
Maternity
& Bonding
Family
Care All Leaves
Total Leaves 37,709 13,615 22,475 73,798
Total Leaves Lasting One Week or More 26,104 9,861 9,844 45,809
Number Receiving Program Benefits 9,708 4,568 702 14,979
Mean Duration of Benefit Receipt (Days) 27.4 36.2 15.5 29.5
Total Annual Cost (millions)
Program Benefits $69.5 $41.6 $2.9 $114.0
Employer Wage Benefits $51.6 $17.1 $18.5 $87.2
Employee Uncompensated Time $230.3 $83.3 $56.3 $369.9
Total $351.3 $142.0 $77.8 $571.1
Benefit Cost as a Percent of UI Earnings* 2.18% 1.31% 0.09% 3.59%
Benefit Cost as a Percent of SS Earnings* 0.31% 0.19% 0.01% 0.51%
Benefit Cost as a Percent of Total
Earnings* 0.26% 0.16% 0.01% 0.43%
Other Employers of DC Residents
Own
Health
Maternity
& Bonding
Family
Care All Leaves
Total Leaves 7,743 1,931 4,486 14,161
Total Leaves Lasting One Week or More 5,472 1,346 1,955 8,772
Number Receiving Program Benefits 2,248 801 161 3,210
Mean Duration of Benefit Receipt (Days) 27.2 37.7 16.1 29.2
Total Annual Cost (millions)
Program Benefits $19.2 $9.4 $1.0 $29.6
Employer Wage Benefits $13.0 $2.8 $5.5 $21.3
Employee Uncompensated Time $56.5 $14.6 $14.0 $85.1
Total $88.7 $26.7 $20.4 $135.9
Benefit Cost as a Percent of UI Earnings* 2.48% 1.21% 0.12% 3.81%
Benefit Cost as a Percent of SS Earnings* 0.30% 0.14% 0.01% 0.46%
Benefit Cost as a Percent of Total
Earnings* 0.25% 0.12% 0.01% 0.39% Source: IWPR estimates for private employers in DC based on IWPR/LRC Family and Medical Leave Simulation
Model. Full wage replacement (100 percent) for up to 12 weeks of family and medical leave. Benefit eligibility
determined by Federal FMLA. * Benefit costs as a percent of taxable payroll include 5 percent of estimated
benefits for administrative costs.

15
($93.6 million). Under this proposal, benefits would account for about 20 percent of the total value of
leaves taken. Benefits paid would require revenues of 3.6 to 3.8 percent of UI taxable earnings, 0.5
percent of Social Security taxable earnings, and 0.4 percent of total earnings for covered workers.
Table 8: Number of Leaves and Total Costs by Type of Leave for Up to 16 Weeks of Fully Paid
Family and Medical Leave for DC Private Employers and Other Employers of DC Residents
(Model 4). Eligibility based on Federal FMLA.
DC Private Employers
Own
Health
Maternity
& Bonding
Family
Care All Leaves
Total Leaves 37,254 13,487 23,202 73,943
Total Leaves Lasting One Week or More 26,175 9,757 9,946 45,878
Number Receiving Program Benefits 9,696 4,275 768 14,739
Mean Duration of Benefit Receipt (Days) 30.8 40.9 13.6 32.8
Total Annual Cost (millions)
Program Benefits $79.6 $41.5 $2.9 $124.0
Employer Wage Benefits $48.9 $16.6 $19.0 $84.5
Employee Uncompensated Time $211.9 $75.0 $55.9 $342.7
Total $340.4 $133.0 $77.9 $551.3
Benefit Cost as a Percent of UI Earnings* 2.50% 1.30% 0.09% 3.90%
Benefit Cost as a Percent of SS Earnings* 0.36% 0.19% 0.01% 0.55%
Benefit Cost as a Percent of Total
Earnings* 0.30% 0.16% 0.01% 0.47%
Other Employers of DC Residents
Own
Health
Maternity
& Bonding
Family
Care All Leaves
Total Leaves 7,457 2,044 4,571 14,072
Total Leaves Lasting One Week or More 5,272 1,421 1,941 8,634
Number Receiving Program Benefits 2,231 788 176 3,195
Mean Duration of Benefit Receipt (Days) 31.4 40.0 15.4 32.7
Total Annual Cost (millions)
Program Benefits $23.6 $11.0 $1.1 $35.7
Employer Wage Benefits $11.8 $2.9 $4.8 $19.6
Employee Uncompensated Time $52.1 $13.8 $14.4 $80.4
Total $87.6 $27.8 $20.3 $135.6
Benefit Cost as a Percent of UI Earnings* 3.04% 1.42% 0.14% 4.60%
Benefit Cost as a Percent of SS Earnings* 0.36% 0.17% 0.02% 0.55%
Benefit Cost as a Percent of Total
Earnings* 0.31% 0.14% 0.01% 0.47% Source: IWPR estimates for private employers in DC based on IWPR/LRC Family and Medical Leave Simulation
Model. Full wage replacement (100 percent) for up to 16 weeks of family and medical leave. Benefit eligibility
determined by Federal FMLA. * Benefit costs as a percent of taxable payroll include 5 percent of estimated
benefits for administrative costs.

16
Table 8 models a proposal for providing full wage replacement for all eligible leave taken under
the Federal FMLA, up to 16 weeks annually (Model 4). Full wage benefits were specified as in Model 3.
The cost for family and medical leave benefits paid to DC private workers for 16 weeks of leave under
Model 4 ($124.0 million) are $30.4 million more than for 8 weeks of leave under Model 2 ($93.6 million).
Under this proposal, benefits would account for about 23 percent of the total value of leaves taken.
Benefits paid to covered workers would require revenues of 3.9 to 4.6 percent of UI taxable earnings,
0.55 percent of Social Security taxable earnings, and 0.47 percent of total earnings.
Table 9 models a proposal for providing full wage replacement for all eligible leave taken under
the DC FMLA, up to 16 weeks annually (Model 5). While Federal FMLA does not cover about 40
percent of workers (Klerman et al. 2012), based on the distribution of DC’s workforce by firm size in the
QCEW, nearly half of workers excluded workers under Federal FMLA would be covered under DC’s
FMLA. Full wage benefits for up to 16 weeks were specified as in Model 4. Compared with Model 4,
more than 4,000 additional leaves would be eligible and take-up program benefits (18,901 v. 14,739). The
cost for family and medical leave benefits paid to DC private workers for 16 weeks of leave under Model
5 ($150.9 million) are $26.9 million more than for 16 weeks of leave under Model 4 ($124.0 million).
Under this proposal, benefits would account for about 27 percent of the total value of leaves taken.
Benefits paid would require revenues of 4.3 to 4.5 percent of UI taxable earnings, 0.56 to 0.63 percent of
Social Security taxable earnings, and 0.47 to 0.53 percent of total earnings reported by workers covered
by DC FMLA.

17
Table 9: Number of Leaves and Total Costs by Type of Leave for Up to 16 Weeks of Fully Paid
Family and Medical Leave for DC Private Employers and Other Employers of DC Residents
(Model 5). Eligibility based on DC FMLA.
DC Private Employers
Own
Health
Maternity
& Bonding
Family
Care All Leaves
Total Leaves 38,428 13,900 22,949 75,277
Total Leaves Lasting One Week or More 26,863 9,998 9,699 46,560
Number Receiving Program Benefits 11,867 6,026 1,008 18,901
Mean Duration of Benefit Receipt (Days) 30.9 40.6 16.5 33.2
Total Annual Cost (millions)
Program Benefits $92.8 $54.0 $4.1 $150.9
Employer Wage Benefits $48.2 $15.1 $16.9 $80.1
Employee Uncompensated Time $211.4 $67.4 $52.0 $330.8
Total $352.4 $136.5 $73.0 $561.9
Benefit Cost as a Percent of UI Earnings* 2.63% 1.53% 0.12% 4.27%
Benefit Cost as a Percent of SS Earnings* 0.39% 0.23% 0.02% 0.63%
Benefit Cost as a Percent of Total
Earnings* 0.33% 0.19% 0.01% 0.53%
Other Employers of DC Residents
Own
Health
Maternity
& Bonding
Family
Care All Leaves
Total Leaves 7,764 1,930 4,692 14,386
Total Leaves Lasting One Week or More 5,340 1,385 1,928 8,653
Number Receiving Program Benefits 2,447 963 224 3,634
Mean Duration of Benefit Receipt (Days) 29.7 42.4 13.7 32.1
Total Annual Cost (millions)
Program Benefits $23.9 $12.5 $1.1 $37.5
Employer Wage Benefits $13.0 $2.3 $4.4 $19.7
Employee Uncompensated Time $56.0 $12.0 $12.3 $80.3
Total $93.0 $26.8 $17.7 $137.5
Benefit Cost as a Percent of UI Earnings* 2.89% 1.51% 0.13% 4.53%
Benefit Cost as a Percent of SS Earnings* 0.36% 0.19% 0.02% 0.56%
Benefit Cost as a Percent of Total
Earnings* 0.30% 0.16% 0.01% 0.47% Source: IWPR estimates for private employers in DC based on IWPR/LRC Family and Medical Leave Simulation
Model. Full wage replacement (100 percent) for up to 16 weeks of family and medical leave. Benefit eligibility
determined by DC FMLA. * Benefit costs as a percent of taxable payroll include 5 percent of estimated
benefits for administrative costs.

18
When estimating leave behaviors and characteristics using the IWPR/LRC simulation model
there are several decision points during the estimation of leave taking behaviors, such as taking a leave
when experiencing a qualifying event, where a statistical model for the probability of deciding ―yes‖ is
applied using a function of the person’s demographic characteristics. The estimated probability is
compared to a randomly selected number between zero and one. If the estimated probability is greater
than the random number, the decision is ―yes, leave is taken‖ and the model continues simulating the
leave’s characteristics, such as duration and costs. This is the essence of simulation, but subsequent runs
using similar policy design inputs can vary slightly. For example, comparing leaves for ―Own Health‖
Tables 4 and 5, under both current policies and 8 weeks paid leave for family reasons there is no leave
program for workers’ own health needs, but the estimation results vary a small amount.
Other differences across models are more systematic and stem from the underlying logic of the
model. For example, the model specifications anticipate that more leaves will be taken when there is wage
replacement available. However, the characteristics of the additional leaves is less clear. On the one hand,
offering a new paid leave benefit might lead to a longer leave duration if some portion of the total time
taken is paid through a newly available benefit program. On the other hand, the additional leaves could be
shorter, on average, and reduce the total cost of benefit. For example, Baum and Ruhm (2014) find that
California’s paid family leave program increased leave-taking for bonding with a new child, but mothers
use two to three additional weeks of leave and fathers just under one additional week. If more new fathers
take bonding leaves following the birth of a child relative to new mothers, the total cost of leaves could
decrease.
While the total value of leaves taken by DC private workers is over $535 million annually, it is
important to look at how that figure is distributed. First, the majority (77 percent) of leave costs are borne
by workers currently; under the four alternative leave policy scenarios modeled that include both family
and medical leave, the share of leave costs that consists of uncompensated wages declines in each of the
programs and is below 60 percent in the most generous (Model 5). Second, even in the current policy
environment, DC’s private employers are spending more than $123 million compensating workers taking
family and medical leaves. The amount being paid directly by employers as wages also declines across
the policy proposals modeled. Third, the range of leave costs covered by the proposed benefits ranges
from 6 percent of total leave costs to around 55 percent of total leave costs. Compared with the estimated
value of uncompensated leave time taken under current law, under the alternative leave policy scenarios
uncompensated leave costs are reduced between 5 percent and 20 percent for private DC employees.
Private DC employees bear the lion’s share of total leave costs under all scenarios.
START-UP AND ADMINISTRATIVE COSTS
So far the costs estimated have focused on the costs of providing wage replacement for workers
on leave under alternative policy scenarios. These costs could be distributed between employers,
employees, and other possible groups with different implications for total costs.
Under the logic of the first alternative policy scenario (Model 1), based on the current policy for
DC government workers, the eight weeks of leave provided would be paid for by employers as regular
wages. In terms of minimizing start-up costs and ongoing administration, this would be the least

19
expensive route to program administration, but is likely to face political opposition by employers and
their representatives.
In the three states that have added paid family leave to existing temporary disability insurance
(TDI) systems (California, New Jersey, and Rhode Island), the costs for the new leave are paid for by
workers through a social insurance system with a payroll tax. (In California and Rhode Island, TDI is also
paid for by the workers; in New Jersey employers contribute to TDI.) Based on the results for DC, all of
the alternative policies examined would cost less than one percent of payrolls based on either all earnings
or earnings up to the Social Security maximum ($118,500). Taxing higher earners at the same rate as
lower earners would result in a more progressive program.
For governments like DC’s – without a TDI system to expand for covering family leaves – start
up and administration need to be built from scratch. Several states without existing TDI systems have
recently had proposals for paid family and medical leave insurance. Recent fiscal notes for new programs
have recently been issued in Washington and Connecticut.
During an approximately two-year start-up phase (2016-17), Washington Employment Security
Department (WESD) estimates that system configuration and procedure planning would cost $13.2
million including equipment procurement and 56,000 hours of software development. Once the program
is fully functional, they estimate $61 million for administration for the first four years or approximately
$15.3 million per year. Washington State plans to pay for these costs by collecting premiums by a payroll
tax that phases in at 0.2 percent of payroll between July 2016 and December 2016 and then increases to
0.4 percent of payroll in January 2018 when benefits are scheduled to begin to be paid. The payroll tax is
paid by the employer, but the current Washington state bills (HB 1273 and SB 5459) permit the employer
to deduct half of the required amount from the employee’s pay. Looking at the monthly average earnings
generated by DC’s workforce, in total or up to the Social Security maximum, start-up costs at the level
estimated by Washington state could paid for in 4 months at 0.2 percent of payroll and 2 months at 0.4
percent.
Connecticut estimates lower start-up costs in the first year, $6 million, and higher annualized
administrative costs starting in the second, $16.9 million. Again, Connecticut’s workforce is 2.2 times
larger than DC’s suggesting a pro-rated administrative cost for DC of $7.7 million. Connecticut’s fiscal
note is much less detailed than Washington’s. Expenses counted in year one in Washington may have
been included in subsequent years in Connecticut.
To estimate the administrative costs as a percent of total benefits, estimates of the cost for
providing the proposed leave benefits were estimated using the simulation model for the Washington state
bills (HB 1273 and SB 5459). Dividing the WESD estimated annual average administrative costs by the
model-based estimate for total cost of leave benefits suggests that 4.6 percent of benefits would be
required to administer their proposed family and medical leave insurance program. For the DC estimates
calculated as a share of taxable earnings under three bases, administrative costs were rounded up to 5
percent.

20
PROJECTED GROWTH
Data from the early experiences of California and New Jersey state plans are used to estimate
program growth during the first five years following family leave insurance implementation. The family
leave insurance growth is used in both states to try to capture the early growth as the program became
more familiar to employers and workers. Both states began providing family leave insurance as an
expansion of disability insurance that had been operating for decades. The growth in both claims and cost
of benefits were applied to the DC alternative policy model results. In general, New Jersey’s program
seems to have grown more slowly than California’s, so the experience of these two states suggests a range
of trajectories.
Figure 1: Estimated Growth in Number of Family and Medical Leave Claims for DC Private
Employers Based on New Jersey and California Family Leave Programs
Figure 2: Estimated Growth in Total Cost of Family and Medical Leave Benefits for DC Private
Employers Based on New Jersey and California Family Leave Programs

21
Figure 1 shows the growth in total number of claims DC might expect under growth like New
Jersey, on the left, and California, on the right. New Jersey’s Family Leave Insurance program began
paying benefits in July 2009, immediately following the Great Recession. The growth based on full
calendar years 2010-2014 are used for measuring an increase in claims in a fairly steady, linear path
resulting in a 16 percent increase over 5 years. The data from California’s Paid Family Leave program
statistics are reported for the state’s fiscal year that runs from July 1 to June 30 and 2006-07 to 2010-11
were used. This period includes the great recession and recovery and results in a 20 percent increase in
claims across the period.
Figure 2 shows the increase in program costs for providing family and medical leave benefits in
DC based on previous state experiences. Year-over-year growth rates were estimated using the cost of
benefit claims adjusted to constant 2014 dollars using the CPI-U-RS. Costs grow more slowly in New
Jersey, 7.2 percent over 5 years, compared with California, 19 percent over the period. Under either
scenario, benefits and administrative costs (estimated as 5 percent of total benefits) remain under one
percent of taxable payroll up to the Social Security maximum for all 5 alternative policy models.
DISTRIBUTIONAL ANALYSIS
Table 10 describes distributional impacts of the five alternative policy scenarios on DC private
employees measured according as the estimated share of workers that receive no compensation while
taking family and medical leaves. The model results suggest that having a policy that covers only family
reasons (second column) might shift employers’ benefit offerings and workers’ leave taking behaviors in
ways that increase the incidence of uncompensated leaves. Comparing the current policy environment
(first column) to 16 weeks of fully paid DC FMLA proposal (last column) shows that vulnerable workers
are expected to experience the largest drops in uncompensated leaves; for example, the incidence of
uncompensated leave declines by 5.5 percentage points for workers with a high school degree or less, 5.1
percentage points for part-time workers, and 7.1 percentage points for workers in families with incomes
below $25,000. Comparing the similar benefit structures included models 4 and 5 suggests that almost
half of these gains result from the greater access to program benefits workers would have under DC’s
FMLA than under Federal FMLA. However, even the employer size and work hours requirements in
DC’s FMLA will leave out many workers.

22
Table 10: Percent of Leaves with No Compensation During Family and Medical Leaves for
Private Workers in DC
DC Private
Employers
Baseline:
Current
Policy
Model 1: 8
Weeks
Family, Full
Pay, Federal
FMLA
Eligibility
Model 2: 8
Weeks Family
and Medical,
Full Pay,
Federal
FMLA
Eligibility
Model 3: 12
Weeks, Full
Pay,
Federal
FMLA
Eligibility
Model 4: 16
Weeks, Full
Pay,
Federal
FMLA
Eligibility
Model 5: 16
Weeks, Full
Pay, DC
FMLA
Eligibility
Total 26.9% 28.7% 25.2% 26.0% 25.5% 24.4%
Gender
Men 22.6% 24.9% 21.8% 23.0% 22.4% 22.0%
Women 29.9% 31.3% 27.6% 28.1% 27.7% 26.0%
Race &
Ethnicity
White 21.1% 23.2% 20.5% 21.3% 20.9% 20.3%
Black 31.2% 32.9% 28.3% 29.4% 29.1% 26.9%
Hispanic 40.3% 40.2% 37.2% 37.9% 35.8% 34.5%
Other/Mixed 22.6% 25.8% 21.8% 21.8% 22.7% 22.6%
Age
Less than 35 34.2% 34.5% 31.7% 32.2% 31.9% 29.4%
35-44 23.0% 25.3% 21.6% 22.2% 21.9% 21.7%
45-54 21.6% 25.2% 20.5% 23.1% 21.7% 20.5%
55+ 26.7% 27.8% 24.8% 24.5% 24.9% 24.3%
Educational
Attainment
HS or Less 39.8% 41.3% 36.0% 37.6% 38.2% 34.3%
Some College or
Associates 33.8% 34.9% 30.9% 31.8% 30.9% 29.7%
Bachelors 21.0% 24.4% 20.0% 21.2% 20.5% 19.7%
Postgraduate 17.1% 18.6% 17.0% 17.2% 16.7% 16.8%
Work Schedule
Part-time 46.5% 45.0% 44.1% 44.4% 43.4% 41.4%
Full-time 23.3% 25.8% 21.9% 22.8% 22.3% 21.6%
Family Income
< $25K 54.4% 54.5% 49.4% 51.4% 52.1% 47.3%
$25K - 49.9K 35.9% 39.0% 33.9% 34.9% 33.5% 32.9%
$50K - 74.9 28.3% 29.6% 25.5% 27.5% 26.6% 26.1%
$75K - 99.9 23.8% 24.8% 21.6% 22.3% 22.4% 20.4%
$100K+ 16.5% 18.1% 16.3% 16.2% 16.1% 15.6%
Source: IWPR estimates for private employers in DC based on IWPR/LRC Family and Medical Leave Simulation
Model.
23
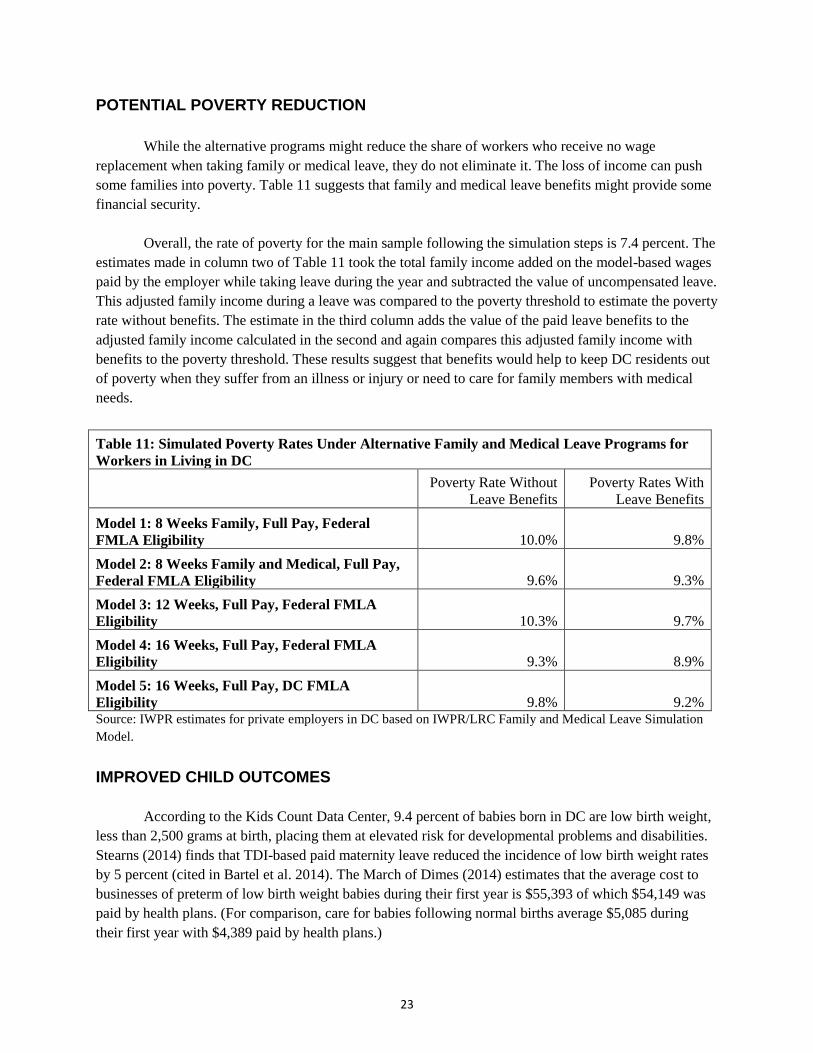
POTENTIAL POVERTY REDUCTION
While the alternative programs might reduce the share of workers who receive no wage
replacement when taking family or medical leave, they do not eliminate it. The loss of income can push
some families into poverty. Table 11 suggests that family and medical leave benefits might provide some
financial security.
Overall, the rate of poverty for the main sample following the simulation steps is 7.4 percent. The
estimates made in column two of Table 11 took the total family income added on the model-based wages
paid by the employer while taking leave during the year and subtracted the value of uncompensated leave.
This adjusted family income during a leave was compared to the poverty threshold to estimate the poverty
rate without benefits. The estimate in the third column adds the value of the paid leave benefits to the
adjusted family income calculated in the second and again compares this adjusted family income with
benefits to the poverty threshold. These results suggest that benefits would help to keep DC residents out
of poverty when they suffer from an illness or injury or need to care for family members with medical
needs.
Table 11: Simulated Poverty Rates Under Alternative Family and Medical Leave Programs for
Workers in Living in DC
Poverty Rate Without
Leave Benefits
Poverty Rates With
Leave Benefits
Model 1: 8 Weeks Family, Full Pay, Federal
FMLA Eligibility 10.0% 9.8%
Model 2: 8 Weeks Family and Medical, Full Pay,
Federal FMLA Eligibility 9.6% 9.3%
Model 3: 12 Weeks, Full Pay, Federal FMLA
Eligibility 10.3% 9.7%
Model 4: 16 Weeks, Full Pay, Federal FMLA
Eligibility 9.3% 8.9%
Model 5: 16 Weeks, Full Pay, DC FMLA
Eligibility 9.8% 9.2% Source: IWPR estimates for private employers in DC based on IWPR/LRC Family and Medical Leave Simulation
Model.
IMPROVED CHILD OUTCOMES
According to the Kids Count Data Center, 9.4 percent of babies born in DC are low birth weight,
less than 2,500 grams at birth, placing them at elevated risk for developmental problems and disabilities.
Stearns (2014) finds that TDI-based paid maternity leave reduced the incidence of low birth weight rates
by 5 percent (cited in Bartel et al. 2014). The March of Dimes (2014) estimates that the average cost to
businesses of preterm of low birth weight babies during their first year is $55,393 of which $54,149 was
paid by health plans. (For comparison, care for babies following normal births average $5,085 during
their first year with $4,389 paid by health plans.)

24
Table 12 shows the estimated costs that could be saved from reducing the incidence of low birth
weight babies in DC by providing paid leave for maternity disability and family bonding leave. Average
savings per low birthweight infant are estimated as the cost difference between a normal and low birth
weight baby for their first year of care. As the simulation output does not include information on
employer-provided health insurance that would be required to attribute savings to employers, the savings
are divided between insurers operating in DC, in general, and the remaining share paid by individuals.
Total savings range widely from $150,000 to $300,000. Most policy alternatives save about $180,000 per
year in health care costs for the first year of the child’s life. The expanded benefit coverage under DC’s
FMLA compared with the Federal FMLA greatly improves the savings on reduced low birth weight baby
care costs. The vast majority of these saving do go to DC insurers, but individuals are also benefited.
Table 12: Estimated Savings from Reducing Low-Weight Births By Implementing Paid
Maternity Leave
Total Insurers Individuals
Model 1: 8 Weeks Family, Full
Pay, Federal FMLA Eligibility $178,569 $176,624 $1,945
Model 2: 8 Weeks Family and
Medical, Full Pay, Federal
FMLA Eligibility $178,107 $176,167 $1,940
Model 3: 12 Weeks, Full Pay,
Federal FMLA Eligibility $179,693 $177,735 $1,957
Model 4: 16 Weeks, Full Pay,
Federal FMLA Eligibility $153,436 $151,765 $1,671
Model 5: 16 Weeks, Full Pay,
DC FMLA Eligibility $296,306 $293,078 $3,228 Source: IWPR estimates for private employers in DC based on IWPR/LRC Family and Medical Leave Simulation
Model.
SAVINGS FROM REDUCED PUBLIC ASSISTANCE
Houser and Vartanian (2012) used the National Longitudinal Study of Youth 1997 Cohort to
study leave taking. They estimate that, compared with not taking a leave following a child’s birth, taking
paid leave reduced the total amount of public assistance received in that year by more than $400 ($413 for
women and $421 for men) in their sample.
Table 13 estimates how much less public assistance might be accessed in DC following the
implementation of a paid family leave program. The estimates are based on leaves taken for new children
(maternity-related disability or bonding leaves) that were assigned model-based program benefits during
the simulation, but no wages were estimated to have been paid by the employer during the leave. That is,
the only wage replacement would be the program benefits.
The first set of columns are the savings for individuals up to age 30. This restriction is based on
the age of the NLSY-97 analyzed by Houser and Vartanian (2012). Savings that use the same estimates

25
level for all individuals taking new child leaves for descriptive purposes are shown under ―workers of all
ages. It is important to note that the cost savings estimates for ―Working for Private DC Employers‖ and
―DC Residents – All Employers‖ are not exclusive groups in this table. DC residents working for private
DC employers are in both columns, so they do not sum to total savings.
The savings from reduced public assistance are fairly similar in magnitude to the savings from
reduced low birth weight babies. If new parents over age 30 benefit at the same level as younger parents,
the amount of reduced use of public assistance would be nearly doubled.
Table 13: Estimated Savings from Reduced Public Assistance By Implementing Paid Family and
Medical Leave
Workers Aged 30 or Younger Workers of All Ages
Working for
Private DC
Employers
DC Residents
- All
Employers
Working for
Private DC
Employers
DC Residents
- All
Employers
Model 1: 8 Weeks Family,
Full Pay, Federal FMLA
Eligibility $170,821 $106,986 $308,877 $159,268
Model 2: 8 Weeks Family and
Medical, Full Pay, Federal
FMLA Eligibility $160,752 $82,365 $308,818 $141,275
Model 3: 12 Weeks, Full Pay,
Federal FMLA Eligibility $160,690 $95,272 $313,041 $157,661
Model 4: 16 Weeks, Full Pay,
Federal FMLA Eligibility $148,831 $81,418 $267,110 $134,750
Model 5: 16 Weeks, Full Pay,
DC FMLA Eligibility $257,956 $112,920 $492,074 $199,058 Source: IWPR estimates for private employers in DC based on IWPR/LRC Family and Medical Leave Simulation
Model.
SAVINGS TO EMPLOYERS FROM REDUCED TURNOVER
According to Boushey and Glynn (2012a) employee turnover is expensive for employers. Across
a large number of case studies, they estimate that replacing an employee costs about 21 percent of their
annual salary, on average. Having paid leave reduces voluntary job mobility by an average of 5 percent;
the effect varies by sex and marital status from three to six percentage points (Cooper and Monheit 1993).
Workers who experience a health care crisis are also more likely to return to their employer if they have a
paid leave policy—more than twice as likely, in the case of women with heart disease (Earle, Ayanian,
and Heymann 2006).
Table 14 uses the simulation model output to calculate savings from paid leave under the five
alternative policy scenarios for private DC employers, private businesses outside of DC employing DC
residents, and DC residents working for the Federal government. The costs of turnover are estimated as
21 percent of annual earnings for 5 percent of leave takers who would receive a program benefit, but not

26
wages from their employer, while on leave. Under Models 2-5, DC employers stand to reduce their
turnover costs by $1.6 million to $2.3 million dollars each year. Taxpayers would save $250,000 to
$272,000 from reduced turnover in Federal employment for federally employed DC residents receiving
benefits were they to be covered and participate in the program.
Table 14: Estimated Savings to Businesses from Turnover Across Alternative Paid Family and
Medical Leave Programs
Private DC
Employers
DC Residents --
Private
Employers
DC Residents --
Federal
Employees
Model 1: 8 Weeks Family, Full Pay,
Federal FMLA Eligibility $543,242 $47,922 $76,466
Model 2: 8 Weeks Family and Medical,
Full Pay, Federal FMLA Eligibility $1,739,963 $172,385 $255,339
Model 3: 12 Weeks, Full Pay, Federal
FMLA Eligibility $1,620,708 $176,990 $203,927
Model 4: 16 Weeks, Full Pay, Federal
FMLA Eligibility $1,580,581 $183,740 $272,369
Model 5: 16 Weeks, Full Pay, DC FMLA
Eligibility $2,295,977 $257,334 $269,575 Source: IWPR estimates for private employers in DC based on IWPR/LRC Family and Medical Leave Simulation
Model.
CONCLUSION
Based on the experiences of states that provide paid family and medical leave and the simulation
model results reviewed, DC could set up and administer any of the programs examined for less than one
percent of payroll. While the costs would be expected to increase, especially in the early year as
awareness grows, even at the end of the first five year window, the same low cost would be required to
provide wage replacement to workers on leave and support the centralized management of the program.
The program’s costs could be borne by employers, workers, or shared. Based on the model results,
workers are bearing most of the costs of leaves taken for their own health or the needs of their families.
However, employers do provide some workers paid leave. By risk sharing and standardizing the criteria
for paid leave eligibility, providing paid leave benefits would appear to play a role in evening the playing
field and pushing back against rising inequality among groups of workers.

27
REFERENCES
Appelbaum, Eileen and Ruth Milkman. 2011. Leaves that Pay. Washington, DC: Center for Economic
and Policy Research.
Bartel, Ann, Charles Baum, Maya Rossin-Slater, Christopher Ruhm, and Jane Waldfogel. 2014.
California’s Paid Family Leave Law: Lessons from the First Decade. Unpublished manuscript.
Baum, Charles L. and Christopher J. Ruhm. 2014. ―The Effects of Paid Family Leave in California on
Labor Market Outcomes.‖ NBER Working Paper 19741. Cambridge, MA: National Bureau of
Economic Research.
Boushey, Heather and Sarah Jane Glynn. 2012a. ―There Are Significant Business Costs to Replacing
Employees.‖ Washington, DC: Center for American Progress.
Boushey, Heather and Sarah Jane Glynn. 2012b. ―The Effects of Paid Family and Medical Leave on
Employment Stability and Economic Security.‖ Washington, DC: Center for American Progress.
Cooper, Philip F., and Alan C. Monheit. 1993. ―Does Employment-Related Health Insurance Inhibit Job
Mobility?‖ Inquiry 30 (Winter): 400-416.
Chatterji, Pinka, Sara Markowitz, and Jeanne Brooks-Gunn. "Effects of Early Maternal Employment on
Maternal Health and Well-being." Journal of Population Economics, 2013, 285-301.
Chatterji, P., and S. Markowitz. "Family Leave after Childbirth and the Mental Health of New Mothers."
J Ment Health Policy Econ, 2012.
Earle, Alison, John Z. Ayanian, and Jody Heymann. 2006. ―Work Resumption after Newly Diagnosed
Coronary Heart Disease: Findings on the Importance of Paid Leave.‖ Journal of Women’s
Health 15(4): 430-441.
Earle, Alison, and Jody Heymann. 2011. "Protecting the Health of Employees Caring for Family
Members with Special Health Care Needs." Social Science & Medicine: 68-78.
Gomby, Deanna, and Dow-Jane Pei. "Newborn Family Leave: Effects on Children, Parents, and
Business." The David and Lucile Packard Foundation. 2009. Accessed March 25, 2015.
Guendelman, S., J. L. Kosa, M. Pearl, S. Graham, J. Goodman, and M. Kharrazi. "Juggling Work and
Breastfeeding: Effects of Maternity Leave and Occupational Characteristics." Pediatrics, 2009,
E38-46.
Hamman, Mary Kathryn. "Making Time for Well-Baby Care: The Role of Maternal Employment."
Maternal and Child Health Journal, 2011, 1029-036.
Houser, Linda, and Thomas Vartanian. "Pay Matters: The Positive Economic Impacts of Paid Family
Leave for Families, Businesses, and the Public." Center for Women and Work at Rutgers
University, 2012.
Klerman, Jacob, Kelly Daley, and Alyssa Pozniak. 2012. Family and Medical Leave in 2012: Technical
Report. Cambridge, MA: Abt Associate, Inc.
Lerner, Sharon and Eileen Appelbaum. 2014. ―Business As Usual: New Jersey Employers’ Experiences
with Family Leave Insurance.‖ Washington, DC: Center for Economic and Policy Research.

28
March of Dimes. 2014. ―Premature Babies Cost Employers $12.7 Billion Annually.‖ Press release.
The MetLife Mature Market Institute. 2011. ―Caregiving Costs to Working Caregivers: Double Jeopardy
for Baby Boomers Caring for Their Parents.‖ New York, NY: MetLife.
Milkman, Ruth and Eileen Appelbaum. 2013. Unfinished Business: Paid Family Leave in California and
the Future of U.S. Work-Family Policy. Ithaca, United States: ILR Press.
Ogbuanu, C., S. Glover, J. Liu, and J. Hussey. "The Effect of Maternity Leave Length and Time of Return
to Work on Breastfeeding." Pediatrics, 2011, Peds.2010-0459.
Pichler, Stefan and Nicolas R. Ziebarth. 2015. ―The Pros and Cons of Sick Pay Schemes: Testing for
Contagious Presenteeism and Shirking Behavior.‖ German Institute for Economic Research
DIW Berlin Discussion Paper No. 1509.
Rossin-Slater, Maya, Christopher J. Ruhm, and Jane Waldfogel. "The Effects of California's Paid Family
Leave Program on Mothers’ Leave-Taking and Subsequent Labor Market Outcomes." Journal of
Policy Analysis and Management, 2011, 224-45.