Final Report on CCT-K7 Key comparison of water triple...
98
1/98 Final Report on CCT-K7 Key comparison of water triple point cells 4 January 2006 M. Stock 1 , S. Solve 1 , D. del Campo 2 , V. Chimenti 2 , E. Méndez-Lango 3 , H. Liedberg 4 , P.P.M. Steur 5 , P. Marcarino 5 , R. Dematteis 5 , E. Filipe 6 , I. Lobo 6 , K.H. Kang 7 , K.S. Gam 7 , Y.- G. Kim 7 , E. Renaot 8 , G. Bonnier 8 , M. Valin 8 , R. White 9 , T.D. Dransfield 9 , Y. Duan 10 , Y. Xiaoke 10 , G. Strouse 11 , M. Ballico 12 , D. Sukkar 12 , M. Arai 13 , A. Mans 14 , M. de Groot 14 , O. Kerkhof 14 , R. Rusby 15 , J. Gray 15 , D. Head 15 , K. Hill 16 , E. Tegeler 17 , U. Noatsch 17 , S. Ďuriš 18 , H.Y. Kho 19 , S. Ugur 20 , A. Pokhodun 21 , S.F. Gerasimov 21 1 Bureau International des Poids et Mesures, BIPM 2 Centro Español de Metrología, CEM, Spain 3 Centro Nacional de Metrología, CENAM, Mexico 4 National Metrology Laboratory, CSIR-NML, South Africa 5 Instituto Nazionale de Ricerca Metrologica, INRIM, Italy 6 Instituto Português da Qualidade, IPQ, Portugal 7 Korea Research Institute of Standards and Science, KRISS, Rep. of Korea 8 Laboratoire National de Métrologie et d’Essais, LNE, France 9 Measurement Standards Laboratory of New Zealand, MSL, New Zealand 10 National Institute of Metrology, NIM, China 11 National Institute of Standards and Technology, NIST, USA 12 National Measurement Laboratory, NMIA, Australia 13 National Metrology Institute of Japan, NMIJ/AIST, Japan 14 Nederlands Meetinstituut - Van Swinden Laboratorium, NMi-VSL, Netherlands 15 National Physical Laboratory, NPL, United Kingdom 16 National Research Council of Canada, NRC, Canada 17 Physikalisch-Technische Bundesanstalt, PTB, Germany 18 Slovak Institute of Metrology, SMU, Slovakia 19 National Metrology Centre, SPRING, Singapore 20 Ulusal Metroloji Enstitüsü, UME, Turkey 21 D.I. Mendeleev Institute for Metrology, VNIIM, Russia
-
Upload
truongxuyen -
Category
Documents
-
view
222 -
download
0
Transcript of Final Report on CCT-K7 Key comparison of water triple...
1/98
Final Report on CCT-K7
Key comparison of water triple point cells
4 January 2006 M. Stock1, S. Solve1, D. del Campo2, V. Chimenti2, E. Méndez-Lango3, H. Liedberg4,
P.P.M. Steur5, P. Marcarino5, R. Dematteis5, E. Filipe6, I. Lobo6, K.H. Kang7, K.S. Gam7, Y.- G. Kim7, E. Renaot8, G. Bonnier8, M. Valin8, R. White9, T.D. Dransfield9, Y. Duan10, Y. Xiaoke10, G. Strouse11, M. Ballico12, D. Sukkar12, M. Arai13, A. Mans14, M. de Groot14, O. Kerkhof14, R. Rusby15, J. Gray15, D. Head15, K. Hill16, E. Tegeler17, U. Noatsch17, S. Ďuriš 18, H.Y. Kho19, S. Ugur20, A. Pokhodun21, S.F. Gerasimov21
1 Bureau International des Poids et Mesures, BIPM 2 Centro Español de Metrología, CEM, Spain
3 Centro Nacional de Metrología, CENAM, Mexico 4 National Metrology Laboratory, CSIR-NML, South Africa 5 Instituto Nazionale de Ricerca Metrologica, INRIM, Italy 6 Instituto Português da Qualidade, IPQ, Portugal 7 Korea Research Institute of Standards and Science, KRISS, Rep. of Korea 8 Laboratoire National de Métrologie et d’Essais, LNE, France 9 Measurement Standards Laboratory of New Zealand, MSL, New Zealand 10 National Institute of Metrology, NIM, China 11 National Institute of Standards and Technology, NIST, USA 12 National Measurement Laboratory, NMIA, Australia 13 National Metrology Institute of Japan, NMIJ/AIST, Japan 14 Nederlands Meetinstituut - Van Swinden Laboratorium, NMi-VSL, Netherlands 15 National Physical Laboratory, NPL, United Kingdom 16 National Research Council of Canada, NRC, Canada 17 Physikalisch-Technische Bundesanstalt, PTB, Germany 18 Slovak Institute of Metrology, SMU, Slovakia 19 National Metrology Centre, SPRING, Singapore 20 Ulusal Metroloji Enstitüsü, UME, Turkey 21 D.I. Mendeleev Institute for Metrology, VNIIM, Russia
2/98
Table of Contents
1 INTRODUCTION ..................................................................................................... 4
2 ORGANIZATION OF THE COMPARISON ............................................................. 5
2.1 Participants...................................................................................................................................................... 5
2.2 Objectives......................................................................................................................................................... 5
2.3 Method of the comparison.............................................................................................................................. 6
2.4 Transfer cells ................................................................................................................................................... 6
3 THE THERMOMETRY LABORATORY AT THE BIPM .......................................... 7
3.1 Experimental setup ......................................................................................................................................... 7
3.2 Performance evaluation.................................................................................................................................. 7 3.2.1 Temperature stability of the TPW maintenance baths................................................................................ 9 3.2.2 Temperature stability of the oil bath .......................................................................................................... 9 3.2.3 Accuracy and linearity of the F18 bridge ................................................................................................... 9 3.2.4 Accuracy of the self-heating correction ................................................................................................... 10 3.2.5 Stray thermal exchanges .......................................................................................................................... 11 3.2.6 Humidity in SPRT.................................................................................................................................... 11 3.2.7 Selection of the BIPM reference cells...................................................................................................... 11
3.3 Uncertainty budget for the comparison of TPW cells................................................................................ 12
4 COMPARISON OF THE TRANSFER CELLS AT THE BIPM............................... 15
4.1 Measurement procedure............................................................................................................................... 15 4.1.1 Groups of cells ......................................................................................................................................... 15 4.1.2 Measurement procedure ........................................................................................................................... 16 4.1.3 Conversion of bridge ratios to temperature differences ........................................................................... 18
4.2 Results of the BIPM measurements............................................................................................................. 20
4.3 Least-squares adjustment............................................................................................................................. 31
4.4 Temperature differences between transfer cells......................................................................................... 34
5 CALIBRATION OF THE TRANSFER CELLS BY THE PARTICIPANTS ............. 42
5.1 Measurement results..................................................................................................................................... 42 5.1.1 BIPM........................................................................................................................................................ 42 5.1.2 BNM-INM ............................................................................................................................................... 43 5.1.3 CEM......................................................................................................................................................... 43 5.1.4 CENAM ................................................................................................................................................... 45 5.1.5 CSIR-NML............................................................................................................................................... 46 5.1.6 CSIRO...................................................................................................................................................... 46 5.1.7 IMGC ....................................................................................................................................................... 47
3/98
5.1.8 IPQ ........................................................................................................................................................... 48 5.1.9 KRISS ...................................................................................................................................................... 49 5.1.10 MSL ....................................................................................................................................................... 49 5.1.11 NIM........................................................................................................................................................ 50 5.1.12 NIST....................................................................................................................................................... 51 5.1.13 NMIJ ...................................................................................................................................................... 51 5.1.14 NMi-VSL ............................................................................................................................................... 52 5.1.15 NPL........................................................................................................................................................ 52 5.1.16 NRC ....................................................................................................................................................... 53 5.1.17 PTB ........................................................................................................................................................ 54 5.1.18 SMU....................................................................................................................................................... 54 5.1.19 SPRING ................................................................................................................................................. 55 5.1.20 UME....................................................................................................................................................... 55 5.1.21 VNIIM.................................................................................................................................................... 56
5.2 Uncertainty budgets ...................................................................................................................................... 57
6 COMPARISON OF THE NATIONAL REFERENCES........................................... 64
6.1 Differences between the national references and the BIPM reference ..................................................... 64
6.2 Key comparison reference value (KCRV)................................................................................................... 66
6.3 Results based on the ocean water definition of the TPW........................................................................... 70
7 SUMMARY AND CONCLUSIONS........................................................................ 72
8 ACKNOWLEDGEMENTS ..................................................................................... 73
9 REFERENCES ...................................................................................................... 74
APPENDIX 1 - TECHNICAL PROTOCOL ............................................................... 75
APPENDIX 2 - IMMERSION DEPTH IN THE PRESENCE OF AN ICE MANTLE ... 89
APPENDIX 3 - IMMERSION PROFILES.................................................................. 92
APPENDIX 4 - DEGREES OF EQUIVALENCE....................................................... 96
4/98
1 Introduction The triple point of water (TPW) has been selected to define the kelvin, the unit of thermodynamic temperature, in the International System of Units (SI) by the definition TTPW ≡ 273.16 K [1]. Furthermore, it is the most important fixed point of the International Temperature Scale of 1990 (ITS-90, [2]) since it is fundamental for measurements with standard platinum resistance thermometers (SPRTs) between 13.8033 K and 1234.93 K. In this range, measurements are performed in terms of the resistance ratio W(T90) = R(T90) / R(TTPW), where T90 is a temperature on the ITS-90 scale. Therefore, any uncertainty in the realization of the TPW is directly propagated over the whole SPRT temperature range. A previous international comparison of TPW cells of twelve laboratories was carried out by the BIPM from 1994 to 1996 [3]. In most cases, the temperatures of the cells agreed to within ± 0.1 mK. In some cases much larger differences, up to 0.53 mK, were observed. The standard uncertainty of the temperature differences was estimated as 0.04 mK and thus was comparable to the temperature differences. The spread of 0.1 mK at the water triple point corresponds to a relative uncertainty of 4 x 10⁻⁷ for the realization of the kelvin. Many of the cells used for the previous comparison no longer exist, others might have changed with time. The uncertainty of this comparison today appears to be too large. The review of the calibration and measurement capabilities (CMCs) declared by national metrology institutes in the framework of the Mutual Recognition Arrangement (MRA), requires a new comparison of TPW cells with lower uncertainty. The Consultative Committee for Thermometry (CCT) decided therefore in its 21st meeting in September 2001 to carry out a new comparison (CCT-K7) and charged the BIPM with its organization. A small working group was constituted by the BIPM, BNM-INM (France), NIST (USA) and UME (Turkey) to prepare the comparison protocol. BNM-INM and UME kindly offered to support the BIPM by temporarily sending staff for participation in the measurements. A staff member of the BIPM was sent to the thermometry laboratory of NIST for additional training. This report presents the results of the TPW comparison and gives detailed information about the measurements made at the BIPM and at the participating laboratories. Chapter 2 summarizes the main points of the technical protocol. The objectives of the comparison are stated and the list of participants is presented. Chapter 3 describes the thermometry facility used at the BIPM for the comparison of the transfer cells and presents the uncertainty budget for the comparison of cells. Chapter 4 describes how the comparison measurements were made. The temperature differences of all cells from the mean of the two BIPM reference cells are presented. The methodology and results of a least-squares procedure, designed to use the ensemble of all cells as reference, are then given. Chapter 5 provides information on the measurements made by the participants. In chapter 6, we combine the results of the measurements in the participating laboratories and those of the cell comparison at the BIPM to obtain the differences between the national references. The reasons for the participants’ choice of the key comparison reference value as the simple mean are summarized and the results are presented accordingly. An attempt is made to quantify the difference between the KCRV, representing the state-of-the-art of thermometry at the time the comparison was carried out, and those results based on the ocean water definition of the TPW. Chapter 7 provides a summary and the conclusions. The immersion profiles for all cells as determined by the participants and at the BIPM and other material are given in the appendices. For the purposes of the MRA, the results of a key comparison are represented in the form of degrees of equivalence. These are derived in Appendix 4.

5/98
2 Organization of the comparison The details of the organization of this comparison are defined in the Technical Protocol, which is reproduced in Appendix 1. Only the main points are presented here.
2.1 Participants All CCT members and observers, and only these, were invited to participate in this comparison. Prior to the start of the comparison the protocol was discussed with all potential participants. It was explicitly accepted in its version of 19 June 2002 by the following participating laboratories: Acronym Name of institute (contact) Country BIPM Bureau International des Poids et Mesures (S. Solve, M. Stock) international BNM-INM1 Bureau National de Métrologie - Institut National de Métrologie
(E. Renaot, G. Bonnier, M. Valin) France
CEM Centro Español de Metrología (D. del Campo, V. Chimenti) Spain CENAM Centro Nacional de Metrología (E. Méndez-Lango) Mexico CSIR-NML National Metrology Laboratory (H. Liedberg) South Africa CSIRO-NML2 National Measurement Laboratory (M. Ballico, D. Sukkar) Australia IMGC3 Instituto di Metrologia “G. Colonnetti” (P.P.M. Steur, P. Marcarino,
R. Dematteis)Italy
IPQ Instituto Português da Qualidade (E. Filipe, I. Lobo) Portugal KRISS Korea Research Institute of Standards and Science (K.H. Kang,
K.S. Gam, Y.-G. Kim) Rep. of Korea
MSL Measurement Standards Laboratory of New Zealand (R. White, T.D. Dransfield)
New Zealand
NIM National Institute of Metrology (Y. Duan, Y. Xiaoke) China NIST National Institute of Standards and Technology (G. Strouse) United States NMIJ/AIST National Metrology Institute of Japan, National Institute of Advanced
Industrial Science and Technology (M. Arai) Japan
NMi-VSL Nederlands Meetinstituut - Van Swinden Laboratorium (A. Mans, M. de Groot, O. Kerkhof)
Netherlands
NPL National Physical Laboratory (R. Rusby, J. Gray, D. Head) United Kingdom NRC National Research Council of Canada (K. Hill) Canada PTB Physikalisch-Technische Bundesanstalt (E. Tegeler, U. Noatsch) Germany SMU Slovak Institute of Metrology (S. Ďuriš) Slovakia SPRING National Metrology Centre (H.Y. Kho) Singapore UME Ulusal Metroloji Enstitüsü (S. Ugur) Turkey VNIIM D.I. Mendeleev Institute for Metrology (A. Pokhodun, S.F. Gerasimov) Russia
Table 1: Participants of CCT-K7.
2.2 Objectives The comparison has two distinct objectives: 1) a direct comparison of high-quality water triple point cells to quantify differences
between cells, and 1 BNM-INM: Name changed to LNE-INM/CNAM on 1 January 2005. 2 CSIRO-NML: Name changed to National Measurement Institute of Australia (NMIA) on 1 July 2004. 3 IMGC: Name changed to Instituto Nazionale di Ricerca Metrologica (INRIM) on 1 January 2006.
6/98
2) a comparison of the national realizations of the water triple point which served to calibrate the transfer cells. To reach the first objective, each participating laboratory sent a cell to the BIPM, where all cells were compared using the same instrumentation and the same technique to prepare the ice mantles. The participants were asked to select the cells carefully so that they are free from obvious defects. Therefore the observed dispersion is a measure of the reproducibility of the water triple point temperature using high-quality cells. If significant differences are found it would be interesting to try to correlate them to the isotopic composition or to the impurities. Therefore, wherever possible, cells should come with an isotope and/or impurity analysis. To achieve the second objective, each participating laboratory stated a value for the temperature difference of the transfer cell, relative to the corresponding national standard, representing 273.16 K. This temperature difference had to be accompanied by an estimate of its uncertainty, including contributions from the realization of the TPW (uncertainty of the national standard) and from the direct comparison of the transfer cell with the national standard. A model of the uncertainty budget was supplied in the protocol. This information in conjunction with the comparison of the transfer cells at the BIPM allows a comparison of the realizations of the water triple point temperature of the various national laboratories.
2.3 Method of the comparison The comparison was organized in the “collapsed-star” form and consisted of three phases: · each participating laboratory selected one of its cells as transfer cell and compared it against its national reference cell(s); · the transfer cell was sent together with the measurement results to the BIPM where all transfer cells were compared against two common reference cells; · the transfer cells were sent back to the laboratories to be re-compared with the same reference cell(s) as before to check the stability of the transfer cell. The participants were asked to perform measurements on two separately prepared ice mantles. Measurements should not start until at least one week after the preparation of the ice mantle. Measurements should then be carried out during two weeks, resulting in typically 10 results per mantle. The protocol recommended that the ice mantle of the transfer cell should be prepared by the same technique as used at the BIPM. Apart from this, the measurement procedure should be that normally applied by the laboratory. The participants were also asked to measure an immersion profile. At the BIPM, all cells were compared with two common reference cells provided by the BIPM. The mean of the bridge ratios measured in these two cells served as a reference for all participants' cells measured on the same day. For each cell, measurements were made at least for two different mantles. Immersion profiles were also measured at the BIPM.
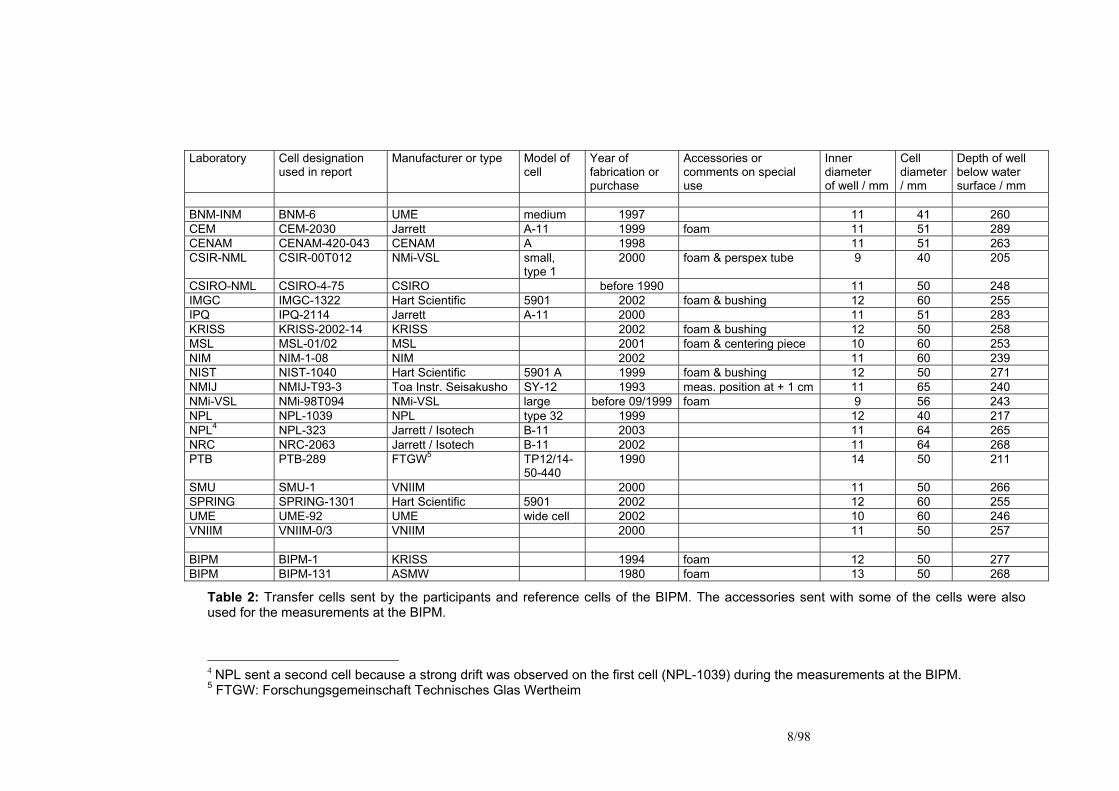
2.4 Transfer cells The transfer cells sent by the laboratories and the two BIPM reference cells are presented in Table 2. The designations used in this report differ in many cases from those used by the
7/98
laboratories because, for convenience, we introduced a uniform labeling system. Each designation starts with the acronym of the laboratory which sent the cell, followed by an identification number. Letters and numbers indicating cell types were dropped from the name. The sixth column of the table lists special accessories which were sent with some of the cells and which were also used for the measurements at the BIPM.
3 The thermometry laboratory at the BIPM
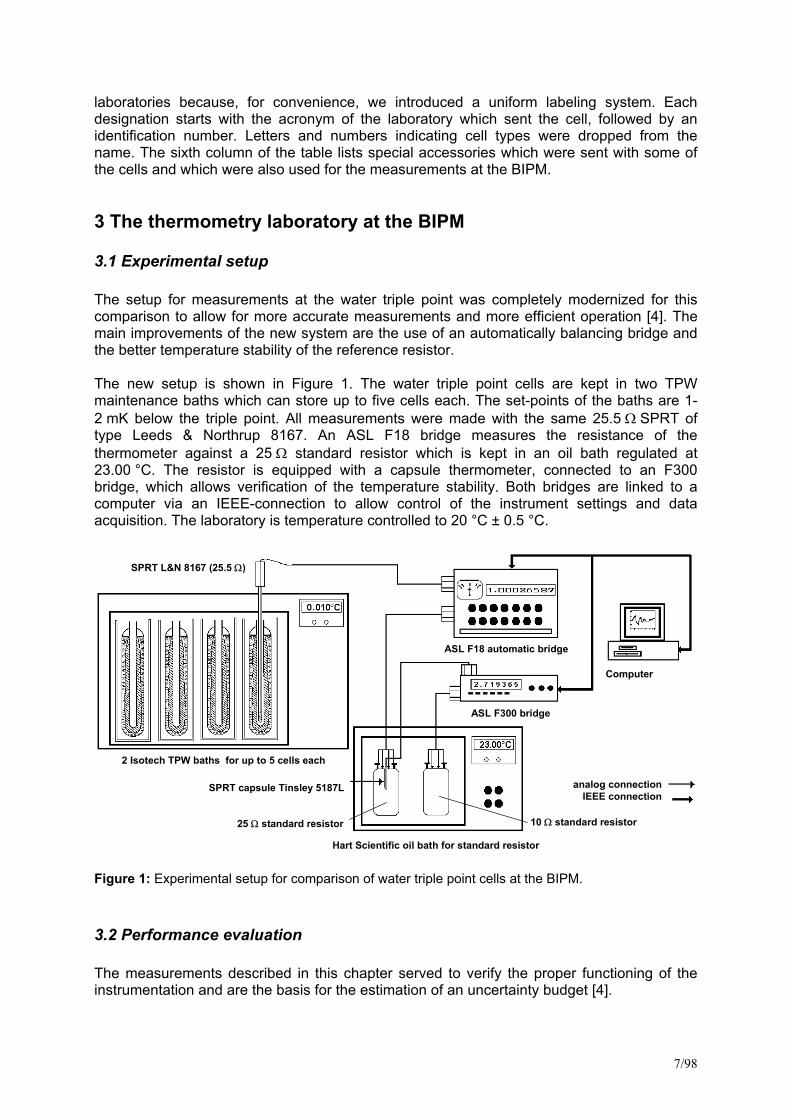
3.1 Experimental setup The setup for measurements at the water triple point was completely modernized for this comparison to allow for more accurate measurements and more efficient operation [4]. The main improvements of the new system are the use of an automatically balancing bridge and the better temperature stability of the reference resistor. The new setup is shown in Figure 1. The water triple point cells are kept in two TPW maintenance baths which can store up to five cells each. The set-points of the baths are 1-2 mK below the triple point. All measurements were made with the same 25.5 Ω SPRT of type Leeds & Northrup 8167. An ASL F18 bridge measures the resistance of the thermometer against a 25 Ω standard resistor which is kept in an oil bath regulated at 23.00 °C. The resistor is equipped with a capsule thermometer, connected to an F300 bridge, which allows verification of the temperature stability. Both bridges are linked to a computer via an IEEE-connection to allow control of the instrument settings and data acquisition. The laboratory is temperature controlled to 20 °C ± 0.5 °C.
2 Isotech TPW baths for up to 5 cells each
SPRT L&N 8167 (25.5 Ω)
25 Ω standard resistor
SPRT capsule Tinsley 5187L
Hart Scientific oil bath for standard resistor
ASL F300 bridge
ASL F18 automatic bridge
10 Ω standard resistor
Computer
analog connectionIEEE connection
2 Isotech TPW baths for up to 5 cells each
SPRT L&N 8167 (25.5 Ω)
25 Ω standard resistor
SPRT capsule Tinsley 5187L
Hart Scientific oil bath for standard resistor
ASL F300 bridge
ASL F18 automatic bridge
10 Ω standard resistor
Computer
analog connectionIEEE connection
Figure 1: Experimental setup for comparison of water triple point cells at the BIPM.
3.2 Performance evaluation The measurements described in this chapter served to verify the proper functioning of the instrumentation and are the basis for the estimation of an uncertainty budget [4].
8/98
Laboratory Cell designation
used in report Manufacturer or type Model of
cell Year of fabrication or purchase
Accessories or comments on special use
Inner diameter of well / mm
Cell diameter / mm
Depth of well below water surface / mm
BNM-INM BNM-6 UME medium 1997 11 41 260 CEM CEM-2030 Jarrett A-11 1999 foam 11 51 289 CENAM CENAM-420-043 CENAM A 1998 11 51 263 CSIR-NML CSIR-00T012 NMi-VSL small,
type 1 2000 foam & perspex tube 9 40 205
CSIRO-NML CSIRO-4-75 CSIRO before 1990 11 50 248 IMGC IMGC-1322 Hart Scientific 5901 2002 foam & bushing 12 60 255 IPQ IPQ-2114 Jarrett A-11 2000 11 51 283 KRISS KRISS-2002-14 KRISS 2002 foam & bushing 12 50 258 MSL MSL-01/02 MSL 2001 foam & centering piece 10 60 253 NIM NIM-1-08 NIM 2002 11 60 239 NIST NIST-1040 Hart Scientific 5901 A 1999 foam & bushing 12 50 271 NMIJ NMIJ-T93-3 Toa Instr. Seisakusho SY-12 1993 meas. position at + 1 cm 11 65 240 NMi-VSL NMi-98T094 NMi-VSL large before 09/1999 foam 9 56 243 NPL NPL-1039 NPL type 32 1999 12 40 217 NPL4 NPL-323 Jarrett / Isotech B-11 2003 11 64 265 NRC NRC-2063 Jarrett / Isotech B-11 2002 11 64 268 PTB PTB-289 FTGW5 TP12/14-
50-440 1990 14 50 211
SMU SMU-1 VNIIM 2000 11 50 266 SPRING SPRING-1301 Hart Scientific 5901 2002 12 60 255 UME UME-92 UME wide cell 2002 10 60 246 VNIIM VNIIM-0/3 VNIIM 2000 11 50 257 BIPM BIPM-1 KRISS 1994 foam 12 50 277 BIPM BIPM-131 ASMW 1980 foam 13 50 268
Table 2: Transfer cells sent by the participants and reference cells of the BIPM. The accessories sent with some of the cells were also used for the measurements at the BIPM.
4 NPL sent a second cell because a strong drift was observed on the first cell (NPL-1039) during the measurements at the BIPM. 5 FTGW: Forschungsgemeinschaft Technisches Glas Wertheim
9/98
3.2.1 Temperature stability of the TPW maintenance baths Several measurements were made of the temperature stability and uniformity of the two TPW maintenance baths. Four calibrated SPRTs were placed at different positions in the baths. In all cases we observed a temperature stability of better than 1 mK peak-to-peak. The uniformity in vertical and horizontal direction is better than 2 mK. The temperatures of both baths were set to 1-2 mK below the triple point by comparison with a triple point cell. The possible influence of the bath temperature on the temperature measured inside a TPW cell is discussed in 3.2.5.
3.2.2 Temperature stability of the oil bath The 25 Ω standard resistor used with the F18 bridge is kept in a temperature controlled oil bath. The temperature of the bath is set to 23.00 °C. According to the specifications of the manufacturer, the short and long term temperature stability is within ± 4 mK. We made several tests with a capsule platinum resistance thermometer either immersed directly in the oil or placed inside a copper block in the bath. From measurements over many hours we typically obtained a standard deviation of 0.2 mK with a maximum difference of 1 mK. Since the temperature coefficient of the standard resistor is of the order of 1 ppm per degree, the variation of the oil bath temperature contributes only 0.05 µK to the standard uncertainty of a measurement at the triple point of water. The temperature of the oil bath was verified at the beginning and at the end of each comparison measurement. We did not investigate the long term stability of the set-point over the duration of the comparison. The two BIPM reference cells were measured every day together with the participants' cells to determine the temperature differences. This scheme is not sensitive to a long term drift of the standard resistor or its temperature.
3.2.3 Accuracy and linearity of the F18 bridge The resistance bridge was checked before and after the comparison with a RBC 100 resistance bridge calibrator [5]. Before the comparison started, the bridge was checked twice, directly after reception in May 2002 and before the comparison started in November 2002. Both results indicate that the bridge works well, however, the software used with the RBC indicates that the accuracy can be improved by applying a linear correction of about 2 x 10⁻⁷ to the bridge ratio rmeas, that is
( )7meas 100.21 −×−= rr .
When this correction is applied, the standard deviation of the residuals of the many resistance combinations measured with the RBC is about 3 x 10⁻⁸. Since we are only interested in the very small temperature differences of the cells, the small linear error does not contribute to the uncertainty. The verification with the RBC after the comparison resulted in a somewhat larger linear correction of -3.0 x 10⁻⁷ but by the same argument as above, this does not contribute to the uncertainty at a significant level.
10/98
We also investigated an eventual differential non-linearity. By this we mean measurement errors introduced by analog-to-digital converters, which depend on the actual bridge ratio and change very quickly over a narrow range of ratios [6]. We therefore looked at the correlation of the residuals of two measurements made with the RBC on two consecutive days. If the residuals are partially correlated this can be interpreted as an indication of differential non-linearity. The correlation coefficient of both series is 0.28, the covariance 2.8 x 10⁻¹⁶. The corresponding standard uncertainty is 1.7 x 10⁻⁸, corresponding to 4 µK at the water triple point.
3.2.4 Accuracy of the self-heating correction The self heating correction is determined from measurements with the currents 1 mA and √2 mA. The use of the formula
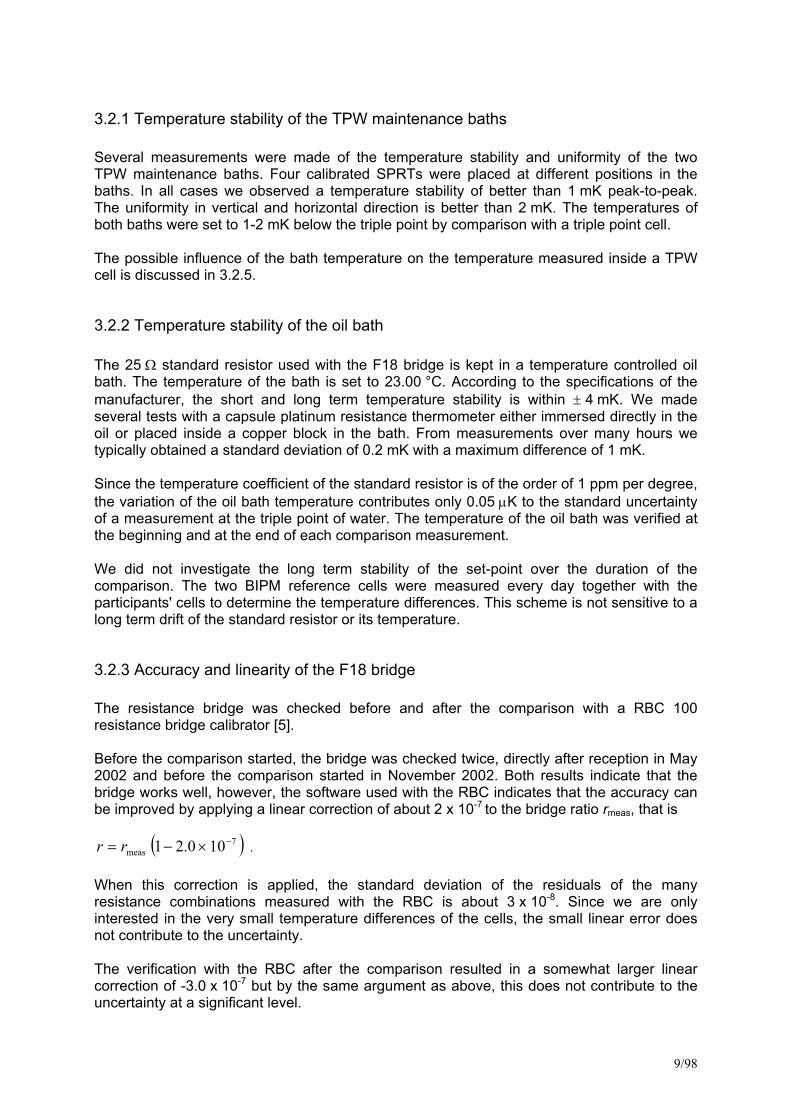
( )mA2)mA1(2)mA0( rrr −= might lead to measurement errors if either the ratio of the two currents differs from √2 or if the relationship between the dissipated power and the temperature rise is not linear. We checked the accuracy of this formula by measuring the self-heating effect with many different currents, ranging from 0.1 mA to 5 mA (Figure 2). Each current was measured independently with an external multimeter. The ratios measured for all currents could be best fitted with a second order polynomial, which was then used for extrapolation to zero current. This result agreed with that obtained from the above formula within 2 x 10⁻⁸. We therefore estimate the uncertainty contributed by the self-heating correction as 5 µK.
2. Order polynomialy = 0.000001906x2 + 0.000000017x + 1.022446739
R2 = 0.999981342Extrapolation to zero: 1.02244674
1.02244
1.02245
1.02246
1.02247
1.02248
1.02249
1.02250
0 1 2 3 4 5 6measured bridge current / mA
brid
ge ra
tio
ratio for I = 0 mA calculated fromI = 1 mA and I = 1.41 mA:
1.02244672
Figure 2: Determination of the accuracy of the self-heating correction by using many different currents. The currents were measured with an external multimeter.
11/98
3.2.5 Stray thermal exchanges Measurement errors may result from an influence of the temperature distribution outside a TPW cell on the temperature measured in the cell. The sensor of the SPRT might be influenced by either the room temperature, the bath temperature or by light conducted down the thermometer well. To quantify a possible influence of the bath temperature, we increased the temperature set-point of one of the maintenance baths by 6 mK. We simultaneously measured the temperature inside the bath and inside a triple point cell stored in the bath. The temperature of the bath increased rapidly, whereas no change was detectable inside the triple point cell. The effect is thus smaller than the experimental standard deviation of about 5 µK. Under normal conditions the temperature of the bath is within 1-2 mK of the triple point temperature, and thus has an effect on the measured cell temperatures of less than 2 µK. To investigate the effect of the room lighting, two cells were measured during 30 minutes with the room light switched on, then 30 minutes with the light switch off and then the light was switched on again. The measurement was made in a small cell, so that a relatively large part of the thermometer sheath was outside the bath. Within the uncertainty of the measurement of about 5 µK, no effect was detectable. We investigated the influence of the room temperature by changing the room temperature by 3.5 °C while measuring a cell. No significant effect was observed within the uncertainty of this measurement of 2.5 µK. The combination of the three effects listed above leads to 6 µK. Since this estimation is limited by the experimental standard deviations of the three measurements, and because it is improbable that all three effects really contribute this maximal value, we divide this estimation by √3 and obtain 4 µK.
3.2.6 Humidity in SPRT Humidity in the stem of the SPRT can introduce measurement errors because it can reduce the insulation resistance. Dependent on the location where condensation occurs, this can also lead to a bad reproducibility of the measurements. The thermometer used for this comparison was therefore checked in the following way: While it was measuring the temperature of a triple point cell, a plastic cap filled with dry ice of temperature -80 °C was placed at the upper end of its stem, around the head. This should lead to a redistribution of condensed water, if there were any. A sudden decrease of the measured temperature of about 0.4 mK occurred due to thermal conduction along the sheath. After a short time, the SPRT reading returned within 20 µK to the values observed before the thermal shock. The cap with dry ice was in place during the whole experiment. This is only a rough check of the behavior of the thermometer and does not allow one to quantify an uncertainty contribution, but we conclude that under normal conditions any effect of residual humidity is negligible.
3.2.7 Selection of the BIPM reference cells A trial comparison was carried out before the start of the measurements on the transfer cells to determine the repeatability of the measurements and to chose two reference cells. It was found that the standard deviation of the temperature difference between two cells over two
12/98
weeks (10 measurements) is of the order of 10 µK, resulting in a standard deviation of the mean of 3 - 4 µK. Cells BIPM-1 and BIPM-131 were chosen as reference cells because they showed the best repeatability. BIPM-1 was manufactured by KRISS and arrived at the BIPM in 1994, BIPM-131 was manufactured by the ASMW6 and sent to the BIPM in 1980.
3.3 Uncertainty budget for the comparison of TPW cells According to their influence on the measured temperature differences between a transfer cell and the BIPM reference, three classes of effects have to be distinguished: 1) random effects, which lead to a variability of the results but do not introduce a systematic bias. They are determined from the repeatability of the measurements. 2) Systematic effects, which influence measurements on a given cell always in the same way, and which are identical for all cells. These effects do not contribute to the uncertainty of a temperature difference. 3) Systematic effects, which influence measurements on a given cell always in the same way, but which vary from cell to cell. These effects cannot be determined from the repeatability and have to be estimated separately. If we suppose that the variation from cell to cell is random, and the uncertainty estimate for an effect of this type for a single cell is u, the combined uncertainty of the temperature difference ∆T = T – (T1+T2)/2 is u(∆T) = 2/3 u, where T is the temperature of the transfer cell and T1 and T2 are the temperatures of the two BIPM reference cells. In the following we describe how we estimated the individual uncertainty components. Repeatability: The experimental standard deviation of 10 measurements (2 weeks) of the temperature difference of a given cell from the reference (mean of BIPM-1 and BIPM-131) is typically 11 µK. This results in an experimental standard deviation of the mean of typically 4 µK. For each cell measurements were made on at least two mantles. The results for different mantles agree for most cells within k=2, so that no significant 'mantle effect' can be statistically determined. The final standard deviation of the mean obtained for both mantles is therefore close to 3 µK for most cells. For those cells, where the results obtained on different mantles were not consistent, this was taken separately into account in the reproducibility component. In the data reduction of the comparison, the repeatability component is determined for each cell from the actual measurements. The experimental standard deviation includes contributions from: - electrical noise (bridge, cables etc.) ; - temperature stability of the standard resistor; - SPRT changes during a day due to manipulation; - different thermal contact of SPRT in TPW cell; - instability of the TPW cell; and - instability of the reference cell. Reproducibility: At least two mantles were made for each cell. In most cases there is no statistically significant dependence on the ice mantle. For those cells where different ice mantles led to different temperatures, this is additionally taken into account, the contributions range from 3-6 µK (see Table 16).
6 ASMW: Amt für Standardisierung, Messwesen und Warenprüfung, now integrated into the PTB.
13/98
Bridge accuracy: As described in 3.2.3 the F18 bridge seems to have a small linear error. Since we are only interested in temperature differences obtained from the ratios of bridge readings, a linear error has no effect on the comparison. Differential bridge non-linearity: Using the data of two series obtained with the RBC 100, the correlation between both series was calculated and interpreted as indication of differential non-linearity (3.2.3). The corresponding uncertainty contribution for a single cell is 4 µK and the combined uncertainty for the temperature difference from the reference is 5 µK. Self-heating correction: The accuracy of the self-heating correction was determined as described in 3.2.4, by comparing the result of the standard technique with that of a measurement using many different, and independently measured, bridge currents. The contribution to the uncertainty at the water triple point is 5 µK for a single cell. The combined uncertainty for the temperature difference from the reference is thus 6 µK. Hydrostatic pressure correction: The sensor of the SPRT (L&N 8167) has a length of 33 mm, and we assume that the effective measurement position is with 99.7 % confidence within ±15 mm around the center. Assuming a normal distribution, the standard uncertainty of the position is 5 mm, corresponding to 4 µK. This component should be strongly correlated for all cells measured with the same SPRT. The correlation will not be 100 % due to variations of cell diameter and differences in the use of foam and bushings. Therefore we estimate this component as 2 µK. The uncertainty of the determination of the depth of the bottom of the thermometer well below the water surface was estimated as 2 mm. An additional contribution arises from the non-perfect knowledge of the height of the water column which was not measured every day and which depends on the size of the ice mantle (see also 4.1.3). We assume that the ice mantle fills between 40 % and 80 % of the available radial distance between the thermometer well and the outer cell enclosure, because we paid attention to the size of the ice mantles when they were made. The corresponding uncertainty of the height is ± 7 mm. We divide by √3 and obtain 4 mm as the standard uncertainty. Together with the components mentioned above, this gives 4 µK in temperature units. The combined uncertainty for the difference from the reference is 5 µK. Stray thermal exchanges: Chapter 3.2.5 describes the experiments made to quantify uncertainties related to the thermal environment of the TPW cells. The result was 4 µK and was only limited by the resolution of the measurements. The combined uncertainty of the difference from the reference is 5 µK, although the uncertainties for the different cells will be partially correlated. The CCT working document CCT/01-10 on “Uncertainties in Temperature Measurements” recommends an additional method to estimate the effect of perturbing heat exchanges. This is based on the deviation of the measured from the theoretical slope of the immersion profile over the sensor length, which is typically 5 cm. For this comparison the transfer cells serve only to transfer the local realizations to the BIPM. No absolute measurements are made with them. Therefore we replace the full sensor length by the difference of the effective measurement position when the BIPM SPRT and the local SPRT are used. The SPRT type used by the participants of K7 with the largest difference in measurement position from our L&N 8167 is the type Tinsley 5187 SA. The difference is 8 mm. As shown in Appendix 3, the average profile slope was found to be 9.9 µK/cm. This leads to an average effect of 2 µK. The largest individual uncertainty is obtained for PTB-289 as 5 µK. This estimation leads to very similar results as the variation of the thermal environment described above. In our
14/98
opinion the variation of the thermal environment leads to more reliable results; therefore we use the estimate based on this technique (5 µK). Temperature stability of standard resistor: The standard deviation of the temperature fluctuations of the oil bath is 0.2 mK (3.2.2). The resistor has a temperature coefficient of 1 ppm/K, which leads to a relative standard uncertainty of 2 x 10⁻¹⁰. The effect on the temperature determination is negligible and included in the repeatability. Long term stability of standard resistor: Since all results obtained during one day are treated together and are expressed as temperature differences, a long term drift of the resistor has no influence on the comparison. Long term stability of the temperature reference: As described in chapter 4.3, for the final data reduction a least-squares procedure was applied to use the results for all cells, not only for the two BIPM reference cells, to construct the most stable temperature reference over the duration of the comparison. The results of this procedure show that the temperature reference used during the comparison measurements, based on cells BIPM-1 and BIPM-131, can be considered as stable to within 4 µK at the 1σ level. We assume that the reference based on all cells is, at least, as stable and include 4 µK in the uncertainty budget. The full uncertainty budget is shown in Table 3. It applies to the comparison of a transfer cell with the BIPM reference including the long term stability of this reference over the period of the comparison. As will become clear later, the comparison uncertainty of about 13 µK is considerably smaller than the typical temperature differences between cells. Also, the combined uncertainties estimated by the participants for the temperatures realized by their cells are much larger (20-160 µK).
Source of uncertainty Contribution / µK repeatability (incl. noise, SPRT changes, TPW changes,...)
3-7 (depends on TPW cell)
reproducibility (effect of ice mantle) generally negligible (otherwise included)
bridge accuracy negligible
differential bridge non-linearity 5
self-heating correction 6
hydrostatic pressure correction
5
stray thermal exchanges
5
temperature stability of standard resistor negligible long term stability of the temperature reference
4
Sum in quadrature (k=1) 12-13
Table 3: Uncertainty budget for the temperature difference between a transfer cell and the BIPM reference (mean of BIPM-1 and BIPM-131).
15/98
4 Comparison of the transfer cells at the BIPM
4.1 Measurement procedure
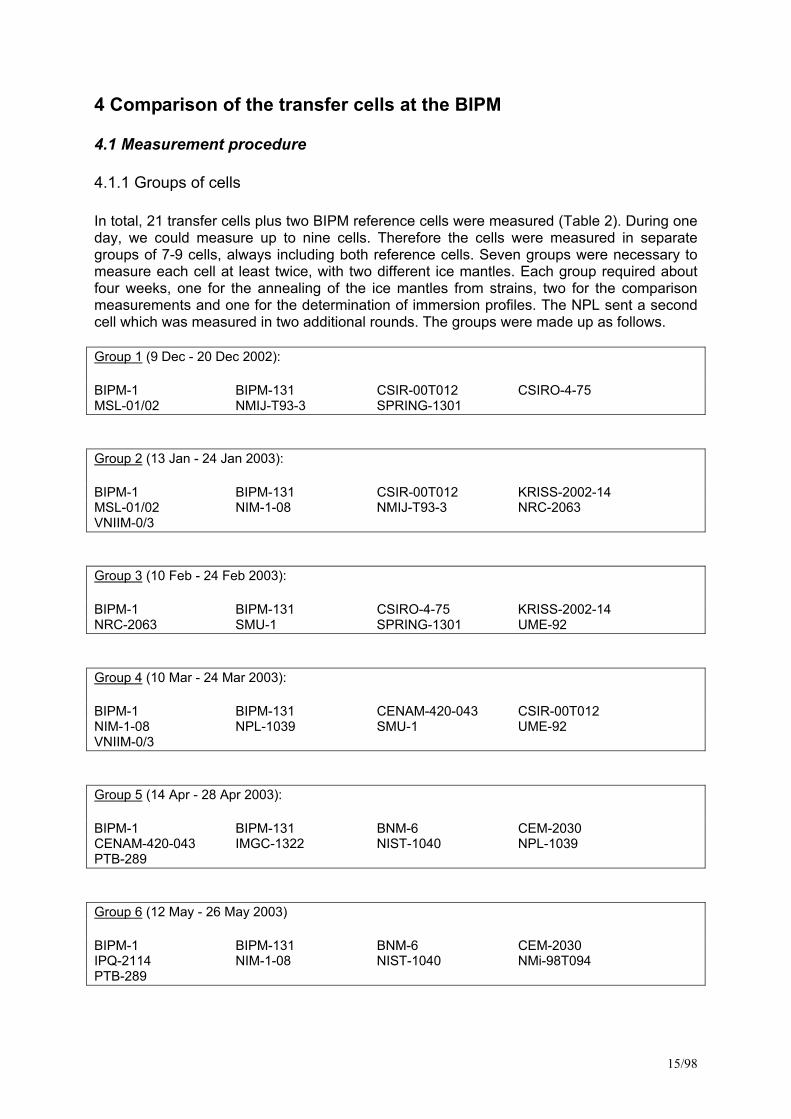
4.1.1 Groups of cells In total, 21 transfer cells plus two BIPM reference cells were measured (Table 2). During one day, we could measure up to nine cells. Therefore the cells were measured in separate groups of 7-9 cells, always including both reference cells. Seven groups were necessary to measure each cell at least twice, with two different ice mantles. Each group required about four weeks, one for the annealing of the ice mantles from strains, two for the comparison measurements and one for the determination of immersion profiles. The NPL sent a second cell which was measured in two additional rounds. The groups were made up as follows. Group 1 (9 Dec - 20 Dec 2002): BIPM-1 BIPM-131 CSIR-00T012 CSIRO-4-75 MSL-01/02 NMIJ-T93-3 SPRING-1301 Group 2 (13 Jan - 24 Jan 2003): BIPM-1 BIPM-131 CSIR-00T012 KRISS-2002-14 MSL-01/02 NIM-1-08 NMIJ-T93-3 NRC-2063 VNIIM-0/3 Group 3 (10 Feb - 24 Feb 2003): BIPM-1 BIPM-131 CSIRO-4-75 KRISS-2002-14 NRC-2063 SMU-1 SPRING-1301 UME-92 Group 4 (10 Mar - 24 Mar 2003): BIPM-1 BIPM-131 CENAM-420-043 CSIR-00T012 NIM-1-08 NPL-1039 SMU-1 UME-92 VNIIM-0/3 Group 5 (14 Apr - 28 Apr 2003): BIPM-1 BIPM-131 BNM-6 CEM-2030 CENAM-420-043 IMGC-1322 NIST-1040 NPL-1039 PTB-289 Group 6 (12 May - 26 May 2003) BIPM-1 BIPM-131 BNM-6 CEM-2030 IPQ-2114 NIM-1-08 NIST-1040 NMi-98T094 PTB-289
16/98
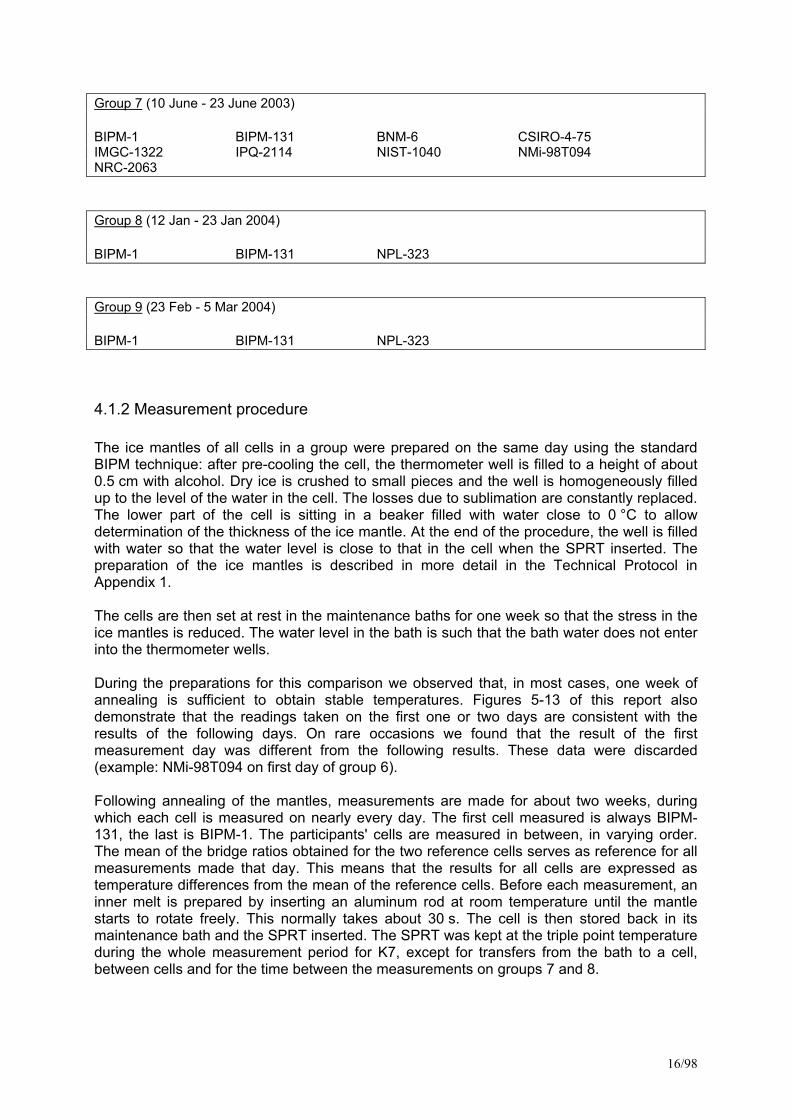
Group 7 (10 June - 23 June 2003) BIPM-1 BIPM-131 BNM-6 CSIRO-4-75 IMGC-1322 IPQ-2114 NIST-1040 NMi-98T094 NRC-2063 Group 8 (12 Jan - 23 Jan 2004) BIPM-1 BIPM-131 NPL-323 Group 9 (23 Feb - 5 Mar 2004) BIPM-1 BIPM-131 NPL-323
4.1.2 Measurement procedure The ice mantles of all cells in a group were prepared on the same day using the standard BIPM technique: after pre-cooling the cell, the thermometer well is filled to a height of about 0.5 cm with alcohol. Dry ice is crushed to small pieces and the well is homogeneously filled up to the level of the water in the cell. The losses due to sublimation are constantly replaced. The lower part of the cell is sitting in a beaker filled with water close to 0 °C to allow determination of the thickness of the ice mantle. At the end of the procedure, the well is filled with water so that the water level is close to that in the cell when the SPRT inserted. The preparation of the ice mantles is described in more detail in the Technical Protocol in Appendix 1. The cells are then set at rest in the maintenance baths for one week so that the stress in the ice mantles is reduced. The water level in the bath is such that the bath water does not enter into the thermometer wells. During the preparations for this comparison we observed that, in most cases, one week of annealing is sufficient to obtain stable temperatures. Figures 5-13 of this report also demonstrate that the readings taken on the first one or two days are consistent with the results of the following days. On rare occasions we found that the result of the first measurement day was different from the following results. These data were discarded (example: NMi-98T094 on first day of group 6). Following annealing of the mantles, measurements are made for about two weeks, during which each cell is measured on nearly every day. The first cell measured is always BIPM-131, the last is BIPM-1. The participants' cells are measured in between, in varying order. The mean of the bridge ratios obtained for the two reference cells serves as reference for all measurements made that day. This means that the results for all cells are expressed as temperature differences from the mean of the reference cells. Before each measurement, an inner melt is prepared by inserting an aluminum rod at room temperature until the mantle starts to rotate freely. This normally takes about 30 s. The cell is then stored back in its maintenance bath and the SPRT inserted. The SPRT was kept at the triple point temperature during the whole measurement period for K7, except for transfers from the bath to a cell, between cells and for the time between the measurements on groups 7 and 8.
17/98
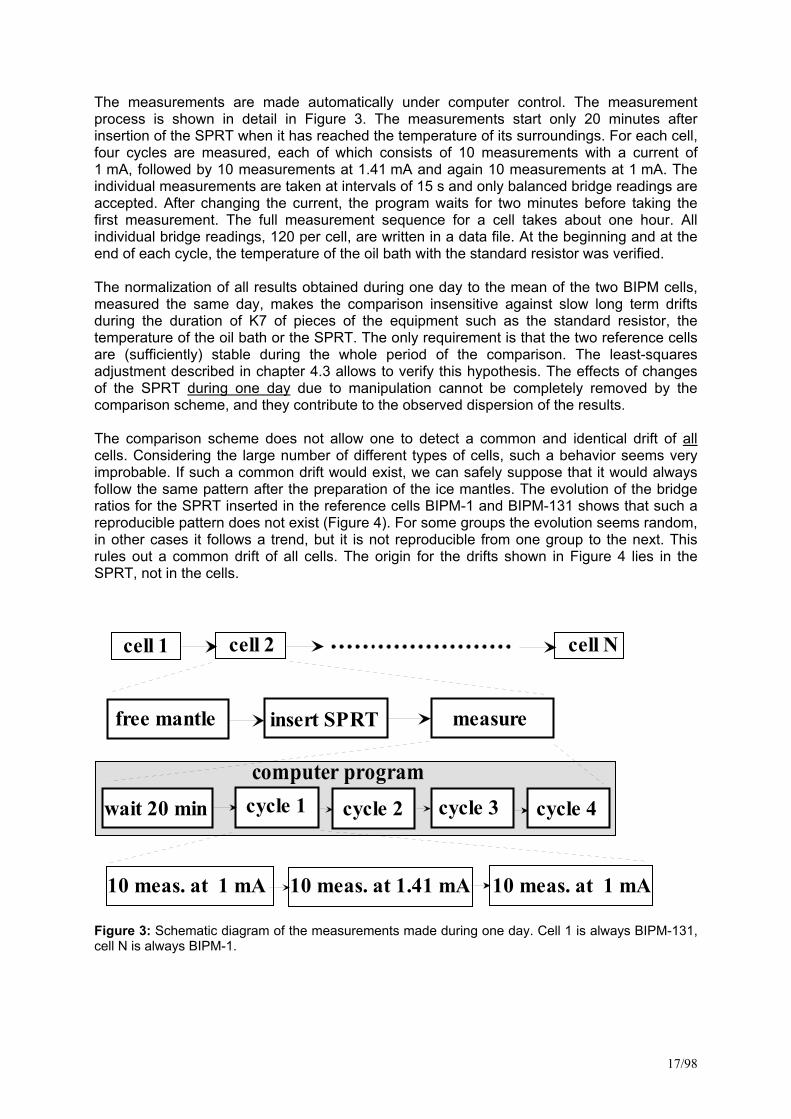
The measurements are made automatically under computer control. The measurement process is shown in detail in Figure 3. The measurements start only 20 minutes after insertion of the SPRT when it has reached the temperature of its surroundings. For each cell, four cycles are measured, each of which consists of 10 measurements with a current of 1 mA, followed by 10 measurements at 1.41 mA and again 10 measurements at 1 mA. The individual measurements are taken at intervals of 15 s and only balanced bridge readings are accepted. After changing the current, the program waits for two minutes before taking the first measurement. The full measurement sequence for a cell takes about one hour. All individual bridge readings, 120 per cell, are written in a data file. At the beginning and at the end of each cycle, the temperature of the oil bath with the standard resistor was verified. The normalization of all results obtained during one day to the mean of the two BIPM cells, measured the same day, makes the comparison insensitive against slow long term drifts during the duration of K7 of pieces of the equipment such as the standard resistor, the temperature of the oil bath or the SPRT. The only requirement is that the two reference cells are (sufficiently) stable during the whole period of the comparison. The least-squares adjustment described in chapter 4.3 allows to verify this hypothesis. The effects of changes of the SPRT during one day due to manipulation cannot be completely removed by the comparison scheme, and they contribute to the observed dispersion of the results. The comparison scheme does not allow one to detect a common and identical drift of all cells. Considering the large number of different types of cells, such a behavior seems very improbable. If such a common drift would exist, we can safely suppose that it would always follow the same pattern after the preparation of the ice mantles. The evolution of the bridge ratios for the SPRT inserted in the reference cells BIPM-1 and BIPM-131 shows that such a reproducible pattern does not exist (Figure 4). For some groups the evolution seems random, in other cases it follows a trend, but it is not reproducible from one group to the next. This rules out a common drift of all cells. The origin for the drifts shown in Figure 4 lies in the SPRT, not in the cells.
cell 1 cell 2 cell N
free mantle insert SPRT measure
cycle 1 cycle 2 cycle 3 cycle 4
10 meas. at 1 mA 10 meas. at 1.41 mA 10 meas. at 1 mA
wait 20 min
computer program
Figure 3: Schematic diagram of the measurements made during one day. Cell 1 is always BIPM-131, cell N is always BIPM-1.
18/98
1.0226528
1.0226530
1.0226532
1.0226534
1.0226536
1.0226538
1.0226540
1.0226542
1/12 31/12 30/1 2/3 1/4 1/5 1/6 1/7date
brid
ge ra
tio c
orre
cted
for s
elf h
eatin
g BIPM-1BIPM-131
50 µK
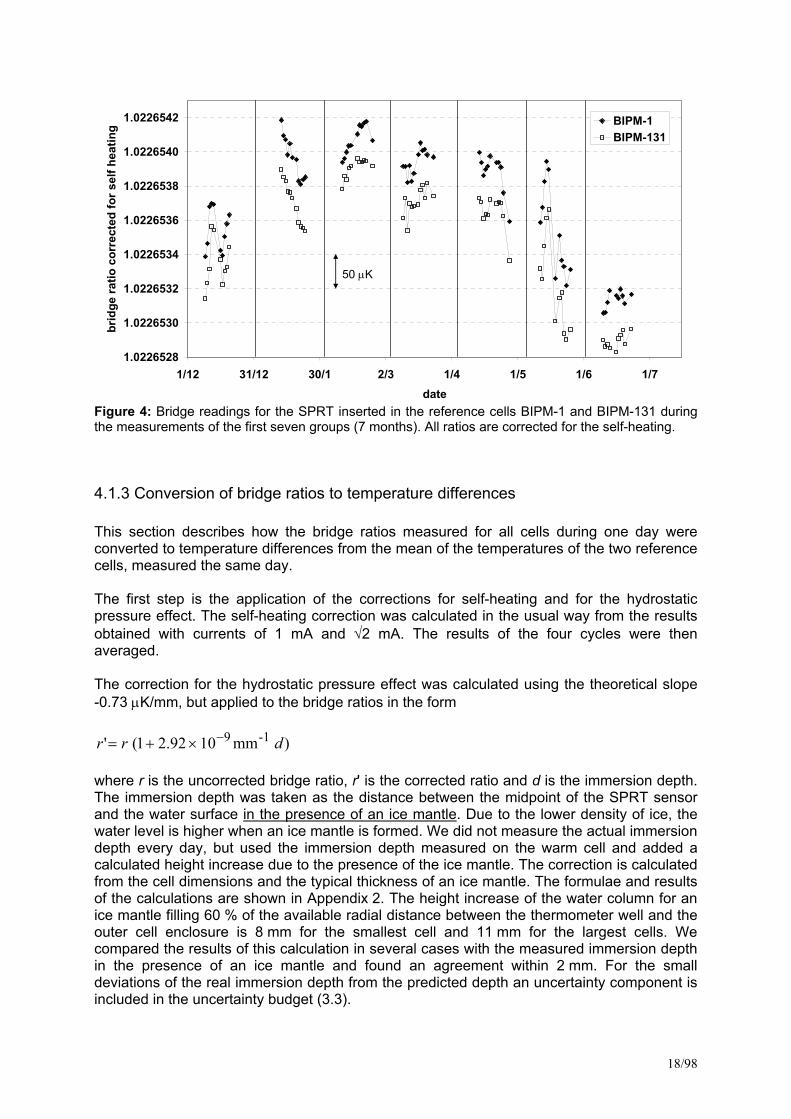
Figure 4: Bridge readings for the SPRT inserted in the reference cells BIPM-1 and BIPM-131 during the measurements of the first seven groups (7 months). All ratios are corrected for the self-heating.
4.1.3 Conversion of bridge ratios to temperature differences This section describes how the bridge ratios measured for all cells during one day were converted to temperature differences from the mean of the temperatures of the two reference cells, measured the same day. The first step is the application of the corrections for self-heating and for the hydrostatic pressure effect. The self-heating correction was calculated in the usual way from the results obtained with currents of 1 mA and √2 mA. The results of the four cycles were then averaged. The correction for the hydrostatic pressure effect was calculated using the theoretical slope -0.73 µK/mm, but applied to the bridge ratios in the form
)mm1092.21(' -19 drr −×+= where r is the uncorrected bridge ratio, r' is the corrected ratio and d is the immersion depth. The immersion depth was taken as the distance between the midpoint of the SPRT sensor and the water surface in the presence of an ice mantle. Due to the lower density of ice, the water level is higher when an ice mantle is formed. We did not measure the actual immersion depth every day, but used the immersion depth measured on the warm cell and added a calculated height increase due to the presence of the ice mantle. The correction is calculated from the cell dimensions and the typical thickness of an ice mantle. The formulae and results of the calculations are shown in Appendix 2. The height increase of the water column for an ice mantle filling 60 % of the available radial distance between the thermometer well and the outer cell enclosure is 8 mm for the smallest cell and 11 mm for the largest cells. We compared the results of this calculation in several cases with the measured immersion depth in the presence of an ice mantle and found an agreement within 2 mm. For the small deviations of the real immersion depth from the predicted depth an uncertainty component is included in the uncertainty budget (3.3).
19/98
The Leeds & Northrup SPRT has a sensor length of 33 mm. The midpoint of the sensor is 28 mm above the tip of the thermometer sheath. The last element to take into consideration is the height of the foam pads inserted in some of the cells and the fact that the NMIJ cell is always measured 1 cm above the bottom of the well. Table 4 shows all elements for the calculation of the immersion depth and the results.
length of well l well within increase in height of foam immersion depth withwater (without ice) height due to ice pad (if any) ice and foam
/ mm / mm / mm / mm
BNM-6 260 10 0 242CEM-2030 289 11 6 266CENAM-420-043 263 10 0 245CSIR-00T012 205 8 16 169CSIRO-4-75 248 10 0 230IMGC-1322 255 10 5 232IPQ-2114 283 11 0 266KRISS-2002-14 258 10 3 237MSL-01/02 253 10 5 230NIM-1-08 239 9 0 220NIST-1040 271 11 5 249NMIJ-T93-3 240 9 10 211NMi-98T094 243 9 3 221NPL-1039 217 9 0 198NPL-323 265 10 0 247NRC-2063 268 10 0 250PTB-289 211 9 0 192SMU-1 266 10 0 248SPRING-1301 255 10 0 237UME-92 246 9 0 227VNIIM-0/3 257 10 0 239
BIPM-1 277 11 5 255BIPM-131 268 11 5 246
Table 4: Calculation of the immersion depth for the hydrostatic pressure correction. The calculation of the height increase due to the lower density of the ice is detailed in Appendix 2 and Table A2.1. For the cell of the NMIJ no foam pad was used, but the measurement position was 10 mm above the bottom of the thermometer well. The midpoint of the SPRT sensor is 28 mm above the tip of the thermometer sheath.
After application of the self-heating correction and the hydrostatic pressure correction, the bridge ratios are converted to temperatures. The mean value measured on the two BIPM reference cells on the same day is used as a reference rref. Temperature differences of the participants' cells from the reference are calculated as
K 2501)icell( 1)icell()icell(
2)131BIPM()1BIPM(
refTPW
90
ref
ref
×⎟⎟⎠
⎞⎜⎜⎝
⎛−≈×⎟⎟
⎠
⎞⎜⎜⎝
⎛−≈∆=∆
−+−=
rr
dWdT
rrTT
rrr
ri
The second equation is an approximation based on the reference function Wr(T90) of the ITS-90 and its slope at 273.16 K of 0.25 mK per ppm. The error introduced by this approximation is below 0.3 µK for the range of temperature differences observed in K7.
20/98
The above formulae were also applied to the two reference cells, which explains why their results are always distributed symmetrically around the reference. The experimental standard deviations of the temperature differences were calculated as
22
22
21
12
2
2
4
)(
4
)()(K250)(
r
ru
r
ru
r
ruTu
i
ii ++≈∆
where u(ri) is the experimental standard deviation of the bridge ratio for cell i, and u(r1) and u(r2) are the standard deviations of the ratios for the two reference cells. The bridge ratios r are all very close to 1 (r ≈ 1.023). For the reference cells this simplifies to
2,14
)(4
)(K250)( 22
22
21
12
=+≈∆ jrru
rruTu j
because they are used to define the reference. Here again the ratios r are very close to 1.
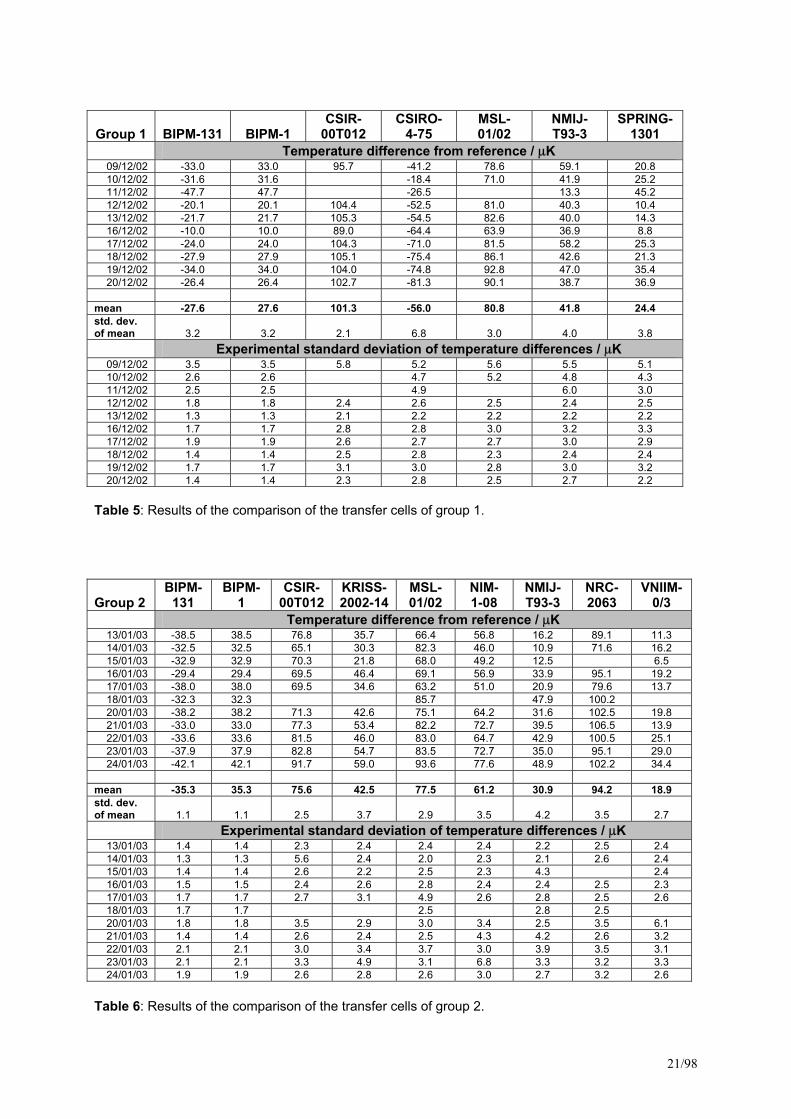
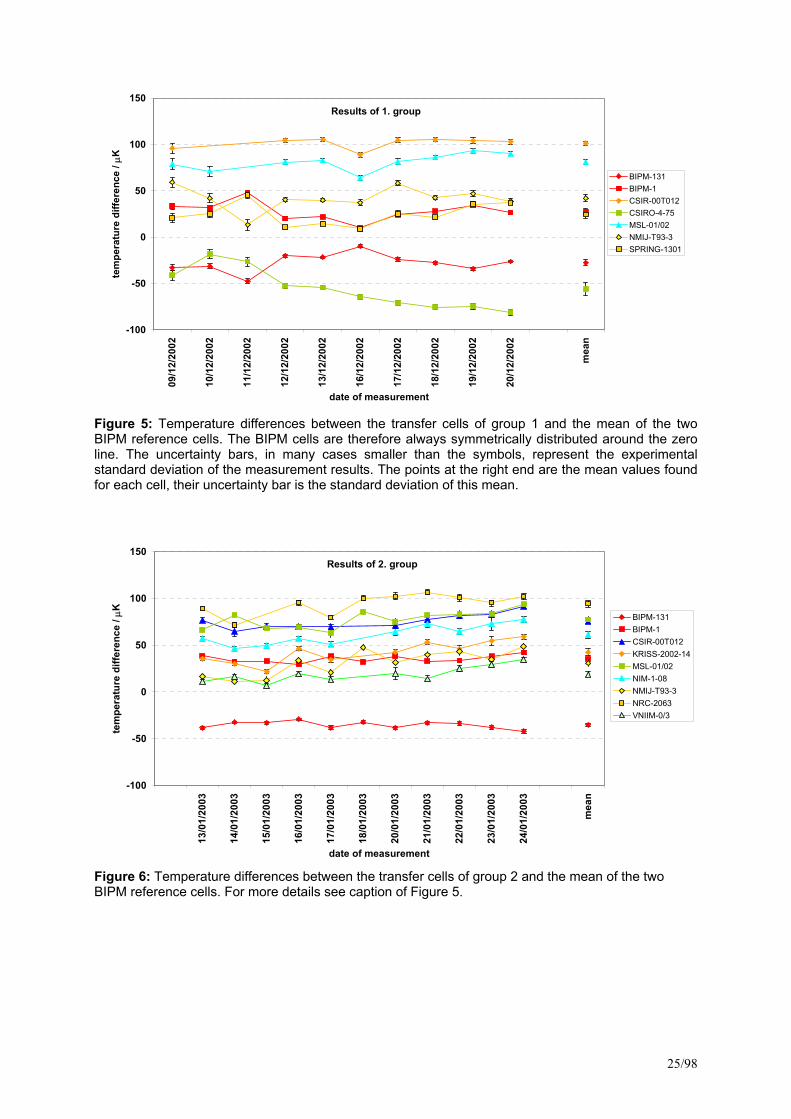
4.2 Results of the BIPM measurements The results for the nine groups of cells are summarized in the Tables 5-13 and in graphical form in Figure 5-13. The top part of each table shows the temperature differences between the transfer cells and the reference, followed by the mean of the temperature differences (in bold type) obtained during the two weeks of measurement and the standard deviation of this mean. The lower part of the tables shows the experimental standard deviations of the individual temperature differences, calculated as explained in the last chapter. Since the two BIPM cells are correlated with the BIPM reference, the experimental standard deviation of the BIPM cells is always smaller as those for the other cells, typically by a factor of ÷3. These standard deviations are not used for any further calculations. The standard deviation of the mean for the BIPM cells is, in most cases, smaller than those of the other cells, again due to the correlation. There are some exceptions, because the dominating effect over a period of two weeks is the change of the SPRT due to manipulation. Figure 14 gives an overview of all measurements made on the transfer cells.
21/98
Group 1 BIPM-131 BIPM-1 CSIR-
00T012 CSIRO-
4-75 MSL-01/02
NMIJ-T93-3
SPRING-1301
Temperature difference from reference / µK 09/12/02 -33.0 33.0 95.7 -41.2 78.6 59.1 20.8 10/12/02 -31.6 31.6 -18.4 71.0 41.9 25.2 11/12/02 -47.7 47.7 -26.5 13.3 45.2 12/12/02 -20.1 20.1 104.4 -52.5 81.0 40.3 10.4 13/12/02 -21.7 21.7 105.3 -54.5 82.6 40.0 14.3 16/12/02 -10.0 10.0 89.0 -64.4 63.9 36.9 8.8 17/12/02 -24.0 24.0 104.3 -71.0 81.5 58.2 25.3 18/12/02 -27.9 27.9 105.1 -75.4 86.1 42.6 21.3 19/12/02 -34.0 34.0 104.0 -74.8 92.8 47.0 35.4 20/12/02 -26.4 26.4 102.7 -81.3 90.1 38.7 36.9
mean -27.6 27.6 101.3 -56.0 80.8 41.8 24.4 std. dev. of mean 3.2 3.2 2.1 6.8 3.0 4.0 3.8
Experimental standard deviation of temperature differences / µK 09/12/02 3.5 3.5 5.8 5.2 5.6 5.5 5.1 10/12/02 2.6 2.6 4.7 5.2 4.8 4.3 11/12/02 2.5 2.5 4.9 6.0 3.0 12/12/02 1.8 1.8 2.4 2.6 2.5 2.4 2.5 13/12/02 1.3 1.3 2.1 2.2 2.2 2.2 2.2 16/12/02 1.7 1.7 2.8 2.8 3.0 3.2 3.3 17/12/02 1.9 1.9 2.6 2.7 2.7 3.0 2.9 18/12/02 1.4 1.4 2.5 2.8 2.3 2.4 2.4 19/12/02 1.7 1.7 3.1 3.0 2.8 3.0 3.2 20/12/02 1.4 1.4 2.3 2.8 2.5 2.7 2.2
Table 5: Results of the comparison of the transfer cells of group 1. Group 2
BIPM-131
BIPM- 1
CSIR-00T012
KRISS-2002-14
MSL-01/02
NIM- 1-08
NMIJ-T93-3
NRC-2063
VNIIM-0/3
Temperature difference from reference / µK 13/01/03 -38.5 38.5 76.8 35.7 66.4 56.8 16.2 89.1 11.3 14/01/03 -32.5 32.5 65.1 30.3 82.3 46.0 10.9 71.6 16.2 15/01/03 -32.9 32.9 70.3 21.8 68.0 49.2 12.5 6.5 16/01/03 -29.4 29.4 69.5 46.4 69.1 56.9 33.9 95.1 19.2 17/01/03 -38.0 38.0 69.5 34.6 63.2 51.0 20.9 79.6 13.7 18/01/03 -32.3 32.3 85.7 47.9 100.2 20/01/03 -38.2 38.2 71.3 42.6 75.1 64.2 31.6 102.5 19.8 21/01/03 -33.0 33.0 77.3 53.4 82.2 72.7 39.5 106.5 13.9 22/01/03 -33.6 33.6 81.5 46.0 83.0 64.7 42.9 100.5 25.1 23/01/03 -37.9 37.9 82.8 54.7 83.5 72.7 35.0 95.1 29.0 24/01/03 -42.1 42.1 91.7 59.0 93.6 77.6 48.9 102.2 34.4
mean -35.3 35.3 75.6 42.5 77.5 61.2 30.9 94.2 18.9 std. dev. of mean 1.1 1.1 2.5 3.7 2.9 3.5 4.2 3.5 2.7
Experimental standard deviation of temperature differences / µK 13/01/03 1.4 1.4 2.3 2.4 2.4 2.4 2.2 2.5 2.4 14/01/03 1.3 1.3 5.6 2.4 2.0 2.3 2.1 2.6 2.4 15/01/03 1.4 1.4 2.6 2.2 2.5 2.3 4.3 2.4 16/01/03 1.5 1.5 2.4 2.6 2.8 2.4 2.4 2.5 2.3 17/01/03 1.7 1.7 2.7 3.1 4.9 2.6 2.8 2.5 2.6 18/01/03 1.7 1.7 2.5 2.8 2.5 20/01/03 1.8 1.8 3.5 2.9 3.0 3.4 2.5 3.5 6.1 21/01/03 1.4 1.4 2.6 2.4 2.5 4.3 4.2 2.6 3.2 22/01/03 2.1 2.1 3.0 3.4 3.7 3.0 3.9 3.5 3.1 23/01/03 2.1 2.1 3.3 4.9 3.1 6.8 3.3 3.2 3.3 24/01/03 1.9 1.9 2.6 2.8 2.6 3.0 2.7 3.2 2.6
Table 6: Results of the comparison of the transfer cells of group 2.
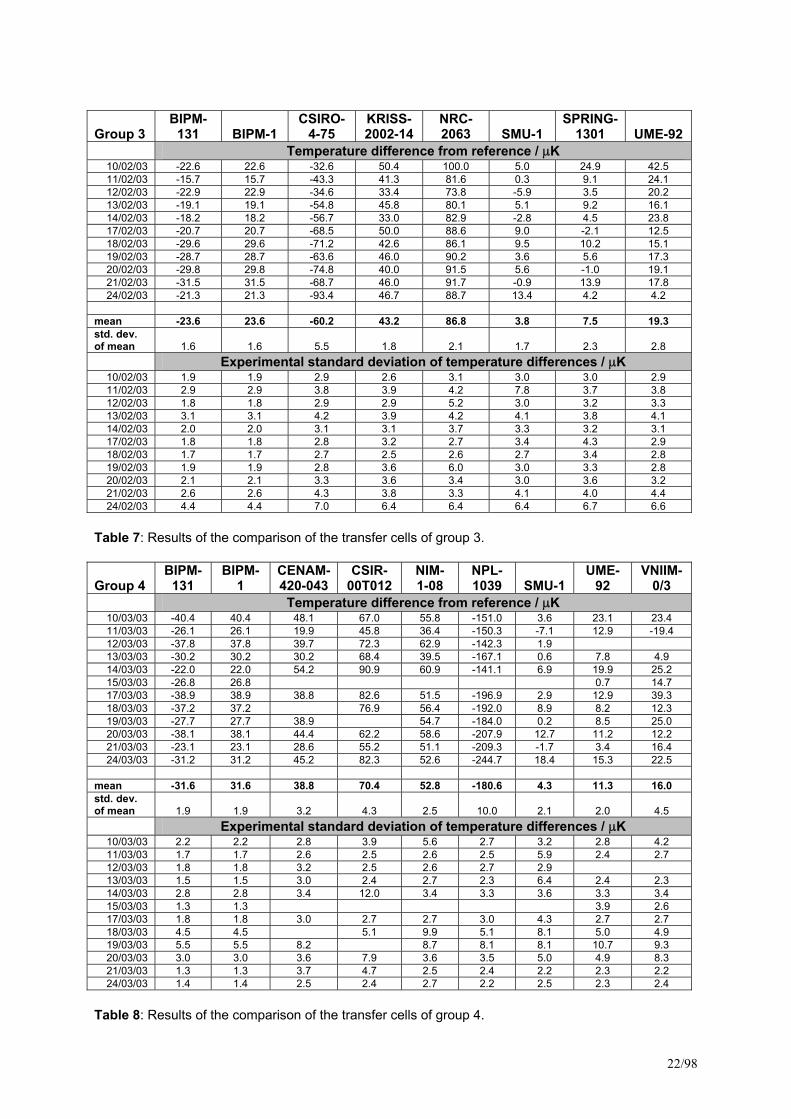
22/98
Group 3
BIPM-131 BIPM-1
CSIRO-4-75
KRISS-2002-14
NRC-2063 SMU-1
SPRING-1301 UME-92
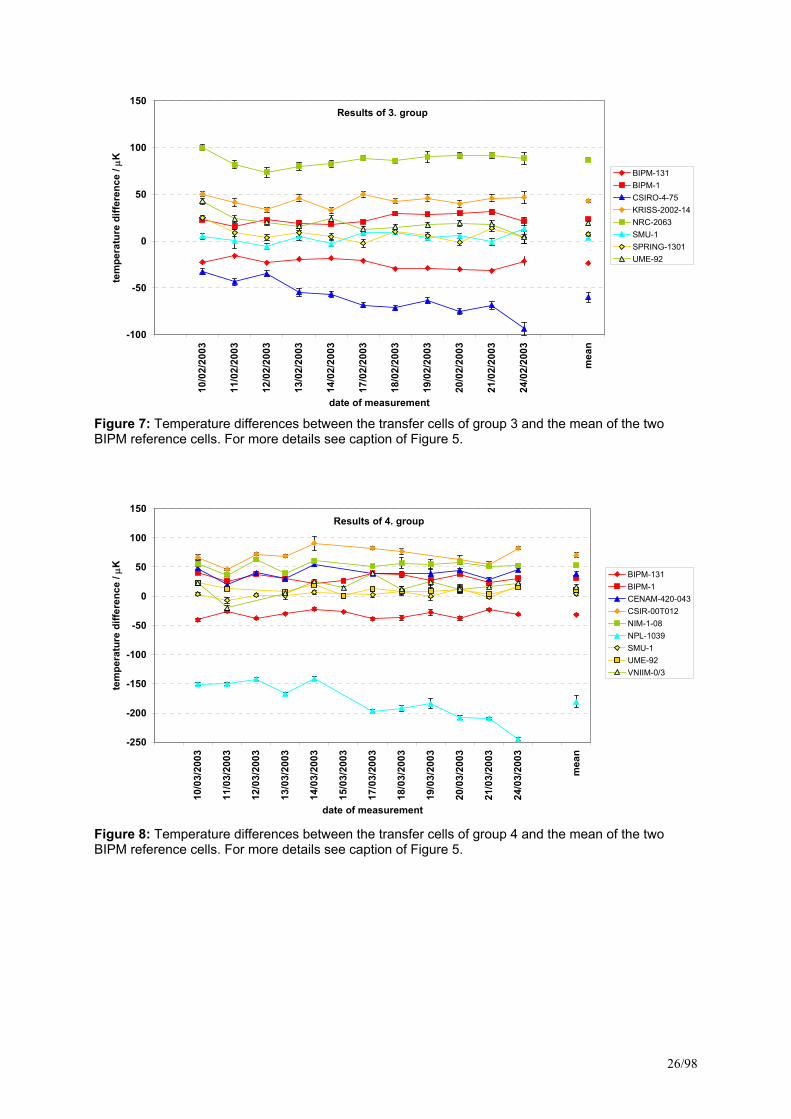
Temperature difference from reference / µK 10/02/03 -22.6 22.6 -32.6 50.4 100.0 5.0 24.9 42.5 11/02/03 -15.7 15.7 -43.3 41.3 81.6 0.3 9.1 24.1 12/02/03 -22.9 22.9 -34.6 33.4 73.8 -5.9 3.5 20.2 13/02/03 -19.1 19.1 -54.8 45.8 80.1 5.1 9.2 16.1 14/02/03 -18.2 18.2 -56.7 33.0 82.9 -2.8 4.5 23.8 17/02/03 -20.7 20.7 -68.5 50.0 88.6 9.0 -2.1 12.5 18/02/03 -29.6 29.6 -71.2 42.6 86.1 9.5 10.2 15.1 19/02/03 -28.7 28.7 -63.6 46.0 90.2 3.6 5.6 17.3 20/02/03 -29.8 29.8 -74.8 40.0 91.5 5.6 -1.0 19.1 21/02/03 -31.5 31.5 -68.7 46.0 91.7 -0.9 13.9 17.8 24/02/03 -21.3 21.3 -93.4 46.7 88.7 13.4 4.2 4.2
mean -23.6 23.6 -60.2 43.2 86.8 3.8 7.5 19.3 std. dev. of mean 1.6 1.6 5.5 1.8 2.1 1.7 2.3 2.8
Experimental standard deviation of temperature differences / µK 10/02/03 1.9 1.9 2.9 2.6 3.1 3.0 3.0 2.9 11/02/03 2.9 2.9 3.8 3.9 4.2 7.8 3.7 3.8 12/02/03 1.8 1.8 2.9 2.9 5.2 3.0 3.2 3.3 13/02/03 3.1 3.1 4.2 3.9 4.2 4.1 3.8 4.1 14/02/03 2.0 2.0 3.1 3.1 3.7 3.3 3.2 3.1 17/02/03 1.8 1.8 2.8 3.2 2.7 3.4 4.3 2.9 18/02/03 1.7 1.7 2.7 2.5 2.6 2.7 3.4 2.8 19/02/03 1.9 1.9 2.8 3.6 6.0 3.0 3.3 2.8 20/02/03 2.1 2.1 3.3 3.6 3.4 3.0 3.6 3.2 21/02/03 2.6 2.6 4.3 3.8 3.3 4.1 4.0 4.4 24/02/03 4.4 4.4 7.0 6.4 6.4 6.4 6.7 6.6
Table 7: Results of the comparison of the transfer cells of group 3. Group 4
BIPM-131
BIPM-1
CENAM-420-043
CSIR-00T012
NIM- 1-08
NPL-1039 SMU-1
UME-92
VNIIM-0/3
Temperature difference from reference / µK 10/03/03 -40.4 40.4 48.1 67.0 55.8 -151.0 3.6 23.1 23.4 11/03/03 -26.1 26.1 19.9 45.8 36.4 -150.3 -7.1 12.9 -19.4 12/03/03 -37.8 37.8 39.7 72.3 62.9 -142.3 1.9 13/03/03 -30.2 30.2 30.2 68.4 39.5 -167.1 0.6 7.8 4.9 14/03/03 -22.0 22.0 54.2 90.9 60.9 -141.1 6.9 19.9 25.2 15/03/03 -26.8 26.8 0.7 14.7 17/03/03 -38.9 38.9 38.8 82.6 51.5 -196.9 2.9 12.9 39.3 18/03/03 -37.2 37.2 76.9 56.4 -192.0 8.9 8.2 12.3 19/03/03 -27.7 27.7 38.9 54.7 -184.0 0.2 8.5 25.0 20/03/03 -38.1 38.1 44.4 62.2 58.6 -207.9 12.7 11.2 12.2 21/03/03 -23.1 23.1 28.6 55.2 51.1 -209.3 -1.7 3.4 16.4 24/03/03 -31.2 31.2 45.2 82.3 52.6 -244.7 18.4 15.3 22.5
mean -31.6 31.6 38.8 70.4 52.8 -180.6 4.3 11.3 16.0 std. dev. of mean 1.9 1.9 3.2 4.3 2.5 10.0 2.1 2.0 4.5
Experimental standard deviation of temperature differences / µK 10/03/03 2.2 2.2 2.8 3.9 5.6 2.7 3.2 2.8 4.2 11/03/03 1.7 1.7 2.6 2.5 2.6 2.5 5.9 2.4 2.7 12/03/03 1.8 1.8 3.2 2.5 2.6 2.7 2.9 13/03/03 1.5 1.5 3.0 2.4 2.7 2.3 6.4 2.4 2.3 14/03/03 2.8 2.8 3.4 12.0 3.4 3.3 3.6 3.3 3.4 15/03/03 1.3 1.3 3.9 2.6 17/03/03 1.8 1.8 3.0 2.7 2.7 3.0 4.3 2.7 2.7 18/03/03 4.5 4.5 5.1 9.9 5.1 8.1 5.0 4.9 19/03/03 5.5 5.5 8.2 8.7 8.1 8.1 10.7 9.3 20/03/03 3.0 3.0 3.6 7.9 3.6 3.5 5.0 4.9 8.3 21/03/03 1.3 1.3 3.7 4.7 2.5 2.4 2.2 2.3 2.2 24/03/03 1.4 1.4 2.5 2.4 2.7 2.2 2.5 2.3 2.4
Table 8: Results of the comparison of the transfer cells of group 4.
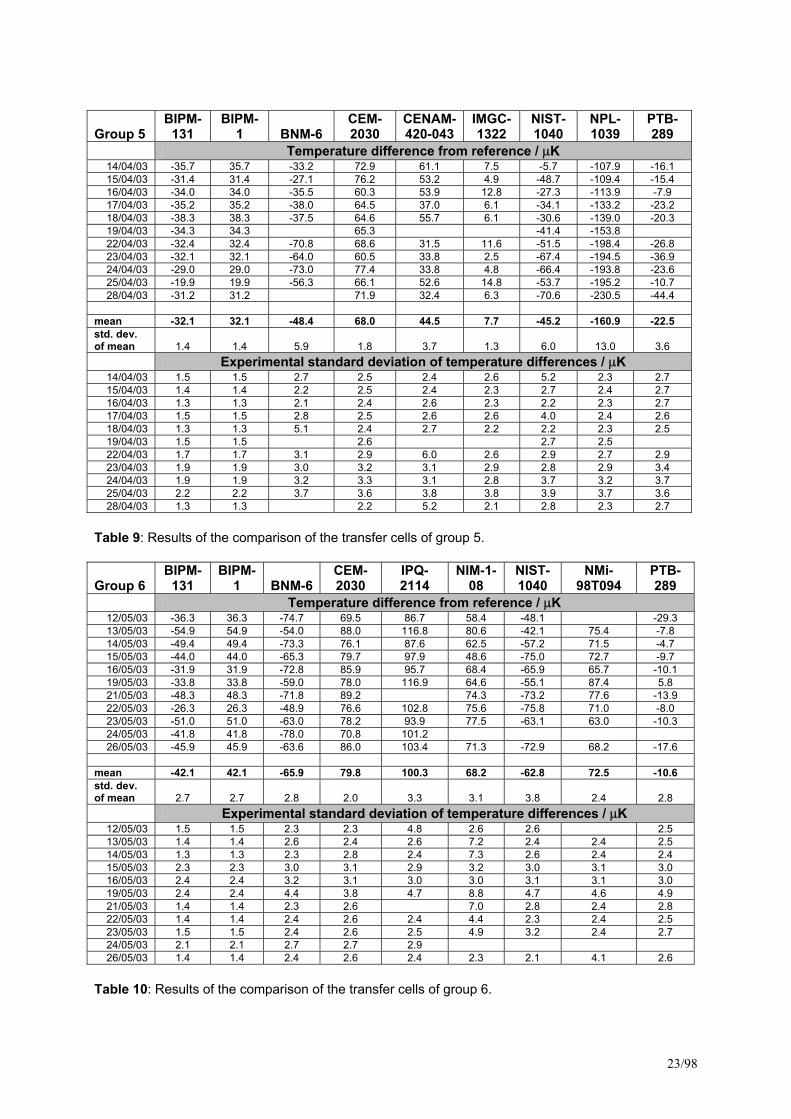
23/98
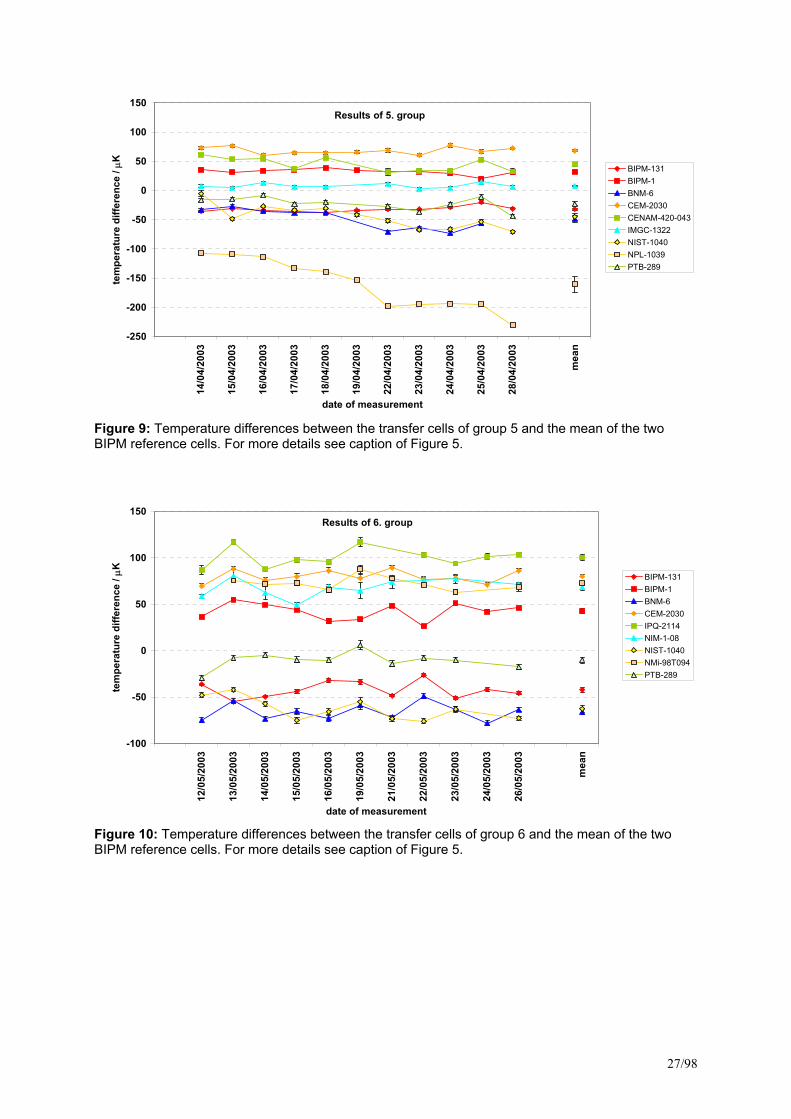
Group 5
BIPM-131
BIPM-1 BNM-6
CEM-2030
CENAM-420-043
IMGC-1322
NIST-1040
NPL-1039
PTB-289
Temperature difference from reference / µK 14/04/03 -35.7 35.7 -33.2 72.9 61.1 7.5 -5.7 -107.9 -16.1 15/04/03 -31.4 31.4 -27.1 76.2 53.2 4.9 -48.7 -109.4 -15.4 16/04/03 -34.0 34.0 -35.5 60.3 53.9 12.8 -27.3 -113.9 -7.9 17/04/03 -35.2 35.2 -38.0 64.5 37.0 6.1 -34.1 -133.2 -23.2 18/04/03 -38.3 38.3 -37.5 64.6 55.7 6.1 -30.6 -139.0 -20.3 19/04/03 -34.3 34.3 65.3 -41.4 -153.8 22/04/03 -32.4 32.4 -70.8 68.6 31.5 11.6 -51.5 -198.4 -26.8 23/04/03 -32.1 32.1 -64.0 60.5 33.8 2.5 -67.4 -194.5 -36.9 24/04/03 -29.0 29.0 -73.0 77.4 33.8 4.8 -66.4 -193.8 -23.6 25/04/03 -19.9 19.9 -56.3 66.1 52.6 14.8 -53.7 -195.2 -10.7 28/04/03 -31.2 31.2 71.9 32.4 6.3 -70.6 -230.5 -44.4
mean -32.1 32.1 -48.4 68.0 44.5 7.7 -45.2 -160.9 -22.5 std. dev. of mean 1.4 1.4 5.9 1.8 3.7 1.3 6.0 13.0 3.6
Experimental standard deviation of temperature differences / µK 14/04/03 1.5 1.5 2.7 2.5 2.4 2.6 5.2 2.3 2.7 15/04/03 1.4 1.4 2.2 2.5 2.4 2.3 2.7 2.4 2.7 16/04/03 1.3 1.3 2.1 2.4 2.6 2.3 2.2 2.3 2.7 17/04/03 1.5 1.5 2.8 2.5 2.6 2.6 4.0 2.4 2.6 18/04/03 1.3 1.3 5.1 2.4 2.7 2.2 2.2 2.3 2.5 19/04/03 1.5 1.5 2.6 2.7 2.5 22/04/03 1.7 1.7 3.1 2.9 6.0 2.6 2.9 2.7 2.9 23/04/03 1.9 1.9 3.0 3.2 3.1 2.9 2.8 2.9 3.4 24/04/03 1.9 1.9 3.2 3.3 3.1 2.8 3.7 3.2 3.7 25/04/03 2.2 2.2 3.7 3.6 3.8 3.8 3.9 3.7 3.6 28/04/03 1.3 1.3 2.2 5.2 2.1 2.8 2.3 2.7
Table 9: Results of the comparison of the transfer cells of group 5. Group 6
BIPM-131
BIPM-1 BNM-6
CEM-2030
IPQ-2114
NIM-1-08
NIST-1040
NMi-98T094
PTB-289
Temperature difference from reference / µK 12/05/03 -36.3 36.3 -74.7 69.5 86.7 58.4 -48.1 -29.3 13/05/03 -54.9 54.9 -54.0 88.0 116.8 80.6 -42.1 75.4 -7.8 14/05/03 -49.4 49.4 -73.3 76.1 87.6 62.5 -57.2 71.5 -4.7 15/05/03 -44.0 44.0 -65.3 79.7 97.9 48.6 -75.0 72.7 -9.7 16/05/03 -31.9 31.9 -72.8 85.9 95.7 68.4 -65.9 65.7 -10.1 19/05/03 -33.8 33.8 -59.0 78.0 116.9 64.6 -55.1 87.4 5.8 21/05/03 -48.3 48.3 -71.8 89.2 74.3 -73.2 77.6 -13.9 22/05/03 -26.3 26.3 -48.9 76.6 102.8 75.6 -75.8 71.0 -8.0 23/05/03 -51.0 51.0 -63.0 78.2 93.9 77.5 -63.1 63.0 -10.3 24/05/03 -41.8 41.8 -78.0 70.8 101.2 26/05/03 -45.9 45.9 -63.6 86.0 103.4 71.3 -72.9 68.2 -17.6
mean -42.1 42.1 -65.9 79.8 100.3 68.2 -62.8 72.5 -10.6 std. dev. of mean 2.7 2.7 2.8 2.0 3.3 3.1 3.8 2.4 2.8
Experimental standard deviation of temperature differences / µK 12/05/03 1.5 1.5 2.3 2.3 4.8 2.6 2.6 2.5 13/05/03 1.4 1.4 2.6 2.4 2.6 7.2 2.4 2.4 2.5 14/05/03 1.3 1.3 2.3 2.8 2.4 7.3 2.6 2.4 2.4 15/05/03 2.3 2.3 3.0 3.1 2.9 3.2 3.0 3.1 3.0 16/05/03 2.4 2.4 3.2 3.1 3.0 3.0 3.1 3.1 3.0 19/05/03 2.4 2.4 4.4 3.8 4.7 8.8 4.7 4.6 4.9 21/05/03 1.4 1.4 2.3 2.6 7.0 2.8 2.4 2.8 22/05/03 1.4 1.4 2.4 2.6 2.4 4.4 2.3 2.4 2.5 23/05/03 1.5 1.5 2.4 2.6 2.5 4.9 3.2 2.4 2.7 24/05/03 2.1 2.1 2.7 2.7 2.9 26/05/03 1.4 1.4 2.4 2.6 2.4 2.3 2.1 4.1 2.6
Table 10: Results of the comparison of the transfer cells of group 6.
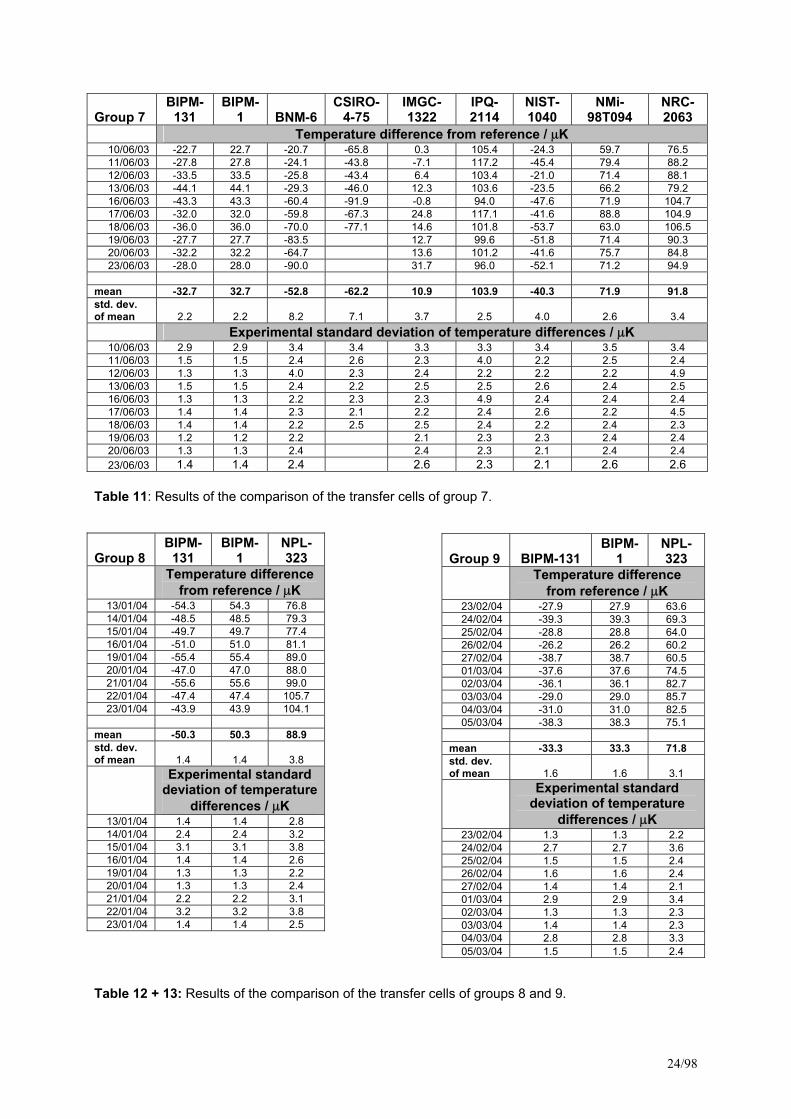
24/98
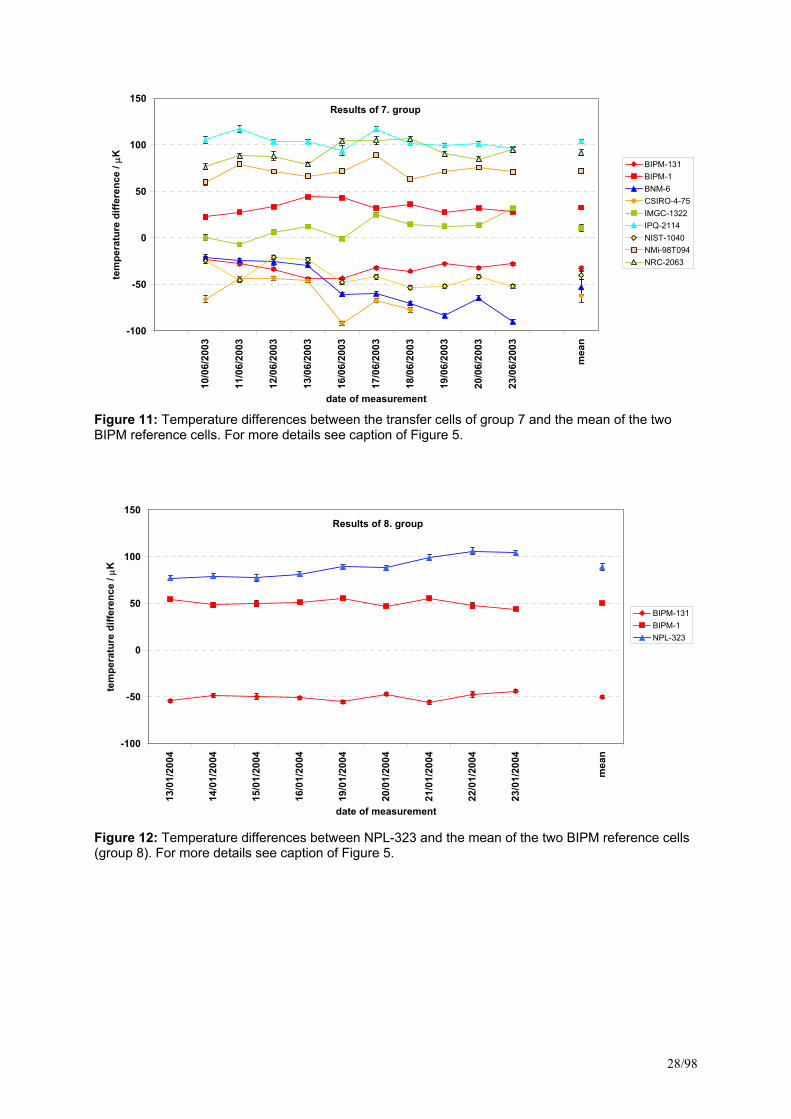
Group 7
BIPM-131
BIPM-1 BNM-6
CSIRO-4-75
IMGC-1322
IPQ-2114
NIST-1040
NMi-98T094
NRC-2063
Temperature difference from reference / µK 10/06/03 -22.7 22.7 -20.7 -65.8 0.3 105.4 -24.3 59.7 76.5 11/06/03 -27.8 27.8 -24.1 -43.8 -7.1 117.2 -45.4 79.4 88.2 12/06/03 -33.5 33.5 -25.8 -43.4 6.4 103.4 -21.0 71.4 88.1 13/06/03 -44.1 44.1 -29.3 -46.0 12.3 103.6 -23.5 66.2 79.2 16/06/03 -43.3 43.3 -60.4 -91.9 -0.8 94.0 -47.6 71.9 104.7 17/06/03 -32.0 32.0 -59.8 -67.3 24.8 117.1 -41.6 88.8 104.9 18/06/03 -36.0 36.0 -70.0 -77.1 14.6 101.8 -53.7 63.0 106.5 19/06/03 -27.7 27.7 -83.5 12.7 99.6 -51.8 71.4 90.3 20/06/03 -32.2 32.2 -64.7 13.6 101.2 -41.6 75.7 84.8 23/06/03 -28.0 28.0 -90.0 31.7 96.0 -52.1 71.2 94.9
mean -32.7 32.7 -52.8 -62.2 10.9 103.9 -40.3 71.9 91.8 std. dev. of mean 2.2 2.2 8.2 7.1 3.7 2.5 4.0 2.6 3.4
Experimental standard deviation of temperature differences / µK 10/06/03 2.9 2.9 3.4 3.4 3.3 3.3 3.4 3.5 3.4 11/06/03 1.5 1.5 2.4 2.6 2.3 4.0 2.2 2.5 2.4 12/06/03 1.3 1.3 4.0 2.3 2.4 2.2 2.2 2.2 4.9 13/06/03 1.5 1.5 2.4 2.2 2.5 2.5 2.6 2.4 2.5 16/06/03 1.3 1.3 2.2 2.3 2.3 4.9 2.4 2.4 2.4 17/06/03 1.4 1.4 2.3 2.1 2.2 2.4 2.6 2.2 4.5 18/06/03 1.4 1.4 2.2 2.5 2.5 2.4 2.2 2.4 2.3 19/06/03 1.2 1.2 2.2 2.1 2.3 2.3 2.4 2.4 20/06/03 1.3 1.3 2.4 2.4 2.3 2.1 2.4 2.4 23/06/03 1.4 1.4 2.4 2.6 2.3 2.1 2.6 2.6
Table 11: Results of the comparison of the transfer cells of group 7.
Table 12 + 13: Results of the comparison of the transfer cells of groups 8 and 9.
Group 9 BIPM-131
BIPM-1
NPL-323
Temperature difference
from reference / µK 23/02/04 -27.9 27.9 63.6 24/02/04 -39.3 39.3 69.3 25/02/04 -28.8 28.8 64.0 26/02/04 -26.2 26.2 60.2 27/02/04 -38.7 38.7 60.5 01/03/04 -37.6 37.6 74.5 02/03/04 -36.1 36.1 82.7 03/03/04 -29.0 29.0 85.7 04/03/04 -31.0 31.0 82.5 05/03/04 -38.3 38.3 75.1
mean -33.3 33.3 71.8 std. dev. of mean 1.6 1.6 3.1
Experimental standard deviation of temperature
differences / µK 23/02/04 1.3 1.3 2.2 24/02/04 2.7 2.7 3.6 25/02/04 1.5 1.5 2.4 26/02/04 1.6 1.6 2.4 27/02/04 1.4 1.4 2.1 01/03/04 2.9 2.9 3.4 02/03/04 1.3 1.3 2.3 03/03/04 1.4 1.4 2.3 04/03/04 2.8 2.8 3.3 05/03/04 1.5 1.5 2.4
Group 8
BIPM-131
BIPM-1
NPL-323
Temperature difference
from reference / µK 13/01/04 -54.3 54.3 76.8 14/01/04 -48.5 48.5 79.3 15/01/04 -49.7 49.7 77.4 16/01/04 -51.0 51.0 81.1 19/01/04 -55.4 55.4 89.0 20/01/04 -47.0 47.0 88.0 21/01/04 -55.6 55.6 99.0 22/01/04 -47.4 47.4 105.7 23/01/04 -43.9 43.9 104.1
mean -50.3 50.3 88.9 std. dev. of mean 1.4 1.4 3.8
Experimental standard deviation of temperature
differences / µK 13/01/04 1.4 1.4 2.8 14/01/04 2.4 2.4 3.2 15/01/04 3.1 3.1 3.8 16/01/04 1.4 1.4 2.6 19/01/04 1.3 1.3 2.2 20/01/04 1.3 1.3 2.4 21/01/04 2.2 2.2 3.1 22/01/04 3.2 3.2 3.8 23/01/04 1.4 1.4 2.5
25/98
Results of 1. group
-100
-50
0
50
100
150
09/1
2/20
02
10/1
2/20
02
11/1
2/20
02
12/1
2/20
02
13/1
2/20
02
16/1
2/20
02
17/1
2/20
02
18/1
2/20
02
19/1
2/20
02
20/1
2/20
02
mea
n
date of measurement
tem
pera
ture
diff
eren
ce /
µK
BIPM-131BIPM-1CSIR-00T012CSIRO-4-75MSL-01/02NMIJ-T93-3SPRING-1301
Figure 5: Temperature differences between the transfer cells of group 1 and the mean of the two BIPM reference cells. The BIPM cells are therefore always symmetrically distributed around the zero line. The uncertainty bars, in many cases smaller than the symbols, represent the experimental standard deviation of the measurement results. The points at the right end are the mean values found for each cell, their uncertainty bar is the standard deviation of this mean.
Results of 2. group
-100
-50
0
50
100
150
13/0
1/20
03
14/0
1/20
03
15/0
1/20
03
16/0
1/20
03
17/0
1/20
03
18/0
1/20
03
20/0
1/20
03
21/0
1/20
03
22/0
1/20
03
23/0
1/20
03
24/0
1/20
03
mea
n
date of measurement
tem
pera
ture
diff
eren
ce /
µK BIPM-131BIPM-1CSIR-00T012KRISS-2002-14MSL-01/02NIM-1-08NMIJ-T93-3NRC-2063VNIIM-0/3
Figure 6: Temperature differences between the transfer cells of group 2 and the mean of the two BIPM reference cells. For more details see caption of Figure 5.
26/98
Results of 3. group
-100
-50
0
50
100
150
10/0
2/20
03
11/0
2/20
03
12/0
2/20
03
13/0
2/20
03
14/0
2/20
03
17/0
2/20
03
18/0
2/20
03
19/0
2/20
03
20/0
2/20
03
21/0
2/20
03
24/0
2/20
03
mea
n
date of measurement
tem
pera
ture
diff
eren
ce /
µK
BIPM-131BIPM-1CSIRO-4-75KRISS-2002-14NRC-2063SMU-1SPRING-1301UME-92
Figure 7: Temperature differences between the transfer cells of group 3 and the mean of the two BIPM reference cells. For more details see caption of Figure 5.
Results of 4. group
-250
-200
-150
-100
-50
0
50
100
150
10/0
3/20
03
11/0
3/20
03
12/0
3/20
03
13/0
3/20
03
14/0
3/20
03
15/0
3/20
03
17/0
3/20
03
18/0
3/20
03
19/0
3/20
03
20/0
3/20
03
21/0
3/20
03
24/0
3/20
03
mea
n
date of measurement
tem
pera
ture
diff
eren
ce /
µK BIPM-131BIPM-1CENAM-420-043CSIR-00T012NIM-1-08NPL-1039SMU-1UME-92VNIIM-0/3
Figure 8: Temperature differences between the transfer cells of group 4 and the mean of the two BIPM reference cells. For more details see caption of Figure 5.
27/98
Results of 5. group
-250
-200
-150
-100
-50
0
50
100
150
14/0
4/20
03
15/0
4/20
03
16/0
4/20
03
17/0
4/20
03
18/0
4/20
03
19/0
4/20
03
22/0
4/20
03
23/0
4/20
03
24/0
4/20
03
25/0
4/20
03
28/0
4/20
03
mea
n
date of measurement
tem
pera
ture
diff
eren
ce /
µK BIPM-131BIPM-1BNM-6CEM-2030CENAM-420-043IMGC-1322NIST-1040NPL-1039PTB-289
Figure 9: Temperature differences between the transfer cells of group 5 and the mean of the two BIPM reference cells. For more details see caption of Figure 5.
Results of 6. group
-100
-50
0
50
100
150
12/0
5/20
03
13/0
5/20
03
14/0
5/20
03
15/0
5/20
03
16/0
5/20
03
19/0
5/20
03
21/0
5/20
03
22/0
5/20
03
23/0
5/20
03
24/0
5/20
03
26/0
5/20
03
mea
n
date of measurement
tem
pera
ture
diff
eren
ce /
µK BIPM-131BIPM-1BNM-6CEM-2030IPQ-2114NIM-1-08NIST-1040NMi-98T094PTB-289
Figure 10: Temperature differences between the transfer cells of group 6 and the mean of the two BIPM reference cells. For more details see caption of Figure 5.
28/98
Results of 7. group
-100
-50
0
50
100
150
10/0
6/20
03
11/0
6/20
03
12/0
6/20
03
13/0
6/20
03
16/0
6/20
03
17/0
6/20
03
18/0
6/20
03
19/0
6/20
03
20/0
6/20
03
23/0
6/20
03
mea
n
date of measurement
tem
pera
ture
diff
eren
ce /
µK BIPM-131BIPM-1BNM-6CSIRO-4-75IMGC-1322IPQ-2114NIST-1040NMi-98T094NRC-2063
Figure 11: Temperature differences between the transfer cells of group 7 and the mean of the two BIPM reference cells. For more details see caption of Figure 5.
Results of 8. group
-100
-50
0
50
100
150
13/0
1/20
04
14/0
1/20
04
15/0
1/20
04
16/0
1/20
04
19/0
1/20
04
20/0
1/20
04
21/0
1/20
04
22/0
1/20
04
23/0
1/20
04
mea
n
date of measurement
tem
pera
ture
diff
eren
ce /
µK
BIPM-131BIPM-1NPL-323
Figure 12: Temperature differences between NPL-323 and the mean of the two BIPM reference cells (group 8). For more details see caption of Figure 5.
29/98
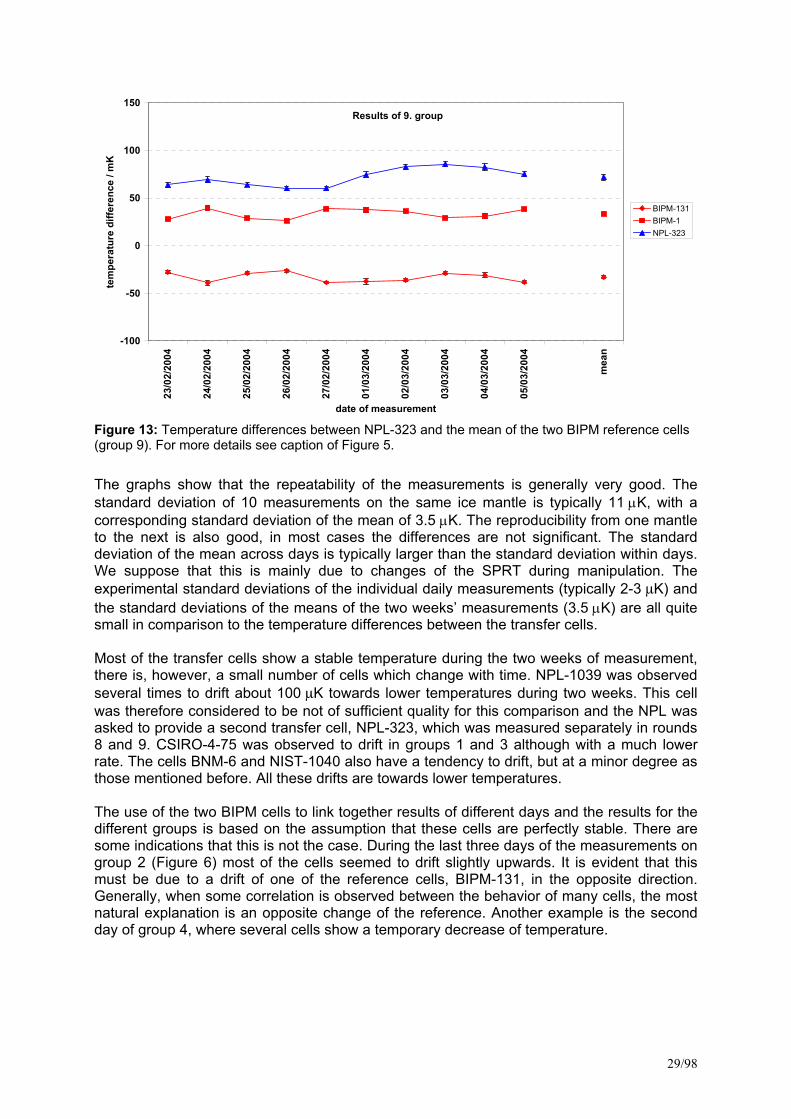
Results of 9. group
-100
-50
0
50
100
150
23/0
2/20
04
24/0
2/20
04
25/0
2/20
04
26/0
2/20
04
27/0
2/20
04
01/0
3/20
04
02/0
3/20
04
03/0
3/20
04
04/0
3/20
04
05/0
3/20
04
mea
n
date of measurement
tem
pera
ture
diff
eren
ce /
mK
BIPM-131BIPM-1NPL-323
Figure 13: Temperature differences between NPL-323 and the mean of the two BIPM reference cells (group 9). For more details see caption of Figure 5.
The graphs show that the repeatability of the measurements is generally very good. The standard deviation of 10 measurements on the same ice mantle is typically 11 µK, with a corresponding standard deviation of the mean of 3.5 µK. The reproducibility from one mantle to the next is also good, in most cases the differences are not significant. The standard deviation of the mean across days is typically larger than the standard deviation within days. We suppose that this is mainly due to changes of the SPRT during manipulation. The experimental standard deviations of the individual daily measurements (typically 2-3 µK) and the standard deviations of the means of the two weeks’ measurements (3.5 µK) are all quite small in comparison to the temperature differences between the transfer cells. Most of the transfer cells show a stable temperature during the two weeks of measurement, there is, however, a small number of cells which change with time. NPL-1039 was observed several times to drift about 100 µK towards lower temperatures during two weeks. This cell was therefore considered to be not of sufficient quality for this comparison and the NPL was asked to provide a second transfer cell, NPL-323, which was measured separately in rounds 8 and 9. CSIRO-4-75 was observed to drift in groups 1 and 3 although with a much lower rate. The cells BNM-6 and NIST-1040 also have a tendency to drift, but at a minor degree as those mentioned before. All these drifts are towards lower temperatures. The use of the two BIPM cells to link together results of different days and the results for the different groups is based on the assumption that these cells are perfectly stable. There are some indications that this is not the case. During the last three days of the measurements on group 2 (Figure 6) most of the cells seemed to drift slightly upwards. It is evident that this must be due to a drift of one of the reference cells, BIPM-131, in the opposite direction. Generally, when some correlation is observed between the behavior of many cells, the most natural explanation is an opposite change of the reference. Another example is the second day of group 4, where several cells show a temporary decrease of temperature.
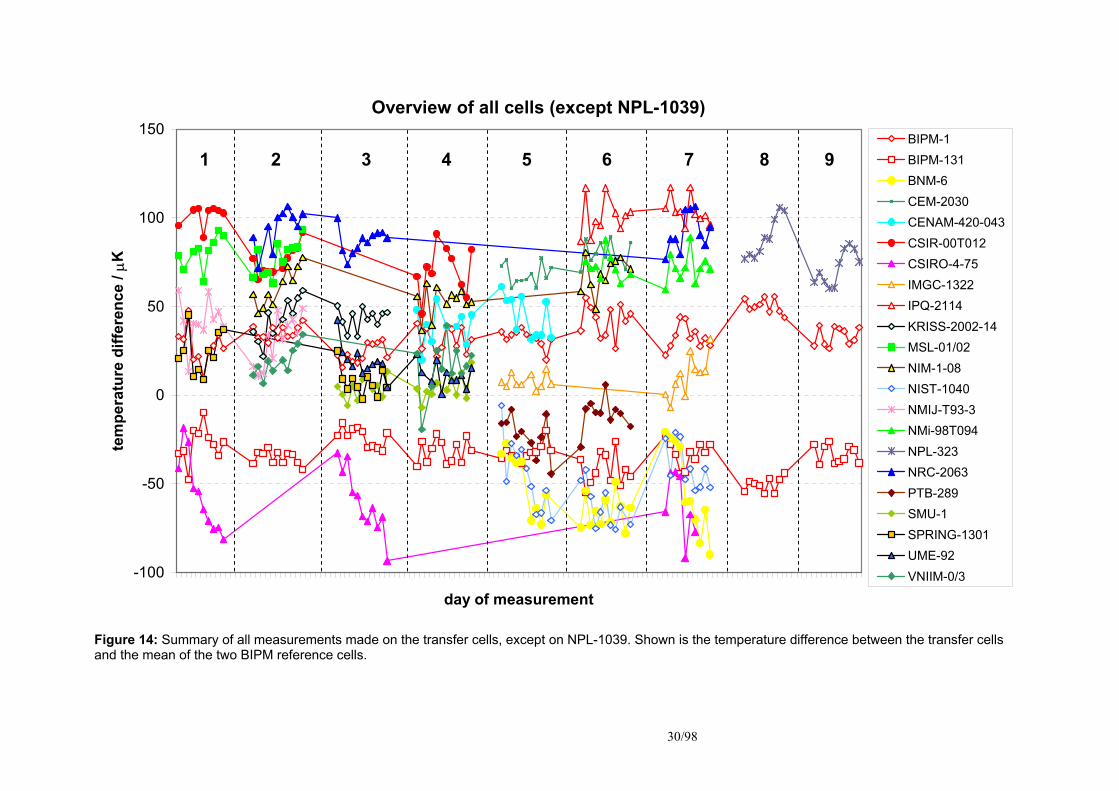
30/98
Overview of all cells (except NPL-1039)
-100
-50
0
50
100
150
day of measurement
tem
pera
ture
diff
eren
ce /
µKBIPM-1BIPM-131BNM-6CEM-2030CENAM-420-043CSIR-00T012CSIRO-4-75IMGC-1322IPQ-2114KRISS-2002-14MSL-01/02NIM-1-08NIST-1040NMIJ-T93-3NMi-98T094NPL-323NRC-2063PTB-289SMU-1SPRING-1301UME-92VNIIM-0/3
1 2 3 4 5 6 7 8 9
Figure 14: Summary of all measurements made on the transfer cells, except on NPL-1039. Shown is the temperature difference between the transfer cells and the mean of the two BIPM reference cells.
31/98
It is therefore questionable if the mean of the two BIPM cells is the best possible choice for a reference. There is no reason to expect that these cells should be more stable than the transfer cells, with the exception of those cells which clearly drift. Therefore, the best technique is to use the information contained in the whole set of cells to construct the most robust reference. This leads to a least-squares-adjustment technique which, instead of assuming perfect stability of two special cells, results in the most stable behavior of all the cells together. This technique and its results are described in the next section.
4.3 Least-squares adjustment The selection of a special cell or group of cells as reference for a large-scale comparison has the advantage of simplicity but is not a natural choice unless it can be argued that these cells have a higher stability as the others. As can be seen from the graphs in the last section most of the transfer cells used for K7 have comparable stability. Therefore the results obtained for the whole set of cells should be used to build a more robust reference. This approach is based on the assumption that each cell can be described by a single temperature which does not change with time. The optimal reference is that which minimizes the sum of the variances of all cells. This reference is found by determining for each day j a temperature offset ∆Tj which is applied to all cells measured that day. The differences between cells obtained during the same day remain unchanged, but the results for successive days are adjusted (to correct for drifts due to imperfections of the equipment) so that the overall stability of the set of cells is optimized. This technique can be applied in two steps. At first, the sum of variances is minimized within each group. The groups can then be linked together by the same technique, because each pair of groups has more cells in common than only the two BIPM cells. An exception are the measurements of groups 8 and 9, where the cell NPL-323 is linked to the others only by the BIPM cells. The mathematical formulation is based on the well-known χ2-formalism which we show below in its application to the results of a group of cells. The application to the link between the groups is straightforward. Given the results jiT , for the temperature difference of cell i on day j from the reference used
so far (the mean of BIPM-1 and BIPM-131), we introduce corrected temperatures ', jiT by the
definition
jjiji TTT ∆+≡ ,', and ∑
=
=N
jji
ii T
NT
1
',
' 1, N = number of measurement days in group, Ni =
number of measurements on cell i. Occasionally a cell was not measured on each day. If cell i was not measured on day j, '
, jiT is taken as zero. 'iT is the mean of all corrected
measurements made on cell i. The sum of variances to be minimized is
( )∑∑= =
−=M
i
N
jijiji TTw
1 1
2'',,
2χ , M = number of cells, N = number of measurement days for this
group,
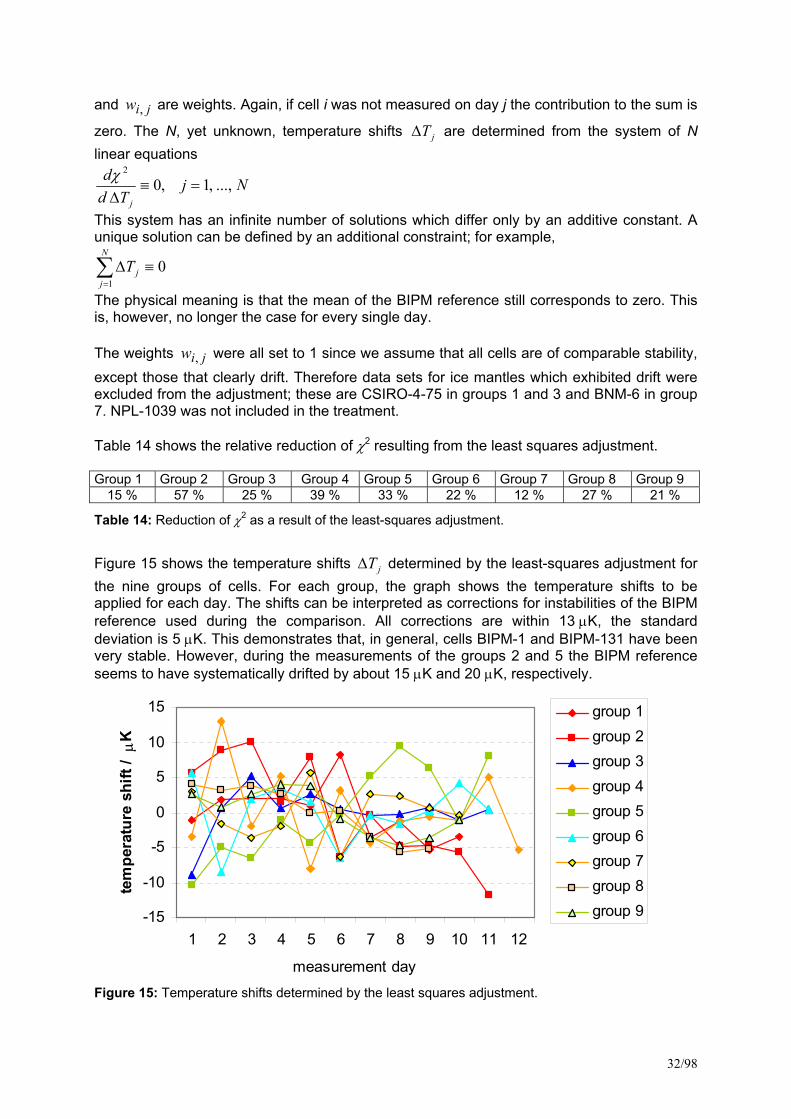
32/98
and jiw , are weights. Again, if cell i was not measured on day j the contribution to the sum is
zero. The N, yet unknown, temperature shifts jT∆ are determined from the system of N linear equations
NjTd
d
j
...,,1,02
=≡∆χ
This system has an infinite number of solutions which differ only by an additive constant. A unique solution can be defined by an additional constraint; for example,
∑=
≡∆N
jjT
10
The physical meaning is that the mean of the BIPM reference still corresponds to zero. This is, however, no longer the case for every single day. The weights jiw , were all set to 1 since we assume that all cells are of comparable stability, except those that clearly drift. Therefore data sets for ice mantles which exhibited drift were excluded from the adjustment; these are CSIRO-4-75 in groups 1 and 3 and BNM-6 in group 7. NPL-1039 was not included in the treatment. Table 14 shows the relative reduction of χ2 resulting from the least squares adjustment. Group 1 Group 2 Group 3 Group 4 Group 5 Group 6 Group 7 Group 8 Group 9
15 % 57 % 25 % 39 % 33 % 22 % 12 % 27 % 21 %
Table 14: Reduction of χ2 as a result of the least-squares adjustment.
Figure 15 shows the temperature shifts jT∆ determined by the least-squares adjustment for the nine groups of cells. For each group, the graph shows the temperature shifts to be applied for each day. The shifts can be interpreted as corrections for instabilities of the BIPM reference used during the comparison. All corrections are within 13 µK, the standard deviation is 5 µK. This demonstrates that, in general, cells BIPM-1 and BIPM-131 have been very stable. However, during the measurements of the groups 2 and 5 the BIPM reference seems to have systematically drifted by about 15 µK and 20 µK, respectively.
-15
-10
-5
0
5
10
15
1 2 3 4 5 6 7 8 9 10 11 12
measurement day
tem
pera
ture
shi
ft /
µK
group 1group 2group 3group 4group 5group 6group 7group 8group 9
Figure 15: Temperature shifts determined by the least squares adjustment.
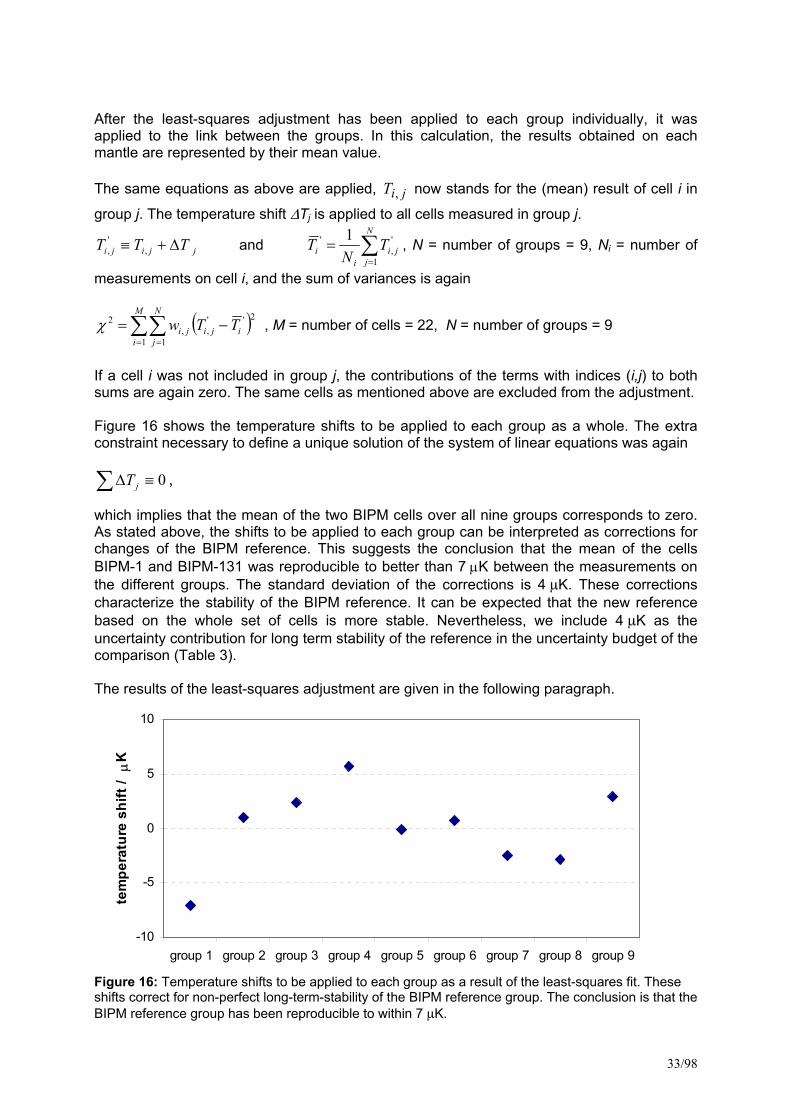
33/98
After the least-squares adjustment has been applied to each group individually, it was applied to the link between the groups. In this calculation, the results obtained on each mantle are represented by their mean value. The same equations as above are applied, jiT , now stands for the (mean) result of cell i in
group j. The temperature shift ∆Tj is applied to all cells measured in group j.
jjiji TTT ∆+≡ ,', and ∑
=
=N
jji
ii T
NT
1
',
' 1, N = number of groups = 9, Ni = number of
measurements on cell i, and the sum of variances is again
( )∑∑= =
−=M
i
N
jijiji TTw
1 1
2'',,
2χ , M = number of cells = 22, N = number of groups = 9
If a cell i was not included in group j, the contributions of the terms with indices (i,j) to both sums are again zero. The same cells as mentioned above are excluded from the adjustment. Figure 16 shows the temperature shifts to be applied to each group as a whole. The extra constraint necessary to define a unique solution of the system of linear equations was again ∑ ≡∆ 0jT ,
which implies that the mean of the two BIPM cells over all nine groups corresponds to zero. As stated above, the shifts to be applied to each group can be interpreted as corrections for changes of the BIPM reference. This suggests the conclusion that the mean of the cells BIPM-1 and BIPM-131 was reproducible to better than 7 µK between the measurements on the different groups. The standard deviation of the corrections is 4 µK. These corrections characterize the stability of the BIPM reference. It can be expected that the new reference based on the whole set of cells is more stable. Nevertheless, we include 4 µK as the uncertainty contribution for long term stability of the reference in the uncertainty budget of the comparison (Table 3). The results of the least-squares adjustment are given in the following paragraph.
-10
-5
0
5
10
group 1 group 2 group 3 group 4 group 5 group 6 group 7 group 8 group 9
tem
pera
ture
shi
ft /
µK
Figure 16: Temperature shifts to be applied to each group as a result of the least-squares fit. These shifts correct for non-perfect long-term-stability of the BIPM reference group. The conclusion is that the BIPM reference group has been reproducible to within 7 µK.
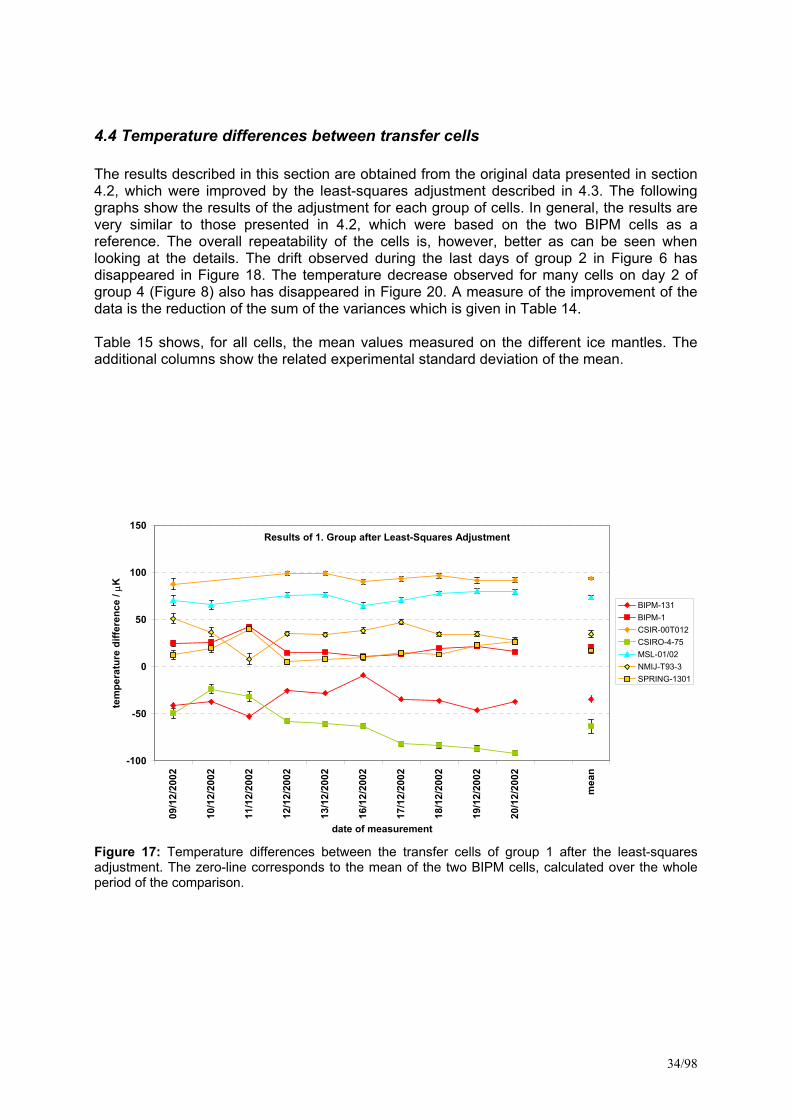
34/98
4.4 Temperature differences between transfer cells The results described in this section are obtained from the original data presented in section 4.2, which were improved by the least-squares adjustment described in 4.3. The following graphs show the results of the adjustment for each group of cells. In general, the results are very similar to those presented in 4.2, which were based on the two BIPM cells as a reference. The overall repeatability of the cells is, however, better as can be seen when looking at the details. The drift observed during the last days of group 2 in Figure 6 has disappeared in Figure 18. The temperature decrease observed for many cells on day 2 of group 4 (Figure 8) also has disappeared in Figure 20. A measure of the improvement of the data is the reduction of the sum of the variances which is given in Table 14. Table 15 shows, for all cells, the mean values measured on the different ice mantles. The additional columns show the related experimental standard deviation of the mean.
Results of 1. Group after Least-Squares Adjustment
-100
-50
0
50
100
150
09/1
2/20
02
10/1
2/20
02
11/1
2/20
02
12/1
2/20
02
13/1
2/20
02
16/1
2/20
02
17/1
2/20
02
18/1
2/20
02
19/1
2/20
02
20/1
2/20
02
mea
n
date of measurement
tem
pera
ture
diff
eren
ce /
µK
BIPM-131BIPM-1CSIR-00T012CSIRO-4-75MSL-01/02NMIJ-T93-3SPRING-1301
Figure 17: Temperature differences between the transfer cells of group 1 after the least-squares adjustment. The zero-line corresponds to the mean of the two BIPM cells, calculated over the whole period of the comparison.
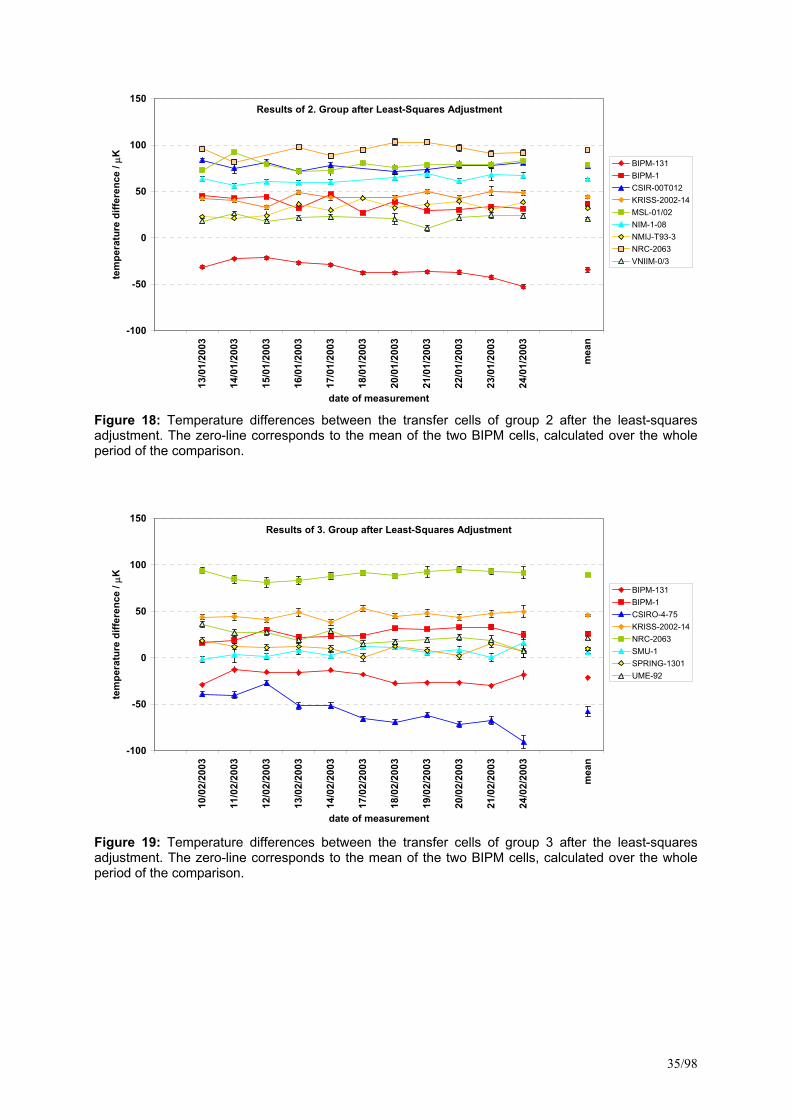
35/98
Results of 2. Group after Least-Squares Adjustment
-100
-50
0
50
100
150
13/0
1/20
03
14/0
1/20
03
15/0
1/20
03
16/0
1/20
03
17/0
1/20
03
18/0
1/20
03
20/0
1/20
03
21/0
1/20
03
22/0
1/20
03
23/0
1/20
03
24/0
1/20
03
mea
n
date of measurement
tem
pera
ture
diff
eren
ce /
µK BIPM-131BIPM-1CSIR-00T012KRISS-2002-14MSL-01/02NIM-1-08NMIJ-T93-3NRC-2063VNIIM-0/3
Figure 18: Temperature differences between the transfer cells of group 2 after the least-squares adjustment. The zero-line corresponds to the mean of the two BIPM cells, calculated over the whole period of the comparison.
Results of 3. Group after Least-Squares Adjustment
-100
-50
0
50
100
150
10/0
2/20
03
11/0
2/20
03
12/0
2/20
03
13/0
2/20
03
14/0
2/20
03
17/0
2/20
03
18/0
2/20
03
19/0
2/20
03
20/0
2/20
03
21/0
2/20
03
24/0
2/20
03
mea
n
date of measurement
tem
pera
ture
diff
eren
ce /
µK
BIPM-131BIPM-1CSIRO-4-75KRISS-2002-14NRC-2063SMU-1SPRING-1301UME-92
Figure 19: Temperature differences between the transfer cells of group 3 after the least-squares adjustment. The zero-line corresponds to the mean of the two BIPM cells, calculated over the whole period of the comparison.
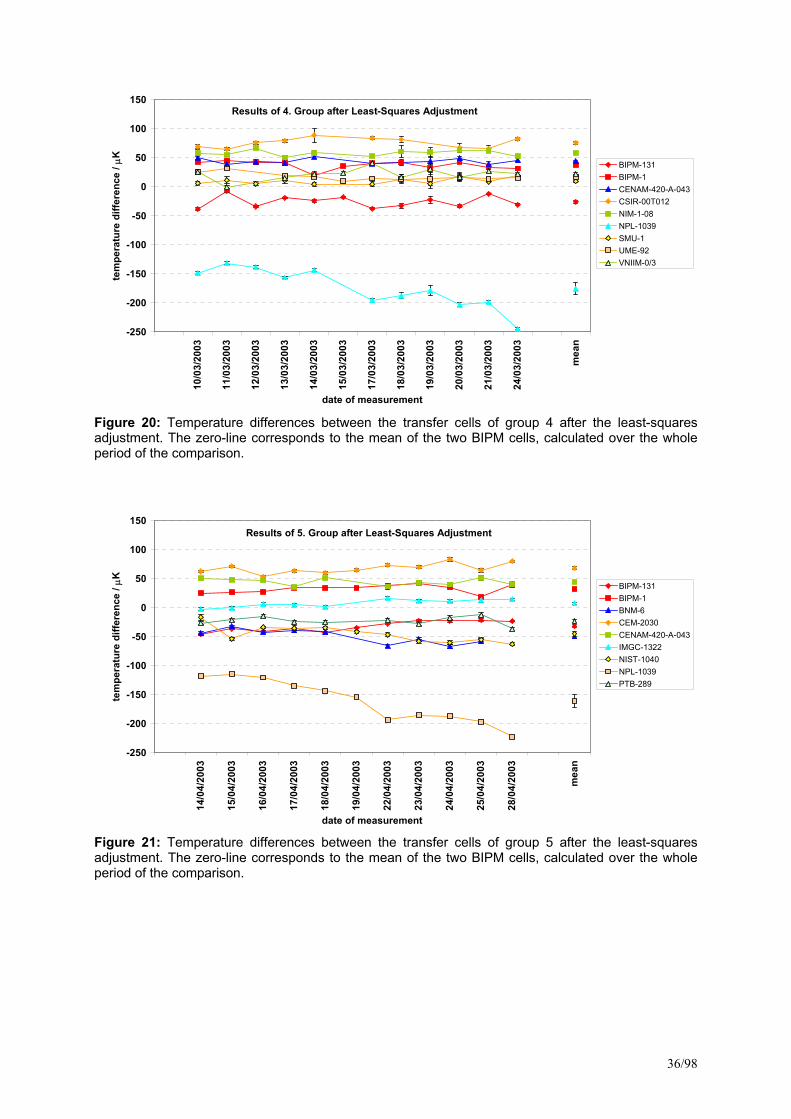
36/98
Results of 4. Group after Least-Squares Adjustment
-250
-200
-150
-100
-50
0
50
100
150
10/0
3/20
03
11/0
3/20
03
12/0
3/20
03
13/0
3/20
03
14/0
3/20
03
15/0
3/20
03
17/0
3/20
03
18/0
3/20
03
19/0
3/20
03
20/0
3/20
03
21/0
3/20
03
24/0
3/20
03
mea
n
date of measurement
tem
pera
ture
diff
eren
ce /
µK BIPM-131BIPM-1CENAM-420-A-043CSIR-00T012NIM-1-08NPL-1039SMU-1UME-92VNIIM-0/3
Figure 20: Temperature differences between the transfer cells of group 4 after the least-squares adjustment. The zero-line corresponds to the mean of the two BIPM cells, calculated over the whole period of the comparison.
Results of 5. Group after Least-Squares Adjustment
-250
-200
-150
-100
-50
0
50
100
150
14/0
4/20
03
15/0
4/20
03
16/0
4/20
03
17/0
4/20
03
18/0
4/20
03
19/0
4/20
03
22/0
4/20
03
23/0
4/20
03
24/0
4/20
03
25/0
4/20
03
28/0
4/20
03
mea
n
date of measurement
tem
pera
ture
diff
eren
ce /
µK BIPM-131BIPM-1BNM-6CEM-2030CENAM-420-A-043IMGC-1322NIST-1040NPL-1039PTB-289
Figure 21: Temperature differences between the transfer cells of group 5 after the least-squares adjustment. The zero-line corresponds to the mean of the two BIPM cells, calculated over the whole period of the comparison.
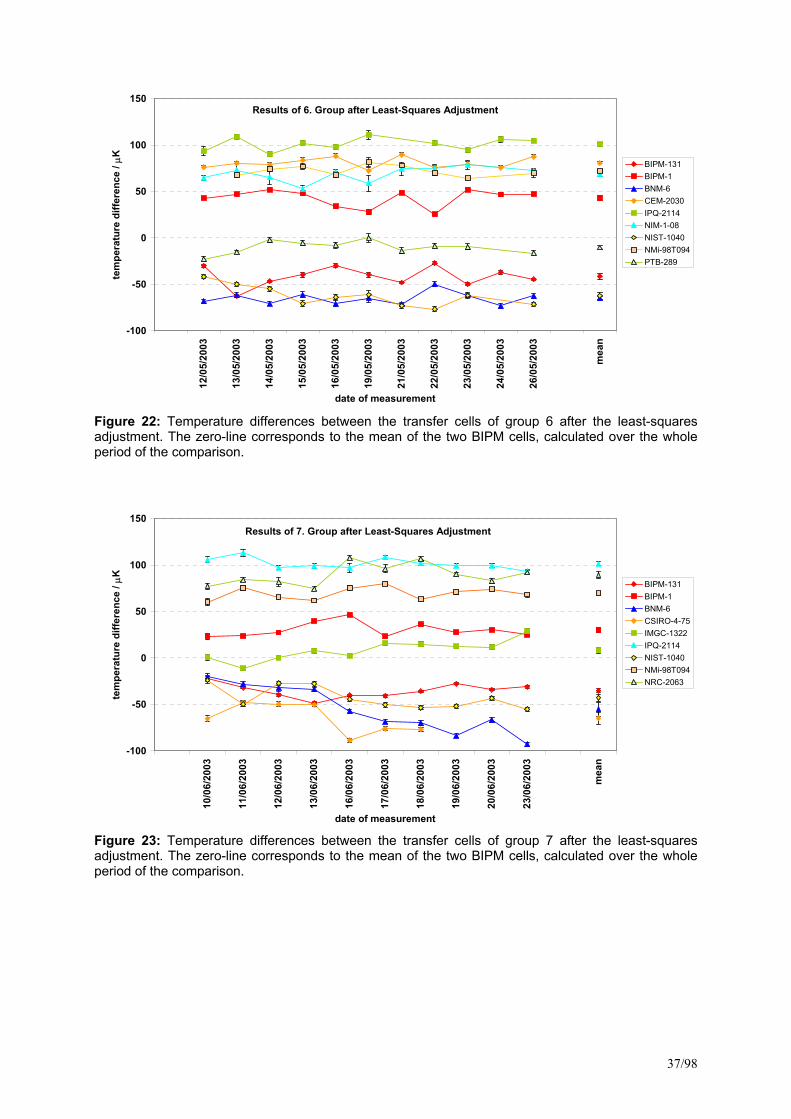
37/98
Results of 6. Group after Least-Squares Adjustment
-100
-50
0
50
100
150
12/0
5/20
03
13/0
5/20
03
14/0
5/20
03
15/0
5/20
03
16/0
5/20
03
19/0
5/20
03
21/0
5/20
03
22/0
5/20
03
23/0
5/20
03
24/0
5/20
03
26/0
5/20
03
mea
n
date of measurement
tem
pera
ture
diff
eren
ce /
µK BIPM-131BIPM-1BNM-6CEM-2030IPQ-2114NIM-1-08NIST-1040NMi-98T094PTB-289
Figure 22: Temperature differences between the transfer cells of group 6 after the least-squares adjustment. The zero-line corresponds to the mean of the two BIPM cells, calculated over the whole period of the comparison.
Results of 7. Group after Least-Squares Adjustment
-100
-50
0
50
100
150
10/0
6/20
03
11/0
6/20
03
12/0
6/20
03
13/0
6/20
03
16/0
6/20
03
17/0
6/20
03
18/0
6/20
03
19/0
6/20
03
20/0
6/20
03
23/0
6/20
03
mea
n
date of measurement
tem
pera
ture
diff
eren
ce /
µK BIPM-131BIPM-1BNM-6CSIRO-4-75IMGC-1322IPQ-2114NIST-1040NMi-98T094NRC-2063
Figure 23: Temperature differences between the transfer cells of group 7 after the least-squares adjustment. The zero-line corresponds to the mean of the two BIPM cells, calculated over the whole period of the comparison.
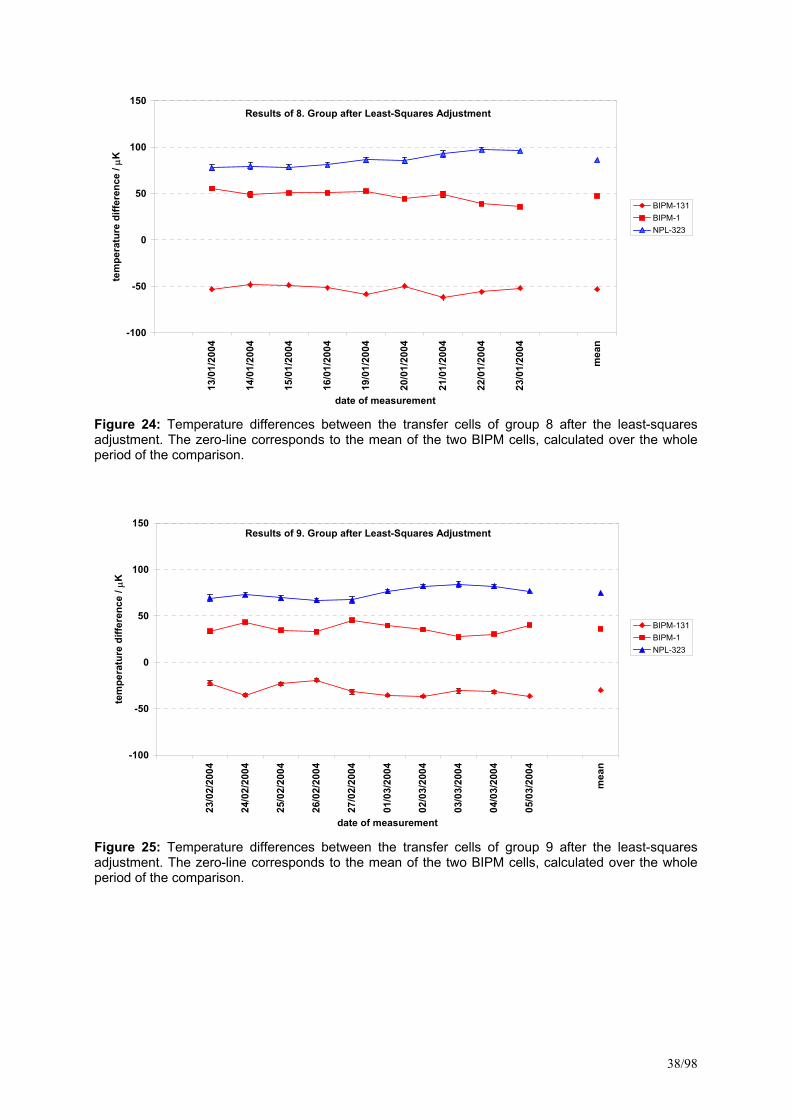
38/98
Results of 8. Group after Least-Squares Adjustment
-100
-50
0
50
100
150
13/0
1/20
04
14/0
1/20
04
15/0
1/20
04
16/0
1/20
04
19/0
1/20
04
20/0
1/20
04
21/0
1/20
04
22/0
1/20
04
23/0
1/20
04
mea
n
date of measurement
tem
pera
ture
diff
eren
ce /
µK
BIPM-131BIPM-1NPL-323
Figure 24: Temperature differences between the transfer cells of group 8 after the least-squares adjustment. The zero-line corresponds to the mean of the two BIPM cells, calculated over the whole period of the comparison.
Results of 9. Group after Least-Squares Adjustment
-100
-50
0
50
100
150
23/0
2/20
04
24/0
2/20
04
25/0
2/20
04
26/0
2/20
04
27/0
2/20
04
01/0
3/20
04
02/0
3/20
04
03/0
3/20
04
04/0
3/20
04
05/0
3/20
04
mea
n
date of measurement
tem
pera
ture
diff
eren
ce /
µK
BIPM-131BIPM-1NPL-323
Figure 25: Temperature differences between the transfer cells of group 9 after the least-squares adjustment. The zero-line corresponds to the mean of the two BIPM cells, calculated over the whole period of the comparison.
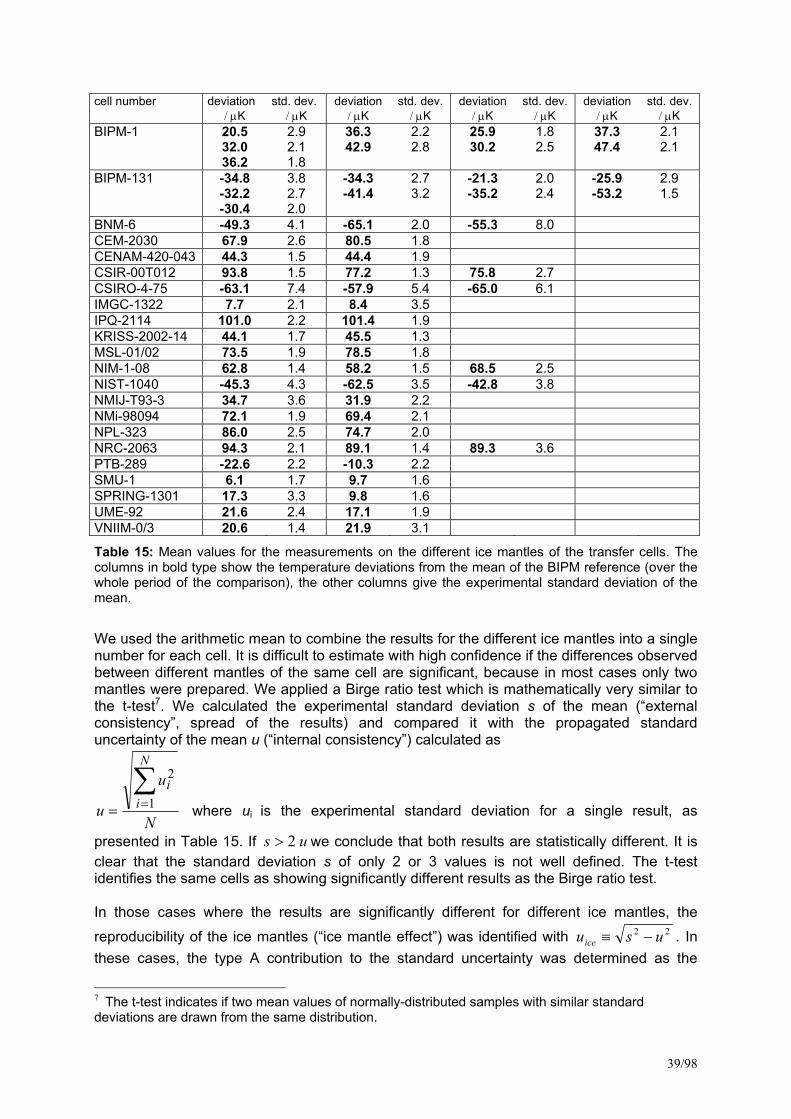
39/98
cell number deviation std. dev. deviation std. dev. deviation std. dev. deviation std. dev. / µK / µK / µK / µK / µK / µK / µK / µK BIPM-1 20.5 2.9 36.3 2.2 25.9 1.8 37.3 2.1 32.0
36.2 2.1 1.8
42.9 2.8 30.2 2.5 47.4
2.1
BIPM-131 -34.8 3.8 -34.3 2.7 -21.3 2.0 -25.9 2.9 -32.2
-30.4 2.7 2.0
-41.4 3.2 -35.2 2.4 -53.2
1.5
BNM-6 -49.3 4.1 -65.1 2.0 -55.3 8.0 CEM-2030 67.9 2.6 80.5 1.8 CENAM-420-043 44.3 1.5 44.4 1.9 CSIR-00T012 93.8 1.5 77.2 1.3 75.8 2.7 CSIRO-4-75 -63.1 7.4 -57.9 5.4 -65.0 6.1 IMGC-1322 7.7 2.1 8.4 3.5 IPQ-2114 101.0 2.2 101.4 1.9 KRISS-2002-14 44.1 1.7 45.5 1.3 MSL-01/02 73.5 1.9 78.5 1.8 NIM-1-08 62.8 1.4 58.2 1.5 68.5 2.5 NIST-1040 -45.3 4.3 -62.5 3.5 -42.8 3.8 NMIJ-T93-3 34.7 3.6 31.9 2.2 NMi-98094 72.1 1.9 69.4 2.1 NPL-323 86.0 2.5 74.7 2.0 NRC-2063 94.3 2.1 89.1 1.4 89.3 3.6 PTB-289 -22.6 2.2 -10.3 2.2 SMU-1 6.1 1.7 9.7 1.6 SPRING-1301 17.3 3.3 9.8 1.6 UME-92 21.6 2.4 17.1 1.9 VNIIM-0/3 20.6 1.4 21.9 3.1
Table 15: Mean values for the measurements on the different ice mantles of the transfer cells. The columns in bold type show the temperature deviations from the mean of the BIPM reference (over the whole period of the comparison), the other columns give the experimental standard deviation of the mean.
We used the arithmetic mean to combine the results for the different ice mantles into a single number for each cell. It is difficult to estimate with high confidence if the differences observed between different mantles of the same cell are significant, because in most cases only two mantles were prepared. We applied a Birge ratio test which is mathematically very similar to the t-test7. We calculated the experimental standard deviation s of the mean (“external consistency”, spread of the results) and compared it with the propagated standard uncertainty of the mean u (“internal consistency”) calculated as
N
u
u
N
ii∑
== 1
2
where ui is the experimental standard deviation for a single result, as
presented in Table 15. If us 2> we conclude that both results are statistically different. It is clear that the standard deviation s of only 2 or 3 values is not well defined. The t-test identifies the same cells as showing significantly different results as the Birge ratio test. In those cases where the results are significantly different for different ice mantles, the reproducibility of the ice mantles (“ice mantle effect”) was identified with 22 usuice −≡ . In these cases, the type A contribution to the standard uncertainty was determined as the
7 The t-test indicates if two mean values of normally-distributed samples with similar standard deviations are drawn from the same distribution.
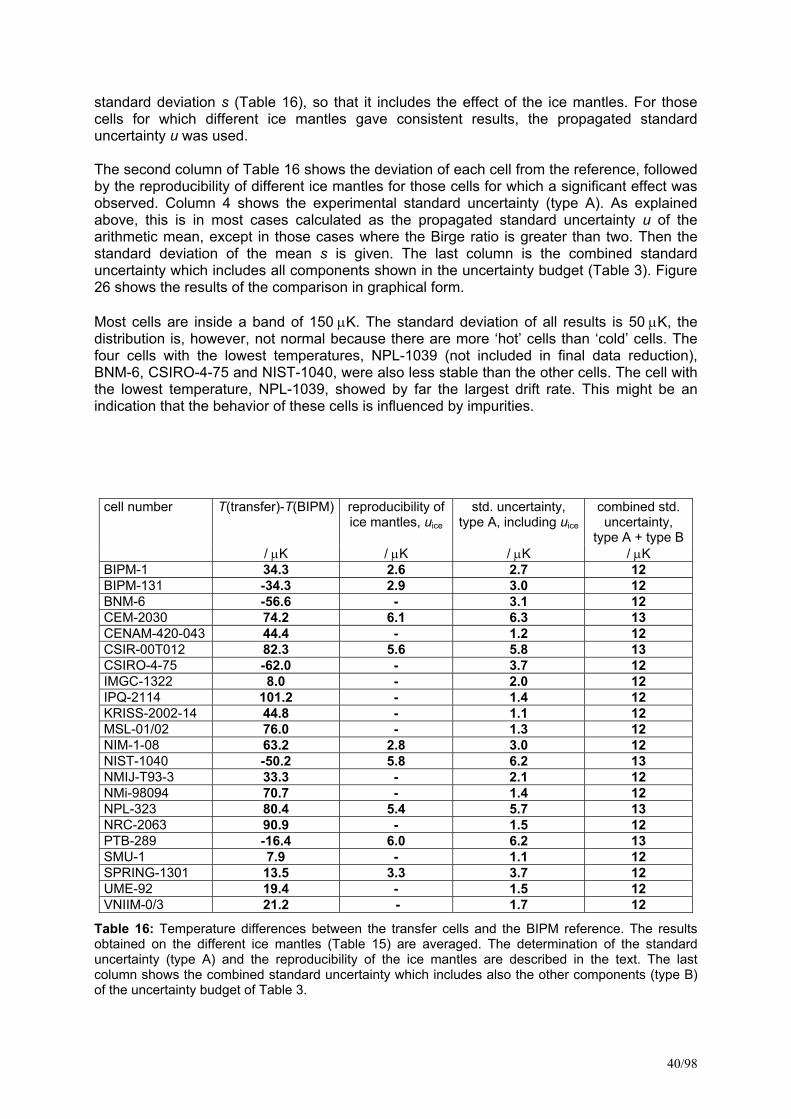
40/98
standard deviation s (Table 16), so that it includes the effect of the ice mantles. For those cells for which different ice mantles gave consistent results, the propagated standard uncertainty u was used. The second column of Table 16 shows the deviation of each cell from the reference, followed by the reproducibility of different ice mantles for those cells for which a significant effect was observed. Column 4 shows the experimental standard uncertainty (type A). As explained above, this is in most cases calculated as the propagated standard uncertainty u of the arithmetic mean, except in those cases where the Birge ratio is greater than two. Then the standard deviation of the mean s is given. The last column is the combined standard uncertainty which includes all components shown in the uncertainty budget (Table 3). Figure 26 shows the results of the comparison in graphical form. Most cells are inside a band of 150 µK. The standard deviation of all results is 50 µK, the distribution is, however, not normal because there are more ‘hot’ cells than ‘cold’ cells. The four cells with the lowest temperatures, NPL-1039 (not included in final data reduction), BNM-6, CSIRO-4-75 and NIST-1040, were also less stable than the other cells. The cell with the lowest temperature, NPL-1039, showed by far the largest drift rate. This might be an indication that the behavior of these cells is influenced by impurities.
cell number T(transfer)-T(BIPM) reproducibility of ice mantles, uice
std. uncertainty, type A, including uice
combined std. uncertainty,
type A + type B / µK / µK / µK / µK BIPM-1 34.3 2.6 2.7 12 BIPM-131 -34.3 2.9 3.0 12 BNM-6 -56.6 - 3.1 12 CEM-2030 74.2 6.1 6.3 13 CENAM-420-043 44.4 - 1.2 12 CSIR-00T012 82.3 5.6 5.8 13 CSIRO-4-75 -62.0 - 3.7 12 IMGC-1322 8.0 - 2.0 12 IPQ-2114 101.2 - 1.4 12 KRISS-2002-14 44.8 - 1.1 12 MSL-01/02 76.0 - 1.3 12 NIM-1-08 63.2 2.8 3.0 12 NIST-1040 -50.2 5.8 6.2 13 NMIJ-T93-3 33.3 - 2.1 12 NMi-98094 70.7 - 1.4 12 NPL-323 80.4 5.4 5.7 13 NRC-2063 90.9 - 1.5 12 PTB-289 -16.4 6.0 6.2 13 SMU-1 7.9 - 1.1 12 SPRING-1301 13.5 3.3 3.7 12 UME-92 19.4 - 1.5 12 VNIIM-0/3 21.2 - 1.7 12
Table 16: Temperature differences between the transfer cells and the BIPM reference. The results obtained on the different ice mantles (Table 15) are averaged. The determination of the standard uncertainty (type A) and the reproducibility of the ice mantles are described in the text. The last column shows the combined standard uncertainty which includes also the other components (type B) of the uncertainty budget of Table 3.
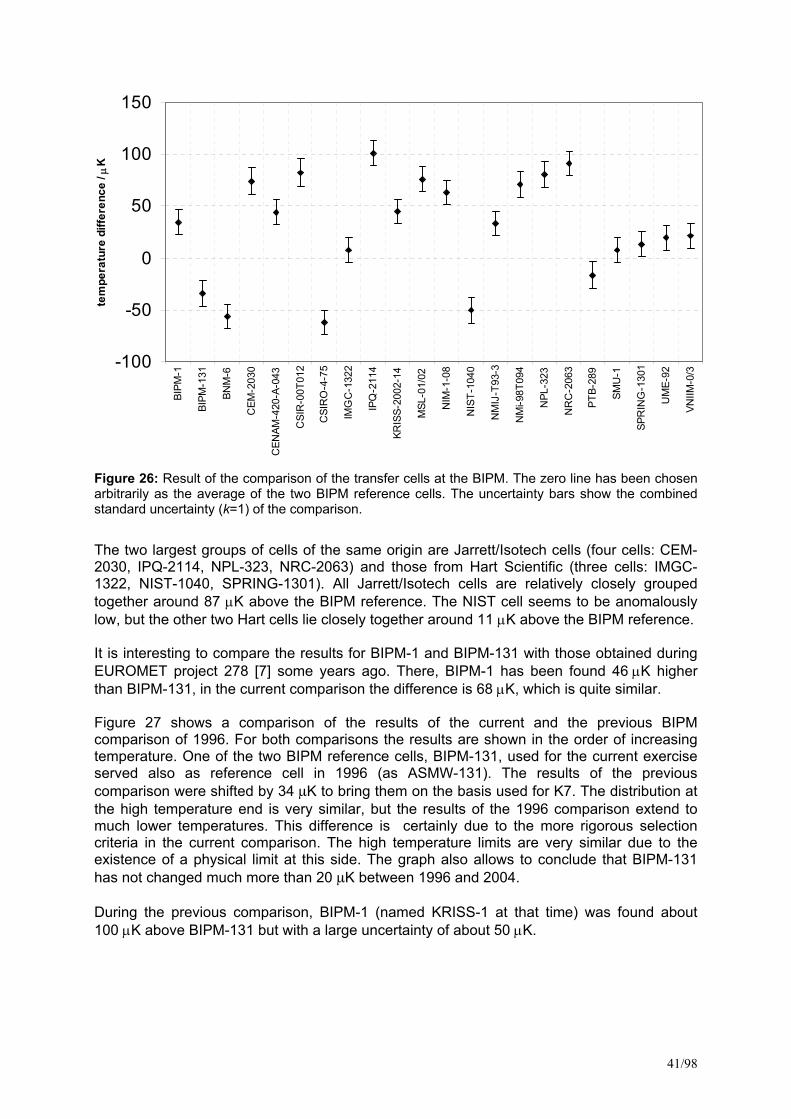
41/98
-100
-50
0
50
100
150
BIPM
-1
BIPM
-131
BNM
-6
CEM
-203
0
CEN
AM-4
20-A
-043
CSI
R-0
0T01
2
CSI
RO
-4-7
5
IMG
C-1
322
IPQ
-211
4
KRIS
S-20
02-1
4
MSL
-01/
02
NIM
-1-0
8
NIS
T-10
40
NM
IJ-T
93-3
NM
i-98T
094
NPL
-323
NR
C-2
063
PTB-
289
SMU
-1
SPR
ING
-130
1
UM
E-92
VNIIM
-0/3
tem
pera
ture
diff
eren
ce /
µK
Figure 26: Result of the comparison of the transfer cells at the BIPM. The zero line has been chosen arbitrarily as the average of the two BIPM reference cells. The uncertainty bars show the combined standard uncertainty (k=1) of the comparison. The two largest groups of cells of the same origin are Jarrett/Isotech cells (four cells: CEM-2030, IPQ-2114, NPL-323, NRC-2063) and those from Hart Scientific (three cells: IMGC-1322, NIST-1040, SPRING-1301). All Jarrett/Isotech cells are relatively closely grouped together around 87 µK above the BIPM reference. The NIST cell seems to be anomalously low, but the other two Hart cells lie closely together around 11 µK above the BIPM reference. It is interesting to compare the results for BIPM-1 and BIPM-131 with those obtained during EUROMET project 278 [7] some years ago. There, BIPM-1 has been found 46 µK higher than BIPM-131, in the current comparison the difference is 68 µK, which is quite similar. Figure 27 shows a comparison of the results of the current and the previous BIPM comparison of 1996. For both comparisons the results are shown in the order of increasing temperature. One of the two BIPM reference cells, BIPM-131, used for the current exercise served also as reference cell in 1996 (as ASMW-131). The results of the previous comparison were shifted by 34 µK to bring them on the basis used for K7. The distribution at the high temperature end is very similar, but the results of the 1996 comparison extend to much lower temperatures. This difference is certainly due to the more rigorous selection criteria in the current comparison. The high temperature limits are very similar due to the existence of a physical limit at this side. The graph also allows to conclude that BIPM-131 has not changed much more than 20 µK between 1996 and 2004. During the previous comparison, BIPM-1 (named KRISS-1 at that time) was found about 100 µK above BIPM-131 but with a large uncertainty of about 50 µK.
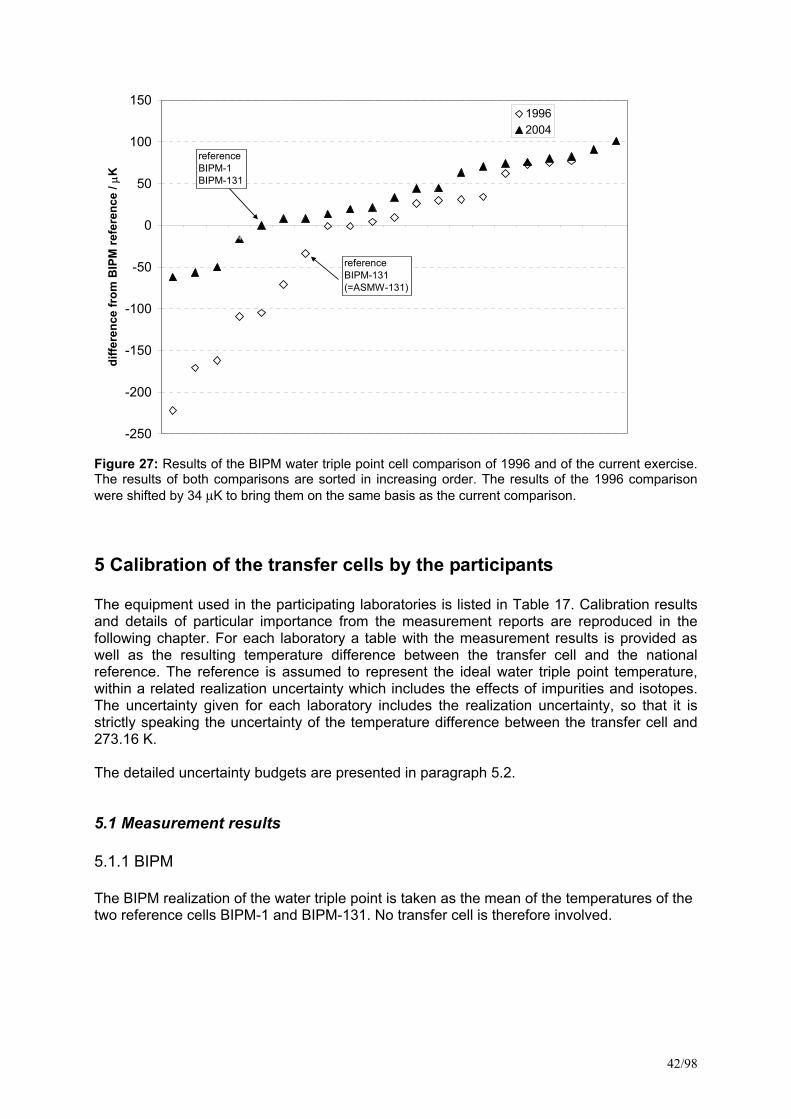
42/98
-250
-200
-150
-100
-50
0
50
100
150
1 2 3 4 5 6 7 8 9 10 11 12 13 14 15 16 17 18 19 20 21
diffe
renc
e fr
om B
IPM
refe
renc
e / µ
K19962004
referenceBIPM-131(=ASMW-131)
referenceBIPM-1BIPM-131
Figure 27: Results of the BIPM water triple point cell comparison of 1996 and of the current exercise. The results of both comparisons are sorted in increasing order. The results of the 1996 comparison were shifted by 34 µK to bring them on the same basis as the current comparison.
5 Calibration of the transfer cells by the participants The equipment used in the participating laboratories is listed in Table 17. Calibration results and details of particular importance from the measurement reports are reproduced in the following chapter. For each laboratory a table with the measurement results is provided as well as the resulting temperature difference between the transfer cell and the national reference. The reference is assumed to represent the ideal water triple point temperature, within a related realization uncertainty which includes the effects of impurities and isotopes. The uncertainty given for each laboratory includes the realization uncertainty, so that it is strictly speaking the uncertainty of the temperature difference between the transfer cell and 273.16 K. The detailed uncertainty budgets are presented in paragraph 5.2.
5.1 Measurement results
5.1.1 BIPM The BIPM realization of the water triple point is taken as the mean of the temperatures of the two reference cells BIPM-1 and BIPM-131. No transfer cell is therefore involved.
43/98
5.1.2 BNM-INM
First ice mantle Second ice mantle Date T(BNM-6)-T(NPL 673) / mK Date T(BNM-6)-T(NPL 673) / mK
08/07/02 0.0932 02/12/02 -0.0508 09/07/02 0.0132 03/12/02 -0.0028 10/07/02 0.0272 04/12/02 0.0051 11/07/02 -0.0028 05/12/02 0.0373 12/07/02 -0.0428 10/12/02 -0.0348 15/07/02 0.0292 11/12/02 -0.0988 16/07/02 -0.0008 12/12/02 -0.1190 17/07/02 -0.0158 13/12/02 0.0174 18/07/02 -0.0008 16/12/02 -0.0635 19/07/02 0.0362 17/12/02 0.0078
mean 0.0136 -0.0302 standard deviation of the mean
0.0116
0.0165
The temperature difference between the transfer cell BNM-6 and cell NPL 673 is stated in the BNM report as T(BNM-6)-T(NPL 673)= -0.0083 mK. The national reference corresponds to the arithmetic mean of nine TPW cells, one of which is NPL 673. It is T(NPL 673)-T(national reference)=0.0054 mK. This leads to T(BNM-6)-T(national reference)=-0.003 mK. The combined standard uncertainty - including the contribution for deviations from the ideal water triple point realization - is estimated as 0.065 mK. Measurements on one ice mantle after return of the cell from the BIPM resulted in the same temperature difference between BNM-6 and NPL 673 within 0.006 mK as before. Therefore only the ‘before’ measurements are used.
5.1.3 CEM
First ice mantle Second ice mantle Date T(CEM-2030)-T(ref.) / mK Date T(CEM-2030)-T(ref.) / mK
28/06/02 0.081 23/07/02 0.092 01/07/02 0.094 24/07/02 0.097 02/07/02 0.098 25/07/02 0.087 03/07/02 0.093 26/07/02 0.088 04/07/02 0.093 29/07/02 0.097 05/07/02 0.076 30/07/02 0.081 08/07/02 0.085 31/07/02 0.080 09/07/02 0.094 01/08/02 0.068 10/07/02 0.081 02/08/02 0.097 11/07/02 0.099 05/08/02 0.084
mean 0.089 0.087 standard deviation of the mean
0.003 0.003
At CEM the TPW is maintained as the mean of four TPW cells. Corrections are applied to each cell obtained from the results of EUROMET project n° 278, in which one of the reference cells participated. The temperature difference between the transfer cell CEM-2030 and the national reference was stated in the CEM report as T(CEM-2030)-T(nat. ref)=0.088 mK. The combined standard uncertainty - including the contribution for deviations from the ideal water triple point realization - is estimated as 0.039 mK.
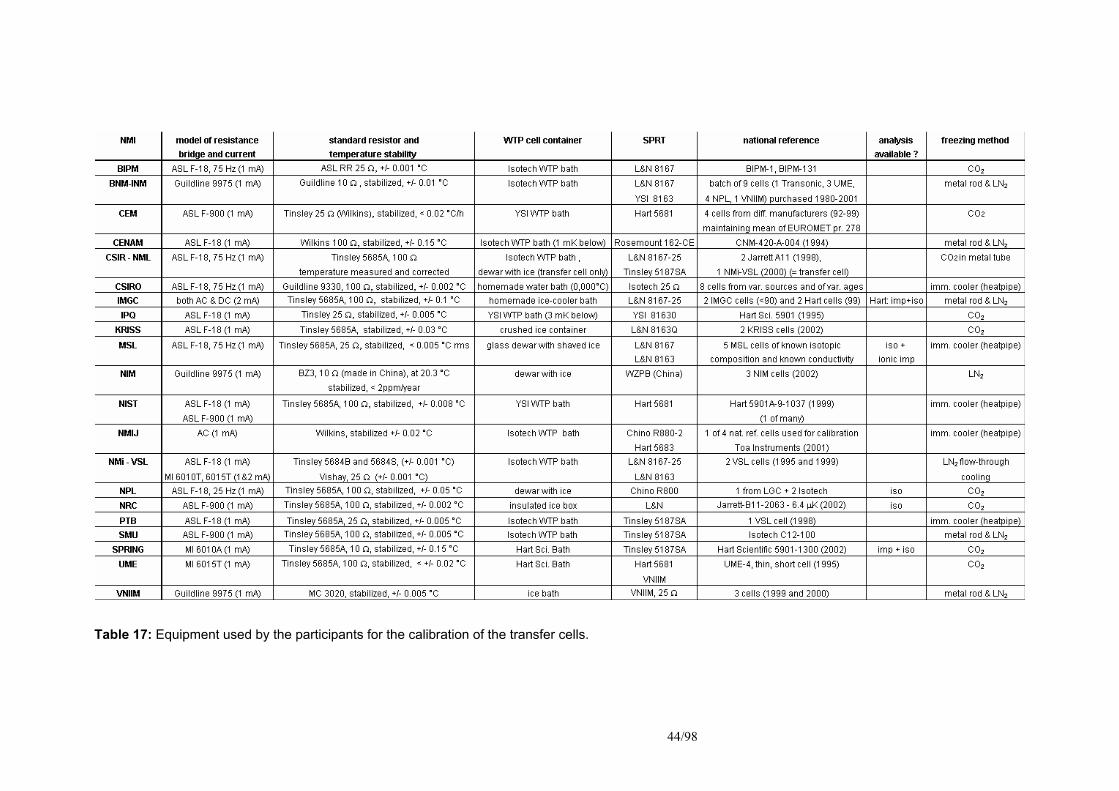
44/98
Table 17: Equipment used by the participants for the calibration of the transfer cells.
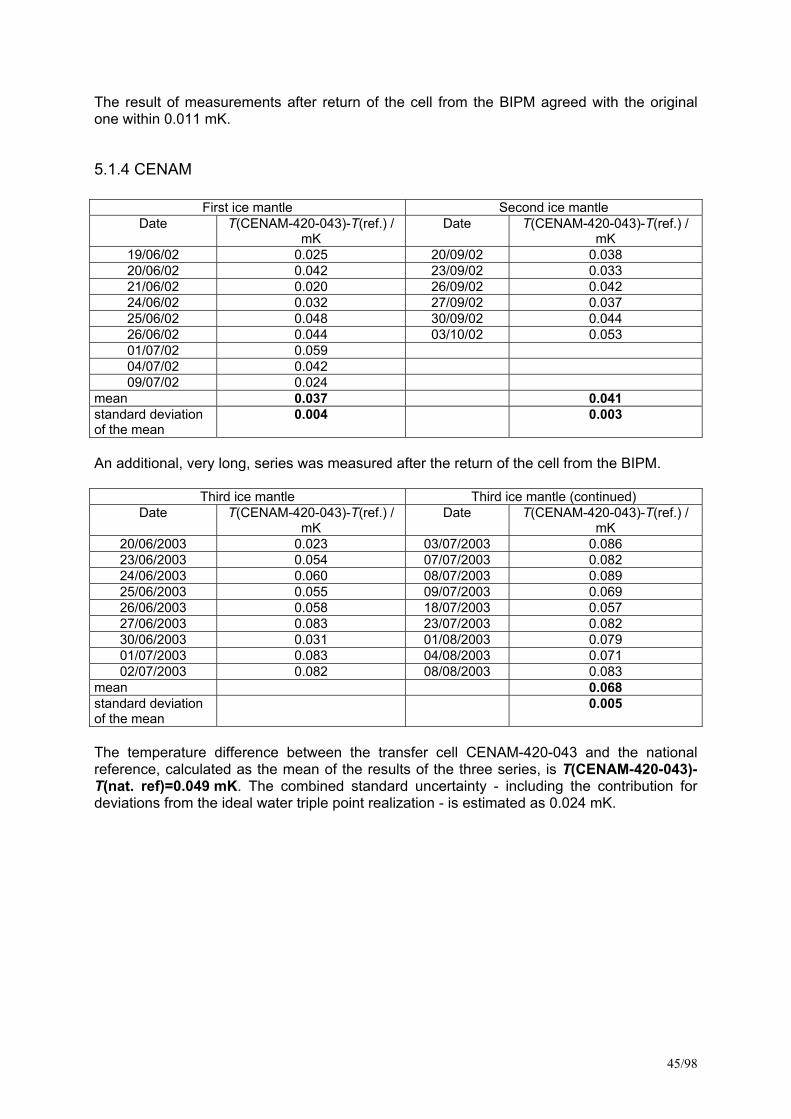
45/98
The result of measurements after return of the cell from the BIPM agreed with the original one within 0.011 mK.
5.1.4 CENAM
First ice mantle Second ice mantle Date T(CENAM-420-043)-T(ref.) /
mK Date T(CENAM-420-043)-T(ref.) /
mK 19/06/02 0.025 20/09/02 0.038 20/06/02 0.042 23/09/02 0.033 21/06/02 0.020 26/09/02 0.042 24/06/02 0.032 27/09/02 0.037 25/06/02 0.048 30/09/02 0.044 26/06/02 0.044 03/10/02 0.053 01/07/02 0.059 04/07/02 0.042 09/07/02 0.024
mean 0.037 0.041 standard deviation of the mean
0.004 0.003
An additional, very long, series was measured after the return of the cell from the BIPM.
Third ice mantle Third ice mantle (continued) Date T(CENAM-420-043)-T(ref.) /
mK Date T(CENAM-420-043)-T(ref.) /
mK 20/06/2003 0.023 03/07/2003 0.086 23/06/2003 0.054 07/07/2003 0.082 24/06/2003 0.060 08/07/2003 0.089 25/06/2003 0.055 09/07/2003 0.069 26/06/2003 0.058 18/07/2003 0.057 27/06/2003 0.083 23/07/2003 0.082 30/06/2003 0.031 01/08/2003 0.079 01/07/2003 0.083 04/08/2003 0.071 02/07/2003 0.082 08/08/2003 0.083
mean 0.068 standard deviation of the mean
0.005
The temperature difference between the transfer cell CENAM-420-043 and the national reference, calculated as the mean of the results of the three series, is T(CENAM-420-043)-T(nat. ref)=0.049 mK. The combined standard uncertainty - including the contribution for deviations from the ideal water triple point realization - is estimated as 0.024 mK.
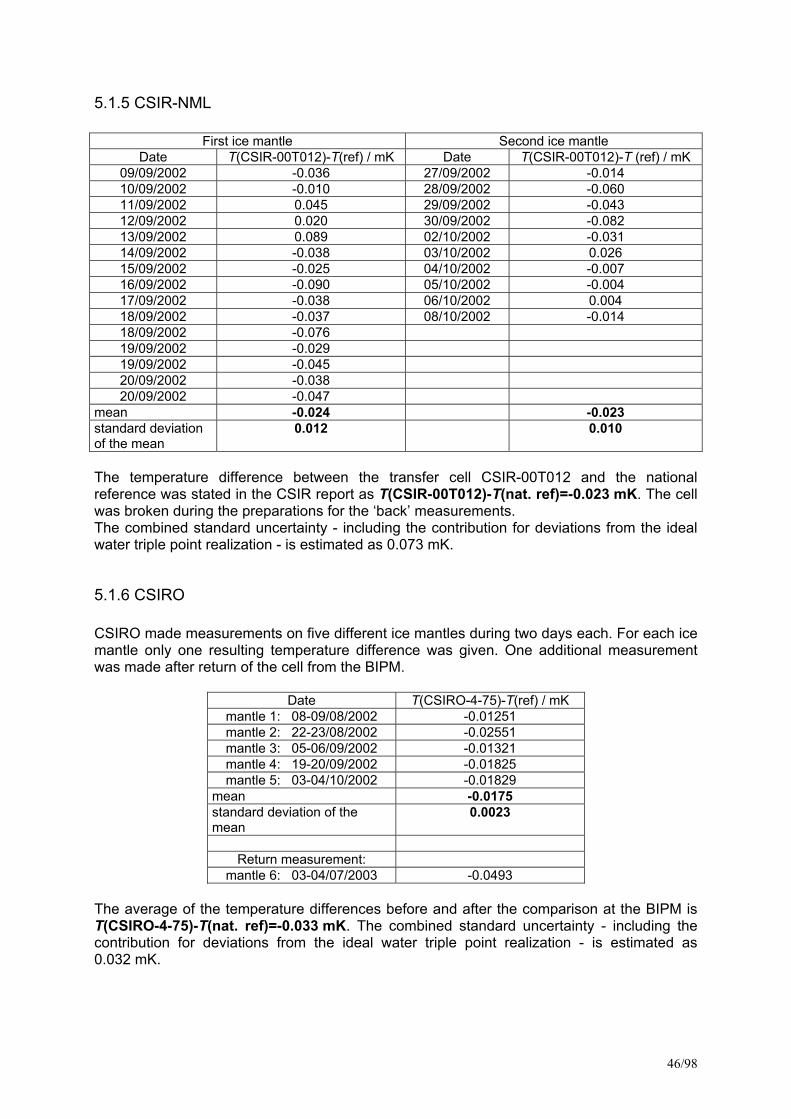
46/98
5.1.5 CSIR-NML
First ice mantle Second ice mantle Date T(CSIR-00T012)-T(ref) / mK Date T(CSIR-00T012)-T (ref) / mK
09/09/2002 -0.036 27/09/2002 -0.014 10/09/2002 -0.010 28/09/2002 -0.060 11/09/2002 0.045 29/09/2002 -0.043 12/09/2002 0.020 30/09/2002 -0.082 13/09/2002 0.089 02/10/2002 -0.031 14/09/2002 -0.038 03/10/2002 0.026 15/09/2002 -0.025 04/10/2002 -0.007 16/09/2002 -0.090 05/10/2002 -0.004 17/09/2002 -0.038 06/10/2002 0.004 18/09/2002 -0.037 08/10/2002 -0.014 18/09/2002 -0.076 19/09/2002 -0.029 19/09/2002 -0.045 20/09/2002 -0.038 20/09/2002 -0.047
mean -0.024 -0.023 standard deviation of the mean
0.012 0.010
The temperature difference between the transfer cell CSIR-00T012 and the national reference was stated in the CSIR report as T(CSIR-00T012)-T(nat. ref)=-0.023 mK. The cell was broken during the preparations for the ‘back’ measurements. The combined standard uncertainty - including the contribution for deviations from the ideal water triple point realization - is estimated as 0.073 mK.
5.1.6 CSIRO CSIRO made measurements on five different ice mantles during two days each. For each ice mantle only one resulting temperature difference was given. One additional measurement was made after return of the cell from the BIPM.
Date T(CSIRO-4-75)-T(ref) / mK mantle 1: 08-09/08/2002 -0.01251 mantle 2: 22-23/08/2002 -0.02551 mantle 3: 05-06/09/2002 -0.01321 mantle 4: 19-20/09/2002 -0.01825 mantle 5: 03-04/10/2002 -0.01829
mean -0.0175 standard deviation of the mean
0.0023
Return measurement:
mantle 6: 03-04/07/2003 -0.0493 The average of the temperature differences before and after the comparison at the BIPM is T(CSIRO-4-75)-T(nat. ref)=-0.033 mK. The combined standard uncertainty - including the contribution for deviations from the ideal water triple point realization - is estimated as 0.032 mK.
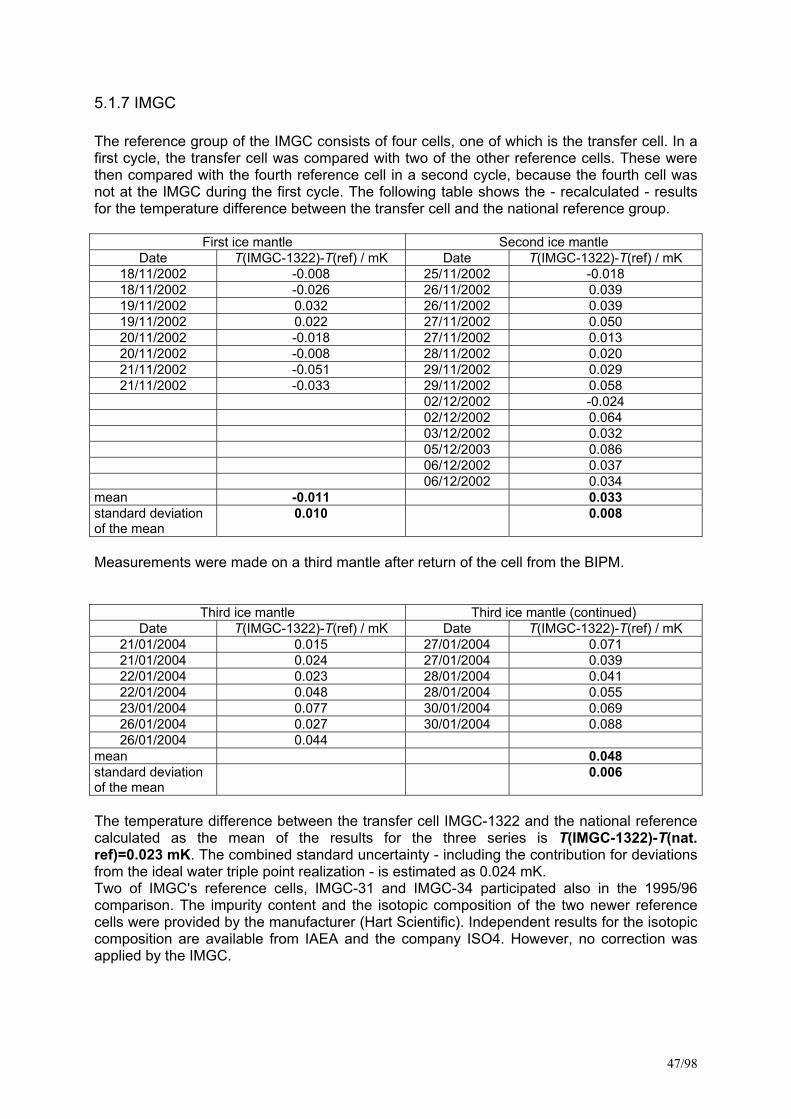
47/98
5.1.7 IMGC The reference group of the IMGC consists of four cells, one of which is the transfer cell. In a first cycle, the transfer cell was compared with two of the other reference cells. These were then compared with the fourth reference cell in a second cycle, because the fourth cell was not at the IMGC during the first cycle. The following table shows the - recalculated - results for the temperature difference between the transfer cell and the national reference group.
First ice mantle Second ice mantle Date T(IMGC-1322)-T(ref) / mK Date T(IMGC-1322)-T(ref) / mK
18/11/2002 -0.008 25/11/2002 -0.018 18/11/2002 -0.026 26/11/2002 0.039 19/11/2002 0.032 26/11/2002 0.039 19/11/2002 0.022 27/11/2002 0.050 20/11/2002 -0.018 27/11/2002 0.013 20/11/2002 -0.008 28/11/2002 0.020 21/11/2002 -0.051 29/11/2002 0.029 21/11/2002 -0.033 29/11/2002 0.058
02/12/2002 -0.024 02/12/2002 0.064 03/12/2002 0.032 05/12/2003 0.086 06/12/2002 0.037 06/12/2002 0.034
mean -0.011 0.033 standard deviation of the mean
0.010 0.008
Measurements were made on a third mantle after return of the cell from the BIPM.
Third ice mantle Third ice mantle (continued) Date T(IMGC-1322)-T(ref) / mK Date T(IMGC-1322)-T(ref) / mK
21/01/2004 0.015 27/01/2004 0.071 21/01/2004 0.024 27/01/2004 0.039 22/01/2004 0.023 28/01/2004 0.041 22/01/2004 0.048 28/01/2004 0.055 23/01/2004 0.077 30/01/2004 0.069 26/01/2004 0.027 30/01/2004 0.088 26/01/2004 0.044
mean 0.048 standard deviation of the mean
0.006
The temperature difference between the transfer cell IMGC-1322 and the national reference calculated as the mean of the results for the three series is T(IMGC-1322)-T(nat. ref)=0.023 mK. The combined standard uncertainty - including the contribution for deviations from the ideal water triple point realization - is estimated as 0.024 mK. Two of IMGC's reference cells, IMGC-31 and IMGC-34 participated also in the 1995/96 comparison. The impurity content and the isotopic composition of the two newer reference cells were provided by the manufacturer (Hart Scientific). Independent results for the isotopic composition are available from IAEA and the company ISO4. However, no correction was applied by the IMGC.
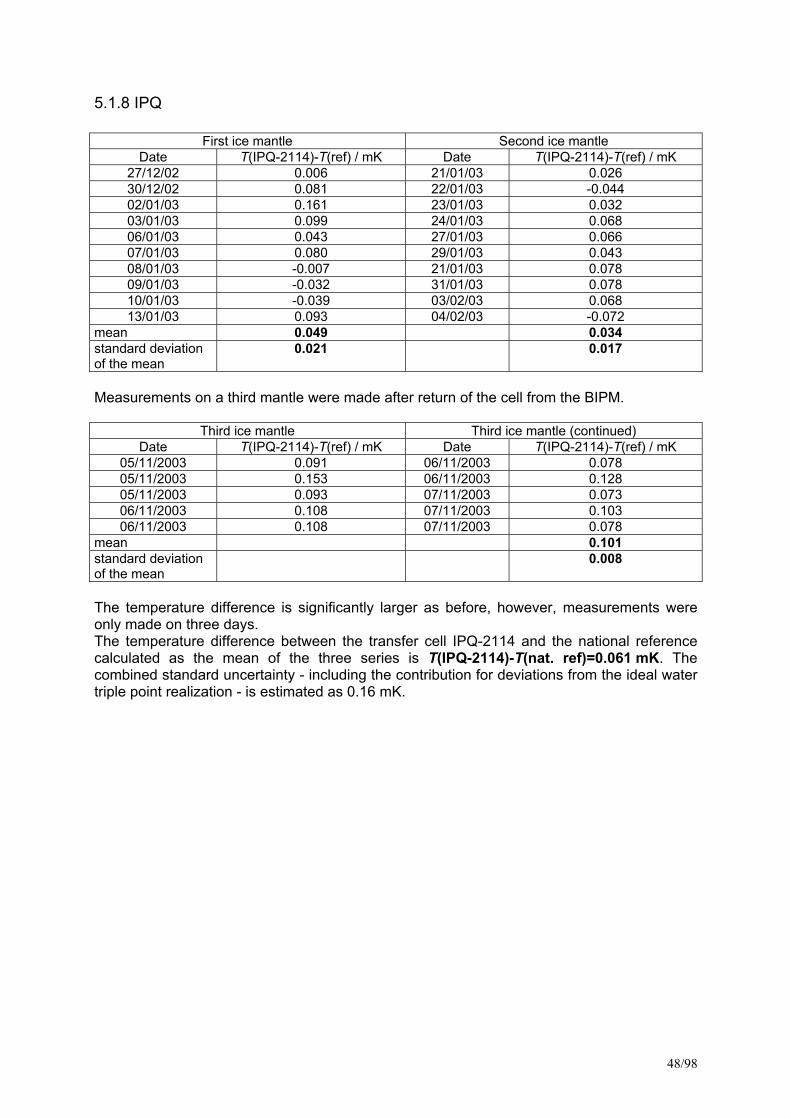
48/98
5.1.8 IPQ
First ice mantle Second ice mantle Date T(IPQ-2114)-T(ref) / mK Date T(IPQ-2114)-T(ref) / mK
27/12/02 0.006 21/01/03 0.026 30/12/02 0.081 22/01/03 -0.044 02/01/03 0.161 23/01/03 0.032 03/01/03 0.099 24/01/03 0.068 06/01/03 0.043 27/01/03 0.066 07/01/03 0.080 29/01/03 0.043 08/01/03 -0.007 21/01/03 0.078 09/01/03 -0.032 31/01/03 0.078 10/01/03 -0.039 03/02/03 0.068 13/01/03 0.093 04/02/03 -0.072
mean 0.049 0.034 standard deviation of the mean
0.021 0.017
Measurements on a third mantle were made after return of the cell from the BIPM.
Third ice mantle Third ice mantle (continued) Date T(IPQ-2114)-T(ref) / mK Date T(IPQ-2114)-T(ref) / mK
05/11/2003 0.091 06/11/2003 0.078 05/11/2003 0.153 06/11/2003 0.128 05/11/2003 0.093 07/11/2003 0.073 06/11/2003 0.108 07/11/2003 0.103 06/11/2003 0.108 07/11/2003 0.078
mean 0.101 standard deviation of the mean
0.008
The temperature difference is significantly larger as before, however, measurements were only made on three days. The temperature difference between the transfer cell IPQ-2114 and the national reference calculated as the mean of the three series is T(IPQ-2114)-T(nat. ref)=0.061 mK. The combined standard uncertainty - including the contribution for deviations from the ideal water triple point realization - is estimated as 0.16 mK.
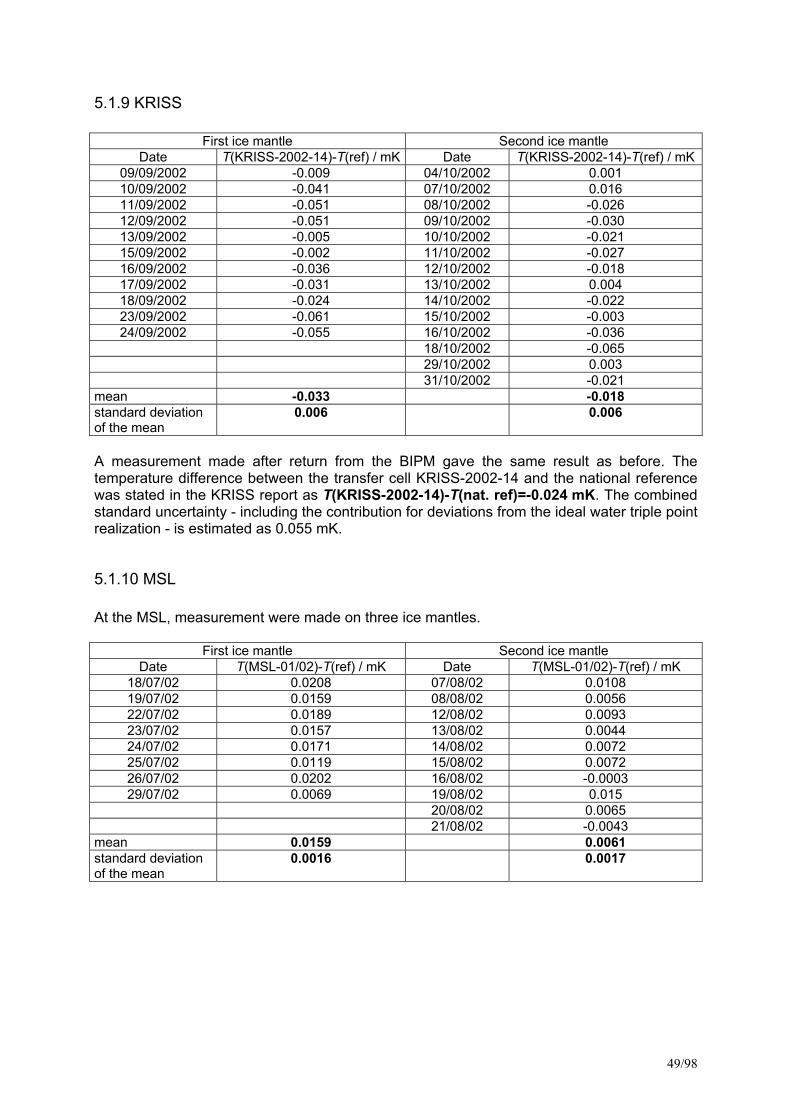
49/98
5.1.9 KRISS
First ice mantle Second ice mantle Date T(KRISS-2002-14)-T(ref) / mK Date T(KRISS-2002-14)-T(ref) / mK
09/09/2002 -0.009 04/10/2002 0.001 10/09/2002 -0.041 07/10/2002 0.016 11/09/2002 -0.051 08/10/2002 -0.026 12/09/2002 -0.051 09/10/2002 -0.030 13/09/2002 -0.005 10/10/2002 -0.021 15/09/2002 -0.002 11/10/2002 -0.027 16/09/2002 -0.036 12/10/2002 -0.018 17/09/2002 -0.031 13/10/2002 0.004 18/09/2002 -0.024 14/10/2002 -0.022 23/09/2002 -0.061 15/10/2002 -0.003 24/09/2002 -0.055 16/10/2002 -0.036
18/10/2002 -0.065 29/10/2002 0.003 31/10/2002 -0.021
mean -0.033 -0.018 standard deviation of the mean
0.006 0.006
A measurement made after return from the BIPM gave the same result as before. The temperature difference between the transfer cell KRISS-2002-14 and the national reference was stated in the KRISS report as T(KRISS-2002-14)-T(nat. ref)=-0.024 mK. The combined standard uncertainty - including the contribution for deviations from the ideal water triple point realization - is estimated as 0.055 mK.
5.1.10 MSL At the MSL, measurement were made on three ice mantles.
First ice mantle Second ice mantle Date T(MSL-01/02)-T(ref) / mK Date T(MSL-01/02)-T(ref) / mK
18/07/02 0.0208 07/08/02 0.0108 19/07/02 0.0159 08/08/02 0.0056 22/07/02 0.0189 12/08/02 0.0093 23/07/02 0.0157 13/08/02 0.0044 24/07/02 0.0171 14/08/02 0.0072 25/07/02 0.0119 15/08/02 0.0072 26/07/02 0.0202 16/08/02 -0.0003 29/07/02 0.0069 19/08/02 0.015
20/08/02 0.0065 21/08/02 -0.0043
mean 0.0159 0.0061 standard deviation of the mean
0.0016 0.0017
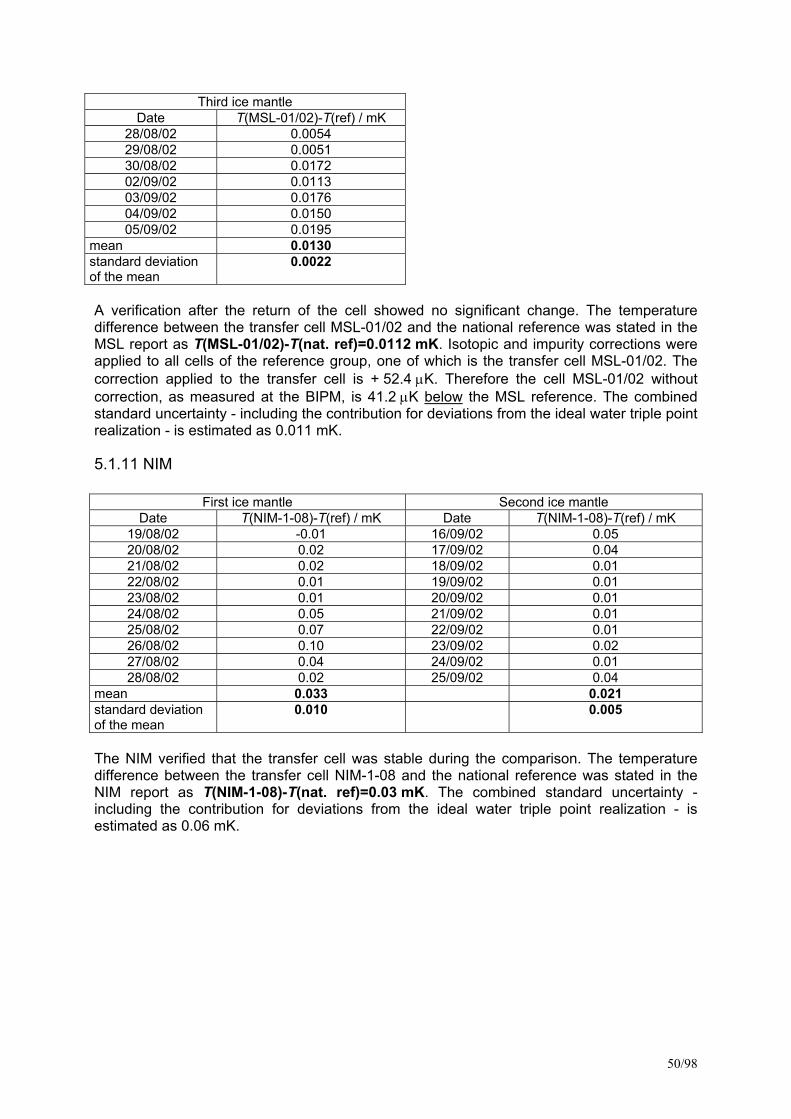
50/98
Third ice mantle Date T(MSL-01/02)-T(ref) / mK
28/08/02 0.0054 29/08/02 0.0051 30/08/02 0.0172 02/09/02 0.0113 03/09/02 0.0176 04/09/02 0.0150 05/09/02 0.0195
mean 0.0130 standard deviation of the mean
0.0022
A verification after the return of the cell showed no significant change. The temperature difference between the transfer cell MSL-01/02 and the national reference was stated in the MSL report as T(MSL-01/02)-T(nat. ref)=0.0112 mK. Isotopic and impurity corrections were applied to all cells of the reference group, one of which is the transfer cell MSL-01/02. The correction applied to the transfer cell is + 52.4 µK. Therefore the cell MSL-01/02 without correction, as measured at the BIPM, is 41.2 µK below the MSL reference. The combined standard uncertainty - including the contribution for deviations from the ideal water triple point realization - is estimated as 0.011 mK.
5.1.11 NIM
First ice mantle Second ice mantle Date T(NIM-1-08)-T(ref) / mK Date T(NIM-1-08)-T(ref) / mK
19/08/02 -0.01 16/09/02 0.05 20/08/02 0.02 17/09/02 0.04 21/08/02 0.02 18/09/02 0.01 22/08/02 0.01 19/09/02 0.01 23/08/02 0.01 20/09/02 0.01 24/08/02 0.05 21/09/02 0.01 25/08/02 0.07 22/09/02 0.01 26/08/02 0.10 23/09/02 0.02 27/08/02 0.04 24/09/02 0.01 28/08/02 0.02 25/09/02 0.04
mean 0.033 0.021 standard deviation of the mean
0.010 0.005
The NIM verified that the transfer cell was stable during the comparison. The temperature difference between the transfer cell NIM-1-08 and the national reference was stated in the NIM report as T(NIM-1-08)-T(nat. ref)=0.03 mK. The combined standard uncertainty - including the contribution for deviations from the ideal water triple point realization - is estimated as 0.06 mK.
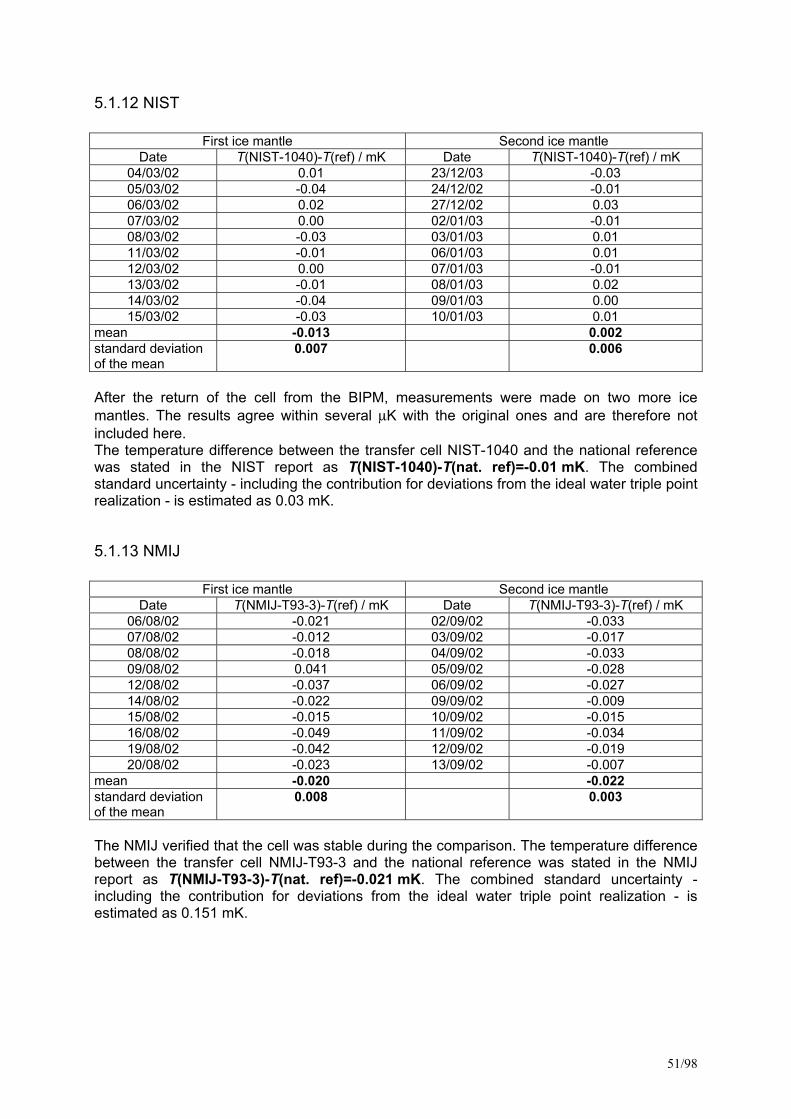
51/98
5.1.12 NIST
First ice mantle Second ice mantle Date T(NIST-1040)-T(ref) / mK Date T(NIST-1040)-T(ref) / mK
04/03/02 0.01 23/12/03 -0.03 05/03/02 -0.04 24/12/02 -0.01 06/03/02 0.02 27/12/02 0.03 07/03/02 0.00 02/01/03 -0.01 08/03/02 -0.03 03/01/03 0.01 11/03/02 -0.01 06/01/03 0.01 12/03/02 0.00 07/01/03 -0.01 13/03/02 -0.01 08/01/03 0.02 14/03/02 -0.04 09/01/03 0.00 15/03/02 -0.03 10/01/03 0.01
mean -0.013 0.002 standard deviation of the mean
0.007 0.006
After the return of the cell from the BIPM, measurements were made on two more ice mantles. The results agree within several µK with the original ones and are therefore not included here. The temperature difference between the transfer cell NIST-1040 and the national reference was stated in the NIST report as T(NIST-1040)-T(nat. ref)=-0.01 mK. The combined standard uncertainty - including the contribution for deviations from the ideal water triple point realization - is estimated as 0.03 mK.
5.1.13 NMIJ
First ice mantle Second ice mantle Date T(NMIJ-T93-3)-T(ref) / mK Date T(NMIJ-T93-3)-T(ref) / mK
06/08/02 -0.021 02/09/02 -0.033 07/08/02 -0.012 03/09/02 -0.017 08/08/02 -0.018 04/09/02 -0.033 09/08/02 0.041 05/09/02 -0.028 12/08/02 -0.037 06/09/02 -0.027 14/08/02 -0.022 09/09/02 -0.009 15/08/02 -0.015 10/09/02 -0.015 16/08/02 -0.049 11/09/02 -0.034 19/08/02 -0.042 12/09/02 -0.019 20/08/02 -0.023 13/09/02 -0.007
mean -0.020 -0.022 standard deviation of the mean
0.008
0.003
The NMIJ verified that the cell was stable during the comparison. The temperature difference between the transfer cell NMIJ-T93-3 and the national reference was stated in the NMIJ report as T(NMIJ-T93-3)-T(nat. ref)=-0.021 mK. The combined standard uncertainty - including the contribution for deviations from the ideal water triple point realization - is estimated as 0.151 mK.
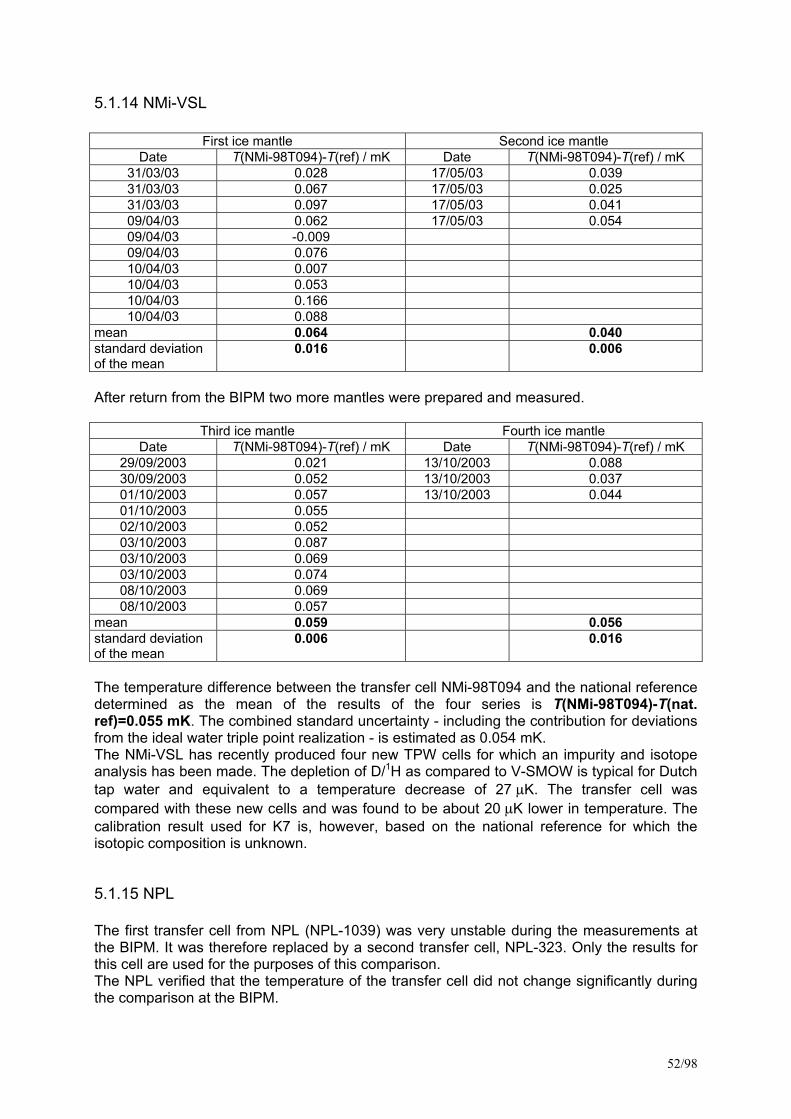
52/98
5.1.14 NMi-VSL
First ice mantle Second ice mantle Date T(NMi-98T094)-T(ref) / mK Date T(NMi-98T094)-T(ref) / mK
31/03/03 0.028 17/05/03 0.039 31/03/03 0.067 17/05/03 0.025 31/03/03 0.097 17/05/03 0.041 09/04/03 0.062 17/05/03 0.054 09/04/03 -0.009 09/04/03 0.076 10/04/03 0.007 10/04/03 0.053 10/04/03 0.166 10/04/03 0.088
mean 0.064 0.040 standard deviation of the mean
0.016 0.006
After return from the BIPM two more mantles were prepared and measured.
Third ice mantle Fourth ice mantle Date T(NMi-98T094)-T(ref) / mK Date T(NMi-98T094)-T(ref) / mK
29/09/2003 0.021 13/10/2003 0.088 30/09/2003 0.052 13/10/2003 0.037 01/10/2003 0.057 13/10/2003 0.044 01/10/2003 0.055 02/10/2003 0.052 03/10/2003 0.087 03/10/2003 0.069 03/10/2003 0.074 08/10/2003 0.069 08/10/2003 0.057
mean 0.059 0.056 standard deviation of the mean
0.006 0.016
The temperature difference between the transfer cell NMi-98T094 and the national reference determined as the mean of the results of the four series is T(NMi-98T094)-T(nat. ref)=0.055 mK. The combined standard uncertainty - including the contribution for deviations from the ideal water triple point realization - is estimated as 0.054 mK. The NMi-VSL has recently produced four new TPW cells for which an impurity and isotope analysis has been made. The depletion of D/1H as compared to V-SMOW is typical for Dutch tap water and equivalent to a temperature decrease of 27 µK. The transfer cell was compared with these new cells and was found to be about 20 µK lower in temperature. The calibration result used for K7 is, however, based on the national reference for which the isotopic composition is unknown.
5.1.15 NPL The first transfer cell from NPL (NPL-1039) was very unstable during the measurements at the BIPM. It was therefore replaced by a second transfer cell, NPL-323. Only the results for this cell are used for the purposes of this comparison. The NPL verified that the temperature of the transfer cell did not change significantly during the comparison at the BIPM.
53/98
First ice mantle Second ice mantle
Date T(NPL-323)-T(ref) / mK Date T(NPL-323)-T(ref) / mK 06/10/2003 0.043 28/10/2003 0.026 07/10/2003 0.043 31/10/2003 0.011 08/10/2003 0.012 03/11/2003 0.054 09/10/2003 0.023 04/11/2003 0.009 10/10/2003 0.009 05/11/2003 0.066 13/10/2003 0.018 06/11/2003 0.073 14/10/2003 0.019 07/11/2003 0.070 15/10/2003 0.025 16/10/2003 0.045 17/10/2003 0.031
mean 0.027 0.044 standard deviation of the mean
0.004 0.011
The temperature difference between the transfer cell NPL-323 and the national reference is T(NPL-323)-T(nat. ref)=0.035 mK. The combined standard uncertainty - including the contribution for deviations from the ideal water triple point realization - is estimated as 0.037 mK. An isotopic analysis is available for cell NPL-323 from the manufacturer. The estimated temperature difference from V-SMOW is approximately -0.010 mK with an uncertainty of +/- 0.002 mK.
5.1.16 NRC
First ice mantle Second ice mantle Date T(NRC-2063)-T(ref) / mK Date T(NRC-2063)-T(ref) / mK
11/09/02 0.006 01/10/02 0.007 12/09/02 0.017 02/10/02 0.001 13/09/02 -0.012 03/10/02 0.007 14/09/02 -0.001 04/10/02 0.004 15/09/02 0.002 05/10/02 0.002 16/09/02 0.029 06/10/02 0.007 17/09/02 -0.005 07/10/02 0.011 18/09/02 0.006 08/10/02 0.013 19/09/02 0.009 09/10/02 0.004 20/09/02 0.019 10/10/02 0.005
11/10/02 -0.003 mean 0.007 0.005 standard deviation of the mean
0.004 0.001
The NRC has verified that its transfer cell has been stable during the comparison at the BIPM. The temperature difference between the transfer cell NRC-2063 and the national reference was stated in the NRC report as T(NRC-2063)-T(nat. ref)=0.0064 mK. The combined standard uncertainty - including the contribution for deviations from the ideal water triple point realization - is estimated as 0.020 mK. The isotopic composition of NRC-2063 is known to increase its triple point temperature by 6.4 µK compared to V-SMOW. This cell is used as transfer cell and serves also as the national reference which is defined as 6.4 µK below the temperature realized by NRC-2063. Therefore the above result is not the result of a TPW comparison, but the definition of the NRC reference. This temperature is maintained by two other TPW cells, against which NRC-
54/98
2063 has been compared for the purpose of this comparison. The temperatures of the two cells were adjusted to respect the definition.
5.1.17 PTB
First ice mantle Second ice mantle Date T(PTB-289)-T(ref) / mK Date T(PTB-289)-T(ref) / mK
14/10/2002 -0.01871 11/11/2002 -0.00317 15/10/2002 -0.00772 12/11/2002 0.00703 16/10/2002 0.00366 13/11/2002 0.00183 17/10/2002 -0.01861 14/11/2002 0.00713 18/10/2002 -0.00827 15/11/2002 0.00931 19/10/2002 -0.00455 16/11/2002 -0.00137 25/10/2002 0.00099 17/11/2002 -0.00185 28/10/2002 -0.00465 18/11/2002 -0.00218 29/10/2002 -0.00515 19/11/2002 -0.00158 30/10/2002 0.00921 20/11/2002 -0.00812 01/11/2002 0.00832 21/11/2002 -0.00634 02/11/2002 0.00851 22/11/2002 -0.00703 03/11/2002 -0.01059 23/11/2002 0.00228 04/11/2002 -0.01079 25/11/2002 -0.00050 07/10/2002 -0.00426 26/11/2002 0.00574
mean -0.0042 0.0001 standard deviation of the mean
0.0023 0.0014
The PTB verified that the transfer cell did not change significantly during the comparison. The temperature difference between the transfer cell PTB-289 and the national reference was stated in the PTB report as T(PTB-289)-T(nat. ref)=-0.002 mK. The combined standard uncertainty - including the contribution for deviations from the ideal water triple point realization - is estimated as 0.054 mK.
5.1.18 SMU
First ice mantle Second ice mantle Date T(SMU-1)-T(ref) / mK Date T(SMU-1)-T(ref) / mK
17/10/02 -0.062 04/11/02 -0.070 18/10/02 -0.047 05/11/02 -0.059 19/10/02 -0.061 06/11/02 -0.069 20/10/02 -0.035 07/11/02 -0.083 21/10/02 -0.058 08/11/02 -0.058 22/10/02 -0.066 09/11/02 -0.079 23/10/02 -0.059 10/11/02 -0.069 24/10/02 -0.063 11/11/02 -0.062 25/10/02 -0.042 12/11/02 -0.063 26/10/02 -0.067 13/11/02 -0.059
mean -0.056 -0.067 standard deviation of the mean
0.003 0.003
The SMU verified that the transfer cell was stable during the comparison. The temperature difference between the transfer cell SMU-1 and the national reference was stated in the SMU report as T(SMU-1)-T(nat. ref)=-0.061 mK. The combined standard uncertainty - including
55/98
the contribution for deviations from the ideal water triple point realization - is estimated as 0.052 mK.
5.1.19 SPRING
First ice mantle Second ice mantle Date T(SPRING-1301)-T(ref) / mK Date T(SPRING-1301)-T(ref) / mK
01/10/2002 0.08 04/11/2002 -0.09 02/10/2002 0.04 05/11/2002 0.00 03/10/2002 -0.01 06/11/2002 0.01 04/10/2002 -0.14 07/11/2002 -0.08 05/10/2002 0.04 08/11/2002 -0.20 07/10/2002 -0.22 09/11/2002 -0.15 08/10/2002 0.05 10/11/2002 0.06 09/10/2002 0.02 11/11/2002 -0.10 10/10/2002 0.11 12/11/2002 0.13 11/10/2002 0.01 13/11/2002 0.18 12/10/2002 -0.11 14/11/2002 -0.05 14/10/2002 0.02 15/11/2002 -0.11 15/10/2002 0.00 15/11/2002 -0.04 16/10/2002 0.12 16/11/2002 -0.11 17/10/2002 -0.04 18/10/2002 0.01
mean -0.001 -0.039 standard deviation of the mean
0.022 0.028
After return of the cell from the BIPM, the SPRING measured on two additional ice mantles. The results agree with the average of the original measurements within 0.01 mK, and are therefore not added here. The temperature difference between the transfer cell SPRING-1301 and the national reference was stated in the SPRING report as T(SPRING-1301)-T(nat. ref)= -0.02 mK. The combined standard uncertainty - including the contribution for deviations from the ideal water triple point realization - is estimated as 0.07 mK. An isotope analysis for the reference cell is available. No correction was applied for this, the result was taken into account in the uncertainty budget.
5.1.20 UME
First ice mantle Second ice mantle Date T(UME-92)-T(ref) / mK Date T(UME-92)-T(ref) / mK
30/09/02 0.078 08/11/02 0.091 01/10/02 -0.048 09/11/02 0.079 02/10/02 0.034 10/11/02 0.063 03/10/02 0.058 11/11/02 0.092 04/10/02 0.071 12/11/02 0.096 07/10/02 0.087 13/11/02 0.088 09/10/02 0.102 14/11/02 0.007 10/10/02 0.103 15/11/02 0.071 11/10/02 0.048 16/11/02 -0.008
17/11/02 0.004 18/11/02 0.023 19/11/02 0.009
mean 0.059 0.051 standard deviation of the mean
0.015 0.012
56/98
Measurements on two more ice mantles were made after return from the BIPM.
Third ice mantle Fourth ice mantle Date T(UME-92)-T(ref) / mK Date T(UME-92)-T(ref) / mK
17/09/2003 0.100 09/10/2003 0.122 18/09/2003 0.063 10/10/2003 0.063 22/09/2003 0.117 13/10/2003 0.110 23/09/2003 0.088 14/10/2003 0.055 24/09/2003 0.113 15/10/2003 0.116 25/09/2003 0.096 16/10/2003 0.094 26/09/2003 0.056 17/10/2003 0.033 29/09/2003 0.050 20/10/2003 0.116 30/09/2003 0.102 21/10/2003 0.096
22/10/2003 0.116 mean 0.087 0.092 standard deviation of the mean
0.008 0.010
The temperature difference between the transfer cell UME-92 and the national reference calculated from the means of the four series is T(UME-92)-T(nat. ref)=0.072 mK. The combined standard uncertainty - including the contribution for deviations from the ideal water triple point realization - is estimated as 0.090 mK.
5.1.21 VNIIM
First ice mantle Second ice mantle Date T(VNIIM-0/3)-T(ref) / mK Date T(VNIIM-0/3)-T(ref) / mK
30/09/02 -0.015 21/10/02 -0.012 01/10/02 -0.009 22/10/02 -0.016 02/10/02 0.009 23/10/02 0.001 03/10/02 -0.002 24/10/02 0.007 04/10/02 -0.018 25/10/02 -0.019 07/10/02 0.004 28/10/02 -0.025 08/10/02 -0.016 29/10/02 0.006 09/10/02 -0.013 30/10/02 -0.013 10/10/02 0.006 31/10/02 -0.011 11/10/02 -0.015 01/11/02 0.002
mean -0.007 -0.008 standard deviation of the mean
0.003 0.004
Two more series were measured after return of the cell from the BIPM.
Third ice mantle Fourth ice mantle Date T(VNIIM-0/3)-T(ref) / mK Date T(VNIIM-0/3)-T(ref) / mK
13/06/2003 0.006 11/07/2003 0.003 16/06/2003 -0.004 14/07/2003 0.006 17/06/2003 0.007 15/07/2003 0.016 18/06/2003 0.009 16/07/2003 -0.002 19/06/2003 -0.011 17/07/2003 -0.004 20/06/2003 0.018 18/07/2003 0.009 23/06/2003 0.022 21/07/2003 -0.001 24/06/2003 -0.013 22/07/2003 0.016 25/06/2003 0.017 23/07/2003 0.012 26/06/2003 -0.002 24/07/2003 0.015
mean 0.005 0.007 standard deviation of the mean
0.004 0.002
57/98
The temperature difference between the transfer cell VNIIM-0/3 and the national reference calculated as the mean of the results of the four series is T(VNIIM-0/3)-T(nat. ref)= -0.001 mK. The combined standard uncertainty - including the contribution for deviations from the ideal water triple point realization - is estimated as 0.044 mK.
5.2 Uncertainty budgets The protocol asked the participants for a detailed uncertainty budget, which should include the uncertainty of the national reference representing the true water triple point temperature (realization uncertainty) and the uncertainty of the calibration of the transfer cell. Since the national reference represents 273.16 K (in some cases after correction for known impurity concentration and isotopic composition), the final uncertainty is that for the temperature difference between the transfer cell and 273.16 K or, which is identical, that of the absolute temperature of the transfer cell. All participants used the model of the uncertainty budget proposed in the measurement report form. The budgets can therefore easily be compared in a single table (Table 18). Some participants added contributions not foreseen in the model. Several laboratories provided background information about their uncertainty estimates. Details of special interest are summarized on the following pages. BIPM: The estimation of the influence of chemical impurities is based on the assumption of a purity of the water of 7N (after triple distillation). Raoult’s law results in a temperature depression of 10 µK, which we take as the corresponding uncertainty contribution. Since we have no information about the isotopic composition of our cells, we estimate the uncertainty from the dispersion between cells observed during the last TPW comparison. A similar value was obtained at a systematic study of this effect [8]. The effect of residual gas is estimated from the bubble size. Since the BIPM reference cells were directly used as reference cells for this comparison, no transfer cell is involved. This gives the BIPM a slight advantage as compared to the other participants. However, as can be seen in Table 18, for most participants the uncertainties of the transfer itself are much smaller than those related to the realization. Therefore this advantage is not significant. BNM-INM: The contribution of chemical impurities, isotopic variation and residual gas pressure is estimated from the maximal difference between the temperatures realized by the nine cells of the reference group (0.2 mK / 2 3 ). CEM: The contribution of chemical impurities has been estimated from the final results obtained in EUROMET project n° 278 "Intercomparison of Triple Point of Water Cells" [7]. CENAM: The influence of impurities and residual gas was estimated from the freezing curve (E. Méndez-Lango (2001), Proc. of 8th International Symp. on Temperature and Thermal Measurements, Berlin). The reproducibility of the national reference is taken from observed differences less than 0.02 mK (rectangular, E. Méndez-Lango (1996), Proc. of 6th International Symp. on Temperature and Thermal Measurements, Torino). The influence of the SPRT type is based on the maximum difference between the SPRT used and two others. Hydrostatic head was calculated from the head difference between transfer and reference cells. Self-heating is considered negligible because strongly correlated between cells. Perturbing heat exchanges are estimated from the immersion profile. CSIR: The effect of impurities is estimated from 33 comparisons of the two or three national reference cells with mantles of various ages and conditions. The reproducibility is also included in this component. Isotopic effects are estimated using [8]. 10 % variations in 2H and 18O content can be expected, equivalent to 60 µK and 6 µK. These are added linearly, as
58/98
distillation may reduce the amount of both isotopes. Divide by √3 to obtain related standard uncertainty. The influence of gas was calculated from the observed bubble size. The contribution of perturbing heat exchange is estimated from the immersion profile. CSIRO: The uncertainty of the national definition is given simply by the standard deviation of the mean of the ensemble of cells used to define it. Cells come from a range of sources and were manufactured over a range of time, thus systematic errors due to impurities, isotopes and gas pressure can be considered randomized. The "effective" position of the sensor is thought to be uncertain at the level of 1-2 sensor diameters. The dominant uncertainty contribution is from perturbing heat exchanges. The deviation from the theoretical hydrostatic pressure effect is less than 40 µK. Some of this deviation is certainly due to other factors such as noise and SPRT repeatability, so this is likely to be an overestimate. CSIRO is aware that this hydrostatic head tracking is less than optimal, and has achieved better, but time constraints have prohibited them from repeating the measurement. The estimation of self-heating is based on an assessment of the accuracy of the factor √2 between currents, the variation of the self-heating correction when the SPRT is moved between measurements and the effect of insufficient wait time after changing currents. The measured standard deviation of measurements on five independent mantle realizations contains contributions from the mantle realization instability, the SPRT stability, the reference resistor and random electrical noise. IMGC: The contribution of isotopic variation is estimated using [9]. For two of the reference cells tap water is assumed with an uncertainty of 20 % in the composition. For the other two cells the composition is furnished by the supplier. Following the comparison, the results of additional isotope analyses made by the IAEA and by the company ISO4 became available. The uncertainty contribution from isotopic effects is the uncertainty of the isotope correction, but the correction itself was not applied for the purpose of this comparison. The combined standard uncertainty is smaller as in CCT-K3. In the present comparison no temperature excursion occurs and many more TPW values are available. IPQ: Effects of impurities and isotopes are estimated using CCT and EUROMET documentation based on interlaboratory comparison data. Residual gas effect is calculated from bubble size. The contribution from self-heating is estimated as 2 % of the maximum difference in the self-heating. The contribution of SPRT instability is the average drift of the SPRT when returning to the same cell. Perturbing heat exchanges were quantified by changing the position of the thermometer. KRISS: The uncertainty due to impurities is obtained from the report : D. Head et al, "Cryogenic triple point cells at NPL", NPL report QM116, October 1995, see Table 3. Isotope effects are treated by using [8]. This report states a deviation of local tap water from SMOW of 0.024 mK, which KRISS divided by 3 to obtain 0.014 mK as standard uncertainty. The uncertainty from residual gas pressure has been referred to Table 2 of the report CCT/01-02 (B. Fellmuth et al.). This table also serves for estimating the contributions of the hydrostatic head correction. The contribution of the self-heating correction is estimated from the standard deviations of the corrections obtained for the two reference cells and the transfer cell. The effect of perturbing heat exchanges is determined from the immersion profile. The value corresponds mainly to the scattering of the data of four measurements of the profile. MSL: A comprehensive report on the uncertainty evaluation was submitted, of which the following is only a very short summary.
59/98
The isotopic composition of the five reference cells has been determined and corrections are applied. The propagated uncertainty in the correction is less than 1 µK. The effect of isotope fractionation during use has been investigated and a standard uncertainty of 1 µK has been assigned. The effect of residual gas pressure was estimated by bubble compression tests and is negligible. The concentration of ionic impurities was determined from the turnover frequency in the cell capacitance versus frequency as described in [10]. The contribution of low-volatility compounds in the water is estimated from the temperature difference between cells which were subject to very different outgassing periods during manufacture. The effect of crystal defects and strain in the ice mantle was estimated as 5 µK. The ratio of 2 between the two currents for the self heating correction has been verified and the related uncertainty taken as zero. The statistical uncertainty includes contributions of many sources, which can in practice not be separated. NIM: The contribution of the self-heating is estimated as the standard deviation of the mean of the individual results. To investigate the effects of impurities and isotopes cells with water from different sources have been compared. The temperatures agreed within 0.03 mK and the reproducibility of each cell was better than 0.03 mK. Therefore, the effect of isotopic composition is considered as very small. NIST: The effects of chemical impurities and isotopic composition are based on the range of differences between good cells manufactured using equatorial surface water. The influence of residual gas is determined from the air bubble size. The self-heating uncertainty is based on the range of extrapolated 0 mA values from multiple current measurements. The contribution of perturbing heat exchanges is based on the immersion profile (measured - expected at 3 cm from bottom). NMIJ: The temperature difference between six cells including the four national reference cells is smaller than 0.07 mK. Since this is less than the uncertainty due to impurities and isotopes as determined to be typically 0.1 mK in CCT working document CCT/01-02, the corresponding uncertainty is estimated as 0.1 mK. The wide-range non-linearity of the bridge is negligible. However, in a limited range, namely to the fourth sub-digits, its contribution may be considerable. Since a sufficient evaluation method is not available, the value 0.01 ppm provided by the manufacturer is used as the uncertainty. The uncertainty due to the self-heating correction is taken as zero due to the same geometric structure of the transfer cell and the reference cells. NMi-VSL: The contribution from chemical impurities has been taken from the CMC documentation. In 2003, four new cells were produced for which a chemical analysis and isotope analysis were made. These new cells were also compared with the transfer cell. The standard deviation of the four isotope corrections (6 µK) was taken as the uncertainty contribution due to isotopic composition. The isotopic composition of the reference cells is unknown and no uncertainty component is attributed to it. NPL: The concentration of chemical impurities was estimated as 1 part in 106. The influence of isotopic variation is estimated from the results of an isotope analysis. The self-heating uncertainty is considered as negligible due to the correlation between the measurements on two cells. Perturbing heat exchanges are estimated from the immersion profile. NRC: A comprehensive report on the uncertainty analysis was provided, of which the following is only a short summary. The contribution of chemical impurities is estimated from the known drift rate of -4 µK/yr ± 2 µK/yr and the age of the cell. No correction was applied for the drift since the reference cell
60/98
is only one year old. The isotopic composition of the transfer cell, which also serves as national reference, is known. A correction of -6.4 µK ± 1 µK (k=1) is applied. The uncertainty associated with residual gas has been estimated based on the note of R. White that was distributed to the CCT-K7 participants. During a comparison carried out at NRC in 1997 [11] it was observed that the increase in the solid-liquid interface during aging of an ice mantle, was accompanied by a decrease of 40 µK in the mean temperature. The resulting standard uncertainty was estimated as 10 µK and attributed to the reproducibility. The uncertainty of the hydrostatic head correction is determined from the uncertainty of the immersion depth (sensor midpoint and depth). The self-heating uncertainty was determined from the standard deviation of the observed corrections. The influence of perturbing heat exchanges is taken from the standard deviation of the differences between the predicted and measured hydrostatic head between 12.5 cm and 24.5 cm immersion. The combined uncertainty is rounded up from 14 µK to 20 µK. PTB: The effect of chemical impurities is estimated from comparisons between different cells of PTB and from comparisons with other NMIs. The result is in agreement with the expected effect from impurity content of water typically used for the manufacturing of TPW cells. The effect of isotopic composition was estimated from the typical variation of tap water in Germany. SMU: No additional information was provided by SMU. SPRING: A sample of the water was sent for laboratory test by the TPW cell manufacturer. Uncertainties related to impurities and isotopic composition are obtained from the report. UME: The laboratory has no facilities for analyzing impurities and isotopic composition. Therefore, UME evaluates the influence of chemical impurities using the result of comparisons of cells made at different times and by different techniques. The estimate is obtained from the dispersion of the results. VNIIM: No additional information was provided by VNIIM.
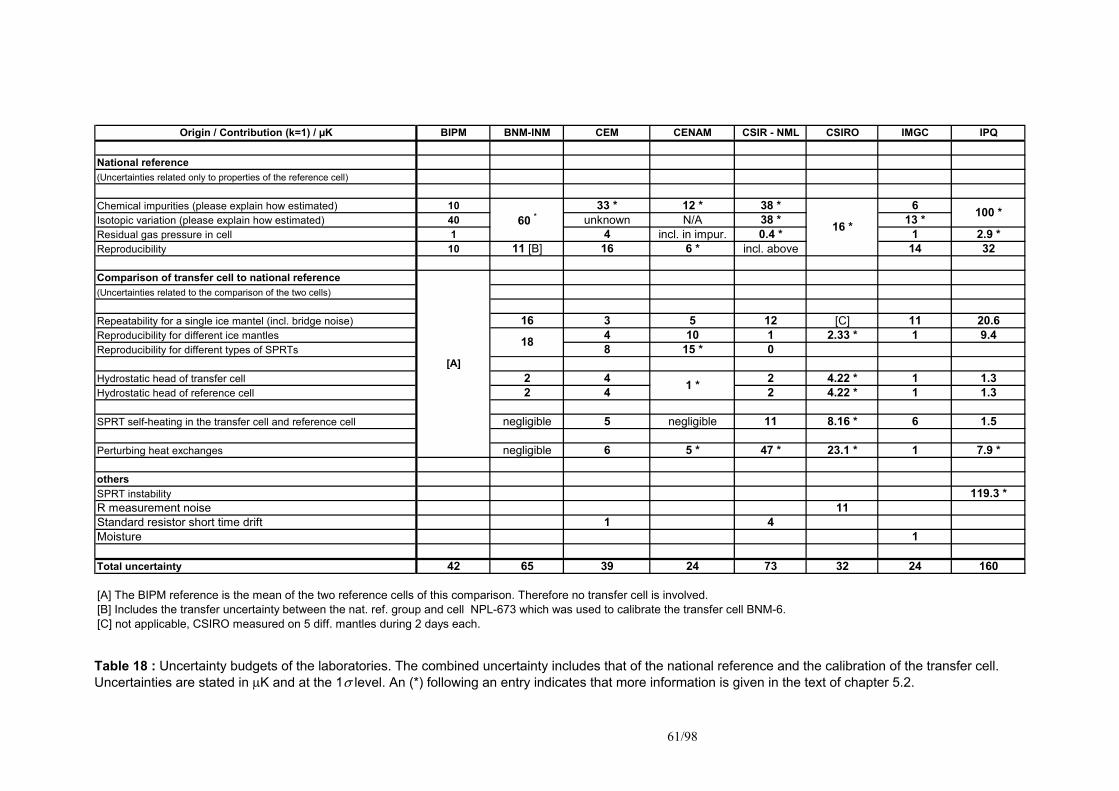
61/98
Origin / Contribution (k=1) / µK BIPM BNM-INM CEM CENAM CSIR - NML CSIRO IMGC IPQ
National reference (Uncertainties related only to properties of the reference cell)
Chemical impurities (please explain how estimated) 10 33 * 12 * 38 * 6Isotopic variation (please explain how estimated) 40 unknown N/A 38 * 13 *Residual gas pressure in cell 1 4 incl. in impur. 0.4 * 1 2.9 *Reproducibility 10 11 [B] 16 6 * incl. above 14 32
Comparison of transfer cell to national reference(Uncertainties related to the comparison of the two cells)
Repeatability for a single ice mantel (incl. bridge noise) 16 3 5 12 [C] 11 20.6Reproducibility for different ice mantles 4 10 1 2.33 * 1 9.4Reproducibility for different types of SPRTs 8 15 * 0
Hydrostatic head of transfer cell 2 4 2 4.22 * 1 1.3Hydrostatic head of reference cell 2 4 2 4.22 * 1 1.3
SPRT self-heating in the transfer cell and reference cell negligible 5 negligible 11 8.16 * 6 1.5
Perturbing heat exchanges negligible 6 5 * 47 * 23.1 * 1 7.9 *
othersSPRT instability 119.3 *R measurement noise 11Standard resistor short time drift 1 4Moisture 1
Total uncertainty 42 65 39 24 73 32 24 160
[A] The BIPM reference is the mean of the two reference cells of this comparison. Therefore no transfer cell is involved.[B] Includes the transfer uncertainty between the nat. ref. group and cell NPL-673 which was used to calibrate the transfer cell BNM-6.[C] not applicable, CSIRO measured on 5 diff. mantles during 2 days each.
16 *100 *
1 *
[A]
18
60 *
Table 18 : Uncertainty budgets of the laboratories. The combined uncertainty includes that of the national reference and the calibration of the transfer cell. Uncertainties are stated in µK and at the 1σ level. An (*) following an entry indicates that more information is given in the text of chapter 5.2.
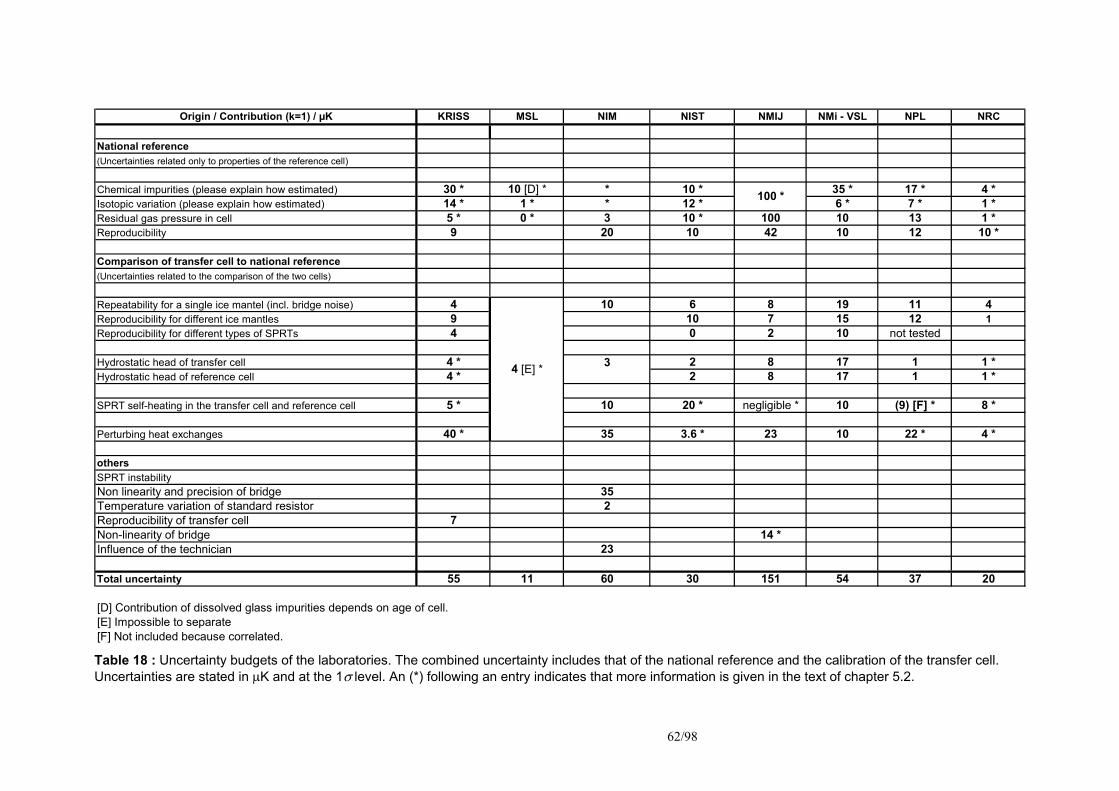
62/98
Origin / Contribution (k=1) / µK KRISS MSL NIM NIST NMIJ NMi - VSL NPL NRC
National reference (Uncertainties related only to properties of the reference cell)
Chemical impurities (please explain how estimated) 30 * 10 [D] * * 10 * 35 * 17 * 4 *Isotopic variation (please explain how estimated) 14 * 1 * * 12 * 6 * 7 * 1 *Residual gas pressure in cell 5 * 0 * 3 10 * 100 10 13 1 *Reproducibility 9 20 10 42 10 12 10 *
Comparison of transfer cell to national reference(Uncertainties related to the comparison of the two cells)
Repeatability for a single ice mantel (incl. bridge noise) 4 10 6 8 19 11 4Reproducibility for different ice mantles 9 10 7 15 12 1Reproducibility for different types of SPRTs 4 0 2 10 not tested
Hydrostatic head of transfer cell 4 * 3 2 8 17 1 1 *Hydrostatic head of reference cell 4 * 2 8 17 1 1 *
SPRT self-heating in the transfer cell and reference cell 5 * 10 20 * negligible * 10 (9) [F] * 8 *
Perturbing heat exchanges 40 * 35 3.6 * 23 10 22 * 4 *
othersSPRT instabilityNon linearity and precision of bridge 35Temperature variation of standard resistor 2Reproducibility of transfer cell 7Non-linearity of bridge 14 *Influence of the technician 23
Total uncertainty 55 11 60 30 151 54 37 20
[D] Contribution of dissolved glass impurities depends on age of cell.[E] Impossible to separate[F] Not included because correlated.
4 [E] *
100 *
Table 18 : Uncertainty budgets of the laboratories. The combined uncertainty includes that of the national reference and the calibration of the transfer cell. Uncertainties are stated in µK and at the 1σ level. An (*) following an entry indicates that more information is given in the text of chapter 5.2.
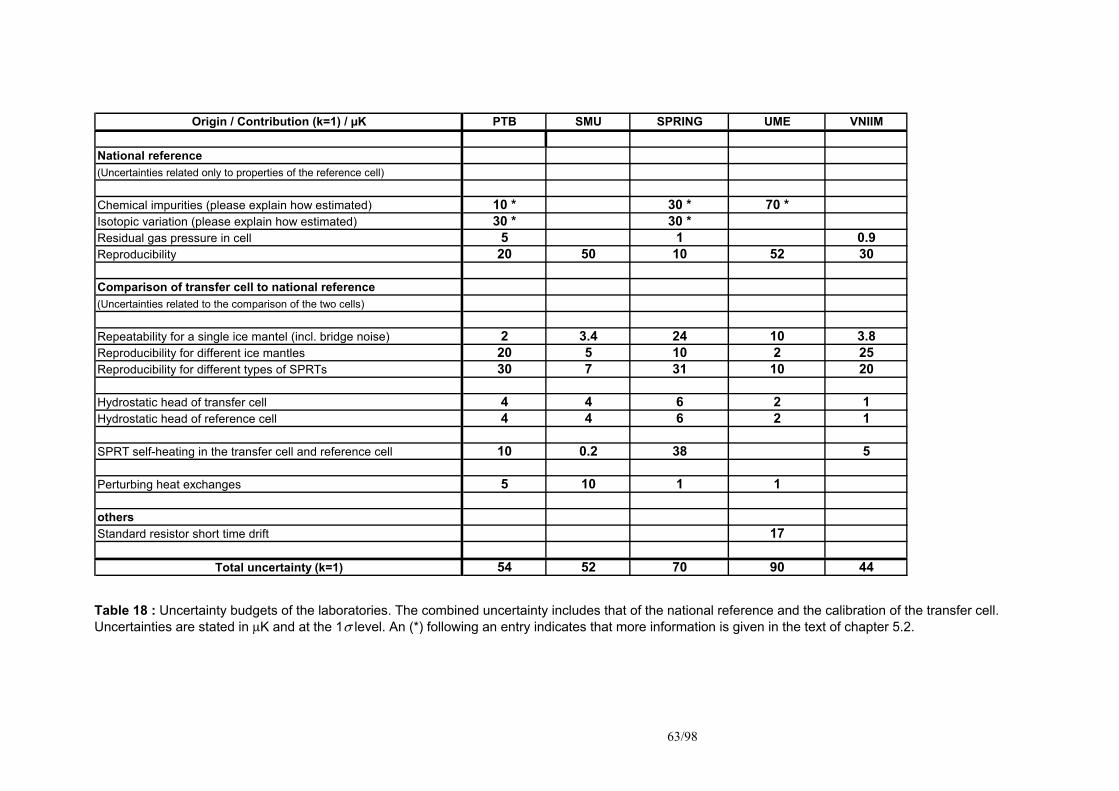
63/98
Origin / Contribution (k=1) / µK PTB SMU SPRING UME VNIIM
National reference (Uncertainties related only to properties of the reference cell)
Chemical impurities (please explain how estimated) 10 * 30 * 70 *Isotopic variation (please explain how estimated) 30 * 30 *Residual gas pressure in cell 5 1 0.9Reproducibility 20 50 10 52 30
Comparison of transfer cell to national reference(Uncertainties related to the comparison of the two cells)
Repeatability for a single ice mantel (incl. bridge noise) 2 3.4 24 10 3.8Reproducibility for different ice mantles 20 5 10 2 25Reproducibility for different types of SPRTs 30 7 31 10 20
Hydrostatic head of transfer cell 4 4 6 2 1Hydrostatic head of reference cell 4 4 6 2 1
SPRT self-heating in the transfer cell and reference cell 10 0.2 38 5
Perturbing heat exchanges 5 10 1 1
othersStandard resistor short time drift 17
Total uncertainty (k=1) 54 52 70 90 44 Table 18 : Uncertainty budgets of the laboratories. The combined uncertainty includes that of the national reference and the calibration of the transfer cell. Uncertainties are stated in µK and at the 1σ level. An (*) following an entry indicates that more information is given in the text of chapter 5.2.
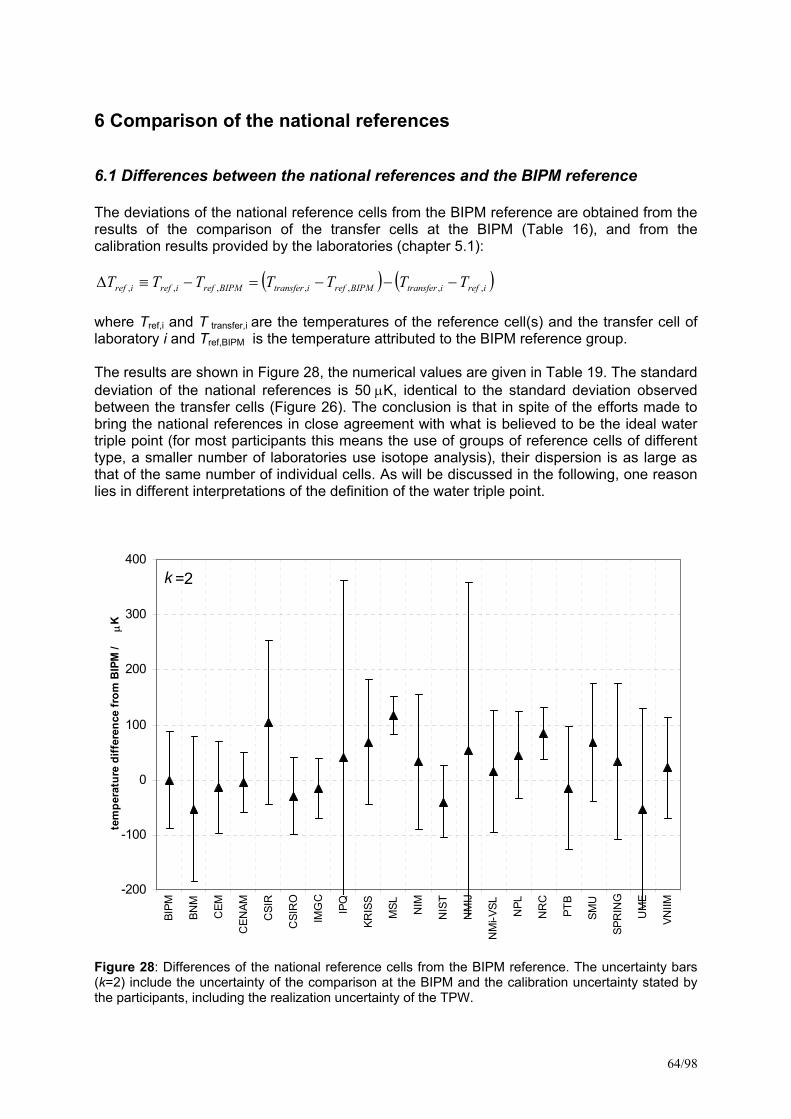
64/98
6 Comparison of the national references
6.1 Differences between the national references and the BIPM reference The deviations of the national reference cells from the BIPM reference are obtained from the results of the comparison of the transfer cells at the BIPM (Table 16), and from the calibration results provided by the laboratories (chapter 5.1):
( ) ( )irefitransferBIPMrefitransferBIPMrefirefiref TTTTTTT ,,,,,,, −−−=−≡∆ where Tref,i and T transfer,i are the temperatures of the reference cell(s) and the transfer cell of laboratory i and Tref,BIPM is the temperature attributed to the BIPM reference group. The results are shown in Figure 28, the numerical values are given in Table 19. The standard deviation of the national references is 50 µK, identical to the standard deviation observed between the transfer cells (Figure 26). The conclusion is that in spite of the efforts made to bring the national references in close agreement with what is believed to be the ideal water triple point (for most participants this means the use of groups of reference cells of different type, a smaller number of laboratories use isotope analysis), their dispersion is as large as that of the same number of individual cells. As will be discussed in the following, one reason lies in different interpretations of the definition of the water triple point.
-200
-100
0
100
200
300
400
BIPM
BNM
CEM
CEN
AM
CSI
R
CSI
RO
IMG
C
IPQ
KRIS
S
MSL NIM
NIS
T
NM
IJ
NM
i-VSL NPL
NR
C
PTB
SMU
SPR
ING
UM
E
VNIIM
tem
pera
ture
diff
eren
ce fr
om B
IPM
/ µ
K
k =2
Figure 28: Differences of the national reference cells from the BIPM reference. The uncertainty bars (k=2) include the uncertainty of the comparison at the BIPM and the calibration uncertainty stated by the participants, including the realization uncertainty of the TPW.
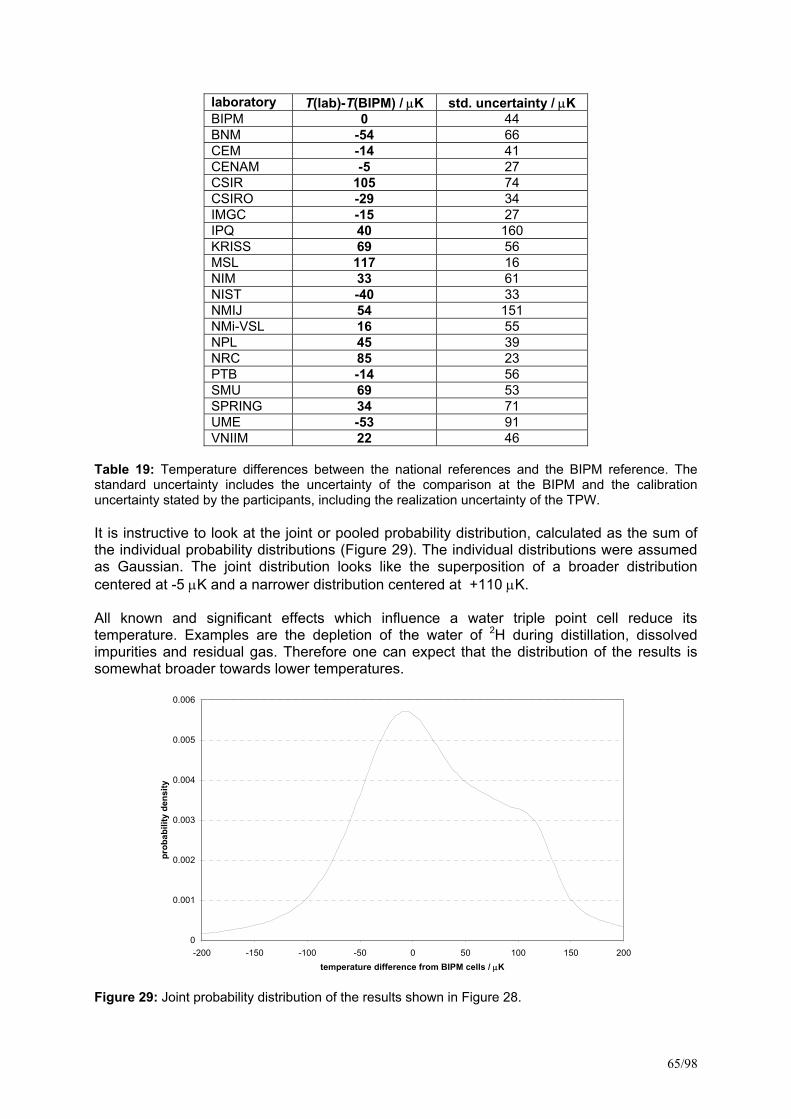
65/98
laboratory T(lab)-T(BIPM) / µK std. uncertainty / µK BIPM 0 44 BNM -54 66 CEM -14 41 CENAM -5 27 CSIR 105 74 CSIRO -29 34 IMGC -15 27 IPQ 40 160 KRISS 69 56 MSL 117 16 NIM 33 61 NIST -40 33 NMIJ 54 151 NMi-VSL 16 55 NPL 45 39 NRC 85 23 PTB -14 56 SMU 69 53 SPRING 34 71 UME -53 91 VNIIM 22 46
Table 19: Temperature differences between the national references and the BIPM reference. The standard uncertainty includes the uncertainty of the comparison at the BIPM and the calibration uncertainty stated by the participants, including the realization uncertainty of the TPW. It is instructive to look at the joint or pooled probability distribution, calculated as the sum of the individual probability distributions (Figure 29). The individual distributions were assumed as Gaussian. The joint distribution looks like the superposition of a broader distribution centered at -5 µK and a narrower distribution centered at +110 µK. All known and significant effects which influence a water triple point cell reduce its temperature. Examples are the depletion of the water of 2H during distillation, dissolved impurities and residual gas. Therefore one can expect that the distribution of the results is somewhat broader towards lower temperatures.
0
0.001
0.002
0.003
0.004
0.005
0.006
-200 -150 -100 -50 0 50 100 150 200temperature difference from BIPM cells / µK
prob
abili
ty d
ensi
ty
Figure 29: Joint probability distribution of the results shown in Figure 28.
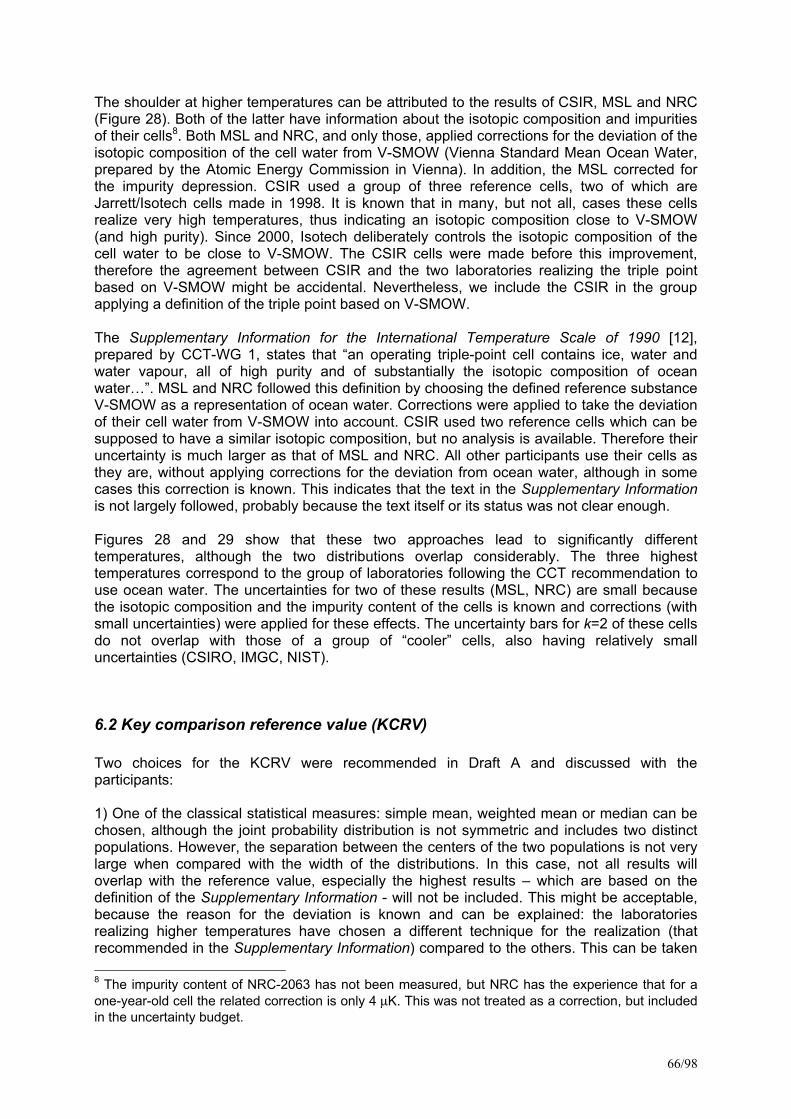
66/98
The shoulder at higher temperatures can be attributed to the results of CSIR, MSL and NRC (Figure 28). Both of the latter have information about the isotopic composition and impurities of their cells8. Both MSL and NRC, and only those, applied corrections for the deviation of the isotopic composition of the cell water from V-SMOW (Vienna Standard Mean Ocean Water, prepared by the Atomic Energy Commission in Vienna). In addition, the MSL corrected for the impurity depression. CSIR used a group of three reference cells, two of which are Jarrett/Isotech cells made in 1998. It is known that in many, but not all, cases these cells realize very high temperatures, thus indicating an isotopic composition close to V-SMOW (and high purity). Since 2000, Isotech deliberately controls the isotopic composition of the cell water to be close to V-SMOW. The CSIR cells were made before this improvement, therefore the agreement between CSIR and the two laboratories realizing the triple point based on V-SMOW might be accidental. Nevertheless, we include the CSIR in the group applying a definition of the triple point based on V-SMOW. The Supplementary Information for the International Temperature Scale of 1990 [12], prepared by CCT-WG 1, states that “an operating triple-point cell contains ice, water and water vapour, all of high purity and of substantially the isotopic composition of ocean water…”. MSL and NRC followed this definition by choosing the defined reference substance V-SMOW as a representation of ocean water. Corrections were applied to take the deviation of their cell water from V-SMOW into account. CSIR used two reference cells which can be supposed to have a similar isotopic composition, but no analysis is available. Therefore their uncertainty is much larger as that of MSL and NRC. All other participants use their cells as they are, without applying corrections for the deviation from ocean water, although in some cases this correction is known. This indicates that the text in the Supplementary Information is not largely followed, probably because the text itself or its status was not clear enough. Figures 28 and 29 show that these two approaches lead to significantly different temperatures, although the two distributions overlap considerably. The three highest temperatures correspond to the group of laboratories following the CCT recommendation to use ocean water. The uncertainties for two of these results (MSL, NRC) are small because the isotopic composition and the impurity content of the cells is known and corrections (with small uncertainties) were applied for these effects. The uncertainty bars for k=2 of these cells do not overlap with those of a group of “cooler” cells, also having relatively small uncertainties (CSIRO, IMGC, NIST).
6.2 Key comparison reference value (KCRV) Two choices for the KCRV were recommended in Draft A and discussed with the participants: 1) One of the classical statistical measures: simple mean, weighted mean or median can be chosen, although the joint probability distribution is not symmetric and includes two distinct populations. However, the separation between the centers of the two populations is not very large when compared with the width of the distributions. In this case, not all results will overlap with the reference value, especially the highest results – which are based on the definition of the Supplementary Information - will not be included. This might be acceptable, because the reason for the deviation is known and can be explained: the laboratories realizing higher temperatures have chosen a different technique for the realization (that recommended in the Supplementary Information) compared to the others. This can be taken 8 The impurity content of NRC-2063 has not been measured, but NRC has the experience that for a one-year-old cell the related correction is only 4 µK. This was not treated as a correction, but included in the uncertainty budget.
67/98
into account during the assessment of the CMCs, and these laboratories are not necessarily penalized. Draft A recommended, in particular, the weighted mean, although the simple mean and the median were found to be quite similar. To elaborate further on the nature of the data, three laboratories are representative of one population of cells (two are of recent manufacture by Isotech, who manipulate the composition during production to be close to SMOW; one has a correction applied to bring it in line with the SMOW value); the remaining 18 laboratories used cells that seem representative of a different population (lying about 100 µK below the first group, almost certainly due to different isotopic composition). A simple analysis reveals the reduced chi-squared tests of three different null hypotheses. The complete 21-cell data set fails the null hypothesis that the data are drawn from a single (normal) population which is scaled by each NMI’s stated standard uncertainty: the reduced chi-squared is larger than 2, and the probability of exceeding this value by chance is only 0.03%. In contrast, there is no statistical evidence to reject the null hypotheses that the 3-cell 'SMOW' group and the 18-cell 'non-SMOW' group of cells are each drawn from its own distinct population (normal, with breadth scaled by each NMI’s standard uncertainty): the reduced chi-squared values are less than 1 for both tests. As such, the conclusion guided by physical intuition based on the participants’ stated measurands is sound: there are indeed two different populations being sampled by the cells used in this key comparison. Cox, writing on behalf of the BIPM Director’s Advisory Group on Statistics, has recommended that any key comparison data set that fails the null-hypothesis test against the inverse-variance weighted mean should be represented by a KCRV determined as the median or some other appropriate quantity [15]. Like the traditional reduced chi-squared against the inverse-variance weighted mean, the reduced chi-squared against the median is also larger than 2; the probability of exceeding this value by chance is only 0.05%. Similarly, chi-squared null-hypothesis testing against the simple mean reveals compelling evidence for rejection: the reduced chi-squared value is greater than 2, and the probability of exceeding it by chance is only 0.24%. Neither of the two “usual” alternate KCRV statistics can be deemed “appropriate” for this data set on the basis of null hypothesis testing. Thus, it seems unreasonable to believe that the complete data set can be adequately represented by a single choice of aggregate value. In fact, once the interpretation that the data are drawn from two distinct populations is accepted, there is no simple statistical quantity computed numerically from the measurement results that can serve as a physically-meaningful KCRV. Nevertheless such a simple statistical quantity has a statistical meaning because it represents the centre of the statistical distribution. 2) The realizations based on the use of V-SMOW could be used to derive the KCRV. Inspection of Figure 28 shows that three or four results would not overlap with such a reference value. The advantage of this solution is that it is coherent with the definition of a water triple point cell given in the Supplementary Information and would put pressure on those laboratories which have not yet presented analysis results or do not use them for a correction. On the other hand, such a reference value would not be very appropriate for demonstrating the equivalence of the laboratories. On the matter of isotopic composition, the phrase "substantially the isotopic composition of ocean water" found in the Supplementary Information was intended to fix the target isotopic composition. Footnote “b” of Table 1 of the Metrologia description of ITS-90 [2] makes the following reference to the Supplementary Information: “For complete definitions and advice on the realization of these various states, see “Supplementary Information for the ITS-90.”” References to the Supplementary Information appear throughout the text of the scale definition, and the two were purposely linked. It is an unfortunate historical fact that there is no explicit text regarding the isotopic composition of water in the ITS-90, in contrast to the case for the 1975 Amended Edition of the IPTS-68 [17]. Though many of the CCT-K7 participants lacked the necessary isotopic analyses to correct the temperatures of their cells
68/98
to a common composition, some who had such information chose not to make such corrections. During the discussion it became clear that a majority of the participants favoured the classical statistical measures, especially the simple mean. The main arguments against the use of a reference value corresponding to water with substantially the isotopic composition of SMOW were that such a value would be based on the results from only three laboratories and would not be representative of the overall set of results. Others argued that the authority of the text of the Supplementary Information was not clear enough. Those in favour of the SMOW definition argued that the simple mean of the whole data set, comprising two different populations, would be unscientific. It would also discount the recommendation of the CCT to use ocean water. The compromise finally adopted was to use the simple mean as KCRV for the comparison, to represent the state-of-the-art at the time of the comparison. It is clear that this KCRV is not the best possible approximation of the true SI value, particularly if this is associated with water having isotopic composition equivalent to the SMOW definition. Nevertheless, the comparison has demonstrated that the two approaches lead to significantly different results which are very probably linked to differences in the isotopic composition. In future, the common adoption of a definition based on a specified standard composition for ocean water would allow improvements to the consistency of the national realizations. The working groups of the CCT shall study the situation and prepare a recommendation. For this key comparison, the KCRV is based on the mean value of the results from all of the participants, including some laboratories who made corrections for the influence of chemical impurities and isotopic composition, and some who did not. The uncertainty of the KCRV is taken to be the standard deviation of the mean of the data set. Because the distribution of the pooled data is multimodal, care should be taken when using this quantity for calculating confidence intervals. In the following, we calculate the simple mean of the results. To allow comparison, we also calculate the weighted mean and the median. The uncertainty of the mean is calculated as the standard deviation of the mean. It was decided not to use the propagated uncertainties of the participants’ results because many of them are underestimated. The uncertainty of the weighted mean xw is accordingly calculated as the weighted standard deviation of the mean:
( )( )∑
∑−
−
−
−= 2
22
1)(
j
iwiw un
uxxxu , where the individual uncertainties ui are taken from Table 19.
The weights used to calculate the weighted mean and its uncertainty are in both cases the inverse squares of the uncertainties. The formula for the uncertainty of the median xm is taken from [14]
( ) NixxN
xu mim ,...,1,med1
9.1)( =−−
= , where med(..) stands for the median of the
arguments. Table 20 shows the results for the three estimators, relative to the BIPM reference. The Birge ratio compares the standard deviation of the mean and the weighted mean with the uncertainties calculated as propagated uncertainties from the individual results.
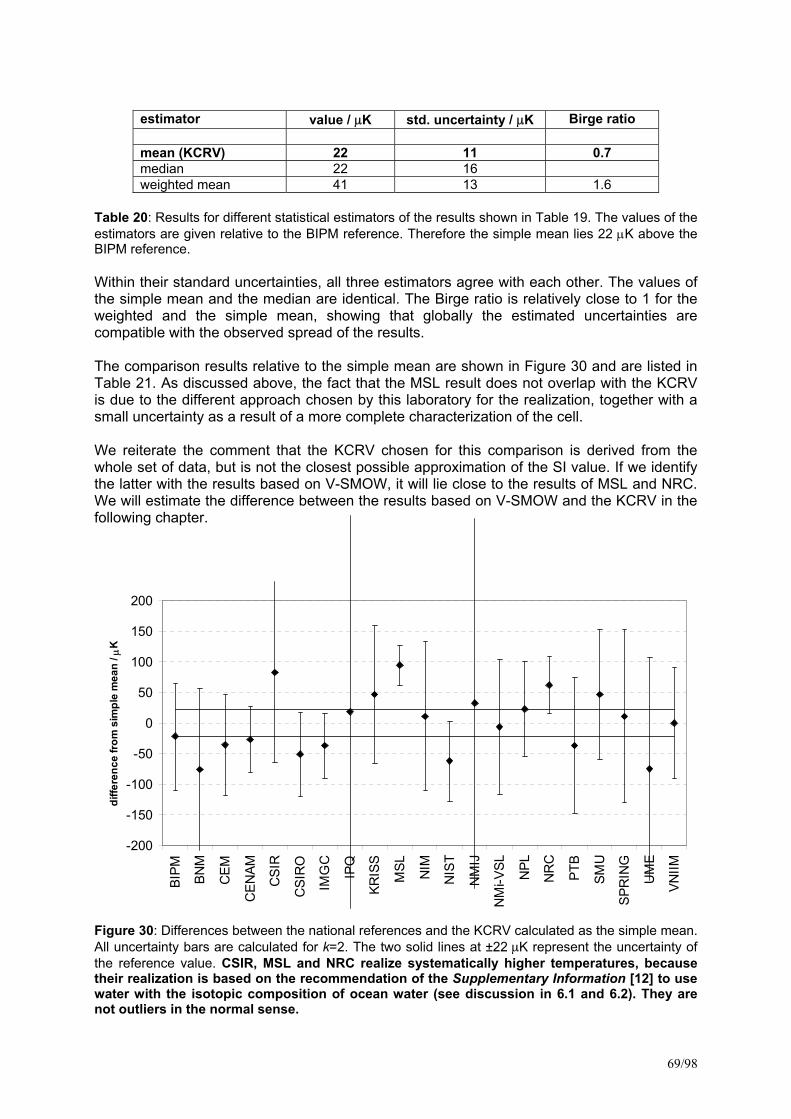
69/98
estimator value / µK std. uncertainty / µK Birge ratio mean (KCRV) 22 11 0.7 median 22 16 weighted mean 41 13 1.6
Table 20: Results for different statistical estimators of the results shown in Table 19. The values of the estimators are given relative to the BIPM reference. Therefore the simple mean lies 22 µK above the BIPM reference. Within their standard uncertainties, all three estimators agree with each other. The values of the simple mean and the median are identical. The Birge ratio is relatively close to 1 for the weighted and the simple mean, showing that globally the estimated uncertainties are compatible with the observed spread of the results. The comparison results relative to the simple mean are shown in Figure 30 and are listed in Table 21. As discussed above, the fact that the MSL result does not overlap with the KCRV is due to the different approach chosen by this laboratory for the realization, together with a small uncertainty as a result of a more complete characterization of the cell. We reiterate the comment that the KCRV chosen for this comparison is derived from the whole set of data, but is not the closest possible approximation of the SI value. If we identify the latter with the results based on V-SMOW, it will lie close to the results of MSL and NRC. We will estimate the difference between the results based on V-SMOW and the KCRV in the following chapter.
-200
-150
-100
-50
0
50
100
150
200
BIPM BN
M
CEM
CEN
AM
CSI
R
CSI
RO
IMG
C
IPQ
KRIS
S
MSL NIM
NIS
T
NM
IJ
NM
i-VSL
NPL
NR
C
PTB
SMU
SPR
ING
UM
E
VNIIM
diffe
renc
e fro
m s
impl
e m
ean
/ µK
Figure 30: Differences between the national references and the KCRV calculated as the simple mean. All uncertainty bars are calculated for k=2. The two solid lines at ±22 µK represent the uncertainty of the reference value. CSIR, MSL and NRC realize systematically higher temperatures, because their realization is based on the recommendation of the Supplementary Information [12] to use water with the isotopic composition of ocean water (see discussion in 6.1 and 6.2). They are not outliers in the normal sense.
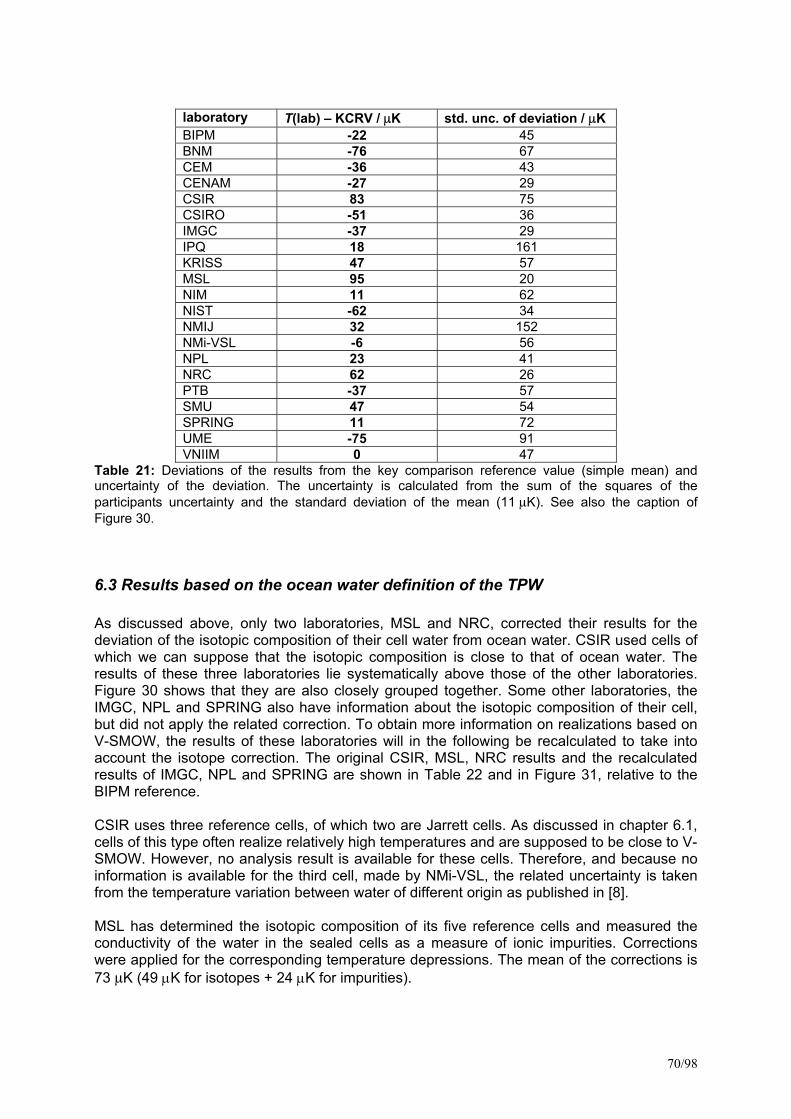
70/98
laboratory T(lab) – KCRV / µK std. unc. of deviation / µK BIPM -22 45 BNM -76 67 CEM -36 43 CENAM -27 29 CSIR 83 75 CSIRO -51 36 IMGC -37 29 IPQ 18 161 KRISS 47 57 MSL 95 20 NIM 11 62 NIST -62 34 NMIJ 32 152 NMi-VSL -6 56 NPL 23 41 NRC 62 26 PTB -37 57 SMU 47 54 SPRING 11 72 UME -75 91 VNIIM 0 47
Table 21: Deviations of the results from the key comparison reference value (simple mean) and uncertainty of the deviation. The uncertainty is calculated from the sum of the squares of the participants uncertainty and the standard deviation of the mean (11 µK). See also the caption of Figure 30.
6.3 Results based on the ocean water definition of the TPW As discussed above, only two laboratories, MSL and NRC, corrected their results for the deviation of the isotopic composition of their cell water from ocean water. CSIR used cells of which we can suppose that the isotopic composition is close to that of ocean water. The results of these three laboratories lie systematically above those of the other laboratories. Figure 30 shows that they are also closely grouped together. Some other laboratories, the IMGC, NPL and SPRING also have information about the isotopic composition of their cell, but did not apply the related correction. To obtain more information on realizations based on V-SMOW, the results of these laboratories will in the following be recalculated to take into account the isotope correction. The original CSIR, MSL, NRC results and the recalculated results of IMGC, NPL and SPRING are shown in Table 22 and in Figure 31, relative to the BIPM reference. CSIR uses three reference cells, of which two are Jarrett cells. As discussed in chapter 6.1, cells of this type often realize relatively high temperatures and are supposed to be close to V-SMOW. However, no analysis result is available for these cells. Therefore, and because no information is available for the third cell, made by NMi-VSL, the related uncertainty is taken from the temperature variation between water of different origin as published in [8]. MSL has determined the isotopic composition of its five reference cells and measured the conductivity of the water in the sealed cells as a measure of ionic impurities. Corrections were applied for the corresponding temperature depressions. The mean of the corrections is 73 µK (49 µK for isotopes + 24 µK for impurities).
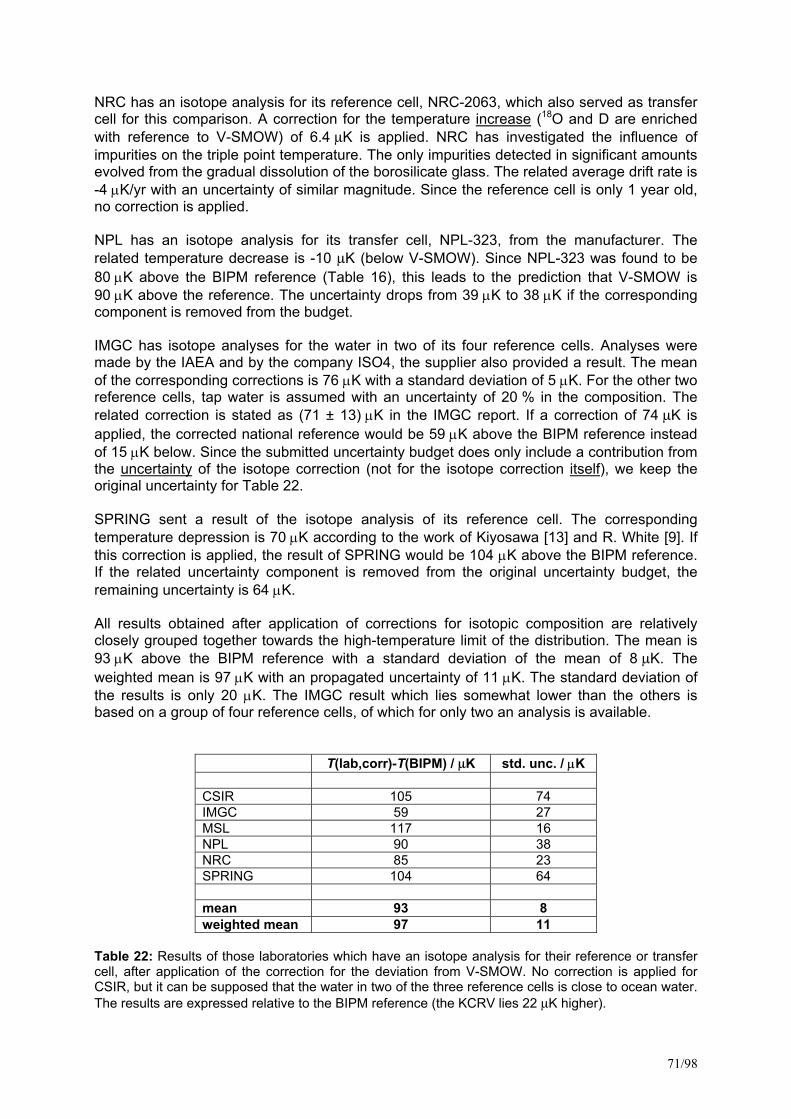
71/98
NRC has an isotope analysis for its reference cell, NRC-2063, which also served as transfer cell for this comparison. A correction for the temperature increase (18O and D are enriched with reference to V-SMOW) of 6.4 µK is applied. NRC has investigated the influence of impurities on the triple point temperature. The only impurities detected in significant amounts evolved from the gradual dissolution of the borosilicate glass. The related average drift rate is -4 µK/yr with an uncertainty of similar magnitude. Since the reference cell is only 1 year old, no correction is applied. NPL has an isotope analysis for its transfer cell, NPL-323, from the manufacturer. The related temperature decrease is -10 µK (below V-SMOW). Since NPL-323 was found to be 80 µK above the BIPM reference (Table 16), this leads to the prediction that V-SMOW is 90 µK above the reference. The uncertainty drops from 39 µK to 38 µK if the corresponding component is removed from the budget. IMGC has isotope analyses for the water in two of its four reference cells. Analyses were made by the IAEA and by the company ISO4, the supplier also provided a result. The mean of the corresponding corrections is 76 µK with a standard deviation of 5 µK. For the other two reference cells, tap water is assumed with an uncertainty of 20 % in the composition. The related correction is stated as (71 ± 13) µK in the IMGC report. If a correction of 74 µK is applied, the corrected national reference would be 59 µK above the BIPM reference instead of 15 µK below. Since the submitted uncertainty budget does only include a contribution from the uncertainty of the isotope correction (not for the isotope correction itself), we keep the original uncertainty for Table 22. SPRING sent a result of the isotope analysis of its reference cell. The corresponding temperature depression is 70 µK according to the work of Kiyosawa [13] and R. White [9]. If this correction is applied, the result of SPRING would be 104 µK above the BIPM reference. If the related uncertainty component is removed from the original uncertainty budget, the remaining uncertainty is 64 µK. All results obtained after application of corrections for isotopic composition are relatively closely grouped together towards the high-temperature limit of the distribution. The mean is 93 µK above the BIPM reference with a standard deviation of the mean of 8 µK. The weighted mean is 97 µK with an propagated uncertainty of 11 µK. The standard deviation of the results is only 20 µK. The IMGC result which lies somewhat lower than the others is based on a group of four reference cells, of which for only two an analysis is available.
T(lab,corr)-T(BIPM) / µK std. unc. / µK CSIR 105 74 IMGC 59 27 MSL 117 16 NPL 90 38 NRC 85 23 SPRING 104 64 mean 93 8 weighted mean 97 11
Table 22: Results of those laboratories which have an isotope analysis for their reference or transfer cell, after application of the correction for the deviation from V-SMOW. No correction is applied for CSIR, but it can be supposed that the water in two of the three reference cells is close to ocean water. The results are expressed relative to the BIPM reference (the KCRV lies 22 µK higher).
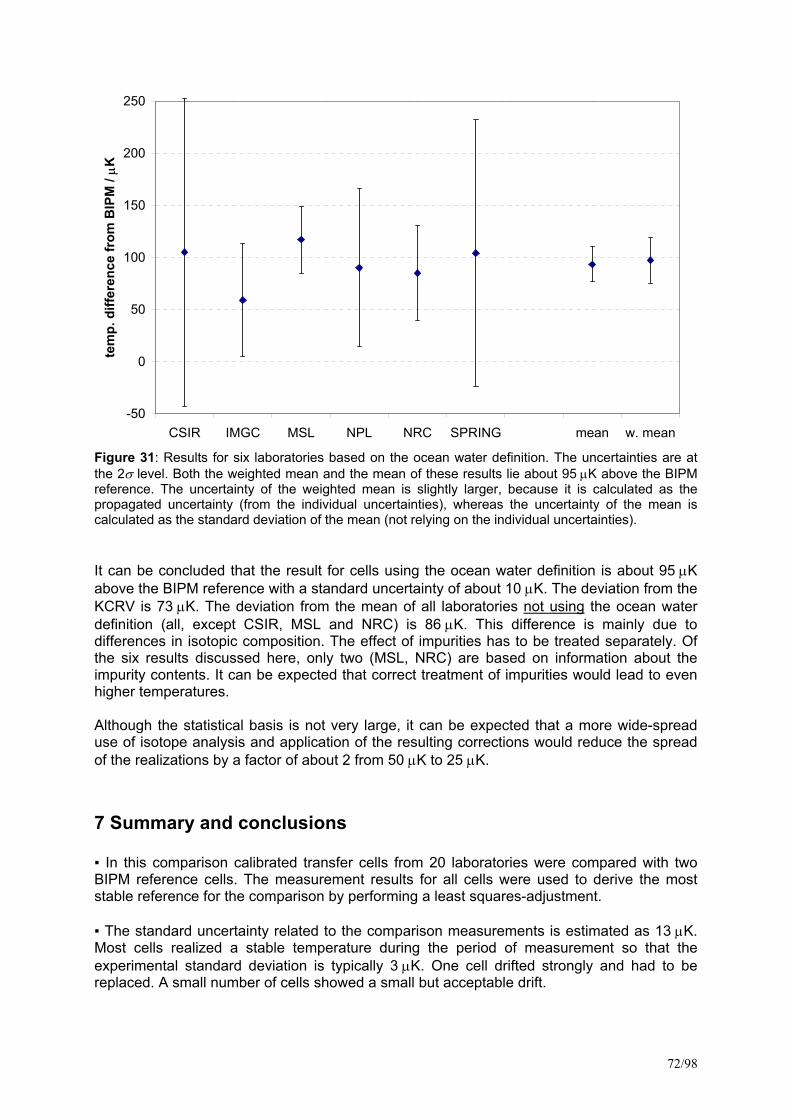
72/98
-50
0
50
100
150
200
250
CSIR IMGC MSL NPL NRC SPRING mean w. mean
tem
p. d
iffer
ence
from
BIP
M /
µK
Figure 31: Results for six laboratories based on the ocean water definition. The uncertainties are at the 2σ level. Both the weighted mean and the mean of these results lie about 95 µK above the BIPM reference. The uncertainty of the weighted mean is slightly larger, because it is calculated as the propagated uncertainty (from the individual uncertainties), whereas the uncertainty of the mean is calculated as the standard deviation of the mean (not relying on the individual uncertainties). It can be concluded that the result for cells using the ocean water definition is about 95 µK above the BIPM reference with a standard uncertainty of about 10 µK. The deviation from the KCRV is 73 µK. The deviation from the mean of all laboratories not using the ocean water definition (all, except CSIR, MSL and NRC) is 86 µK. This difference is mainly due to differences in isotopic composition. The effect of impurities has to be treated separately. Of the six results discussed here, only two (MSL, NRC) are based on information about the impurity contents. It can be expected that correct treatment of impurities would lead to even higher temperatures. Although the statistical basis is not very large, it can be expected that a more wide-spread use of isotope analysis and application of the resulting corrections would reduce the spread of the realizations by a factor of about 2 from 50 µK to 25 µK.
7 Summary and conclusions In this comparison calibrated transfer cells from 20 laboratories were compared with two BIPM reference cells. The measurement results for all cells were used to derive the most stable reference for the comparison by performing a least squares-adjustment. The standard uncertainty related to the comparison measurements is estimated as 13 µK. Most cells realized a stable temperature during the period of measurement so that the experimental standard deviation is typically 3 µK. One cell drifted strongly and had to be replaced. A small number of cells showed a small but acceptable drift.
73/98
The differences between the transfer cells, all of high quality as required by the comparison protocol, are characterized by a standard deviation of 50 µK, the difference between the two extremes is 163 µK. The results of the comparison of the transfer cells together with the calibrations made by the laboratories allows one to calculate the differences between the national references. The national references show the same standard deviation, 50 µK, as the transfer cells, the difference between the extremes is 171 µK. Two laboratories (MSL and NRC) applied corrections for deviations of the isotopic composition from ocean water, represented by V-SMOW. CSIR uses reference cells which can be expected to be close to ocean water. These laboratories follow a recommendation by the CCT in the Supplementary Information for the ITS-90 to use water of the isotopic composition of ocean water. They realize significantly higher temperatures (+ 86 µK) than other laboratories. If the results of three other laboratories, which have isotopic information but did not apply the correction, are correspondingly recalculated, they come into close agreement with the MSL and NRC results. Due to the two different definitions of the water triple point used, the results show a bimodal distribution, the two peaks being separated by approximately 100 µK. It is therefore not easy to define a meaningful key comparison reference value. As a result of the discussion which took place between participants after distribution of Draft A, the KCRV is calculated as the simple mean of the individual results. This KCRV is not the best possible approximation of the true SI value, if this is related to the V-SMOW definition. It represents the current practice at the time of the comparison. The result based on the ocean water definition lies about 70 µK above the KCRV. From the close agreement of the six results based on ocean water, it can be expected that the general use of this technique would reduce the spread of the results considerably. The pilot of the comparison therefore suggested that the working groups of the CCT analyze the situation and prepare a recommendation to the members of the CCT. The chair of Working Group 1 of the CCT initiated the creation of a task group. The proposal of this group, that the definition of the kelvin should refer to water of a specified isotopic composition (V-SMOW), was approved by the CCT during its meeting in 2005. Subsequently, the CIPM adopted the CCT Recommendation T1 (2005) to clarify the isotopic composition of water in the definition of the kelvin in the SI brochure (Recommendation 2 CI-2005). The 8th edition of the SI brochure will include the corresponding information.
8 Acknowledgements During the preparation of the comparison protocol we had many helpful discussions with Greg Strouse and Dean Ripple from NIST, and with Eliane Renaot and Georges Bonnier from the BNM-INM. This helped us in clarifying the expected outcome of the comparison. One of us (S. Solve) was given the opportunity to work in the Thermometry Laboratory of NIST for one week. During the measurement phase we obtained valuable support from BNM-INM who sent us one of their staff members, Mrs. Maï Huong-Hoang-Valin, for the preparation of the ice mantles for each group of cells. Rod White and Mark Bart from MSL undertook to verify our calculations and helped to assure the correctness of the report. Finally, the comparison would not have been possible without the cooperation of the participating laboratories which, by and large, sent their water triple point cells and
74/98
measurement reports in a timely way. The discussion of the results led to many improvements of the report.
9 References [1] The International System of Units (SI), edited by the BIPM, 7th edition, 1998, ISBN 92-822-
2154-7. [2] The International Temperature Scale of 1990 (ITS-90), H. Preston-Thomas, Metrologia, 1990,
27, 3-10. [3] Report on the international comparison of water triple-point cells, R. Pello, R. Goebel,
R. Köhler, BIPM report 96/8 and CCT document CCT/96-1. [4] Preparation at the BIPM for a key comparison of water triple-point cells, S. Solve, M. Stock,
Temperature: Its Measurement and Control in Science and Industry, Am. Inst. Phys., New York, Vol. 7, 2003, 891-896.
[5] A method for calibrating resistance bridges, D. R. White, Proceedings TEMPMEKO '96, ed.
Piero Marcarino, Levrotto & Bella - Torino, 129-134. [6] Contribution of uncertainty in resistance measurements to uncertainty in ITS-90, D. R. White,
Temperature: Its Measurement and Control in Science and Industry, Am. Inst. Phys., New York, Vol. 7, 2003, 321-326.
[7] Interlaboratory comparison of realizations of the triple point of water, E. Renaot, M. Elgourdou
and G. Bonnier, Metrologia, 2000, 37, 693-699. [8] Isotopic composition of water used for triple point of water cells, J. V. Nicholas,
T. D. Dransfield, D. R. White, Metrologia, 1996, 33, 265-267. [9] Effects of heavy hydrogen and oxygen on the triple-point temperature of water, D. R. White et
al, Temperature: Its Measurement and Control in Science and Industry, Am. Inst. Phys., New York, Vol. 7, 2003, 221-226.
[10] A technique for in-situ measurement of the conductivity of water in triple point of water cells,
M. Ballico, Meas. Sci. Technol. 1999, 10, L33-36. [11] K. D. Hill, TEMPBEIJING '97, Proc. Int. Conf. Temperature and Thermal Measurements,
Beijing, Standards Press of China, 1997, 10-15. [12] Supplementary Information for the International Temperature Scale of 1990, BIPM, ISBN 92-
822-2111-3, reprint 1997. [13] Freezing point of mixtures of H2
16O and H218O, K. Kiyosawa, J. Soln. Chem. 20, 1991, 583-
588. [14] Possible advantages of a robust evaluation of comparisons, J. W. Müller, BIPM report BIPM-
95/2. Reprinted in J. Res. Natl. Inst. Stand. Technol., 105, 2000, 551-555. [15] The evaluation of key comparison data, M. Cox, Metrologia, 2002, 39, 589-595. [16] Effect of crystal size, form and stability on the triple point of water, E. Méndez-Lango,
Proceedings TEMPMEKO '96, ed. Piero Marcarino, Levrotto & Bella - Torino, 57-62. [17] The international practical temperature scale of 1968 – amended edition of 1975, Metrologia,
1976, 12, 7-17.
Appendix 1 - Technical Protocol
75/98
Appendix 1 - Technical Protocol
Protocol for the CIPM key comparison of water triple point cells CCT-K7 M. Stock, S. Solve, BIPM 19 June 2002 Contents 1. Introduction 2. Objectives of the comparison 3. Organization of the comparison 4. Selection of cells 5. Measurement instructions 6. Reporting of results 7. Measurements at the BIPM 8. Results of the comparison References Appendix Standard BIPM technique for preparation of ice mantles in TPW cells Measurement report form and example for uncertainty budget
Appendix 1 - Technical Protocol
76/98
1. Introduction Under the Mutual Recognition Arrangement (MRA) [A1] the metrological equivalence of national measurement standards is determined by a set of key comparisons chosen and organized by the Consultative Committees of the CIPM working closely with the Regional Metrology Organizations (RMOs). At its meeting in September 2001, the Consultative Committee for Thermometry, CCT, decided to carry out a key comparison of water triple point cells, which is designated as CCT-K7. The BIPM was charged with organizing this comparison, with support from BNM-INM (France), NIST (USA) and UME (Turkey). The technical protocol has been drawn up by the BIPM following discussions with BNM-INM and NIST. This protocol describes the objectives of the comparison, its organization and the procedures to be followed by the participants. It follows the ‘Guidelines for key comparisons’ established by the BIPM [A2], and is based on current best practice. It takes into account experience gained from the previous comparison of water triple point cells [A3] and comments from the members and observers of the CCT. All participants of this key comparison accept the general instructions and the technical protocol written down in this document and commit themselves to follow the procedures. Once the protocol and list of participants has been agreed, no change to the protocol or list of participants may be made without prior agreement of all participants. 2. Objectives of the comparison This comparison will serve two distinct objectives: 1) a direct comparison of water triple point cells (TPW cells) to quantify differences
between cells and 2) a comparison of calibrations of these cells provided by the participants. To reach the first objective, each participating laboratory will send one of its cells to the BIPM, where all cells will be compared using the same technique to prepare the ice mantles (the standard BIPM technique, see appendix) and the same instrumentation. All cells should be carefully selected and free from obvious defects (paragraph 4). Therefore the observed dispersion can be seen as a measure of the reproducibility of the water triple point temperature. If significant differences are found between cells it would be interesting to try to correlate them to the isotopic composition or to its impurities. Therefore, wherever possible, cells should come with an isotope and/or impurity analysis. To reach the second objective, each participating laboratory will state a value for the temperature difference of the transfer cell, relative to the corresponding national standard,
Appendix 1 - Technical Protocol
77/98
representing 273.16 K. This temperature difference has to be accompanied by an estimate of its uncertainty, including budgets for both the uncertainty of the national standard and of the direct comparison of the transfer cell to the national standard. A model for this uncertainty budget is given in the appendix. This information in conjunction with the key comparison measurements will allow a comparison of the calibrations provided by the participants and an evaluation of the underlying realizations of the water triple point temperature of the various national laboratories. This information can be a basis for a later assessment of CMC claims. 3. Organization of the comparison All CCT members and observers, and only these, are invited to participate in this comparison. The list of participants, based on the circulation of the protocol (version 29 May 2002) is the following: BNM-INM NMi-VSL (*) SPRING CSIR-NML NMIJ UME IMGC-CNR NML-CSIRO VNIIM KRISS NPL CEM MSL NRC CENAM NIM PTB IPQ NIST SMU BIPM The comparison will be organized as a collapsed star comparison and will consist of three phases:
1) each participating laboratory selects one of its cells for use as a transfer cell (paragraph 4) and directly compares it against its national reference (paragraph 5);
2) the selected transfer cell is sent together with the measurement results (see paragraph 6) to the BIPM where all transfer cells are compared against two common reference cells (paragraph 7);
3) the transfer cells are sent back to the laboratories to directly re-compare with the same reference cell(s) as before to check the transfer cell stability.
In the case that a participant’s cell was found unstable (∆T > 100 µK, or criteria identified by the participant before the comparison begins) in the last step, the above three steps have to be repeated with another cell. These additional measurements should be done as a separate, subsequent comparison to avoid a long delay in the finalization of CCT-K7. The subsequent comparison and CCT-K7 can of course be linked via the BIPM reference cells. The transport of the cells to and from the BIPM is within the responsibility of the laboratories. The cells should be hand-carried whenever this is possible. When this causes difficulties special provisions have to be made with the BIPM. The cells have to be accompanied by an ATA carnet or a temporary exportation document (where appropriate). Also an eventual insurance of the cells for the transport is within the responsibility of the laboratories. Before sending a cell, the laboratory shall inform the BIPM. If a laboratory uses special parts with its
(*) to be confirmed
Appendix 1 - Technical Protocol
78/98
cell, like a bushing or a foam pad, these should also be sent to BIPM, together with a short description of its use, if necessary. During spring 2002 BIPM is modernizing its thermometry equipment to reduce the uncertainties of the comparison to a level of 20 – 30 µK. We will also have to move to another room in the next months for internal reasons. Due to this and the French holiday season in July and August the comparison measurements at BIPM can not begin before September or October 2002. The participants’ cells should arrive at the BIPM before the end of November 2002. Based on a tentative schedule, the measurements at BIPM will take about 6 months and thus should be finished around Mai 2003. We plan to measure cells arriving from other continents with priority to profit from the CCT meeting during the week of 12-16 May 2003 for their return. The deadline for reception of the results of the back measurements will be 6 months after the measurements at the BIPM are finished, to allow for a transport of the cells back to their laboratories. If the cells have not changed significantly, the detailed results of the back measurement do not need to be send to the BIPM (see paragraph 6). 4. Selection of cells The cells chosen for this comparison should be carefully selected. The quality of the transfer cell should not differ significantly from the reference cell or cells used at each NMI. No cells must be used whose quality is suspect on simple inspection procedures or which are known for any kind of abnormal behavior. The following tests should be made on the cells and will be repeated at reception of the cells at the BIPM:
- No floating material should be visible in the water. - There should be a sharp ‘click’ audible if the cell is gently inverted, indicating a
very low amount of air. - In cells where it is possible, a McLeod-type test should be made by inverting the
cell and entrapping air in the side arm or the filling extension. The allowable bubble size for an acceptable cell depends on the cell type. For example, for a Jarrett Type A cell, the bubble diameter should not be larger than about 5 mm [A4], corresponding to a temperature depression of 5 µK. Prior to testing for air, the cells should be held vertically at room temperature overnight.
BIPM reserves the right to reject transfer cells that do not meet the minimum selection criteria when tested on receipt. Laboratories normally using other tests are invited to apply them in addition and to describe them. Laboratories are asked to inform us as early as possible of the dimensions of the cell chosen. This is especially important for cells with unusual dimensions (very large or very small). 5. Measurement instructions Before sending a cell to the BIPM, the following measurements have to be made:
- The cell has to be carefully selected according to the criteria given in paragraph 4. - The cell should be compared against the national reference (cell or set of cells).
Measurements should be made on the transfer cell with two ice mantles separately
Appendix 1 - Technical Protocol
79/98
prepared, and for each ice mantle the direct comparison with the reference should be followed during two weeks with typically one measurement per day. Measurements should not start until at least one week after the preparation of the ice mantle. Depending on the local preparation technique, the necessary wait time might be longer than one week. A minimum of 10 measurements, per mantle, should be reported on the Measurement Report Form. For these measurements an inner melt shall be induced. The recommended method is the insertion of a metal or glass rod at ambient temperature in the thermometer well for a few seconds. The ice mantle should then rotate freely around the well if a small rotational impulse is given to it. The well should be filled with pre-cooled pure water up to the level of the water in the cell, when the thermometer is in place. To reduce the transfer uncertainty, the participants might consider to prepare the ice mantle of their transfer cell by using the BIPM technique (see appendix). Apart from this, the measurement procedure should be that normally applied by the laboratory.
- For each transfer cell, an immersion profile should be provided, to ensure that the
measurement really senses the temperature of the ice/water interface. For each position, the self-heating correction should be determined and applied. The step width should be 1 to 2 cm, and measurements be taken up to about 10 cm below the water surface. The position of the sensor at which the comparison with the reference cell(s) was made should be indicated.
After its return from the BIPM, the stability of the cell has to be checked by an additional comparison against the national reference. 6. Reporting of results Each participating laboratory must send a measurement report to the BIPM together with its cell which should include at least the following:
- The daily results obtained during the two measurement phases on the two separately prepared mantles. The self-heating (0 mA) and hydrostatic head correction (immersion depth) should be applied to the results, and the corrections for the transfer cell also communicated separately. Based on these data sets a resulting temperature difference of the transfer cell from the national reference has to be stated.
- The immersion profile of the transfer cell, indicating the position of the sensor at
which the calibration was made.
- A detailed budget for the uncertainty of the temperature realized by the transfer cell has to be provided, which follows the general guidance of the ‘GUM’ [A5]. This budget shall include the uncertainty of the national standard (realization uncertainty) and of the direct comparison of the transfer cell to the standard. A model uncertainty budget is given in the appendix. Some guidance can also be found in [A6].
- The equipment used for the calibration: description of the national reference,
technique to prepare the ice mantel, type of storage container, type of thermometer,
Appendix 1 - Technical Protocol
80/98
type of resistance bridge (AC or DC), type of reference resistor and whether or not it is temperature controlled, purchase or manufacturing date of reference cell(s) and transfer cell, measurement currents, and age of mantles of the reference cell(s). If available, the results of an isotope or impurity analysis.
A form which can be used to collect these data is provided in the appendix (Measurement report form). After its return from the BIPM, the laboratory must check the stability of its cell in the form of an additional direct comparison with the national reference, done in the same form as before. If the cell is found to be stable, this information should be given to BIPM; in this case only the measurements made before sending the cell to the BIPM will be used. If a small, but significant drift is discovered, the laboratory should send the new results within 6 months to the BIPM, in the same form as before and a new final value for the temperature of the cell can be determined, based on all measurements. If a cell is found unstable (∆T > 100 µK, or criteria identified by the participant before the comparison begins), the laboratory should inform BIPM as early as possible, and within 6 months. If no back measurement is provided by the laboratory within the time foreseen, only the first result will be used for the data reduction. To resolve problems concerning eventual incomplete or anomalous data, the general rules of the guidelines for CIPM key comparison [A2] will be applied. The full text can be found on the BIPM web page (www.bipm.fr/pdf/guidelines.pdf), and in the following we give an extract of some rules which are the most important according to our experience: • During the comparison, as the results are received by the pilot institute, they are kept confidential by the pilot institute until all the participants have completed their measurements and all the results have been received, or until the date limit for receipt of results has passed. • A result from a participant is not considered complete without an associated uncertainty, and is not included in the draft report unless it is accompanied by an uncertainty supported by a complete uncertainty budget. Uncertainties are drawn up following the guidance given in the technical protocol. • If, on examination of the complete set of results, the pilot institute finds results that appear to be anomalous, the corresponding institutes are invited to check their results for numerical errors but without being informed as to the magnitude or sign of the apparent anomaly. If no numerical error is found the result stands and the complete set of results is sent to all participants. Note that once all participants have been informed of the results, individual values and uncertainties may be changed or removed, or the complete comparison abandoned, only with the agreement of all participants and on the basis of a clear failure of the travelling standard or some other phenomenon that renders the comparison or part of it invalid. • An institute that considers its result unrepresentative of its standards may request a subsequent separate bilateral comparison with the pilot institute or one of the participants. This should take place as soon as possible after the completion of the comparison in progress. The subsequent bilateral comparison is considered as a new and distinct comparison (see paragraph 10). It is difficult to give in advance an unambiguous criterion for what constitutes anomalous data. The pilot will consider this depending on the real data. Data, which according to common sense would be called an outlier, will be considered as anomalous and the corresponding laboratory will be asked to verify its calculation. In case of any doubt we will contact the corresponding laboratory.
Appendix 1 - Technical Protocol
81/98
7. Measurements at the BIPM All cells sent to the BIPM will be compared against two common reference cells that have been tested against a group of cells. The measurement of the temperature difference of the two common reference cells every day allows to check the stability of the measurement system and allows to detect problems related to the stability of one of the reference cells. We will measure immersion profiles of the two reference cells. The ice mantles of all cells will be prepared by the technique routinely used at the BIPM, that is the introduction of dry ice together with some alcohol in the thermometer well after pre-cooling of the cell (see appendix). If a laboratory uses a bushing or a foam pad with its cell, these items should be sent with the cell and we will use them with the transfer cell. The triple point cells are stored in two automatic maintenance baths each of which can store up to 4 cells. For each cell measurements will be made on two mantles prepared separately. For each mantle the direct comparison will be followed during two weeks (ten working days) starting one week after the initial preparation of the ice mantle. It is planned to measure the six transfer cells of the two baths every day in a random sequence starting and ending with one of the two reference cells: ref 1, DUT1, …, DUT6, ref 2. It is planned to make all measurements with the same thermometer and the same resistance bridge. In the ideal case, for 20 cells these measurements will take about 20 weeks. To allow for unexpected problems, 6 weeks more should be foreseen, resulting in a total measurement time of about 6 months. 8. Results of the comparison The results of the comparison will be evaluated in two ways, giving results corresponding to the two objectives introduced in paragraph 2. BIPM strongly encourages an assistant laboratory to volunteer to recalculate the results of the comparison, using data supplied by the BIPM. This will greatly reduce the possibility of a calculational error. The MSL has kindly accepted to take on this task. From the bridge readings obtained with a thermometer in a cell under test and in a BIPM reference cell a resistance ratio W can be formed which can be translated into a temperature difference using the reference function Wr (T) of the ITS-90. Using the same reference cell for all cells under test allows to compare the cells with each other. Since in fact we will use two common reference cells, it seems reasonable to relate all cells under test to the average of these two cells. Secondly, each cell from a participant will be seen as a transfer standard with a temperature assigned by its laboratory and the common BIPM cells compared with it. This allows to calculate the temperature differences of the BIPM cells from each national reference cell, and the differences thus obtained are a measure for the differences between calibrations provided by the laboratories. After reception of the results of the back measurements of all participants the Draft A report will be prepared and circulated. If the back measurement is not provided by the laboratory within the time foreseen, only the first result will be used for the data reduction. The organizers of the comparison will present the results using different possible choices of reference values which will include at least the simple and weighted mean and the median.
Appendix 1 - Technical Protocol
82/98
The final decision on the presentation and interpretation of the results will be taken together with the participants and the Key Comparison Working Group 7 of the CCT. The publication of the results will be discussed with the participants. The pilot plans to list the participants as co-authors, if there is general consensus on this. References [A1] MRA, Mutual Recognition Arrangement, BIPM, 1999. [A2] T. J. Quinn, “Guidelines for key comparisons carried out by Consultative
Committees”, 1 March 1999, BIPM, Paris. [A3] R. Pello, R. Goebel, R. Köhler, “Report on the international comparison of water
triple-point cells”, BIPM report 96/8 and CCT document CCT/96-1. [A4] G. T. Furukawa, W. R. Bigge, “Reproducibility of some triple point of water cells”,
Temperature, its Measurement and Control in Science and Industry (5), 1982, 291-297.
[A5] “Guide to the expression of uncertainty in measurement”, ISO, 1993, ISBN 92-67-
10188-9. [A6] E. Renaot, G. Bonnier, “Combined standard uncertainty for SPRT calibration at the water triple point”, CCT/2000-16 and “Report of Working Group 3 to the CCT: 21st
meeting”, CCT/01-10 which includes the document “Uncertainty Budgets for SPRT Calibrations at the Defining Fixed Points”. This document is not in its final form, but can give some guidance on evaluating uncertainty components.
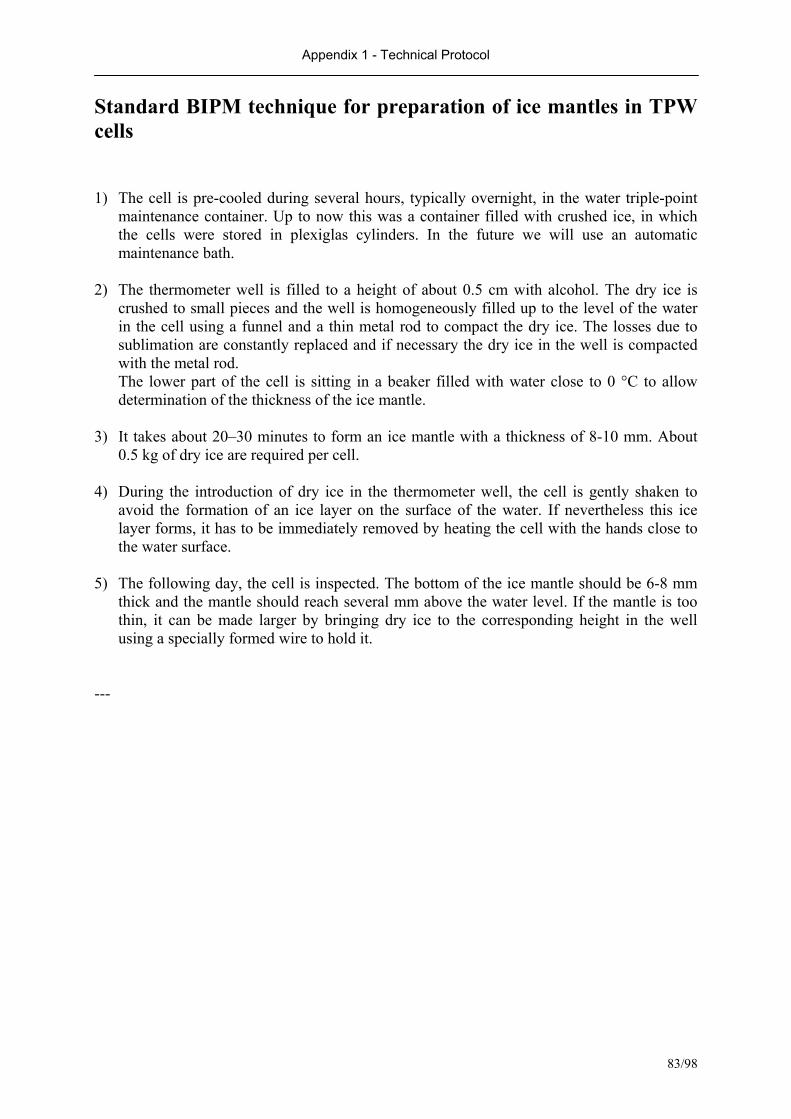
Appendix 1 - Technical Protocol
83/98
Standard BIPM technique for preparation of ice mantles in TPW cells 1) The cell is pre-cooled during several hours, typically overnight, in the water triple-point
maintenance container. Up to now this was a container filled with crushed ice, in which the cells were stored in plexiglas cylinders. In the future we will use an automatic maintenance bath.
2) The thermometer well is filled to a height of about 0.5 cm with alcohol. The dry ice is
crushed to small pieces and the well is homogeneously filled up to the level of the water in the cell using a funnel and a thin metal rod to compact the dry ice. The losses due to sublimation are constantly replaced and if necessary the dry ice in the well is compacted with the metal rod. The lower part of the cell is sitting in a beaker filled with water close to 0 °C to allow determination of the thickness of the ice mantle.
3) It takes about 20–30 minutes to form an ice mantle with a thickness of 8-10 mm. About
0.5 kg of dry ice are required per cell. 4) During the introduction of dry ice in the thermometer well, the cell is gently shaken to
avoid the formation of an ice layer on the surface of the water. If nevertheless this ice layer forms, it has to be immediately removed by heating the cell with the hands close to the water surface.
5) The following day, the cell is inspected. The bottom of the ice mantle should be 6-8 mm
thick and the mantle should reach several mm above the water level. If the mantle is too thin, it can be made larger by bringing dry ice to the corresponding height in the well using a specially formed wire to hold it.
---

Appendix 1 - Technical Protocol
84/98

Appendix 1 - Technical Protocol
85/98
Measurement report form for CCT-K7 Laboratory:……………………………………………………………………………………………… Contact person:…………………………………………………………………………………………... Contact address, email :………………………………………….………………………………………. …………………………………………………………………………………………………………… Transfer cell: n° and type:………………………………………………………………………………... Purchase or manufacture date:…………………………………………………………………………… Measurement results on first ice mantle Date of preparation of ice mantle of transfer cell:…………………...…………………………………... Technique for preparation :……………………………………………………………………. ………... …………………………………………………………………………………………………………… Date of preparation of the mantle of the reference cell(s):………………………………………………. Date of measurement
Temperature difference from national reference
Distance from sensor midpoint to surface level of water in tr. cell
Self-heating correction for transfer cell
1 2 3 4 5 6 7 8 9 10 11 12 13 14 15 The temperature differences should already be corrected for hydrostatic-head and self-heating effects. To allow comparison with our measurements, the corrections should also be given separately.

Appendix 1 - Technical Protocol
86/98
Measurement results on second ice mantle Date of preparation of ice mantle :………………...…………………………………………………….. Technique for preparation :………………………………………………………………………………. …………………………………………………………………………………………………………... Date of preparation of the mantle of the reference cell(s):………………………………………………. Date of measurement
Temperature difference from national reference
Distance from sensor midpoint to surface level of water in tr. cell
Self-heating correction for transfer cell
1 2 3 4 5 6 7 8 9 10 11 12 13 14 15 The temperature differences should already be corrected for hydrostatic head and self-heating effects. To allow comparison with our measurements, the corrections should also be given separately. Resulting temp. difference between transfer cell and national reference: ………………… Equipment used for the calibration Description of national reference (1 or several cells, purchase or manufacture date)…………………… …………………………………………………………………………………………………………… …………………………………………………………………………………………………………… Type of resistance bridge, AC or DC:………………………………………………..………………….. Measurement current:……………………………………………………………………………………. Type of reference resistor:……………………………………………….………………………………. Is reference resistor temperature controlled, if yes, stability:……………………………………………. Type of thermometer, length of sensor:………………………………………………………………….
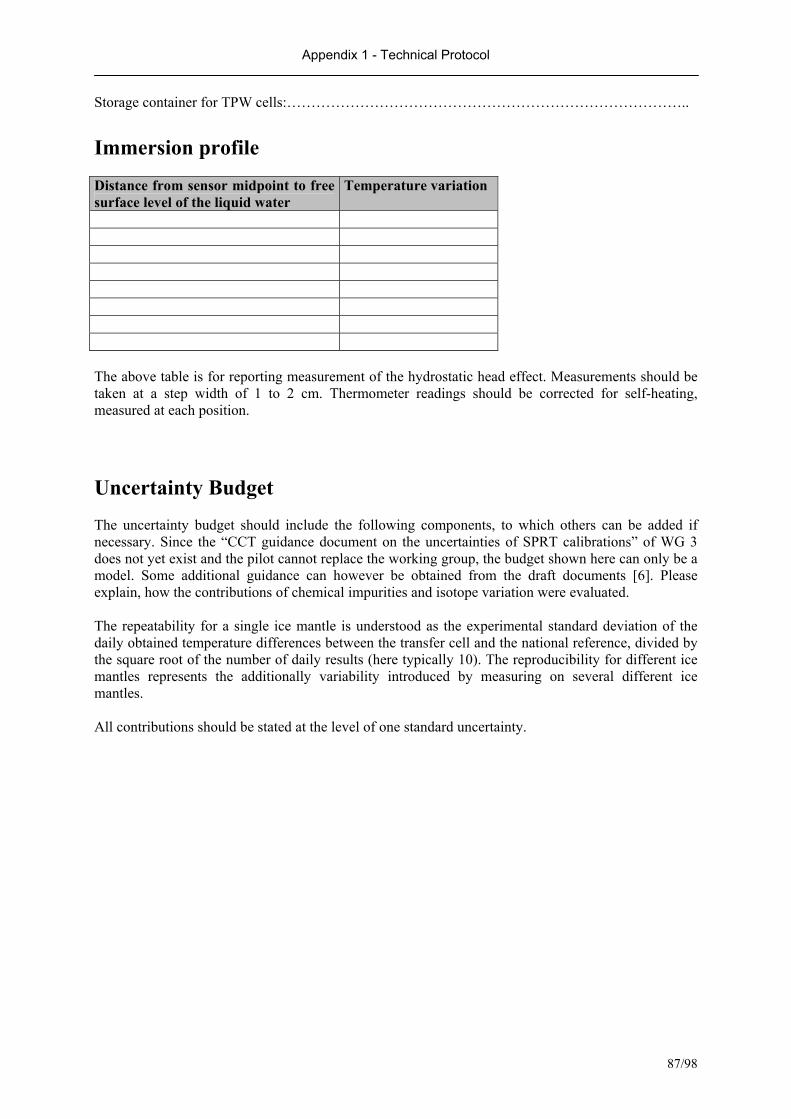
Appendix 1 - Technical Protocol
87/98
Storage container for TPW cells:……………………………………………………………………….. Immersion profile Distance from sensor midpoint to free surface level of the liquid water
Temperature variation
The above table is for reporting measurement of the hydrostatic head effect. Measurements should be taken at a step width of 1 to 2 cm. Thermometer readings should be corrected for self-heating, measured at each position.
Uncertainty Budget The uncertainty budget should include the following components, to which others can be added if necessary. Since the “CCT guidance document on the uncertainties of SPRT calibrations” of WG 3 does not yet exist and the pilot cannot replace the working group, the budget shown here can only be a model. Some additional guidance can however be obtained from the draft documents [6]. Please explain, how the contributions of chemical impurities and isotope variation were evaluated. The repeatability for a single ice mantle is understood as the experimental standard deviation of the daily obtained temperature differences between the transfer cell and the national reference, divided by the square root of the number of daily results (here typically 10). The reproducibility for different ice mantles represents the additionally variability introduced by measuring on several different ice mantles. All contributions should be stated at the level of one standard uncertainty.
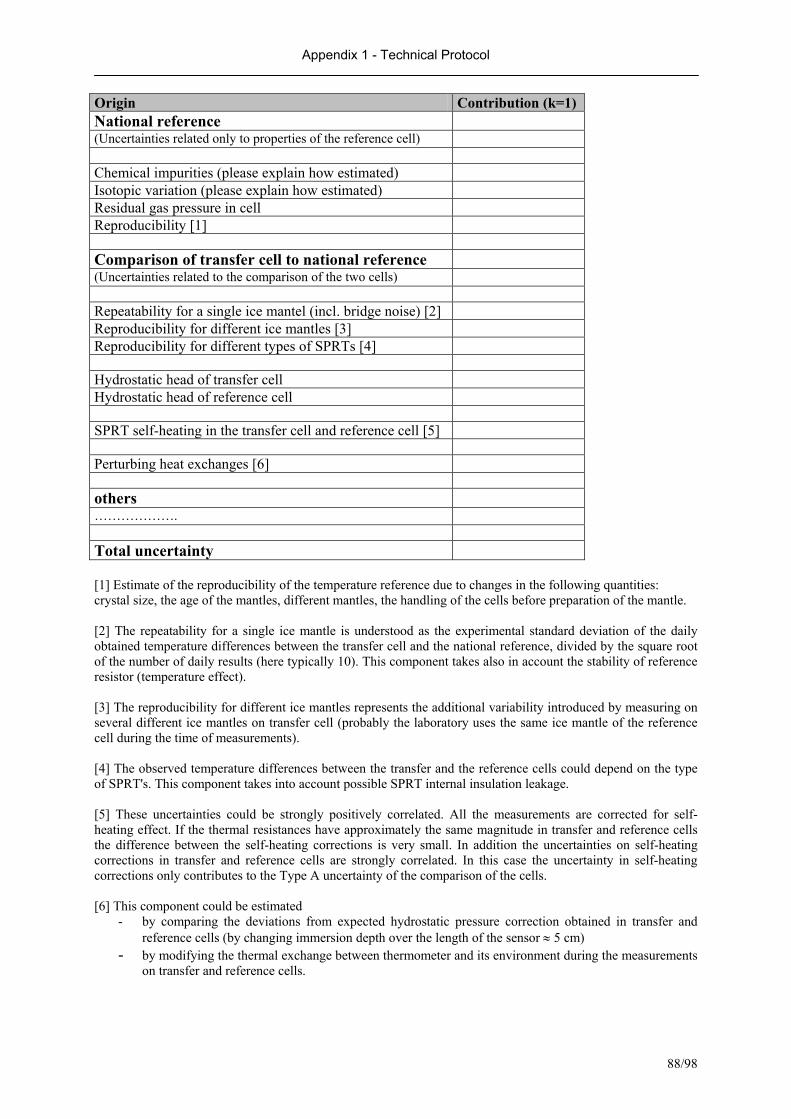
Appendix 1 - Technical Protocol
88/98
Origin Contribution (k=1) National reference (Uncertainties related only to properties of the reference cell) Chemical impurities (please explain how estimated) Isotopic variation (please explain how estimated) Residual gas pressure in cell Reproducibility [1] Comparison of transfer cell to national reference (Uncertainties related to the comparison of the two cells) Repeatability for a single ice mantel (incl. bridge noise) [2] Reproducibility for different ice mantles [3] Reproducibility for different types of SPRTs [4] Hydrostatic head of transfer cell Hydrostatic head of reference cell SPRT self-heating in the transfer cell and reference cell [5] Perturbing heat exchanges [6] others ………………. Total uncertainty [1] Estimate of the reproducibility of the temperature reference due to changes in the following quantities: crystal size, the age of the mantles, different mantles, the handling of the cells before preparation of the mantle. [2] The repeatability for a single ice mantle is understood as the experimental standard deviation of the daily obtained temperature differences between the transfer cell and the national reference, divided by the square root of the number of daily results (here typically 10). This component takes also in account the stability of reference resistor (temperature effect). [3] The reproducibility for different ice mantles represents the additional variability introduced by measuring on several different ice mantles on transfer cell (probably the laboratory uses the same ice mantle of the reference cell during the time of measurements). [4] The observed temperature differences between the transfer and the reference cells could depend on the type of SPRT's. This component takes into account possible SPRT internal insulation leakage. [5] These uncertainties could be strongly positively correlated. All the measurements are corrected for self-heating effect. If the thermal resistances have approximately the same magnitude in transfer and reference cells the difference between the self-heating corrections is very small. In addition the uncertainties on self-heating corrections in transfer and reference cells are strongly correlated. In this case the uncertainty in self-heating corrections only contributes to the Type A uncertainty of the comparison of the cells. [6] This component could be estimated
- by comparing the deviations from expected hydrostatic pressure correction obtained in transfer and reference cells (by changing immersion depth over the length of the sensor ≈ 5 cm)
- by modifying the thermal exchange between thermometer and its environment during the measurements on transfer and reference cells.
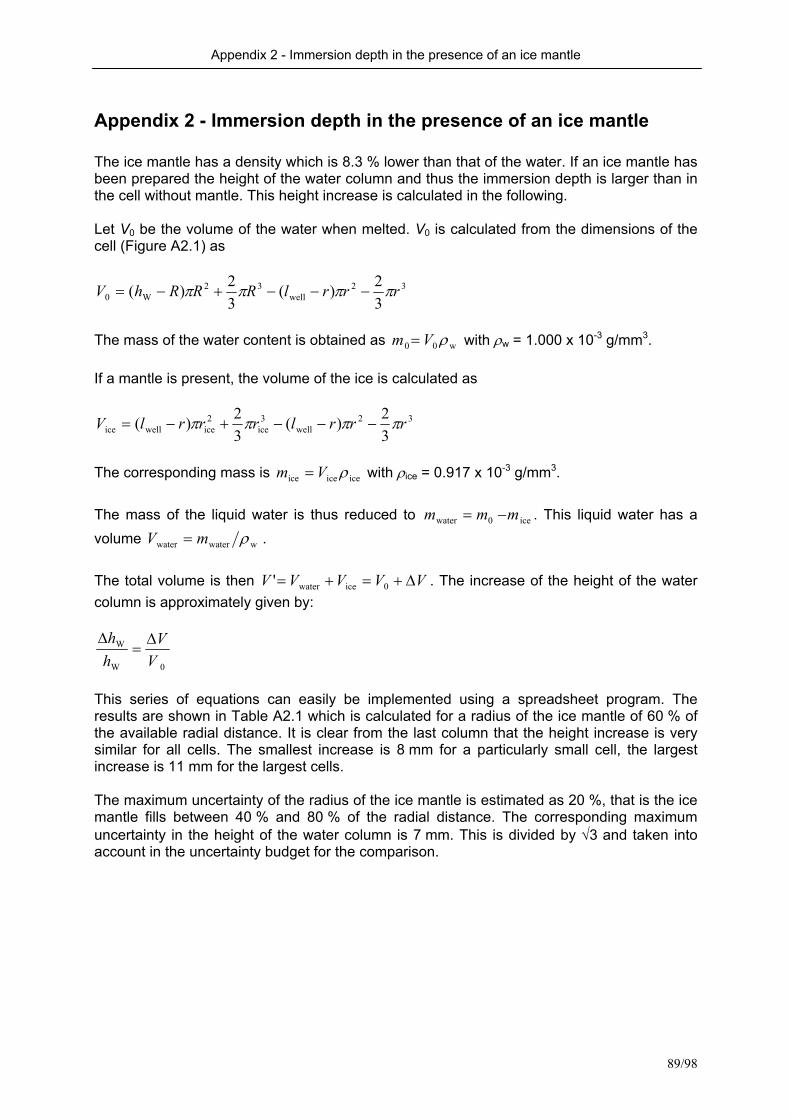
Appendix 2 - Immersion depth in the presence of an ice mantle
89/98
Appendix 2 - Immersion depth in the presence of an ice mantle The ice mantle has a density which is 8.3 % lower than that of the water. If an ice mantle has been prepared the height of the water column and thus the immersion depth is larger than in the cell without mantle. This height increase is calculated in the following. Let V0 be the volume of the water when melted. V0 is calculated from the dimensions of the cell (Figure A2.1) as
32well
32W0 3
2)(32)( rrrlRRRhV ππππ −−−+−=
The mass of the water content is obtained as w00 ρVm = with ρw = 1.000 x 10⁻³ g/mm3. If a mantle is present, the volume of the ice is calculated as
32well
3ice
2icewellice 3
2)(32)( rrrlrrrlV ππππ −−−+−=
The corresponding mass is iceiceice ρVm = with ρice = 0.917 x 10⁻³ g/mm3. The mass of the liquid water is thus reduced to ice0water mmm −= . This liquid water has a volume wwaterwater ρmV = . The total volume is then VVVVV ∆+=+= 0icewater' . The increase of the height of the water column is approximately given by:
0W
W
VV
hh ∆
=∆
This series of equations can easily be implemented using a spreadsheet program. The results are shown in Table A2.1 which is calculated for a radius of the ice mantle of 60 % of the available radial distance. It is clear from the last column that the height increase is very similar for all cells. The smallest increase is 8 mm for a particularly small cell, the largest increase is 11 mm for the largest cells. The maximum uncertainty of the radius of the ice mantle is estimated as 20 %, that is the ice mantle fills between 40 % and 80 % of the radial distance. The corresponding maximum uncertainty in the height of the water column is 7 mm. This is divided by √3 and taken into account in the uncertainty budget for the comparison.
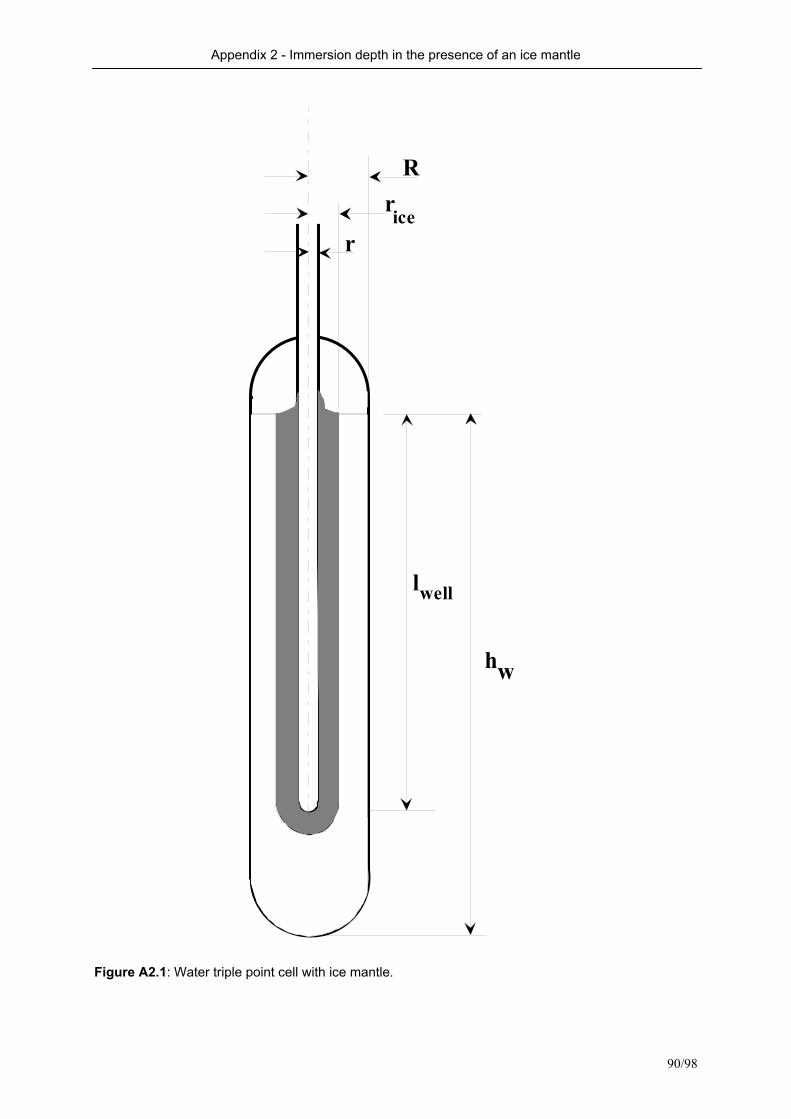
Appendix 2 - Immersion depth in the presence of an ice mantle
90/98
Figure A2.1: Water triple point cell with ice mantle.
hw
lwell
r
Rr ice
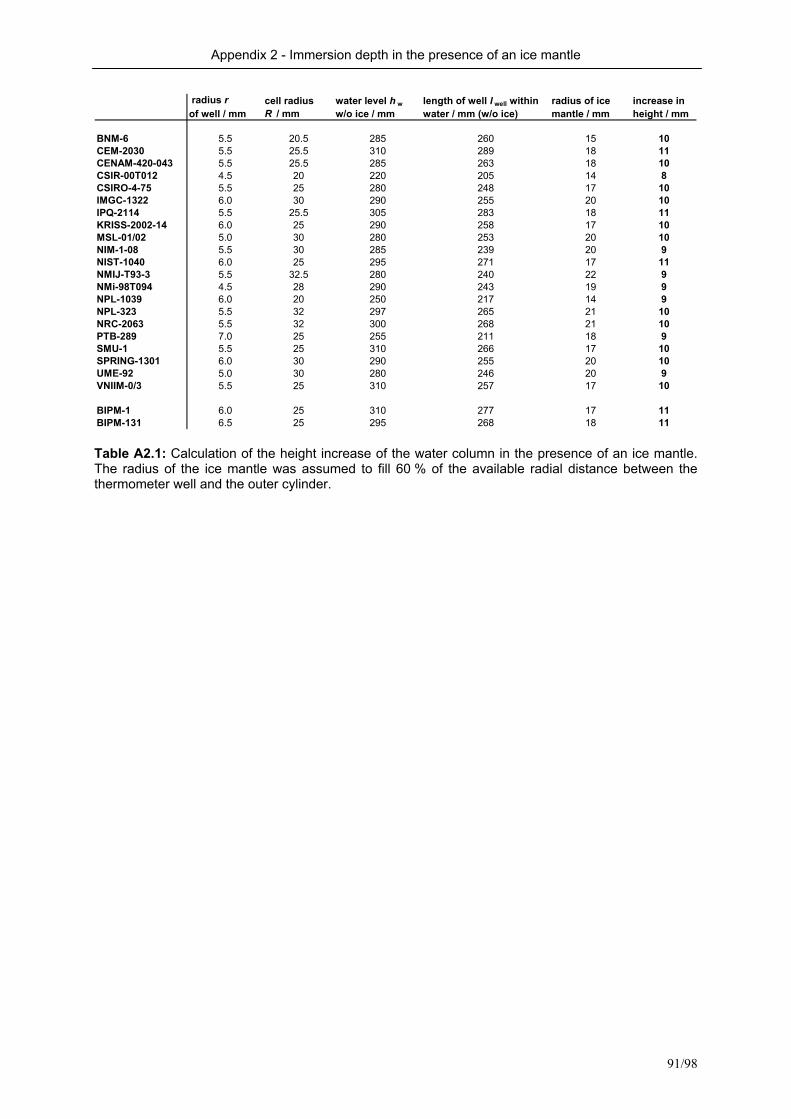
Appendix 2 - Immersion depth in the presence of an ice mantle
91/98
radius r cell radius water level h w length of well l well within radius of ice increase in of well / mm R / mm w/o ice / mm water / mm (w/o ice) mantle / mm height / mm
BNM-6 5.5 20.5 285 260 15 10CEM-2030 5.5 25.5 310 289 18 11CENAM-420-043 5.5 25.5 285 263 18 10CSIR-00T012 4.5 20 220 205 14 8CSIRO-4-75 5.5 25 280 248 17 10IMGC-1322 6.0 30 290 255 20 10IPQ-2114 5.5 25.5 305 283 18 11KRISS-2002-14 6.0 25 290 258 17 10MSL-01/02 5.0 30 280 253 20 10NIM-1-08 5.5 30 285 239 20 9NIST-1040 6.0 25 295 271 17 11NMIJ-T93-3 5.5 32.5 280 240 22 9NMi-98T094 4.5 28 290 243 19 9NPL-1039 6.0 20 250 217 14 9NPL-323 5.5 32 297 265 21 10NRC-2063 5.5 32 300 268 21 10PTB-289 7.0 25 255 211 18 9SMU-1 5.5 25 310 266 17 10SPRING-1301 6.0 30 290 255 20 10UME-92 5.0 30 280 246 20 9VNIIM-0/3 5.5 25 310 257 17 10
BIPM-1 6.0 25 310 277 17 11BIPM-131 6.5 25 295 268 18 11
Table A2.1: Calculation of the height increase of the water column in the presence of an ice mantle. The radius of the ice mantle was assumed to fill 60 % of the available radial distance between the thermometer well and the outer cylinder.
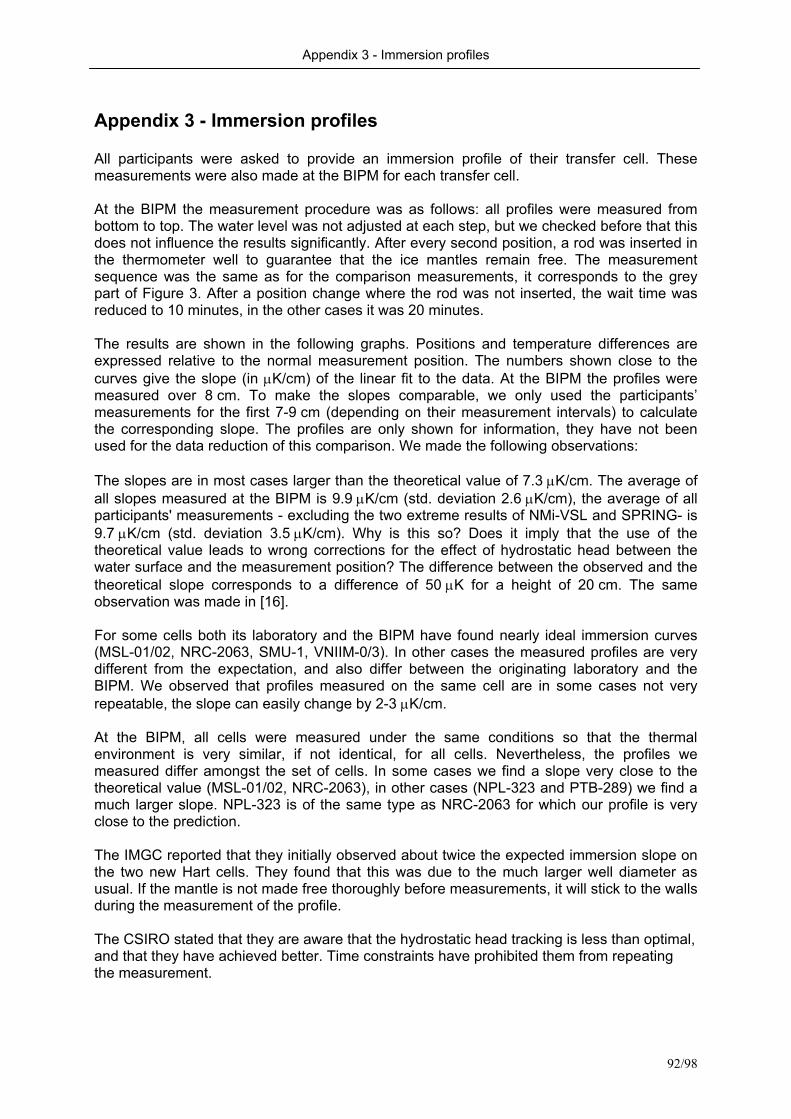
Appendix 3 - Immersion profiles
92/98
Appendix 3 - Immersion profiles All participants were asked to provide an immersion profile of their transfer cell. These measurements were also made at the BIPM for each transfer cell. At the BIPM the measurement procedure was as follows: all profiles were measured from bottom to top. The water level was not adjusted at each step, but we checked before that this does not influence the results significantly. After every second position, a rod was inserted in the thermometer well to guarantee that the ice mantles remain free. The measurement sequence was the same as for the comparison measurements, it corresponds to the grey part of Figure 3. After a position change where the rod was not inserted, the wait time was reduced to 10 minutes, in the other cases it was 20 minutes. The results are shown in the following graphs. Positions and temperature differences are expressed relative to the normal measurement position. The numbers shown close to the curves give the slope (in µK/cm) of the linear fit to the data. At the BIPM the profiles were measured over 8 cm. To make the slopes comparable, we only used the participants’ measurements for the first 7-9 cm (depending on their measurement intervals) to calculate the corresponding slope. The profiles are only shown for information, they have not been used for the data reduction of this comparison. We made the following observations: The slopes are in most cases larger than the theoretical value of 7.3 µK/cm. The average of all slopes measured at the BIPM is 9.9 µK/cm (std. deviation 2.6 µK/cm), the average of all participants' measurements - excluding the two extreme results of NMi-VSL and SPRING- is 9.7 µK/cm (std. deviation 3.5 µK/cm). Why is this so? Does it imply that the use of the theoretical value leads to wrong corrections for the effect of hydrostatic head between the water surface and the measurement position? The difference between the observed and the theoretical slope corresponds to a difference of 50 µK for a height of 20 cm. The same observation was made in [16]. For some cells both its laboratory and the BIPM have found nearly ideal immersion curves (MSL-01/02, NRC-2063, SMU-1, VNIIM-0/3). In other cases the measured profiles are very different from the expectation, and also differ between the originating laboratory and the BIPM. We observed that profiles measured on the same cell are in some cases not very repeatable, the slope can easily change by 2-3 µK/cm. At the BIPM, all cells were measured under the same conditions so that the thermal environment is very similar, if not identical, for all cells. Nevertheless, the profiles we measured differ amongst the set of cells. In some cases we find a slope very close to the theoretical value (MSL-01/02, NRC-2063), in other cases (NPL-323 and PTB-289) we find a much larger slope. NPL-323 is of the same type as NRC-2063 for which our profile is very close to the prediction. The IMGC reported that they initially observed about twice the expected immersion slope on the two new Hart cells. They found that this was due to the much larger well diameter as usual. If the mantle is not made free thoroughly before measurements, it will stick to the walls during the measurement of the profile. The CSIRO stated that they are aware that the hydrostatic head tracking is less than optimal, and that they have achieved better. Time constraints have prohibited them from repeating the measurement.
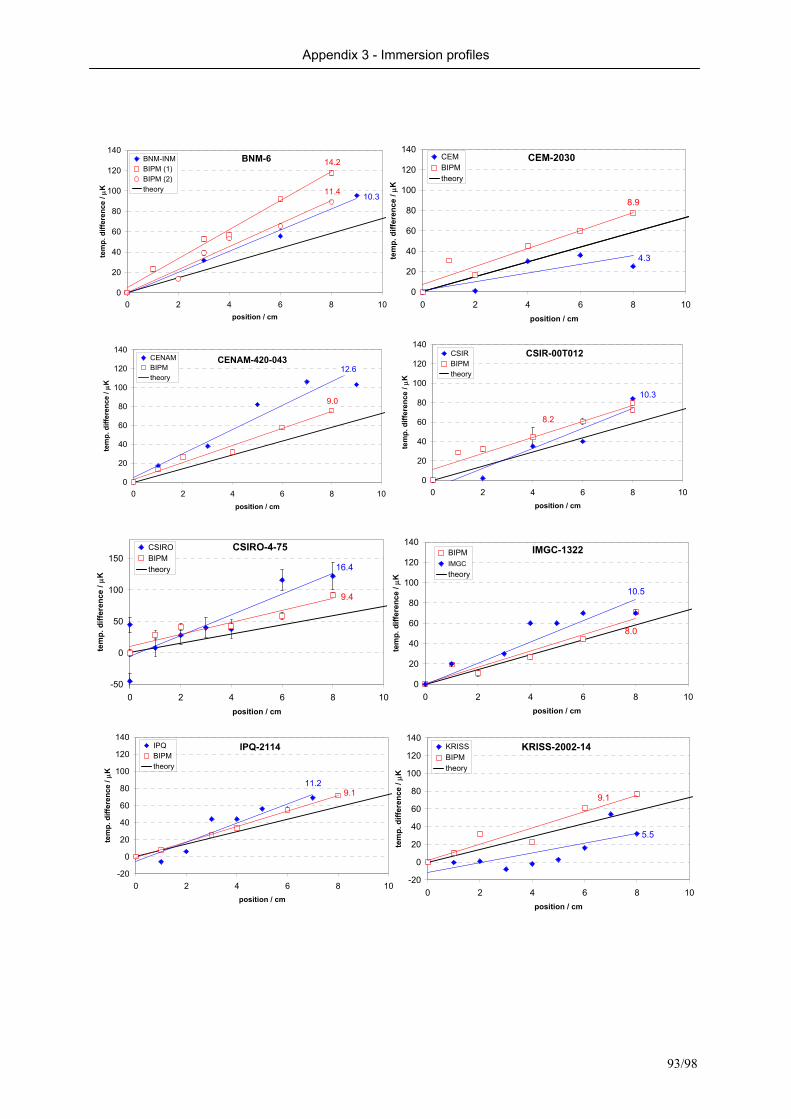
Appendix 3 - Immersion profiles
93/98
BNM-6
0
20
40
60
80
100
120
140
0 2 4 6 8 10position / cm
tem
p. d
iffer
ence
/ µK
BNM-INMBIPM (1)BIPM (2)theory
10.3
14.2
11.4
CEM-2030
0
20
40
60
80
100
120
140
0 2 4 6 8 10position / cm
tem
p. d
iffer
ence
/ µK
CEMBIPMtheory
8.9
4.3
CENAM-420-043
0
20
40
60
80
100
120
140
0 2 4 6 8 10position / cm
tem
p. d
iffer
ence
/ µK
CENAMBIPMtheory
9.0
12.6
CSIR-00T012
0
20
40
60
80
100
120
140
0 2 4 6 8 10position / cm
tem
p. d
iffer
ence
/ µK
CSIRBIPMtheory
8.2
10.3
CSIRO-4-75
-50
0
50
100
150
0 2 4 6 8 10position / cm
tem
p. d
iffer
ence
/ µK
CSIROBIPMtheory 16.4
9.4
IMGC-1322
0
20
40
60
80
100
120
140
0 2 4 6 8 10position / cm
tem
p. d
iffer
ence
/ µK
BIPMIMGCtheory
8.0
10.5
IPQ-2114
-20
0
20
40
60
80
100
120
140
0 2 4 6 8 10position / cm
tem
p. d
iffer
ence
/ µK
IPQBIPMtheory
9.111.2
KRISS-2002-14
-20
0
20
40
60
80
100
120
140
0 2 4 6 8 10position / cm
tem
p. d
iffer
ence
/ µK
KRISSBIPMtheory
9.1
5.5
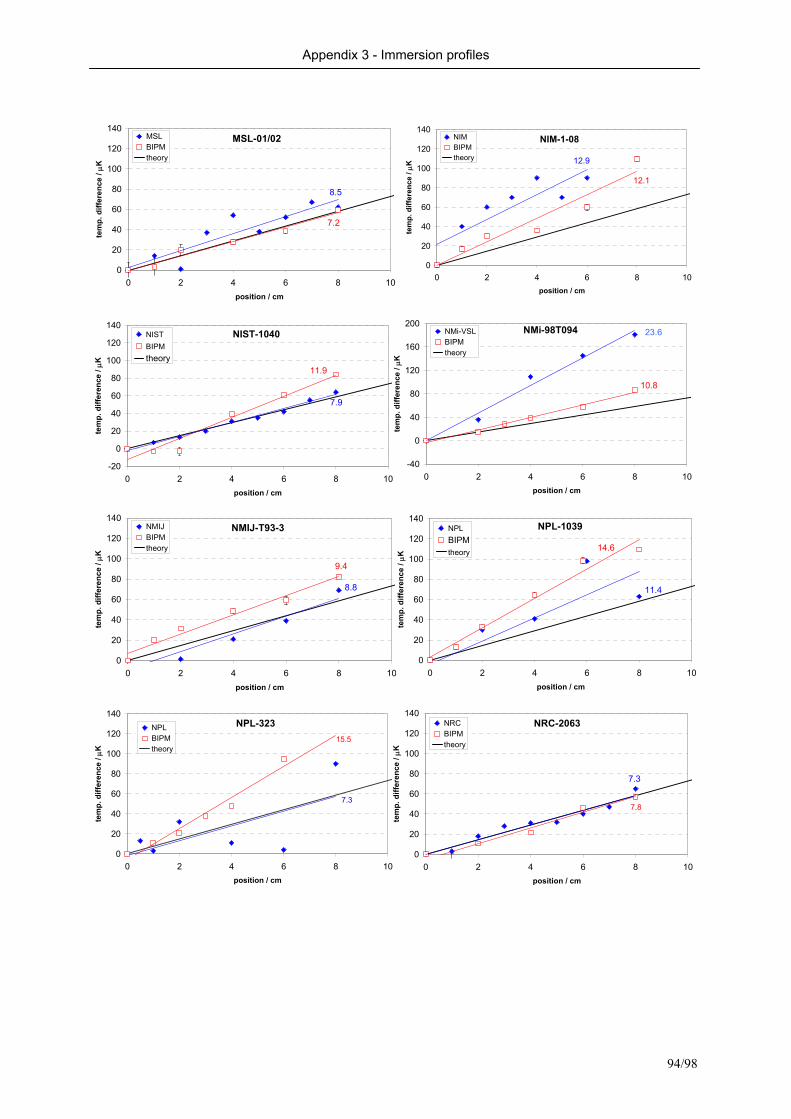
Appendix 3 - Immersion profiles
94/98
MSL-01/02
0
20
40
60
80
100
120
140
0 2 4 6 8 10position / cm
tem
p. d
iffer
ence
/ µK
MSLBIPMtheory
8.5
7.2
NIM-1-08
0
20
40
60
80
100
120
140
0 2 4 6 8 10position / cm
tem
p. d
iffer
ence
/ µK
NIMBIPMtheory 12.9
12.1
NIST-1040
-20
0
20
40
60
80
100
120
140
0 2 4 6 8 10position / cm
tem
p. d
iffer
ence
/ µK
NISTBIPMtheory
11.9
7.9
NMi-98T094
-40
0
40
80
120
160
200
0 2 4 6 8 10position / cm
tem
p. d
iffer
ence
/ µK
NMi-VSLBIPMtheory
10.8
23.6
NMIJ-T93-3
0
20
40
60
80
100
120
140
0 2 4 6 8 10position / cm
tem
p. d
iffer
ence
/ µK
NMIJBIPMtheory
9.4
8.8
NPL-1039
0
20
40
60
80
100
120
140
0 2 4 6 8 10position / cm
tem
p. d
iffer
ence
/ µK
NPLBIPMtheory 14.6
11.4
NPL-323
0
20
40
60
80
100
120
140
0 2 4 6 8 10position / cm
tem
p. d
iffer
ence
/ µK
NPLBIPMtheory
7.3
15.5
NRC-2063
0
20
40
60
80
100
120
140
0 2 4 6 8 10position / cm
tem
p. d
iffer
ence
/ µK
NRCBIPMtheory
7.3
7.8
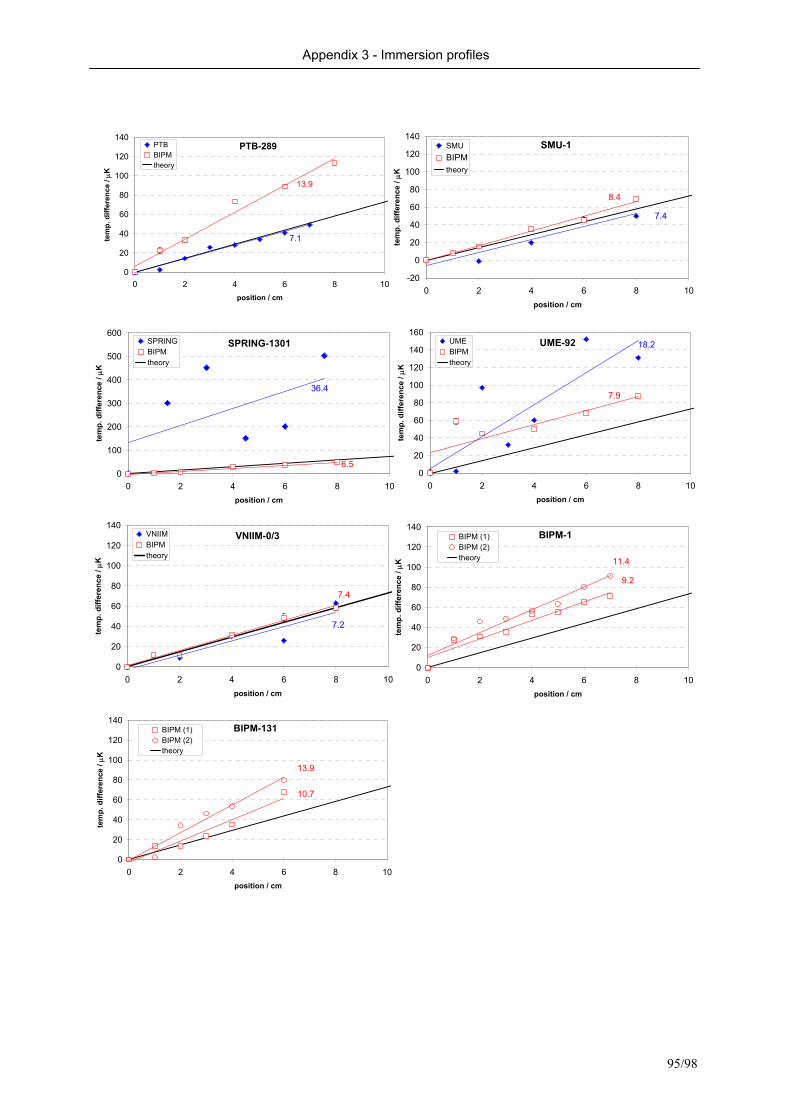
Appendix 3 - Immersion profiles
95/98
PTB-289
0
20
40
60
80
100
120
140
0 2 4 6 8 10position / cm
tem
p. d
iffer
ence
/ µK
PTBBIPMtheory
7.1
13.9
SMU-1
-20
0
20
40
60
80
100
120
140
0 2 4 6 8 10position / cm
tem
p. d
iffer
ence
/ µK
SMUBIPMtheory
7.4
8.4
SPRING-1301
0
100
200
300
400
500
600
0 2 4 6 8 10position / cm
tem
p. d
iffer
ence
/ µK
SPRINGBIPMtheory
6.5
36.4
UME-92
0
20
40
60
80
100
120
140
160
0 2 4 6 8 10position / cm
tem
p. d
iffer
ence
/ µK
UMEBIPMtheory
7.9
18.2
VNIIM-0/3
0
20
40
60
80
100
120
140
0 2 4 6 8 10position / cm
tem
p. d
iffer
ence
/ µK
VNIIMBIPMtheory
7.2
7.4
BIPM-1
0
20
40
60
80
100
120
140
0 2 4 6 8 10position / cm
tem
p. d
iffer
ence
/ µK
BIPM (1)BIPM (2)theory
9.2
11.4
BIPM-131
0
20
40
60
80
100
120
140
0 2 4 6 8 10position / cm
tem
p. d
iffer
ence
/ µK
BIPM (1)BIPM (2)theory
10.7
13.9
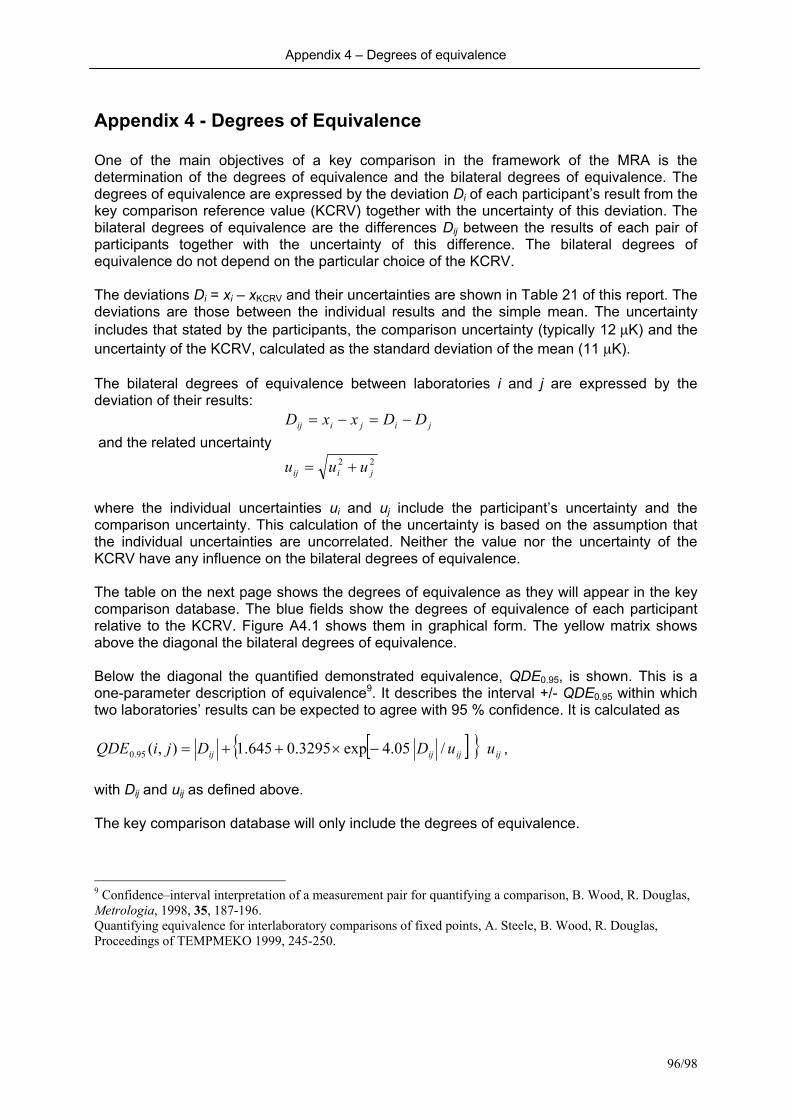
Appendix 4 – Degrees of equivalence
96/98
Appendix 4 - Degrees of Equivalence One of the main objectives of a key comparison in the framework of the MRA is the determination of the degrees of equivalence and the bilateral degrees of equivalence. The degrees of equivalence are expressed by the deviation Di of each participant’s result from the key comparison reference value (KCRV) together with the uncertainty of this deviation. The bilateral degrees of equivalence are the differences Dij between the results of each pair of participants together with the uncertainty of this difference. The bilateral degrees of equivalence do not depend on the particular choice of the KCRV. The deviations Di = xi – xKCRV and their uncertainties are shown in Table 21 of this report. The deviations are those between the individual results and the simple mean. The uncertainty includes that stated by the participants, the comparison uncertainty (typically 12 µK) and the uncertainty of the KCRV, calculated as the standard deviation of the mean (11 µK). The bilateral degrees of equivalence between laboratories i and j are expressed by the deviation of their results:
jijiij DDxxD −=−= and the related uncertainty 22
jiij uuu += where the individual uncertainties ui and uj include the participant’s uncertainty and the comparison uncertainty. This calculation of the uncertainty is based on the assumption that the individual uncertainties are uncorrelated. Neither the value nor the uncertainty of the KCRV have any influence on the bilateral degrees of equivalence. The table on the next page shows the degrees of equivalence as they will appear in the key comparison database. The blue fields show the degrees of equivalence of each participant relative to the KCRV. Figure A4.1 shows them in graphical form. The yellow matrix shows above the diagonal the bilateral degrees of equivalence. Below the diagonal the quantified demonstrated equivalence, QDE0.95, is shown. This is a one-parameter description of equivalence9. It describes the interval +/- QDE0.95 within which two laboratories’ results can be expected to agree with 95 % confidence. It is calculated as
[ ] ijijijij uuDDjiQDE /05.4exp3295.0645.1),(95.0 −×++= , with Dij and uij as defined above. The key comparison database will only include the degrees of equivalence.
9 Confidence–interval interpretation of a measurement pair for quantifying a comparison, B. Wood, R. Douglas, Metrologia, 1998, 35, 187-196. Quantifying equivalence for interlaboratory comparisons of fixed points, A. Steele, B. Wood, R. Douglas, Proceedings of TEMPMEKO 1999, 245-250.
Appendix 4 – Degrees of equivalence
97/98
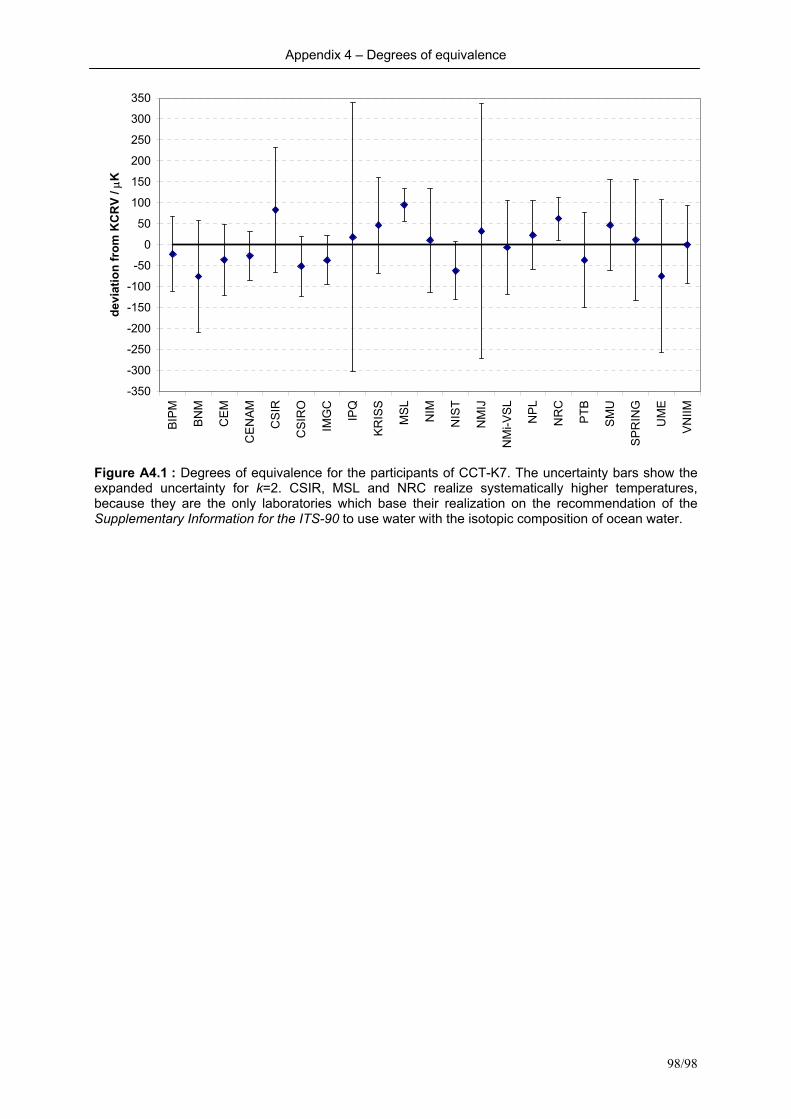
Appendix 4 – Degrees of equivalence
98/98
-350
-300
-250
-200
-150
-100
-50
0
50
100
150
200
250
300
350
BIPM
BNM
CEM
CEN
AM
CSI
R
CSI
RO
IMG
C
IPQ
KRIS
S
MSL NIM
NIS
T
NM
IJ
NM
i-VSL
NPL
NR
C
PTB
SMU
SPR
ING
UM
E
VNIIM
devi
atio
n fr
om K
CR
V / µ
K
Figure A4.1 : Degrees of equivalence for the participants of CCT-K7. The uncertainty bars show the expanded uncertainty for k=2. CSIR, MSL and NRC realize systematically higher temperatures, because they are the only laboratories which base their realization on the recommendation of the Supplementary Information for the ITS-90 to use water with the isotopic composition of ocean water.