FINAL REPORT - eisdocs.dsdip.qld.gov.aueisdocs.dsdip.qld.gov.au/Gladstone Liquefied Natural...
84
FINAL REPORT Gladstone LNG Facility Development – Surface Water EIS Prepared for Santos Ltd Santos House Level 14 60 Edward Street Brisbane QLD 4000 13 March 2009 42626220 C:\Documents and Settings\rxborge0\My Documents\URS Report front cover for pdf.doc
Transcript of FINAL REPORT - eisdocs.dsdip.qld.gov.aueisdocs.dsdip.qld.gov.au/Gladstone Liquefied Natural...

F I N A L R E P O R T
Gladstone LNG Facility Development – Surface Water EIS
Prepared for Santos Ltd Santos House Level 14 60 Edward Street Brisbane QLD 4000
13 March 2009
42626220
C:\Documents and Settings\rxborge0\My Documents\URS Report front cover for pdf.doc
G L A D S T O N E L N G F A C I L I T Y D E V E L O P M E N T - S U R F A C E W A T E R E I S
Prepared for Santos Ltd, 13 March 2009
Project Manager:
…………………………… Paul Wilkinson Principal Water Engineer
Project Director:
…………………………… Michel Raymond Principal Water Engineer
URS Australia Pty Ltd
Level 16, 240 Queen Street Brisbane, QLD 4000 GPO Box 302, QLD 4001 Australia Tel: 61 7 3243 2111 Fax: 61 7 3243 2199
Author:
p.p.
…………………………… Joni Avenell Senior Water Quality Scientist
Date: Reference: Status:
13 March 2009 Surface Water Section Final

G L A D S T O N E L N G F A C I L I T Y D E V E L O P M E N T - S U R F A C E W A T E R E I S
Contents
Prepared for Santos Ltd, 13 March 2009
1
Contents
Executive Summary ............................................................................................ES-1
1 Introduction ................................................................................................... 1-1
1.1 Hydrological Overview of the Study Area ................................................................. 1-2
1.1.1 Curtis Island................................................................................................... 1-2
1.1.2 Boyne River ................................................................................................... 1-3
1.1.3 Calliope River ................................................................................................ 1-3
1.1.4 Curtis Coast................................................................................................... 1-3
2 Environmental Values................................................................................... 2-1
2.1 Environmental Protection (Water) Policy 1997......................................................... 2-1
2.2 Curtis Coastal Regional Management Plan............................................................... 2-2
3 Water Supply ................................................................................................. 3-1
3.1 Water Act 2000 ............................................................................................................. 3-1
3.2 Water Supply ................................................................................................................ 3-1
4 Surface Water Resources............................................................................. 4-1
4.1 Climatic Data ................................................................................................................ 4-1
4.1.1 Rainfall........................................................................................................... 4-1
4.1.2 Evaporation ................................................................................................... 4-3
4.2 Stream Flows................................................................................................................ 4-4
4.3 Soils and Geology........................................................................................................ 4-4
4.4 Existing Flood Characteristics ................................................................................... 4-5
4.4.1 Flood Hydrology ............................................................................................ 4-5
4.4.2 Flood Assessment ......................................................................................... 4-7
5 Existing Water Quality .................................................................................. 5-1
5.1.1 Water Quality Assessment ............................................................................ 5-1
6 Impacts and Mitigation Measures................................................................ 6-1
6.1 Construction Phase ..................................................................................................... 6-1
6.1.1 Erosion and Sediment Mobilisation ............................................................... 6-2
6.1.2 Works Adjacent to/within Drainage Lines...................................................... 6-3
6.1.3 Contaminant Mobilisation .............................................................................. 6-4
6.1.4 Pollution......................................................................................................... 6-5
6.1.5 Flooding......................................................................................................... 6-6

G L A D S T O N E L N G F A C I L I T Y D E V E L O P M E N T - S U R F A C E W A T E R E I S
Contents
Prepared for Santos Ltd, 13 March 2009
2
6.1.6 Water Supply ................................................................................................. 6-6
6.2 Commissioning Phase ................................................................................................ 6-7
6.2.1 Hydrostatic Testing........................................................................................ 6-7
6.3 Operation Phase .......................................................................................................... 6-7
6.3.1 Site Water Management................................................................................ 6-8
6.3.2 Erosion and Sediment Mobilisation ............................................................. 6-10
6.3.3 Improper Disposal of Effluent and Operational Waste Water ..................... 6-11
6.3.4 Flooding....................................................................................................... 6-12
6.4 Decommissioning Phase .......................................................................................... 6-12
6.4.1 Sediment Mobilisation ................................................................................. 6-13
6.4.2 Works Adjacent to/within Drainage Lines.................................................... 6-13
6.4.3 Contaminant Mobilisation ............................................................................ 6-13
6.4.4 Pollution....................................................................................................... 6-13
6.5 Cumulative Impacts ................................................................................................... 6-13
7 Summary........................................................................................................ 7-1
8 Glossary & Adversatives.............................................................................. 8-1
9 References..................................................................................................... 9-1
10 Limitations................................................................................................... 10-1

G L A D S T O N E L N G F A C I L I T Y D E V E L O P M E N T - S U R F A C E W A T E R E I S
Tables, Figures, Appendices
Prepared for Santos Ltd, 13 March 2009
3
Tables, Figures, Plates, Drawings Appendices Error! No table of figures entries found.
Tables
Table 1-1 Terms of Reference ............................................................................................................ 1-1
Table 2-1 Environmental Values for the Watercourses and Receiving Environment of the LNG Facility............................................................................................................................................ 2-2
Table 3-1 Water Demand and Usage for the Facility Stages.............................................................. 3-2
Table 4-1 Predicted peak design flow for drainage features at the perimeter road, Curtis Island...... 4-7
Table 4-2 Predicted flood depths for drainage features at the perimeter road, Curtis Island............. 4-7
Table 5-1 Water Quality Objectives for the Waters of Curtis Island ................................................... 5-1
Table F-1 OCP Facility Catchments.................................................................................................. 10-3
Table F-2 Long Term Rainfall Statistics (107 years, commencing 1900), mm. ................................ 10-3
Table F-3 Mean Monthly Site and Data Drill Rainfalls (mm)............................................................. 10-4
Table F-4 Adopted natural land type AWBM parameters: ................................................................ 10-6
Table F-5 Adopted hardstand land type AWBM parameters: ........................................................... 10-7
Table F-6 OCP Design ...................................................................................................................... 10-8
Figures
Figure 1 Site Location Curtis Island .................................................................................................. 4-2
Figure 2 Mean Monthly Rainfall ........................................................................................................ 4-3
Figure 3 Mean Daily Pan Evaporation .............................................................................................. 4-4
Figure 4 Catchment Boundaries Curtis Island .................................................................................. 4-6
Figure 5 Proposed OCP Process Facility Layout Curtis Island 6-9
Appendices
A. Site Assessment
B. Climatic Data
C. Flooding Assessment
D. Risk Assessment
E. Hazards Matrix
F. Water Balance Assessment
G. Diversion Drainage

G L A D S T O N E L N G F A C I L I T Y D E V E L O P M E N T - S U R F A C E W A T E R E I S
Executive Summary
Prepared for Santos Ltd, 13 March 2009
ES-1
Executive Summary
This Section of the EIS identifies the potential risks to the surface water environmental values as a result of the proposed Gladstone Liquefied Natural Gas (LNG).
The proposed LNG facility study area is located on Curtis Island, within the Boyne-Calliope sub-region of the Fitzroy Basin. The wet season for the area is from October to April.
The onsite ephemeral drainage features are dry outside of rain events and events are anticipated to carry sediment and organic matter. The proposed process area and perimeter road are predicted to be prone to flooding after short, intense rainfall events. This may present a risk to workers’ health and safety and sediment mobilisation during the construction and decommissioning. Flooding in these areas is however likely to subside quickly and construction and operational activity schedules should not be significantly impacted. It is recommended that work is scheduled appropriately during October to April (wet season) to reduce risk from flooding and stormwater management measures be designed at a minimum AEP 0.01 (100 yr ARI).
During the operation of the LNG facility, out-of-bank/flash flood events could result in non-compliant off-site discharges due to inadequate containment capacity of the proposed stormwater management systems. Additionally, it is likely that the perimeter road would be flooded to depths of 0.5 – 1m, in events of a 10yr ARI magnitude, and would therefore be impassable for a short period of time. As during construction, flood depths are likely to subside relatively quickly and operations should not be significantly impacted. It is recommended that emergency response procedures and a flood warning system be incorporated into the site’s Health, Safety and Environment Plan to protect on-site personnel and vulnerable infrastructure.
A qualitative risk assessment approach was used to determine the potential impacts and mitigation measures through the different stages of construction, operation and decommissioning. Potential impacts from the LNG facility during the construction phase are expected to include earth moving activities, works adjacent to/within drainage lines, contaminant mobilisation, pollution and flooding. These impacts may be minimised using erosion and sediment control techniques and the implementation of an Erosion and Sediment Control Plan and a Stormwater Management Strategy.
Indicative sedimentation/evaporation basins were evaluated to provide guidance for onsite stormwater management. The preferred design indicated that a design standard of 0.1 AEP or 10yr ARI could be achieved with the incorporation of a low flow discharge. Insufficient information was available to assess water quality treatment of runoff from hydrocarbon contaminated, natural and disturbed areas. Recommendations include that once water quality objectives have been established, that this, or a similar, water balance model is refined to provide intrinsic data on the performance of the proposed stormwater management and likely frequency, volume and quality of off-site discharges, and aid negotiations with the EPA. This can be done as part of final design if the facility.
It is further recommended that for all containment facilities with off-site discharges to the receiving environment, telemetry monitoring systems are installed (to measure, EC, pH and water level as a minimum). This can provide accurate information regarding both quantity and quality of discharged effluent and calibration data for future water balance, water quality and flood assessment modelling.
It is expected that the proposed recommendations, management and mitigation measures in this report will reduce risks to the environmental values of the surface water environment in the study area.

G L A D S T O N E L N G F A C I L I T Y D E V E L O P M E N T - S U R F A C E W A T E R E I S
Introduction Section 1
Error! Reference source not found. Prepared for Santos Ltd, 13 March 2009
1-1
1 Introduction
This chapter provides an assessment of the water resources of the proposed Gladstone Liquid Natural Gas (LNG) facility site on Curtis Island in the context of environmental values as defined by the Environmental Protection (Water) Policy 1997. The value of these resources to the community and the environment is discussed in terms of current legislation, water quality, regional hydrology, existing conditions of onsite drainage and flow regimes in the study area watercourses. Potential impacts from development activities on the environmental values are discussed and mitigation measures detailed to demonstrate appropriate management. Table 1.1 lists the sections of this report that address the Terms of Reference for an Environmental Impact Statement Gladstone LNG (Santos), August 2008.
Table 1-1 Terms of Reference
Terms of Reference Section
Description EIS Section
Water usage by the Project for raw and treated water for the various processes and the sources of water for construction and operation.
3.2
Any onsite water storage and treatment facilities.
3.2
2.5.2 Water Supply
An assessment of the capability of the water network to provide the necessary demand.
3.2
Amount and nature of stormwater generated for on or offsite treatment and disposal and facilities proposed to accommodate these streams.
Appendix F
Site layout plans should be provided incorporating conceptual plans for stormwater management facilities including descriptions of discharge requirements during construction and operation.
Appendix F
2.5.6 Stormwater
Proposals for drainage structures and dams and an overall site water balance
6.1 6.3 6.4
Appendix F
Description of existing surface water in terms of physical, chemical and biological characteristics.
4 5
Description of existing surface drainage patterns, ephemeral water systems, permanent and episodic wetlands, overland flows, history of flooding including extent, levels and frequency.
5
3.4 Surface Water Resources – Existing Environment
Environmental values of the surface waterways of the affected area in terms of: Values identified in the EPP (Water); physical integrity, fluvial processes and morphology of watercourses; hydrology of waterways, in particular the interconnectiveness of surface water
2
3

G L A D S T O N E L N G F A C I L I T Y D E V E L O P M E N T - S U R F A C E W A T E R E I S
Introduction Section 1
Error! Reference source not found. Prepared for Santos Ltd, 13 March 2009
1-1
Terms of Reference Section
Description EIS Section
and aquifers to adjoining features; and any Water Resource Plans relevant to the affected catchments.
The potential impacts the Project may have on the flow and quality of surface waters from all phases of the Project, and the proposed mitigation measures of these impacts.
6.1 6.2 6.3 6.4
Chemical and physical properties of any waste water including stormwater at the point of discharge into natural surface waters, and the potential effects of effluent on flora and fauna.
7.1.1 7.4.1
3.4 Surface Water Resources – Potential Impacts and Mitigation Measures
The results of a risk assessment for uncontrolled releases to water due to system or catastrophic failure, implications of such release for human health and natural ecosystems, and list strategies to prevent, minimise and contain impacts.
Appendix F
1.1 Hydrological Overview of the Study Area
The proposed LNG facility site is located on Curtis Island, located in the Fitzroy Basin, within the Boyne-Calliope sub-region.
1.1.1 Curtis Island
Curtis Island is within the Curtis coast region, which consists of Raglan Creek to the north, Colosseum Inlet to the south and the Capricorn Group of islands to the east. The western boundary is defined as the landward edge of the coastal catchments (the Boyne River, Calliope River and part of the Fitzroy River catchment) within the local government areas of Gladstone City and Calliope Shire. The Curtis Island Basin has a total catchment area of 576km². Curtis Island is 45km long and a maximum of 14km wide (ANRA, 2007). The major drainage feature on Curtis Island is Graham Creek, located north of the study area. The creek channels a significant portion of surface water runoff from the southern half of Curtis Island into The Narrows, an estuarine passage separating Curtis Island from the mainland. Graham creek, however, is not part of the study area catchment.
Water features within the Project study area are limited to drainage features containing water only during and immediately after rain events. During flood events, runoff is predicted to contain high sediment loads, as flows erode the upper catchment alluvials. The relatively short drainage reaches discharge in to the intertidal flats of China Bay. Saltpan and mangrove communities are present along the sheltered intertidal zones at the south and west of the site. These communities are protected by Department of Primary Industry and Fisheries (DPIF). Chapter 8.4 details the ecological habitat values of the site. Further details of the water features within the study area are provided in Appendix A.
The major freshwater systems in the Curtis Coast region are the Boyne and Calliope rivers. To provide regional context and as the major freshwater input to Port Curtis, these are described in the following sections.

G L A D S T O N E L N G F A C I L I T Y D E V E L O P M E N T - S U R F A C E W A T E R E I S
Introduction Section 1
Error! Reference source not found. Prepared for Santos Ltd, 13 March 2009
1-1
1.1.2 Boyne River
The freshwater flows of the Boyne River are heavily restricted by the Awoonga Dam (which is the principal water supply in the region), Mann’s Weir, and licensed annual diversions of approximately 400Ml annually downstream of the Awoonga Dam.
A water allocation and management planning process has been undertaken for the Boyne River. As part of this process, the Water Resource (Boyne River Basin) Plan 2000 (subordinate legislation under the Water Act 2000) has been developed which seeks to provide a framework for the sustainable management of water resources of the Boyne River. The plan includes provision of environmental flow releases from the Awoonga Dam when the level of the dam is more than 30m AHD (the full supply level is 45m AHD), for the benefit of the Boyne River estuary. Further raising of the dam may be required in the future to meet the projected increases in industrial and urban demand over the next 50 years, but would require a review of this plan (EPP, 2003).
1.1.3 Calliope River
A water allocation and management planning process has not yet been undertaken for the Calliope River but has been scheduled for the future by Department of Natural Resources and Water (NRW). The Calliope River is important in the region in terms of its significant coastal resources (including coastal wetlands, freshwater flow and fisheries habitat values) and its value to the regional community for recreation and fishing. It is also one of few east coast rivers that are natural and do not have dam/weir developments or major flow diversions. Some minor barriers have been constructed in the headwaters that have a minor impact on the flow of freshwater to the coast. The relatively natural flows of the Calliope River are likely to be important in maintaining the ecology of the Gladstone Harbour estuary, especially given the high level of modification and reduction in freshwater flows of the Boyne River (EPP, 2003).
1.1.4 Curtis Coast
The management of water quality is a critical issue for the Curtis Coast region as it includes a large industrial centre and a major city (Gladstone) in close proximity to the Great Barrier Reef World Heritage Area and State and Commonwealth marine parks. The development of water quality management strategies, in accordance with established environmental values and water quality objectives, will ensure adverse impacts on coastal resources and their values are minimised, and public health and wellbeing are protected.
Water quality in the Curtis Coast region has the potential to be adversely affected by industrial discharges, new and existing mining, agricultural, industrial and residential developments near waterways, marine-based pollution and disturbance of coastal habitats. According to findings from the Curtis Coast Regional Coastal Management Plan, the existing water quality for the following waterbodies is of the following standard:
The Narrows — near pristine system;
Gladstone Harbour — modified system; and
Colosseum Inlet — pristine system.
The Great Barrier Reef Marine Park Authority’s Water Quality Action Plan provides a catchment risk assessment (based on the relative increase in sediment, nitrogen and phosphorus exports from 1850 to present) for the main river catchments for the Great Barrier Reef Lagoon. The actions of this assessment include:
The Calliope River has been assigned a medium/high risk and the Boyne River has been assigned a medium risk.
The Great Barrier Reef Marine Park Authority has developed runoff reduction targets for all waterways flowing to the Great Barrier Reef lagoon.

G L A D S T O N E L N G F A C I L I T Y D E V E L O P M E N T - S U R F A C E W A T E R E I S
Introduction Section 1
Error! Reference source not found. Prepared for Santos Ltd, 13 March 2009
1-1
The Queensland and Commonwealth Governments are developing a Reef Water Quality Protection Plan16 that will identify practical actions to improve the water quality and reduce the impacts on the Great Barrier Reef marine environment.
The Fitzroy Basin Association is preparing a natural resource management plan that will include the Curtis Coast region and will identify targets for certain activities to ensure improvements in water quality (EPP, 2003).
As a consequence of increasing population and industrial activities, the Port Curtis estuary is expected to receive increasing quantities of contaminant inputs from diffuse sources (e.g. urban run-off) and point source discharges (e.g. industrial effluents). A study undertaken by CRC, (2005) has therefore been comprised focusing on key contaminants in the Port Curtis estuary.
The contaminants of potential ecological concern identified include Tributyltin (TBT) in waters and Arsenic, TBT and naphthalene (based on limited historical data) in sediments.
Particulate arsenic and naphthalene may be derived from natural sources within Port Curtis (e.g. oil shale deposits). The main sources of TBT are commercial ships and leisure boats that utilise the area. TBT concentrations are expected to decline in Port Curtis over the next decade as this antifoulant is completely phased out worldwide (CRC, 2005).
The concentrations of dissolved metals in waters of the Port Curtis estuary were below levels of regulatory concern. However, the concentrations of dissolved copper, nickel, lead and zinc were elevated relative to concentrations at pristine coastal water sites in Australia. The reasons for these elevated concentrations may be industrial discharges or natural inputs of metals from local geological formations.
A sub-tropical humid climate is characteristic of the Gladstone and Rockhampton regions, with wet summer periods generally between October and April, and dry winters generally between May and September. Climatic data for Gladstone area is discussed in Section 4.1.

G L A D S T O N E L N G F A C I L I T Y D E V E L O P M E N T - S U R F A C E W A T E R E I S
Environmental Values Section 2
Error! Reference source not found. Prepared for Santos Ltd, 13 March 2009
2-1
2 Environmental Values
2.1 Environmental Protection (Water) Policy 1997
The Environmental Protection (Water) Policy 1997 (EPP, 2003) seeks to protect and/or enhance the suitability of Queensland’s waters for various beneficial uses. The policy identifies environmental values for waters within Queensland and guides the setting of water quality objectives to protect the environmental values of any water resource. The environmental values include the biological integrity of the aquatic ecosystem and recreational, drinking water supply, agricultural and/or industrial uses.
Within the proposed LNG facility site there are no named watercourses or minor tributaries. However watercourses on Curtis Island, such as Graham Creek, and waters surrounding Curtis Island will be protected under the EPP Water. Additionally, the pristine “Narrows” and the Great Barrier Marine Park should be considered as receiving waters of any discharge from the site.
Local government, industry and the Gladstone Port Authority are involved in a collaborative project as part of the Gladstone Harbour Protection and Enhancement Strategy that has identified preliminary environmental values for some waterways in the Curtis Coast region.
Environmental values adopted for this project have been identified through the Strategy’s preliminary environmental values (BCC, 2002) and data gathered from URS site assessment (refer Appendix A) and are summarised in Table 2.1
Cultural Heritage:
The Curtis Coast region has a unique historical background with a diversity of features and places of cultural heritage significance including memorials, shipwrecks, middens and lighthouses. The region is of cultural significance to Indigenous Traditional Owners and fulfils an essential role in their traditional and contemporary lifestyle.
Marine areas and islands such as the Capricorn Group, The Narrows and Gladstone Harbour are within the Great Barrier Reef Region, most of which was inscribed on the World Heritage List in 1981. A World Heritage listing obliges governments to protect, conserve, present, rehabilitate and transmit to future generations these World Heritage Areas (EPP, 2003).
Aquatic Ecosystem:
The undeveloped coastal areas within the Curtis Coast region contain sites of high conservation value such as a diversity of wetlands, seagrass beds, dugong habitat, turtle nesting beaches, coral cays and planar reefs (EPP, 2003).
The coast has been subject to a number of pressures as a result of industrial and social development. Building of the Awoonga Dam has resulted in a significant reduction in freshwater flows at the mouth of the Boyne River, which in turn has had significant adverse impacts on some fisheries and possible impacts on coastal ecosystems (EPP, 2003).
Primary Industries:
On Curtis Island, land use is characterised largely by various areas of State owned lands (including some protected areas), national parks and forestry and cattle grazing.
The key industrial land uses in the Curtis Coast region include the Port of Gladstone; the Gladstone State Development Area and associated major infrastructure; major urban centres at Gladstone, Boyne Island, Tannum Sands and Calliope.
Recreation:
The recreation amenity of Curtis Island, and more generally the Curtis Coast region, is high, due to the coastal resources available and cultural sites.

G L A D S T O N E L N G F A C I L I T Y D E V E L O P M E N T - S U R F A C E W A T E R E I S
Environmental Values Section 2
Error! Reference source not found. Prepared for Santos Ltd, 13 March 2009
2-2
Table 2-1 Environmental Values for the Watercourses and Receiving Environment of the LNG Facility
Environmental Values Relevance to Curtis Coast Region
Protection of high ecological value aquatic habitat
Protection of slightly to moderately disturbed aquatic habitat
Protection of highly disturbed aquatic habitat X
Suitability for human consumers of aquatic food
Suitability for primary contact recreation (e.g. swimming)
Suitability for secondary recreation (e.g. boating)
Suitability for visual (no contact) recreation
Protection of cultural and spiritual values
Suitability for industrial use (including manufacturing plants, power generation)
Suitability for aquaculture (e.g. red claw, barramundi)
Suitability for drinking water supplies X
Suitability for crop irrigation X
Suitability for stock watering
Suitability for farm use
Table Notes:
: River basin is suitable for the environmental value.
X: River basin is not suitable for the environmental value.
Brought into effect on the 1st January 2008, the Environmental Protection (Water) Amendment Policy (No. 1) 2008 amends the EPP Water. These changes do not however affect work prepared in 2008 on the EIS.
2.2 Curtis Coastal Regional Management Plan
Although no water resource plan exists for Curtis Island, the Curtis Coastal Regional Management Plan operates alongside a range of statutory and non-statutory plans and policies at Commonwealth, State and Local government level. It establishes policies to assist and guide the integration of these plans and policies with other relevant planning and decision-making activities to achieve the ecologically sustainable use and management of the coastal zone.
The Curtis Coastal Plan provides policy guidance and direction for developments and strategic planning in Calliope Shire and Gladstone City. Its effect as a State planning policy incorporates State and regional interests into local government planning schemes (EPP, 2003).

G L A D S T O N E L N G F A C I L I T Y D E V E L O P M E N T - S U R F A C E W A T E R E I S
Section 3 Water Supply
Prepared for Santos Ltd, 13 March 2009
3-1
3 Water Supply
The Water Act 2000 and the Integrated Planning Act 1997 are the principal legislation governing approvals and licensing of water supply schemes and associated structures.
3.1 Water Act 2000
The Water Act 2000 (the Act) provides a basis for the planning and allocation of Queensland water resources. Under the Act the provision of water for human uses such as irrigation, stock watering, drinking and industry must make allowances for the environmental requirements that support the ecological health of the river system.
The watercourses affected by the proposed LNG facility site will be subject to protection under the Water Act 2000, which will regulate the extraction of water from these watercourses and the diversion of these watercourses.
The Fitzroy Basin and Calliope Basin Water Resource Plan’s cover the management of all surface water in the basin including overland flow. The Final Fitzroy Water Resource Plan was approved in December 1999 and the Final Calliope Water Resource Plan was approved in December 2006.
Due to the ephemeral nature of the watercourses along on Curtis Island, it is unlikely that water for construction and operation will be sourced from any of these watercourses. Water supply for the site facility construction and operation will be sourced from a number of options as detailed below.
3.2 Water Supply
The proposed design for the facility on Curtis Island is the Optimised Cascade LNG Process (OCP) (see Figure 5). During the initial phase of construction, OCP propose potable water is proposed to be brought to the site by barge. During the later stages of construction, when work crew size increases, the desalination of seawater using Reverse Osmosis (RO) is proposed to be used as a secondary water source. As the water demand continues to grow, routing of excess stormwater may provide a third water supply source to the system.
As water demands from the three sources were not provided, the assessment of the water balance model (refer to Appendix F) does not account for water supply. This omission therefore provides a slightly conservative estimate of overflow volume and frequency.
OCP estimate the water demand during the peak of construction to be over the 40 month construction phase:
Construction supply, including concrete: 37,000m3.
Site preparation and dust control: 6,000m3.
Potable water: 650,000m3.
OCP estimates 87,000m3 of water for hydrostatic testing of the facility, undertaken during the commissioning phase. The design does not specify operational demands or sources.
Table 3.1 presents the approximate daily use and storage volumes through each stages of the project life.

G L A D S T O N E L N G F A C I L I T Y D E V E L O P M E N T - S U R F A C E W A T E R E I S
Section 3 Water Supply
Prepared for Santos Ltd, 13 March 2009
3-2
Table 3-1 Water Demand and Usage for the Facility Stages
OCP
Construction Commission Operation
Approximate Predicted Daily Use
600 m3/day No data No data
Predicted Stored Volume
No data 90,000m3 No data

G L A D S T O N E L N G F A C I L I T Y D E V E L O P M E N T - S U R F A C E W A T E R E I S
Section 4 Surface Water Resources
Prepared for Santos Ltd, 13 March 2009
4-1
4 Surface Water Resources
4.1 Climatic Data
Rainfall and evaporation data was obtained from the Bureau of Meteorology (BoM). No climatic data was available for Southern Curtis Island (Station Number 039241). Therefore rainfall and evaporation data for gauges adjacent to the study area were reviewed for suitability.
4.1.1 Rainfall
Mean monthly rainfall data was sourced from a number of BoM meteorological stations in the vicinity of Curtis Island. Stations included Gladstone Airport (Station Number 039326), Gladstone Radar (Station Number 039123), Gladstone Post Office (Station Number 039041) all located to the west of Curtis Island, and Cape Capricorn (Station Number 039023) (Figure 1).
Mean monthly rainfall (refer Figure 2) is greatest in January and February, with the highest rainfall occurring at Gladstone Post Office station, and lowest in July at Gladstone Airport. The mean annual rainfall rangers from 786.4mm (Gladstone Airport) to 1020.8mm (Gladstone Post Office). The mean annual rainfall for the area is 865.8mm. Rainfall averages suggest a distinct wet and dry season, with the wet generally October to April and the dry May to September.

151º13'
151º12'
151º12'30"
-23º47'30"
-23º47'
-23º46'30"
-23º46'
151º13'30"
151º14'
151º14'30"
China Bay
2222222222222222222222222222222222222222222222222
3333333333333333333333333333333333333333333333333
44444444444444444444444444444444444444444444444445555555555555555555555555555555555555555555555555
6666666666666666666666666666666666666666666666666
77777777777777777777777777777777777777777777777778888888888888888888888888888888888888888888888888
Figure:
4262 6220
SIT
E L
OC
AT
ION
CU
RT
IS IS
LA
ND
Rev: B
Approved:
File N
o:A
442626220-g-518b.w
or1
Client
Project
Title
Job No:
Date:
27-01-2009D
rawn:
This drawing is subject to COPYRIGHT. It remains the property of URS Australia Pty Ltd.
RG
JB
Source: This map may contain data which is sourced and Copyright. Refer to Section 18.2 of the EIS for Ownerstip and Copyright.
Gladstone Airport
Cape Capricorn Lighthouse
Gladstone Radar
Gladstone Post Office
Gladstone Radar0 250m
Scale
500m
Scale: 1:20 000 (A4)Datum : GDA94
URS Visual Assessment - Access RoadRainfall StationEvaporation Station
LNG Facility Site BoundaryLNG Facility Study Area
Proposed Site Access RoadGas Transmission Pipeline
GLA
DS
TO
NE
LNG
PR
OJE
CT
LNG
FA
CILIT
Y S
UR
FA
CE
WA
TE
R R
EP
OR
T
Catchment BoundaryOther DrainageWatercourseTrack

G L A D S T O N E L N G F A C I L I T Y D E V E L O P M E N T - S U R F A C E W A T E R E I S
Section 4 Surface Water Resources
Prepared for Santos Ltd, 13 March 2009
4-3
0
50
100
150
200
250
Jan Feb Mar Apr May Jun Jul Aug Sep Oct Nov Dec
Month
mm
Gladstone Airport (BoM, 1994 to 2008) Gladstone Radar (BoM,1957 to 2008)
Gladstone Post Office (BoM, 1872 to 1958) Cape Capricorn (BoM, 1899 to 1987)
Figure 2 Mean Monthly Rainfall
4.1.2 Evaporation
Pan evaporation data was obtained from Gladstone Radar (Station Number 039123) (refer to Figure 1).
Mean daily evaporation rates, recorded 1966 to 1993, are greatest in December and January (6.3mm/day) with the lowest evaporation levels occurring in June/July (3.0 and 3.1mm/day respectively) (refer to Figure 3). The annual mean daily evaporation is 4.8mm/day (refer to Appendix B for climate data tables).

G L A D S T O N E L N G F A C I L I T Y D E V E L O P M E N T - S U R F A C E W A T E R E I S
Section 4 Surface Water Resources
Prepared for Santos Ltd, 13 March 2009
4-4
0
1
2
3
4
5
6
7
Jan Feb Mar Apr May Jun Jul Aug Sep Oct Nov Dec
Month
Mea
n D
aily
Eva
po
rati
on
(m
m/d
ay)
Gladstone Radar (BoM, 1966 to 1993)
Figure 3 Mean Daily Pan Evaporation
4.2 Stream Flows
Neither the Gladstone Regional Council nor the NRW hold historical flood records for Curtis Island. Due to the highly ephemeral nature and small catchment size of the drainage features within the LNG facility study area, regional stream flow information was considered an inappropriate source of data for design peak flows.
As part of the EIS, a Water Balance Model has been prepared for the LNG facility study area water management (refer to Appendix F). Stream flow data from the gauge at the Castelhope Calliope River gauge 132001A (1938-2006) was used in the absence of any other appropriate data, for the Curtis Island catchment runoff calibration. An analysis of this data and its use has been discussed in Appendix F.
4.3 Soils and Geology
The terrain in the LNG facility site area and along the perimeter road includes gently to moderately inclined foot-slopes and undulating valley plains and alluvial drainage-ways which are fringed along the coastline by supra-tidal estuarine/marine flats and tidal mangrove flats.
The soils in these areas comprise deep soft saline clay, silt and muddy sand soils on the estuarine/coastal flats, with deep uniform (non-cracking) clay soils with a silty clay surface and some thin silt loamy surface duplex soils with locally moderately saline medium to heavy clay subsoils on the alluvial flats and drainage-ways. Medium to deep gravelly loamy surface duplex soils and locally some gradational clay soils occur on the lower slopes and valley plains. Shallow to medium deep gravelly red-brown duplex soils occur in the low rounded hilly areas and shallow to medium deep stony loams and

G L A D S T O N E L N G F A C I L I T Y D E V E L O P M E N T - S U R F A C E W A T E R E I S
Section 4 Surface Water Resources
Prepared for Santos Ltd, 13 March 2009
4-5
shallow gravelly uniform structured clay soils occur on the steeper hilly and high hilly lands and on some low saddles in the hilly areas.
With the exception of the of the potentially deep soft sediments in the estuarine/marine flats, the remainder of the LNG facility site area is underlain at relatively shallow depths, generally between about 0.5m to 2.0m (below ground level), by highly weathered sandstone, siltstone, mudstone or meta-sediments associated with the Carboniferous Wandilla Formation. Geology is discussed in greater detail in Chapter 8.3 Land, Terrain and Soils.
4.4 Existing Flood Characteristics
The proposed LNG facility site is approximately 3.8km2 and is located to the south west coast of Curtis Island. The site stretches from the hills to the east at approximately 124m AHD in elevation, down to the flat salt marsh of the China Bay coast. At higher elevations the site is densely vegetated bushland; at lower elevations the vegetation generally becomes sparser. The proposed facility area is currently grazed with cattle and there is a single dirt road traversing the perimeter of the site.
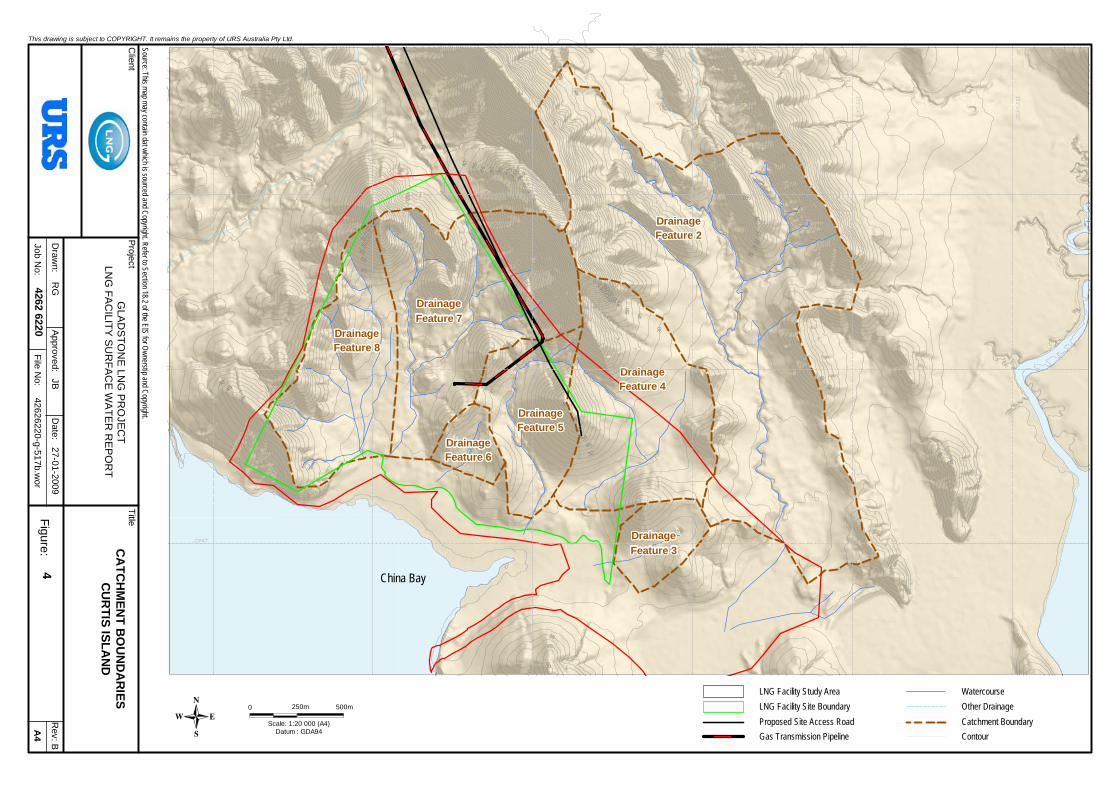
Within the designated LNG facility study area eight drainage features have been identified. The features are all ephemeral in nature, with small catchments (less than 5km2 in size). The drainage features have been numbered from east to west and are shown on Figure 4.
The site investigation indicated that features evolved from drainage gullies in the upper catchment formed from erosive runoff, during high intensity storm events. The small feature drains are hard to distinguish with the channel width varying between 0.3 – 2.5m. The channels are generally extremely shallow with depths of 0.1 – 1.5m, however heavily eroded bends have gully features up to 4m in depth.
Evaluation of the proposed facility layout led to the assessment of all but one of the eight drainage features (the most easterly drainage feature is unlikely to be disturbed as a result of the project). The assessments were undertaken at the road crossing to the south of the site. Refer to Appendix A for the detailed flood assessment of the proposed LNG facility study area.
4.4.1 Flood Hydrology
Flood hydrology uses statistical or deterministic methods to estimate the depth of rainfall to occur and the likely flow, for any point within a catchment, for a particular probabilistic (Annual Recurrence Interval, ARI) flood event. A hydrological assessment using the Rational Method based on Weeks (1991) was applied at the perimeter road (refer to Figure 4). This analysis considered the catchment characteristics and local hydrological patterns to determine the time of concentration and runoff coefficient.
Details of the hydrological assessment undertaken for the seven drainage features identified are provided in Appendix C. Results of the assessment are summarised below in Table 4-1.
DrainageDrainageDrainageDrainageDrainageDrainageDrainageDrainageDrainageDrainageDrainageDrainageDrainageDrainageDrainageDrainageDrainageDrainageDrainageDrainageDrainageDrainageDrainageDrainageDrainageDrainageDrainageDrainageDrainageDrainageDrainageDrainageDrainageDrainageDrainageDrainageDrainageDrainageDrainageDrainageDrainageDrainageDrainageDrainageDrainageDrainageDrainageDrainageDrainageFeature 2Feature 2Feature 2Feature 2Feature 2Feature 2Feature 2Feature 2Feature 2Feature 2Feature 2Feature 2Feature 2Feature 2Feature 2Feature 2Feature 2Feature 2Feature 2Feature 2Feature 2Feature 2Feature 2Feature 2Feature 2Feature 2Feature 2Feature 2Feature 2Feature 2Feature 2Feature 2Feature 2Feature 2Feature 2Feature 2Feature 2Feature 2Feature 2Feature 2Feature 2Feature 2Feature 2Feature 2Feature 2Feature 2Feature 2Feature 2Feature 2
DrainageDrainageDrainageDrainageDrainageDrainageDrainageDrainageDrainageDrainageDrainageDrainageDrainageDrainageDrainageDrainageDrainageDrainageDrainageDrainageDrainageDrainageDrainageDrainageDrainageDrainageDrainageDrainageDrainageDrainageDrainageDrainageDrainageDrainageDrainageDrainageDrainageDrainageDrainageDrainageDrainageDrainageDrainageDrainageDrainageDrainageDrainageDrainageDrainageFeature 4Feature 4Feature 4Feature 4Feature 4Feature 4Feature 4Feature 4Feature 4Feature 4Feature 4Feature 4Feature 4Feature 4Feature 4Feature 4Feature 4Feature 4Feature 4Feature 4Feature 4Feature 4Feature 4Feature 4Feature 4Feature 4Feature 4Feature 4Feature 4Feature 4Feature 4Feature 4Feature 4Feature 4Feature 4Feature 4Feature 4Feature 4Feature 4Feature 4Feature 4Feature 4Feature 4Feature 4Feature 4Feature 4Feature 4Feature 4Feature 4
DrainageDrainageDrainageDrainageDrainageDrainageDrainageDrainageDrainageDrainageDrainageDrainageDrainageDrainageDrainageDrainageDrainageDrainageDrainageDrainageDrainageDrainageDrainageDrainageDrainageDrainageDrainageDrainageDrainageDrainageDrainageDrainageDrainageDrainageDrainageDrainageDrainageDrainageDrainageDrainageDrainageDrainageDrainageDrainageDrainageDrainageDrainageDrainageDrainageFeature 3Feature 3Feature 3Feature 3Feature 3Feature 3Feature 3Feature 3Feature 3Feature 3Feature 3Feature 3Feature 3Feature 3Feature 3Feature 3Feature 3Feature 3Feature 3Feature 3Feature 3Feature 3Feature 3Feature 3Feature 3Feature 3Feature 3Feature 3Feature 3Feature 3Feature 3Feature 3Feature 3Feature 3Feature 3Feature 3Feature 3Feature 3Feature 3Feature 3Feature 3Feature 3Feature 3Feature 3Feature 3Feature 3Feature 3Feature 3Feature 3
DrainageDrainageDrainageDrainageDrainageDrainageDrainageDrainageDrainageDrainageDrainageDrainageDrainageDrainageDrainageDrainageDrainageDrainageDrainageDrainageDrainageDrainageDrainageDrainageDrainageDrainageDrainageDrainageDrainageDrainageDrainageDrainageDrainageDrainageDrainageDrainageDrainageDrainageDrainageDrainageDrainageDrainageDrainageDrainageDrainageDrainageDrainageDrainageDrainageFeature 5Feature 5Feature 5Feature 5Feature 5Feature 5Feature 5Feature 5Feature 5Feature 5Feature 5Feature 5Feature 5Feature 5Feature 5Feature 5Feature 5Feature 5Feature 5Feature 5Feature 5Feature 5Feature 5Feature 5Feature 5Feature 5Feature 5Feature 5Feature 5Feature 5Feature 5Feature 5Feature 5Feature 5Feature 5Feature 5Feature 5Feature 5Feature 5Feature 5Feature 5Feature 5Feature 5Feature 5Feature 5Feature 5Feature 5Feature 5Feature 5
DrainageDrainageDrainageDrainageDrainageDrainageDrainageDrainageDrainageDrainageDrainageDrainageDrainageDrainageDrainageDrainageDrainageDrainageDrainageDrainageDrainageDrainageDrainageDrainageDrainageDrainageDrainageDrainageDrainageDrainageDrainageDrainageDrainageDrainageDrainageDrainageDrainageDrainageDrainageDrainageDrainageDrainageDrainageDrainageDrainageDrainageDrainageDrainageDrainageFeature 8Feature 8Feature 8Feature 8Feature 8Feature 8Feature 8Feature 8Feature 8Feature 8Feature 8Feature 8Feature 8Feature 8Feature 8Feature 8Feature 8Feature 8Feature 8Feature 8Feature 8Feature 8Feature 8Feature 8Feature 8Feature 8Feature 8Feature 8Feature 8Feature 8Feature 8Feature 8Feature 8Feature 8Feature 8Feature 8Feature 8Feature 8Feature 8Feature 8Feature 8Feature 8Feature 8Feature 8Feature 8Feature 8Feature 8Feature 8Feature 8
DrainageDrainageDrainageDrainageDrainageDrainageDrainageDrainageDrainageDrainageDrainageDrainageDrainageDrainageDrainageDrainageDrainageDrainageDrainageDrainageDrainageDrainageDrainageDrainageDrainageDrainageDrainageDrainageDrainageDrainageDrainageDrainageDrainageDrainageDrainageDrainageDrainageDrainageDrainageDrainageDrainageDrainageDrainageDrainageDrainageDrainageDrainageDrainageDrainageFeature 7Feature 7Feature 7Feature 7Feature 7Feature 7Feature 7Feature 7Feature 7Feature 7Feature 7Feature 7Feature 7Feature 7Feature 7Feature 7Feature 7Feature 7Feature 7Feature 7Feature 7Feature 7Feature 7Feature 7Feature 7Feature 7Feature 7Feature 7Feature 7Feature 7Feature 7Feature 7Feature 7Feature 7Feature 7Feature 7Feature 7Feature 7Feature 7Feature 7Feature 7Feature 7Feature 7Feature 7Feature 7Feature 7Feature 7Feature 7Feature 7
DrainageDrainageDrainageDrainageDrainageDrainageDrainageDrainageDrainageDrainageDrainageDrainageDrainageDrainageDrainageDrainageDrainageDrainageDrainageDrainageDrainageDrainageDrainageDrainageDrainageDrainageDrainageDrainageDrainageDrainageDrainageDrainageDrainageDrainageDrainageDrainageDrainageDrainageDrainageDrainageDrainageDrainageDrainageDrainageDrainageDrainageDrainageDrainageDrainageFeature 6Feature 6Feature 6Feature 6Feature 6Feature 6Feature 6Feature 6Feature 6Feature 6Feature 6Feature 6Feature 6Feature 6Feature 6Feature 6Feature 6Feature 6Feature 6Feature 6Feature 6Feature 6Feature 6Feature 6Feature 6Feature 6Feature 6Feature 6Feature 6Feature 6Feature 6Feature 6Feature 6Feature 6Feature 6Feature 6Feature 6Feature 6Feature 6Feature 6Feature 6Feature 6Feature 6Feature 6Feature 6Feature 6Feature 6Feature 6Feature 6
151º13'
151º12'
151º12'30"
-23º47'
-23º46'30"
-23º46'
151º13'30"
151º14'
151º14'30"
China Bay
105
70
85
50
85
100
3045
55
70
5545
30
30
45
00
0
0
30
45
65
50
100
80
12014
5-99920
0
0
30
45
70
55
958 065
5040
30
125
30
45
55
8565
100
115140
1510
35
45
35
45
00
-99915
5
Figure:
4262 6220
CA
TC
HM
EN
T B
OU
ND
AR
IES
CU
RT
IS IS
LA
ND
Rev: B
Approved:
File N
o:A
442626220-g-517b.w
or4
Client
Project
Title
Job No:
Date:
27-01-2009D
rawn:
This drawing is subject to COPYRIGHT. It remains the property of URS Australia Pty Ltd.
RG
JB
GLA
DS
TO
NE
LNG
PR
OJE
CT
LNG
FA
CILIT
Y S
UR
FA
CE
WA
TE
R R
EP
OR
T
Source: This map may contain dat which is sourced and Copyright. Refer to Section 18.2 of the EIS for Ownerstip and Copyright.
0 250m
Scale
500m
Scale: 1:20 000 (A4)Datum : GDA94
LNG Facility Site BoundaryLNG Facility Study Area
Gas Transmission PipelineProposed Site Access Road Catchment Boundary
Other DrainageWatercourse
Contour

G L A D S T O N E L N G F A C I L I T Y D E V E L O P M E N T - S U R F A C E W A T E R E I S
Section 4 Surface Water Resources
Prepared for Santos Ltd, 13 March 2009
4-7
Table 4-1 Predicted peak design flow for drainage features at the perimeter road, Curtis Island
Drainage Feature Upstream Catchment Area (km2)
2 Year ARI
Peak Flow (m3/s)
10 Year ARI
Peak Flow (m3/s)
100 Year ARI
Peak Flow (m3/s)
Unnamed Drainage Feature No. 2 2.156 6.4 14.9 35
Unnamed Drainage Feature No. 3 0.165 0.8 1.9 4.5
Unnamed Drainage Feature No. 4 0.776 2.9 6.7 15.6
Unnamed Drainage Feature No. 5 0.370 1.6 3.7 8.6
Unnamed Drainage Feature No. 6 0.080 0.5 1.1 2.6
Unnamed Drainage Feature No. 7 0.890 3.1 7.2 16.9
Unnamed Drainage Feature No. 8 0.568 2.2 5.2 12.2
Further details of each drainage feature are provided in Appendices A and C.
4.4.2 Flood Assessment
To approximate the flood depths at each of the seven identified drainage features, a basic hydraulic assessment has been undertaken using industry accepted software (HEC-RAS v3). The predicted water depths are summarized below in Table 4-2 (further details of the assessment are provided in Appendix C). In all three simulated flood events 2, 10 and 100 year ARI, out of channel bank flooding is predicted to occur.
Table 4-2 Predicted flood depths for drainage features at the perimeter road, Curtis Island
Drainage Feature 2yr ARI Depth (m)
10yr ARI Depth (m)
100yr ARI Depth (m)
Unnamed Drainage Feature No. 2 1.55 1.84 2.16
Unnamed Drainage Feature No. 3 0.09 0.13 0.18
Unnamed Drainage Feature No. 4 1.13 1.24 1.39
Unnamed Drainage Feature No. 5 0.51 0.67 0.89
Unnamed Drainage Feature No. 6 0.39 0.42 0.48
Unnamed Drainage Feature No. 7 0.53 0.61 0.68
Unnamed Drainage Feature No. 8 0.59 0.79 1.04
Further details of each drainage feature crossing are provided in Appendices A and C.

G L A D S T O N E L N G F A C I L I T Y D E V E L O P M E N T - S U R F A C E W A T E R E I S
Section 5 Existing Water Quality
Prepared for Santos Ltd, 13 March 2009
5-1
5 Existing Water Quality
The Australian and New Zealand Environment and Conservation Council (ANZECC) Guidelines 2000 provide guideline values or descriptive statements for different indicators to protect aquatic ecosystems and human uses of waters (e.g. primary recreation, human drinking water, agriculture, stock watering). The ANZECC (2000) Guidelines are a broad scale assessment and it is recommended that, where applicable, locally relevant guidelines are adopted.
The Queensland EPAs Queensland Water Quality Guidelines 2006 (QWQG, 2006) are intended to address the need identified in the ANZECC Guidelines by:
Providing guideline values that are specific to Queensland regions and water types; and
Provide a process/framework for deriving and applying local guidelines for waters in Queensland (i.e. more specific guidelines than those in the ANZECC).
Relevant water quality objectives for the study area were identified from QWQG (2006) to support and protect different environmental values for waters in the Curtis Island Basin (refer to Table 5-1). Salinity guidelines were obtained from Appendix G of the QWQG (2006). These water quality objectives should be used as a guide to what the ambient water quality should be. The receiving environment is Port Curtis. Detailed assessment of the water quality of Port Curtis is contained in Chapter 8.4. Ecological assessment of the site is included in Chapter 8.4 as part of this EIS to characterise the health of the waterways.
Table 5-1 Water Quality Objectives for the Waters of Curtis Island
Parameters Enclosed Coastal Upper Estuarine Lowland Streams Ammonia N (µg/l) 8 30 20
Oxidised Nitrogen (Nitrate and Nitrite) (µg/l)
3 15 60
Organic N (µg/l) 180 400 420
Total N (µg/l) 200 450 500
Filterable Reactive Phosphorus (µg/l)
6 10 20
Total Phosphorous (µg/l) 20 40 50
Chlorophyll-a (µg/l) 2 10 5
Dissolved Oxygen (%saturation)
90 - 100 70 - 100 85 - 110
Turbidity (NTU) 6 25 50
Suspended Solids (mg/l) 15 25 10
pH 8.0 - 8.4 7.0 – 8.4 6.5 – 8.0
Conductivity (µS/cm) 970 970 970
5.1.1 Water Quality Assessment
No existing surface water quality data was available for watercourses and drainage features within the LNG facility area on Curtis Island. There are no NRW recognized watercourses that will potentially be affected by the Project. The water features within the study area would generally be classified as drainage feature lines carrying water only during immediately and after storm events. Observations during the URS site visual assessment, undertaken in May 2008, indicated drainage features at the site were ephemeral and dry outside of rain events. The visual assessment also suggested that both minor and major flows would carry sediment and organic matter such as leaf litter. Appendix A presents details of the drainage features as noted by the URS site assessment. These characterizations will be used to establish baseline physical conditions of the watercourses and be used to determine changes over time and from potential impacts as a result of the development.

G L A D S T O N E L N G F A C I L I T Y D E V E L O P M E N T - S U R F A C E W A T E R E I S
Section 6 Impacts and Mitigation Measures
Prepared for Santos Ltd, 13 March 2009
6-1
6 Impacts and Mitigation Measures
The following information details the major planned activities for the proposed LNG facility site through the different stages of construction, commissioning, operation and decommissioning. The potential impacts are discussed and management measures to minimise those impacts are outlined. This was undertaken using a qualitative risk assessment approach (refer to Appendix D). Risk is the chance of something happening that will have an impact and it is measured in terms of the potential ‘consequences’ of an event and the ‘likelihood’ that the event will occur (AS/NZ4360). The detailed risk matrix for the proposed LNG facility site activities is provided in Appendix E and the impacts and mitigation measures identified are outlined as follows.
A Preliminary Site Investigation (PSI) was undertaken by URS to examine the potential for pre-existing land contamination as well as project related contamination impacts during the construction and operational phases of the project. The investigation identified arsenic at concentrations greater than the health based investigation levels for industrial/commercial land use. For further information refer to “Preliminary Site Assessment – Santos Gladstone Liquefied Natural Gas (GLNG) Project” report.
Additionally a study of the shallow groundwater resources was compiled by URS. The findings of the groundwater quality analysis included:
In general, groundwater in all site monitoring bores except one is suitable for livestock drinking water.
The concentration of dissolved arsenic in groundwater from all bores (with the exception of one) exceeds the ANZECC guidelines for freshwater aquatic environments.
The concentrations of dissolved manganese in groundwater from all bores are above the ANZECC guidelines for freshwater aquatic environments.
The concentrations of dissolved cadmium, chromium, nickel, and zinc from some bores are above the ANZECC guidelines for freshwater aquatic environments.
The concentrations of dissolved cobalt in groundwater from all bores are above the ANZECC guidelines for marine aquatic environments.
The concentrations of dissolved chromium, copper, lead, nickel, and zinc from some bores are above the ANZECC guidelines for marine aquatic environments.
The groundwater, from both shallow (< 8 m) and deep (> 20 m) boreholes, is recognised as not suitable for discharge into the fresh or marine water environments.
Treatment may be required for industrial use, which could result in waste material, which would require the correct industry accepted handling, storage, and disposal practices.
Elevated concentrations of dissolved solids, sodium, chloride, and sulfate were recorded in the majority of the groundwater samples above the ADWG guideline values.
Concentrations of dissolved metals, arsenic, manganese, and nickel, were recorded in the majority of the groundwater samples.
For further information refer to “GLNG Environmental Impact Statement – Shallow Groundwater” report.
6.1 Construction Phase
It is anticipated the OCP design will follow the following steps:
Site survey;
Mobilisation of earthmoving equipment;
Construction of the Haul Road to the site;

G L A D S T O N E L N G F A C I L I T Y D E V E L O P M E N T - S U R F A C E W A T E R E I S
Section 6 Impacts and Mitigation Measures
Prepared for Santos Ltd, 13 March 2009
6-2
Transport and storage of bulk fuels, including the construction of bunded areas to avoid spillage;
Clearance of vegetation on and around the site;
Removal of topsoil and stockpiling in an approved area. This will be use for landscaping following construction of the facility;
Excavation, backfilling and compaction of material in accordance to design specification;
Construction of workers camp;
Construction of appropriate foundations;
Construction of Material Offloading Facilities (MOF), and LNG Jetty;
Construction of LNG tank and other storage tanks;
Installation of gas turbine, compressors, pipe racks, and power generation equipment;
Construction of both effluent and water treatment facilities;
Assembly of the flare and utilities area;
Installation of the incinerators; and,
Construction of administration buildings.
During the construction of the facility, workforce numbers are predicted to increase and decrease over three waves, known as workforce trains. The first train will peak with numbers exceeding 3000 workers by month 20. The other two trains will peak at month 68 and 116, to approximately 1800 workers. The LNG facility shall be in full operation by month 138.
6.1.1 Erosion and Sediment Mobilisation
Activities
Earth moving activities are expected to include:
Removal of vegetation;
Top soil removal and stockpiling;
Cut and fill;
Construction of the proposed LNG facility
Construction of workers camp; and
Construction of the lay down area for equipment storage
Potential Impacts
Sediment mobilised during construction activities may enter surface water runoff during rainfall events and discharge to drainage lines leading to deleterious effects on water quality and aquatic habitats. Sediment exposed or generated during construction may also be blown by wind into surface water bodies. Additionally there is the potential presence of high levels of metals in soils that may enter waterways.

G L A D S T O N E L N G F A C I L I T Y D E V E L O P M E N T - S U R F A C E W A T E R E I S
Section 6 Impacts and Mitigation Measures
Prepared for Santos Ltd, 13 March 2009
6-3
Mitigation and Management Measures
Areas of disturbed or exposed soil may be managed to reduce sediment mobilisation and erosion by:
Concentrating work to as small an area as possible and progressively expanded to reduce the area potentially at risk;
Minimizing the number of passes by heavy earth moving equipment;
Stripping and stockpiled usable topsoil away from drainage lines to protect it from erosion;
Implementing sediment limitation devices (e.g. settlement/evaporation ponds, drainage ditches;
Constructing bunds to restrict flow velocities across the project site;
Limiting vegetation clearing work during heavy rainfall;
Requesting the earthworks contractor to prepare a Sediment and Erosion Control Plan prior to the commencement of construction;
Adopting stormwater controls and upstream treatment, such as infiltration devices and vegetation filters;
Locating vehicle wash bays away from watercourses;
Revegetating and/or using of other stabilisation techniques, considering seasonal influences, upon completion of works;
Minimising vegetation disturbance, especially riparian vegetation;
Implementing dust suppression measures including irrigation and/or covering of stockpiles;
Adopting erosion control, energy dissipation and scour protection, such as matting, riprap and gabions;
Preparing a Stormwater Management Plan (SWMP) for the construction of the LNG facility; and.
Elevated metals in soils will need to be managed accordingly, with the level of controls adopted to minimise the risk of heavy metal runoff to surface waters to be refined following additional soils analysis.
The application of the above proposed management measures will reduce both the likelihood and the consequences of the above impacts.
6.1.2 Works Adjacent to/within Drainage Lines
Activities
Works adjacent to or within drainage lines are expected to include:
Site Facility construction; and
Vehicle crossing of watercourses and drainage lines.
Potential Impacts
Construction activities at or near drainage features can mobilise sediment and alter flow and quality characteristics. Contaminated soil may be exposed and enter waterways. The potential impacts from construction activities can be significant if not managed properly.

G L A D S T O N E L N G F A C I L I T Y D E V E L O P M E N T - S U R F A C E W A T E R E I S
Section 6 Impacts and Mitigation Measures
Prepared for Santos Ltd, 13 March 2009
6-4
Mitigation and Management Measures
These potential impacts may be mitigated by:
Installing suitable stormwater management infrastructure prior to commencing construction activities;
Designing vehicle crossings Main Roads Department (MRD),(Queensland) ,including under road drainage, for extreme flow conditions;
Using low flow diversions or coffer dams with pumping, to divert flows;
Minimising disturbance by heavy earth moving equipment, especially in riparian areas; and
Contaminated soils will need to be managed accordingly, with the level of controls adopted to minimise the risk of contaminant runoff to surface waters to be refined following additional soils analysis
Riverine Protection Permit
Under Section 266 of the Water Act 2000, a Riverine Protection Permit is required from NRW where development will:
Destroy vegetation in a watercourse;
Excavate in a watercourse; or
Place fill in a watercourse.
Initial assessment of the proposed LNG facility site indicated that there was no water features designated as “watercourses”. Should this be confirmed and defined by NRW, then a Riverine Protection Permit may not be required for works within the drainage features.
If a Riverine Protection Permit is required, then a range of specific management measures and conditions relating to each watercourse will be established by NRW. As a minimum, this is likely to include the following:
The area of disturbance must be no greater than the minimum area necessary for the purpose.
The area of bed and banks disturbed by the activities must be stabilised regardless of previous stability.
The extent and duration of bare surface exposure must be minimised, and protected from weathering, rain drop impact, and water runoff.
Clean water run-off must be diverted around areas of disturbance where practicable.
Bed and bank stability must be managed to minimise erosion and reduce sedimentation.
Where practicable, sediment must be captured and retained on-site.
Machinery to be used in carrying out the activities must be selected on the basis of a type and size necessary and capable of safe operation to achieve minimal disturbance of the site.
Constructed drainage and discharge structures must not alter the natural bed and bank profile.
6.1.3 Contaminant Mobilisation
Activities
The use of fuels and chemicals onsite may involve the refuelling of vehicles and construction of the site facility and associated infrastructure. Potential aqueous waste streams may include oily waste water
G L A D S T O N E L N G F A C I L I T Y D E V E L O P M E N T - S U R F A C E W A T E R E I S
Section 6 Impacts and Mitigation Measures
Prepared for Santos Ltd, 13 March 2009
6-5
(from equipment wash water), contaminated runoff from chemical storage areas, contaminated drainage from fuel oil storage areas, runoff from oil-filled transformer yard areas and general washdown water.
Potential Impacts
Without proper mitigation measures, runoff from potentially contaminated drainage from fuel oil storage areas and general washdown water could enter into drainage features and receiving waters, altering the physical and chemical quality of the water and receiving environment. Additionally, site excavation works may expose groundwaters which have been found to have high background levels of dissolved metals in both near-surface and deeper aquifers.
Mitigation and Management Measures
These potential impacts may be mitigated by:
The construction of bunded storage areas for contaminants are recommended with spill cleanup kits in accordance with Australian Standards (AS1940 and AS3780) to prevent the contamination of surrounding surface runoff;
The transfers of fuels and chemicals controlled and managed to prevent spillage outside bunded areas;
Implement control so significant leakage/spillage is immediately reported and appropriate emergency clean-up operations implemented to prevent possible mobilisation of contaminants;
Chemically contaminated areas are protected by rooving from rainfall to reduce the likelihood of overtopping;
Bunds and sumps are frequently drained, and effluent is treated appropriately;
Contaminants or major spillages of stored material in the bunded areas are collected by licensed waste collection and transport contractors for disposal off site at a licensed facility; and
Any site groundwater extraction activities may require treatment or other appropriate management controls before discharges.
The application of the above proposed management measure may reduce the likelihood and consequence of the above impacts.
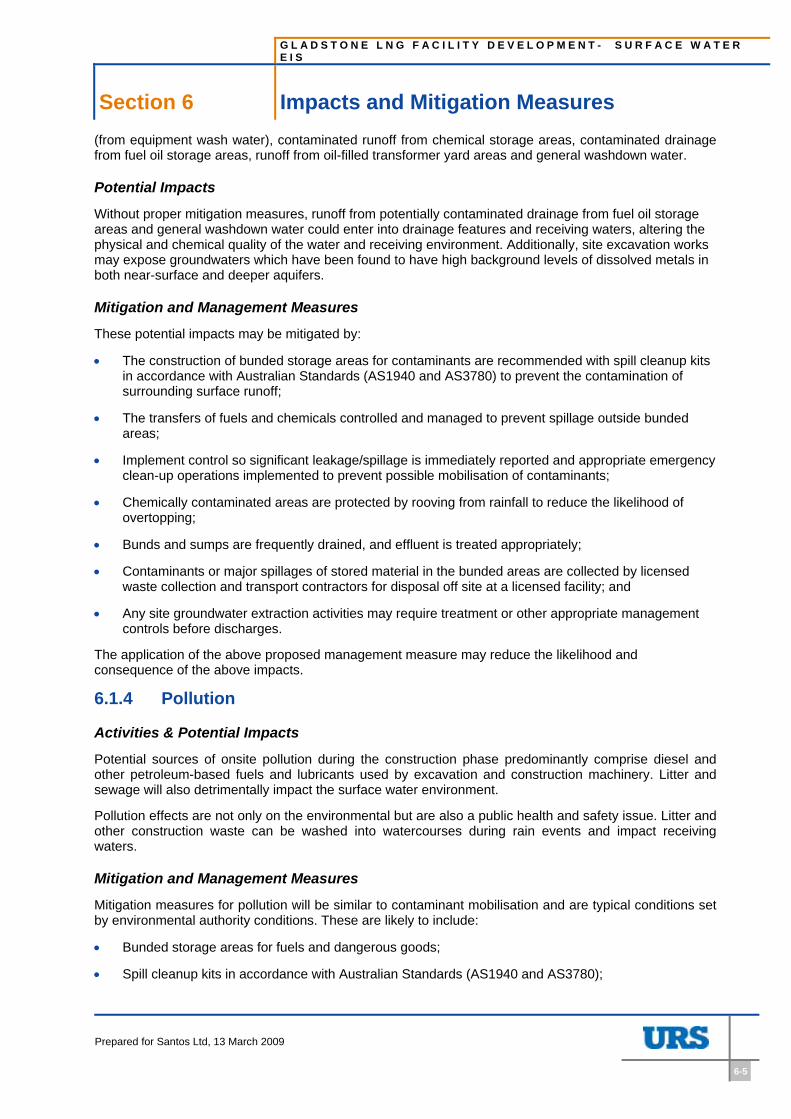
6.1.4 Pollution
Activities & Potential Impacts
Potential sources of onsite pollution during the construction phase predominantly comprise diesel and other petroleum-based fuels and lubricants used by excavation and construction machinery. Litter and sewage will also detrimentally impact the surface water environment.
Pollution effects are not only on the environmental but are also a public health and safety issue. Litter and other construction waste can be washed into watercourses during rain events and impact receiving waters.
Mitigation and Management Measures
Mitigation measures for pollution will be similar to contaminant mobilisation and are typical conditions set by environmental authority conditions. These are likely to include:
Bunded storage areas for fuels and dangerous goods;
Spill cleanup kits in accordance with Australian Standards (AS1940 and AS3780);
G L A D S T O N E L N G F A C I L I T Y D E V E L O P M E N T - S U R F A C E W A T E R E I S
Section 6 Impacts and Mitigation Measures
Prepared for Santos Ltd, 13 March 2009
6-6
Control and manage transfers of fuels and chemicals to prevent spillage outside the bunded areas
Pollution from sewage can be managed with a Waste Management/Disposal Plan (refer to Appendix K of the main EIS). Techniques of treatment of worksite sewage may include septic systems, mobile chemical treatment system or a sewage treatment plant.
This is also detailed in the waste management chapter (Appendix K of the EIS).
The application of the above proposed management measure will reduce the likelihood of the above impacts.
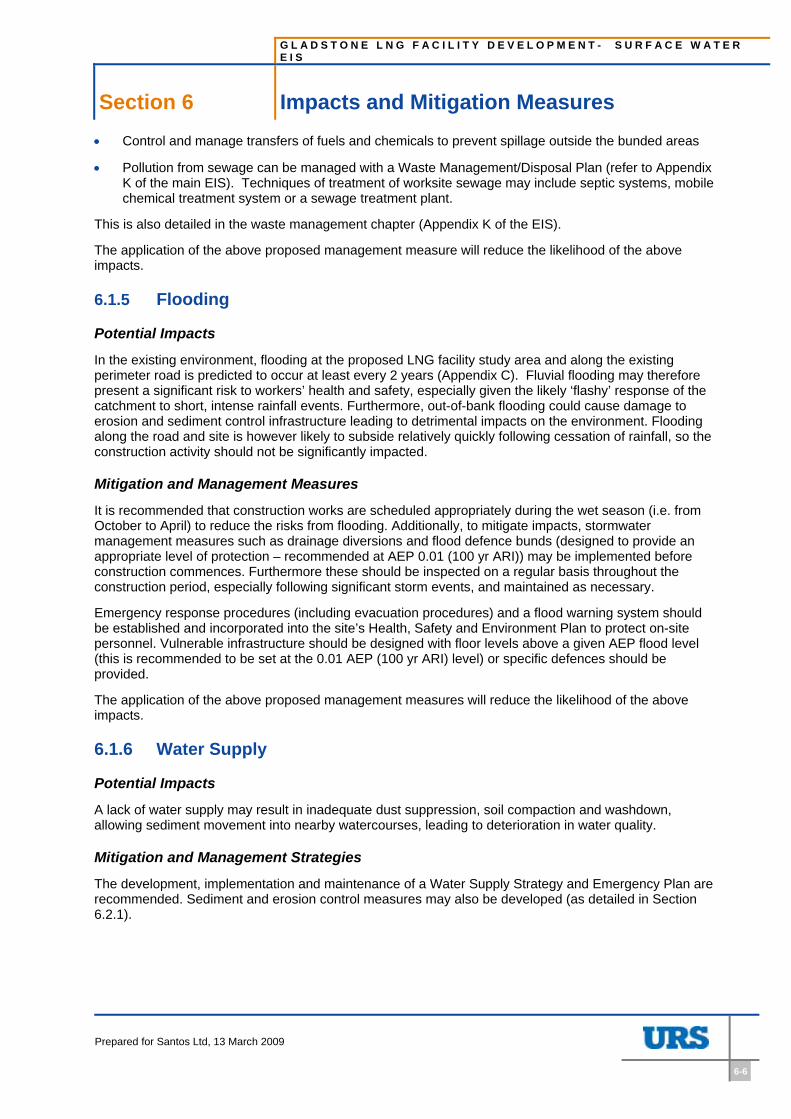
6.1.5 Flooding
Potential Impacts
In the existing environment, flooding at the proposed LNG facility study area and along the existing perimeter road is predicted to occur at least every 2 years (Appendix C). Fluvial flooding may therefore present a significant risk to workers’ health and safety, especially given the likely ‘flashy’ response of the catchment to short, intense rainfall events. Furthermore, out-of-bank flooding could cause damage to erosion and sediment control infrastructure leading to detrimental impacts on the environment. Flooding along the road and site is however likely to subside relatively quickly following cessation of rainfall, so the construction activity should not be significantly impacted.
Mitigation and Management Measures
It is recommended that construction works are scheduled appropriately during the wet season (i.e. from October to April) to reduce the risks from flooding. Additionally, to mitigate impacts, stormwater management measures such as drainage diversions and flood defence bunds (designed to provide an appropriate level of protection – recommended at AEP 0.01 (100 yr ARI)) may be implemented before construction commences. Furthermore these should be inspected on a regular basis throughout the construction period, especially following significant storm events, and maintained as necessary.
Emergency response procedures (including evacuation procedures) and a flood warning system should be established and incorporated into the site’s Health, Safety and Environment Plan to protect on-site personnel. Vulnerable infrastructure should be designed with floor levels above a given AEP flood level (this is recommended to be set at the 0.01 AEP (100 yr ARI) level) or specific defences should be provided.
The application of the above proposed management measures will reduce the likelihood of the above impacts.
6.1.6 Water Supply
Potential Impacts
A lack of water supply may result in inadequate dust suppression, soil compaction and washdown, allowing sediment movement into nearby watercourses, leading to deterioration in water quality.
Mitigation and Management Strategies
The development, implementation and maintenance of a Water Supply Strategy and Emergency Plan are recommended. Sediment and erosion control measures may also be developed (as detailed in Section 6.2.1).

G L A D S T O N E L N G F A C I L I T Y D E V E L O P M E N T - S U R F A C E W A T E R E I S
Section 6 Impacts and Mitigation Measures
Prepared for Santos Ltd, 13 March 2009
6-7
6.2 Commissioning Phase
6.2.1 Hydrostatic Testing
Activities
A hydrostatic test has been proposed for the LNG facility infrastructure during the commissioning phase. The test involves the purging of pipes, tanks and compressors with clean water, aiming to, assess the performance of the constructed facility, detect leaks and pressure resistance and remove contaminants from its construction.
Potential Impacts
Biological and chemical contaminants flushed from the newly constructed facility are anticipated to pollute the clean testing water. Furthermore, it is expected that the water sourced for the testing will undergo chemical treatment prior to its use. Therefore, if water from the hydrostatic testing entered into drainage features or receiving waters, alteration to the physical and chemical quality of the water and waterway may occur.
Mitigation and Management Strategies
To mitigate the potential impacts from the hydrostatic testing process:
Consideration should be given to the local environment and environmental values when determining water treatment, re-use and disposal methods;
The hydrostatic test water from the first tank should be recycled to test the other LNG tanks, therefore reducing the total volume of contaminant water;
Prior to reuse, the test water should be routed through sedimentation ponds to improve water quality and reduce the accumulation of contaminants; and
Once the testing is complete, test water should be discharged to sea following water quality testing (and meeting relevant water quality objectives).
6.3 Operation Phase
The proposed LNG facility on Curtis Island is approximately 5km north-east of Gladstone. The LNG facility is proposed to include:
Separation, filtration and treatment to purify the gas.
Refrigeration and liquefaction.
LNG storage tanks with vapour recovery.
Marine facilities including off-shore port facility and desalination plant.
Utilities including water, steam, fuel systems, controls systems and possibly power generation.
Flare systems for LNG facility, storage and loading facilities.
The proposed work force during the Operation phase has been estimated at 140 personnel.
The following section details potential impacts of the operation of the proposed LNG facility and the proposed mitigation measures.

G L A D S T O N E L N G F A C I L I T Y D E V E L O P M E N T - S U R F A C E W A T E R E I S
Section 6 Impacts and Mitigation Measures
Prepared for Santos Ltd, 13 March 2009
6-8
6.3.1 Site Water Management
A water balance model has been developed for the proposed Curtis Island Gladstone LNG facility site, for the Optimised Cascade LNG Process (OCP) (see Figure 5). The model provided an assessment and indicative design parameters, for the proposed sedimentation/evaporation basins. A full description of the water balance model is provided in Appendix F.
Due to the non hazardous nature of the stored runoff, Santos requested a preliminary design storage allowance of 0.1 AEP (thereby providing sufficient storage to limit the annual probability of overtopping to 1 in 10). This design standard is consistent with other industrial discharge licences in the bay; however this standard may alter when a discharge agreement (in an environmental authority) is formed with the Environmental Protection Agency (EPA), Queensland.
It is understood that all stormwater and sewage management storages will discharge (both controlled and uncontrolled outflows) into the saltpan and mangrove communities within China Bay. Although tolerant to saline waters and moderate sediment loads, the vegetation of these communities are protected under the Queensland Fisheries Act, 1994 and are of high conservation significance.
Whilst the accuracy of the water balance model is considered adequate for the intended use, it should only be used to provide indicative guidance regarding facility stormwater controls. To improve the accuracy of the model and quality of output, it is suggested that accurate design dimensions of all storages, inlets and outfalls are incorporated into the model (following further progress in the design of the processing facility). Furthermore, where possible, the model should be calibrated and verified using local data (a water monitoring programme should be established for this purpose – as outlined in the Surface Water LNG facility EMP).
Stormwater Management Design
Catchment inflows have been divided into two distinct categories, those from non-process areas and those from process areas. Areas that are disturbed, including roads and the compressor plant, are of the hardstand catchment type and are referred to as process areas, whilst catchment areas upstream of these disturbed sites, where no development is proposed (i.e. retaining existing vegetation), are referred to as natural or non-process areas.
The two categories will require different treatments and varying discharge restriction prior to discharge into receiving waters. Due to the diversion of natural flows, it is considered that flow from the non-process area will require sediment control, to reduce the concentration of suspended solids discharging to receiving water from the site. This will be undertaken with the design of grassy swales, or infiltration ditches (see Appendix G).
The process area has been further delineated into a chemically contaminated process area and disturbed process area. Santos indicated that areas with chemical contaminants such as hydrocarbons and lubricants will be roofed and therefore will not be affected by pluvial storm events. Therefore, this assessment has assumed that runoff from roofed and disturbed process areas will require stormwater treatment, using sedimentation/evaporation basins only. Information provided by Santos indicates the basins will then discharge into the natural salt pan environment. Further detail of the treatment controls for the chemically contaminated process area is provided in Section 6.3.3 of the report.
The OCP facility has been evaluated using an iterative process. The initial basin design dimensions were based on information provided in Santos Document No. 25438-100-G65-GEH-00001. The document details that the clean stormwater runoff of the facility site will be routed to sedimentation/evaporation basins. The inclusion of a low flow outlet has been assumed, as without the allowance of a mechanism for drawdown the pond would be regularly bypassed in the wet season, achieving ineffective sediment control and unacceptable discharges to the environment. It is also suggested that the pipe is above HAT (Highest Astronomical Tide) level (2.27 m AHD) (Maritime Safety Queensland, 2008), to retain a free flowing outlet, except in extreme tidal conditions.
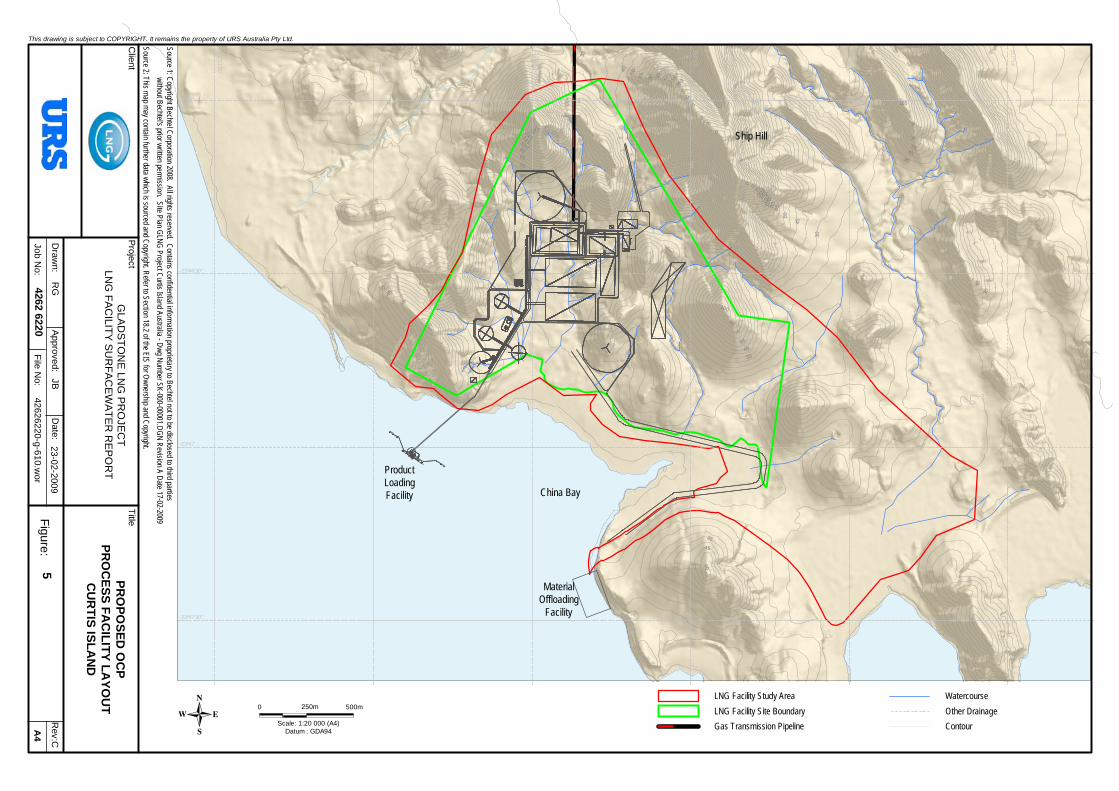
151º11'30"
151º12'
151º12'30"
-23º46'
-23º47'30"
-23º47'
-23º46'30"
151º14'
151º13'
151º13'30"
China Bay
Ship Hill
ProductLoadingFacility
MaterialOffloading
Facility
105
70
85
50
85
100
3045
5570
5545
30
30
45
00
0
0
30
45
65
50
100
80
12014
5-99920
00
30
45
70
55
958 065
50
40
30
125
30
45
55
8565
100
115140
1510
35
45
00
-99915
5
Figure:
4262 6220
PR
OP
OS
ED
OC
PP
RO
CE
SS
FA
CIL
ITY
LA
YO
UT
CU
RT
IS IS
LA
ND
Rev:C
Approved:
File N
o:A
442626220-g-610.w
or5
Client
Project
Title
Job No:
Date:
23-02-2009D
rawn:
This drawing is subject to COPYRIGHT. It remains the property of URS Australia Pty Ltd.
RG
JB
GLA
DS
TO
NE
LNG
PR
OJE
CT
LNG
FA
CILIT
Y S
UR
FA
CE
WA
TE
R R
EP
OR
T
0 250m
Scale
500m
Scale: 1:20 000 (A4)Datum : GDA94
LNG Facility Site BoundaryLNG Facility Study Area
Gas Transmission PipelineOther DrainageWatercourse
Contour
Source 2: This map may contain further data which is sourced and Copyright. Refer to Section 18.2 of the EIS for Ownership and Copyright.
Source 1: Copyright Bechtel Corporation 2008. All rights reserved. Contains confidential information proprietary to Bechtel not to be disclosed to third partieswithout Bechtel's prior written permission. Site Plan GLNG Project Curtis Island Australia - Dwg Number SK-000-00001.DGN Revision A Date 17-02-2009

G L A D S T O N E L N G F A C I L I T Y D E V E L O P M E N T - S U R F A C E W A T E R E I S
Section 6 Impacts and Mitigation Measures
Prepared for Santos Ltd, 13 March 2009
6-10
Summary of Model Results and Discussion
A summary of the results, including potential impacts and mitigation measures is provided below for the proposed design:
1. The impact of uncontrolled discharges to the receiving environment from the specified sedimentation/evaporation basins, including low flow discharge, is expected to be negligible, as this will occur on average once per 10 years and the water quality will be reasonable (non contaminate runoff only). To mitigate any potential impacts relating to elevated suspended solid concentrations, the design of the sediment ponds should be optimised to improve settlement performance (e.g. through inclusion of a permanent pool to reduce velocities and the construction of islands, baffles and weirs to increase the hydraulic efficiency of sediment settlement). Periodic dredging of sediments and safe disposal should also be undertaken to maintain performance.
2. Uncontrolled discharges from operational areas, such as refuelling areas are unlikely, if sufficient protection from rainfall and overland flow is provided. However, as discharges are unlikely to be diluted from natural runoff, waters are expected to have moderate to high concentrations of chemical contaminants such as hydrocarbons. Hence the impact on the receiving environment (saltpan and mangrove communities) could be potentially more significant. An effective way of mitigating this will be to increase the capacity of the contaminate process area drainage ditches, sumps and treatment rates, to further reduce the annual frequency and volume of overtopping.
3. The sedimentation/evaporation basin embankment structure should be constructed in accordance with best practice to minimise the potential for catastrophic failure (including design and construction of a formal spillway with sufficient capacity to safely pass a minimum 0.01 AEP critical duration storm event, and sufficient downstream erosion controls). This would also include constructing the earth bunds with competent material and undertaking regular inspections and periodic maintenance. With these controls in place the likelihood of catastrophic failure is considered minimal. Additionally, given the limited capacity of the basins (around 25Ml), were there to be a catastrophic overtopping or piping failure there would be minimal impact on the receiving environment.
Further detail of the water balance model inputs and assumptions, the model schematisations and the evaporation/sedimentation designs and results is provided in Appendix F.
Regulatory Permits
In Queensland, effluent discharges to the marine environment are regulated by the EPA. When new infrastructure is proposed, a licensing agreement is formed as part of the planning process, to permit offsite discharges. As yet, no instructions on water quantity and quality objectives for the LNG facility have been established. It is recommended that this, or a similar, water balance model is refined to provide intrinsic data on the performance of the proposed stormwater management and likely frequency, volume and quality of off-site discharges, and aid negotiations with the EPA.
It is further recommended that for all containment facilities with off-site discharges to the receiving environment, telemetry monitoring systems are installed (to measure, EC, pH and water level at the least). This can provide accurate information regarding both quantity and quality of discharged effluent and calibration data for future water balance, water quality and flood assessment modelling.
6.3.2 Erosion and Sediment Mobilisation
Activities
The most common activities during construction that can lead to erosion and sediment mobilisation are permanent structures and minor earth disturbances.

G L A D S T O N E L N G F A C I L I T Y D E V E L O P M E N T - S U R F A C E W A T E R E I S
Section 6 Impacts and Mitigation Measures
Prepared for Santos Ltd, 13 March 2009
6-11
Potential Impacts
The above activities can result in localised erosion and sediment mobilisation leading to deleterious effects on water quality and aquatic habitats. Additional there is the potential presence of high levels of metals in soils that may enter waterways.
Mitigation and Management Measures
Potential impacts may be mitigated using appropriate design of erosion and scour protection and a comprehensive Stormwater Management Plan (SWMP) (refer Section 6.2.1).
Mitigation measure for areas that are disturbed, including the perimeter road and the facility site, include structures, such as sedimentation/evaporation basins, as discussed in Section 6.3.1 and Appendix F.
Elevated metals in soils will need to be managed accordingly, with the level of controls adopted to minimise the risk of heavy metal runoff to surface waters to be refined following additional soils analysis
Whilst catchments upstream of these disturbed sites, where no development is proposed (i.e. retaining existing vegetation), are unlikely to suspend high concentrations of solids due to the natural and vegetated condition. However the diversion ditches constructed to reduce the volume of runoff to the facility site will increase the velocity and hence the suspended solid concentration of upper catchment flows into the receiving environment. Grassy swales are open vegetated drains, which provide water quality treatment through physical filtration of water through the vegetation and depending on the retention time some additional pollutant take-up provided by the vegetation.
An evaluation of the diversion ditches, include the incorporation of grassy swale features may provide mitigation; this is discussed further in Appendix G.
6.3.3 Improper Disposal of Effluent and Operational Waste Water
Activities
Both chemically contaminated water from process area sumps and human sewage will result from site operation. The process design has proposed an onsite wastewater treatment facility during the operation phase.
The OCP design proposes that contaminated water is to be routed to the CPI separator via a process area spill containment sump for treatment. The CPI effluent is to be then further treated in a dissolved air floatation unit and a tertiary filter and then routed to an irrigation system. The flow capacity of the CPI separator has been set to 44m3/hr and any excesses water has been designated to flow into the sedimentation/evaporation basins used for stormwater management.
Impacts
Sewage and operational waste water can enter into drainage features and receiving waters, often significantly altering the physical and chemical quality of the water and waterway. Effluent from the wastewater treatment facilities requires appropriate discharge to avoid scour and sediment mobilisation.
Mitigation and Management Measures
The effective level and rate of treatment should be evaluated to mitigate the likelihood of uncontrolled and/or non compliant discharge to receiving waters. This may be undertaken using a water balance or water quality model.
It is recommended that for all containment facilities with off-site discharges to the receiving environment, telemetry monitoring systems are installed (to measure, EC, pH and water level). This can provide accurate information regarding both quantity and quality of discharged effluent and calibration data for future water balance, water quality and flood assessment modelling.

G L A D S T O N E L N G F A C I L I T Y D E V E L O P M E N T - S U R F A C E W A T E R E I S
Section 6 Impacts and Mitigation Measures
Prepared for Santos Ltd, 13 March 2009
6-12
Furthermore, it is proposed that a soil capacity study be undertaken to determine the appropriate volumes and concentrations of treated effluent to be irrigated. Water must be tested to ensure it meets the Queensland Recycled Water Quality Guidelines (2006) before being used for irrigation. Effluent and operational waste water should be removed and disposed of as per the Waste Management Strategy (refer to Chapter 7 Waste Management).
6.3.4 Flooding
Impacts
Out-of-bank/flash flood events during the operational phase of the project could result in non-compliant off-site discharges due to inadequate containment capacity of the proposed stormwater management system. If fluvial flooding is frequent and uncontrolled, it may present a significant risk to workers’ health and safety, as well as to vulnerable infrastructure, especially given the likely ‘flashy’ response of the catchment to short, intense rainfall events.
It is also likely that the perimeter road would be flooded to depths of 0.5 – 1m, having peak velocities in the range of 1m/s, in events of a 10yr ARI magnitude, and would therefore be impassable for a short period of time. Flood depths are however likely to subside relatively quickly following cessation of rainfall, so operations should not be significantly impacted.
Mitigation and Management Measures
Assessments undertaken, described in Appendix F and G, consider indicative designs for stormwater management measures at the LNG facility study area.
Measures such as drainage diversions and sedimentation/evaporation basins require regularly inspected and maintenance during the operation phase to remain efficient. It is recommended that inspections be carried out on a bi-annual basis, and after significant storm events, to check for erosion, cracking, visible seepage and any other unsuitable conditions. Timely action should be taken to prevent or minimise any actual or potential environmental harm through preventative works.
Emergency response procedures (including evacuation procedures) and a flood warning system should be established and incorporated into the site’s Health, Safety and Environment Plan to protect on-site personnel. Vulnerable infrastructure should be designed with floor levels above a given AEP flood level (this is recommended to be set at the 0.01 AEP (100 yr ARI) level) or specific defences should be provided (bunding).
6.4 Decommissioning Phase
The range of potential impacts and proposed mitigation and management measures during the decommissioning phase are broadly similar to those which are likely to be encountered during the construction phase of the Project.
Once all resources are exhausted and no feed is available for the LNG facility, plant equipment and piping is to be purged. This purging or flushing of the process equipment is proposed to be undertaken using water, stored onsite. Water used for decommissioning should be disposed of as per agreement with the regulatory authorities.
Other decommissioning activities is anticipated to largely involve the removal of equipment and structures which are of no further economic value, including where necessary, testing to establish whether any decontamination work is required and performance of such work. It is proposed that sedimentation/evaporation basins are to be decontaminated, filled and re-contoured to match the surrounding topography. Disturbed areas of the site will be re-contoured as necessary and landscaped to stabilise against erosion. Any stormwater management ponds present at the time of decommissioning will be used to assist with the provision of water for rehabilitation, where necessary.
The following impacts will be managed during the decommissioning phase of the project.

G L A D S T O N E L N G F A C I L I T Y D E V E L O P M E N T - S U R F A C E W A T E R E I S
Section 6 Impacts and Mitigation Measures
Prepared for Santos Ltd, 13 March 2009
6-13
6.4.1 Sediment Mobilisation
Details of managing sediment mobilisation are contained in Section 6.2.1.
6.4.2 Works Adjacent to/within Drainage Lines
Details of managing works within drainage lines are contained in Section 6.2.2.
6.4.3 Contaminant Mobilisation
Details of managing contaminant mobilisation are contained in Section 6.2.3.
6.4.4 Pollution
Details of managing pollution are contained in Section 6.2.4.
Further details on the proposed mitigation measures relating to the above impacts are provided in the EMP.
6.5 Cumulative Impacts
Curtis Island lies within the Gladstone State Development Area. The development scheme is a land use planning instrument which is administered by the Coordinator-General for the purpose of guiding future development in the GSDA. This land in the Gladstone region is considered suitable for future large-scale industrial development and comprises approximately 28,000 hectares. Among other new amended land areas this includes the Curtis Island Industry Precinct, which provides for the establishment of liquefied natural gas facilities on the west coast of southern Curtis Island.
Other projects for consideration whilst assessing the proposed LNG facility include four LNG projects which are:
Gladstone LNG Project – Arrow Energy and LNG Ltd.
– Planned for 2009 – 2014, this is a natural gas liquefaction facility and associated infrastructure and facilities which is proposed to be built at Fisherman’s Landing Wharf (FLW). Wharf loading facilities at FLW No. 5 are to be upgraded. Coal Seam Gas (CSG) is to be sourced from gas fields operated by Arrow Energy LNG via the proposed Central Queensland Gas Pipeline. The CSG is proposed to be liquefied, stored and loaded onto vessels for export. (EPA, 2008).
Sun LNG Project – Sunshine Gas and Sojitz Corp.
– Scheduled for 2009 – 2011, this is a natural gas liquefaction facility and associated infrastructure and facilities that is proposed to be built at FLW. Wharf loading facilities at FLW No.5 is to be upgraded. A five km lateral gas pipeline is proposed to be constructed to deliver natural gas from the Gladstone City Gas Gate to the facility. (EPA, 2008).
Queensland Curtis LNG project – QGC Ltd and BG Group.
– Planned for 2010 – 2013, the Queensland Curtis LNG Project proposes to develop an integrated LNG project comprising three principal components: expansion of coal seam gas operations in the Surat Basin, a 380 km pipeline to Gladstone and a LNG processing facility on Curtis Island with a port facility for exports.
Central Queensland Gas Pipeline – AGL and Arrow Energy.
– Planned for 2009 – 2010 this proposed works incorporates a 440 km high pressure gas transmission pipeline in Central Queensland from Moranbah to Gladstone. (DIP 2008).

G L A D S T O N E L N G F A C I L I T Y D E V E L O P M E N T - S U R F A C E W A T E R E I S
Section 6 Impacts and Mitigation Measures
Prepared for Santos Ltd, 13 March 2009
6-14
Other projects to note in the vicinity of Curtis Island include:
Yarwun Alumina Refinery Expansion – Rio Tinto.
– Stage 2 of the existing Yarwun Alumina Refinery scheduled for 2008 – 2010 includes a gas-fired cogeneration facility.
Boyne Smelter – Boyne Smelters.
– Construction of new baking furnace and upgrade of crane runway is scheduled to be undertaken 2009 – 2010.
Wiggins Island Coal Terminal – Gladstone Ports Corporation and Queensland Rail.
– New coal terminal and associated rail infrastructure is proposed for construction 2009 – 2012.
Gladstone Pacific Nickel Refinery – Gladstone Pacific Nickel
– New nickel refinery and residue storage facility is scheduled for 2009 – 2011, including ore importing facility at the proposed Wiggins Island terminal.
Of particular impact is the Queensland Curtis LNG project that proposes to locate its processing facility on Curtis Island. Although this facility will be located adjacent to that of Santos, the project will be within a different hydrological catchment. On the assumption that the Queensland Curtis LNG project is adopting best practice approaches to storm water management (i.e. diverting clean and dirty water and using oil separators/treatment trains etc.) the combined impact on the receiving environment is expected to be negligible.

G L A D S T O N E L N G F A C I L I T Y D E V E L O P M E N T - S U R F A C E W A T E R E I S
Section 7 Summary
Prepared for Santos Ltd, 13 March 2009
7-1
7 Summary
The risks associated with the activities of the construction, operation and decommissioning of the proposed LNG facility site have been identified and allocated mitigation and management strategies to reduce them to a level that does not significantly impact upon the environmental values of the proposed LNG facility site and those of the receiving waters. The environmental values for protection involve the human consumption of aquatic food, recreation at all levels, cultural and spiritual values and water uses for farms and industrial purposes. Specific details on the mitigation and monitoring measures are provided in the EMP (Section 13).
Construction Phase
Earth Moving Activities and Works Adjacent to/within Drainage Lines
The movement of sediment and potential erosion may be exacerbated from the construction of the LNG facility and vehicle crossing of drainage features. It is recommended that these impacts are minimised using erosion and sediment control techniques and the implementation of an Erosion and Sediment Control Plan and Stormwater Management Strategy.
Contaminant Mobilisation and Pollution
Contaminant mobilisation through the use of fuels and chemicals onsite including pollution such as diesel and other petroleum-based fuels and lubricants could enter into drainage features and receiving waters, altering the physical and chemical quality of the water and waterways. These potential impacts may be mitigated by establishing spill and refuelling standards and practices. A Waste Management Strategy should be established to manage litter and other construction waste as well as the removal of sewage from worksites.
Flooding
A risk to both worker’s health and safety and water quality is posed by out-of-bank/flash flood rainfall events, during construction. It is recommended that works occur outside the wet season where practicable, and emergency response procedures and flood forecasting are incorporated into site operational (and Health and Safety) procedures.
Operation Phase
Site water management and its potential impact on the receiving environment were assessed for the proposed process using a water balance model. A summary of the results, including potential impacts and mitigation measures is provided below:
The impact of uncontrolled discharges to the receiving environment from the specified sedimentation/evaporation basins, including low flow discharge, is expected to be negligible, as this will occur on average once per 10 years and reasonable water quality (disturbed runoff only). To mitigate any potential impacts relating to elevated suspended solid concentrations, the design of the sediment ponds should be optimised to improve settlement performance (e.g. through inclusion of a permanent pool to reduce velocities and the construction of islands, baffles and weirs to increase the hydraulic efficiency of sediment settlement). Periodic dredging of sediments and safe disposal should also be undertaken to maintain performance.
Uncontrolled discharges from operational areas, such as refuelling areas are unlikely, if sufficient protection from rainfall and overland flow is provided. However, as discharges are unlikely to be diluted from natural runoff, waters are expected to have moderate to high concentrations of chemical contaminants. Hence the impact on the receiving environment (saltpan and mangrove communities) is potentially more significant. An effective way of mitigating this will be to increase the capacity of the contaminate process area drainage ditches, sumps and treatment rates, to further reduce the frequency of overtopping.
The sedimentation/evaporation basin embankment structure should be constructed in accordance with best practice to minimise the potential for catastrophic failure (including design and construction of a formal spillway with sufficient capacity to safely pass a minimum 0.01 AEP critical duration storm

G L A D S T O N E L N G F A C I L I T Y D E V E L O P M E N T - S U R F A C E W A T E R E I S
Section 7 Summary
Prepared for Santos Ltd, 13 March 2009
7-2
event, and sufficient downstream erosion controls). This would also include constructing the earth bunds with competent material and undertaking regular inspections and periodic maintenance. With these controls in place the likelihood of catastrophic failure is considered minimal. Additionally, given the limited capacity of the basins (around 25Ml) were there to be a catastrophic overtopping or piping failure there would be minimal impact on the receiving environment.
Decommissioning Phase
The removal of equipment and structures and the re-contouring of the site may involve the following impacts:
Earth Moving Activities and Works Adjacent to/within Drainage Lines
The movement of sediment and potential erosion may be exacerbated from the removal of infrastructure and re-contouring of the site. This may include the infilling of sedimentation ponds. These impacts may be minimised by using erosion and sediment control techniques and the implementation of an Erosion and Sediment Control Plan and a Stormwater Management Strategy.
Contaminant Mobilisation and Pollution
Contaminant mobilisation through the use of fuels and chemicals onsite including pollution such as diesel and other petroleum-based fuels and lubricants could enter into drainage lines and receiving waters, altering the physical and chemical quality of the water and waterway. Additionally, exposure of potentially contaminated land may occur during infrastructure removal or the infilling of sedimentation ponds. These potential impacts may be mitigated by as per the decommissioning plan developed in conjunction with the regulatory authorities.
.

G L A D S T O N E L N G F A C I L I T Y D E V E L O P M E N T - S U R F A C E W A T E R E I S
Section 8 Glossary & Adversatives
Prepared for Santos Ltd, 13 March 2009
8-1
8 Glossary & Adversatives
Glossary, Acronyms and Abbreviations AEP Annual Exceedence Period
ANRA Australian Natural Resources Atlas
ARI Annual Reoccurrence Interval
AR&R Australian Rainfall and Runoff
AS Australian Standard
AWBM Australian Water Balance Model
BCC Brisbane City Council
BOM Bureau of Meteorology
CPI Corrugated Plates Interceptor
CSG Coal Seam Gas
DPIF Department of Primary Industries and Fisheries
EC Electrical Conductivity
EIS Environmental Impact Statement
EMP Environmental Management Plan
EPA Environmental Protection Agency (Queensland)
EPP Water The Environmental Protection (Water) Policy 1997
FLW Fisherman’s Landing Wharf
HAT Highest Astronomical Tide
HEC-RAS Hydrologic Engineering Centre River Analysis System
IEAust Institute of Engineers Australia
LNG Liquid Natural Gas
MRD Main Roads Department
NRW Natural Resources and Water (Department of)
OCP Optimised Cascade LNG Process
PSI Preliminary Site Investigation
QWQG Queensland Water Quality Guidelines
RRL Rainfall Runoff Library
SWMP Stormwater Management Plan
TNT Tributyltin

G L A D S T O N E L N G F A C I L I T Y D E V E L O P M E N T - S U R F A C E W A T E R E I S
Section 9 References
Prepared for Santos Ltd, 13 March 2009
9-1
9 References
Australian Natural Resources Atlas (ANRA) (2007) Rivers- Assessment of River Condition- Queensland. Queensland Government
Australian and New Zealand Environment and Conservation Council (ANZECC), (2000) Australia and New Zealand Guidelines for Fresh and Marine Water Quality, 2000.
Australian Standards AS 1940 (2004): The storage and handling of flammable and combustible liquids, Standards Australia
Australian Standards AS 3780 (2008): The storage and handling of corrosive substances, Standards Australia
Australian Standards AS 4390 (1996): Records management – Strategies, Standards Australia
Australian Water Resources (AWR) (2005) Australian Government, National Water Commission.
Brisbane City Council (2002) Stormwater run-off, Prepared for the Gladstone Harbour Protection and Enhancement Strategy, By City Design, Brisbane City Council. ,Available online: http://www.epa.qld.gov.au/media/environmental_management/coast_ocean/gladstone_harbour/b_reports/1.pdf
Chanson H. (2004) The Hydraulics of Open Channel Flow: An Introduction, Second Edition, Elsevier Butterworth-Heinemann
Chow, (1959) Open Channel Hydraulics, McGraw-Hill Book Company, Inc.
Bureau of Meteorology. Available online: http://www.bom.gov.au
Department of Infrastructure and Planning (2008) Queensland Government
Environmental Protection Act 1994 Queensland Government Environmental Protection (Water) Amendment Policy (No. 1) 2008, Subordinate Legislation 2008 No. 443. Available online: http://www.legislation.qld.gov.au/LEGISLTN/SLS/2008/08SL443.pdf
Environmental Protection Agency (2008) Queensland Government
(Environmental Protection Agency (2003) Queensland Government, Queensland Parks and Wildlife Service) Curtis Coast Regional Coastal Management Plan, September 2003. Available online:http://www.epa.qld.gov.au/register/p00528bm.pdf
Environmental Protection Act 1994 Queensland Government
Fisheries Act 1994 Queensland Government
Fitzroy Basin WRP 1999 Queensland Government
Fitzroy Basin ROP 2006 Queensland Government
Institution of Engineers Australia (1987) Australian Rainfall and Runoff: A Guide to Flood Estimation.
Queensland Government (2008) Maritime Safety Queensland 2008.
Queensland Government (Environmental Protection Agency) Queensland Water Quality Guidelines 2006, March 2006
Queensland Water Recycling Guidelines (2005) Queensland Government, WaterWise Queensland, December 2005, Available online: http://www.nrw.qld.gov.au/water/regulation/recycling/pdf/recycle_guidelines.pdf
Water Act 2000 Queensland Government
Weeks, WD, (1991) Design Floods for Small Rural Catchments in Queensland, Civ Eng Trans, IE Aust, Vol CE 33, No 4, pp 249-260.

G L A D S T O N E L N G F A C I L I T Y D E V E L O P M E N T - S U R F A C E W A T E R E I S
Section 10 Limitations
Prepared for Santos Ltd, 13 March 2009
10-1
10 Limitations
URS Australia Pty Ltd (URS) has prepared this report in accordance with the usual care and thoroughness of the consulting profession for the use of Santos and only those third parties who have been authorised in writing by URS to rely on the report. It is based on generally accepted practices and standards at the time it was prepared. No other warranty, expressed or implied, is made as to the professional advice included in this report. It is prepared in accordance with the scope of work and for the purpose outlined in the Proposal.
The methodology adopted and sources of information used by URS are outlined in this report. URS has made no independent verification of this information beyond the agreed scope of works and URS assumes no responsibility for any inaccuracies or omissions. No indications were found during our investigations that information contained in this report as provided to URS was false.
This report was prepared between 2007/2008 and is based on the conditions encountered and information reviewed at the time of preparation. URS disclaims responsibility for any changes that may have occurred after this time.
This report should be read in full. No responsibility is accepted for use of any part of this report in any other context or for any other purpose or by third parties. This report does not purport to give legal advice. Legal advice can only be given by qualified legal practitioners.

G L A D S T O N E L N G F A C I L I T Y D E V E L O P M E N T - S U R F A C E W A T E R E I S
Appendix A Site Assessment
Prepared for Santos Ltd, 13 March 2009
A. Site Assessment

GLNG – Surface Water Assessment - Plant Location No. 15 Location Name Unnamed Drainage Feature No. 2 Easting: 319,539 Northing: 7,369,105 Site Description: Located on the north eastern boundary of the study area, Unnamed Drainage Feature No. 2 is both ephemeral and unmodified in nature. The small feature drain has the largest of the site’s catchments. At the road a ford constrains flows and the surrounding channel bed has severe sediment deposition. Survey was undertaken at a road crossing. Channel Depth: 1.5m Channel Width: 1.5m Floodplain Slope: L 1:170, R 1:70 Bank Slope: LB 1.2:1, RB 1.2:1 Channel Banks: Where stable, banks are convex in shape and have a moderate slope; however there are sections of undercutting. Both left and right banks are unstable with many severely eroded areas along straight sections as well as bends. Substrate Type: The bed substrate is of low compaction with an open framework with a low percentage of fines and a high availability of interstitial spaces. The pre-dominate particle size is a fine sub-angular silt however large sandy cobbles have also been deposited. Channel Bed: The U shaped channel is moderately sinuous, with bends providing 2 to 3 times the length. The channel bed was reasonably flat, with extensive build up of cobbles and fine sediment, loosely arranged and unpacked. The channel bed is additionally covered in leaf litter and small pieces of wooden debris. Water Quality: No water present, no assessment undertaken
Plan: Unnamed Drainage Feature 2
Photo: Looking Upstream
Sketch: Cross section (not to scale)

Floodplain: Woodland currently grazed by cattle. Catchment Size: 2.156 km2 Channel Slope: 7 m/km Catchment Storage: Well defined system of small watercourses.
Catchment Relief: Flat, with slopes of 0 – 1.5% Q2 Q10 Q100 Duration 60 min Intensity 39.6mm 57mm 87mm Flow 6.4m3/s 14.9m3/s 35m3/s Depth 1.55m 1.84m 2.16m
Cross Section Road_2
Photo: Looking Downstream

GLNG – Surface Water Assessment - Plant Location No. 11 Location Name Unnamed Drainage Feature No. 3 Easting: 318,730 Northing: 7,368,510 Site Description: Located to the south east of study area, Unnamed Drainage Feature No. 3 is both ephemeral and unmodified in nature. The small feature drain is a small grassy gully that is often hard to distinguish along its reach. The channel is undefined less than 100m upstream of the predicted road crossing. Downstream of the road concentrated overland flow has eroded a deep channel. The downstream channel bed has deposits of small boulder and ponding of water in heavily eroded sections. As the drainage feature enters the salt marsh the channel widens and eventually diffuses. Channel Depth: 0.1m Channel Width: 0.5m Channel Banks: Upstream, both left and right banks are convex in shape and have a moderate slope. However downstream both banks are higher and steep with more undercutting. Substrate Type: Upstream the bed is thickly grassed, whilst downstream the eroded channel contains small boulders with some wooden debris and leaf litter. Channel Bed: The channel has little sinuous features, with bends providing only 1 to 1.5 time the length. The channel bed is reasonably flat. Water Quality: The pooled water was slightly murky with no odour or algal growth present. Floodplain: Woodland currently grazed by cattle.
Photo: Looking Upstream
Sketch: Cross section (not to scale)
Plan: Unnamed Drainage Feature 3

Catchment Size: 0.165 km2 Channel Slope: 29 m/km Catchment Storage: Well defined system of small watercourses.
Catchment Relief: Rolling with slopes 1.5 - 4% Q2 Q10 Q100 Duration 23 min Intensity 65mm 94mm 145mm Flow 0.8m3/s 1.9m3/s 4.5m3/s Depth 0.09m 0.13m 0.18
Cross Section Road_3
Photo: Looking Downstream
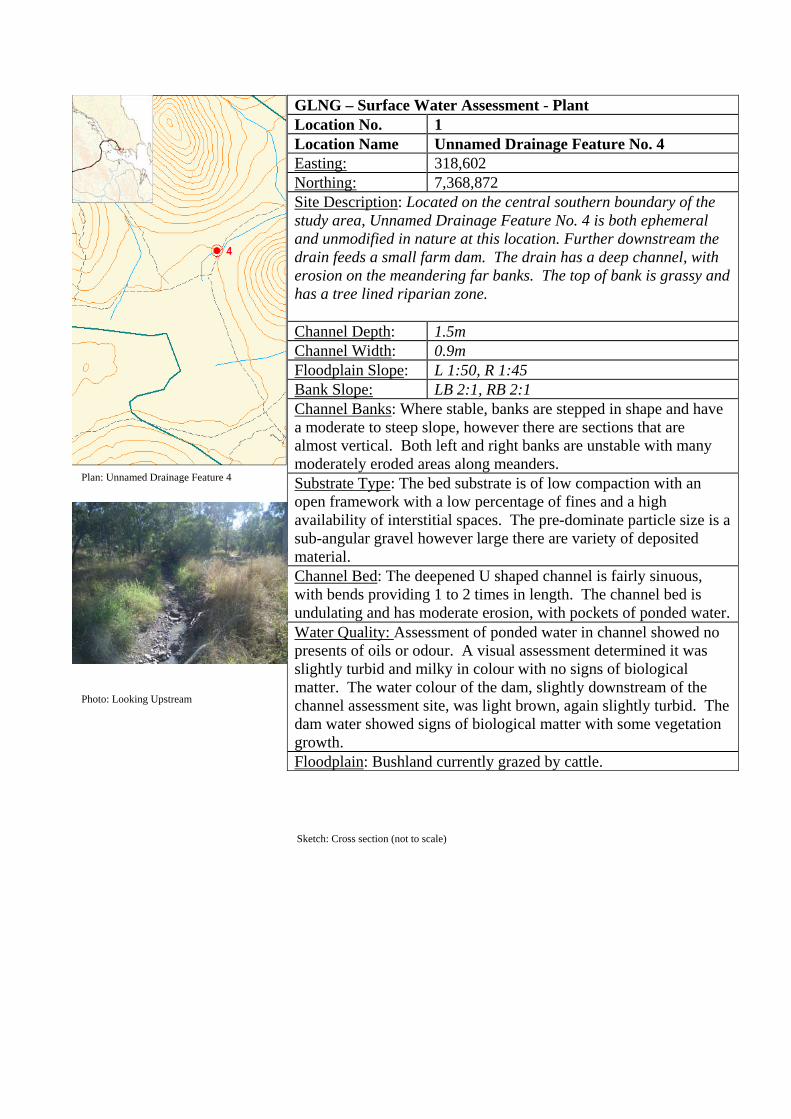
GLNG – Surface Water Assessment - Plant Location No. 1 Location Name Unnamed Drainage Feature No. 4 Easting: 318,602 Northing: 7,368,872 Site Description: Located on the central southern boundary of the study area, Unnamed Drainage Feature No. 4 is both ephemeral and unmodified in nature at this location. Further downstream the drain feeds a small farm dam. The drain has a deep channel, with erosion on the meandering far banks. The top of bank is grassy and has a tree lined riparian zone. Channel Depth: 1.5m Channel Width: 0.9m Floodplain Slope: L 1:50, R 1:45 Bank Slope: LB 2:1, RB 2:1 Channel Banks: Where stable, banks are stepped in shape and have a moderate to steep slope, however there are sections that are almost vertical. Both left and right banks are unstable with many moderately eroded areas along meanders. Substrate Type: The bed substrate is of low compaction with an open framework with a low percentage of fines and a high availability of interstitial spaces. The pre-dominate particle size is a sub-angular gravel however large there are variety of deposited material. Channel Bed: The deepened U shaped channel is fairly sinuous, with bends providing 1 to 2 times in length. The channel bed is undulating and has moderate erosion, with pockets of ponded water. Water Quality: Assessment of ponded water in channel showed no presents of oils or odour. A visual assessment determined it was slightly turbid and milky in colour with no signs of biological matter. The water colour of the dam, slightly downstream of the channel assessment site, was light brown, again slightly turbid. The dam water showed signs of biological matter with some vegetation growth. Floodplain: Bushland currently grazed by cattle.
Plan: Unnamed Drainage Feature 4
Photo: Looking Upstream
Sketch: Cross section (not to scale)

Catchment Size: 0.776 km2 Channel Slope: 10 m/km Catchment Storage: Well defined system of small watercourses.
Catchment Relief: Flat, with slopes of 0 – 1.5% Q2 Q10 Q100 Duration 40 min Intensity 49.3mm 71mm 108mm Flow 2.9m3/s 6.7m3/s 15.6m3/s Depth 1.13m 1.24m 1.39m
Cross Section Road_4
Photo: Looking Upstream (Bed)

Photo: Looking downstream Photo: Eroded left bank Photo: Downstream Farming Dam
Photo: Downstream Farming Dam (Water)

GLNG – Surface Water Assessment - Plant Location No. 3 & 4 Location Name Unnamed Drainage Feature No. 5 Easting: 319,539 Northing: 7,369,105 Site Description: Located along the southern boundary of study area, Unnamed Drainage Feature No. 5 is both ephemeral and unmodified in nature. The small feature drain alters dramatically upstream and downstream of its road crossing. Upstream the channel is shallow and flat, with a rocky bed, and the well defined banks are covered with grasses, shrub and small tree vegetation. Downstream the channel bed and banks are severely eroded; there is deposition of boulders and undercutting of banks. Channel Depth: 0.3m Channel Width: 2m Bank Slope: LB 2:1, RB 2:1 Channel Banks: Upstream, banks are convex in shape and have a steep slope with some erosion, however downstream there is severe erosion with sections of undercutting with tree roots protruding. Substrate Type: Downstream the bed substrate is of low compaction with an open framework and low percentage of fines and a high availability of interstitial spaces. The pre-dominate particle size is boulders, well rounded, however there are bars of gravels. Upstream the substrate is predominately rock, with fine sediments between the cracks. Channel Bed: Upstream the channel shape is described as a Flat U shape, whilst downstream the channel is a box shape. The wide and flat upstream channel has a fair to poor sinuosity, with less than 2 times longer stream length due to bends. Water Quality: No water present, no assessment undertaken Floodplain: Woodland currently grazed by cattle.
Plan: Unnamed Drainage Feature 5
Photo: Upstream Channel Bed
Sketch: Cross section (not to scale)

Catchment Size: 0.37 km2 Channel Slope: 20 m/km Catchment Storage: Well defined system of small watercourses.
Catchment Relief: Rolling, with slopes of 1.5 - 4% Q2 Q10 Q100 Duration 30 min Intensity 57mm 83mm 126mm Flow 1.6m3/s 3.7m3/s 8.6m3/s Depth 0.51m 0.67m 0.89m
Cross Section Road_5
Photo: Downstream Channel Bed

Photo: Upstream Channel Photo: Downstream Channel
Photo: Eroded Downstream Bank Photo: Undercutting Downstream Bank

GLNG – Surface Water Assessment - Plant Location No. 7 Location Name Unnamed Drainage Feature No. 6 Easting: 317,945 Northing: 7,369,078 Site Description: Located along the southern boundary of the study area, Unnamed Drainage Feature No. 6 is both ephemeral and unmodified in nature. The small feature drain is only apparent along some reaches, here it is has eroded vegetation and flatten long grass. Channel Depth: 0.3m Channel Width: 0.3m Floodplain Slope: L 1:30, R 1:35 Bank Slope: LB 3:1, RB 3:1 Channel Banks: The channel is both narrow and shallow; little bank shape exists, with grass and trees defining the channel. Those banks which are identifiable are convex and steep. Substrate Type: The bed is compact with an array of sediment sizes and a low availability of interstitial spaces. The streambed comprises of tightly arranged and packed material, predominately clays and silt. Channel Bed: The U shaped channel is fairly sinuosity as it is 1 to 2 times longer in stream length due to bends. Water Quality: No water present, no assessment undertaken Floodplain: Woodland currently grazed by cattle.
Plan: Unnamed Drainage Feature 5
Photo: Downstream Channel
Sketch: Cross section (not to scale)

Catchment Size: 0.08 km2 Channel Slope: 40 m/km Catchment Storage: Well defined system of small watercourses.
Catchment Relief: Rolling, with slopes of 1.5 - 4% Q2 Q10 Q100 Duration 18 min Intensity 57mm 106mm 163mm Flow 0.5m3/s 1.1m3/s 2.6m3/s Depth 0.39m 0.42m 0.48m
Cross Section Road_6
Photo: Debris from storm event

GLNG – Surface Water Assessment - Plant Location No. 6 Location Name Unnamed Drainage Feature No. 7 Easting: 317,490 Northing: 7,369,047 Site Description: Located on the southern boundary of study area site, Unnamed Drainage Feature No. 7 is both ephemeral and unmodified in nature. The shallow, yet defined, upstream channel has shallow ponding water and muddy banks, however the upper banks are dry with grassy vegetation. Downstream of the road, the channel is hard to distinguish as it disperses into the flat salt marsh. Channel Depth: 0.5m Channel Width: 3m Floodplain Slope: L 1:200, R 1:400 Bank Slope: LB 1:2, RB 1:2 Channel Banks: The banks appear stable with infrequent and small areas of erosion, they are convex in shape and have a shallow slope. The lower face has a scatter of grass with small trees further upstream on the upper face. Substrate Type: The bed substrate is compacted with a dilated framework and low availability of interstitial spaces. The pre-dominate particle size is a fine sub-angular silt however some cobbles have also been deposited. Channel Bed: The U shaped channel is fairly sinuous, with bends providing 1 to 2 times in length. The channel bed was concave in shape, and appears reasonably stable. Water Quality: The ponded, turbid water is muddy brown in colour and indicated no presents of oils or odours at the time of visual assessment. Floodplain: Woodland currently grazed by cattle.
Plan: Unnamed Drainage Feature 7
Photo: Looking Upstream
Sketch: Cross section (not to scale)

Catchment Size: 0.89 km2 Channel Slope: 12.6 m/km Catchment Storage: Well defined system of small watercourses.
Catchment Relief: Flat, with slopes of 0 – 1.5% Q2 Q10 Q100 Duration 45 min Intensity 46mm 67mm 102mm Flow 3.1m3/s 7.2m3/s 16.9m3/s Depth 0.53m 0.61m 0.68m
Cross Section Road_7
Photo: Looking Upstream

GLNG – Surface Water Assessment - Plant Location No. 16 Location Name Unnamed Drainage Feature No. 8 Easting: 317,490 Northing: 7,369,047 Site Description: Located on the south western boundary of study area, Unnamed Drainage Feature No. 8 is both ephemeral and unmodified in nature. The channel is well defined, however water is stagnant in the downstream reaches of the channel. The banks are slightly eroded and evidence of large wooden debris from flood events still exists. Channel Depth: 0.5m Channel Width: 2.5m Floodplain Slope: L 1:40, R 1:40 Bank Slope: LB 1:1, RB 1:1 Channel Banks: Channel banks are fairly stable with 30-60% of bank reaches having signs of erosion. The banks are convex in shape and moderately steep with vegetation primarily on the upper banks. Substrate Type: The bed substrate is of moderate compaction with a diluted framework and low availability of interstitial spaces. The pre-dominate particle size is rounded sands however gravels are also common. Channel Bed: The wide box shaped channel is fairly sinuous, with bends providing 2 to 3 times the length. The channel has sections of ponded water and side and central bar deposits. The channel bed is additionally covered in leaf litter and small and large pieces of wooden debris. Water Quality: Ponded water has a slight turbidity and is milky in colour. The site assessment detected neither oils nor odours from the water or associated sediment. Floodplain: Woodland currently grazed by cattle.
Plan: Unnamed Drainage Feature 8
Photo: Looking Upstream
Sketch: Cross section (not to scale)

Catchment Size: 0.568 km2 Channel Slope: 24 m/km Catchment Storage: Well defined system of small watercourses.
Catchment Relief: Rolling, with slopes of 1.5 - 4% Q2 Q10 Q100 Duration 36 min Intensity 52mm 75mm 115mm Flow 2.2m3/s 5.2m3/s 12.2m3/s Depth 0.59m 0.79m 1.04m
Cross Section Road_8
Photo: Looking Downstream

G L A D S T O N E L N G F A C I L I T Y D E V E L O P M E N T - S U R F A C E W A T E R E I S
Appendix B Climatic Data
Prepared for Santos Ltd, 13 March 2009
B. Climatic Data
Table B-1 Mean Monthly Rainfall Data
Mean Total Rainfall (mm) Gauge
Jan Feb Mar Apr May Jun Jul Aug Sep Oct Nov Dec Year Cape Capricorn (1899 to 1987)
121 131 98.1 65.4 61.1 53.5 44 24.9 25 36.5 54.4 83.5 797.5
Gladstone Airport (1994 to 2008)
114 171 46.2 37.9 37.5 50.6 14 39.8 32.6 66.7 56.3 106 786.4
Gladstone Post Office (1872 to 1958)
181.6 191.1 129.6 61 46.1 63.1 47.3 23.7 30.9 51.9 75.1 118.7 1020.8
Gladstone Radar (1957 to 2008)
144.2 141.5 83.5 45.5 60.5 39.4 35.2 32.4 26.5 62.3 74.1 129.8 876.7
Source: Bureau of Meteorology (2008)
Table B-2 Mean Monthly Pan Evaporation
Mean Pan Evaporation (mm/day) Gauge
Jan Feb Mar Apr May Jun Jul Aug Sep Oct Nov Dec Year
Gladstone Radar (1957 to 2008)
6.3 5.9 5.3 4.4 3.4 3 3.1 3.5 4.4 5.5 6.1 6.3 4.8
Source: Bureau of Meteorology (2008)

G L A D S T O N E L N G F A C I L I T Y D E V E L O P M E N T - S U R F A C E W A T E R E I S
Appendix C Flooding Assessment
Prepared for Santos Ltd, 13 March 2009
C. Flooding Assessment
Study Area Description
The proposed coal seam gas compression LNG facility study area has a footprint of approximately 3.8km2 and is located to the south west coast of Curtis Island (Figure 1). The site stretches from the hills to the east approximately 124 m AHD in elevation, down to the flat salt marsh of the China Bay coast. At higher elevations the study area is densely vegetated bushland, at lower elevation the vegetation generally becomes sparser and the terrain flatter. The study area is currently grazed with cattle and there is single dirt road traversing the site, predominately following the coastline to the south west.
Within the designated facility site area eight (8) drainage features have been identified. The features are all ephemeral in nature, with small catchments, less than 5km2 in size. The site investigation indicated that features evolved from drainage gullies in the upper catchment formed from erosive runoff during high intensity storm events. The drainage features have been numbered from east to west and are shown on Figure 2.
Evaluation of the proposed site layout resulted in the assessment of all but one of the eight drainage features, as the most easterly drainage feature is unlikely to be disturbed by the development. The following sections provide a description of the existing tidal and fluvial flood regime of the area.
Flood Hydrology
Flood hydrology uses statistical or deterministic methods to estimate the depth of rainfall to occur and the likely flow, for any point within a catchment, for a particular probabilistic flood event. Hydrological assessments consider the catchment characteristic and local hydrological patterns for a range of event durations to determine the most critical, it is this duration that depths and flows are predicted.
To estimate the flood depths of the seven (7) identified drainage features, a hydrological assessment of each, at the perimeter road, has been undertaken. The assessment considers probable design floods, a theoretically derived flood which has a certain likelihood of occurrence, expressed as an average recurrence interval (ARI). Flood flow estimates for the watercourse were estimated for a range of flood events considered as mean, minor and major respectively: 2, 10, and 100 year ARI events.
The selection of hydrological estimation method was based from guidance provided in the technical reference Australian Rainfall and Runoff (AR&R) (IEAUST, 1987). AR&R Section 5.3 suggests, for small ungauged catchments where considerable data is available for a site, flood frequency, unit hydrograph or runoff routing methods are preferred. A flood frequency analysis for the region was considered to provide poor representation of these small catchments, with no gauges on the island and gauges within the Calliope Region of significantly greater size. Again, with the small catchment area sizes and the lack of available data for the site, the complex unit hydrograph and runoff routing methods were also considered unsuitable.
The reference (AR&R, Section 5.3) also notes; where no data is available for the site and little time is available to produce a design, a published regional method should be applied. Following this, the Rational Method was applied to estimate peak flows for design floods for the drainage features. The Rational Method is given by the equation:
AICQ YtYY c ,278.0 Equation 1
Where QY = peak flow rate (m3/s) of average recurrence interval (ARI) of Y years
CY = runoff coefficient (dimensionless) for ARI of Y years
A = area of catchment (km2)
Itc, Y = average rainfall intensity (mm/hr) for design duration of tc hours and ARI of Y years.
The Rational Method is a statistical relationship which relates rainfall of a particular probability to the flood discharge of the same probability. A paper titled “Design Floods for Small Rural Catchments in

G L A D S T O N E L N G F A C I L I T Y D E V E L O P M E N T - S U R F A C E W A T E R E I S
Appendix C Flooding Assessment
Prepared for Santos Ltd, 13 March 2009
Queensland” (W.D. Weeks, 1991) discusses further analysis undertaken for rational methods application in Queensland. The paper was developed from an analysis of all gauged catchments in Queensland with a catchment area of less than 250km2 and more than 20 years of stream flow record.
Weeks (1991) suggested that time of concentration estimated by Bransby Williams formula (AR&R, 1987) gives extended durations and the flow estimation method provides a large number of unrealistically high runoff coefficients. The alternate Pilgrim and McDermott formula (1982) was recommended as a result of Weeks’ (1991) analysis undertaken, as this provided consistently shorter durations. The hydrological estimations for Bell Creek, Conciliation Creek upstream and Spring Creek adopted the Pilgrim and McDermott formula, a slightly more conservative approach.
Design rainfall intensity, were obtained by using the AusIFD program and the AR&R Manual (IEAust, 1987). Each watercourse’s catchment was delineated based on 1m contours provided by Santos (Figure 2).
Two methods of calculating the runoff coefficient were undertaken for the small watercourse hydrological estimation;
Queensland MRD Bridge – Branch Method (AR&R, 1987), and ;
Weeks (1991).
The Weeks (1991) method was developed for catchments with limited landuse and terrain information. The MRD considered catchment characteristics and provided a higher flow estimate. In view of this, a conservative approach was adopted and the MRD method was used for determining the rational method runoff coefficients.
The 0.1 AEP runoff coefficient was adjusted for a range of flood probabilities using Equation 2, developed by Weeks (1991).
10)46.0)(54.0( CYLogCY Equation 2
Table C-1 below, provides the predicted peak flows for the drainage features.
Table C-1 Predicted peak design flows
Drainage Feature No.
Upstream Catchment Area (km2)
2 Year ARI Peak Flow
(m3/s)
10 Year ARI Peak Flow
(m3/s)
100 Year ARI Peak Flow
(m3/s) 2 2.156 6.4 14.9 35
3 0.165 0.8 1.9 4.5
4 0.776 2.9 6.7 15.6
5 0.37 1.6 3.7 8.6
6 0.08 0.5 1.1 2.6
7 0.89 3.1 7.2 16.9
8 0.568 2.2 5.2 12.2
Flood Assessment
To approximate the flood depths at the road crossing, a flood assessment of the seven drainage features, as identified above in the flood hydrology Section C4, has been undertaken.
The US Army Corps developed Hydrologic Engineering Centers River Analysis System, known commonly as HEC RAS, is a one-dimensional hydraulic estimation model. The hydraulic model was adopted for

G L A D S T O N E L N G F A C I L I T Y D E V E L O P M E N T - S U R F A C E W A T E R E I S
Appendix C Flooding Assessment
Prepared for Santos Ltd, 13 March 2009
flood estimation of the 7 locations. The model inputs include geometry of the channel and floodplain, peak flows (from Table C-1) and representative hydraulic roughness coefficients.
Using a 12d digital terrain model (developed from 1m contour data), channel cross sections were extracted for each watercourse to HEC-RAS to form a simplified hydraulic model The cross sections were further detailed with information gathered during the site visit, primarily providing channel definition. The cross-sections were then replicated in an upstream direction, using the average drainage feature gradient for a distance of 400m. Once the series of cross-sections were developed for each assessment location, they were then exported to the HEC RAS to form a simplistic 400m model extent.
Along with the cross-sectional data the geometric file requires a description of the bed, channel wall and floodplain roughness. Hydraulic roughness values (Mannings ‘n’) were adopted from hydraulic references based on field observations (see Table C-2 below):
Table C-2 Adopted Mannings ‘n’ values
Surface Type Roughness Value
Floodplains
Light brush and trees, in winter 0.06
Heavy stand of timber, a few down trees, little undergrowth 0.08 – 0.1
Main Channel
Clean, winding, some pools and shoals, some weeds and stones 0.04- 0.045
Clean, winding, some pools and shoals, some weeds and stones, lower stages, ineffective slopes and sections
0.05
Sluggish reaches, weedy, deep pools 0.07
Sources: Chow, 1959, Open Channel Hydraulics, McGraw-Hill Book Company, Inc.
Each model contains two boundary conditions, an upstream flow boundary and a downstream water level boundary. The inflow values were taken from the peak flows determined in the hydrological analysis (Table C.1) at each location. As the downstream environment would be commonly effected by the tidal level within China Bay, the salt marsh downstream of the facility site, the level was simplified and a normal depth downstream boundary was adopted based on the average gradient of the drainage feature gradient.
The HEC RAS model was simulated using steady state conditions, due to the flat topographic nature of all the watercourses identified; subcritical flow conditions were also adopted.
At all locations, for all three events, the model predicted out of channel bank flooding to occur. Table C-3 below provides the flood depths and extents for each key watercourse location.

G L A D S T O N E L N G F A C I L I T Y D E V E L O P M E N T - S U R F A C E W A T E R E I S
Appendix C Flooding Assessment
Prepared for Santos Ltd, 13 March 2009
Table C-3 Predicted Flood Depths
Name 2yr ARI Depth (m)
10yr ARI Depth (m)
100yr ARI Depth (m)
Unnamed Drainage Feature No. 2 1.55 1.84 2.16
Unnamed Drainage Feature No. 3 0.09 0.13 0.18
Unnamed Drainage Feature No. 4 1.13 1.24 1.39
Unnamed Drainage Feature No. 5 0.51 0.67 0.89
Unnamed Drainage Feature No. 6 0.39 0.42 0.48
Unnamed Drainage Feature No. 7 0.53 0.61 0.68
Unnamed Drainage Feature No. 8 0.59 0.79 1.04
As mentioned above, to the south west of the site lies the flat salt marsh of China Bay. This creates a further risk from flooding from tidal surges. Although the marine environment has been explored in further detailed in the Marine Water Chapter of this EIS, the following tidal levels were taken for and will influence downstream reach flood levels during a combined tidal and hydrologic event. Table C-4 below provides extreme tidal level predictions for Gladstone (Queensland Government, 2008).
Table C-4 Predicted Extreme Tidal Surge Levels at Gladstone (source, 2003)
Probability Predicted Level 100yr ARI 2.82 m AHD
500yr ARI 3.51 m AHD
1000yr ARI 3.80 m AHD
The above flow and water depth results have been calculated with limited data of the site and have not calibrated to real data. Due to the simplistic nature of this investigation and the lack of verification, the level of accuracy is low. Hence any results provided in this appendix should only be used to obtain an indicative understanding of the flooding behaviour they are not suitable for design purposes.

G L A D S T O N E L N G F A C I L I T Y D E V E L O P M E N T - S U R F A C E W A T E R E I S
Appendix D Risk Assessment
Prepared for Santos Ltd, 13 March 2009 J:\Jobs\42626220\07 Deliverables\EIS\FINAL for Public Release\33. Appendix O - Surface Water\Appendix O3 - Surface Water - LNG Facility\O3 Surface Water LNG Facility FINAL CM.doc
D. Risk Assessment
Likelihood Scale
Likelihood is defined as a general description of probability and/or frequency (AS/NZ4360, 2004). Applied to this project it is the water quality impact within and surrounding the facility and using the following likelihood scale.
Level Likelihood Description
1 Rare Will ONLY occur in exception circumstances
2 Unlikely Could occur but not expected
3 Possible Could occur at some time
4 Likely Will probably occur in most circumstances
5 Almost Certain Expected to occur in most circumstances
Consequence Scale
Consequence is defined as the outcome or impact of an event (AS/NZ4360, 2004).
Level Consequence Description
1 Insignificant Trivial environmental impact
2 Minor Unreasonable interference with the environment. (Results in minor illness or injury)
3 Moderate
Clearly visible impact to aquatic ecosystem. Requires localised remediation. (Results in illness or injury)
4 Major Damage to the environment that requires significant remediation. (Results in serious illness or injury)
5 Catastrophic Environmental damage is irreversible, of high impact or widespread. (Results in death)
Risk Rating Matrix
A combination of the consequences and likelihood assigned to each measure to calculate the overall risk rating.
Consequences
Likelihood Insignificant Minor Moderate Major Catastrophic
Almost Certain High High Extreme Extreme Extreme
Likely Medium High High Extreme Extreme
Possible Low Medium High High Extreme
Unlikely Low Low Medium High Extreme
Rare Low Low Medium High Extreme

G L A D S T O N E L N G F A C I L I T Y D E V E L O P M E N T - S U R F A C E W A T E R E I S
Appendix E Hazards Matrix
Prepared for Santos Ltd, 13 March 2009
E. Hazards Matrix
Aspect Potential Impact Inherent Risk rating
Mitigation Strategy Residual Risk Rating
Construction
Erosion and Sediment Mobilisation
Sediment from earth moving and stockpiling can enter surface water runoff during rainfall events or blown by wind and discharge to watercourses leading to deleterious effects on water quality and aquatic habitats. Potential presence of high levels of metals in soils that may enter waterways.
High - Appropriate design (erosion and scour protection) for sections of pipeline crossing active floodplain and main channel; - Stormwater management (development, implementation and maintenance of plan), to include:
Erosion control and energy dissipation, watercourse stabilisation i.e. matting, riprap and gabions;
Stormwater controls and upstream treatment, i.e. infiltration devices and vegetation filters;
Stabilisation techniques, i.e. revegetation;
- Construction to occur in dry season; - Crossings to be at right angles to direction of flow; - Stockpiling of topsoil located away from watercourses; - Vehicle wash bay to be located away from watercourses; - Minimise vegetation disturbance; - Routine inspections - Adopt controls to minimise risk of heavy metal runoff to surface waters
Low

G L A D S T O N E L N G F A C I L I T Y D E V E L O P M E N T - S U R F A C E W A T E R E I S
Appendix E Hazards Matrix
Prepared for Santos Ltd, 13 March 2009
Aspect Potential Impact Inherent Risk rating
Mitigation Strategy Residual Risk Rating
Pollution - Oily waste water (from miscellaneous plant and equipment wash water); Contaminated runoff from chemical storage areas; Potentially contaminated drainage from fuel oil storage areas; - Oil-filled transformer yard areas and general washdown water. Diesel and other petroleum-based fuels and lubricants used by excavation and construction machinery. - Environmental and public health and safety issue. - Site excavation works may expose groundwaters which have been found to have high background levels of dissolved metals in both near-surface and deeper aquifers.
High - Chemical and fuel storage areas to be appropriately bunded; - Spill cleanup kits in accordance with Australian Standards (AS1940 and AS3780) to be located in convenient locations, i.e. work vehicles; - Refuelling to occur in bunded areas; Should a spill occur, ensure it is contained and does not enter drainage lines or watercourses; - Follow all other operational procedures. - Any site dewatering activities will require treatment or other appropriate management controls before discharge to grade is considered
Medium
Improper disposal of all construction wastes
Litter and other construction waste can be washed into watercourses during rain events and impact receiving waters.
Medium Develop, implement and maintain Waste Management/Disposal Plan.
Low

G L A D S T O N E L N G F A C I L I T Y D E V E L O P M E N T - S U R F A C E W A T E R E I S
Appendix E Hazards Matrix
Prepared for Santos Ltd, 13 March 2009
Aspect Potential Impact Inherent Risk rating
Mitigation Strategy Residual Risk Rating
Works adjacent to/within drainage lines and watercourses
Trenching at watercourse crossings and vehicle access crossings can alter flow characteristics. Potential presence of high levels of metals in soils that may enter waterways.
High - Diversion of watercourse either by low flow diversion or coffer dam with pumping; - Construction activities that will affect existing drainage channels and control measures must only be carried out after suitable stormwater management infrastructure has been implemented onsite; - Minimal disturbance by heavy earth moving equipment; - Vehicle crossings should be adequately designed for a range of flow conditions, including under road drainage. - Adopt controls to minimise risk of heavy metal runoff to surface waters
Low
Flooding Possibility of out-of-bank/flash flood rainfall event during construction causing erosion and damage to erosion and sediment control infrastructure.
High - Schedule construction works appropriately during wet season and where practicable, limit works within the flood plain. However, if not possible, make sure a flood risk assessment has been conducted; - Stormwater management e.g. drainage diversions and bunding; - Emergency response procedures and flood forecasting.
Medium
Lack of water supply Inadequate dust suppression, soil compaction and washdown.
High Develop, implement and maintain Water Supply Strategy and Emergency Plan.
Medium

G L A D S T O N E L N G F A C I L I T Y D E V E L O P M E N T - S U R F A C E W A T E R E I S
Appendix E Hazards Matrix
Prepared for Santos Ltd, 13 March 2009
Aspect Potential Impact Inherent Risk rating
Mitigation Strategy Residual Risk Rating
Contaminant Mobilisation Runoff from potentially contaminated drainage from fuel oil storage areas and general washdown water entering into drainage features and receiving waters, altering the physical and chemical quality of the water and receiving environment.
High - The construction of bunded storage areas for contaminants are recommended with spill cleanup kits in accordance with Australian Standards (AS1940 and AS3780) to prevent the contamination of surrounding surface runoff; - The transfers of fuels and chemicals controlled and managed to prevent spillage outside bunded areas; - Implement control so significant leakage/spillage is immediately reported and appropriate emergency clean-up operations implemented to prevent possible mobilisation of contaminants; - Chemically contaminated areas are protected by rooving from rainfall to reduce the likelihood of overtopping; - Bunds and sumps are frequently drained, and effluent is treated appropriately; - Any site dewatering activities will require treatment or other appropriate management controls before discharge to grade is considered.
Medium
Commissioning
Lack of water supply Insufficient water to undertake hydrostatic testing.
High Water Supply Strategy. Low
Disposal of water Improper disposal of water used in hydrostatic testing - impact surrounding environment and receiving waters (erosion)
Medium Water management/disposal procedures. Low
Operation

G L A D S T O N E L N G F A C I L I T Y D E V E L O P M E N T - S U R F A C E W A T E R E I S
Appendix E Hazards Matrix
Prepared for Santos Ltd, 13 March 2009
Aspect Potential Impact Inherent Risk rating
Mitigation Strategy Residual Risk Rating
Erosion and Sediment Mobilisation
Permanent structures and minor earth disturbance can result in localised erosion and sediment mobilisation leading to deleterious effects on water quality and aquatic habitats.
Medium Stormwater management to include: - Localised erosion control and energy dissipation measures; - Stabilisation techniques.
Routine inspection and maintenance of existing erosion and sediment control measures.
Low
Discharges from sediment ponds
It is proposed to have four sediment ponds onsite. Uncontrolled releases from these ponds could allow process and contaminated stormwater to enter drainage lines and receiving waters.
Medium Sediment ponds will be designed to contain up to a10yr ARI. Releases from ponds should be controlled and should occur after the water has been tested and meets license guidelines (which are to be determined)
Low
Pollution Diesel and other petroleum-based fuels and lubricants used by operational vehicles and machinery entering watercourses.
Medium - Chemical and fuel storage areas to be appropriately bunded; - Spill cleanup kits in accordance with Australian Standards (AS1940 and AS3780) to be located in convenient locations; - Refuelling to occur in bunded areas; Should a spill occur, ensure it is contained and does not enter drainage lines or watercourses; - Follow all other site operational procedures.
Low
Improper disposal of all operational wastes
Litter and other operational waste can be washed into watercourses during rain events and impact receiving waters.
Low Develop, implement and maintain Waste Management/Disposal Plan
Low
Flooding Possibility of out-of-bank/flash flood rainfall event causing failure of erosion and sediment control infrastructure.
High - Monitoring and maintenance of erosion and sediment control features; - Emergency Response Procedures and flood forecasting (where practical).
Medium
Lack of water supply Inadequate dust suppression, soil compaction and washdown.
High Develop, implement and maintain Water Supply Strategy and Emergency Plan.
Medium

G L A D S T O N E L N G F A C I L I T Y D E V E L O P M E N T - S U R F A C E W A T E R E I S
Appendix E Hazards Matrix
Prepared for Santos Ltd, 13 March 2009
Aspect Potential Impact Inherent Risk rating
Mitigation Strategy Residual Risk Rating
Decommissioning
Erosion and Sediment Mobilisation
- Erosion and movement of sediment can potentially have adverse impacts on water quality. - Potential presence of high levels of metals in soils that may enter waterways.
Medium - Implement and maintain a Decommissioning Environmental Plan. Apply sediment and erosion control measures prior to earth moving activities. - Adopt controls to minimise risk of heavy metal runoff to surface waters
Low
Pollution - Diesel and other petroleum-based fuels and lubricants used by operational vehicles and machinery entering watercourses. - Site excavation works may expose groundwaters which have been found to have high background levels of dissolved metals in both near-surface and deeper aquifers.
Medium - Chemical and fuel storage areas to be appropriately bunded; - Spill cleanup kits in accordance with Australian Standards (AS1940 and AS3780) to be located in convenient locations, i.e. work vehicles; - Refuelling to occur in bunded areas; - Should a spill occur, ensure it is contained and does not enter drainage lines or watercourses; - Follow all other site operational procedures. - Any site dewatering activities will require treatment or other appropriate management controls before discharge to grade is considered
Low
Improper disposal of all demolition wastes
Impact to receiving waters. Medium Develop and implement a Waste Management/Disposal Plan.
Low

G L A D S T O N E L N G F A C I L I T Y D E V E L O P M E N T - S U R F A C E W A T E R E I S
Appendix E Hazards Matrix
Prepared for Santos Ltd, 13 March 2009
Aspect Potential Impact Inherent Risk rating
Mitigation Strategy Residual Risk Rating
Works adjacent to/within drainage lines and watercourses
Infilling on-site surface water bodies or drainage lines can lead to potential loss of water storage and can adversely impact ecological habitats. Potential presence of high levels of metals in soils that may enter waterways.
High - Diversion of drainage features before construction commences (for stable vegetated channels); - Process area diversion (sediment basins and diversion drains); - Decommissioning works that will affect existing drainage channels and control measures must only be carried out after suitable stormwater management infrastructure has been implemented on-site; - Minimal number of passes by heavy earth moving equipment; - Prior to decommissioning, development and implementation of monitoring program - Adopt controls to minimise risk of heavy metal runoff to surface waters
Medium
Flooding Possibility of out-of-bank/flash flood rainfall event exceeding capacity of the storm water management system resulting in non compliant offsite discharges. Also, risk to construction workers (H&S).
Medium - Schedule decommissioning work appropriately during the wet season and try and work outside the flood plain to reduce risk from flooding and undertake a flood risk assessment has been conducted; - Stormwater management e.g. drainage diversions and bunding; - Emergency response procedures and flood forecasting.
Medium
Lack of water supply Dust emissions and inadequate soil compaction and washdown, fire water.
High Develop, implement and maintain Water Supply Strategy and Emergency Plan.
Low

G L A D S T O N E L N G F A C I L I T Y D E V E L O P M E N T - S U R F A C E W A T E R E I S
Appendix E Hazards Matrix
Prepared for Santos Ltd, 13 March 2009
Aspect Potential Impact Inherent Risk rating
Mitigation Strategy Residual Risk Rating
Contaminant Mobilisation Runoff from potentially contaminated drainage from fuel oil storage areas and general washdown water entering into drainage features and receiving waters, altering the physical and chemical quality of the water and receiving environment.
High - The construction of bunded storage areas for contaminants are recommended with spill cleanup kits in accordance with Australian Standards (AS1940 and AS3780) to prevent the contamination of surrounding surface runoff; - The transfers of fuels and chemicals controlled and managed to prevent spillage outside bunded areas; - Implement control so significant leakage/spillage is immediately reported and appropriate emergency clean-up operations implemented to prevent possible mobilisation of contaminants; - Chemically contaminated areas are protected by rooving from rainfall to reduce the likelihood of overtopping; - Bunds and sumps are frequently drained, and effluent is treated appropriately; - Any site dewatering activities will require treatment or other appropriate management controls before discharge to grade is considered.
Medium
Incomplete rehabilitation Erosion and movement of sediment, potential adverse impact to water quality.
High Decommissioning Rehabilitation Plan (including replanting of riparian and other erosion sensitive zones).
Low

G L A D S T O N E L N G F A C I L I T Y D E V E L O P M E N T - S U R F A C E W A T E R E I S
Appendix F Water Balance Assessment
Prepared for Santos Ltd, 13 March 2009
F. Water Balance Assessment
A water balance model has been developed for the proposed Curtis Island Gladstone LNG facility site. The model provided an assessment and indicative design parameters for the proposed sedimentation/evaporation basins.
Discussion with Santos (D. Reid, 5/12/2008) requested the model, initially constructed to assess the proposed water management, be adopted to design the required holding capacity, including outline dimensions, of the sedimentation/evaporation basins. Due to the non hazardous nature of the stored runoff, Santos requested a preliminary design storage allowance of 0.1 AEP, thereby providing sufficient storage to limit the annual probability of overtopping in 1 in 10 years. This design standard is consistent with other industrial discharge licences in the bay; however this standard may alter when a discharge agreement is formed with the Environmental Protection Agency (EPA), Queensland.
It is understood that all stormwater and sewage management storages will discharge (both controlled and uncontrolled outflows) into the saltpan and mangrove communities within China Bay. Although tolerant to saline waters and moderate sediment loads the vegetation of these communities are protected under the Queensland Fisheries Act 1994 and are of high conservation significance.
At this stage, the model will provide a reasonable estimate of sedimentation/evaporation basin dimensions required to meet the proposed design standard. However, with further development the model could be used for detailed design, investigation and planning of long-term storage and treatment facilities, as well as demonstrating compliance with statutory authority requirements (EPA).
Water Balance Software
The GoldSim modelling platform was selected for the construction of the water balance model. GoldSim is a modelling package used for visualising and dynamically simulating nearly any kind of physical, financial or organisational system. For the Gladstone LNG facility study area, the model has been developed to represent components of the water management system, which comprises of a series of storages (reservoir elements) with functions that affect positive (sources) and negative (losses) rates of water to the dynamic volume and mass variation in each storage element. The software allows individual runs or stochastic simulations which are suitable for evaluating probability and risk associated with system scenarios.
This type of modelling is able to assess event runoff storage performance in response to sequential rainfall events which are often the most critical conditions for overflow risks (e.g. consecutive above average wet months or years). For this assessment, the water balance model was run over a 107 year period using synthetically developed climate data, to infer the likely frequency of discharges to the environment.
Model Requirements
The key requirements (inputs) for a water balance model are:
Contributing catchment areas
Hydrological inputs, i.e. rainfall and evaporation
Representation of catchment runoff from various designated land types (or landforms) and it’s storage destination.
The capacity and level/area dimensions of each storage facility (to be determined iteratively).
The outlet discharge relationship for each storage element.
Water Sources and Losses
The water sources represented in the water management system and in receiving water streams included:

G L A D S T O N E L N G F A C I L I T Y D E V E L O P M E N T - S U R F A C E W A T E R E I S
Appendix F Water Balance Assessment
Prepared for Santos Ltd, 13 March 2009
Runoff from varying catchment types,
Evaporation from storage areas,
Direct rainfall onto the inundation surface of storages, and
Sanitary effluent, where appropriate.
Catchment Types
The overall facility site and upper catchments were divided into different catchment land types (or landforms) that can be considered as having relatively similar runoff quantity characteristics. The adopted catchment land types are:
Natural and undistributed areas
Hardstand areas, including roads, process facility areas, and generally areas that have some degree of compaction that produce higher runoff rates
Direct rainfall, these are open storages where the rainfall would directly contribute to the storage.
Catchment Data
Catchment inflows have been divided into two distinct categories, those from non-process areas and those from process areas. Areas that are disturbed, including roads and the compressor facility, are of the hardstand catchment type and are referred to as process areas whilst catchment areas upstream of these disturbed sites, where no development is proposed (i.e. retaining existing vegetation), are referred to as natural or non-process areas.
The two categories will require different treatments and varying discharge restriction prior to discharge into receiving waters. Due to the diversion of natural flows, it is considered that flow from the non-process area will require sediment control, to reduce the concentration of suspended solids discharging to receiving water from the site. This will be undertaken with the design of grassy swales, or infiltration ditches (see Appendix G).
The process area has been further delineated into a chemically contaminated process area and process area. Santos indicated (D Reid, 5/12/2008) that areas with contaminants such as hydrocarbons and lubricants will be roofed and therefore will not be affected by pluvial storm events. Therefore this assessment has assumed that runoff from roofed and uncontaminated process areas will require stormwater treatment, using sedimentation/evaporation ponds only. Information provided by Santos also indicates the basins will then discharge into the natural salt pan environment. Further detail of the treatment controls for the contaminated process area is provided in Section 6.3.3 of the report.
The catchments of the 8 unnamed drainage features identified on the facility site were delineated using 1m contours of the study area; this is discussed further in the existing environment flood assessment section of the report. The OCP design overlaid the western catchments of unnamed drainage features 6, 7 and 8. .
In general, the process area footprint was located in the downstream reaches of each drainage feature. Upper catchment areas, outside the main process area, will be drained by two separate stormwater systems. Both systems will commence to the north of the site, with one following the western perimeter and the other following the eastern perimeter. The camp and administration facilities will also have upstream diversion drains. The larger catchments have been delineated into northern and southern extents and all areas are shown in Table F1 and Table F2, below.
OCP Facility document (Santos document number: 1603-BTH-2-3.3-PDF) provided a description of the preferred design of the of the non process diversion drainage ditches. This specification has been adopted and diversion drainage dimensions have been evaluated in Appendix G.

G L A D S T O N E L N G F A C I L I T Y D E V E L O P M E N T - S U R F A C E W A T E R E I S
Appendix F Water Balance Assessment
Prepared for Santos Ltd, 13 March 2009
Discussion with Santos (D.Reid, 5/12/2008) nominated 2 to 3 locations for sedimentation/evaporation basins to drain the main process and the camp and administration facilities. The catchment areas to drain to the basins are provided in Table F-1 below.
Table F-1 OCP Facility Catchments
Catchment Area (km2) Process Area - West 0.265
Process Area - East 0.286
Process Area - Camp 0.033
Non-Process Area – North West 0.215
Non-Process Area – South West 0.205
Non-Process Area - East 0.455
Non-Process Area - Camp West 0.027
Rainfall and Evaporation Data
Long-term rainfall and evaporation for the Gladstone area were obtained from the Department of Natural Resources and Water (NRW) Data Drill system. The Data Drill rainfall is determined through accessing grids of data derived from interpolation of regional Bureau of Meteorology (BoM) station records. This provides a synthetic data set for a defined set of co-ordinates, derived from actual recorded data. As discussed earlier in this chapter, rainfall and evaporation data was however available for the Gladstone area, but not over the 100 year time frame required to infer the containment capacity of the proposed water management system. To assess the accuracy of the SILO data, a statistical analysis was undertaken.
The long-term rainfall statistics for the Data Drill values are provided in Table F-2.
Table F-2 Long Term Rainfall Statistics (107 years, commencing 1900), mm.
Item Jan Feb Mar Apr May Jun Jul Aug Sep Oct Nov Dec Year
Average 122 117 83 43 45 39 32 26 26 47 67 102 749
Std. Dev 108 119 81 54 55 43 38 28 28 42 44 81 255
Daily site records from the Gladstone Radar rain gauge (station number 039326) for the period January 1958 till December 2007 were analysed. Monthly averages are detailed in Table F-3, along with the corresponding Data Drill averages for that period.

G L A D S T O N E L N G F A C I L I T Y D E V E L O P M E N T - S U R F A C E W A T E R E I S
Appendix F Water Balance Assessment
Prepared for Santos Ltd, 13 March 2009
Table F-3 Mean Monthly Site and Data Drill Rainfalls (mm)
Item Jan Feb Mar Apr May Jun Jul Aug Sep Oct Nov Dec Year Data Drill (1958 to 2007) 146 143 96 52 63 40 33 32 26 53 72 125 881
Gladstone Radar (1958 to 2007) 141 133 82 45 60 39 32 32 26 62 72 130 853
Comparison of monthly rainfall totals are also shown in Figure F-1.
Figure F-1 Correlation of rainfall Data Drill values with site recorded data, monthly totals (January 1958 – December 2007)
Data Drill Verses Gladstone Gauge Station Rainfall Data
Gladst one Sit e Dat a
Correlat ion Coef f icient R2 = 0.9029
0.00
25.00
50.00
75.00
100.00
125.00
150.00
0 25 50 75 100 125 150
Data Drill Rainfall (mm)
Gau
gin
g S
tati
on
Rai
nfa
ll (m
m)
Gladstone Gauge Station
Linear (Gladstone Gauge Station)
Review of Figure F-1 shows good correlation between the Gladstone gauge station recorded data and data drill rainfall values, for the concurrent period, with a R2 value of 0.9029. Given this, current investigations have adopted the Data Drill rainfall values for long-term water management simulation.
Average total evaporation rates from the Gladstone Radar gauge station (039123) and Data Drill evaporation data, provided by NRW are listed in Table F-4.

G L A D S T O N E L N G F A C I L I T Y D E V E L O P M E N T - S U R F A C E W A T E R E I S
Appendix F Water Balance Assessment
Prepared for Santos Ltd, 13 March 2009
Table F-4 Mean Monthly Pan Evaporation (mm/day)
Item Jan Feb Mar Apr May Jun Jul Aug Sep Oct Nov Dec Year Data Drill (1967 to 1992) 6 5 5 4 3 3 3 4 5 6 6 6 147
Gladstone Radar (1967 to 1992) 6 5 5 4 3 3 3 3 4 5 6 6 145
Comparison of monthly totals is also compared in Figure F-2.
Figure F-1 Correlation of evaporation Data Drill values with site recorded data, monthly totals (January 1967 – December 1992)
Data Drill Verses Gladstone Gauge Station Evaporation Data
Gladst one Sit e Dat a
Correlat ion Coef f icient R2 = 0.9231
66.00
116.00
166.00
216.00
266.00
316.00
70 90 110 130 150 170 190 210 230 250
Data Drill Evaporation (mm)
Gau
gin
g S
tati
on
Eva
po
rati
on
(m
m)
Gladstone Gauge Station
Linear (Gladstone Gauge Station)
Review of Figure F-2 shows good correlation between the Gladstone gauge station recorded data and data drill evaporation values, for the concurrent period, with a R2 value of 0.9231. As for rainfall data, given its good correlation current investigations have adopted the Data Drill evaporation values for long-term water management simulation.
Runoff model representation
Catchment runoff processes were modelled using the Australian Water Balance Model (AWBM) type runoff model. The AWBM model is considered a more superior method of estimating runoff from rainfall than simpler methods using runoff coefficients.

G L A D S T O N E L N G F A C I L I T Y D E V E L O P M E N T - S U R F A C E W A T E R E I S
Appendix F Water Balance Assessment
Prepared for Santos Ltd, 13 March 2009
The AWBM is a catchment water balance model that can relate runoff to rainfall with daily or hourly data, and calculates losses from rainfall for flood hydrograph modelling. The model takes account of observed variability of runoff rate in response to preceding rainfall conditions and corresponding effects on catchment wetness.
The model uses 3 surface stores to simulate partial areas of runoff. At each time step, rainfall is added to each of the 3 surface stores and evapotranspiration is subtracted. If the capacity of the store is exceeded the excess becomes runoff. The runoff recharges the baseflow store and if there is remainder it becomes surface runoff.
The natural land type parameters were calibrated using an automated calibration program known as Rainfall Runoff Library (RRL). The RRL uses daily time series rainfall and evapotranspiration data to generate daily catchment runoff. The generator provides several commonly used lumped rainfall-runoff models, calibration optimisers and display tools to facilitate model calibration. Once the runoff is estimated, it is then compared, using statistical correlation methods, to real flow data. The major inputs to the RRL are as follows:
Rainfall – continuous time series of rainfall data that represents the rainfall across the catchment, in mm/day.
Evaporation – a continuous time series of potential evapotranspiration (PET) or actual evapotranspiration data that represents the evapotranspiration across the catchment, in mm/day.
Flow gauging – daily runoff values for the gauging station that is to be used for model calibration, in m3/s.
Catchment area – this is used to convert inputs and outputs between flow and depth of runoff.
Rainfall and evaporation data used for the natural runoff model calibration were sourced primarily NRW Data Drill database. As mentioned above in the data provides long term synthetic records based on real gauge information.
The AWBM runoff parameters for natural land type were calibrated using recorded flow data. The flows recorded at this gauge. As flow data for the Curtis Island catchments was unavailable, the closest long term gauge record considered appropriate was that of the Castelhope gauge (CS132001A) on the Calliope River. The inland location of the gauge, and the substantial size of its upstream catchment (1,041km2), vary considerable from the site, reducing the relative accuracy of the assessment.
Using a variety of different optimisation methods, numerous AWBM parameter sets were assessed, resulting in the highest correlation being adopted. For this assessment a correlation R2 value of 0.676 was achieved, which is considered adequate for this level of assessment. Table F-5 below provides the natural land type AWBM parameters.
Table F-4 Adopted natural land type AWBM parameters:
A1 0.134
A2 0.433
A3 0.433
BFI 0.673
C1 19.292
C2 154.526
C3 914.447
K Base 0.269
K Surf 0.917
There was no data available to calibrate runoff parameters for hardstand catchment land types. The adopted AWBM runoff parameters were therefore estimated by adjustment of the natural land type runoff

G L A D S T O N E L N G F A C I L I T Y D E V E L O P M E N T - S U R F A C E W A T E R E I S
Appendix F Water Balance Assessment
Prepared for Santos Ltd, 13 March 2009
model parameters based on the inferred physical differences between hardstand areas relative to characteristics of natural (relatively undisturbed) catchment surfaces.
The general approach was to reduce the catchment store depth (C1, C2 and C3), generally to produce higher runoff. This alteration takes into account the relatively heavily compacted areas and the assumption that hardstand areas will be well drained. However, hardstand areas are often relatively flat and include many minor small surface depressions, which produce some losses as water is retained on the surface and evaporates away after rainfall events.
Additionally, hardstand catchments are assumed to have minimal or no significant baseflow recession. Therefore the Base Flow Index parameter was set to zero. Table F-6 below provides the hardstand land type AWBM parameters.
Table F-5 Adopted hardstand land type AWBM parameters:
A1 0.134
A2 0.433
A3 0.433
BFI 0
C1 5
C2 20
C3 40
K Base 0.269
K Surf 0.917
Model Schematic
A facility configuration has been provided for the compression facility site for the OCP Process. At this early stage of design, several assumptions have been made to undertake the most appropriate assessment.
The design has been evaluated using an iterative process. The initial basin design dimensions were based on information provided in Santos Document No. 25438-100-G65-GEH-00001. The document details that the clean stormwater runoff of the facility site will be routed to sedimentation/evaporation ponds. Four of these ponds are proposed, with three being of dimensions 100m x 50m, 3m deep (15ML capacity) and the fourth being 100m x 50m, 2.5m deep (12.5Ml capacity), providing a total capacity of 57.5Ml.
As the document also indicated that the total holding capacity was below the available storage volume, a wet pond configuration has been assumed, where the low flow outlet is above the bed of the pond. Further evaluation of the proposed storage design calculations suggest the outlet is located 0.375m above the bed of the basin, therefore providing a small settling zone, slightly improving the sedimentation performance of the pond.
The inclusion of a low flow outlet has been assumed, as without the allowance of a mechanism for drawdown the pond would be regularly bypassed in the wet season, achieving ineffective sediment control and unacceptable discharges to the environment. The schematic has allowed for a low flow discharge of a small capacity, to restrict flow velocities, reducing the potential for outlet erosion. A 100mm diameter pipe for each basin has been adopted. Using the hydraulic application Culvert W, a stage discharge relationship has been incorporated into the water balance model. It is also suggested that the pipe is above HAT (Highest Astronomical Tide) level (2.27 m AHD) (Maritime Safety Queensland, 2008), to retain a free flowing outlet, except in extreme tidal conditions.
The initial design document also suggests that excess storm water from the ponds will be discharged through seawater outfalls. The model has set all overflows from the ponds to be directly discharged into the sea.

G L A D S T O N E L N G F A C I L I T Y D E V E L O P M E N T - S U R F A C E W A T E R E I S
Appendix F Water Balance Assessment
Prepared for Santos Ltd, 13 March 2009
As mentioned previously, Santos propose that runoff from the chemically contaminated process area will not be effected by pluvial storm events. It is understood that these areas will be washed regularly and drained to sumps located throughout the rooved area. The design standard of the drains and sumps will need to be designed at least 110% of the estimated maximum supplied fluids in the area. Water treatment proposed for the two process will hence need to be assessed in accordance with the predicted daily washdown volumes and contaminates, type of contaminates and their estimated volume.
Model Assumptions and Accuracy
In addition to the assumptions listed in the model schematic section of this appendix, several other assumptions were made for the construction of the model, including;
No allowance was made in the model for seepage through the base of the storages. This is a conservative assumption and will generally overestimate the overflow volumes and frequency.
No allowance was made for lag time for catchments upstream of the facility. For the scale of the catchments represented by the modelling, lag would typically be less than a day, and as such this assumption is not significant.
No allowance for tidal effect. It is understood that all infrastructure will be built above the Highest Astronomical Tidal level (at approximately 11m AHD, pers. comm. Santos).
Unverified discharge agreement with appropriate government authority, therefore potentially under or over estimation of design standard.
As previously discussed, the model contains several sources of potential inaccuracy, including:
Hydrologic information of the site was unavailable, and as such synthetic data for the 107 year simulation was used as a substitute,
Relatively poor correlation of natural runoff parameters was achieved, and no data was available to calibrate hardstand runoff parameters,
Lack of data regarding model layout, surface gradient and contaminated areas, and
Model verification and calibration of the model has not been undertaken given the lack of available local gauged data.
Considering the above, whilst the accuracy of the assessment is considered adequate for EIS purposes, the evaluation provides indicative basin dimensions only. The results from this model are therefore inappropriate for design purposes. Further model refinement would be required for such an application to be made.
Model Results and Discussion
A key output of this investigation is the storage configuration to achieve the design standard of discharge. The model was simulated on an hourly time-step for 107 years (1900 - 2007), and the annual average days of overflow and volume of overflow discharge was determined.
The OCP design model results are provided below in Table F-7.
Table F-6 OCP Design
Storage and Destination Length Width Depth Capacity Spill Frequency
West Sedimentation/Evaporation Basin 110m 55m 2.92m 17,666m3 0.1 AEP East Sedimentation/Evaporation Basin* 130m 65m 2.89m 24,420.5m3 0.1 AEP
* Includes discharges from the Camp Process Area.

G L A D S T O N E L N G F A C I L I T Y D E V E L O P M E N T - S U R F A C E W A T E R E I S
Appendix F Water Balance Assessment
Prepared for Santos Ltd, 13 March 2009
As shown in the table above, the model predicts that two sedimentation/evaporation basins should provide sufficient capacity to achieve a spill frequency of 0.1AEP. This simulation included a low flow discharge, as described in the model schematic section, without this allowance a spill frequency of both basins is predicted to increase to approximately of 2.7 AEP, i.e. 3 times a year.
Summary
As discussed earlier within this Appendix, the accuracy of the water balance model is considered adequate for the intended use and should only be used to provide indicative guidance regarding facility stormwater controls. To improve the accuracy of the model and quality of output, it is suggested that accurate design dimensions of all storages, inlets and outfalls are incorporated into the model (following further progress in the design of the processing facility). Furthermore, where possible, the model should be calibrated and verified using local data (a monitoring programme should be established for this purpose).
A summary of the results, including potential impacts and mitigation measures is provided below for the proposed design:
1. The impact of uncontrolled discharges to the receiving environment from the specified sedimentation/evaporation basins, including low flow discharge, is expected to be negligible, as this will occur on average once per 10 years and reasonable water quality (non contaminate runoff only). To mitigate any potential impacts relating to elevated suspended solid concentrations, the design of the sediment ponds should be optimised to improve settlement performance (e.g. through inclusion of a permanent pool to reduce velocities and the construction of islands, baffles and weirs to increase the hydraulic efficiency of sediment settlement). Periodic dredging of sediments and safe disposal should also be undertaken to maintain performance.
2. Uncontrolled discharges from contaminated areas are unlikely if sufficient protection from flooding is provided. Discharge waters are likely to include moderate to poor concentration of contaminants, as overtop may include diluted. As such, the impact on the receiving environment (saltpan and mangrove communities) is potentially more significant. An effective way of mitigating this will be to increase the capacity of the contaminate process area drainage ditches, sumps and treatment rates, to further reduce the frequency of overtopping.
3. The sediment pond bunds should be constructed in accordance with best practice to minimise the potential for catastrophic failure (including design and construction of a formal spillway with sufficient capacity to safely pass a minimum 0.01 AEP critical duration storm event, and sufficient downstream erosion controls). This would also include constructing the earth bunds with competent material and undertaking regular inspections and periodic maintenance. With these controls in place the likelihood of catastrophic failure is considered minimal. Additionally, given the limited capacity of the ponds (around 25Ml) were there to be a catastrophic overtopping or piping failure there would be minimal impact on the receiving environment.
Recommendations
The following recommendations are provided in relation to the storm water management system:
Further assessment of the settlement performance of the proposed sedimentation/evaporation ponds should be undertaken. Guidelines generally require a reduction in sediment loads of 50% and 80% for fine (<0.1mm) and course (>0.5mm) sized particles, respectively. The size and shape of the sedimentation pond governs its efficiency of settling sediment particles.
In accordance with best practice, it is recommended that the design of sedimentation basins should consider:
– A permanent pool to reduce flow velocities and provide storage of settle sediment. The basin should be designed with approximately 1.5m permanent pool depth with an additional 1m for sediment to accumulate.

G L A D S T O N E L N G F A C I L I T Y D E V E L O P M E N T - S U R F A C E W A T E R E I S
Appendix F Water Balance Assessment
Prepared for Santos Ltd, 13 March 2009
– Both inlet and outlets of ponds should include localised scour protection and for process areas some form of gross pollutant trap.
– Ideally the length to width ratios of ponds should be set to 3L: 1W, to slow flow velocities within the pond.
Other ways to improve efficiency should be explored such as constructing islands, baffles and weirs, and designing numerous inflow points, to increase the hydraulic efficiency of sediment settling.
In Queensland, effluent discharges to the marine environment are regulated by the EPA. When new infrastructure is proposed, a licensing agreement is formed as part of the planning process, to permit offsite discharges. As yet, no instructions on water quantity and quality objectives for the LNG facility study area have established. When an agreement is formed, it is recommended that this, or a similar, water balance model is refined to provide intrinsic data on the performance of the proposed stormwater management and likely quality of off-site discharges, and aid negotiations with the EPA.
It is recommended that for all containment facilities with off-site discharges to the receiving environment, telemetry monitoring systems are installed (to measure, Electrical Conductivity (EC), pH and water level). This can provide accurate information regarding both quantity and quality of discharged effluent and calibration data for future water balance, water quality and flood assessment modelling.

G L A D S T O N E L N G F A C I L I T Y D E V E L O P M E N T - S U R F A C E W A T E R E I S
Appendix G Diversion Drainage
Prepared for Santos Ltd, 13 March 2009
G. Diversion Drainage
Introduction
Catchment inflows have been divided into two distinct categories, those from non-process areas and those from process areas. Areas that are disturbed, including roads and the compressor facility, are of the hardstand catchment type and are referred to as process areas Whilst catchment areas upstream of these disturbed sites, where no development is proposed (i.e. retaining existing vegetation), are referred to as natural or non-process areas.
To reduce the probability and consequence of flooding and reducing the volume of contaminated runoff, Santos (D. Reid 5/12/2009) propose to divert upstream catchment non-process flows. The diversion of natural flows is considered to require sediment controls; this will assist to reduce the concentration of suspended solids discharging to receiving water from the site.
Grassy swales are open vegetated drains, which provide water quality treatment through physical filtration of water through the vegetation and depending on the retention time some additional pollutant take-up provided by the vegetation. The following Appendix provides an indicative design for the drainage ditches consistent for a grassy swale design.
Drainage Dimensions
OCP Facility document (Santos document number: 1603-BTH-2-3.3-PDF) provided a description of the preferred design of the of the non process diversion drainage ditches. The document specified a trapezoidal cross section with a minimum bottom width of 600 mm, side slope of 1.5 horizontal to 1 vertical in rock cut areas, and 2 horizontal to 1 vertical in fill areas, and a minimum gradient for main collection ditches to be 0.001 m/m, and a minimum gradient for all other ditches shall be 0.002 m/m.
Table G-1 below provides a summary of the catchment areas of the non-process, undisturbed catchments, for the two process schematics.
Table G-1 Catchment
Catchment Area (km2) OCP Facility
Non-Process Area – North West 0.215
Non-Process Area – South West 0.205
Non-Process Area - East 0.455
Non-Process Area - Camp West 0.027
Using the Mannings Equation (Chow, 1959) design depths and widths of each diversion drain has been estimated. The equation requires slope, area and roughness values to estimate the peak flow. Due to the anticipated grassy bed, a Mannings ‘n’ of 0.07 has been adopted. Width to depth ratios have been based on guidance from Chanson (1994). Table G-2 provides indicative dimensions for the OCP facility designs.

G L A D S T O N E L N G F A C I L I T Y D E V E L O P M E N T - S U R F A C E W A T E R E I S
Appendix G Diversion Drainage
Prepared for Santos Ltd, 13 March 2009
Table G-2 OCP Facility Indicative Drainage Ditch Dimension
Name Area (km²) 100yr ARI
(m³/s) Bed Width
(m) Depth (m) Width (m) Non Process North West 0.215 7.90 2.54 2.20 6.94
Non Process East 0.455 14.20 3.16 2.74 8.64
Non process South West 0.205 13.50 3.11 2.69 8.49
Non Process Camp West 0.027 1.40 1.33 1.15 3.63
Process Camp 0.033 1.60 1.39 1.20 3.79