FINAL REPORT - Joint Fire Science Program REPORT Spatiotemporal Evaluation of Fuel Treatment and...
34
FINAL REPORT Spatiotemporal Evaluation of Fuel Treatment and Previous Wildfire Effects on Suppression Costs JFSP PROJECT ID: 14-5-01-25 September 2017 Helen T. Naughton Department of Economics University of Montana Missoula, MT 59803-5472 Kevin Barnett Department of Economics University of Montana Missoula, MT 59803-5472 The views and conclusions contained in this document are those of the authors and should not be interpreted as representing the opinions or policies of the U.S. Government. Mention of trade names or commercial products does not constitute their endorsement by the U.S. Government.
-
Upload
nguyenhanh -
Category
Documents
-
view
214 -
download
0
Transcript of FINAL REPORT - Joint Fire Science Program REPORT Spatiotemporal Evaluation of Fuel Treatment and...

FINAL REPORT Spatiotemporal Evaluation of Fuel Treatment and Previous Wildfire Effects on Suppression Costs
JFSP PROJECT ID: 14-5-01-25
September 2017
Helen T. Naughton Department of Economics University of Montana Missoula, MT 59803-5472
Kevin Barnett Department of Economics University of Montana Missoula, MT 59803-5472
The views and conclusions contained in this document are those of the authors and should not be interpreted as representing the opinions or policies of the U.S. Government. Mention of trade names or commercial products does not constitute their endorsement by the U.S. Government.

i
Table of Contents Front Matter .................................................................................................................................... ii
List of Tables .............................................................................................................................. iiList of Figures ............................................................................................................................. iiList of Abbreviations & Acronyms ............................................................................................ iiiKeywords ................................................................................................................................... iiiAcknowledgements .................................................................................................................... iii
Abstract ........................................................................................................................................... 1Objectives ....................................................................................................................................... 2Background ..................................................................................................................................... 4Data and Methods ........................................................................................................................... 6
Methods for the Encounter Rates Analysis ................................................................................. 9Methods for the Suppression Cost Regression Analysis .......................................................... 10Methods for the I-Suite to ROSS Data Matching Exercise ...................................................... 11
Results and Discussion ................................................................................................................. 16Results from the Encounter Rates Analysis .............................................................................. 16Results from the Suppression Cost Regression Analysis ......................................................... 19Results from the I-Suite to ROSS Data Matching Exercise ..................................................... 21
Conclusions ................................................................................................................................... 23Implications for Management ................................................................................................... 23Implications for Future Research .............................................................................................. 24
Literature Cited ............................................................................................................................. 25Appendix A: Contact Information for Key Project Personnel ...................................................... 28Appendix B: List of Completed/Planned Publications and Products ........................................... 29Appendix C: Metadata .................................................................................................................. 30
Data Publication Abstract: ........................................................................................................ 30

ii
Front Matter
List of Tables Table 1 Variable descriptions and data sources for the suppression cost regression analysis. ....... 8Table 2 Summary statistics for the cost and treatment variables. ................................................. 10Table 3 Matched fire-days data by state for 2008-2012. .............................................................. 12Table 4 The count and proportion of sample days in which the predicted values from ROSS are
within various absolute margins of error. ............................................................................. 15Table 5 Number of treatments, area treated, treated area burned and encounter rate by treatment
unit size class. ....................................................................................................................... 17Table 6 Number of treatments, area treated, treated area burned and encounter rate by number of
times treated. ......................................................................................................................... 17Table 7. Suppression cost regression results for treatment variables only. .................................. 20Table 8 Comparing actual and predicted Ln(COST) regressions. ................................................. 22
List of Figures Figure 1 Map of federal lands across the CONUS. ........................................................................ 7Figure 2 Distribution of WUI lands including 2.5 km buffer (gray) among regions and
ecoregions of the CONUS. ..................................................................................................... 7Figure 3 Observed vs. predicted daily fire management costs, by fire. ........................................ 13Figure 4 Distribution of (a) area burned, (b) treated area, (c) treated area burned, and (d) the
encounter rates for each of the 67 ecoregions across the CONUS. ...................................... 16Figure 5 Encounter rate as a function of time since most recent treatment. ................................. 18

iii
List of Abbreviations & Acronyms Abbreviations/Acronyms Definition CONUS Conterminous United States GIS Geographic Information Systems ha Hectares ICS-209 Incident Status Summary reports IMT Incident management team JFSP Joint Fire Science Program km Kilometer LANDFIRE Landscape Fire and Resource Management Planning Tools LandScan Oak Ridge National Laboratory’s 1 km resolution global
population distribution dataset MTBS Monitoring Trends in Burn Severity ROSS Resource Ordering and Status System TNC The Nature Conservancy US United States USDA US Department of Agriculture USDI US Department of Interior USFS USDA Forest Service USGS US Geological Survey WUI Wildland-urban interface
Keywords Fire management, federal lands, WUI, daily fire suppression costs, fuel treatment effects, previous fire effects, fire and fuel treatment encounters.
Acknowledgements This research was funded by the Joint Fire Science Program project 14-5-01-25. The authors of the final report would like to acknowledge the invaluable contributions made by our collaborators Sean Parks and Carol Miller at the USFS Aldo Leopold Wilderness Research Institute. Sean Parks produced the day-of-burning maps for the fires analyzed by our study. Both Sean Parks and Carol Miller were instrumental in developing study ideas and producing the manuscripts. We would also like to thank our colleagues at the USFS Rocky Mountain Research Station, especially Crystal Stonesifer, for providing the ROSS data so that we could complete the data matching exercise between the I-Suite fire management cost data and ROSS resource use data. Further, we thank Karin Riley and Matthew Thompson for co-organizing a manager-inclusive workshop “Fuel treatments in theory and practice: science applications in support of the Cohesive Strategy” at the National Cohesive Wildland Fire Management Strategy Workshop: All Hands, All Lands – Implementation Rooted in Science in Reno, NV in April 2017. Workshop presenters and panelists Kevin Barnett, Karin Riley, Joe Scott, Brandon Collins, and Bill Gamble were critical to the success of the workshop. All attendants of the workshop contributed to the positive interactive atmosphere and we thank them all.

1
Abstract This project quantifies the effects of fuel treatments and previously burned areas on daily fire management costs, as well as summarizes recent encounter rates between fuel treatments and wildland fires across the conterminous United States. Using national-scale, spatially explicit data on recent fuel treatments and wildland fires, we quantified the frequency, extent, and geographic variation of encounters between fuel treatments and wildland fires on federal lands. These data were used to identify fires that burned into previous fuel treatments or burned areas. Panel regression analysis estimates daily fire management costs for 56 such fires between 2008 and 2012 as a function of a suite of spatial variables that characterized the fire environment (e.g., weather, topography, and human populations-at-risk). Results from the regression analysis suggest that days when a fire encounters a fuel treatment or burned area are, on average, positively associated with fire management costs, likely revealing the use of previously treated and burned areas to facilitate suppression operations. These effects, however, are not uniform across regions and landscape contexts. Contrary to our findings, the proposal for this project hypothesized that encounters with fuel treatments and previous burns would reduce fire management costs. As such, our initial objectives were predicated on that expectation. The study objectives were to determine the specific sources of these reductions in costs as well as estimating the tradeoffs between fuel treatment costs and suppression costs. The objectives were only partially met because our data request to the USFS National Incident Management Organization’s I-Suite application was only partially fulfilled and because of the contrary findings of increased fire management costs as fires enter fuel treatments and previous burns. To overcome the obstacle of inaccessible fire cost data, we explored expanding our cost dataset with model-predicted cost using a data matching exercise between I-Suite costs and ROSS resource use categories. While there may be some merit to that exercise, given our limited set of I-Suite data we deemed it to be a tenuous source for expanding the data. This study focused on evaluating daily costs, rather than total fire costs. Unexpectedly, we found that encounters with fuel treatments and previous fires increase daily fire management costs. Managers working in the field validated the concept suggesting that fuel treatments and previous fires are often areas where suppression efforts are applied in greater force. Future research could determine if these suppression efforts are successful at stopping fires and reducing total fire costs.

2
Objectives This project proposed to quantify the effects of hazardous fuels treatments on suppression costs of subsequent wildfires in response to the following JFSP task statement: “Fuels Treatment Effectiveness: Landscape-level and Programmatic Economics” addressing the following question: “Avoided wildfire costs and the costs of wildfire consequences - How do the costs of implementing various wildland fire suppression strategies compare to fuel treatment costs? Are treatment costs justified by avoidance of resource impacts, or avoidance of other harm to communities and human populations?” In our project, econometric models of daily fire suppression costs are estimated to determine if and to what extent hazardous fuels treatments and previous wildfires reduced observed wildfire suppression costs for a sample of 56 recent fires that have interacted with previously treated and burned areas. We investigate how other biophysical and environmental factors influence suppression costs and leverage existing datasets on the location, type and intensity of previously treated areas with observed wildfire suppression costs, and use a combination of geospatial analysis and econometric modeling techniques to better understand how hazardous fuels treatments affect wildfire suppression costs. The specific objectives outlined in the proposal for this project were to:
1. Quantify fuel treatment and wildfire effects on suppression costs in terms of fuel treatment type, age, size, and intensity;
2. Quantify the spatial spillovers and temporal longevity of fuel treatment and wildfire effects on suppression costs of subsequent fires; and
3. Estimate the tradeoffs between fuel treatment costs and suppression costs. We hypothesized that fuel treatments and previous wildland fires reduce the cost of managing subsequent fires when fires spread into treated or previously burned areas. The longevity of the expected reductions in suppression costs were hypothesized to vary according to fuel treatment type, time since treatment, size, and intensity. The effects of fuel treatments and previously burned areas on suppression costs were expected to exhibit a positive spatial spillover, and the tradeoffs between the cost of fuel treatment implementation and reductions in future fire suppression costs were predicted to vary according to treatment and ecosystem types. Objective 1 was successfully achieved by constructing empirical models of daily wildland fire management costs that included information describing the distribution of fuel treatments and previously burned areas in different levels of detail. We attempted to identify unique effects of different fuel treatment types, ages, sizes, and intensities, but were constrained by the availability of fire management cost data. Rather, we estimated suppression cost effects of a fire entering fuel treatments (collectively) or a previous wildfire. While the limited sample of fires prevented us from estimating separate effects by fuel treatment type, age, size and intensity, we were able to identify different effects by region (east vs. west) and landscape context (defined by areas with low population and low density of fuel treatments). Objectives 2 and 3 were predicated on an expected negative relationship between fuel treatments and previously burned areas on fire management costs. Our findings from Objective 1 were somewhat counterintuitive, suggesting a positive association between daily fire management

3
costs and encounters with fuel treatments and previously burned areas, though these effects vary somewhat across geography and landscape contexts. These findings were further validated through workshop interactions with fire managers who indicated that treatments and previously burned areas can serve as safe and effective platforms for suppression activities. Given the positive association between daily fire management costs and encounters with fuel treatments and previously burned areas, addressing the temporal longevity of treatments from an avoided suppression cost perspective and the tradeoffs between fuel treatment costs and avoided suppression costs in Objectives 2 and 3 became effectively moot. We achieved an additional objective by quantifying encounter rates of recent wildland fires with fuel treatments across the CONUS. Encounter rates were calculated and mapped for 67 ecosystems. We also summarized encounter rates for treatment units by treatment unit size, number of treatments, and by age of treatment. These findings were published in Barnett et al. (2016) and are summarized in this final report.

4
Background Federal wildland fire management costs continue to increase, limiting land management agencies’ ability to attain further land and resource management objectives (Thompson et al. 2015). The US Forest Service (‘Forest Service’) spent over 50% of its discretionary funding on wildland fire suppression alone in fiscal year 2015 (USFS 2015), a notable increase from an average of 20% before 2000 (USFS 2009). The Forest Service invests substantial resources into removing hazardous fuels to improve forest health and mitigate fire hazard. Fuel treatments are assumed to reduce wildfire management costs by decreasing the risks of uncharacteristic wildland fire and facilitating the restoration of active fire regimes. Little empirical justification exists to support this policy. Fuel treatments are a standard land management tool to mitigate negative wildland fire effects on forested lands. The objectives of fuel treatments vary across a landscape, but in general are intended to reduce fire spread rates and the probability of extreme fire behavior (Agee and Skinner 2005). In doing so, fuel treatments are expected to create both short and long-term pathways to achieve reductions in fire management costs. The likelihood of extinguishing unplanned ignitions during the initial phases of fire suppression, or ‘initial attack’, increases as potential fire spread rates decrease, and arguably the most effective, albeit short-term, strategy to reduce fire suppression costs may be through safe and effective initial-attack (Gebert and Black 2012). However, long-term reductions in fire management costs may be achieved by strategically locating fuel treatments across a landscape such that wildland fires will not harm important ecological functions (Ager et al. 2013). In doing so, the decision-space over future unplanned ignitions may expand and increase opportunities to employ less aggressive response strategies that require fewer suppression resources (Reinhardt et al. 2008). Regulatory, funding, and operational constraints to fuel treatment implementation, especially large treatment units that have the greatest impacts on potential fire spread and behavior (Collins et al. 2010), challenge the Forest Service’s ability to reduce fuel loadings on the millions of forested hectares that are in need of restoration. Despite annual investments of over $300 million in the hazardous fuels treatment program since 2007 (USFS 2016), recent research suggests that the pace and scale of forest restoration treatments is insufficient to achieve landscape-scale management objectives on Forest Service lands (North et al. 2015). Many fire-prone landscapes remain in a ‘disturbance deficit’ (Parks et al. 2015b), with only about half of the historic annual area burned being treated or burned by characteristic wildfire in a given year on lands managed by the Forest Service (Vaillant and Reinhardt 2017). Breaking the suppression-risk cycle (Arno and Brown 1991) requires a concerted effort to manage fire for its ecological benefits by choosing to not suppress unplanned ignitions when low-risk opportunities present themselves (Calkin et al. 2015). Although fuel treatments are viewed as a catalyst for this change (Agee and Skinner 2005), the low probability of a treated area being burned by a subsequent fire during a treatment’s lifespan raises questions over the efficacy of treatments to alter regional fire patterns (Barnett et al. 2016, Schoennagel et al. 2017). Recognizing that fuel treatments alone have a limited ability to achieve forest management objectives, federal fire management policy and strategy encourages the use of unplanned, naturally ignited fires to advance the pace of landscape-scale forest restoration (USDA and USDI 2011). Previously burned areas can serve as natural fuel treatments by moderating the spread,

5
severity, and occurrence of subsequent fires (Collins et al. 2007, Parks et al. 2014, Parks et al. 2015a, Parks et al. 2016). Fires not only reduce and rearrange fuel loadings over a much larger spatial extent than mechanical fuel treatments (USFS 2003), but the heterogeneity in successional pathways created by fire’s natural variability remains an integral function of resilient forested ecosystems (Hessburg et al. 2015). From a fire manager’s perspective, previously burned areas can serve as important fire control locations (Thompson et al. 2016). A higher probability of natural fire cessation tends to occur in fuel-limited areas (Holsinger et al. 2016), especially during periods of moderate fire weather (Parks et al. 2015a). What remains unclear is whether and how fuel treatments and previously burned areas affect suppression resource use and associated costs. Three studies have examined the potential effects of fuel treatments on subsequent fire suppression costs (Thompson and Anderson 2015). There are two main threads that tie this limited body of research together: 1) each employs simulation modeling techniques to examine potential impacts of fuel treatments between observed and hypothetical landscape scenarios; and 2) consideration of changes in suppression resource use throughout the duration of a fire as a result of fuel treatment encounters is neglected. How fire managers respond to heterogeneous landscape conditions, including changes in fuel conditions as a result of fuel treatments and previously burned areas, can help policy makers gauge whether investments in hazardous fuels reduction programs are effectively changing the fire management decision-space.

6
Data and Methods The main objective of this study was to evaluate the effect of fuel treatments and previous fires on daily fire suppression costs. Obtaining daily fire suppression cost data from the USFS National Incident Management Organization’s I-Suite application is a time consuming endeavor. To facilitate the process, we narrowed our data request to the 361 fires between 2002-2013 (with 158 fires between 2008-2012) that entered a fuel treatment or previous fire and that employed Type 1 or Type 2 incident teams during at least a part of the fire suppression efforts. At least 91 of those fires between 2008-2013 were located within the I-Suite application and daily cost data were provided for 65 of the requested fires. I-Suite cost data for 63 fires were successfully mapped to ROSS resource use data for the matching exercise described below. For the purpose of suppression cost regression analysis the number of fires were reduced to 56 fires and 985 fire-days because the sample fires burned for very short durations (i.e., less than five days), the I-Suite data contained erroneous values, or subsequent evaluation revealed that the fire was predominantly managed by an agency other than the USFS. Extensive GIS work preceded the creation of the data request for daily fire suppression costs. Federal lands1 (Figure 1) within 2.5 kilometers from the WUI2 (Figure 2) were identified and for those lands fuel treatments and fire polygons were obtained from LANDFIRE and MTBS. These polygons were then analyzed to determine the set of fires that intersected a prior fuel treatment or a previous fire. This set of fires were checked in the ICS-209 system to determine which fires employed Type 1 or Type 2 incident management teams to increase the chances that the fire data is contained within the I-Suite application.
1 Federal lands layer obtained from the Protected Areas Database (Version 1.3, USGS Gap Analysis Program, available at https://gapanalysis.usgs.gov). 2 WUI based on the ‘interface’ and ‘intermix’ spatial layers from the SILVIS lab (Radeloff et al. 2005).

7
Figure 1 Map of federal lands across the CONUS.
Source: Barnett et al. (2016) Figure 1. Figure 2 Distribution of WUI lands including 2.5 km buffer (gray) among regions and ecoregions of the CONUS.
Source: Barnett et al. (2016) Figure 2. 3
3 Ecoregions layer from The Nature Conservancy at http://maps.tnc.org/gis_data.html.

8
While our suppression cost data request was being processed, these initial data were used to characterize the interactions between fire and treatments in the US and published in Barnett et al. (2016). Corresponding methods and results are summarized below. At the same time, our USFS collaborator Sean Parks produced day-of-burning maps following Parks’ (2014) method. After our I-Suite data request had reached its limit, spatially explicit independent variables were derived from a variety of data sources using the day-of-burning maps. Variable descriptions and data sources for the suppression cost analysis are provided in Table 1. The day-of-burning maps were used to delineate daily burned area as well as daily cumulative footprint of the fire. For most variables, spatial data characterizes the fire environment within the cumulative footprint to allow the use of all daily cost data rather than just those days when the fire spread. However, for fuel treatment (RX) and previous fire (FIRE) variables, the data evaluated fire spread days only. Defining the treatment variables in such a manner allows our regression analysis to identify the average suppression cost effects of a fire entering a fuel treatment or a previous fire, while holding other variables constant. Table 1 Variable descriptions and data sources for the suppression cost regression analysis.
Variable Description Source COST Total daily fire management cost I-Suite IMT_UC 1 if a fire was managed under ‘Unified Command’, 0
otherwise ICS-209
IMT_1 1 if a fire was managed by a Type 1 IMT, 0 otherwise ICS-209 IMT_2 1 if a fire was managed by a Type 2 IMT, 0 otherwise ICS-209 IMT_3 1 if a fire was managed by a Type 3 IMT, 0 otherwise ICS-209 IMT_4 1 if a fire was managed by a Type 4 IMT, 0 otherwise ICS-209 IMT_LOCAL 1 if a fire was managed by a local unit, 0 otherwise ICS-209 POP 1 if a fire intersected a populated area, 0 otherwise LandScan REMOTE Index characterizing the relative amount of wilderness
areas within a 20km window Derived
TOPO Standard deviation of the difference between cell and neighborhood elevation
Derived
FUEL Index of vegetation productivity Landsat imagery ERC Available energy per unit area within the flaming front US Forest Service RX 1 if a fire intersected a previously treated area, 0 otherwise LANDFIRE FIRE 1 if a fire intersected a previous wildland fire, 0 otherwise MTBS EAST 1 if fire is located in eastern US ecoregions, 0 otherwise TNC LOWPOP 1 if less than 500 people are within 5km of the final fire
perimeter, 0 otherwise LandScan
LOWRX 1 if less than 3,000 ha of previously treated or burned areas are within 10km of the final fire perimeter, 0 otherwise
MTBS & LANDFIRE

9
Methods for the Encounter Rates Analysis For the lands described above (Figure 2), using spatial data for fuel treatments between 1999 and 2012 and for fires between 2000 and 2013, encounter rates were calculated as the percentage of treatment unit polygons that were intersected by wildland fires and summarized across ecoregions. This calculation involved two steps. First, for the treatment units encountered by a subsequent fire, we determined the number of years since the most recent fuel treatment. In this step, the earliest fire date was used for treatment units that encountered more than one fire. The second step involved normalizing the number of treatments within each time-since-treatment interval to remove potential bias introduced by truncated fire record. This normalization ensures that only treatments implemented in 1999 are included in analyzing encounter rates for treatments 14 years old (since the last fire year is 2013), only treatments from 1999 and 2000 are included in analyzing encounter rates for treatments 13 years old, etc. Area burned, treated area, treated area burned and encounter rates were summarized by 67 ecoregions. Number of treatments, area treated, treated area burned and encounter rates were also summarized by treatment unit size class and number of times treated. Finally, we provide encounter rates by treatment age (time-since-treatment) containing information about number of treatments in each age-class.

10
Methods for the Suppression Cost Regression Analysis The panel model estimated the logarithm of daily management costs ln(COST) for fire i on day t is modeled as:
ln !"#$!" = !! + !!!"#!" + !!!!" + !!!!" + !!" !!" = !! + !!"
where !! is the intercept, !!, !!, and !! are vectors of other model coefficients to be estimated. !"#!" is a set of dummy variables representing the type of incident management team, !!" is a set of biophysical variables, !!" is a set of fuel treatment and previous fire variables (collectively called “treatment variables”), and !!" is a composite error term that includes both an unobserved effect for fire i that is time-invariant (!!) and an idiosyncratic error component (!!"). Cluster robust standard errors are used to account for heteroscedasticity and spatial and serial correlation at the fire level. The dependent and all independent variables are described in Table 1. COST and treatment variables are summarized below in Table 2. Table 2 Summary statistics for the cost and treatment variables.
Variable Mean Std. Dev. Min. Max. COST 570,905 774,500 188 6,453,287 RX 0.12 0 1 RX *LOWPOP 0.09 0 1 RX *LOWRX 0.01 0 1 RX*EAST 0.02 0 1 FIRE 0.17 0 1 FIRE*LOWPOP 0.13 0 1 FIRE*LOWRX 0.01 0 1 FIRE*EAST 0.02 0 1 The analysis considered both the random effects model, where !! is assumed to be uncorrelated with independent variables, and the fixed effects model, without such an assumption. To choose the statistically preferred model between these two, Sargan-Hansen chi-square test is used because it allows for clustered standard errors in panel models while the Hausman test does not. These statistical tests suggest that the fixed effects model is more appropriate and, thus, the results focus on the fixed effects model.

11
Methods for the I-Suite to ROSS Data Matching Exercise An exercise matching the I-Suite cost data to Resource Order and Status System (ROSS) resource use data was primarily completed in an effort to explore whether ROSS-predicted costs could supplement the limited cost data obtained from I-Suite. ROSS is a comprehensive database that tracks tactical, logistical and support resources mobilized to wildland fire incidents in the US (Katuwal et al. 2017). ROSS data for this exercise were pre-processed by and acquired from research colleagues at the Rocky Mountain Research Station. ROSS database contains a much larger sample of fires than the I-Suite application. The resource use for each fire-day could, in theory at least, be transferred into a modeled cost metric for each fire-day. A secondary reason for completing this exercise was to validate that the I-Suite cost data corresponds closely to resources used in each fire-day. Given information on the mobilization and demobilization date of individual resource orders, suppression resources used to manage a given incident can be assigned to unique days during a fire’s progression (Hand et al. 2017). Depending on the predictive capabilities of the ROSS data, it may be possible to use the model to predict daily fire management costs for a larger sample of fires and enable a more robust analysis of the effects of fuel treatment and previously burned areas on fire management costs. I-Suite daily cost data were matched to daily suppression resource orders from ROSS. The final ROSS variables represent the daily count of unique suppression resources by category assigned to manage an individual incident. Table 3 provides information about the I-Suite to ROSS matched fire-days by state for 2008-2012.

12
Table 3 Matched fire-days data by state for 2008-2012.
State Fires Days Total Cost ($1,000s)
Cost/Fire ($1,000s)
Cost/Day ($1,000s)
AZ 3 22 3,779.09 1,259.70 171.78 CA 11 257 275,030.53 27,503.05 1,070.16 CO 2 34 48,837.38 24,418.69 1,436.39 ID 3 21 6,741.78 2,247.26 321.04 MN 2 73 24,022.07 12,011.04 329.07 MT 7 105 26,965.00 3,852.14 256.81 NC 1 46 12,110.35 12,110.35 263.27 NM 1 14 4,226.94 4,226.94 301.92 NV 7 75 18,433.35 2,633.34 245.78 OK 1 6 585.60 585.60 97.60 OR 8 160 75,254.91 9,406.86 470.34 SD 1 4 539.89 539.89 134.97 TX 1 4 1,749.09 1,749.09 437.27 UT 6 129 35,524.01 5,920.67 275.38 VA 2 98 19,348.52 9,674.26 197.43 WA 3 31 11,247.33 3,749.11 362.82 WY 4 50 20,926.43 5,231.61 418.53
Total 63 1129 585,322.3 127,119.6 State average 3.71 66.41 34,430.72 7,477.62 399.63
Pooled ordinary least squares estimated the I-Suite costs as a function of 54 ROSS categories for 63 fires and 1,127 fire-days and explained 96.4% of variation in I-Suite costs. The high explanatory power of this simple model corroborates that the ROSS resource use data and I-Suite data generally move together. Based on the estimated regression (available upon request), the predicted daily wildland fire management costs were then computed and plotted against the observed values (Figure 3). Fitted lines between the predicted and observed values can be compared against 1:1 to gauge overall prediction accuracy across individual fires. There exists variability in the predicted versus observed values as estimated from the pooled ordinary least squares regression across the sample fires. Fitted lines in red (gray in black and white printout) for several fires exhibited a strong divergence from the black line with 1:1 correspondence, suggesting a poor model performance. However, predicted values were in close agreement for many fires and for 36 of the 63 fires the correlation (r) between observed and predicted values was 0.9 or higher.
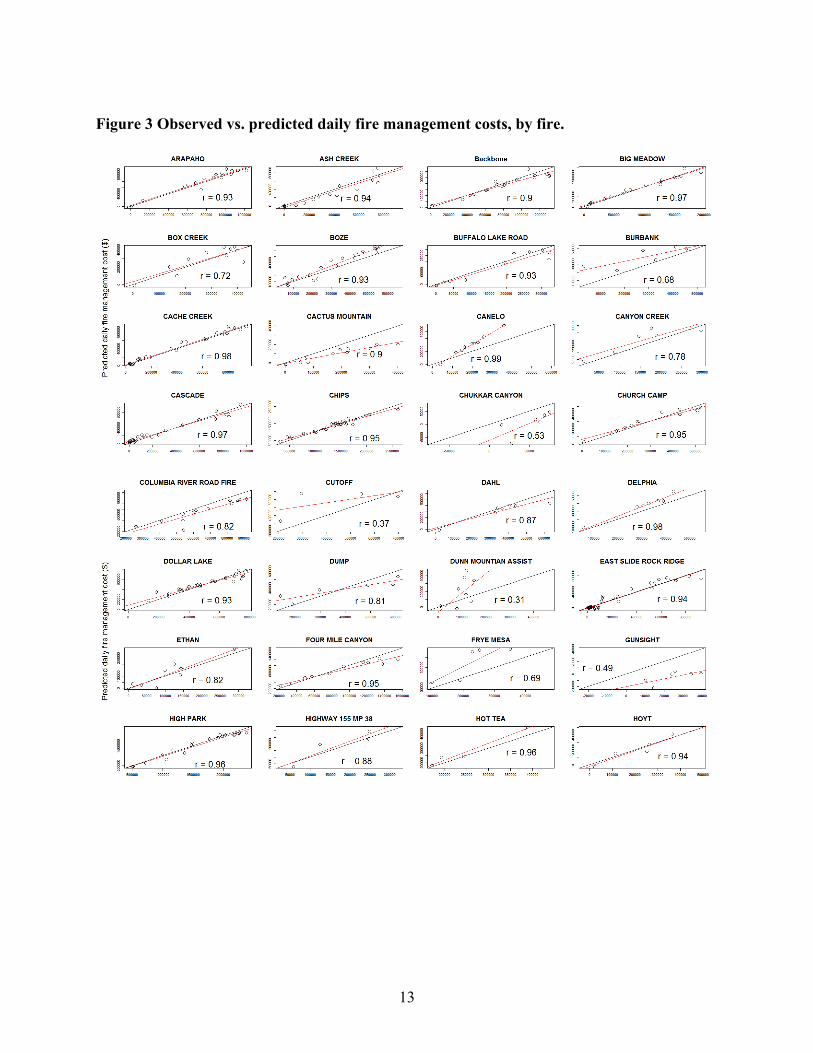
13
Figure 3 Observed vs. predicted daily fire management costs, by fire.

14
Figure 4, cont. Observed vs. predicted daily fire management costs, by fire.

15
Table 4 The count and proportion of sample days in which the predicted values from ROSS are within various absolute margins of error.
Absolute margin of error (%)
No. of sample days (% of total)
5 177 (15.7) 10 348 (30.9) 20 587 (52.1) 30 712 (63.2) 40 790 (70.1) 50 836 (74.2)
The predicted values were also summarized in terms of absolute margin of error (Table 4). Roughly three-quarters of the sample days exhibited predicted costs within 50% of the observed costs, but dropped to only 15.7% within five percent of the observed value. As a final part of the matching exercise, we use the ROSS-category predicted cost values in our suppression cost regression discussed in more detail above. The main estimation model is the same as above, with the replacement of the dependent variable with the ROSS-predicted costs:
ln !"!!_!"#$%&'#$_!"#$!" = !! + !!!"#!" + !!!!" + !!!!" + !!" !!" = !! + !!"
The results of that analysis are provided in the next section. These results should be viewed with caution since the dependent variable contains modeled values rather than real world observed values for costs.

16
Results and Discussion
Results from the Encounter Rates Analysis The likelihood of fuel treatments being encountered by a subsequent wildland fire is relatively low but varies across ecoregions of the CONUS. One principal critique of fuel treatments is that their benefits are rarely realized because of the low likelihood that an unplanned fire will encounter a previously treated area during its effective lifespan, though the rate and extent to which this occurs has remained largely unknown. We summarized encounters between recently completed fuel treatments on federal lands and subsequent wildland fires in terms of frequency, areal extent, and geography across ecoregions of the CONUS (Barnett et al. 2016). Across all ecoregions, 6.7% of fuel treatments implemented between 1999 and 2012 on federal lands were encountered by a subsequent fire by 2013. This rate, however, varied by ecoregion, with the highest encounter rates observed in the Southern California, Snake River Plain, and Mogollon Rim ecoregions (Figure 4, panel (d)). Figure 4 Distribution of (a) area burned, (b) treated area, (c) treated area burned, and (d) the encounter rates for each of the 67 ecoregions across the CONUS.
Source: Barnett et al. (2016) Figure 3. Encounter rates are particularly large for treatment units 200 ha or greater (Table 5) even though only 1.4 percent of treatment units are that large. Also, while treatment units that have been treated just once make up the vast majority of treatments (in number and area), those also have the smallest encounter rates (Table 6). Treatment units that were treated three or more times between 1999 and 2012 had the largest encounter rates. This seems to indicate the land managers’ success in strategically repeating treatments in areas where wildland fires are likely.

17
Table 5 Number of treatments, area treated, treated area burned and encounter rate by treatment unit size class.
Treatment unit size class (ha)
Number of treatments
Area treated (ha)
Treated area burned (ha)
Encounter rate (%)
0-5 74,966 99,547 6,331 6.8 5-10 21,809 158,899 9,718 6.5 10-25 24,156 374,289 21,107 6.2 25-50 8,125 281,081 15,543 6.8 50-100 3,755 259,466 13,981 7.2 100-200 1,753 244,308 11,783 8.1 200-500 1,122 352,008 23,844 10.9 500-1,000 503 352,731 23,907 15.5 1,000-5,000 276 498,034 61,382 21.4 > 5,000 18 184,486 28,690 50.0 Source: Barnett et al. (2016) Table 3. Table 6 Number of treatments, area treated, treated area burned and encounter rate by number of times treated.
Number of times treated
Number of treatments
Area treated (ha)
Treated area burned (ha)
Encounter rate (%)
1 85,337 2,178,223 152,405 5.2 2 32,955 461,365 42,889 7.9 3 12,143 126,897 17,985 11.3 4 3,992 25,021 2,206 13.3 ≥ 5 2,056 13,344 802 15.7 Source: Barnett et al. (2016) Table 4. Encounter rates tended to decrease with the age of the treatment (Figure 5). Fires most frequently encountered treatments within one year from treatment and nearly half of those encounters were with treatment units that had received two or more treatments during study period (1999-2012).

18
Figure 5 Encounter rate as a function of time since most recent treatment.
Note: Number of treatments represents the number of times an area was treated before being encountered by a subsequent fire. Source: Barnett et al. (2016) Figure 4.

19
Results from the Suppression Cost Regression Analysis Our manuscript, currently under review, provides the full regression results and discussion. Here we focus on the main variables of interest measuring the effects of a fire entering a fuel treatment or previous fire in different landscape contexts (low-population or low-treatment) or regions (east vs. west). For this discussion, collectively we call these variables “treatment variables” and report their coefficients in Table 7. Since these treatment variables are all dummy variables, their interpretation requires a transformation of 100 ∙ exp β − 1 because of the logarithmic form of the dependent variable (Wooldridge 2009). Encounters of wildland fires with previous fuel treatments are positively associated with daily fire management costs, at least in the western US comprising the majority of the sample fires. Days when the sample fires burned into a previous fuel treatment are associated with a 53.6% increase in daily management costs, or $306,005 when evaluated at the mean of daily management costs. The coefficient on the interaction variable RX*EAST is negative and statistically significant at p ≤ 0.01. Relative to days when a fire did not encounter a previous fuel treatment, daily management costs are associated with a 40.7% decrease in management costs on days when a fire encountered a previous fuel treatment in the eastern US. It is possible that fires located in the eastern US received a more passive management response when fires encountered treated areas in an effort to achieve land management objectives. Encounters of wildland fires with previously burned areas is positively associated with daily fire management costs, but the size of this effect is dependent on landscape context. Days when the sample fires burned into previously burned areas are associated with a 62.6% increase in daily management costs, or $353,387 when evaluated at the mean of daily suppression costs. In low-populated area this effect is much smaller (7.4%) but still positive. This result validates the idea that higher cost suppression resources are reserved for incidents that are within closer proximity to populated areas.

20
Table 7. Suppression cost regression results for treatment variables only.
(1) (2) Variables Ln(COST) Ln(COST) RX 0.254** 0.429* (0.099) (0.232) RX*LOWPOP 0.084 (0.306) RX*LOWRX -0.258 (0.416) RX*EAST -0.951** (0.417) FIRE 0.108 0.486*** (0.118) (0.159) FIRE*LOWPOP -0.415** (0.193) FIRE*LOWRX -0.522 (0.325) FIRE*EAST -0.244 (0.149) Observations 985 985 R-squared 0.652 0.663 Number of fires 56 56 Other coefficients removed for brevity (available upon request). Cluster robust standard errors (clustered by fire) in parentheses. *** p<0.01, ** p<0.05, * p<0.1

21
Results from the I-Suite to ROSS Data Matching Exercise The primary reason for the I-Suite to ROSS data matching exercise was to evaluate whether ROSS data can be used to accurately predict daily wildland fire management costs. While the overall model fit for the pooled ordinary least squares regression finds that ROSS category items explain a large percent of variation in I-Suite daily cost data, within individual fires prediction quality was variable as seen on Figure 3 and discussed above. In this section coefficient estimates from suppression cost regression analysis using I-Suite cost data are compared to the corresponding analysis using ROSS-predicted cost data as the dependent variable (Table 8). The samples for these regressions are restricted to the matched observations only with 101 fire-days’ observations for 3 fires lost due to no match with ROSS data. The estimated coefficients of the IMT variables exhibited similar signs but different magnitudes and statistical significance between the two models, while the sign and significance of the estimated coefficients for variables representing the biophysical environment had higher agreement. The lone exception for this group is the estimated coefficient for available energy per unit area (ERC), which was statistically insignificant in the ROSS model. Estimated coefficients for variables representing encounters with fuel treatments varied in statistical significance between the two models. Coefficient on RX is positive and statistically significant using observed I-Suite data as the dependent variable but insignificant when using predicted values from ROSS. The interaction term RX*EAST has a negative and statistically significant coefficient across models, but is larger in magnitude in the ROSS specification. Greater differences between the models existed with respect to the magnitude and significance of the estimated coefficients representing encounters with previously burned areas. The interaction term FIRE*EAST is more than double in absolute magnitude when using the predicted values from ROSS relative to the observed I-Suite data. Furthermore, the estimated coefficient for FIRE*LOWRX is not significant in the ROSS specification. Ultimately, given the constrained sample of fires the predicative capabilities of the ROSS data and their ability to supplement the I-Suite fire management cost data for our purposes were deemed insufficient. Prediction quality of daily fire management costs varied considerably within and between fires, and discrepancies regarding the magnitude and statistical significance of estimated model coefficients for variables of interest between suppression cost regression analysis using predicted and observed fire management cost data were discouraging. Therefore, we decided against using the ROSS data to predict daily wildland fire management costs for a greater sample of fires. This exercise, though, can be considered a pseudo-validation since the accuracy of the I-Suite data itself is not well understood by the fire science and management community.

22
Table 8 Comparing actual and predicted Ln(COST) regressions.
(1) (2) Variables
I-Suite Ln(COST)
ROSS-predicted Ln(COST)
IMT_2 -0.213 -0.015 (0.230) (0.215) IMT_3 -1.185*** -0.701*** (0.276) (0.231) IMT_4 -2.429*** -1.650*** (0.475) (0.329) IMT_LOCAL -3.146*** -2.444*** (0.631) (0.466) IMT_UC 0.110 0.544* (0.380) (0.313) POP 0.189** 0.178* (0.091) (0.103) REMOTE 0.103** 0.069* (0.044) (0.037) TOPO 0.005 -0.003 (0.009) (0.005) FUEL 0.051 0.032 (0.032) (0.057) ERC 0.016* 0.003 (0.009) (0.003) RX 0.443** 0.240 (0.182) (0.224) RX*LOWPOP 0.012 0.062 (0.252) (0.253) RX*LOWRX -0.160 0.144 (0.314) (0.445) RX*EAST -0.758** -1.024* (0.337) (0.579) FIRE 0.319** 0.513*** (0.129) (0.184) FIRE*LOWPOP -0.192 -0.276 (0.139) (0.201) FIRE*LOWRX -0.331** -0.496 (0.148) (0.461) FIRE*EAST -0.252** -0.595** (0.118) (0.260) Observations 884 884 R-squared 0.608 0.502 Number of fires 53 53 Cluster robust standard errors (clustered by fire) in parentheses. *** p<0.01, ** p<0.05, * p<0.1

23
Conclusions The use of national-scale, spatially explicit fuel treatment and wildland fire data was sufficient to achieve the main project goal of estimating the effect of a fire entering fuel treatments and previous fires on fire management costs. This study leveraged nationally consistent spatial datasets to describe the fire environment as well as the spatial distribution of fuel treatments and previously burned areas. Since an original project objective was to evaluate treatment effects across major ecosystem types, we were conscious to obtain high-quality data that was consistent across the entire CONUS. Prior to this project, no study had leveraged the LANDFIRE fuel treatment dataset containing spatial polygons of completed fuel treatments between 1999 and 2012. In contrast to naïve expectations, we found that encounters with fuel treatments and previously burned areas were associated with an increase in daily wildland fire management costs, likely because these areas were capitalized to increase suppression effectiveness in fuel-limited areas. Previous prospective evaluations of fuel treatment and previous fire effects on fire suppression costs have employed simulation frameworks to demonstrate significant reductions in suppression costs due to treatments (Thompson et al. 2013, Houtman et al. 2013). These approaches rely on the previously established correlation that fire size is positively associated with suppression expenditures, and therefore, decreases in future area burned due to treatments and previously burned areas are expected to reduce suppression costs. Existing suppression cost regression equations can be used to estimate the magnitude of the effect (Gebert et al. 2007). Because these approaches use aggregated, fire-level suppression cost data, the effect of fuel treatments on suppression costs may be masked because changes in suppression resource use and strategies as the fire progresses cannot be captured. In effect, previous studies have assumed a constant management strategy throughout the course of a fire, when it is likely that suppression effort changes as fires spread. To take advantage of fuel treatment’s ability to enhance suppression effectiveness, risk-averse fire managers may be compelled to allocate additional suppression resources to these areas to maximize the likelihood of containment. What remains unclear is whether the temporary increase in suppression effort and associated costs in treated or previously burned areas is offset by an overall reduction in the duration of an incident. Restricted access to historical daily fire management cost data remains a significant barrier to evaluating fire management decision-making. Although a formal appeal for daily fire management cost data was approved by individuals within the Forest Service’s National Incident Business Organization, we ultimately received a small fraction of fire management cost data relative to our original request. There remains no clearinghouse of historical financial data related to wildland fire management activities, and such a barrier prohibits robust evaluations of decision-making that can lead to improved future outcomes.
Implications for Management There exists an assumption within the wildland fire science and management community that investments in fuel treatments will result in decreased future fire management costs. In order for this to manifest, wildland fires must interact with fuel treatments during the lifespan that treatments remain effective. Our finding that 6.7% of treatments on federal lands between 1999 and 2012 were encountered by a subsequent fire by 2013, and that only 7.7% of the total treated area was burned by a subsequent fire through 2013, raises questions over the validity of such an

24
assumption. Low encounter rates may stem from three primary sources: 1) the stochastic nature of wildland fire in terms of occurrence and extent; 2) constraints on optimal fuel treatment locations; or 3) decisions to suppress unplanned ignitions prior to encounters with treatments. A better understanding of the drivers of the relatively low encounter rates observed in this study can help guide future wildland fire and fuels management decision-making. In addition, fuel treatments should encourage the use of less aggressive suppression responses in order to achieve reductions in fire management costs. Our finding that daily fire management costs are positively associated with encounters with fuel treatments and previously burned areas suggests that these areas may instead be used to facilitate suppression operations. Although this topic warrants further research, our results suggest that the expected negative feedback between treatments and subsequent fire management costs is limited to certain landscape contexts.
Implications for Future Research Although this project yielded insights into the potential effects of fuel treatments and previously burned areas on fire management costs, there are several natural research extensions that warrant investigation. An explicit consideration of the temporal dynamics and long-term interactions between fires and previous fuel treatments and burned areas is arguably the most critical need for a formal evaluation of fire and fuels management programs. A successful fuels management program is not necessarily one that achieves an immediate return on investment, but rather one that over time facilitates the use of fire to achieve land and resource management objectives (Reinhardt et al. 2008). It is plausible that the current rate of fuel treatment implementation and area burned by wildland fire is insufficient to effectively reduce landscape-level fire risk and expand the fire management decision-space (Barnett et al. 2016, Vaillant et al. 2017). A continued focus on strategic fuel treatment implementation coupled with capitalizing on low-risk opportunities to use unplanned ignitions to achieve land and resource management objectives is necessary to attain long-term reductions in wildland fire management costs. Because daily fire management cost data are only archived for incidents that were at some point managed by a Type 1 or Type 2 incident management team, the results from this project have a relatively limited scope of inference. It is highly plausible that this criterion restricted the analysis to fires where the overarching management objective was to minimize area burned, and therefore treatments and previously burned areas were leveraged to facilitate suppression operations. Myriad examples from wilderness and other areas where fire has been successfully managed suggest that past fires serve as important barriers to fire spread. In response, managers allocate fewer suppression resources to such areas. It is likely that we were unable to capture this expected feedback given the data restrictions. Lastly, future research should address the selection bias related to the likelihood a fire encounters a treatment or previously burned area. That is, the probability that a fire spreads into a treatment or previously burned area is not random, and therefore the estimated coefficients of interest from this study may be biased. In the program evaluation literature where non-experimental data are the norm, propensity score matching methods have proven to be an effective approach to construct quasi-control groups and overcome issues related to selection bias. This approach would be best implemented when evaluating aggregate fire cost rather than at the daily costs.

25
Literature Cited Agee, J.K, C.N. Skinner. 2005. Basic principles of forest fuel reduction treatments. Forest Ecology and Management 211(1-2): 83-96. Ager, A.A., N.M. Vaillant, A. McMahan. 2013. Restoration of fire in managed forests: A model to prioritize landscapes and analyze tradeoffs. Ecosphere 4(2): 1-19. Arno, S.F., J.K. Brown. 1991. Overcoming the paradox in managing wildland fire. Western Wildlands 17(1): 40-46. Barnett K., Parks S.A., Miller C., Naughton H.T. 2016. “Beyond fuel treatment effectiveness: characterizing interactions between fire and treatments in the US, Forests 7, 237. Calkin, D.E., M.P. Thompson, M.A. Finney. 2015. Negative consequences of positive feedbacks in US wildfire management. Forest Ecosystems 2(9): 10 pp. Collins, B.M., S.L. Stephens. 2007. Managing natural wildfires in Sierra Nevada wilderness areas. Frontiers in Ecology and the Environment 5(10): 523-527. Collins, B.M., S.L. Stephens, J.J. Moghaddas, J. Battles. 2010. Challenges and approaches in planning fuel treatments across fire-excluded forested landscapes. Journal of Forestry 108(1): 24-31. Gebert, K.M., A.E. Black. 2012. Effect of suppression strategies on federal wildland fire suppression expenditures. Journal of Forestry 110(2): 65-73. Gebert, K.M., D.E. Calkin, J. Yoder. 2007. Estimating suppression expenditures for individual large wildland fires. Western Journal of Applied Forestry 22(3): 188-196. Hand, M.S., H. Katuwal, D.E. Calkin, M.P Thompson. 2017. The influence of incident management teams on the deployment of wildfire suppression resources. International Journal of Wildland Fire 26(7): 615-629. Hessburg, P.F., D.J. Churchill, A.J. Larson, R.D. Haugo, C. Miller, T.A. Spies, M.P. North, N.A. Povak, R.T. Belote, P.H. Singleton, W.L Gaines, R.E. Keane, G.H. Aplet, S.L. Stephens, P. Morgan, P.A. Bisson, B.E. Rieman, R.B. Salter, G.H. Reeves. 2015. Restoring fire-prone Inland Pacific landscapes: seven core principles. Landscape Ecology 30(10): 1805-1835. Holsinger, L.M., S.A. Parks, C. Miller. 2016. Weather, fuels, and topography impede wildland fire spread in western US landscapes. Forest Ecology and Management 380: 59-69. Houtman, R.M., C.A. Montgomery, A.R. Gagnon, D.E. Calkin, T.G. Dietterich, S.McGregor, M. Crowley. 2013. Allowing a wildfire to burn: estimating the effect on future fire suppression costs. International Journal of Wildland Fire 22(7): 871-882.

26
Katuwal, H., C.J. Dunn, D.E. Calkin. 2017. Characterising resource use and potential inefficiencies during large-fire suppression in the western US. International Journal of Wildland Fire 26(7): 604-614. North, M.P., A. Brough, J. Long, B. Collins, P. Bowden, D. Yasuda, J. Miller, N. Sugihara. 2015. Constraints on mechanized treatment significantly limit mechanical fuels reduction extent in the Sierra Nevada. Journal of Forestry 113(1): 40-48. Parks, S.A. 2014. Mapping day-of-burning with coarse-resolution satellite fire-detection data. International Journal of Wildland Fire 23(2): 215-223. Parks, S.A., L.M. Holsinger, C. Miller, C.R. Nelson. 2015a. Wildland fire as a self-regulating mechanism: the role of previous burns and weather in limiting fire progression. Ecological Applications 25(6): 1478-1492. Parks, S.A., C. Miller, C.R. Nelson, Z.A. Holden. 2014. Previous fires moderate the severity of subsequent wildland fires in two large western US wilderness areas. Ecosystems 17(1): 29-42. Parks, S.A., C. Miller, L.M. Holsinger, L.S. Baggett, B.J. Bird. 2016. Wildland fire limits subsequent fire occurrence. International Journal of Wildland Fire 25(2): 182-190. Parks, S.A., C. Miller, M.A. Parisien, L.M. Holsinger, S.Z. Dobrowski, J. Abatzoglou. 2015b. Wildland fire deficit and surplus in the western United States. Ecosphere 6(12): 1–13. Radeloff V.C., Hammer R.B., Stewart S.I.; Fried J.S., Holcomb S.S., McKeefry J.F. 2005. The wildland-urban interface in the United States. Ecological Applications 15: 799-805. doi: 10.1890/04-1414. Reinhardt, E.D., R.E. Keane, D.E. Calkin, J.D. Cohen. 2008. Objectives and considerations for wildland fuel treatment in the forested ecosystems of the interior western United States. Forest Ecology and Management 256(12): 1997-2006. Schoennagel, T., J.K.Balch, H. Brenkert-Smith, P.E. Dennison, B.J. Harvey, M.A. Krawchuk, N. Mietkiewicz, P. Morgan, M.A. Moritz, R. Rasker, M.G. Turner, C. Whitlock. 2017. Adapt to more wildfire in western North American forests as climate changes. Proceedings of the National Academy of Sciences 114(18): 4582-4590. Thompson, M.P., N.A. Anderson. 2015. Modeling fuel treatment impacts on fire suppression cost savings: a review. California Agriculture 69(3): 164-170. Thompson, M.P., P. Freeborn, J.D. Rieck, D.E. Calkin, J.W. Gilbertson-Day, M.A. Cochrane, M.S. Hand. 2016. Quantifying the influence of previously burned areas on suppression effectiveness and avoided exposure: a case study of the Las Conchas Fire. International Journal of Wildland Fire 25(2): 167-181.

27
Thompson, M.P., J.R. Haas, M.A. Finney, D.E. Calkin, M.S. Hand, M.J. Browne, M. Halek, K.C. Short, I.C. Grenfell. 2015. Development and application of a probabilistic method for wildfire suppression cost modeling. Forest Policy and Economics 50: 249-258. Thompson, M.P, N.M. Vaillant, J.R. Haas, K.M. Gebert, K.D. Stockmann. 2013. Quantifying the potential impacts of fuel treatments on wildfire suppression costs. Journal of Forestry 111(1): 49-58. USFS. 2003. Healthy Forest Initiative: Fuels accomplishments. http://www.fs.fed.us/projects/hfi/May-2003/hfi-fuels-treatment-graphs.shtml USFS. 2009. Fire and aviation management fiscal year 2008 accountability report. Available online at www.fs.fed.us/fire/management/reports/fam_fy2008_ accountability_report.pdf; last accessed 9/28/2017. USDA, USDI. 2011. A national cohesive wildland fire management strategy. Washington, DC: Wildland Fire Leadership Council. 43 p. USFS. 2015. The rising cost of wildfire operations: Effects on the Forest Service’s non-fire work. Available online at www.fs.fed.us/sites/default/files/2015-Fire-Budget-Report.pdf; last accessed 8/31/17. USFS. 2016. Budget and performance. Available online at https://www.fs.fed.us/about-agency/budget-performance; last accessed 8/17/17. Vaillant, N.M., E.D. Reinhardt. 2017. An evaluation of the Forest Service hazardous fuels treatment program – are we treating enough to promote resiliency or reduce hazard? Journal of Forestry 115(4): 300-308. Wooldridge, J.M. 2009. Introductory econometrics: A modern approach. Mason, OH: South-Western Cengage Learning.

28
Appendix A: Contact Information for Key Project Personnel Principal Investigator: Helen T. Naughton Department of Economics University of Montana Missoula, MT 59812-5472 [email protected] Collaborators: Kevin Barnett Department of Economics University of Montana Missoula, MT 59812-5472 [email protected] Sean A. Parks Aldo Leopold Wilderness Research Institute Rocky Mountain Research Station USDA Forest Service, Missoula, MT 59801 [email protected] Carol Miller Aldo Leopold Wilderness Research Institute Rocky Mountain Research Station USDA Forest Service, Missoula, MT 59801 [email protected]
29
Appendix B: List of Completed/Planned Publications and Products 1. Articles in peer-reviewed journals:
• Kevin Barnett, Helen T. Naughton, Sean A. Parks, and Carol Miller. 2017. Forest fuel treatment and previous fire effects on daily fire management costs: a panel data analysis. In review.
• Kevin Barnett, Sean A. Parks, Carol Miller and Helen T. Naughton. 2016.Beyond fuel treatment effectiveness: characterizing interactions between fire and treatments in the US. Forests 7, 237.
• Winslow D. Hansen, F Stuart Chapin III, Helen T. Naughton, T. Scott Rupp and David Verbyla. 2016. Forest-landscape structure mediates effects of a spruce bark beetle (Dendroctonus rufipennis) outbreak on subsequent likelihood of burning in Alaskan boreal forest. Forest Ecology and Management 369: 38-46.
2. Technical reports: NA 3. Textbooks or book chapters: NA 4. Graduate thesis: NA 5. Conference or symposium proceedings scientifically recognized and referenced: NA 6. Conference presentations:
• Kevin Barnett, Helen T. Naughton, Sean A. Parks and Carol Miller, “Fuel treatment effects on large fire suppression costs,” a presentation at the National Cohesive Wildland Fire Management Strategy Workshop: All Hands, All Lands – Implementation Rooted in Science, Reno, NV, April 2017.
• Kevin Barnett, Helen T. Naughton, “Spatiotemporal evaluation of fuel treatment and previous fire effects on suppression costs,” Fuels Treatment Effectiveness: JFSP Workshop for Current Research, Preliminary Results and Implications, Portland, OR April 2016.
7. Posters: • Helen T. Naughton, Crystal S. Stonesifer, and Kevin Barnett, “Matching Daily Data on
Resource Use to Fire Suppression Costs,” National Cohesive Wildland Fire Management Strategy Workshop: All Hands, All Lands – Implementation Rooted in Science, Reno, NV, April 2017.
• Kevin Barnett, Helen T. Naughton, Sean A. Parks, and Carol Miller, “Encounter rates between fire and fuel treatments in the United States,” Wicked Problem, New Solutions: Our Fire, Our Problem, 5th International Fire Behavior and Fuels Conference, Portland, OR, April 2016.
8. Workshop/panel session organized: • Kevin Barnett, Karin Riley, Helen Naughton, and Matthew Thompson, “Fuel treatments
in theory and practice: science applications in support of the Cohesive Strategy,” a manager inclusive workshop session at the National Cohesive Wildland Fire Management Strategy Workshop: All Hands, All Lands – Implementation Rooted in Science, Reno, NV, April 2017.
9. Field demonstration/tour summaries: NA 10. Website development: NA 11. Webinars:
• Kevin Barnett. “Fuel treatments, wildland fires, and suppression costs,” a scheduled webinar with the Northern Rockies Fire Science Network, November 15, 2017.

30
Appendix C: Metadata The dataset used for the final analysis and corresponding metadata have been published at: Barnett, Kevin; Naughton, Helen T.; Parks, Sean A.; Miller, Carol. 2017. “Fuel treatment and
previous fire effects on daily fire management costs.” Fort Collins, CO: Forest Service Research Data Archive. https://doi.org/10.2737/RDS-2017-0050
Data Publication Abstract: This publication contains tabular data used to evaluate the effects of fuel treatments and previously burned areas on daily wildland fire management costs. The data represent daily Forest Service fire management costs for a sample of 56 fires that burned between 2008 and 2012 throughout the conterminous United States. Included in the data is a suite of spatially derived variables used to control for variation in daily fire management costs, including topography, fire weather, fuel loading, remoteness, and human populations-at-risk. These data were extracted using daily fire progression maps produced using the methods outlined in Parks (2014).