FINAL REPORT - JICAopen_jicareport.jica.go.jp/pdf/11699865_01.pdf · and the Base + Muara-Tower...
100
Japan International Cooperation Agency (JICA) Ministry of Energy and Mineral Resources (MEMR), The Republic of Indonesia Study on The Optimal Electric Power Development and Operation in Indonesia FINAL REPORT (Main Report) August, 2002 Chubu Electric Power Co,. INC. The Institute of Energy Economics, Japan MPN JR 02-128 No.
Transcript of FINAL REPORT - JICAopen_jicareport.jica.go.jp/pdf/11699865_01.pdf · and the Base + Muara-Tower...

Japan International Cooperation Agency (JICA) Ministry of Energy and Mineral Resources (MEMR), The Republic of Indonesia
Study on The Optimal Electric Power
Development and Operation
in Indonesia
FINAL REPORT
(Main Report)
August, 2002
Chubu Electric Power Co,. INC. The Institute of Energy Economics, Japan MPN
JR
02-128
No.


Japan International Cooperation Agency (JICA) Ministry of Energy and Mineral Resources (MEMR), The Republic of Indonesia
Study on The Optimal Electric Power
Development and Operation
in Indonesia
FINAL REPORT
(Main Report)
August, 2002
Chubu Electric Power Co,. INC. The Institute of Energy Economics, Japan


Preface
In response to the request from the Government of Republic of Indonesia, the
Government of Japan decided to conduct the Study on The Optimal Electric Power
Development and Operation in Indonesia, and the study was implemented by the Japan
International Cooperation Agency (JICA).
JICA sent to Indonesia a study team headed by Mr. Akihisa MIZUNO of Chubu
Electric Power Co., INC. and organized by Chubu Electric Power Co., INC. and The
Institute of Energy Economics, Japan four times from July 2001 to August 2002.
The team held discussions with the officials concerned of the Government of Republic
of Indonesia and conducted related field surveys. After returning to Japan, the study team
conducted further studies and compiled the final results in this report.
I hope this report will contribute to the promotion of the plan and to the enhancement of
friendly relations between our two countries.
I wish to express my sincere appreciation to the officials concerned of the Government
of Republic of Indonesia for their close cooperation throughout the study.
August 2002
Takao KAWAKAMI
President
Japan International Cooperation Agency

August 2002
Mr. Takao KAWAKAMI President Japan International Cooperation Agency Tokyo, Japan
Dear Mr. KAWAKAMI,
Letter of Transmittal
We are pleased to submit to you the report of Study on The Optimal Electric Power
Development and Operation in Indonesia. This study has been implemented by Chubu
Electric Power Co., INC. and The Institute of Energy Economics, Japan from July 2001
to August 2002 based on the contract with your Agency. This report presents the comprehensive proposal, such as the countermeasures against
the power deficit anticipated for the near future, the Optimal Power Development Plan for
the medium and long term considering political issues, Transmission Plan considering
appropriate placement of power plants and measures from technical, organizational and
institutional aspects in order to realize the above plans.
We trust that realization of our proposal will much contribute to sustainable
development of electric power sector, and will contribute strengthening of economic
fundamentals of Indonesia and improvement of the public welfare as well.
In view of the urgency to increase efficiency of power sector, we recommend that the
Government of Indonesia implement our proposal by applying result of technology
transfer in the study as a top priority. We wish to take this opportunity to express our sincere gratitude to your Agency, the
Ministry of Foreign Affairs and the Ministry of International Trade and Industry. We also
wish to express our deep gratitude to the Ministry of Energy and Mineral Resources,
PT-PLN (Persero) and other authorities concerned of the Government of Indonesia for
the close cooperation and assistance extended to us during our investigations and study. Very truly yours,
Akihisa MIZUNO Team Leader Study on The Optimal Electric Power Development and Operation in Indonesia
Contents List of Tables and Figures................................................................................................i
Abbreviation....................................................................................................................xii
Chapter 1 Preface
1.1 Background .................................................................................................. 1-1
1.2 The Target Regions and Purpose of the Study............................................... 1-2 1.3 Study Content............................................................................................... 1-2 1.4 Procedure of the Study ................................................................................. 1-5 1.5 Study Schedule ............................................................................................. 1-6 1.6 Working Group, PLN Study Team and JICA Study Team............................. 1-6
Chapter 2 Indonesian Economy and Energy demand
2.1 Indonesian Economy....................................................................................... 2-1
2.1.1 Background............................................................................................. 2-1
2.1.2 Asian Crisis and the Change in Economic Structure................................. 2-2
2.1.3 Latest Development with IMF and Subjects for the Future ...................... 2-8
2.1.4 Summary.................................................................................................. 2-9
2.2 Energy Policy in Indonesia ............................................................................. 2-11
2.2.1 Transition of Energy Policy ...................................................................... 2-11
2.2.2 Policy Issues of Energy Sector ................................................................. 2-14
2.2.3 Present Status of New Oil and Gas Law ................................................... 2-14
2.2.4 Electric Power Policy ............................................................................... 2-16
2.2.5 Outline of Energy related Laws and Regulations....................................... 2-17
2.2.6 Outline of Electric Power related Agencies............................................... 2-19
2.3 Energy Supply and Demand in Indonesia ......................................................... 2-22
2.3.1 Resources and Reserves ........................................................................... 2-22
2.3.2 Exploration of Primary Energy Resources ................................................ 2-28
2.3.3 Renewable Energy.................................................................................... 2-33
2.3.4 Outline of Current Situation of Energy Supply and Demand ..................... 2-36
2.3.5 Energy Balance Table and Energy Flow.................................................... 2-38
2.3.6 Historical Trend of Energy Supply and Demand ....................................... 2-41
2.4 Cross Country Analysis on Electricity Consumption........................................ 2-51
2.4.1 Electricity Consumption and Economic Activities..................................... 2-51
2.4.2 Electricity Intensity and Economic Level .................................................. 2-52
2.4.3 Electricity Elasticity with respect to GDP ................................................. 2-54

Chapter 3 National Electricity General Plan (RUKN)
3.1 Outline of National Electricity General Plan (RUKN) ...................................... 3-1
3.1.1 Objective of RUKN.................................................................................. 3-1
3.1.2 Responsible Agency ................................................................................. 3-1
3.1.3 Power Development ................................................................................. 3-1
3.1.4 Simulation Tool........................................................................................ 3-2
3.2 Demand Forecasting........................................................................................ 3-4
3.3 Supply Capacity.............................................................................................. 3-7
3.3.1 Supply Capacity of Existing Power Units.................................................. 3-7
3.3.2 Power Development Plan ......................................................................... 3-8
3.3.3 Generation Reserve Margin (GRM).......................................................... 3-10
3.3.4 Fuel Consumption Plan and Financing Plan............................................... 3-11
Chapter 4 Electricity Demand Forecast in Java-Bali Region
4.1 Historical Trend Economic Activity and Electricity Demand............................ 4-1
4.1.1 Historical Trend of Economic Activities (RGDP, Regional GDP) ............. 4-1
4.1.2 Electricity Price........................................................................................ 4-5
4.1.3 Electricity Demand................................................................................... 4-7
4.1.4 Factor Analysis on Electricity Demand Contributor .................................. 4-10
4.2 Electricity Demand Forecasting Model............................................................ 4-15
4.2.1 Energy Models Applied in Indonesia......................................................... 4-15
4.2.2 Electricity Demand Forecasting Model ..................................................... 4-16
4.2.3 Model Structure and Data Source............................................................. 4-19
4.3 Forecasted Electricity Demand by Sector ........................................................ 4-24
4.3.1 Scenario ................................................................................................... 4-24
4.3.2 Short-Medium Term Electricity Demand Forecasted Results (2001-2010) 4-25
4.3.3 Long Term Electricity Demand Forecasted Results (2001-2015) .............. 4-27
4.4 Electricity Demand by Sub-Region.................................................................. 4-30
4.4.1 RGDP by Sub-Region (Area) ................................................................... 4-30
4.4.2 Electricity Demand by Sub-Region (Area) ................................................ 4-35
4.5 Examples of Model Application....................................................................... 4-45
4.5.1 Household Electrification ......................................................................... 4-45
4.5.2 Energy Conservation Case........................................................................ 4-47
4.5.3 Captive Power.......................................................................................... 4-49

Chapter 5 Probability of Power Deficit - Short Term Development Plan -
5.1 Review of the Supply Capacity........................................................................ 5-1
5.1.1 Review of the Derated Capacity covered by GRM.................................... 5-2
5.1.2 Review of the Constrained Capacity not covered by GRM........................ 5-7
5.1.3 Ongoing / Planned Projects....................................................................... 5-11
5.1.4 Fuel Supply Issues.................................................................................... 5-16
5.2 Probability of Power Deficit ............................................................................ 5-21
5.2.1 Demand Scenario ..................................................................................... 5-21
5.2.2 Supply Scenario ....................................................................................... 5-21
5.2.3 Sensitive Study for Demand-Supply Plan.................................................. 5-28
5.2.4 Probability of Power Deficit ..................................................................... 5-32
Supplementary Discussion:
Comparison of Merits Between the Base + Muara-Tower BlockⅡ Case
and the Base + Muara-Tower BlockⅢ Case ......5-34
Chapter 6 Short-term Countermeasures against Power Deficit
6.1 Effective Operation of Existing Facilities ......................................................... 6-1
6.1.1 Fuel Supply .............................................................................................. 6-1
6.1.2 Reduction of Forced Outage Rate............................................................. 6-2
6.1.3 Proper Repair and Inspection of Adjustment of periodical Inspection........ 6-2
6.1.4 Rehabilitation ........................................................................................... 6-4
6.1.5 Improvement of Operation ....................................................................... 6-5
6.2 Operational Control of a Power System under Power Deficit........................... 6-6
6.2.1 Brown Out ............................................................................................... 6-6
6.2.2 Rotational Black Out................................................................................ 6-6
6.2.3 Demand-side measures ............................................................................. 6-7
6.3 Short-Term Countermeasures against Power Deficit........................................ 6-8
6.3.1 Effects of Short-Term Countermeasures................................................... 6-8
6.3.2 Effect to the Power System Reliability...................................................... 6-9
Chapter 7 Optimal Power Development Plan -Long Term Development Plan-
7.1 Screening Curve Analysis ................................................................................ 7-2
7.1.1 Load Duration Curve ............................................................................... 7-2
7.1.2 Load Factor ............................................................................................. 7-3
7.1.3 Screening Curve Analysis ......................................................................... 7-5
7.2 Optimal Power Development Plan................................................................... 7-7
7.2.1 Base Case Study....................................................................................... 7-7
7.2.2 Sensitive Studies ...................................................................................... 7-16
7.2.3 Issues to be addressed for the Power Development Plan ........................... 7-30
7.3 Study on Optimal Power Component Ratio ..................................................... 7-33
7.3.1 Component Ratio to realize the Least Cost Development.......................... 7-33
7.3.2 Trial Calculation of Target Power Mixture in Long Term ......................... 7-35
Supplementary Discussion 1: Outline of WASP-IV ...................................................... 7-41
Supplementary Discussion 2:
Study on Adequate Proportion of Pumped Storage Power in Optimal Power Development .... 7-45
Chapter 8 Transmission Planning and System Analysis
8.1 Current State and Problems of the Java Bali System........................................ 8-1
8.1.1 Introduction ............................................................................................. 8-1
8.1.2 Reliability in the Java Bali System............................................................. 8-3
8.1.3 Transmission and Distribution Losses ....................................................... 8-3
8.1.4 State of System Operation in the Java Bali System.................................... 8-4
8.1.5 Protective Relay and Telecommunication Facilities ................................... 8-6
8.2 PLN Transmission Planning............................................................................. 8-7
8.2.1 Criteria of PLN for Transmission Planning................................................ 8-7
8.2.2 PLN Transmission Planning...................................................................... 8-7
8.3 Transmission Planning (Short-term) ................................................................ 8-11
8.3.1 Programs and Conditions for System Analysis .......................................... 8-11
8.3.2 Transmission of the Power Stations in East Java and Tanjung Jati B ......... 8-12
8.3.3 Transmission Planning for Repowering at the Muara Karang Power Station... 8-18
8.3.4 Transmission Planning for Muara Tawar Power Station............................ 8-22
8.3.5 Short Circuit Capacity.............................................................................. 8-24
8.3.6 Frequency ................................................................................................ 8-25
8.3.7 Conclusions and Recommendations .......................................................... 8-26
8.4 Transmission Planning (Mid- and Long-term).................................................. 8-29
8.4.1 Demand Forecasts.................................................................................... 8-29
8.4.2 Power Development Plan ......................................................................... 8-29
8.4.3 Study Cases.............................................................................................. 8-31
8.4.4 Conditions................................................................................................ 8-34
8.4.5 Study Results ........................................................................................... 8-35
8.4.6 Conclusions and Recommendations .......................................................... 8-54
Chapter 9 Rehabilitation Plan of Thermal Power Plant
9.1 Summary......................................................................................................... 9-1
9.2 Status of Facilities........................................................................................... 9-4
9.3 Focus of Rehabilitation.................................................................................... 9-7

9.4 Selection of Measures to Improve Thermal Efficiency ..................................... 9-8
9.5 Examination of Application of Thermal Efficiency Improvement Measures...... 9-12
9.5.1 Cleaning of Feed Water Heater Tubes ...................................................... 9-12
9.5.2 Boiler Chemical Cleaning ......................................................................... 9-15
9.5.3 Improving High and Intermediate-Pressure Turbine Blades....................... 9-16
9.5.4 Replacement of Air Preheater Element and Seal........................................ 9-19
9.6 Conclusion...................................................................................................... 9-20
Chapter 10 Environmental Measures
10.1 Environmental Regulations and Standards ..................................................... 10-1
10.2 Current Environmental Measures taken by Thermal Power Plants.................. 10-3
10.3 Proposals to Improve Environment ............................................................... 10-4
10.3.1 Environmental Measures against Problems of Thermal Power Plants....... 10-4
10.3.2 Environmental Protection Measures for Promoted Use of Coal
in Thermal Power Plants..... 10-5
Chapter 11 Institutional and Organizational Recommendation for the Optimal
Electric Power Development Plan and the Stable Power Supply
11.1 Lessons from the California Power Crisis to the Power Sector
Liberalization in Indonesia.................. 11-2
11.1.1 Present Situation of Power Sector Liberalization in Indonesia ................. 11-2
11.1.2 Lessons from the California Power Crisis................................................ 11-4
11.1.3 Institutional Measures in Other Countries ............................................... 11-6
11.2 System for Power Supply Bidding with a view to Power Supply Composition..... 11-12
11.2.1 Problems in Past Invitations to IPPs in Indonesia .................................... 11-12
11.2.2 Japan’s Wholesale Power Bidding System .............................................. 11-12
11.2.3 Power Source Bidding System taking Power Source Composition into account . 11-15
11.3 An Approach to Power Development Supporting System in line with Energy Policy.. 11-17
11.3.1 Introduction of New and Renewable Energy Sources.............................. 11-17
11.3.2 Introduction of Clean Development Mechanism(CDM) .......................... 11-19
11.4 Utilization of Captive Power ......................................................................... 11-22
11.4.1 Present Status of Captive Power............................................................. 11-22
11.4.2 Demand of Captive Power with a Fluctuation of Price of Electricity and Fuel..... 11-24
11.4.3 Recommendations .................................................................................. 11-25
11.5 Utilization of Demand Side Management (DSM)........................................... 11-26
11.5.1 The Outline of DSM............................................................................... 11-26
11.5.2 Characterization of Power Demand in Indonesia ..................................... 11-26
11.5.3 Past DSM Program and Current Status................................................... 11-28

11.5.4 DSM Practices in Other Countries .......................................................... 11-30
11.5.5 Analysis of the Issues and Recommendations......................................... 11-33
11.6 Financial Enhancement of PLN...................................................................... 11-35
11.6.1 Financial Analysis ................................................................................... 11-35
11.6.2 Analysis of Financial Structure in PLN.................................................... 11-42
11.6.3 A Factor Analysis of Revenue................................................................. 11-45
11.6.4 Operational Efficiency Improvements and Efficiency Drive Program (EDP) ..... 11-51
11.6.5 Challenges and Proposals ....................................................................... 11-54
11.7 Measures to Promote Private Investment....................................................... 11-57
11.7.1 Effects of Liberalizing Indonesian Electricity Market .............................. 11-57
11.7.2 Measures and Problems of New Private Investment into Indonesia ......... 11-58
11.7.3 Risk Management for Inviting Investment............................................... 11-60
11.7.4 Measures to Invite Private Investment into Indonesian
Electricity Market .......................... 11-62
11.7.5 New Business Model.............................................................................. 11-64
11.8 Technical Cooperation Programs................................................................... 11-72
11.8.1 Technical Cooperation for the Promotion of Electric Power Development......... 11-72
11.8.2 Operation and Maintenance of Existing facilities ..................................... 11-73
11.8.3 Demand Side Management (DSM) ......................................................... 11-74

i
List of Tables and Figures
List of Figures
Figures Description Page
Chapter 2
Figure 2.1.1 The Asian Crisis and the Devaluation of Currency by Country ............. 2-2
Figure 2.1.2 Real GDP and the Components by Industry ......................................... 2-3
Figure 2.1.3 The Impact of Asian Crisis on Indonesia by Industry............................ 2-4
Figure 2.1.4 Governmental Deficit/Surplus .............................................................. 2-4
Figure 2.1.5 Consumer Price Index and the Inflation................................................ 2-5
Figure 2.1.6 CPI vs Electricity Price and the Scenario up to 2005............................ 2-5
Figure 2.1.7 Use of IMF Credit ............................................................................... 2-6
Figure 2.1.8 Import/Export ..................................................................................... 2-7
Figure 2.2.1 Restructuring of Energy Policy in Indonesia......................................... 2-12
Figure 2.2.2 Organization Chart of MEMR ............................................................. 2-20
Figure 2.2.3 Organization Chart of PLN.................................................................. 2-21
Figure 2.3.1 Distribution of Coal Reserves in Indonesia ........................................... 2-26
Figure 2.3.2 Ash Content of Indonesian Coal........................................................... 2-27
Figure 2.3.3 Sulfur Content of Indonesian Coal ....................................................... 2-27
Figure 2.3.4 Speculative Survey Area...................................................................... 2-31
Figure 2.3.5 Oil and Gas Exploration Area .............................................................. 2-31
Figure 2.3.6 Share of PER by Source ...................................................................... 2-36
Figure 2.3.7 Share of FEC by Source ...................................................................... 2-36
Figure 2.3.8 Schematic Energy Flow in Indonesia.................................................... 2-39
Figure 2.3.9 Block Diagram of Energy Flow by Energy Carrier (1999).................... 2-40
Figure 2.3.10 Historical Trends of GDP and Energy Indicators.................................. 2-41
Figure 2.3.11 Historical Trends of Energy Supply and Demand in Indonesia.............. 2-42
Figure 2.3.12 Historical Trend of Primary Energy Production by Energy Carrier ....... 2-42
Figure 2.3.13 Historical Trend of Crude Oil Production and Export/Import ............... 2-43
Figure 2.3.14 Historical Trend of Natural Gas Production and Export ....................... 2-44
Figure 2.3.15 Historical Trend of Coal Production and Export .................................. 2-44
Figure 2.3.16 (a) Historical Trend of Primary Energy Supply by Source........................ 2-45
Figure 2.3.16 (b) Historical Trend of Primary Energy Supply Structure......................... 2-45
Figure 2.3.17 (a) Historical Trend of Final Energy Consumption by Sector ................... 2-46
Figure 2.3.17 (b) Historical Trend of Final Energy Consumption Structure by Sector.... 2-46
Figure 2.3.18 (a) Historical Trend of Final Energy Consumption by Source .................. 2-47
Figure 2.3.18 (b) Historical Trend of Final Energy Consumption Structure by Source... 2-47
Figure 2.3.19 Historical Trend of Electricity Consumption by Sector......................... 2-48
Figure 2.3.20 Power Generation by Source (PLN)..................................................... 2-49

ii
Figure 2.3.21 Historical Trend of Fuel Consumption by PLN..................................... 2-50
Figure 2.4.1 The Relationship between Electricity Consumption and Economic Size ......... 2-51
Figure 2.4.2 The Relationship between Electricity Intensity and Economic Level..... 2-52
Figure 2.4.3 Electricity Intensity and Economic Level in selected ASEAN Countries......... 2-53
Chapter 3
Figure 3.2.1 The trend of electric demand from year 1988 to 2000 in Java-Bali ....... 3-5
Figure 3.2.2 Java-Bali Daily Load Curves on Peak Day (1990-2000) ....................... 3-6
Chapter 4
Figure 4.1.1(a) Historical Trend of RGDP in the Java-Bali Region................................4-2
Figure 4.1.1(b) Historical Trend of RGDP Structure in the Java-Bali Region ................4-2
Figure 4.1.2(a) Historical Trend of RGDP by Sector in the Java-Bali Region ................4-3
Figure 4.1.2(b) Historical Trend of RGDP Structure by Sector in the Java-Bali Region..........4-3
Figure 4.1.3(a) Historical Trend of RGDP by Sub-Region ............................................4-4
Figure 4.1.3(b) Historical Trend of RGDP Structure by Sub-Region .............................4-4
Figure 4.1.4(a) Historical Trend of Nominal Electricity Price ........................................4-5
Figure 4.1.4(b) Historical Trend of Real Electricity Price ..............................................4-6
Figure 4.1.5 Historical Trends of CPI and WPI.........................................................4-6
Figure 4.1.6(a) Historical Trend of Electricity Demand by Sector (Java-Bali)................4-7
Figure 4.1.6(b) Historical Trend of Electricity Demand Structure (Java-Bali) ................4-8
Figure 4.1.7 Historical Trend of Peak Load in the Java-Bali System .........................4-9
Figure 4.1.8 Historical Trend of Electricity Demand and Real Price in Java-Bali Region ....4-10
Figure 4.1.9(a) Factor’s Contribution to Electricity Consumption .................................4-11
Figure 4.1.9(b) Factor’s Contribution Ratio to Electricity Consumption........................4-11
Figure 4.1.10 Factor’s Contribution to Electricity Consumption .................................4-12
Figure 4.1.11 Factor Analysis by Sector .....................................................................4-13
Figure 4.2.1 Schematic Diagram of Proposed Model ................................................4-18
Figure 4.2.2 Framework of Electricity Demand Sub-Block .......................................4-19
Figure 4.2.3 Framework of Power Generation Sub-Block.........................................4-22
Figure 4.3.1 Forecasted Peak Load...........................................................................4-26
Figure 4.3.2 Electricity Demand by Sector (JICA/LPE Case 1 &Case 2)...................4-29
Figure 4.3.3 Electricity Demand Structure by Sector (Case 1) ..................................4-29
Figure 4.4.1 Concept of Regional Demand Shift .......................................................4-30
Figure 4.4.2 RGDP by Area .....................................................................................4-31
Figure 4.4.3 RGDP in the Jakarta Area.....................................................................4-32
Figure 4.4.4 RGDP in the West Java Area ................................................................4-32
Figure 4.4.5 RDP in the Central Java Area ...............................................................4-33
Figure 4.4.6 RGDP in the East Java Area .................................................................4-34
Figure 4.4.7 RGDP in the Bali Area .........................................................................4-35

iii
Figure 4.4.8 Electricity Demand by Area (JICA/LPE Case 1) ...................................4-36
Figure 4.4.9 Peak Load by Area (JICA/LPE Case 1 and Case 2)...............................4-37
Figure 4.4.10 Forecasted Electricity Demand by Sub-Region......................................4-40
Figure 4.4.11 Electricity Demand by Sector in the Jakarta Area..................................4-41
Figure 4.4.12 Electricity Demand by Sector in the West Java Area .............................4.42
Figure 4.4.13 Electricity Demand by Sector in the Central Java Area..........................4-43
Figure 4.4.14 Electricity Demand by Sector in the East Java Area ..............................4-43
Figure 4.4.15 Electricity Demand by Sector in the Bali Area.......................................4-44
Figure 4.5.1 Household Electrification by Scenario...................................................4-46
Figure 4.5.2 Electricity Demand in the Java-Bali Region(Case 1 and the Energy Conservation Case) . 4-48
Figure 4.5.3 Peak Load in the Java-Bali Region(Case 1 and the Energy Conservation Case) .......4-48
Figure 4.5.4 Installed Capacity, Utilized Capacity and Utilization Ratio (Indonesia) ..........4-49
Figure 4.5.5 Captive Power Generation in Indonesian and in the Java-Bali Region....4-50
Figure 4.5.6 Captive Power Generation Forecast by Scenario ...................................4-52
Figure 4.5.7 Electricity Demand Total in the Java-Bali Region (Scenario 1)..............4-53
Chapter 5
Figure 5.1.1 The Java-Bali System in 2001 ...............................................................5-9
Figure 5.1.2 Power Flow Diagram of Java-Bali System in 2001................................5-10
Figure 5.1.3 Overall Project Schedule of Muara Karang Repowering........................5-11
Figure 5.1.4 Overall Project Schedule of Muara-Tawar Block Ⅲ,Ⅳ Extension ........5-12
Figure 5.1.5 Overall Project Schedule of Muara-Tawar Block Ⅱ Added on .............5-13
Figure 5.1.6 Natural Gas Supply Plan in Pertamina ...................................................5-19
Figure 5.2.1 The relation ship among %ESR,%OSR and %LOLP(2004,2005) .........5-26
Chapter 7
Figure 7.1.1 Load Duration Curve in 2000 ...............................................................7-2
Figure 7.1.2 Load Shapes in Thailand .......................................................................7-4
Figure 7.1.3 Screening Curve Analysis .....................................................................7-5
Figure 7.2.1 Trend of Installed Capacity (Demand:JICA CASE2).............................7-11
Figure 7.2.2 Trend of Power Procuction (Demand:JICA CASE2).............................7-12
Figure 7.2.3 Duration of Power Generation (in 2015)...............................................7-12
Figure 7.2.4 Trend of Gas Consumption(Fuel Price Increase Scenario).....................7-18
Figure 7.2.5 Trend of Coal Consumption (Fuel Price Increase Scenario)...................7-18
Figure 7.2.6 Trend of Gas Consumption (Power Development Limited Scenario).....7-23
Figure 7.2.7 Trend of Coal Consumption (Power Development Limited Scenario)....7-23
Figure 7.2.8 Trend of Gas Consumption (Environmental Scenario)...........................7-27
Figure 7.2.9 Trend of Coal Consumption (Environmental Scenario) .........................7-27
Figure 7.2.10 Composition of Coal Reserve by Type ..................................................7-31
Figure 7.3.1 Component Ratio to Realize the Least Cost Development.....................7-34

iv
Figure 7.3.2 Trend of Gas Consumption (Primary Energy Case) ...............................7-37
Figure 7.3.3 Trend of Coal Consumption (Primary Energy Case)..............................7-37
Figure 7.3.4 Component Ratio of Power Sources in Long-Term (Trial Calculation) ...........7-39
Figure 7.S.1 The calculation Flow of WASP-IV .......................................................7-43
Figure 7.S.2 Proportion of Pumped Storage Power...................................................7-50
Figure 7.S.3 Proportion and Unit Construction Cost of Pumped Storage Power .......7-50
Chapter 8
Figure 8.3.1 In 2002 (No southern 500kV transmission lines) .................................. 8-12
Figure 8.3.2 In 2002 (Operation of one circuit between Paiton and Klaten).............. 8-13
Figure 8.3.3 In 2003 (Operation of two circuits between Paiton and Klaten)............ 8-14
Figure 8.3.4 In 2003 (Double π connection at Cirebon) ......................................... 8-14
Figure 8.3.5 In 2004 (Operation of entire southern 500kV transmission lines).......... 8-15
Figure 8.3.6 In 2005 (Operation of Tanjung Jati B: Connected to the northern line). 8-16
Figure 8.3.7 In 2005 (Operation of Tanjung Jati B: Connected to Ungaran)............. 8-16
Figure 8.3.8 Delay of southern transmission lines (Operation of Tanjung Jati B: one unit) ... 8-17
Figure 8.3.9 Delay of southern transmission lines (Operation of Tanjung Jati B: two units).. 8-17
Figure 8.3.10 Normal condition (Peak in 2007) ......................................................... 8-19
Figure 8.3.11 Normal condition (Off-peak in 2007) ................................................... 8-20
Figure 8.3.12 Expansion of Block Ⅱ(Peak in 2007) .................................................. 8-22
Figure 8.3.13 Extension of Block Ⅲ(Peak in 2007)................................................... 8-22
Figure 8.3.14 Expansion of Block Ⅱand Extension of Block Ⅲ(Without measure) ... 8-23
Figure 8.3.15 Expansion of Block Ⅱand Extension of Block Ⅲ(With measure) ........ 8-23
Figure 8.3.16 Short Circuit Current (2007)................................................................ 8-24
Figure 8.3.17 Characteristic of frequency in Java Bali system .................................... 8-25
Figure 8.4.1 Demand Forecast in each area.............................................................. 8-30
Figure 8.4.2 Power Flow Diagram of Java-Bali system (2010 Balance case) ............ 8-36
Figure 8.4.3 Power Flow Diagram of Java-Bali system (2010 West case) ................ 8-37
Figure 8.4.4 Power Flow Diagram of Java-Bali system (2010 East case).................. 8-38
Figure 8.4.5 Power Flow Diagram of Java-Bali system (2010 East case2 (+1200MW at Paiton))... 8-39
Figure 8.4.6 Power Flow Diagram of Java-Bali system (2010 Heavy-east case : without measures). 8-40
Figure 8.4.7 Power Flow Diagram of Java-Bali system (2010 Heavy-east case : with measures)..... 8-41
Figure 8.4.8 Power Flow Diagram of Java-Bali system (2015 Balance case) ............ 8-42
Figure 8.4.9 Power Flow Diagram of Java-Bali system (2015 West case) ................ 8-43
Figure 8.4.10 Power Flow Diagram of Java-Bali system (2015 East case).................. 8-44
Figure 8.4.11 Power Flow Diagram of Java-Bali system (2015 East case2 (+ 1200MW at Paiton)).. 8-45
Figure 8.4.12 Power Flow Diagram of Java-Bali system (2015 Heavy-east case : without measures). 8-46
Figure 8.4.13 Power Flow Diagram of Java-Bali system (2015 Heavy-east case : with measures)..... 8-47

v
Chapter 9
Figure 9.5.1 Schematic of cleaning with sponge....................................................... 9-12
Figure 9.5.2 Schematic of cleaning with high-pressure jet ....................................... 9-12
Figure 9.5.3 Transition of improved efficiency and profit by LP-HTR cleaning with sponge .... 9-13
Figure 9.5.4 Transition of improved efficiency and profit by HP-HTR cleaning
with high-pressure jet .. 9-13
Figure 9.5.5 Cause of internal loss of turbine .......................................................... 9-16
Figure 9.5.6 Improving blade top seal...................................................................... 9-16
Figure 9.5.7 Improving blade shape ......................................................................... 9-16
Figure 9.5.8 Turbine efficiency improvement (relative value) ................................... 9-17
Figure 9.5.9 Transition of improved efficiency and profit ......................................... 9-17
Chapter 10
Figure 10.3.1 Merits of conversion from a subcritical to supercritical plant
(Calculation for a Model Plant).......... 10-8
Chapter 11
Figure 11.2.1 Example of a bidding schedule ............................................................. 11-13
Figure 11.4.1 Captive Installed Capacity by Type of Plants ....................................... 11-22
Figure 11.4.2 Captive Installed Capacity by Sector.................................................... 11-22
Figure 11.5.1 Trend of daily load curve ..................................................................... 11-27
Figure 11.5.2 Tentative project structure (as of February 2002)................................ 11-29
Figure 11.5.3 Annual Load Adjustment Contract....................................................... 11-32
Figure 11.5.4 Interruptible Load Adjustment Contract............................................... 11-32
Figure 11.6.1 Breakdown of Operational Expenses.................................................... 11-40
Figure 11.6.2 Analysis result of factors of revenue changes ....................................... 11-46
Figure 11.6.3 Growth rate of sales by sector.............................................................. 11-47
Figure 11.6.4 Results of PLN’s Income and Operational Expense Predictions
(with no structural change)....... 11-48
Figure 11.6.5 Results of PLN’s Income and Operational Expense Predictions
(with structural changes) ....... 11-50
Figure 11.6.6. Comparison of Average Tariffs ............................................................ 11-56
Figure 11.7.1 Model of Establishing Special-purpose Company................................. 11-66

vi
List of Tables
Tables Description Page
Chapter 2
Table 2.1.1 Economic indicators ............................................................................ 2-10
Table 2.2.1 Electricity Pricing Schedule ................................................................. 2-19
Table 2.3.1 Reserves and Production of Crude Oil ................................................. 2-22
Table 2.3.2 Distribution of Hydrocarbon Reserves ................................................. 2-23
Table 2.3.3 Reserves and Resources of Oil and Natural Gas ................................... 2-23
Table 2.3.4 Oil and Gas Production by Major Producers ........................................ 2-23
Table 2.3.5 Reserves and Production of natural Gas............................................... 2-24
Table 2.3.6 Reserves and Production of Coal ......................................................... 2-25
Table 2.3.7 Indonesian Coal Resources .................................................................. 2-26
Table 2.3.8 New Discoveries and Fields Coming on Line ....................................... 2-29
Table 2.3.9 Discoveries and Production of Oil and natural Gas Field ...................... 2-30
Table 2.3.10 Hydropower Potential in Indonesia ...................................................... 2-33
Table 2.3.11 Hydropower Development Plan in Java-Bali Area................................ 2-34
Table 2.3.12 Geothermal Power Potential in Indonesia............................................. 2-34
Table 2.3.13 Geothermal Power Development Plan in Java-Bali Area....................... 2-35
Table 2.3.14 Energy Balance Table in 1999.............................................................. 2-38
Table 2.3.15 Average Growth Rate of Electricity Consumption by Sector ................ 2-48
Table 2.3.16 Brevity Code Name by Power Source.................................................. 2-49
Table 2.4.1 Electricity Consumption per Capita in selected ASEAN Countries ....... 2-53
Table 2.4.2 Electricity Elasticity in selected ASEAN Countries .............................. 2-54
Chapter 3
Table 3.1.1 Demand-Supply plan of RUKN as of October 2001 (Java-Bali System) .....3-3
Table 3.2.1 Demand Forecast in RUKN ..................................................................3-4
Table 3.3.1 Installed Capacity by Type and Location (unit: MW) ............................3-7
Table 3.3.2 Installed Capacity by Fuel type..............................................................3-8
Table 3.3.3 Installed Capacity by Owner ................................................................3-8
Table 3.3.4 Required Capacity by Type of Power Source ........................................3-10
Table 3.3.5 Generation Reserve Margin of RUKN ..................................................3-10
Table 3.3.6 Production Plan / Fuel Consumption Plan of RUKN .............................3-11
Table 3.3.7 Financing Plan in RUKN.......................................................................3-12
Table 3.3.8 Construction Cost for Transmission system...........................................3-12
Chapter 4
Table 4.1.1 Average Growth Rate of Electricity by Sector during each Period.........4-8
Table 4.1.2 Load Factor and Total Losses in the Java-Bali System..........................4-8
Table 4.1.3 Number of Customer and Electricity Consumption per Customer..........4-14

vii
Table 4.2.1 Outline of Models.................................................................................4-15
Table 4.2.2 Base Year and Observation Year ..........................................................4-23
Table 4.3.1 Characteristics of Scenario (JICA/LPE) ................................................4-24
Table 4.3.2 Price Scenario (JICA/LPE Case 1)........................................................4-24
Table 4.3.3 Detailed Scenario (JICA/LPE and PLN) ...............................................4-25
Table 4.3.4 Summary of Simulation Results ............................................................4-26
Table 4.3.5 Outline of Simulation Results................................................................4-27
Table 4.3.6 Forecasted Peak Load (JICA/LPE) .......................................................4-28
Table 4.4.1 Forecasted Electricity Demand by Sub-Region and by Sector................4-38
Table 4.4.2 Forecasted Electricity Demand by Sector..............................................4-39
Table 4.4.3 Forecasted Peak Load by Sub-Region...................................................4-39
Table 4.5.1 Scenarios of Household Electrification..................................................4-45
Table 4.5.2 Forecasted Peak Load by Scenario........................................................4-46
Table 4.5.3 Scenario on Electricity Price and Fuel Price ..........................................4-51
Table 4.5.4 Captive Power Generation by Scenario .................................................4-52
Chapter 5
Table 5.1.1 Causes of Constraint .............................................................................5-1
Table 5.1.2 Hydropower Derated Capacity..............................................................5-2
Table 5.1.3 Derated Capacity of Thermal Power Plants...........................................5-4
Table 5.1.4 Maintenance Capacity...........................................................................5-5
Table 5.1.5 Constrained capacity caused by limitation of 500kV trunk line in 2001 ..........5-8
Table 5.1.6 Constrained Capacity Expected in the near future .................................5-8
Table 5.1.7 Project Cost of Muara Karang Repowering...........................................5-11
Table 5.1.8 Project Cost of Muara-Tawar BlockⅢ,Ⅳ Extension project.................5-13
Table 5.1.9 Project Cost of Muara-Tawar Block Ⅱ Extension project ....................5-14
Table 5.1.10 Number of troubles by shortage of Coal................................................5-16
Table 5.1.11 Coal characters in Indonesia Coal-fired thermal plants...........................5-16
Table 5.1.12 Reserve Ratio in each type of Coal........................................................5-17
Table 5.1.13 Number of Troubles Caused by Gas Shortage in 2000...........................5-17
Table 5.1.14 Pertamina’s Gas Supply Plan ................................................................5-18
Table 5.1.15 Generation Cost of Power Sources ......................................................5-20
Table 5.2.1 Evaluation of GRM ..............................................................................5-21
Table 5.2.2 Derated capacity covered by GRM .......................................................5-22
Table 5.2.3 Constrained Capacity not to be covered by GRM..................................5-22
Table 5.2.4 Development scenarios examined in this report .....................................5-23
Table 5.2.5 Constrained capacity of each case .........................................................5-24
Table 5.2.6 Demand- Supply Balance for Base Case - JICA/LPE Case 2- .............5-24
Table 5.2.7 Demand- Supply Balance for LOLP(1day)Case - JICA/LPE Case 2 - .........5-26
viii
Table 5.2.8 Evaluation of Essential Spinning Reserve ..............................................5-27
Table 5.2.9 Demand- Supply Balance for LOLP(1day) Case - JICA/LPE Case 1 - ..........5-27
Table 5.2.10 Development Scenarios (Sensitive Study) .............................................5-29
Table 5.2.11 Demand-Supply Balance for Base + Muara- Tower BlockⅡ Case ........5-30
Table 5.2.12 Demand-Supply Balance for Base + Muara- Tower BlockⅢ Case ........5-30
Table 5.2.13 Demand-Supply Balance for Muara-Tower BlockⅡ Added on Case.....5-31
Table 5.2.14 Demand-Supply Balance for Limited Development Case.......................5-31
Table 5.2.15 Demand-Supply Balance for Slipped Base Case ....................................5-32
Table 5.2.16 Operational Spinning Reserve for All Development Scenarios...............5-33
Table 5.S.1 Study Cases..........................................................................................5-34
Table 5.S.2 Simulation Results from 2002 to 2011 (JICA/LPE CASE2) ..................5-36
Table 5.S.3 Simulation Results from 2002 to 2011 (JICA/LPE CASE1) ..................5-37
Chapter 6
Table 6.1.1 Rehabilitation for Muara-Karan unit 4-5 ...............................................6-4
Table 6.1.2 Rehabilitation for Suralaya 1-4..............................................................6-5
Table 6.2.1 An example of Rotational Black Out.....................................................6-6
Table 6.2.2 Captive capacity connected to the PLN system .....................................6-7
Table 6.3.1 Effects of short-term countermeasures ..................................................6-8
Table 6.3.2 Maximum Improved Capacity by Short - Term Countermeasures..........6-9
Table 6.3.3 Operational Spinning Reserve after taking countermeasures -JICA/LPE Case 2- .....6-10
Table 6.3.4 Operational Spinning Reserve after taking countermeasures -JICA/LPE Case 1- .....6-11
Chapter 7
Table 7.1.1 Classification of Peak Demand..............................................................7-3
Table 7.1.2 Load Factors in the South - East Asian Countries ...............................7-3
Table 7.2.1 Characteristics of the Model Power Sources .........................................7-8
Table 7.2.2 Simulation Output of WASP-IV (Base Case) ........................................7-9
Table 7.2.3 Installed Capacity (Base Case) ..............................................................7-10
Table 7.2.4 Power Generation (Base Case) .............................................................7-11
Table 7.2.5 Capacity Factor (Base Case) .................................................................7-13
Table 7.2.6 Fuel Consumption (Base Case) ............................................................7-13
Table 7.2.7 CO2 Emission (Base Case)....................................................................7-14
Table 7.2.8 Necessary Investment (Base Case)........................................................7-15
Table 7.2.9 Necessary System Cost for Base Case (2001-2015) ..............................7-15
Table 7.2.10 Fuel Price Increase Scenario .................................................................7-16
Table 7.2.11 Power Development Plan by WASP-IV (Fuel Price Increase Scenario) ......7-17
Table 7.2.12 Necessary System Cost (Fuel Price Increase Scenario)..........................7-19
Table 7.2.13 Power Development Limited Scenario ..................................................7-21
Table 7.2.14 Power Development Plan by WASP-IV (Power Development Limited Scenario) .....7-22

ix
Table 7.2.15 Necessary System Cost (Power Development Limited Scenario)...........7-24
Table 7.2.16 Environmental Scenario ........................................................................7-24
Table 7.2.17 Amount of Renewable Energy ..............................................................7-25
Table 7.2.18 Power Development Plan By WASP-IV (Environmental Scenario) .......7-26
Table 7.2.19 Fuel Consumption and CO2 Emission (Environmental Scenario) ...........7-28
Table 7.2.20 Necessary System Cost (Environmental Scenario).................................7-29
Table 7.2.21 Mineable Resources on Coal.................................................................7-31
Table 7.3.1 Installed Capacity (in 2015) ..................................................................7-33
Table 7.3.2 Power generation (in 2015)...................................................................7-34
Table 7.3.3 Scenario of Trial Calculation on Optimal Power Mixture ......................7-35
Table 7.3.4 Power Development Plan By WASP-IV (Primary Energy Case)............7-36
Table 7.3.5 Fuel Consumption and CO2 Emission (Primary Energy Case)................7-38
Table 7.3.6 Installed Capacity of Each Case (Primary Energy Case) ........................7-38
Table 7.3.7 Power Production of Each Case (Primary Energy Case)........................7-39
Table 7.3.8 Necessary System Cost (Primary Energy Case) .....................................7-40
Table 7.S.1 Differences between WASP-IV and Sihombing model ..........................7-41
Table 7.S.2 Principal Capabilities of WASP-IV .......................................................7-44
Table 7.S.3 Development of Pumped Storage in Japan ............................................7-47
Table 7.S.4 Development of Pumped Storage by CEPCO........................................7-47
Table 7.S.5 Operation Record of Pumped Storage by CEPCO.................................7-47
Table 7.S.6 Input Data ............................................................................................7-49
Chapter 8
Table 8.1.1 Demand and supply balance of each area in the Java Bali system (2001) ....... 8-2
Table 8.1.2 Transmission lines................................................................................ 8-2
Table 8.1.3 Substations (Transformers) .................................................................. 8-3
Table 8.1.4 Reliability in Java island (In 2000)........................................................ 8-3
Table 8.1.5 Transmission Losses and Distribution Losses (In 2000)........................ 8-3
Table 8.1.6 Availability Factors (AF) of transformers (In 2000).............................. 8-4
Table 8.1.7 Transmission lines of which AF are more than 60% (In 2000) .............. 8-5
Table 8.1.8 Nominal short circuit current ............................................................... 8-5
Table 8.2.1 500kV Transmission lines .................................................................... 8-7
Table 8.2.2 500/150kV substations ........................................................................ 8-8
Table 8.2.3 Transmission lines and substations under 150kV .................................. 8-8
Table 8.3.1 Transmission limit in 2002 (No southern 500kV transmission lines) ..... 8-12
Table 8.3.2 Transmission Limit in 2002(Operation of one circuit between Paiton and Klaten) .. 8-13
Table 8.3.3 Transmission limit in 2003 (Operation of two circuits between Paiton and Klaten) . 8-13
Table 8.3.4 Transmission limit in 2003 (Double π connection at Cirebon) .......................... 8-14
Table 8.3.5 Transmission limit in 2004 (Operation of entire southern 500kV transmission lines)8-15

x
Table 8.3.6 Generation restriction in 2005
(Operation of Tanjung Jati B: Connected to the northern line) .... 8-15
Table 8.3.7 Transmission Limit in 2005(Operation of Tanjung Jati B: Connected to Ungaran).. 8-16
Table 8.3.8 Transmission limit in 2005
(Delay of southern 500kV transmission lines and Operation of Tanjung Jati B ) . 8-17
Table 8.3.9 Power flow in normal condition and with N-1 contingency (Peak in 2007)............ 8-19
Table 8.3.10 Power flow in normal condition and with N-1 contingency (Off-peak in 2007) ...... 8-20
Table 8.3.11 Short circuit current............................................................................. 8-21
Table 8.3.12 Cases for short circuit analysis (Conditions of circuit breakers) ............ 8-21
Table 8.3.13 Frequency drop and load shedding ....................................................... 8-25
Table 8.4.1 Demand forecast.................................................................................. 8-29
Table 8.4.2 Power development plan for transmission planning .............................. 8-29
Table 8.4.3 Distribution patterns for the new power stations .................................. 8-31
Table 8.4.4 Power development plan in each area (2001-2010) .............................. 8-31
Table 8.4.5 Power development plan in each area (2001-2015) .............................. 8-32
Table 8.4.6 Power development plan in each area................................................... 8-33
Table 8.4.7 Ratio of PR and BS of generators for study ......................................... 8-34
Table 8.4.8 Summary of result ............................................................................... 8-35
Table 8.4.9 Transmission lines for which power flow
exceeds its one-circuit capacity with one-circuit fault .......... 8-49
Table 8.4.10 Transmission lines of which one-circuit fault make the system unstable ........ 8-50
Table 8.4.11 Result of short circuit analysis.............................................................. 8-51
Table 8.4.12 Result of short circuit analysis (in case of split of the system) ............... 8-52
Table 8.4.13 Transmission losses (500kV system) .................................................... 8-53
Table 8.4.14 Cost of transmission losses .................................................................. 8-53
Chapter 9
Table 9.1.1 Application effect of thermal efficiency improvement measures (summary) .... 9-2
Table 9.2.1 Operational status of thermal power plants owned by PLN .................. 9-5
Table 9.4.1 Thermal efficiency of the power plants (at maximum output) ............... 9-8
Table 9.4.2 Thermal efficiency improvement measures ........................................... 9-9
Table 9.4.3 Terminal temperature difference of feed water heater ........................... 9-10
Table 9.4.4 Air leakage rate and temperature efficiency of air preheater............................... 9-11
Table 9.5.1 Efficiency improvement of cleaning feed water heater tubes ................. 9-13
Table 9.5.2 Efficiency improvement of cleaning feed water heater tubes and its cost ............... 9-13
Table 9.5.3 Application effect of LP-HTR cleaning with sponge............................. 9-14
Table 9.5.4 Application effect of HP-HTR cleaning with high-pressure jet.............. 9-14
Table 9.5.5 Efficiency improvement by boiler chemical cleaning and its cost ........... 9-15
Table 9.5.6 Application effect of boiler chemical cleaning....................................... 9-15

xi
Table 9.5.7 Efficiency improvement by improving HP and IP turbine blades and cost ...... 9-17
Table 9.5.8 Application effect of improving HP and IP turbine blades..................... 9-18
Table 9.5.9 Application effect of improving HP and IP turbine blades
(Application along with repair when the blades are deteriorated)... 9-18
Table 9.5.10 Application effect of AH element and seal............................................ 9-19
Table 9.6.1 Application effect of thermal efficiency improvement measures (summary) .... 9-20
Chapter 10
Table 10.1.1 Comparison of air pollution standards in Indonesia, Thailand and Japan........ 10-1
Table 10.1.2 Comparison of air emission standards in Indonesia, Thailand and Japan........ 10-2
Table 10.3.1 Characteristics of coal used in coal-fired power plants in Indonesia ...... 10-5
Table 10.3.2 Coal reserves by coal type.................................................................... 10-5
Table 10.3.3 Contract of purchase of sub-bituminous coal by Japanese power companies
from Indonesia ... 10-6
Table 10.3.4 General description of CCT ................................................................. 10-7
Table 10.3.5 Latest lignite plants.............................................................................. 10-8
Table 10.3.6 Specifications of CFBC plant in Japan.................................................. 10-9
Chapter 11
Table 11.1.1 The roles of UK and US regulatory Bodies .......................................... 11-10
Table 11.3.1 CDM costs and its priority ranking of project types.............................. 11-20
Table 11.3.2 CO2 emissions cost in Japan, Afforestation & Emission Trading cost overseas....... 11-21
Table 11.3.3 Total Generated Power and CO2 Emission ........................................... 11-21
Table 11.4.1 Captive Power Installed Capacity in Java-Bali...................................... 11-23
Table 11.4.2 Comparison the costs between captive power and PLN........................ 11-24
Table 11.5.1 Result of analysis of peak demand over 1,000 hours............................. 11-27
Table 11.5.2 Proposed DSM options in DSM Action Plan of 1992........................... 11-28
Table 11.5.3 DSM pilot programs in Thailand.......................................................... 11-30
Table 11.5.4 On-going DSM program...................................................................... 11-31
Table 11.6.1 Profit (Income) and Loss Statement ..................................................... 11-35
Table 11.6.2 Balance Sheet ...................................................................................... 11-36
Table 11.6.3 Total Equity ........................................................................................ 11-38
Table 11.6.4 Changes in Internal Reserves (Retained Earnings) in PLN.................... 11-39
Table 11.6.5 Cost Efficiency .................................................................................... 11-39
Table 11.6.6 Debt Service Ratio in PLN................................................................... 11-40
Table 11.6.7 Consolidated Balance Sheet ................................................................. 11-41
Table 11.6.8 Declines of Rupiah, Results ................................................................. 11-42
Table 11.6.9 Exports and Imports ............................................................................ 11-43
Table 11.6.10 Actual data of revenue, sales, and tariff by sector................................. 11-45
Table 11.6.11 Actual achievement of EDP ................................................................. 11-53

xii
Abbreviation
(1) Organizations *: Indonesian
ASEAN Association of Southeast Asian Nations
ADB Asian Development Bank
BAPPENAS Badan Perencanaan Pembangunan Nasional*
National Development Planning Agency
BATAN National Atomic Energy Agency, Indonesia
BHP (Australia's) Broken Hill Proprietary
BP British Petroleum
BPS Biro Pusat Statistik*
Central Bureau of Statistics
BPPT Agency for the Assessment & Application of Technology
CGI Consultative Group on Indonesia
DOC Directorate of Mineral and Coal Enterprises, MEMR
DOE/EIA U.S. Department of Energy / Energy Information Administration
DGEEU Directorate General of Electricity Utilization, MEMR
EATM Electricity Tariff Adjustment Mechanism
IBRA Indonesia Bank Restructuring Agency
IEA OECD / International Energy Agency
IMF International Monetary Fund
JBIC Japan Bank for International Cooperation Agency
JETRO Japan External Trade Organization
JICA Japan International Cooperation Agency
MEMR Ministry of Energy and Mineral Resources
MIGAS Direktorat Jenderal Minyak dan Gas Bumi
Directorate General of Oil and Gas, MEMR
OECD Organisation for Economic Cooperation and Development
P3B Penyaluan dan Pusat Pengatur Beban*
PJB PLN Java Bali Power Company
PLN Perusahaan Umum Listric Negara PERSERO*
WB The World Bank
WEC World Energy Council

xiii
(2) Terms *: Indonesian
a. Facilities
AC Available Capacity
AVR Automatic Voltage Regulator
cct circuit
CF Capacity Factor
ESR Essential Spinning Reserve
EVA Early Valve Actuation
FEC Final Energy Consumption
GATT General Agreement of Tariffs and Trade
GIL Gas Insulated Transmission Line
GRF Gas Recirculating Fan
HSD High speed Diesel Oil
HP(E)HTR High Pressure feed water Heater
IC Installed Capacity
IDO Intermediate Diesel Oil
LFC Load Frequency Control
LNG Liquefied Natural Gas
LPG Liquefied Petroleum Gas
LOLP Loss Of Load Probability
MFO Marine Fuel Oil
OSR Operational Spinning Reserve
PER Primary Energy Requirement
PLC Power Line Carrier communication
PM Particulate Matter
PSS Power System Stabilizer
RUKN Rencana Umum Kelistrilcan Nasional*
National Electricity Development Plan
SEDF Social Electricity Development Fund (SEDF)
SDR System Dumping Resistor
TSC Transient Stabilizing Controller
T/D losses Transmission and Distribution Losses
VAT Value Added Tax
b. Miscellanea
AMDAL Analisi Menegenai Dampak Lingkungan*
CPI Consumer Price Index
EATM Electricity Tariff Adjustment Mechanism
GDP Gross Domestic Product
xiv
HGI Hardgrove Grindability Index
EIA Environment Impact Assessment
IPPs Independent Power Producers
IRR Internal Rate of Return
LP Linear Programming
NPV Net Present Value
NCV Net Calorific Value
PM Particulate Matter
PPA Power Purchase Agreement
PSCs Production Sharing Contracts
RGDP Regional Gross Domestic Product
R/P ratio Reserve / Production ratio
SEDF Social Electricity Development Fund (SEDF)
SB Single Buyer market
WASP-Ⅳ Wien Automatic System Planning
WPI Wholesales Price Index
c. Unit
kV kilovolt
kVA kilovolt-Ampere
MVA Megavolt-Ampere
kW kilowatt
kWh kilowatt-hour
MW Megawatt
MWh Megawatt-hour
GW Gigawatt
GWh Gigawatt-hour
kmc kilometer circuit
bbl barrel
bbl/d barrel per day
BTU British Thermal Unit
BOE barrel of oil equivalent
toe ton of oil equivalent
ktoe kilo (thousand) tones of oil equivalent
SCF Standard Cubic Foot
BSCF billion Standard Cubic Foot
MMSCF million Standard Cubic Foot
mmscfd million standard cubic foot per day
TFCF trillion Standard Cubic Foot
1-1
Chapter 1 Preface
1.1 Background
Since the economic crisis in 1997, Indonesia has been regarded as needing reform in many
fields. Structural reform has been under way in the electrical power sector to enable efficient
electrical supply. This restructuring process was laid out in the “Power Sector Restructuring
Policy” adopted by the Indonesian government in 1998. It aimed to use deregulation of the
power sector and the introduction of market mechanism through the creation of a competitive
market in order to achieve electrical power supply of high quality and efficiency. The New
Electricity Law is to be enacted as soon as possible as the legal basis of this policy. Within
three years of the new law coming into effect, it is to establish Single Buyer (hereinafter
referred to as SB) market within the Java – Bali system. Within seven years it is to completely
liberalize the operation of the Java – Bali system in the Multiple Buyers/ Multiple Sellers
market (hereinafter referred to as MB/MS).
In the SB market and the MB/MS market, private generation companies are expected to take
part in power development than before. The Optimal Power Development Plan, reflecting the
issues faced by the sector, is essential as a development indicator in order to reconcile future
participation of the private sector in power development with efficient and stable power
supply. On the other hand, government participation is needed for the attainment of public-
interest goals such as environmental preservation, supply stability and the best mix of energy
to make effective use of national coal and natural gas reserves. Therefore the government
must also be capable of power development planning and policies.
As the economy recovers from the 1997 economic crisis, the power demand is growing
steadily. Demand in the Java – Bali system grew by 8.8% on the preceding year in 1999, by
9.9% in 2000 and by 6.35% in 2001. Steady demand growth is expected in future, prompting
concerns that the system could reach a power deficit by as early as 2003~04, without the
construction of new power stations, or measures to rehabilitate existing power stations and
ease restrictions on their operation. In this situation, the examination of the probability of
power deficit and preparing short-term countermeasures are current urgent issues to be solved.

1-2
1.2 The Target Regions and Purpose of the Study
This situation prompted JICA to begin a “Study on the Optimal Electric Power
Development and Operation in Indonesia” (referred to below as “the Study”) in July 2001.
The scope of the study was limited to Java and Bali. The purpose of the study is as follows; - To examine the probability of the power deficit anticipated for the near future (around
2005) and prepare countermeasures.
- To examine the Optimal Power Development Plan for the medium and long term (to 2015),
taking generation costs, the effective use of primary energy sources, environmental
conservation and other issues, and a Transmission Plan considering appropriate placement
of power sources.
- To examine measures from technical, organizational and institutional aspects in order to
realize the above plans.
- To transfer to the Indonesian counterpart the technologies and know-how for implementing
the optimal power development plan and transmission plan during the progress of the study.
1.3 Study Content
This study comprises the following two phases:
[1] Verification of the power deficit which is anticipated for the near future, and preparation
of the necessary short-term measures
[2] Examination of the Optimal Power Development Plan and Transmission Plan for the
medium and long term, and advice on the technical, organizational and systematic aspects
in order to realize the plans
These phases are summarized below. (1) Verification of the power deficit which is anticipated for the near future, and
preparation of the necessary short-term measures
First, past trends in power demand will be analyzed to make a detailed demand forecast
using an econometric model. The model will comprise demand functions using income (GDP),
electricity tariff and household electrification rates as the explanatory variables. The
characteristic feature of this examination is that pricing effects will be considered in the
demand forecast, reflecting the trend in the period before 1997, in which power demand
increased as the real price declined. The two forecast cases are as follows:
- The JICA/LPE Case 1 scenario, in which the power price is raised to the 6~7c/kWh level
by 2005, approximately doubling the current nominal price.
1-3
- The JICA/LPE Case 2 scenario, in which the power price is tied to the inflation rate, thus
maintaining the real price at the current level.
This examination is the first stage of a study intended to verify the power crisis. Therefore
the forecast period extends to 2010.
Next, to verify the capacity of power supply, the study will confirm the development timing
in the existing power development plan, the available capacity of existing power plants, and
the restrictions on them, to review the supply capacity which can be anticipated in each year.
The impact of transmission constraints of the southern 500kV transmission line is examined
by system analysis. These studies will envisage a number of scenarios considering the
operation schedule and practicability of power plants that are now in development or at the
planning stage. The probability of power deficit will be verified for each scenario.
Short-term measures, which at present appear to include coordination of the repair
schedules of thermal power generators, rehabilitation of those generators, and the utilization
of captive power, will be examined and their anticipated effects gauged to estimate the impact
of such measures on the power deficit.
(2) Examination of the Optimal Power Development Plan and Transmission Plan for the
medium and long term, and advice on the technical, organizational and institutional
aspects in order to realize the plans
The model constructed for the short-term demand forecast will be used as the basis for a
medium and long-term demand forecast, extending the forecast period to 2015. For the
medium and long-term Optimum Power Development Plan, WASP-IV will be used to study a
minimum-cost plan taking into account policies for the stable and effective use of energy,
environmental preservation and other issues. The minimum-cost power development as the
base case will be analyzed for sensitivity to influences such as rising fuel prices, development
lead time and environmental policies and evaluated from the point of view of primary energy
supply. The issues identified in the above process will be examined, and then
recommendations for the realization of the Optimal Power Development Plan will be
presented.
For the Transmission Plan, to match the Optimal Power Development Plan by 2015,
distribution scenarios of new power sources (balanced distribution, western bias, eastern bias)
will be assumed. Then, power flow, stability and short-circuit capacity of each scenario will
be examined by system analysis, and the Optimal Transmission Plan will be proposed.

1-4
In parallel with the above analyses, the technical, organizational and institutional issues and
recommendations in order to realize the Optimal Power Development Plan and to contribute
stable power supply will be examined.
On the technical side, based on the field study of thermal power plants, measures for
improving the thermal efficiency of existing power plants will be analyzed in technical and
economic terms, and effective measures will be proposed.
The current status of environmental measures will be studied. And environmental
countermeasures to improve environmental conditions will be examined and further
environmental measures in order to increase the utilization of coal in future will be proposed.
On the organizational and systematic side, measures from Indonesia and abroad which
illustrate the realization of power development plans and stable power supply will be gathered
and analyzed. Measures apparently applicable to Indonesia’s current situation will be
identified from these cases and analyzed.
Issues and recommendations will be examined for the utilization of DSM to contribute to
stable power supply in the short, medium and long terms, and for the utilization of captive
power, which are expected to have a large impact on Indonesia’s Power Development Plan
because of their large capacity.
Measures to assist the introduction of renewable energy, the introduction of CDM, and a
power source bidding system with a view to the power supply composition will also be raised,
with examples from overseas, as measures to support the optimal power development.
In addition, measures will be examined and proposals made on enhancement of the PLN’s
financial condition, which is most important to the realization of optimal power development
plan, and on promoting private investment, which is the key to future power development.

1-5
1.4 Procedure of the Study
Procedures of this study are summarized as follows.
Procedure Activities - Analysis of data and information - Review of existing short-term power
demand forecast by using model
- Review of existing power development plan
- Verification of short-term demand and supply balance
- Planning short-term countermeasures - Analysis of long-term power demand
forecast by using model
- Drawing up the optimal power development plan by using WASP-IV
- Evaluation of energy available for power sector
- Power flow analysis and stability analysis
- Drawing up the transmission plan
- Drawing up the rehabilitation plan for the existing thermal power plants
- Review of the environmental policy - Examination of environmental measures
- Study for institutional and organizational recommendations for the optimal power development plan and stable power supply
Phase 2: Preparation of comprehensive and realistic medium-to-long term power development plan
Drawing up the optimal power development plan
Proposal to implement the plans on technical aspects
Long-term power demand forecast
Proposal to implement the plans on institutional and organizational aspects
Drawing up the power transmission plan
Phase 1: Examination of probability of power deficit and planning of short-term countermeasures
Review of power demand forecast
Examination of the probability of power deficit and short-term countermeasures
Review of power supply capacity

1-6
1.5 Study Schedule
The Study is scheduled for 12 months, from August 2001 to July 2002. The overall work schedule in Indonesia is shown below.
2001 2002
8 9 10 11 12 1
2002
2 3 4 5 6 7 8
I/R: Inception Report DF/R: Draft Final Report P/R: Progress Report F/R: Final Report IT/R: Interim Report
1.6 Working Group, PLN Study Team and JICA Study Team (1) Working group
Activities Member Project leader (Director of DGEEU, MEMR) Ir. Suharto Satibi, SE Project co-leader (Director of Planning, PLN) Ir. Hardiv H. Situmeang, MSc,. DSc Demand forecast, Supply plan, Policy/Institutional Issues (DGEEU)
Ir. Mohamed Nur Hidayat, MSc
Finance, Reform (DGEEU) Ir. Jarman, MSc Policy, Finance (DGEEU) Ir. Bambang Adi Winarso, MSc Coordinator (DGEEU) Ir. Ris Wahyuti Supply plan (DGEEU) Ir. Agoes Triboesono, ME Policy (Macro economy), Reform (DGEEU) Ir. Madrianto Kadri, DSc Policy (Macro economy) (BAPPENAS) Ir. Rizal Primana, MSc Finance, Supply plan, Demand forecast (PLN) Ir. Eden Napltupulu, SE Transmission (P3B) Ir. E. H. Gultom Transmission (P3B) Ir. Susanto Wibowo Environment (DGEEU) Ir. Elidar Bahar According to the reassignment in MEMR, Mr. Mardrianto Kadri who assumed Director of
DGEEU as the successor to Mr. Suharto Satibi became the Project Leader from the 3rd work-in-Indonesia.
1st work in-Indonesia
2nd work in-Indonesia
I/R P/R
3rd work in-Indonesia
4th work-in-Indonesia
IT/R DF/R F/R

1-7
(2) PLN study team Activities PLN Team
Coordinator Eden Napitupulu, EH Gultom Institutional Issues & Tariff
Eden Napitupulu, ERL Tobing, Azis Sabarto, Rachmadi, Widhoyoko, Handani R A, Bambang Hermawanto
Finance Handani R A, Yusuf Hamdani, Bambang Heru, Sri Fortuna, Indira Almatsier, Sugiarto
Economics Abdurahman Afiff, Eden Napitupulu, Widhoyoko, Bambang Hermawanto, Budi Chaerudin, Fiesta W
Load Demand Putu Karmiata, Hamzah, Agung Hariyanto, Sardjito, Helmy N Linear Programming /WASP
Abdurahman Afiff, Budi Chaerudin, M. Ikbal Nur, Gunawan Sidabalok, Sahala Turnip, Monstar P, Prianda
Thermal Budi Chaerudin, Monstar Panjaitan, Sudirmanto (IP), Iwan Supangkat (PJB)
Hydro Endro S, Budi Chaerudin, Monstar Panjaitan, Sudirmanto (IP), Iwan Supangkat (PJB)
Geothermal M. Pohan, Budi Chaerudin, Monstar Panjaitan, Sudirmanto (IP), Iwan Supangkat (PJB)
Transmission Prianda, Asttuti, Andi Darmawati, Helmy N, Susanto W System Analysis Bambang Hermawanto, Prianda, Helmy N, Susanto W,
Bambang Waspada, Romantika Environment Andy Purnama, Kabul S, M. Pohan, Harry H, Ria (PJB), Asistia Balance of Demand and Supply
Monstar P, Bambang Hermawanto, Budi Chaerudin, Agung H, Romantika, M. Ikbal Nur
Primary Energy Fuel Consumption Planning
A. Purnama, Monstar P, Endro S, M. Ikbal Nur, Romantika
Name of main person is printed in bold character. (3) JICA Study Team
Mr. Akihisa MIZUNO Team leader, Power development plan A
Mr. Yoshitaka SAITO Sub team leader,
Energy / electricity policies and Institutional Issues
Dr. Kaoru YAMAGUCHI Macro economy, Financial analysis
Dr. Atsushi FUKUSHIMA Power development plan B, Power demand forecast
Mr. Hiromi SAKAKIBARA Thermal power generating plan
Dr. Kenso NISHINO Hydropower generating plan
Mr. Kouki KOSEKI Power transmission plan, Power system analysis
Mr. Tsutomu TAKAHASHI Environment
Mr. Kazuhiko MIZUNO Coordinator

2-1
Chapter 2 Indonesian Economy and Energy Demand
2.1 Indonesian Economy
2.1.1 Background
In the years of Suharto's government, Indonesia's economy grew from a per capita GDP of
US$70 in 1965 to more than US$1,000 by 1996. Prudent monetary and fiscal policies have
succeeded to hold inflation in the 5%-10% range; the rupiah was stable. Much of the
development budget was financed by concessional foreign aid, avoiding domestic financing.
In the mid-1980s, the government began eliminating regulatory obstacles to economic activity.
They succeeded to keep annual real GDP growth nearly 7% for years1987-97, and most
analysts recognized Indonesia as a newly industrializing economy and emerging major market.
There is a number of structural weakness, however, behind the high levels of economic
growth of 1987-97. The legal system was very weak, and there was and is no effective way to
enforce contracts, collect debts, or sue for bankruptcy. Banking sector was infiltrated by
widespread violation of regulations, including limits on connected lending. Furthermore, the
economy has been distorted by non-tariff barriers, inefficiency of state-owned enterprises,
domestic subsidies, and restrictions to domestic trade and export.
The Asian currency crisis in late 1997 quickly became an economic and political crisis.
Indonesia responded by floating the rupiah, raising key domestic interest rates, and tightening
fiscal policy. An economic reform program was prepared aimed at macroeconomic
stabilization in October 1997 as an agreement with International Monetary fund (IMF). It
eliminated some of the country's most damaging economic policies, such as the National Car
Program and the monopoly. However, the rupiah could not stabilize in May 1998. In August
1998, new agreement with the IMF was made under President Habibie that included significant
structural reform targets. As President Abdurrahman Wahid took office in October 1999,
Indonesia and the IMF renewed the agreement in January 2000. The new program also has a
range of economic, structural reform, and governance targets.

2-2
2.1.2 Asian Crisis and the Change in Economic Structure
(1) Asian Crisis: the devaluation of Rupiah
The Asian financial crisis devastated the Indonesian economy and precipitated the fall of
President Suharto. The rupiah, which had been in the Rp. 2,400/US$ in 1997 reached Rp.
17,000/US$ at its peak in the 1998, returned to the Rp. 6,500-8,000/US$ in late 1998. Now the
rupiah is approximately Rp. 10,000/US$. The real GDP contracted by an estimated 13.7% in
1998. The economy bottomed out in mid-1999 with the real GDP growth of 0.3%. Inflation
reached 77% at its peak in 1998 but slowed to 2% in 1999. The unfavorable exchange rate
reduced imports in the early stage of the crisis with reduction in domestic demand and absence
of new investment, although a severe drought in 1997-98 forced Indonesia to import record
amounts of rice.
Figure 2.1.1 compares the magnitude of currency depreciations of four countries of
Indonesia, Philippines, Thailand, and Malaysia. The exchange rate of the first quarter of 1997
was based to be 100. The period of each year in X axis was separated by quarter. The impact on
Indonesia is prominent in comparison with other countries. Even after the crisis, in 2000 the
exchange rate is three to four times higher than the level of before crisis means the value of
Rupiah has fell to one third to one fourth.
Figure 2.1.1 The Asian Crisis and the Devaluation of Currency by Country
0
100
200
300
400
500
600
1 2 3 4 1 2 3 4 1 2 3 4 1 2 3 4
1997 1998 1999 2000
1997
Q1=
100
Indonesia (Ruiah/USD) Philippines (Pesos/USD) Thailand (Baht/USD) Malaysia (Ringgit/USD)
(Source) IMF

2-3
(2) GDP by industry and the impact of the Asian Crisis
Despite the continued policy disarray, Indonesia's real economy began to recover in 2000, led
largely by consumer demand and surging exports. In the first seven months of 2000,
Indonesia's exports were up 34 percent over the same period of 1999. The country retains its
solid export foundation of oil, gas, minerals and agricultural commodities such as coffee, tea,
rubber, timber, palm oil and shrimp. Regions such as Sumatra and Sulawesi that have strong,
agricultural commodity-based economies survived the crisis with only minor disruptions.
The Figure 2.1.2 shows the real GDP with its factor cost components. The Figure 2.1.3
shows the growth rate of each sector to see the difference of the impact by sector. From Figure
21.2, the shrunk of GDP in 1998 and 1999 was clear. The Figure 2.1.3 indicates that the
impacts were especially severe for such sectors of construction, finance, and trade, while the
impacts of the sectors of agriculture and electricity, gas and water were less severe.
Figure 2.1.2 Real GDP and the Components by Industry
(Source) ADB
0
50000
100000
150000
200000
250000
300000
350000
400000
450000
500000
1988 1989 1990 1991 1992 1993 1994 1995 1996 1997 1998 1999
1993
Con
stan
t bi
llion
Rup
ia
Agriculture Mining Manufacturing Electricity, gas and water
Construction Trade Transport and communications Financed
Public administration Others

2-4
Figure 2.1.3 The Impact of Asian Crisis on Indonesia by Industry
-50
-40
-30
-20
-10
0
10
20
Agr
icultu
re
Mini
ng
Man
ufac
turin
g
Elec
tricit
y, ga
s and
wat
er
Con
struc
tion
Tra
de
Tra
nspo
rt an
d co
mm
unica
tions
Fina
nced
Pub
lic a
dmini
strati
on
Oth
ers
Gro
wth
Rat
e %
1996 1997 1998 1999
(3) Governmental budget and debt
As shown in Figure 2.1.4, the Indonesian government has historically maintained a
"balanced" budget: expenditures were covered by the sum of domestic revenues and foreign aid
and borrowing, without resort to domestic borrowing. However, the financial crisis, especially
the bank recapitalization program, has placed a heavy burden on government finances. The
crisis left the government deeply in debt. After completing the bank recapitalization program
the debt will add up to a 94% of GDP, up from a pre-crisis level of 23% of GDP. Interest
payments on domestic debt, which before the crisis was almost zero, are estimated to reach Rp.
55 trillion (US$6.4 billion) or 19 percent of total spending in FY-2001. The government
expects the gap between domestic revenues and expenditures to remain for several years
although the rise in oil prices starting in late 1999 relieved budgetary pressure in 2000. The
budgetary gap in the FY-2001 is targeted at approximately 3.7 percent of GDP.
Figure 2.1.4 Governmental Deficit/Surplus
-40
-30
-20
-10
0
10
20
30
40
50
60
1975
1976
1977
1978
1979
1980
1981
1982
1983
1984
1985
1986
1987
1988
1989
1990
1991
1992
1993
1994
1995
1996
1997
1998
1999T
rillio
n R
up
iah
GOVERNMENT DEFICIT (-) OR SURPLUS Financing from abroad

2-5
(4) Inflation and electricity prices
Figure 2.1.5 shows the consumer price index and the inflation rate. As shown in this figure,
in parallel with its fiscal policy, the Indonesian government had a reputation for prudent
monetary policy that helped keep consumer price inflation below 10%. However, the
extraordinary depreciation of the rupiah that began in mid-1997 and huge governmental
intervention (liquidity injections) into the banking system contributed to significant inflation.
Figure 2.1.6 shows the comparison of the inflations of CPI and average electricity price with
measure in the left side axis. Also it shows the average electricity price in US$/kWh with its
measure on right side axis.
Figure 2.1.5 Consumer Price Index and the Inflation
Figure 2.1.6 CPI vs Electricity Price and the Scenario up to 2005
-10
0
10
20
30
40
50
60
70
1983
1984
1985
1986
1987
1988
1989
1990
1991
1992
1993
1994
1995
1996
1997
1998
1999
2000
2001
2002
2003
2004
2005
Infl
ati
on
%
0
0.02
0.04
0.06
0.08
0.1
0.12
Ele
ctr
icit
y P
ric
e (
$U
S/k
Wh
)
CPI Inflation % Electricity Price Inflation % Average Electricity Price ($US)
Scenario:$0.07/kWh by
2005
0
50
100
150
200
250
1975
1977
1979
1981
1983
1985
1987
1989
1991
1993
1995
1997
1999
CP
I, 19
95=
100
0
10
20
30
40
50
60
70
Infl
ati
on
%
Consumer price index Inflation

2-6
The electricity prices are controlled by the government. Therefore, without major increase
during the crisis, the effect was the sharp downfall of the price in real term. Actually, in 1998,
the inflation of CPI or the peak is much higher than the peak of electricity price inflation. At the
same time, the sharp downfall is in the price in US$ in 1998. Except 1989, 1991, and 1993, the
CPI inflation is higher than the inflation of electricity price, means that the electricity price has
been decreased substantially. In fact the price in 1998 was about a half of the price of 1984.
The graph beyond 2001 shows the PLN scenario to increase the electricity price up to 7 cents
by 2005. The scenario was calculated based on the assumptions—CPI inflation 10% and the
exchange rate 8000 rupiah/US$. This scenario shows that the relationship between the inflation
of CPI and that of electricity price have to be reversed. The inflation of electricity price has to
be 20% or more if CPI inflation is about 10%. (5) Structural policies
Pressured by the deteriorating conditions, Indonesia requested support from the International
Monetary Fund (IMF) to have signed its first Letter of Intent (LOI) with the IMF on October 31,
1997. The letter called for a three-year economic stabilization and recovery program,
supported by loans from the IMF (US$10 billion), the World Bank, the Asian Development
Bank, and bilateral donors (See below Figure 2.1.7).
Figure 2.1.7 Use of IMF Credit
Indonesia’s agreement with the IMF has been revised repeatedly because of the deteriorating
macroeconomic conditions and political changes. The result is a complex program to tackle
macroeconomic imbalances, financial weaknesses, real sector inefficiencies, and the loss of
private sector confidence. Accordingly, the government has introduced several measures to
improve governance. These include a Competition Commission that was inaugurated in
September 2000 and various bodies to investigate and prevent corruption, collusion and
nepotism.
Use of IMF credit
0
2
4
6
8
10
12
1975
1977
1979
1981
1983
1985
1987
1989
1991
1993
1995
1997
1999
Bill
ion
$U
S

2-7
With such an injection of external debt, Indonesia’s foreign debt totaled about US$162
billion as of July 2000, which includes about US$80 billion owed by the public sector and
US$82 billion by the private sector.
(6) Imports & Exports
In recent years, Indonesia has liberalized its trade regime and taken steps to reduce protection.
Namely, since 1996, the government has issued a series of deregulation packages that have
reduced overall tariff levels, simplified the tariff structure, removed restrictions, replaced
non-tariff barriers with more transparent tariffs, and encouraged foreign and domestic private
investment.
For example, import tariffs on vehicles were lowered in June 1999 to 65 to 80 percent
(depending on engine size) for completely built-up sedans, 5 to 40 percent for trucks, and 35 to
65 percent for motorcycles. Rates for parts were also reduced to a maximum 15 percent.
Luxury taxes for sedans range from 35 to 50 percent.
Export-loan interest subsidies were eliminated since Indonesia joined the GATT Subsidies
Code in 1990. As part of its drive to increase non-oil and gas exports, the government permits
restitution of VAT paid by a producing exporter on purchases of materials for use in
manufacturing export products. Free trade zones and industrial estates are combined in several
bonded areas.
Figure 2.1.8 shows the historical change of imports and exports. The depreciation of rupiah
during the crisis combined with improved trade environment contributed to the surge of both
imports and exports since 1998. The export is relatively large because of the rupiah devaluation
and this was the primary factor, which led the recent recovery.
Figure 2.1.8 Import/Export
0
100
200
300
400
500
600
1975
1976
1977
1978
1979
1980
1981
1982
1983
1984
1985
1986
1987
1988
1989
1990
1991
1992
1993
1994
1995
1996
1997
1998
1999
Tri
llio
n R
up
iah
Exports of goods and services Imports of goods and services
2-8
2.1.3 Latest Development with IMF and Subjects for the Future
The Indonesian economy stabilized in 1999, following the sharp contraction and high
inflation of 1998. By following tight monetary policy, the government reduced inflation from
over 70% in 1998 to 2% in 1999. Although interest rates spiked as high as 70% in response to
the monetary contraction, they fell rapidly to the 10% to 15% range. The economy stopped its
free-fall as GDP showed some growth in the second half of 1999, although GDP for the year as
a whole showed no growth. The government managed to recapitalize a handful of private
banks and has begun recapitalizing the state-owned banking sector. New lending, however,
remains almost unavailable as banks continue to be wary of issuing new debt in an environment
where little progress has been made in restructuring the huge burden of outstanding debts. IMF
payments were suspended late in 1999 as the result of evidence that a private bank had illegally
funneled payments it received from the government to one of the political parties.
The new government of the President Megawati Soekarnoputri seems more pro-reform than
the predecessor. Thus the LOI of August 2001 between IMF and the government of Indonesia
paved the way for the IMF to disburse its long-delayed US$400 million loan tranche to
Indonesia. The agreement revealed that the IMF is easing some economic reform targets in
support for President Megawati Soekarnoputri’s request. In the agreement, the inflation rate is
now targeted at between 9 and 11 %, extending the range from earlier target of 9.3%. The GDP
was revised downward from 4.8% to between 3 and 3.5%. The base money target has also been
raised from 108 trillion to 110.5 trillion, although it is still lower than the current level of Rp.
112 trillion. Also, Indonesia agreed to raise Rp. 27 trillion from the sales of assets under the
Indonesian Bank Restructuring Agency (IBRA) and Rp. 6.5 trillion from the privatization of
state-owned enterprises.
The new government is trying to receive more loans from Donor countries under the
Consultative Group on Indonesia (CGI). The government has expressed hope of the CGI
increasing its loans to Indonesia to help finance a 2002 state budget deficit. The government is
relying on foreign investment and loans to help contain this year’s state budget deficit at 3.7%
of GDP. Without these, it must seek alternative sources of revenue. That could translate into
the imposition of higher taxes and an increase of fuel and power prices.
The followings are the primary points in the LOI of August 2001.
- GDP growth set at 3% to 3.5%, inflation at 9% to 11% by the end of this year, and base
money supply growth at 12.5% by March 2002.
- Introduction of treasury bills by year end to gradually replace Bank Indonesia’s

2-9
promissory notes.
- Bank Mandiri privatization through an initial public offering of up to 30% by the end of
this year.
- IBRA revenue target at 27 trillion, of which Rp. 19.8 trillion must be collected in cash
by end of September 2001.
- Announcement of performance audits of key state firms including PT Telecom and PT
Garude Indonesia.
- Target to issue bonds to replenish funds for the government’s blanket bank guarantee
scheme.
- Restructuring corporate debts totaling US$14 billion to US$15 billion under the Jakarta
Initiative Task Force.
- Targeting privatization proceeds of Rp. 6.5 trillion this year (2001).
2.1.4 Summary
To summarize, Indonesia’s economy has been deeply dependent on foreign aid. The dollar or
yen denominated loan made Indonesia made its economy very sensitive to the fluctuation of
exchange rate. Moreover, the exchange rate can easily fall and rise in response to the political
turmoil of the country. Thus, the Asian crisis, which began in 1997, was accelerated by the
political upheaval for the case of Indonesia. The spread of sectarian violence and continuing
dissatisfaction with the pace of bank and debt restructuring is another factor, which disturb to
attract the private investment
At this moment, the critical macroeconomic problem is the governmental budget and debt.
The subsidies for food and fuel are the primary burden for the government. Until recently, the
income from the sales of crude oil was somewhat a relief for the government. However,
without promising crude oil development in Indonesia, the government has few option but to
shrink its spending with less subsidy—meaning more pain for the recipients of public in general.
Now the economy is pressed to be self-sustainable with increased investment into a productive
sector.
The event of terrorist attack of September 2001 against USA would deteriorate the recovery of
Indonesian Economy. The GDP estimate was adjusted to lower than before. According to the
World Bank the GDP growth of Indonesia would recover to 4% by 2004, but continued to be
around 4% until the year 2010.
Table 2.1.1 shows Economic indicators of WB
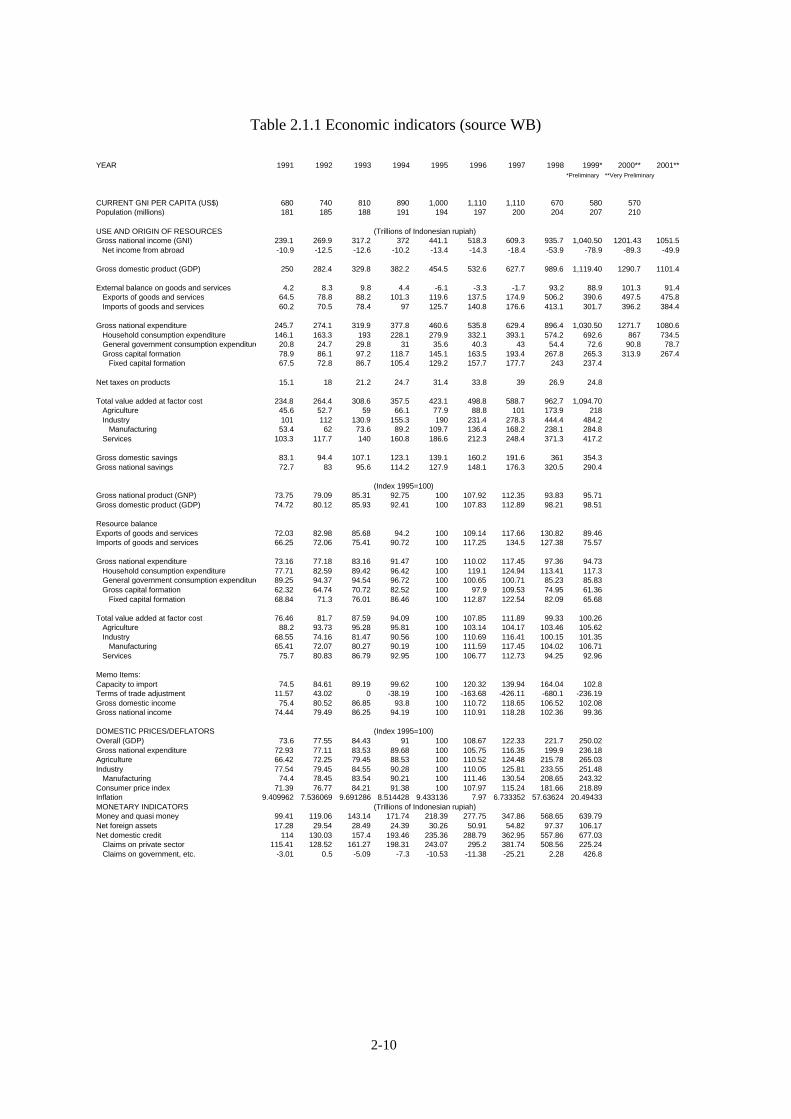
2-10
Table 2.1.1 Economic indicators (source WB)
YEAR 1991 1992 1993 1994 1995 1996 1997 1998 1999* 2000** 2001***Preliminary **Very Preliminary
CURRENT GNI PER CAPITA (US$) 680 740 810 890 1,000 1,110 1,110 670 580 570Population (millions) 181 185 188 191 194 197 200 204 207 210
USE AND ORIGIN OF RESOURCES (Trillions of Indonesian rupiah)Gross national income (GNI) 239.1 269.9 317.2 372 441.1 518.3 609.3 935.7 1,040.50 1201.43 1051.5 Net income from abroad -10.9 -12.5 -12.6 -10.2 -13.4 -14.3 -18.4 -53.9 -78.9 -89.3 -49.9
Gross domestic product (GDP) 250 282.4 329.8 382.2 454.5 532.6 627.7 989.6 1,119.40 1290.7 1101.4
External balance on goods and services 4.2 8.3 9.8 4.4 -6.1 -3.3 -1.7 93.2 88.9 101.3 91.4 Exports of goods and services 64.5 78.8 88.2 101.3 119.6 137.5 174.9 506.2 390.6 497.5 475.8 Imports of goods and services 60.2 70.5 78.4 97 125.7 140.8 176.6 413.1 301.7 396.2 384.4
Gross national expenditure 245.7 274.1 319.9 377.8 460.6 535.8 629.4 896.4 1,030.50 1271.7 1080.6 Household consumption expenditure 146.1 163.3 193 228.1 279.9 332.1 393.1 574.2 692.6 867 734.5 General government consumption expenditure 20.8 24.7 29.8 31 35.6 40.3 43 54.4 72.6 90.8 78.7 Gross capital formation 78.9 86.1 97.2 118.7 145.1 163.5 193.4 267.8 265.3 313.9 267.4 Fixed capital formation 67.5 72.8 86.7 105.4 129.2 157.7 177.7 243 237.4
Net taxes on products 15.1 18 21.2 24.7 31.4 33.8 39 26.9 24.8
Total value added at factor cost 234.8 264.4 308.6 357.5 423.1 498.8 588.7 962.7 1,094.70 Agriculture 45.6 52.7 59 66.1 77.9 88.8 101 173.9 218 Industry 101 112 130.9 155.3 190 231.4 278.3 444.4 484.2 Manufacturing 53.4 62 73.6 89.2 109.7 136.4 168.2 238.1 284.8 Services 103.3 117.7 140 160.8 186.6 212.3 248.4 371.3 417.2
Gross domestic savings 83.1 94.4 107.1 123.1 139.1 160.2 191.6 361 354.3Gross national savings 72.7 83 95.6 114.2 127.9 148.1 176.3 320.5 290.4
(Index 1995=100)Gross national product (GNP) 73.75 79.09 85.31 92.75 100 107.92 112.35 93.83 95.71Gross domestic product (GDP) 74.72 80.12 85.93 92.41 100 107.83 112.89 98.21 98.51
Resource balanceExports of goods and services 72.03 82.98 85.68 94.2 100 109.14 117.66 130.82 89.46Imports of goods and services 66.25 72.06 75.41 90.72 100 117.25 134.5 127.38 75.57
Gross national expenditure 73.16 77.18 83.16 91.47 100 110.02 117.45 97.36 94.73 Household consumption expenditure 77.71 82.59 89.42 96.42 100 119.1 124.94 113.41 117.3 General government consumption expenditure 89.25 94.37 94.54 96.72 100 100.65 100.71 85.23 85.83 Gross capital formation 62.32 64.74 70.72 82.52 100 97.9 109.53 74.95 61.36 Fixed capital formation 68.84 71.3 76.01 86.46 100 112.87 122.54 82.09 65.68
Total value added at factor cost 76.46 81.7 87.59 94.09 100 107.85 111.89 99.33 100.26 Agriculture 88.2 93.73 95.28 95.81 100 103.14 104.17 103.46 105.62 Industry 68.55 74.16 81.47 90.56 100 110.69 116.41 100.15 101.35 Manufacturing 65.41 72.07 80.27 90.19 100 111.59 117.45 104.02 106.71 Services 75.7 80.83 86.79 92.95 100 106.77 112.73 94.25 92.96
Memo Items:Capacity to import 74.5 84.61 89.19 99.62 100 120.32 139.94 164.04 102.8Terms of trade adjustment 11.57 43.02 0 -38.19 100 -163.68 -426.11 -680.1 -236.19Gross domestic income 75.4 80.52 86.85 93.8 100 110.72 118.65 106.52 102.08Gross national income 74.44 79.49 86.25 94.19 100 110.91 118.28 102.36 99.36
DOMESTIC PRICES/DEFLATORS (Index 1995=100)Overall (GDP) 73.6 77.55 84.43 91 100 108.67 122.33 221.7 250.02Gross national expenditure 72.93 77.11 83.53 89.68 100 105.75 116.35 199.9 236.18Agriculture 66.42 72.25 79.45 88.53 100 110.52 124.48 215.78 265.03Industry 77.54 79.45 84.55 90.28 100 110.05 125.81 233.55 251.48 Manufacturing 74.4 78.45 83.54 90.21 100 111.46 130.54 208.65 243.32Consumer price index 71.39 76.77 84.21 91.38 100 107.97 115.24 181.66 218.89Inflation 9.409962 7.536069 9.691286 8.514428 9.433136 7.97 6.733352 57.63624 20.49433MONETARY INDICATORS (Trillions of Indonesian rupiah)Money and quasi money 99.41 119.06 143.14 171.74 218.39 277.75 347.86 568.65 639.79Net foreign assets 17.28 29.54 28.49 24.39 30.26 50.91 54.82 97.37 106.17Net domestic credit 114 130.03 157.4 193.46 235.36 288.79 362.95 557.86 677.03 Claims on private sector 115.41 128.52 161.27 198.31 243.07 295.2 381.74 508.56 225.24 Claims on government, etc. -3.01 0.5 -5.09 -7.3 -10.53 -11.38 -25.21 2.28 426.8

2-11
2.2 Energy Policy in Indonesia
2.2.1 Transition of Energy Policy
(1) Traditional energy policy
The objectives of the traditional energy policy in Indonesia are summarized as follows.
- To secure the continuity of energy supply for domestic use at prices affordable to the public
in order to enhance the quality of life of the people and to stimulate economic growth.
- To save an adequate supply of oil and gas for export so that these can remain an important
source of foreign exchange for funding the national development program.
The energy development policy in order to meet the above objectives is also summarized as
follows.
1) Energy Intensification, i.e., to increase and expand the survey and exploration of energy
resources available in the country.
2) Energy Diversification, i.e., to reduce dependency on oil in overall energy consumption by
a substitution of the other available resources for oil in the country.
3) Energy Conservation, i.e., to economize energy and to use it efficiently.
(2) Restructuring of energy policy
Indonesia, one of the energy-resource rich countries of Asia, has made a drastic turnaround in
its second long term national plan. Namely, its first long-term plan (LTD-1, 1969/70-1993/94)
stated; 1) Indonesia is rich in usable energy resources, 2) fossil fuel resources can satisfy both
exports to earn foreign currency and domestic demand, and 3) energy prices are maintained
lower than the economic values.
The second long-term plan (LTD-2, 1994/95-2018/19), however, revealed a different
understanding of these basic matters and stated; (a) Indonesia is not necessarily rich in energy
resources, (b) fossil fuel resources need to be earmarked for exports, and also are positioned as
fuels and materials necessary for manufacturing products, and (c) energy prices must be set to
reflect the economic values. Accordingly, Indonesia changed its energy diversification policy
from a “conventional one designed to reduce domestic oil dependence in an effort to secure oil
exports” to a “new one designed to maximize the national earnings and to delay depletion of its
fossil fuel resources.” The second long-term plan declares that the goal of energy development
is to increase the added value of Indonesia as a whole and to ensure the energy security and
elasticity for the country. Figure 2.2.1 shows the main changes related to the energy
development policy.

2-12
Figure 2.2.1 Restructuring of Energy Policy in Indonesia
First Long-term Development Plan
(LTD-1, 1969/70~1993/94)
Second Long-term Development Plan
(LTD-2, 1994/95~2018/19)
1. Energy resources are considered to be abundant in
availability
2. Fossil fuel resources are in response to both
①Earning of foreign currency by export, and
②Supply for domestic energy requirement
3. Energy price is kept below its economic value
1. Energy resources are scare resources
①Oil reserve is 1.1 % of the World
②Natural gas is 1~2 % of the World
③Coal reserve is 3.1 % of the World
2. Oil, Gas and Coal are positioned as fossil fuels and
raw materials for domestic energy need to produce
export goods for foreign currency
3. Energy price is set according to its economic value
and market mechanism
First Long-term Development Plan
(LTD-1, 1969/70~1993/94)
Second long-term Development Plan
(LTD-2, 1994/95~2018/19)
1. Diversification of energy source
Diversification for decrease of oil dependency ratio in
domestic energy supply in order to keep oil export
2. Energy Conservation
Energy conservation policy is focused on down-stream
1. Diversification of energy source
①to gain maximum benefit of the nation
②to delay the depletion of fossil fuel resources
2. Energy Conservation
Energy conservation policy is adopted to both up-stream
and down-stream
Basic Recognition
Main Changes of Energy Policy
Goal of Energy Development
Increase of total value-added in the nation
Strategy of Energy Development
Optimum allotment & utilization of energy resources
1. Stable supply of energy and ensuring of energy
security
2. Establishment of optimum energy use
3. Support of environment-friendly energy
development
4. Increase of the national resilience
1. Optimum use of energy resources
2. Commercialization of new and renewable energy
3. Selection of moderate technology
4. Even (Equal) energy distribution & utilization
5. Export of technology & services/expertise
6. Development of energy industry
7. Efficient and environment-friendly energy use
in transport sector

2-13
Energy development policy in the second long-term plan stresses the following items.
1) Energy diversification
Energy diversification policy aims at maximizing the net benefit of the nation and at
supporting sustainable development by diversifying the use of energy resources. This
policy is to ensure an optimum and economic utilization and supply of energy to reduce the
depletion rate of hydrocarbon resources.
(Past Policy): Aimed at diversifying the use of energy resources to reduce dependence on
certain resources (especially oil) in order to enable the country to secure oil
supply for export.
(New Policy): Aimed at diversifying the use of energy resources and at ensuring on optimum
& efficient utilization of energy in order to enable the country to achieve a
maximum net benefit from energy utilization.
2) Energy intensification
Intensification policy of survey and exploration activities is to identify the potentials of
economically exploitable energy resources (especially oil, gas and coal) in order to
guarantee a sustainable supply of energy.
3) Energy conservation
Energy conservation policy is to stipulate the efficient and rational utilization of energy,
which is adopted the whole process of energy utilization covering the demand and supply
side.
(Past Policy): Implementation of energy conservation especially focused on downstream.
(New Policy): Energy conservation is applied to downstream and upstream activities.
4) Energy pricing
The energy price is designed to gradually reflect the real economic value, following the
market mechanism.
- Enhancing economic competitiveness,
- Protecting consumers,
- Ensuring even distribution of energy.
5) Environment
An environmentally benign energy development policy aims at reducing the destruction
and degradation of ecosystems for supporting sustainable development.

2-14
2.2.2 Policy Issues of Energy Sector
Recently, various problems in the energy sector have been highlighted, just as in the power
sector. In this section, these issues are summarized.
(1) Pricing mechanism and subsidy
The oil product price is kept lower than the international market price with a subsidy of
US$ 3billion (calculated by domestic price - production cost) to promote domestic development
and to protect low-income groups and the residents of remote areas. This situation is a factor in
the reduced international competitiveness of existing industries and the pressure on the national
budget.
In addition, revenue from oil exports represents an economic loss for Indonesia, because the
domestic oil product price is not linked with the international market price and is kept lower
than the international market price.
(2) Monopoly system by Pertamina
According to the Indonesian constitution, the rights and interests of natural resources belong
to the state. Pertamina has enjoyed a monopoly of upstream and downstream activities in the
oil and gas sectors through a commission between it and the State based on the Law 8/1971.
However, obstacles related to Pertamina, Indonesia's state oil and gas company, are
becoming remarkable. The main obstacles are summarized below.
1) During the exploration and exploitation phase, production cost tends to be high and
productivity tends to be low, because of the length of time for exploration and exploitation
and/or the time it takes to get an exploration license from Pertamina.
2) Pertamina's supervising role in upstream activities is focused more on control than on
gaining added value for the Government.
3) Inefficient system in downstream activities, from refining to retailing of petroleum
products, without incentives for cost reduction in each process.
2.2.3 Present Status of New Oil and Gas Law
In response to the above-mentioned policy and issues, a New Oil and Gas Law was
developed to improve the efficiency of the energy sector. This draft law was already approved
by the House in Oct 2001 and was promulgated after the President's signature in Nov 2001.

2-15
This law focuses on liberalization and splitting of the upstream and downstream activities of
the oil and gas sector, i.e., 1) to split the function of oil and gas sector into upstream activities
(exploration and exploitation) and downstream activities (processing, transportation, storage
and/or trading), 2) to transfer the authority monopolized by Pertamina in both activities to an
Implementing Body and a Regulatory Body, and 3) to install a market mechanism to the
downstream activities.
1) Main provisions related to the upstream activities
- Implementing Body shall be responsible for the upstream activities. All existing rights,
obligations and consequences of the Production Sharing Contracts (PSCs) between
Pertamina and other parties shall be transferred to the Implementing Body.
- Main rights in the upstream activities are to conduct the execution of the Cooperation
Contract and to supervise and monitor the implementation of upstream activities.
- Business Entity (domestic capital) and Permanent Establishment (foreign capital) can
conduct the upstream activities based on the Cooperation Contract with the Implementing
Body.
- Pertamina will be transformed into a State-owned Limited Liability Company (Persero).
Therefore, Pertamina has to contract with the Implementing Body in order to continue the
upstream activities.
- Until the establishment of the Implementing Body after the time this law comes into
effect, Pertamina has to continue to perform its duties and functions of upstream
activities.
2) Main provisions related to the downstream activities
- Regulatory Body shall be responsible for the downstream activities.
- Main rights in the downstream activities are to make policy, to regulate and supervise on
the implementation of downstream activities based on the Business License.
- Business Entity (domestic capital) can conduct the downstream activities after receiving
Business License from the Government, but Permanent Establishment (foreign capital)
cannot receive Business License.
- Oil and gas price will be set through competition based on the market mechanism.
- Pertamina will be transformed into a State-owned Limited Liability Company (Persero).
It will have the required Business License for downstream activities after its
transformation.
- Until the establishment of the Regulatory Body after the time this law comes into effect,
Pertamina has to continue to perform its duties and functions of downstream activities.

2-16
2.2.4 Electric Power Policy
The government has consistently been expanding access to an affordable and reliable
electricity supply as a vital element of its strategy for rapid economic growth and equitable
social development. The government established PLN in 1950 as a national electricity utility
responsible for electricity generation and distribution throughout the country. In response to the
continuous power deficit, the 1985 Law No.25 allowed private enterprises and cooperatives to
participate in the electricity business as complements to PLN in areas where PLN was not able
to supply electricity. In addition, public financing of power development was insufficient to
meet the increasing demand so the government, through the 1992 Presidential Decree No.37,
allowed the private sector to participate in power generation projects as Independent Power
Producers (IPPs).
The policy for the use of primary energy is to increase the utilization of non-oil energy
sources. Accordingly, coal is increasingly utilized. The same is true for geothermal although
its use is not increasing as rapidly. The abundance of the coal supply has rapidly led to an
increased number of coal steam power plants. In contrast, the uncertainty of the geothermal
supply is an obstacle to increasing its development. Priority is actually given to renewable
energy such as hydropower. However, the isolation of hydropower sites, the need for large
space, and the high costs involved are obstacles to the development of hydropower. Efforts are
always taken to utilize hydropower at the micro-scale for rural areas that are far from PLN’s
grid or fuel oil distribution networks.
In order to create a competitive market and to improve the efficiency of the power sector, the
government developed a power sector’s restructuring program. The Power Sector
Restructuring Policy was released in August 1998 and it’s Implementation Plan in December
1998. Unbundling and privatization of PLN is in progress. In the Java-Bali system, there is
transmission, distribution, and generation, so there are many commercial business
opportunities. To facilitate competition, generation, transmission and distribution are separated
and multiple players are created in generation and distribution. In 1994, PLN converted to
public company status (Persero) of which 100% of shares were owned by the government. In
1995, the PLN Java-Bali generation assets were unbundled into two power generation
companies: Indonesia Power and PJB.
In the Java-Bali system, PLN unbundling and privatization are carried out systematically.
First, Strategy Business Units are established in PLN to prepare for unbundling. Next, the
generation and distribution sectors are separated from PLN. A Single Buyer system will be
2-17
introduced where PLN buys power from generation companies and IPPs and sells it to
distribution companies. Finally, a Multiple Buyer /Multiple Seller (MSMB) market for a
completely competitive market will be created. The electricity bill, which is the basis for power
restructuring and is now under deliberation in the House of Representatives.
The development of rural electricity will be carried out to achieve the goal of electrifying all
rural areas; either by expanding the network or installing isolated systems such as solar power
for households (Solar Home System). At present, PKUK (PLN) has a significant role in
implementing the rural electricity program by expanding the network. The cooperatives also
have a role in implementing this program, but it is small compared to PLN. Almost all the
financing for the PKUK (PLN) program is from the State budget so PLN’s rural electrification
project is regarded as a Government project.
Outside Java, the power sector consists of a number of small systems and sometimes an
isolated power system. The costs are high and the electrification ratio is low. Therefore,
electricity business cannot be conducted for profit in these areas and government support is still
needed. In these areas a Rural Electricity Company (REC) will be established, directly owned
by the government. This will allow restructuring at a slow pace. 2.2.5 Outline of Energy related Laws and Regulations
(1) New electricity law
The Electricity Bill was submitted to the House of Representatives in February 2001. Since
then discussion of the Bill has been going on and it is expected to be approved as soon as
possible. The new electricity law aims at providing sustainable and affordable power to
improve the public welfare and prosperity of the nation. Power development needs to be
undertaken through competition and transparency, in a sound business climate by means of an
arrangement which provides fair treatment to all business players and which benefits
consumers. Therefore, business opportunities are given to state enterprises, regional
enterprises, cooperatives and the private sector. The power development will take into account
environmental preservation, energy conservation, and energy diversification in line with the
national energy policy. The new law will replace Law No.15 of 1985. The key points of the law are:
1) PLN will lose its monopoly over the country’s power industry
2) The private sector will be allowed to do business in power generation and retailing, as
well as with PLN

2-18
3) The government will control power transmission and distribution networks, and charge
producers a fee to use them
4) All power producers will sell power to the public through competitive bidding. Producers
that offer the cheapest price will be allowed first access to the government-owned network.
Under the new law, the central government will be responsible for making general power
policy, such as, power demand forecasts, supply plans, transmission plans, finance plans,
subsidies and new & renewable energy utilization. On the other hand, local government will
be responsible for local business planning, such as, local demand forecasts, primary energy
studies and transmission planning considering the regional development plan.
Electricity will be supplied based on market competitiveness. A regulatory body will be
established in order to ensure the electricity industry introduces a competitive market. Its focus
will be guaranteeing fair competition, introducing an efficient electricity supply, promoting
sustainable new investment, ensuring reasonable profits for market players, and protecting the
interests of the community. The Social Electricity Development Fund (SEDF), managed by a
separate entity, will allocate subsidies to low-income consumers, underdeveloped areas and to
rural electrification. After enactment into law, there will be a seven (7) year transition period:
within a year of enactment, an executive body for SEDF will be established; within two years,
an independent regulating body will be established; within three years, a single buyer market
will be established; and within seven years, a fully competitive market will be established.
(2) Electricity tariff and policy
The electricity tariff is to be approved by the President. PLN submits an application to
MEME and after arrangement with related agencies, it is submitted to the President. Before the
economic crisis, the Electricity Tariff Adjustment Mechanism (EATM) was applied. Under this
system, the tariff was set every three (3) months in response to fuel price, IPP price, inflation
ratio and exchange rate to US$. However, the Rupiah devaluation in 1997 meant higher tariff
increases and the tariff was not increased as planned due to political considerations. In addition
to this, the dollar linked power purchase price from IPPs and the fuel price (coal and gas) meant
that PLN finances remained in the red.
In order to generate profits, PLN will increase the tariff from the current 3.5¢/kWh to 7¢
/kWh by 2005. The electricity tariff was increased by 30.1% in July and October 2001. The
tariff increase did not apply to low-income groups to protect these customers. In 2002, it will be
increased every three (3) months including low-income groups. Table 2.2.1 shows the
electricity-pricing schedule.

2-19
Table 2.2.1 Electricity Pricing Schedule (Average Tariff :Rp./kWh) 1999 2000 2001 2002 2003 2004 2005 Industrial Residential Commercial Public
210.3 197.7 317.2 265.8
299.6 210.9 378.6 265.8
365.2 311.0 447.7 460.6
429.3 395.1 506.2 507.1
480.8 442.5 566.9 568.0
533.7 485.8 623.5 624.7
587.1 535.4 686.0 687.3
Average 221.9 276.9 360.2 429.8 481.4 532.0 585.4 (Source) PLN
Although consumers in the same categories have paid the same charge for electricity even
though they are in different areas, a differential charge system will now be introduced. For
example, the tariff system in Irian Jaya should be different from Batam because of the different
income levels. In fact, PLN established a subsidiary company (Regional Electric Company)
and set its own tariff.
Rural areas are not profitable because of high generation costs and because they are
dominated by low tariff groups. Revenue generated in Java island is allocated to rural areas as
a cross subsidy. All costs cannot be recovered under this tariff because of the low incomes in
rural area. The government is going to continue to allocate a subsidy to support undeveloped
areas, by subsidizing electricity for low-income groups. The subsidy should be transparent.
The Social Electricity Development Fund (SEDF) will be created to finance the subsidy.
Through the fund, the difference between allowable costs and sales revenue will be made up for
to five distribution/retail companies in Java-Bali, and to REC outside Java. The allowable costs
should be set based on assumptions of efficient operation, not based on actual costs.
2.2.6 Outline of Electric Power related Agencies
The Ministry of Energy and Mineral Resources (MEMR) has the combined government role
of owner, policy-maker and regulator. It is necessary to separate these different roles.
Policy-making will be the responsibility of the Directorate General of Electricity and Energy
Utilization (DGEEU) under MEMR. The ownership role of PLN is transferred to the Ministry
of Empowerment of State-Owned Enterprises. In order to separate the regulatory role, the
Electricity Business Supervision was created in DGEEU and will be developed as an
autonomous agency responsible for the regulatory roles of the energy sector. Figure 2.2.2 and
2.2.3 show the organization chart of MEMR and PLN.

2-20
Figure 2.2.2 Organization Chart of MEMR
Minister
Directorate General of Electricity & Energy Utilization
Directorate General of Oil & Gas
Directorate General of Geology & Mineral Resources
Mineral Resources Education & Training Agency
Mineral Resources Research & Development Agency
Directorate of Electricity Program Supervision
Supply Program
Investment & Finance Social Electrification
Cooperation Information, Analysis and Evaluation
Directorate of Power Enterprise
Electric Power Industry
Price Analysis Business service
Consumer Protection Commercial Relation
Directorate of Electric Power Technology
Electric Power Standard
Electric Power Utilization Plan Electric Power Environment
Electric Power Technology Technology Application
Directorate of New, Renewable Energy and Energy Conservation
Energy Utilization
New & Renewable Energy Business Energy Conservation
Rural Energy Supporting Industry

2-21
Figure 2.2.3 Organization Chart of PLN
President Director
Vice President
1.Planning 2.Restructuring 3.Business Development 4.Environment 5.Tariff and Commercial 6.Business Performance 7.Law 8.Information Technology 9.Communication 10.Renegotiation IPP contract 11.Procurement
Planning Director
Secretariat
System planning team Corporate planning team
Analysis and Evaluation team Information technology team
Human Resources & Organization Team
Secretariat Human resources and organization team
Office facilities team Law and regulation team
Public relation team
Operation Director
Secretariat Operation team
Construction team
Marketing & Distribution Director
Secretariat
Customer service team Distribution team
Tariff commercial team Rural electrification team
Business development team
Finance Director
Secretariat
Casher team Accounting team
Budget team Loan financing team

2-22
2.3 Energy Supply and Demand in Indonesia
2.3.1 Resources and Reserves
Indonesian primary energy resources and the reserves are published by MIGAS, BP Amoco
Statistics, WEC (World Energy Council) and other international institutions. Taking into
consideration of the published data synthetically, Indonesia has crude oil proven reserves of 5.2
billion bbl (barrels), the natural gas proven reserves of 72.3 trillion standard cubic feet, and coal
reserves of about 5.3 billion short tones, at the end of 1999.
(1) Oil
According to BP Amoco Statistics 2001, the reserves and production of crude oil is shown in
Table 2.3.1.
Table 2.3.1 Reserves and Production of Crude Oil At the end of
1979 At the end of
1989 At the end of
1998 At the end of 1999
billion billion billion billion billion
Proved Reserves
barrels barrels barrels barrels tones Share R/P ratio Indonesia 9.6 8.2 5.0 5.0 0.7 0.5% 9.7
Asia Pacific Total 39.4 46.6 43.1 44.0 5.9 4.3% 16.3 World Total 650.1 1011.7 1052.0 1033.8 140.4 100.0% 41.0
Production
Million tones 1990 1991 1992 1993 1994 1995 1996 1997 1998 1999 Growth
98/99 Share
in 1999
Indonesia 71.9 78.3 74.1 74.3 74.3 73.9 74.1 73.1 71.6 68.2 –4.7% 2.0%Asia Pacific
Total 322.9 332.4 332.4 334.8 344.0 350.1 362.5 367.8 367.0 364.5 –0.7% 10.5%
World Total 3164.1 3151.9 3184.1 3184.2 3225.2 3272.0 3370.9 3468.5 3533.1 3452.2 –2.3% 100.0%
(Source) BP Amoco 2001
In the Table, the proved reserves of Indonesian crude oil are estimated 5.0 billion barrels at
the end of 1999, accounting for 0.5% of world total and 11.4 % of Asia Pacific total.
Reserve/Production (R/P) ratio is 9.7, while that of world average is 41.0. The oil production in
1999 was 68.2 million tones, with the decrease of 4.7% from the previous year.
Much of Indonesia's proven oil reserve base is located onshore. Central Sumatra is the
country's largest oil producing province where Duri and Minas oil fields are located. Other
significant oil field under development or production is located in accessible areas such as
offshore of northwestern Java, East Kalimantan, and the Natuna Sea. Table 2.3.2 shows the
regional distribution of hydrocarbon (oil and natural gas) reserves, and Table 2.3.3 shows the
oil and natural gas reserves and resources in whole Indonesia (by MIGAS).

2-23
Table 2.3.2 Distribution of Hydrocarbon Reserves Oil (million bbl) Natural Gas (TSCF)
Location Proven Potential Total Proven Potential Total Aceh 53.3 19.7 73.0 4.1 6.7 10.8 North Sumatra 162.1 59.5 221.6 1.2 0.3 1.5 Natuna 127.0 180.2 307.2 30.5 19.0 49.5 Central Sumatra 2,732.0 2,973.1 5,705.1 0.3 1.0 1.3 South Sumatra 428.6 319.8 748.4 6.3 3.8 10.1 West Java 621.9 487.4 1,109.4 4.5 2.3 6.7 East Java 232.2 91.7 323.9 2.8 3.1 5.9 East Kalimantan 760.9 475.9 1,236.7 27.7 20.1 47.8 South Sulawesi - - - 0.7 0.2 0.9 Irian Jaya 85.3 15.7 101.0 14.5 9.4 23.9 Total 5,203.2 4,623.1 9,826.3 92.5 65.8 158.3
(Source) MIGAS, January 1, 1999
Table 2.3.3 Reserves and Resources of Oil and Natural Gas Oil (billion bbl) Gas (TSCF) Reserves Onshore 7.7 113.1 Offshore 2.1 45.2 Total 9.8 158.3 Resources Onshore 19.3 73.0 Offshore 19.2 141.4 Total 38.4 214.4 (Source) MIGAS, January 1, 1999
Except for Exspan, Pertamina and Total companies, most of the country’s major producers
have experienced a downward trend in the output in recent years. Officials said that low
production levels would continue in 2000 since no large oil fields had been discovered in recent
years, and new oil-field development would be concentrated in smaller fields (on and offshore)
in the relatively well explored provinces of Sumatra, Java, and Kalimantan. The oil production
by major producers is shown in Table 2.3.4.
Table 2.3.4 Oil and Gas Production by Major Producers Oil and Condensate (1000 bbl/d) Gas mmscf
Company 1998 1999 2000 Jan-May
Producers 1998 1999 Share (% )
Caltex 759.5 746 719.3 Mobil Oil 921,865 794,299 25.9Maxus 148.2 140.1 126.2 Total Co. 79.2 81.2 86.4 Total Co. 604,447 684,565 22.3Arco 74.4 71.5 65.7 Arco 165,937 298,327 9.7Exspan 26.6 37.5 61.9 Pertamina 270,330 259,132 8.4Conoco 84.4 64.4 57.4 Gulf Res. 75,076 166,449 5.4Unocal 75.6 63.9 59.9 Unocal 143,764 162,903 5.3Vico 60.8 54.7 49.2 Vico 456,954 477,368 15.6Others 247.9 241.0 216 Others 340,479 225,306 7Total 1,556.6 1,500.3 1,442.0 Total 2,978,852 3,068,349 100.0(Source) MIGAS
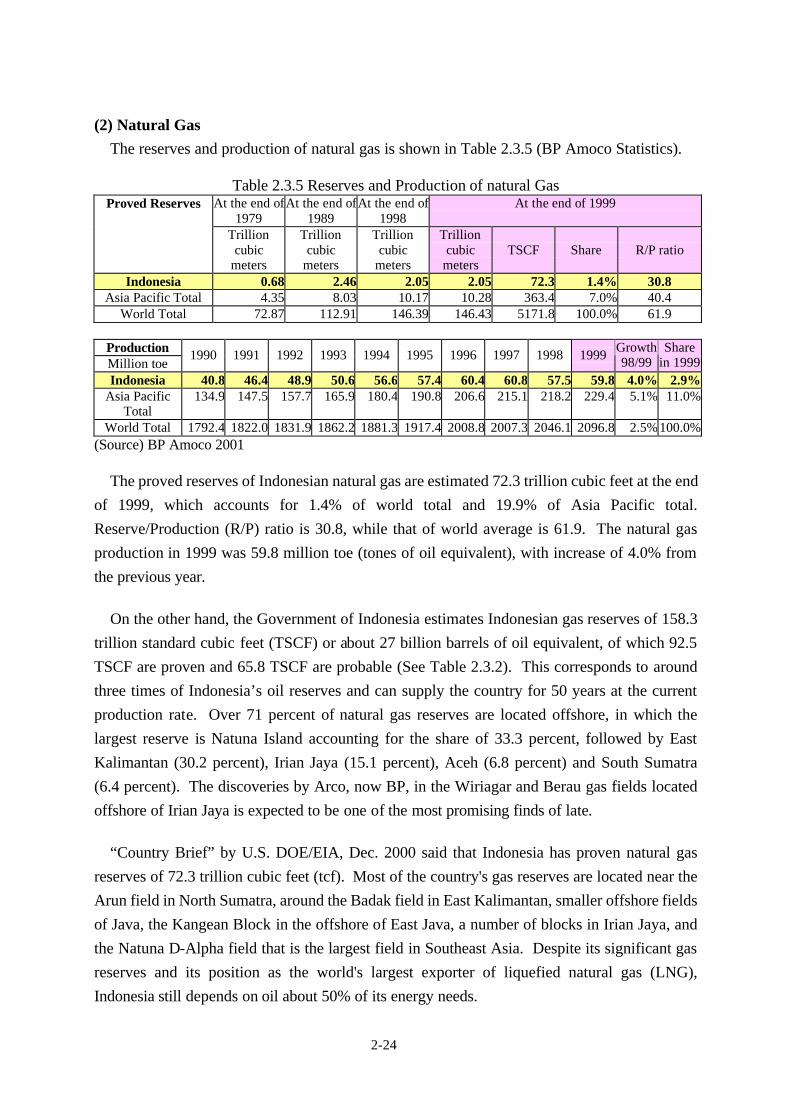
2-24
(2) Natural Gas
The reserves and production of natural gas is shown in Table 2.3.5 (BP Amoco Statistics).
Table 2.3.5 Reserves and Production of natural Gas At the end of
1979 At the end of
1989 At the end of
1998 At the end of 1999 Proved Reserves
Trillion cubic
meters
Trillion cubic
meters
Trillion cubic
meters
Trillion cubic
meters TSCF Share R/P ratio
Indonesia 0.68 2.46 2.05 2.05 72.3 1.4% 30.8 Asia Pacific Total 4.35 8.03 10.17 10.28 363.4 7.0% 40.4
World Total 72.87 112.91 146.39 146.43 5171.8 100.0% 61.9
Production Million toe
1990 1991 1992 1993 1994 1995 1996 1997 1998 1999 Growth 98/99
Share in 1999
Indonesia 40.8 46.4 48.9 50.6 56.6 57.4 60.4 60.8 57.5 59.8 4.0% 2.9%Asia Pacific
Total 134.9 147.5 157.7 165.9 180.4 190.8 206.6 215.1 218.2 229.4 5.1% 11.0%
World Total 1792.4 1822.0 1831.9 1862.2 1881.3 1917.4 2008.8 2007.3 2046.1 2096.8 2.5%100.0%(Source) BP Amoco 2001
The proved reserves of Indonesian natural gas are estimated 72.3 trillion cubic feet at the end
of 1999, which accounts for 1.4% of world total and 19.9% of Asia Pacific total.
Reserve/Production (R/P) ratio is 30.8, while that of world average is 61.9. The natural gas
production in 1999 was 59.8 million toe (tones of oil equivalent), with increase of 4.0% from
the previous year.
On the other hand, the Government of Indonesia estimates Indonesian gas reserves of 158.3
trillion standard cubic feet (TSCF) or about 27 billion barrels of oil equivalent, of which 92.5
TSCF are proven and 65.8 TSCF are probable (See Table 2.3.2). This corresponds to around
three times of Indonesia’s oil reserves and can supply the country for 50 years at the current
production rate. Over 71 percent of natural gas reserves are located offshore, in which the
largest reserve is Natuna Island accounting for the share of 33.3 percent, followed by East
Kalimantan (30.2 percent), Irian Jaya (15.1 percent), Aceh (6.8 percent) and South Sumatra
(6.4 percent). The discoveries by Arco, now BP, in the Wiriagar and Berau gas fields located
offshore of Irian Jaya is expected to be one of the most promising finds of late.
“Country Brief” by U.S. DOE/EIA, Dec. 2000 said that Indonesia has proven natural gas
reserves of 72.3 trillion cubic feet (tcf). Most of the country's gas reserves are located near the
Arun field in North Sumatra, around the Badak field in East Kalimantan, smaller offshore fields
of Java, the Kangean Block in the offshore of East Java, a number of blocks in Irian Jaya, and
the Natuna D-Alpha field that is the largest field in Southeast Asia. Despite its significant gas
reserves and its position as the world's largest exporter of liquefied natural gas (LNG),
Indonesia still depends on oil about 50% of its energy needs.

2-25
(3) Coal
The reserves and production of coal is shown in Table 2.3.6 (BP Amoco Statistics).
Table 2.3.6 Reserves and Production of Coal Reserves at the end of 1999
Million tones Anthracite and
Bituminous Sub-bituminous
and Lignite Total Share R/P ratio
Indonesia 770 4450 5220 0.5% 80 Asia Pacific Total 184450 107895 292345 29.7% 164
World Total 509491 474720 984211 100.0% 230
Production Million toe
1990 1991 1992 1993 1994 1995 1996 1997 1998 1999 Growth 98/99
Share in 1999
Indonesia 6.4 8.7 14.2 17.0 19.1 25.5 31.0 33.7 37.1 40.1 8.2% 1.9%Asia Pacific
Total 815.3 829.7 859.9 885.7 927.7 977.7 1040.0 1031.0 999.2 884.3–11.5% 42.0%
World Total 2269.1 2197.6 2189.5 2131.8 2182.8 2221.4 2285.6 2289.8 2238.9 2103.5 –6.1%100.0%(Source) BP Amoco 2001 The reserves of Indonesian coal are estimated 5.22 billion tones at the end of 1999, which
accounts for 0.5% of world total and 1.8 % of Asia Pacific total. Reserve/Production (R/P) ratio
is 80, while that of world average is 230. The coal production in 1999 was 40.1 million tones,
with the increase of 8.2% from the previous year.
On the other hand, the Directorate of Mineral and Coal Enterprises (DOC) Ministry of
Energy and Mineral Resources (MEMR) has identified 38.8 billion tones of coal deposits, of
which 11.5 billion tones are classified as the measured resources and 27.3 billion tones as the
indicated, inferred and hypothetical resources, and 5.4 billion tones is classified as the
commercially exploitable reserves (See Figure 2.3.7). Major coal resource areas are
Kalimantan and Sumatra, estimated at 21.1 billion tones and 17.8 billion tones, respectively.
Coal deposits in Sumatra are located largely in the area surrounding Tanjung Enim, South
Sumatra. These deposits are mined by a state-owned coal company, Perusahaan Tambang
Batubara Bukit Asam (PTBA). Kalimantan has high quality coal deposits. Coal contractors
operating in Kalimantan have the rights to exploit a total of 6.5 billion tones of the measured
reserves. Kaltim Prima Coal possesses the largest measured reserves estimated at 1.3 billion
tones, followed by Arutmin Indonesia and Adaro Indonesia with one billion tones each.
Regarding coal production, Indonesia plans to double coal production over the next five
years, mostly for exports to other countries in East Asia and India. The new capacity will come
primarily from private mines. The Clough Group of Australia was awarded a US$215-million
contract for improvements at the Indonesian firm GBP's Kutai mine in East Kalimatan.
Another foreign firm with major interests in Indonesian coal mining is Australia's Broken Hill
Proprietary (BHP).

2-26
Table 2.3.7 Indonesian Coal Resources Resources Mineable Company
(Million tones) Measured Indicated Total Reserves
PTBA 1,902 4,657 6,559 2,804
Contractors 8,998 22,185 31,183 2,054
Others 584 442 1,026 504
TOTAL 11,484 27,284 38,768 5,362
(Source) Directorate of Mineral and Coal Enterprises
Figure 2.3.1 Distribution of Coal Reserves in Indonesia
(Source) Directorate of Mineral and Coal Enterprises
KALIMANTAN
JAVA
SULAWESI
IRIAN JAYA
100%
79,4%9,1%
11,3%
0,2%
SUMATRA
95,7%
0,9%
2,3%
100 %
1 0 0 %
94,3%
5,7%
84,5%15,5%
63,5% 36,5%
18.8 Bill.T
4.2 Bill.T
0.06 Bill.T
2.6 Bill.T
3.7 Bill.T
5.3 Bill.T
0.03 Bill.T
1.7 Bill.T
TOTAL INDONESIA
ANTHRACITE 0.1 Bill.T ( 0.3%)BITUMINOUS 5.2 Bill.T ( 14.3%)SUB-BITUMINOUS 9.7 Bill.T ( 26.7%) LIGNIT 21.6 Bill.T ( 58.7%)TOTAL 36.6 Bill.T ( 100%)
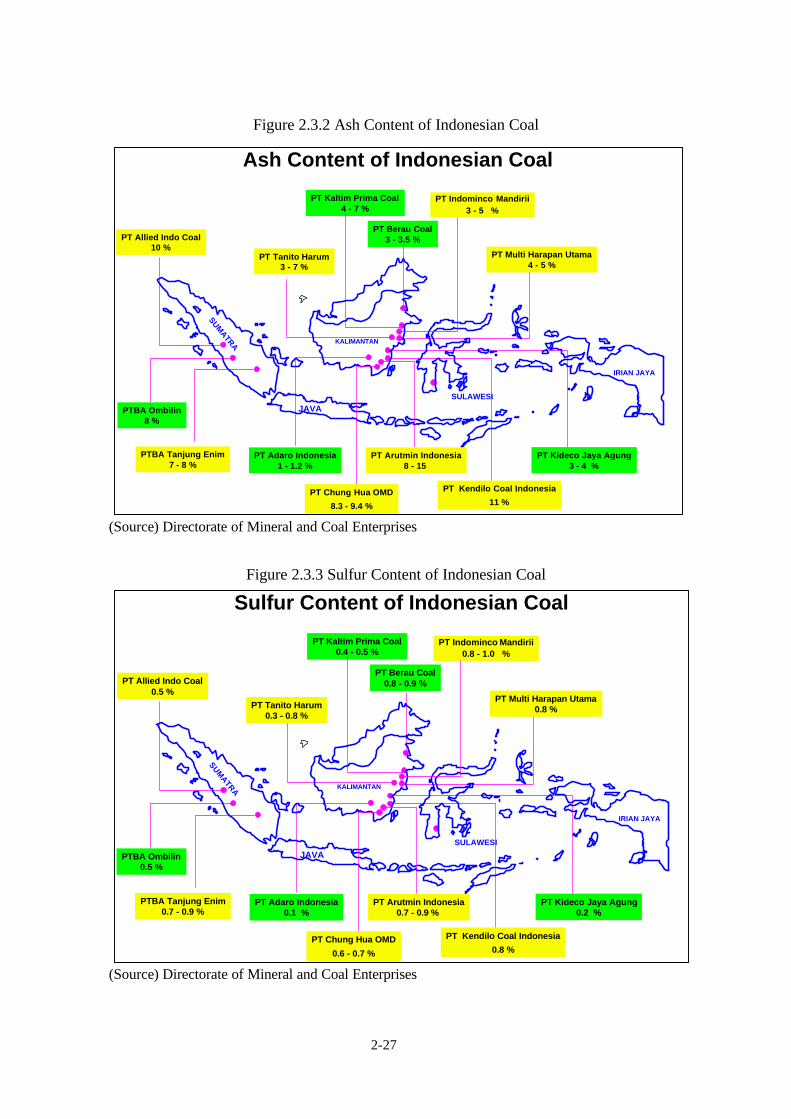
2-27
Figure 2.3.2 Ash Content of Indonesian Coal
(Source) Directorate of Mineral and Coal Enterprises
Figure 2.3.3 Sulfur Content of Indonesian Coal
(Source) Directorate of Mineral and Coal Enterprises
Ash Content of Indonesian Coal
JAVAPTBA Ombilin8 %
PTBA Tanjung Enim7 - 8 %
PT Adaro Indonesia1 - 1.2 %
PT Allied Indo Coal10 %
PT Berau Coal3 - 3.5 %
PT Kaltim Prima Coal4 - 7 %
PT Tanito Harum3 - 7 %
PT Kendilo Coal Indonesia
11 %
PT Kideco Jaya Agung3 - 4 %
PT Multi Harapan Utama4 - 5 %
KALIMANTAN
SUM
ATR
A
SULAWESI
IRIAN JAYA
PT Indominco Mandirii3 - 5 %
PT Arutmin Indonesia8 - 15
PT Chung Hua OMD
8.3 - 9.4 %
Sulfur Content of Indonesian Coal
JAVAPTBA Ombilin0.5 %
PTBA Tanjung Enim0.7 - 0.9 %
PT Adaro Indonesia0.1 %
PT Allied Indo Coal0.5 %
PT Berau Coal0.8 - 0.9 %
PT Kaltim Prima Coal0.4 - 0.5 %
PT Tanito Harum0.3 - 0.8 %
PT Kendilo Coal Indonesia
0.8 %
PT Kideco Jaya Agung0.2 %
PT Multi Harapan Utama0.8 %
KALIMANTAN
SUM
ATR
A
SULAWESI
IRIAN JAYA
PT Indominco Mandirii0.8 - 1.0 %
PT Arutmin Indonesia0.7 - 0.9 %
PT Chung Hua OMD
0.6 - 0.7 %

2-28
2.3.2 Exploration of Primary Energy Resources
The Government of Indonesia tries to enhance the production from existing fields and makes
effort to discover new fields.
In 1999, Indonesian oil production, including condensate, declined by 3.6 percent to an
average of 1.50 million bbl/d from 1.56 million bbl/d in 1998. Crude oil production, excluding
condensate, peaked at 1.391 million bbl/d in February 1999. Condensate is mainly produced at
the Arun field in North Sumatra as a by-product of the oil and natural gas production process.
However, because of dwindling gas reserves in the Arun field, the reduction of gas production
resulted in the less produced condensate. Production of condensate fell to 149.1 thousand bbl/d
in 1999 from 155.3 thousand bbl/d in 1998 and 162.8 thousand bbl/d in 1997.
Indonesia's recent oil production has remained relatively flat as the result of the introduction
of crude streams from new and smaller fields, which has helped to compensate for declines at
many of the country's mature oil fields. To meet its goal of oil production, Indonesia has
stepped up efforts to sign new oil exploration contracts. Seven new production-sharing
contracts (PSCs) were awarded in May 2000, up from only four in the 1999 bidding round. The
majority of Indonesia's producing oil fields are located in the central and western sections of the
country. Therefore, the focus of new exploration has been on frontier regions, particularly in
eastern Indonesia. Sizable, but as of yet unproven, reserves may lie in the numerous,
geologically complex, pre-tertiary basins located in eastern Indonesia. These regions are much
more remote and the terrain more difficult to explore than areas of western and central
Indonesia (“Country Brief” by U.S. DOE/EIA, Dec. 2000).
Of the estimated 60 oil basins, over 22 have been extensively explored. Most oil exploration
is currently being carried out in the basins of Western Indonesia under PSCs. The bulk of
Indonesia’s oil reserves are located onshore and offshore in Central Sumatra and Kalimantan.
The Government has placed increased emphasis on developing oil reserves in remote locations,
such as Papua, where proven reserves are estimated at 85 million barrels (“Petroleum Report”
by US Embassy in Jakarta).
A total of 22 wildcat and appraisal gas wells were drilled in 1999. Oil companies, however,
do not actively explore for gas in Indonesia, due to disincentives in the pricing for domestic gas.
Rather, as the ratio of gas to oil accumulations is high in Indonesia, most gas fields have been
discovered during oil exploration (“Petroleum Report” by US Embassy in Jakarta).
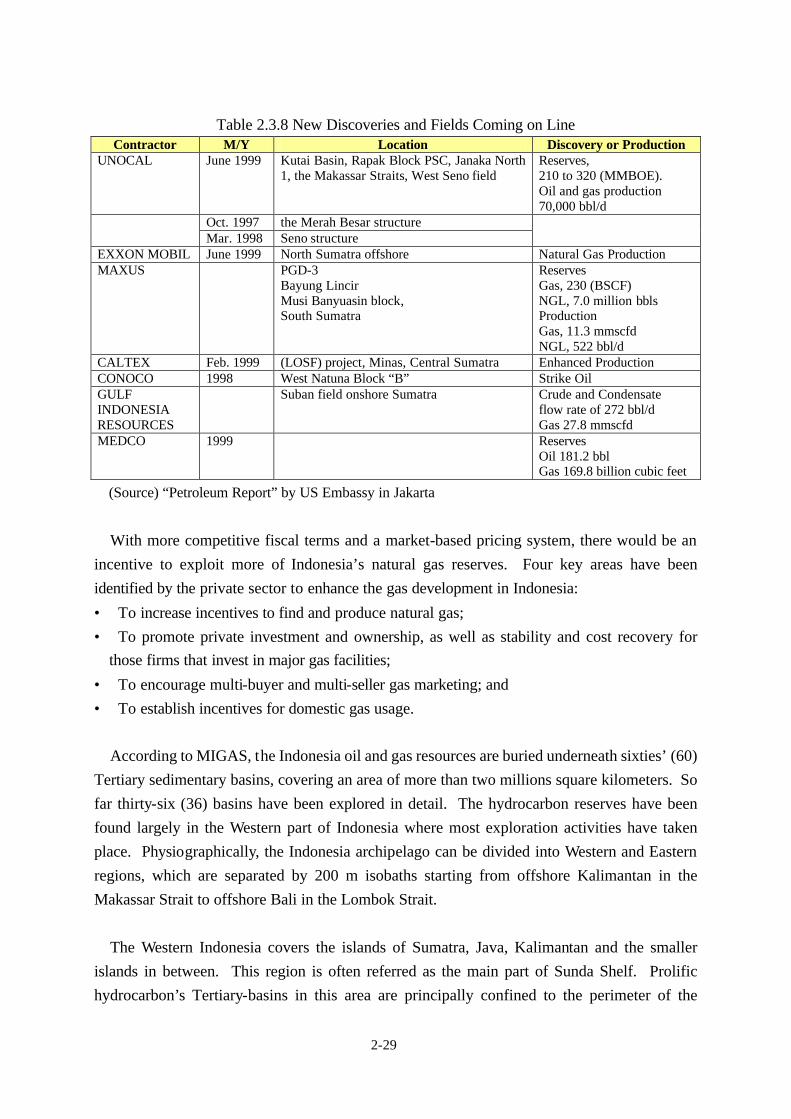
2-29
Table 2.3.8 New Discoveries and Fields Coming on Line Contractor M/Y Location Discovery or Production
UNOCAL June 1999 Kutai Basin, Rapak Block PSC, Janaka North 1, the Makassar Straits, West Seno field
Reserves, 210 to 320 (MMBOE). Oil and gas production 70,000 bbl/d
Oct. 1997 the Merah Besar structure Mar. 1998 Seno structure
EXXON MOBIL June 1999 North Sumatra offshore Natural Gas Production MAXUS PGD-3
Bayung Lincir Musi Banyuasin block, South Sumatra
Reserves Gas, 230 (BSCF) NGL, 7.0 million bbls Production Gas, 11.3 mmscfd NGL, 522 bbl/d
CALTEX Feb. 1999 (LOSF) project, Minas, Central Sumatra Enhanced Production CONOCO 1998 West Natuna Block “B” Strike Oil GULF INDONESIA RESOURCES
Suban field onshore Sumatra Crude and Condensate flow rate of 272 bbl/d Gas 27.8 mmscfd
MEDCO 1999 Reserves Oil 181.2 bbl Gas 169.8 billion cubic feet
(Source) “Petroleum Report” by US Embassy in Jakarta
With more competitive fiscal terms and a market-based pricing system, there would be an
incentive to exploit more of Indonesia’s natural gas reserves. Four key areas have been
identified by the private sector to enhance the gas development in Indonesia:
• To increase incentives to find and produce natural gas;
• To promote private investment and ownership, as well as stability and cost recovery for
those firms that invest in major gas facilities;
• To encourage multi-buyer and multi-seller gas marketing; and
• To establish incentives for domestic gas usage.
According to MIGAS, the Indonesia oil and gas resources are buried underneath sixties’ (60)
Tertiary sedimentary basins, covering an area of more than two millions square kilometers. So
far thirty-six (36) basins have been explored in detail. The hydrocarbon reserves have been
found largely in the Western part of Indonesia where most exploration activities have taken
place. Physiographically, the Indonesia archipelago can be divided into Western and Eastern
regions, which are separated by 200 m isobaths starting from offshore Kalimantan in the
Makassar Strait to offshore Bali in the Lombok Strait.
The Western Indonesia covers the islands of Sumatra, Java, Kalimantan and the smaller
islands in between. This region is often referred as the main part of Sunda Shelf. Prolific
hydrocarbon’s Tertiary-basins in this area are principally confined to the perimeter of the

2-30
continental margins in the Sunda Shelf. The Eastern Indonesia covers the principal island of
Sulawesi, Maluku, and Irain Jaya, Arafura Sea, Banda and Timor Sea. This region lie on the
Sahul Shelf, which stretches Northwards of the Australian Continent presently, oil and gas
discoveries in the Eastern Indonesia are from both of Tertiary and pre-Tertiary reservoir rocks.
Sedimentary basins in Western Indonesia are mostly located onshore or in shallow water
while in Eastern Indonesia are mainly located in deep water depth. Roughly, 30% of the
offshore basins in Western Indonesia and 80% in Eastern Indonesia are classified as deep-sea
basins. Many of the prolific Tertiary basins in Sumatra, Java, and Kalimantan can be classified
as mature stages in the exploration, whereas productions of some of their fields are declining.
On the contrary, most sedimentary basins in Eastern Indonesia are poorly explored. These
under explored basins are located in remote areas, in deep sea or other geologically complex
regions. Eastern Indonesia, presently, can be considered as frontier area.
Table 2.3.9 Discoveries and Production of Oil and natural Gas Field Contractor M/Y Location Discovery or Production
Indonesia Total Dec. 1999 Tunu and Mahakam, Peciko gas field, East Kalimantan
Proven Gas Reserves 19.5 TSCF Production
100 mmscfd started 400 mmscfd expected 800 mmscfd in 2000
Daily Total 470 million BOE 60% of Bontang LNG
EXXON MOBIL
2001 Merah Besar, offshore East Kalimantan, Makassar strait PSC
Gas Reserves 100 & 200 million BOE
BP, Nippon Oil Kanematsu Occidental, BG, Cairn, Nissho Iwai
Wiriagar, Berau, Muturi, Tangguh, Ilian Jaya
Proven Gas Reserves 14.4 TSCF
BP 2004 Terang-Sirasun, Kangean PSC, Ilian Jaya
1 TSCF
Exxon-Mobile Pertamina
TAGP from East Natuna AL field 46 TSCF Sales 2400 mmcfd, 15 million tons/y LNG for 40
years Pertamina SembGas
Mid 2001 West Natuna to Malaysia, TAGP 325 mmscfd for 22 years
Pertamina Conoco Gulf Ind.
July 2002
West Natuna to Malaysia, TAGP 100 mmscfd 250 mmscfd in 2004
SantaFe Devon
mid-2003 South Sumatra Gas Project Reserves 2.36 Tcf 150 mmscfd 350 mmscfd in 2009
PGN Gas pipe line to Singapore via Batam East Timor Australia
Timor Gap Exploiting contract
(Source) “Petroleum Report” by US Embassy in Jakarta
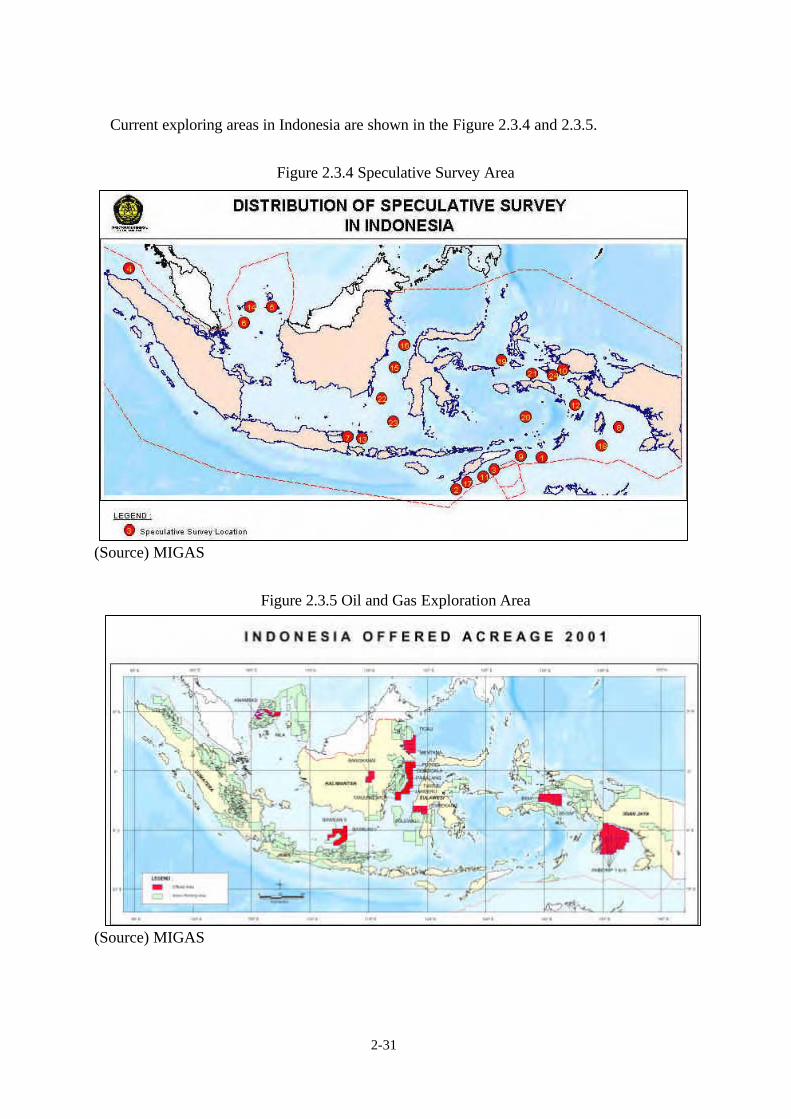
2-31
Current exploring areas in Indonesia are shown in the Figure 2.3.4 and 2.3.5.
Figure 2.3.4 Speculative Survey Area
(Source) MIGAS
Figure 2.3.5 Oil and Gas Exploration Area
(Source) MIGAS

2-32
<Reference>
The main fields and major facilities concerning oil and gas are as follows.
(1) Oil
Major Producing Oil Fields:
Duri, Minas, Belida, Ardjuna, Arun, KG/KRA, Widuri, Nilam, Attaka
Oil Refineries (operating capacity-bbl/d, December 1999):
Cilacap, Central Java (380,000);
Pertamina-Balikpapan, Kalimantan (240,920);
Musi, South Sumatra (109,155);
EXOR-1, Balongan, Java (125,000);
Dumai, Central Sumatra (114,000);
Sungai Pakning, Central Sumatra (47,500);
Pangakalan Brandan, North Sumatra (4,750);
Cepu, Central Java (3,420)
Product Pipelines:
Trans-Java (serving the Surabaya market)
(2) Natural Gas
Major Gas Fields:
Sumatra: Arun, Alur Siwah, Kuala Langsa, Musi, South Lho Sukon, Wampu
East Kalimantan: Attaka, Badak, Bekapai, Handil, Mutiara, Nilam, Semberah, Tunu
Natuna Sea:
Natuna Java: Pagerungan, Terang/Sirasun
Irian Jaya: Tangguh
Major Gas Pipelines:
Sumatra: Pangkalan Brandan-Dumai
LNG Plants:
Arun, Bontang

2-33
2.3.3 Renewable Energy (1) Hydropower potential
The hydropower potential study was carried out by PLN in 1999. Table 2.3.10 shows the
results of the study. The total hydropower potential including undeveloped, planned, under
construction, and developed potential is estimated to be 81,859 MW in Indonesia. The total
hydropower potential in the Java Bali area is estimated to be 5,795 MW.
Table 2.3.10 Hydropower Potential in Indonesia (MW)
Area Undeveloped Planned and Under Construction Developed Total
Java Bali 2,238 1,552 2,005 5,795 Wilayah I (Aceh) 6,367 1,059 0 7,426 Wilayah II (Sumatra) 3,077 921 603 4,601 Wilayah III (Sumatra) 4,094 707 79 4,880 Wilayah IV (Sumatra) 4,277 497 16 4,790 Wilayah V (Kalimantan) 5,469 257 0 5,726 Wilayah VI (Kalimantan) 10,492 780 30 11,302 Wilayah VII (Sulawesi) 4,163 150 31 4,344 Wilayah VIII (Sulawesi) 6,814 947 291 8,052 Wilayah IX (Maluku) 599 66 0 665 Wilayah X (Irian Jaya) 23,109 72 0 23,181 Wilayah XI (Nusateggara) 988 109 0 1,097
Total 71,687 7,117 3,055 81,859
(Source: PLN)
There is much-undeveloped hydropower potential in Indonesia. Most of the potential is
located in Sumatra, Kalimantan and Irian Jaya, outside Java Bali. In these areas, it is expected
that hydropower will be an available primary energy, in addition to coal and gas. However, in
these areas, hydropower is not being developed due to the small and scattered demand and
inadequate transmission lines.
Hydropower sites have been developed mostly on Java Island. In addition, there are some
potential sites of conventional hydropower in the Java-Bali area. Table 2.3.11 shows the 2001
development plan for the Java-Bali area. At the minimum a pre-feasibility study has been
conducted on these development sites. However, most of these sites are difficult to develop due
to economic and socio-environmental reasons, such as high construction costs and resettlement
of communities. Due to this, they have not been promoted to develop conventional hydropower
stations. Nevertheless, pumped storage power stations are considered for future peak demand
in Java-Bali area.

2-34
Table 2.3.11 Hydropower Development Plan in Java-Bali Area Name River Type Installed Capacity
(MW) Ciliman Climan RES 5.3 Rajamandala Citarum ROR 55.0 Cipasang Cimanuk RES 400.0 Jatigede Cimanuk RES 250.0 Cibuni 3 Cibuni RES 172.0 Cibuni 4 Cibuni RES 71.1 Cikaso 3 Cikaso RES 29.8
West Java
Cimandiri Cimandiri RES 352.0 Maung K..Serayu RES 360.0 Gintung K.Serayu RES 19.2
Central Java
Rawalo 1 K.Serayu LHD 0.6 Grindulu 2 K.Grinau RES 16.3 East Java Kesamben Brantas ROR 37.0
(Source: PLN) RES; Reservoir Type
ROR; Run of river Type
LHD; Run of river Type with a low head dam
(2) Geothermal power potential
The geothermal power potential was studied by Pertamina in 1995. Table 2.3.12 shows the
results of the study. The geothermal power potential is estimated to be 19,658 MW in Indonesia.
The geothermal power potential in Java Bali is estimated to be 5,681 MW.
Table 2.3.12 Geothermal Power Potential in Indonesia Area Potential (MW)
Java Bali 5,681 Aceh & North Sumatra 3,705 Central & South Sumatra 5,857 Lombok 0 Sumbawa 250 Frores 1,850 North Sulawesi 815 Other Sulawesi 750 Maluku Islands 750
Total 19,658 (Source: PLN)
As Indonesia is an island country with many volcanic areas, there is much geothermal power
potential. The geothermal power potential distributed in Indonesia is expected to be a primary
energy, in addition to coal and gas.

2-35
A total installed capacity of 727 MW of geothermal power has been developed in Indonesia
by PLN and IPPs, most of it is located in Java island. In addition, there is much undeveloped
geothermal potential. Table 2.3.13 shows the 2001 development plan in the Java-Bali area.
However, many sites are difficult to develop due to economic and environmental reasons.
Geothermal power development by PLN is not progressing. It is expected that development
will be promoted under the IPP scheme in the future.
Table 2.3.13 Geothermal Power Development Plan in Java-Bali Area Name Area Installed
Capacity (MW) (Java-Island) Kamojang 4 West Java 60 Salak 7 West Java 55 Wayag-Windu 2 West Java 110 Karaha West Java 220 Cibuni West Java 10 Patuha West Java 220 Dieng Central Java 95 (Bali-Island) Bedugul Bali Bali 220
(Source: PLN)
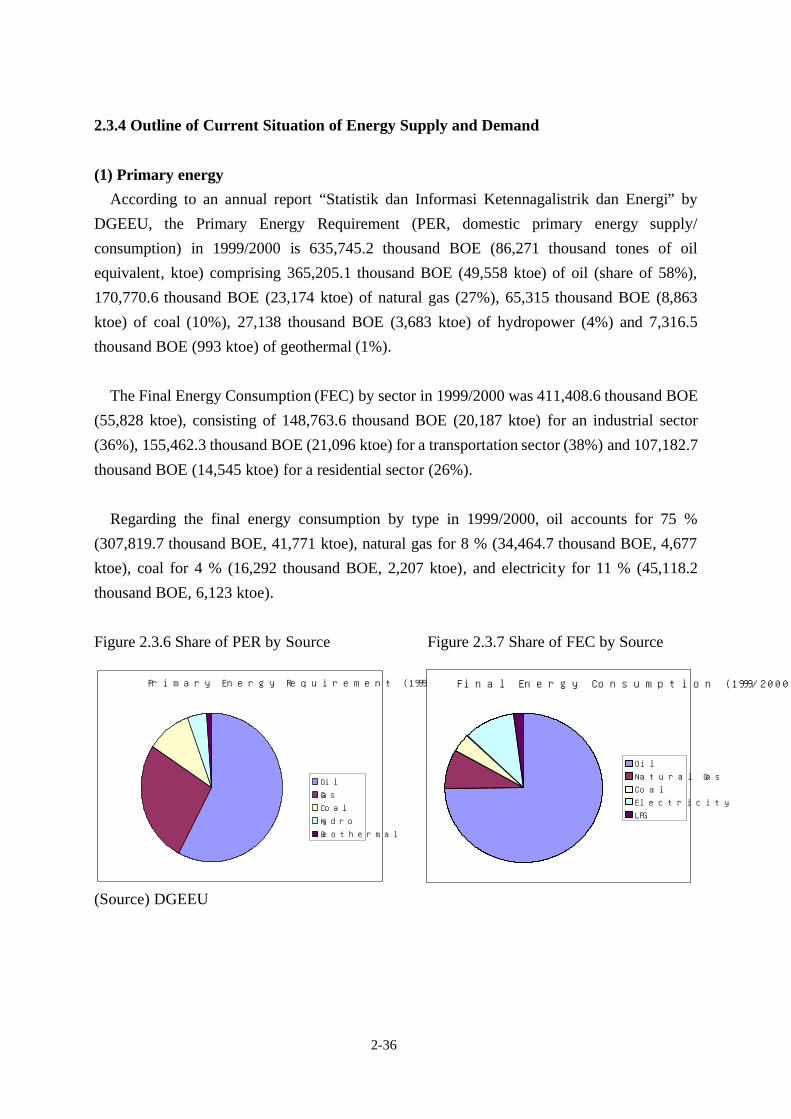
2-36
2.3.4 Outline of Current Situation of Energy Supply and Demand
(1) Primary energy
According to an annual report “Statistik dan Informasi Ketennagalistrik dan Energi” by
DGEEU, the Primary Energy Requirement (PER, domestic primary energy supply/
consumption) in 1999/2000 is 635,745.2 thousand BOE (86,271 thousand tones of oil
equivalent, ktoe) comprising 365,205.1 thousand BOE (49,558 ktoe) of oil (share of 58%),
170,770.6 thousand BOE (23,174 ktoe) of natural gas (27%), 65,315 thousand BOE (8,863
ktoe) of coal (10%), 27,138 thousand BOE (3,683 ktoe) of hydropower (4%) and 7,316.5
thousand BOE (993 ktoe) of geothermal (1%).
The Final Energy Consumption (FEC) by sector in 1999/2000 was 411,408.6 thousand BOE
(55,828 ktoe), consisting of 148,763.6 thousand BOE (20,187 ktoe) for an industrial sector
(36%), 155,462.3 thousand BOE (21,096 ktoe) for a transportation sector (38%) and 107,182.7
thousand BOE (14,545 ktoe) for a residential sector (26%).
Regarding the final energy consumption by type in 1999/2000, oil accounts for 75 %
(307,819.7 thousand BOE, 41,771 ktoe), natural gas for 8 % (34,464.7 thousand BOE, 4,677
ktoe), coal for 4 % (16,292 thousand BOE, 2,207 ktoe), and electricity for 11 % (45,118.2
thousand BOE, 6,123 ktoe).
Figure 2.3.6 Share of PER by Source Figure 2.3.7 Share of FEC by Source
(Source) DGEEU
Primary Energy Requirement (1999/2000)
Oil
Gas
Coal
Hydro
Geothermal
Final Energy Consumption (1999/2000)
Oil
Natural Gas
Coal
Electricity
LPG

2-37
(2) Electricity
In 1999/2000, the capacity of the national power system was 38,599 MW, consisting of the
installed PLN power system 22,732 MW, non-PLN 15,215 MW and private sector 651.8 MW.
Compared to the year 1998/99 (35,676MW), the capacity of the national power system was the
increase of 2,923 MW (8 % up).
The transmission lines increased from 23,860.91 to 24,388.74 kmc (527.83 kmc up). JTET
(extra high voltage transmission lines) was the increase of 102.2 kmc, and JTT (high voltage
transmission lines) was the increase of 426 kmc. The sub-stations increased from 45,361 MVA
to 46,783 MVA. In distribution, JTM (Medium Voltage Lines) was the increased of 21,524 kmc.
JTR (Low Voltage Lines) 21,995 kmc and distribution sub stations 385 MVA.
The supply of electricity in 1999/2000 was 87,999,212 MWh, consisting of PLN’s
production of 83,164,466 MWh and a purchase of 4,834,746 MWh. The sale of PLN electricity
was 73,560,041 MWh, with an increase of 693,882 MWh over 1998/99. Sales to an industrial
sector were 32,412,088 MWh (44%), while that to a residential sector 26,015,859 MWh (35%),
to a commercial/business sector 9,569,216 MWh (13%) and to a public sector 3,382,801 MWh
(4.6%).
The number of customers reached 27,726,932 with an increase of 953,288 (3.56 %). The
residential sector was the largest group of customers, numbering in 26,015,859 with the share
of 93.8 % to total customers. Rural residential customers totaled 18,683,181 equivalent to
67.38 % of the residential group. Until 1999/2000 the electrification ratio has realized 56.75 %
from 56.2 % of 1998/99. The electrified villages in 1999/2000 reached 48,675 villages. The
total number of villages is 61,975 consisting of 39,317 villages outside of Java and 22,658
villages in Java. The village electrification ratio is 78.54 %, while the ratio of outside Java was
67.49 % and in Java 97.71 %.
Transmission losses decreased by 2,116,563 MWh, and distribution losses decreased by
7,862,392 MWh. This represents the ratio of 2.52 % and 9.12 % in overall transmission and
distribution losses respectively.
As of March 31, 2000, the capacity of independent power plants is 1,586.3 MW comprising
of South Sulawesi of 220 MW, Irian Jaya of 120 MW, Central Java of 26 MW, and West Java of
800 MW. The installed capacity of the non-PLN was 15,215.02 MW, while the captive power
permitted was 8,979.79 MW.

2-38
2.3.5 Energy Balance Table and Energy Flow
Table 2.3.14 shows a simple example of Energy Balance Table. Energy flow is from energy
production, to primary energy supply, to energy conversion and to final energy consumption.
Figure 2.3.8 shows the schematic energy flow chart and Figure 2.3.9 shows the energy flow by
energy carrier in the block diagram.
Indonesia, the representative energy producer in Asia, is an energy export country of coal,
crude oil, petroleum products and natural gas. However, petroleum products such as kerosene
and gas oil (diesel oil) are dependent on import at present.
Table 2.3.14 Energy Balance Table in 1999
(Source) IEA, “Energy Balances of Non-OECD Countries, 2001”
1999 Thousand tonnes of oil equicalent
Coal Crude OilPetroleumProducts
NaturalGas
Hydro GeothermalCombustibleand Waste Electricity Total
Indigenous Production 44,282 70,312 0 61,884 806 2,346 46,748 0 226,378Imports 302 11,726 11,242 0 0 0 0 0 23,270Exports -33,528 -34,738 -10,246 -34,055 0 0 -104 0 -112,671International Marine Bunkers 0 0 -308 0 0 0 0 0 -308Stock Changes 517 0 -1,066 0 0 0 0 0 -549Total Primary Energy Supply 11,573 47,300 -377 27,829 806 2,346 46,644 0 136,121
Transfers 0 -1,828 1,551 0 0 0 0 0 -277Statistical Differences -303 3,094 -740 -2 0 0 0 0 2,049Public Electricity Plants -7,151 0 -3,129 -5,198 -806 -2,346 0 6,882 -11,749Autoproducer Electricity Plants 0 0 -369 -656 0 0 0 366 -660Public CHP Plants 0 0 0 0 0 0 0 0 0Autoproducer CHP Plants 0 0 0 0 0 0 0 0 0Public Heat Plants 0 0 0 0 0 0 0 0 0Autoproducer Heat Plants 0 0 0 0 0 0 0 0 0Heat pumps 0 0 0 0 0 0 0 0 0Electric boilers 0 0 0 0 0 0 0 0 0Gas Works 0 0 0 800 0 0 0 0 800Petroleum Refineries 0 -48,566 46,985 0 0 0 0 0 -1,580Coal Transformation -1 0 0 0 0 0 0 0 -1Liquefaction Plants 0 0 322 -386 0 0 0 0 -64Other Transformation 0 0 0 0 0 0 -71 0 -71Own Use 0 0 -2,331 -14,488 0 0 0 -255 -17,075Distribution Losses 0 0 0 0 0 0 0 -858 -858
Total Final Consumption 4,117 0 41,912 7,897 0 0 46,573 6,135 106,634
Industry Sector 1,850 0 8,608 6,571 0 0 0 2,695 19,724Iron and Steel 127 0 1,197 721 0 0 0 0 2,045Chemical and Petrochemical 0 0 1,227 5,488 0 0 0 0 6,715Non-Metallic Minerals 1,108 0 1,386 57 0 0 0 0 2,551Machinery 0 0 67 0 0 0 0 0 67Mining and Quarrying 0 0 1,096 0 0 0 0 0 1,096Food and Tobacco 0 0 771 0 0 0 0 0 771Paper, Pulp and Printing 0 0 0 0 0 0 0 0 0Wood and Wood Products 0 0 0 0 0 0 0 0 0Construction 0 0 333 0 0 0 0 0 333Textile and Leather 0 0 1,270 0 0 0 0 0 1,270Non-specified Industry 616 0 1,261 305 0 0 0 2,695 4,877
Transport Sector 0 0 19,901 0 0 0 0 0 19,901International Civil Aviation 0 0 465 0 0 0 0 0 465Domestic Air Transport 0 0 0 0 0 0 0 0 0Road 0 0 17,750 0 0 0 0 0 17,750Rail 0 0 0 0 0 0 0 0 0Pipeline Transport 0 0 0 0 0 0 0 0 0Internal Navigation 0 0 1,685 0 0 0 0 0 1,685
Other Sectors 2,267 0 12,710 1,326 0 0 46,573 3,440 66,316Agriculture 0 0 1,784 0 0 0 0 0 1,784Commercial and Public Services 0 0 333 400 0 0 0 802 1,536Residential 2,267 0 10,593 926 0 0 46,573 2,312 62,671Non-specified Other 0 0 0 0 0 0 0 325 325
Non-Energy Use 0 0 692 0 0 0 0 0 692
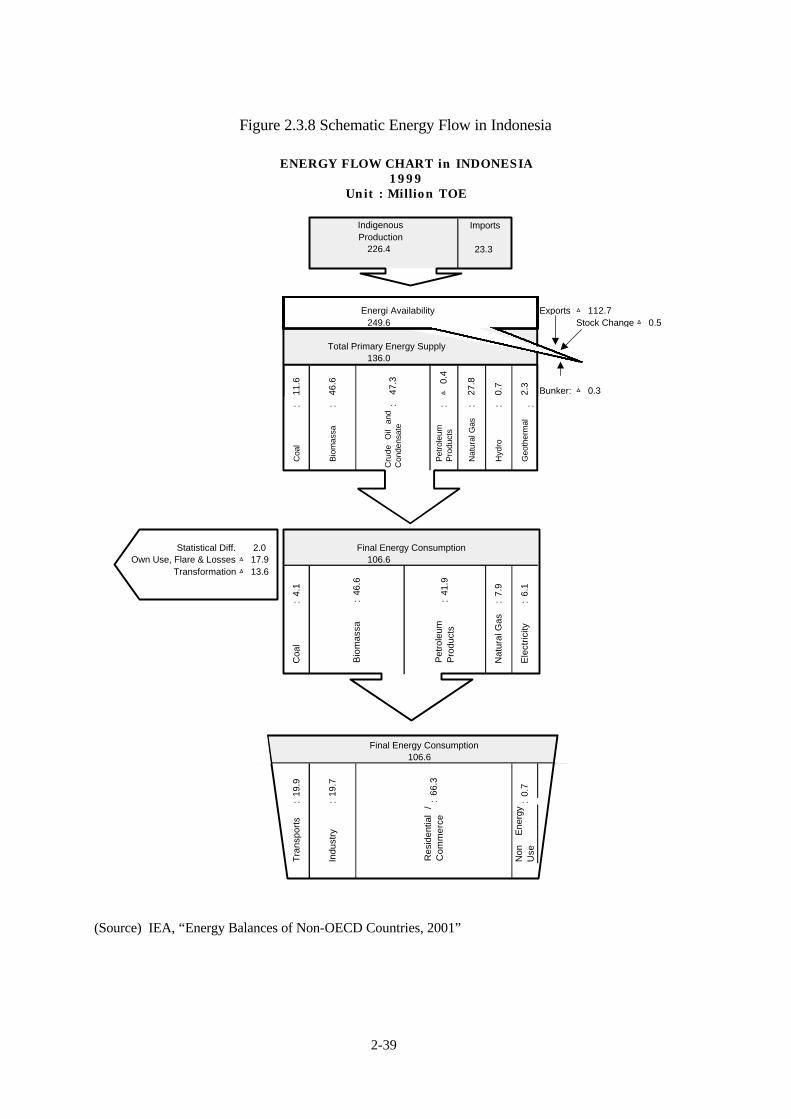
2-39
Figure 2.3.8 Schematic Energy Flow in Indonesia
(Source) IEA, “Energy Balances of Non-OECD Countries, 2001”
ENERGY FLOW CHART in INDONESIA1999
Unit : Million TOE
IndigenousProduction
226.4
Energi Availability Exports :△ 112.7249.6 Stock Change : △ 0.5
Total Primary Energy Supply 136.0
11.6
46.6
△ 0
.4
27.8
0.7
2.3
Bunker: △ 0.3
: : : : : :
Coa
l
Bio
mas
sa
Pet
role
umP
rodu
cts
Nat
ural
Gas
Hyd
ro
Geo
ther
mal
Statistical Diff. 2.0 Final Energy ConsumptionOwn Use, Flare & Losses △ 17.9 106.6
Transformation △ 13.6
4.1
7.9
6.1
: : :
Coa
l
Nat
ural
Gas
Ele
ctric
ity
Final Energy Consumption106.6
19.9
19.7
0.7
: : :
Tra
nspo
rts
Indu
stry
Non
Ene
rgy
Use
66.3
:R
esid
entia
l/
Co
mm
erc
e
46.6
:B
iom
assa
Cru
deO
ilan
dC
onde
nsat
e
41.9
:P
etro
leum
Pro
duct
s
Imports
23.3
47.3
:

2-40
Figure 2.3.9 Block Diagram of Energy Flow by Energy Carrier (1999)
(Source) IEA, “Energy Balances of Non-OECD Countries, 2001”

2-41
2.3.6 Historical Trend of Energy Supply and Demand
Firstly we describe the outline of economic activities and energy demand. Figure 2.3.10
shows the historical trends of Indonesian economy and energy. In the Figure, polygonal line
means annual average growth rates (%) of GDP, Primary Energy Requirement (PER), and
Electricity Consumption (Electricity) respectively. As shown in the Figure, Primary Energy
Requirement keeps a stable relationship with GDP growth rate in the period 1984/85 – 1997/98.
Entering 1998/99, these energy indicators drastically decreased linked with minus (-) growth of
GDP. After 1999/00, recovery of GDP growth pushed up energy growth rates. GDP growth
rate recorded 4.0 % in year 2000 comparing 0.23 % of year 1999. The growth rate in year 2001
was 3.4 %.
Figure 2.3.10 Historical Trends of GDP and Energy Indicators
(Source) IMF, DGEEU
(1) Energy supply and demand
Figure 2.3.11 shows the historical trends of energy supply/demand (commercial energy)
from energy production to final energy consumption. In the Figure, plotted lines show
indigenous production, primary energy supply (domestic), final energy consumption, import
and export from upper side.
Since after the half of 1990’s, primary energy production has been progressing with an
increasing tendency. On the other hand, the energy import also has increased by crude oil
import for domestic refineries and the secondary energy import such as diesel oil, kerosene and
Growth Rates of GDP and Energy Demand
-20.00
-15.00
-10.00
-5.00
0.00
5.00
10.00
15.00
20.00
25.00
30.00
1970
1971
1972
1973
1974
1975
1976
1977
1978
1979
1980
1981
1982
1983
1984
1985
1986
1987
1988
1989
1990
1991
1992
1993
1994
1995
1996
1997
1998
1999
Ann
ual G
row
th R
ate
(%)
GDP
PER
Electricity

2-42
gasoline (See Figure 2.3.9). As for export and import of crude oil, Indonesia earns hard
currency by the export of high quality crude oil and meets the domestic demand by the import
of comparatively low price crude oil for throughput to refineries (See Figure 2.3.9).
Figure 2.3.11 Historical Trends of Energy Supply and Demand in Indonesia
(Source) IEA, “Energy Balances of Non-OECD Countries, 2001” (2) Energy production
Figure 2.3.12 shows the breakdown of the indigenous production shown in Figure 2.3.11. As
shown in the Figure, coal and natural gas has been expanding their share through the 1990’s.
Figure 2.3.12 Historical Trend of Primary Energy Production by Energy Carrier
(Source) IEA, “Energy Balances of Non-OECD Countries, 2001”
Historical Trend of Energy Flow
-150,000
-100,000
-50,000
0
50,000
100,000
150,000
200,000
1971
1973
1975
1977
1979
1981
1983
1985
1987
1989
1991
1993
1995
1997
1999
Ktoe
IndigenousProduction
Import
Export
Primary EnergySupply
Final EnergyConsumption
Historical Trend of Primary Energy Production
0
20
40
60
80
100
120
140
160
180
200
1971
1973
1975
1977
1979
1981
1983
1985
1987
1989
1991
1993
1995
1997
1999
Year
Mill
ion
toe
Geothermal
Hydropower
Natural gas
Crude Oil
Coal

2-43
According to IEA (International Energy Agency) Statistics, the commercial energy
production in 1999 was 179.63 Mtoe (million toe), in which oil accounted for 70.31 Mtoe
(39.1 %), natural gas for 61.08 Mtoe (34.5 %), coal for 44.28 Mtoe (24.7 %), hydropower for
0.81 Mtoe (0.4 %), and geothermal for 1.3 Mtoe (1.3 %).
(3) Energy export and import
Figure 2.3.13, 2.3.14 and 2.3.15 show the historical trends of export/import of crude oil,
natural gas and coal respectively. In these figures, each production is also plotted to point out
clearly the relationship between production and export/import.
Export of crude oil has a decreasing tendency since 1977 because of the increase of domestic
energy requirement. On the other hand, natural gas export was increasing from 1977 until 1994
and afterwards, the export remains the level of 30,000 ktoe (thousand tones of oil equivalent).
As for coal, the export has rapidly increased after 1990. At present, the exports of crude oil,
natural gas and coal are similar level of about 30,000 ktoe in terms of oil equivalent. Recent
growth rates are –6 % of crude oil, almost +/- 0 % of natural gas, and +16 % of coal.
As for petroleum products, fuel oil and LPG are exported. On the other hand, gasoline,
kerosene and diesel oil are imported to meet the domestic demand. Total balancing of
petroleum products is the import over of about 10 %. In 1999, the total import of petroleum
products was 11,238 ktoe and the total export was 10,245 ktoe.
Figure 2.3.13 Historical Trend of Crude Oil Production and Export/Import
(Source) IEA, “Energy Balances of Non-OECD Countries,2001”
Crude Oil Production and Export
0
10,000
20,000
30,000
40,000
50,000
60,000
70,000
80,000
90,000
1971
1973
1975
1977
1979
1981
1983
1985
1987
1989
1991
1993
1995
1997
1999
Year
ktoe
Production
Imports
Exports

2-44
Figure 2.3.14 Historical Trend of Natural Gas Production and Export
(Source) IEA, “Energy Balances of Non-OECD Countries, 2001”
Figure 2.3.15 Historical Trend of Coal Production and Export
(Source) IEA, “Energy Balances of Non-OECD Countries, 2001”
Natural Gas Production and Export
0
10,000
20,000
30,000
40,000
50,000
60,000
70,0001971
1973
1975
1977
1979
1981
1983
1985
1987
1989
1991
1993
1995
1997
1999
Year
ktoe
Production
Exports
Coal Production and Export
0
5,000
10,000
15,000
20,000
25,000
30,000
35,000
40,000
45,000
50,000
1971
1973
1975
1977
1979
1981
1983
1985
1987
1989
1991
1993
1995
1997
1999
Year
ktoe
Production
Exports

2-45
(4) Primary energy supply
Figure 2.3.16 (a) and (b) show the historical trends of primary energy supply (requirement)
and its supply structure by source. The primary energy requirement grew at the pace of 13.7 %
annual average growth in the 1970’s, 6.4 % in the 1980’s and 6.6 % in the 1990’s. The biggest
source of primary energy supply is oil, however, the share of oil in the total primary energy
supply has decreased from 90 % in the 1970’s to 50 % level in the 1990’s.
Figure 2.3.16 (a) Historical Trend of Primary Energy Supply by Source
(Source) DGEEU
Figure 2.3.16 (b) Historical Trend of Primary Energy Supply Structure
(Source) DGEEU
Primary Energy Supply by Source
0
10,000
20,000
30,000
40,000
50,000
60,000
70,000
80,000
90,000
100,000
1969
/197
0
1971
/197
2
1973
/197
4
1975
/197
6
1977
/197
8
1979
/198
0
1981
/198
2
1983
/198
4
1985
/198
6
1987
/198
8
1989
/199
0
1991
/199
2
1993
/199
4
1995
/199
6
1997
/199
8
1999
/200
0
Year
Thousa
nd T
OE
Geothermal
Hydro
Coal
Gas
Oil
Primary Energy Supply Structure by Source
0%
20%
40%
60%
80%
100%
1969
/197
0
1971
/197
2
1973
/197
4
1975
/197
6
1977
/197
8
1979
/198
0
1981
/198
2
1983
/198
4
1985
/198
6
1987
/198
8
1989
/199
0
1991
/199
2
1993
/199
4
1995
/199
6
1997
/199
8
1999
/200
0
Year
Perc
enta
ge
Geothermal
Hydro
Coal
Gas
Oil

2-46
(5) Final energy consumption
Figure 2.3.17 (a) and (b) show the historical trends of final energy consumption and its
consumption structure by sector. The final energy consumption grew at the pace of 13.6 %
annual average growth in the 1970’s, 4.7 % in the 1980’s and 6.6 % in the 1990’s. In the 1970’s,
major energy consumer was the residential and commercial sector. And entering the 1980’s, the
transportation and industrial sectors expanded the share in the final energy consumption total.
This tendency is still now continuing.
Figure 2.3.17 (a) Historical Trend of Final Energy Consumption by Sector
(Source) DGEEU
Figure 2.3.17 (b) Historical Trend of Final Energy Consumption Structure by Sector
(Source) DGEEU
Final Energy Consumption by Sector
0
10,000
20,000
30,000
40,000
50,000
60,000
1969
/197
0
1971
/197
2
1973
/197
4
1975
/197
6
1977
/197
8
1979
/198
0
1981
/198
2
1983
/198
4
1985
/198
6
1987
/198
8
1989
/199
0
1991
/199
2
1993
/199
4
1995
/199
6
1997
/199
8
1999
/200
0
Thousa
nd T
OE
Transportation
Household
Industry
Final Energy Consumption Structure by Sector
0%
20%
40%
60%
80%
100%
1969
/197
0
1971
/197
2
1973
/197
4
1975
/197
6
1977
/197
8
1979
/198
0
1981
/198
2
1983
/198
4
1985
/198
6
1987
/198
8
1989
/199
0
1991
/199
2
1993
/199
4
1995
/199
6
1997
/199
8
1999
/200
0
Perc
enta
ge
Transportation
Household
Industry

2-47
As for the historical trends of final energy consumption by energy source and its structure
(See Figure 2.3.18 (a) and (b)), the major energy source is oil, and the share decreased from
95 % level in the 1970’s to 75 % level in the 1990’s as shown in Figure 2.3.18 (b). However
after 1990, we cannot identify the decreasing tendency of oil dependent energy consuming
structure.
Figure 2.3.18 (a) Historical Trend of Final Energy Consumption by Source
(Source) DGEEU
Figure 2.3.18 (b) Historical Trend of Final Energy Consumption Structure by Source
(Source) DGEEU
Final Energy Consumption by Source
0
10,000
20,000
30,000
40,000
50,000
60,000
1969
/197
0
1971
/197
2
1973
/197
4
1975
/197
6
1977
/197
8
1979
/198
0
1981
/198
2
1983
/198
4
1985
/198
6
1987
/198
8
1989
/199
0
1991
/199
2
1993
/199
4
1995
/199
6
1997
/199
8
1999
/200
0
Tho
usan
d TO
E
LPG
Electricity
Coal
Natural Gas
Oil
Final Energy Consumption Structure by Source
0%
20%
40%
60%
80%
100%
1969
/197
0
1971
/197
2
1973
/197
4
1975
/197
6
1977
/197
8
1979
/198
0
1981
/198
2
1983
/198
4
1985
/198
6
1987
/198
8
1989
/199
0
1991
/199
2
1993
/199
4
1995
/199
6
1997
/199
8
1999
/200
0
Perc
enta
ge
LPG
Electricity
Coal
Natural Gas
Oil
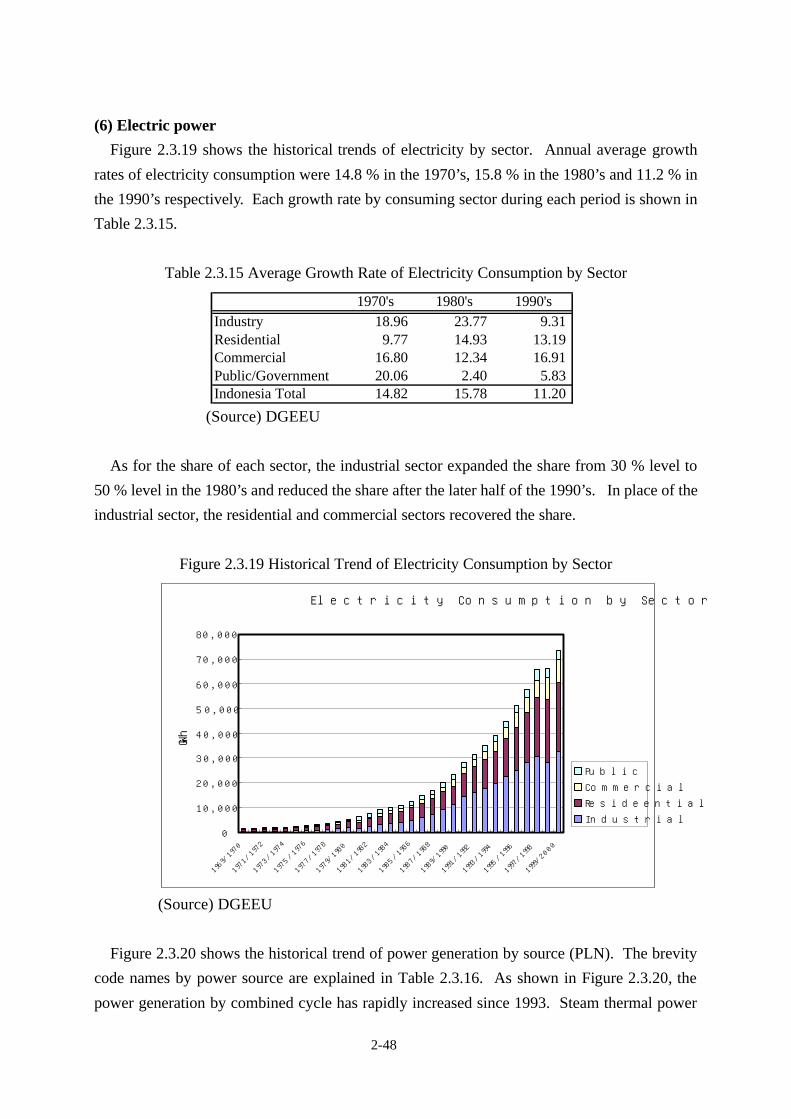
2-48
(6) Electric power
Figure 2.3.19 shows the historical trends of electricity by sector. Annual average growth
rates of electricity consumption were 14.8 % in the 1970’s, 15.8 % in the 1980’s and 11.2 % in
the 1990’s respectively. Each growth rate by consuming sector during each period is shown in
Table 2.3.15.
Table 2.3.15 Average Growth Rate of Electricity Consumption by Sector
(Source) DGEEU
As for the share of each sector, the industrial sector expanded the share from 30 % level to
50 % level in the 1980’s and reduced the share after the later half of the 1990’s. In place of the
industrial sector, the residential and commercial sectors recovered the share.
Figure 2.3.19 Historical Trend of Electricity Consumption by Sector
(Source) DGEEU
Figure 2.3.20 shows the historical trend of power generation by source (PLN). The brevity
code names by power source are explained in Table 2.3.16. As shown in Figure 2.3.20, the
power generation by combined cycle has rapidly increased since 1993. Steam thermal power
Electricity Consumption by Sector
0
10,000
20,000
30,000
40,000
50,000
60,000
70,000
80,000
1969
/197
0
1971
/197
2
1973
/197
4
1975
/197
6
1977
/197
8
1979
/198
0
1981
/198
2
1983
/198
4
1985
/198
6
1987
/198
8
1989
/199
0
1991
/199
2
1993
/199
4
1995
/199
6
1997
/199
8
1999
/200
0
GW
h
Public
Commercial
Resideential
Industrial
1970's 1980's 1990'sIndustry 18.96 23.77 9.31Residential 9.77 14.93 13.19Commercial 16.80 12.34 16.91Public/Government 20.06 2.40 5.83Indonesia Total 14.82 15.78 11.20

2-49
generation (Coal and Oil) had been also gradually increasing. After 1995, the share of steam
thermal, combined cycle and hydropower keep the level of 40-45 %, 30-40 % and about 10 %
respectively. Regarding the generated power by source in 1999, the thermal power generation
was 67,923 GWh and accounted for 85 % of total generation 80,023 GWh, followed by
hydropower 9,372 GWh (12 %) and geothermal power 2,728 GWh (3.4 %).
Figure 2.3.20 Power Generation by Source (PLN)
(Source) PLN
Table 2.3.16 Brevity Code Name by Power Source
Figure 2.3.21 shows the historical trends of fuel consumption by public utility plants (PLN).
In PLN, natural gas requirement has expanded from 1994 and also coal requirement has
increased in recent years. Major fuels for thermal power are coal accounting for the share of
46.2 %, and natural gas of 33.6 %. The share of diesel oil is 13.2 % and that of fuel oil is 7.0 %
Power Generation by Source
0
10000
20000
30000
40000
50000
60000
70000
80000
90000
100000
1980
1981
1982
1983
1984
1985
1986
1987
1988
1989
1990
1991
1992
1993
1994
1995
1996
1997
1998
1999
Year
GW
h
Purchase
PLTGU-G
PLTGU-M
PLTG-G
PLTG-M
PLTD
PLTU-B
PLTU-G
PLTU-M
PLTP
PLTA
Power SourcePLTA HydropowerPLTP GeothermalPLTU-M Steam (Oil)PLTU-G Steam (Natural Gas)PLTU-B Steam (Coal)PLTD DieselPLTG-M Gas TuebinePLTG-G Natural GasPLTGU-M Conbined Cycle (Oil)PLTGU-G Conbined Cycle (N.Gas)

2-50
at 1999. As shown in Figure 2.3.21, the 1997’s high fuel consumption comparatively is due to
compensating thermal power for the output drop of hydropower. Gross thermal efficiency in
Indonesia reached 37.7 % in 1999.
Figure 2.3.21 Historical Trend of Fuel Consumption by PLN
(Source) IEA, “Energy Balances of Non-OECD Countries, 2001”
Fuel Consumption by PLN
0
2000
4000
6000
8000
10000
12000
14000
16000
18000
20000
1980
1981
1982
1983
1984
1985
1986
1987
1988
1989
1990
1991
1992
1993
1994
1995
1996
1997
1998
1999
Year
Kto
e
Natural Gas
Diesl Oil
Fuel Oil
Coal
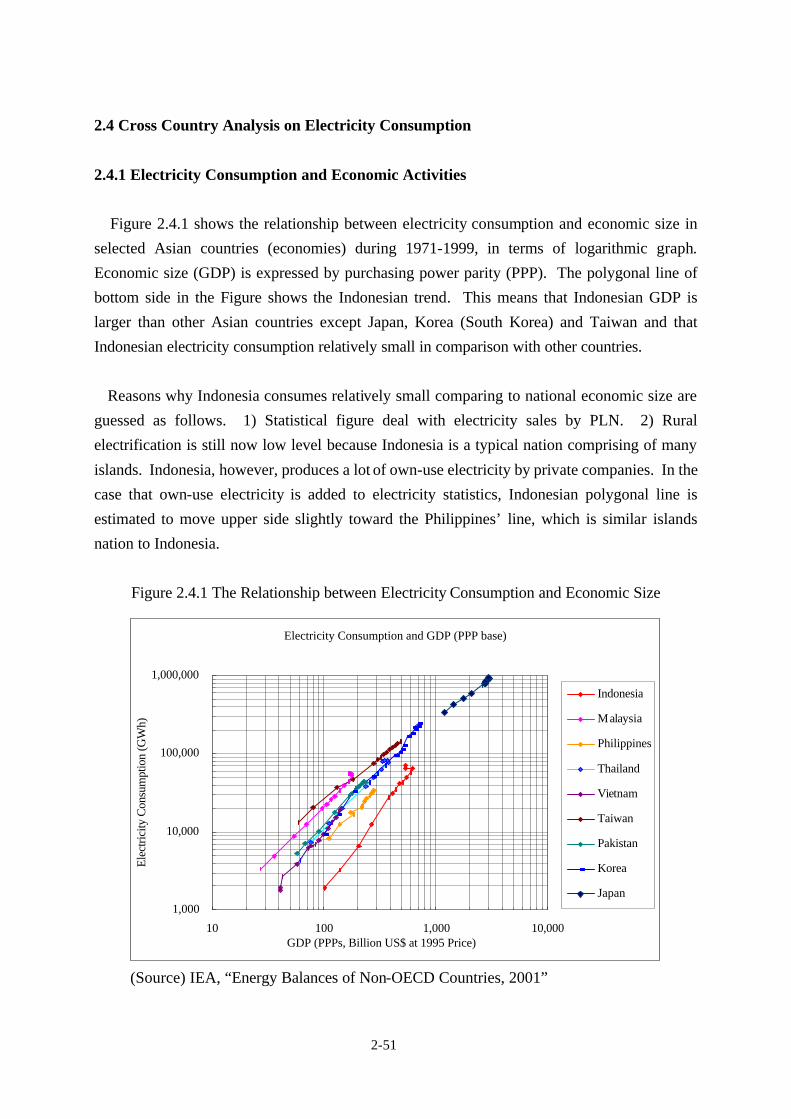
2-51
2.4 Cross Country Analysis on Electricity Consumption
2.4.1 Electricity Consumption and Economic Activities
Figure 2.4.1 shows the relationship between electricity consumption and economic size in
selected Asian countries (economies) during 1971-1999, in terms of logarithmic graph.
Economic size (GDP) is expressed by purchasing power parity (PPP). The polygonal line of
bottom side in the Figure shows the Indonesian trend. This means that Indonesian GDP is
larger than other Asian countries except Japan, Korea (South Korea) and Taiwan and that
Indonesian electricity consumption relatively small in comparison with other countries.
Reasons why Indonesia consumes relatively small comparing to national economic size are
guessed as follows. 1) Statistical figure deal with electricity sales by PLN. 2) Rural
electrification is still now low level because Indonesia is a typical nation comprising of many
islands. Indonesia, however, produces a lot of own-use electricity by private companies. In the
case that own-use electricity is added to electricity statistics, Indonesian polygonal line is
estimated to move upper side slightly toward the Philippines’ line, which is similar islands
nation to Indonesia.
Figure 2.4.1 The Relationship between Electricity Consumption and Economic Size
(Source) IEA, “Energy Balances of Non-OECD Countries, 2001”
Electricity Consumption and GDP (PPP base)
1,000
10,000
100,000
1,000,000
10 100 1,000 10,000GDP (PPPs, Billion US$ at 1995 Price)
Ele
ctric
ity C
onsu
mpt
ion
(GW
h)
Indonesia
Malaysia
Philippines
Thailand
Vietnam
Taiwan
Pakistan
Korea
Japan

2-52
2.4.2 Electricity Intensity and Economic Level
Figure 2.4.2 shows the relationship between electricity consumption per capita (electricity
intensity) and economic size (GDP/Capita) in selected Asian countries (economies) during
1971-1999, in terms of logarithmic graph. GDP is also expressed by purchasing power parity
(PPP) as previous section. As can you seen in the Figure, lines of Thailand – Malaysia – S.
Korea – Taiwan – Japan are drawn like a straight line. And we can find that Indonesia –
Philippines’ line is plotted a little bit lower side of Thailand - -- - Japan line, and lines of
Vietnam and Pakistan are plotted upper side respectively. Lower side countries on same level
of horizontal axis means that electricity consumption per capita is comparatively low in
comparison with similar life level.
Figure 2.4.2 The Relationship between Electricity Intensity and Economic Level
(Source) IEA, “Energy Balances of Non-OECD Countries, 2001”
Figure 2.4.3 shows the trends of selected ASEAN countries derived from Figure 2.4.2. In
Figure 2.4.3, we can see three (3) lines, 1) Indonesia – Philippines, 2) Thailand - Malaysia, and
3) Vietnam from the bottom side. In recent years, however, Indonesia – Philippines’ line is
moving close to Thailand – Malaysia’s line as shown in the Figure. This trend implicates that
the resemblance of economy and people’s living in core ASEAN countries, Indonesia,
Philippines, Thailand and Malaysia, is implied from the viewpoint of their electricity
consumption.
The Relationship between Electricity Intensity and per capita GDP ( PPPs)
10,000
100,000
1,000,000
10,000,000
100 1,000 10,000 100,000
GDP (PPPs) per Capita (US$/Capita)
Ele
ctric
ity In
tens
ity (W
h/C
apita
)
Indonesia
Malaysia
Philippines
Thailand
Vietnam
Taiwan
Pakistan
Korea
Japan

2-53
Figure 2.4.3 Electricity Intensity and Economic Level in selected ASEAN Countries
(Source) IEA, “Energy Balances of Non-OECD Countries, 2001”
Table 2.4.1 Electricity Consumption per Capita in selected ASEAN Countries (Unit: kWh/capita) 1980 1985 1990 1995 1999 Indonesia (PLN) 46.0 83.2 176.7 265.7 358.9 (Java-Bali, PLN) 56.1 99.7 200.6 347.3 465.3
Malaysia 669.8 870.6 1146.7 2004.8 2460.9 Philippines 366.4 347.9 362.8 407.0 473.9 Thailand 294.7 412.9 721.8 1265.6 1404.6 Vietnam 54.6 70.3 99.8 157.9 258.3
(Source) IEA, “Energy Balances of Non-OECD Countries, 2001”
Table 2.4.1 shows numeric values of electricity consumption per capita (kWh/capita). As
shown in the Table, the electricity consumption per capita in Indonesia at 1999, about 360
kWh/capita, corresponds to the 1990 level of the Philippines and before the 1985 level of
Thailand. That of Java-Bali Region is similarly positioned to the Philippines’ level. As
described before, captive power plays a large role in Indonesia, and so it is a little bit difficult to
evaluate the electricity consumption itself as published statistics, which represents the public
utilities’ portion, in general. Taking into the consideration of such situation, for instant, if the
consumption per capita could be presumed as 700 kWh/capita of around double, Indonesian per
capita consumption is still now ranked to before the 1985 level of Malaysia and the 1990 level
of Thailand.
The Relationship between Electricity Intensity and per capita GDP ( PPPs)
10,000
100,000
1,000,000
10,000,000
100 1,000 10,000
GDP (PPPs) per Capita (US$/Capita)
Ele
ctri
city
Inte
nsity
(Wh/
Cap
ita)
Indonesia
Malaysia
Philippines
Thailand
Vietnam

2-54
2.4.3 Electricity Elasticity with respect to GDP
Table 2.4.2 shows the elasticity of electricity consumption to GDP and the elasticity of per
capita electricity consumption to GDP/capita in selected Asian countries. In the Table,
observation year is classified into the period of 1973-1985 and 1985-1997. The reason why
year 1997 is set as an end year of observation period is that receivable results could not be
obtained under the impact of Asian economic crisis after 1998.
Table 2.4.2 Electricity Elasticity in selected ASEAN Countries Electricity Elasticity to GDP Elasticity of
KWh/capita – GDP/capita Country
(Economy) -1973 1973-1985 1985-1997 -1973 1973-1985 1985-1997
Indonesia 2.17 1.99 2.39 2.78
Malaysia 1.52 1.53 1.91 1.68
Philippines 1.29 1.27 4.28 1.63
Thailand 1.61 1.54 1.96 1.61
Vietnam 1.71 1.77 2.98 2.04
Pakistan 1.52 1.66 2.02 2.33
Taiwan (1952-1973) 1.57
1.13
1.14
(1952-1973) 1.88
1.21
1.20
S. Korea (1962-1973) 2.27
1.66
1.64
(1962-1973) 2.76
1.85
1.70
Japan (1946-1965) 1.22
(1965-1973) 1.29
0.89
1.20
(1946-1965) 1.26
(1965-1973) 1.33
0.92
1.25
(Source) IEA Statistics and Energy Statistic of Japan, S. Korea and Taiwan
As a reference, the past elasticity values before 1973 as to Japan, S. Korea and Taiwan are
introduced in the Table. Especially, S. Korea and Taiwan have typical characteristics in the
industrial structure from the viewpoint of electricity consumption and it will be suggested for
developing countries as preferred precedents. S. Korea has a manufacturing (especially heavy
chemical industry) oriented industrial structure, and therefore electricity elasticity is large in
general. On the other hand, Taiwan is a typical economy of a light and service oriented
industrial structure, and the electricity elasticity is small. Japanese industrial structure is
positioned as an intermediate point of both economies.

2-55
Traditionally energy elasticity to GDP in Indonesia is relatively high, compared with other
Asian countries. This historical trend might be imagined that Indonesia is one of the Korean
type’s industrial structures, however, this trend is practically considered that Indonesian
electricity demand is still low for her population and territory. Socio-economy and industrial
structure of Indonesia has an energy consuming characteristics and this trend would continue in
ten (10) or fifteen (15) years when the per capita electricity consumption level will reach the
current level of Thailand or Malaysia, as the case might be, although it depends on energy
conservation and energy price policies.

3-1
Chapter 3 National Electricity General Plan (RUKN)
3.1 Outline of National Electricity General Plan (RUKN)
3.1.1 Objective of RUKN
The National Electricity General Plan (RUKN) is an integrated power development plan
that covers the national policy, power development target and electricity infrastructure
development. RUKN also includes power sector restructuring, privatization of PLN, and
rural electrification according to the decentralization policy. These factors promote private
investment in the power sector and support development of the national economy.
The electric power demand forecast is done based on the previous year’s record. The
power development plan and transmission plan for PLN will be applied in 13 power systems
in Indonesia. Power policy, a fuel plan and a financial plan are also prepared.
3.1.2 Responsible Agency
The Ministry of Energy and Mineral Resources is the agency responsible for RUKN. The
Directorate of Electricity Planning in the Directorate General of Electricity & Energy
Utilization is in charge of the work. RUKN will serve as a guideline for PLN to make an
power demand-supply plan, according to the government policy.
RUKN will be up-dated periodically according to the actual demand and power
development and become effective by signature of the minister. The latest RUKN hasn't been
issued officially since 1996. Therefore the draft RUKN as of October 2001 will be reviewed
in this chapter.
3.1.3 Power Development
PLN is the main electricity supplier. Private companies and cooperatives complement PLN
in areas where PLN is not able to supply power. The government also decided to introduce
IPPs because PLN cannot secure the budget to meet the increasing demand. According to its
depetrolization policy, the government put a high priority on coal, geothermal and
hydropower.
Most of the rural electrification program is carried out by PLN with a government subsidy.
Cooperatives are utilized to promote participation of rural communities and local energy
3-2
utilization. Social Electricity Development Fund will be established to promote in the rural
electrification program in the near future.
In addition to PLN's financial problem caused by the monetary crisis, there are various
other problems. These include inefficiency of PLN in management and technical aspect and
high purchase prices from IPPs. In the Java-Bali system, despite the IPP capacity increases
being re-negotiated, it is pointed out that there still will not be enough capacity by 2003
considering the recent demand growth. In addition to the Java-Bali system, all other systems
except for West Sumatra, the North Sumatra and Ujung Pandang systems will also experience
a power deficit in 2003.
In case PLN does not develop sufficient power, the government will consider private sector
development or power purchases from captives. In order to attract significant investment, it is
necessary to solve problems such as transmission constraints, improve PLN’s financial
condition and change the current investment system.
3.1.4 Simulation Tool
Table 3.1.1 shows the demand- supply plan of the Java-Bali system in RUKN.
The table consists of three sections, the top section shows the demand, the middle section
shows the supply capacity, and the bottom section shows the generation reserve margin.
The actual information is only about ongoing / planned projects, the rest are simulated by
PLN’s power development optimization program. This program, known as " Sihombing
program" named after the person who developed it, is a WASP- like program written in
Fortran.
NEW PLTUs and NEW PLTGs listed in Table 3.1.1 indicate the calculation result of
program simulations, there are no specific plans for these power sources.
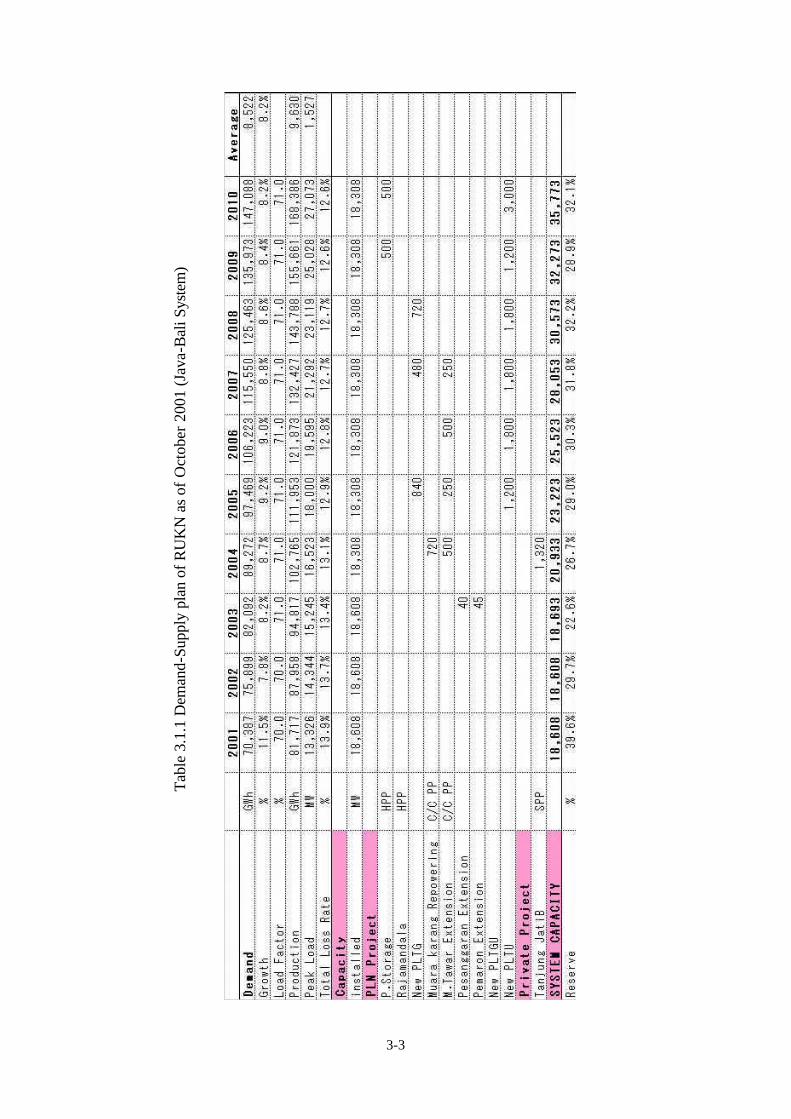
3-3
Tab
le 3
.1.1
Dem
and-
Supp
ly p
lan
of R
UK
N a
s of
Oct
ober
200
1 (J
ava-
Bal
i Sys
tem
)

3-4
3.2 Demand Forecasting
Table 3.2.1 shows the demand forecasted in RUKN. The terms used in the demand section
are defined below:
- Demand (GWh) --- The total electric sales of industrial, commercial, residential,
and public use.
- Production (GWh) --- The total of gross generation output at PLN and net
generation output at IPPs. The output of captives and
cooperative power is not included in the figure.
- Peak load (MW) --- The total of gross electric demand at PLN and net generation
demand at IPPs.
Table 3.2.1 Demand Forecast in RUKN Items 2000 2005 (2005/2000) 2010 (2010/2000)
Demand GWh 63,872 97,469 (8.8%) 147,088 (8.7%) Production GWh 74,901 111,953 (8.4%) 168,386 (8.4%) Peak Load MW 12,231 18,000 (8.0%) 27,073 (8.3%) Total Loss (%) 13.8% 12.9% 12.6%
The peak load is expected to grow at the rate of 8.0% (2005/2000) and 8.3% (2010/2000).
According to this forecast, peak load will increase to 27,073MW, twice as much as the
present peak load (12,231MW). This table implies that large power source development will
be needed if the demand increases at this rate.
Considering that the rate of total loss is around 9% in Japan, a 13% rate in Indonesia is not
so large. PLN is appropriately managing electricity loss.
Figure.3.2.1 shows the trend of electric demand from year 1988 to 2000. Except the year
1998, which was the year that economic crisis happened, the demand has been increased
steadily.
Figure.3.2.2 shows the daily load curves from the year 1990 to 2000. We can see the
maximum load appears in the evening. It means peak load would stem from the lighting
demand.
Despite of the constant temperature of tropical climate, we can see the maximum load day
has been occurred in October, November or December as early wet season, since 1996. It is
considered that maximum demand arises in the end of year since the maximum demand is
renewed every month because of the high growth of electric demand.

3-5
Figu
re 3
.2.1
The
tren
d of
ele
ctri
c de
man
d fr
om y
ear
1988
to 2
000
in J
ava-
Bal
i

3-6
Figure 3.2.2 Java-Bali Daily Load Curves on Peak Day (1990-2000)
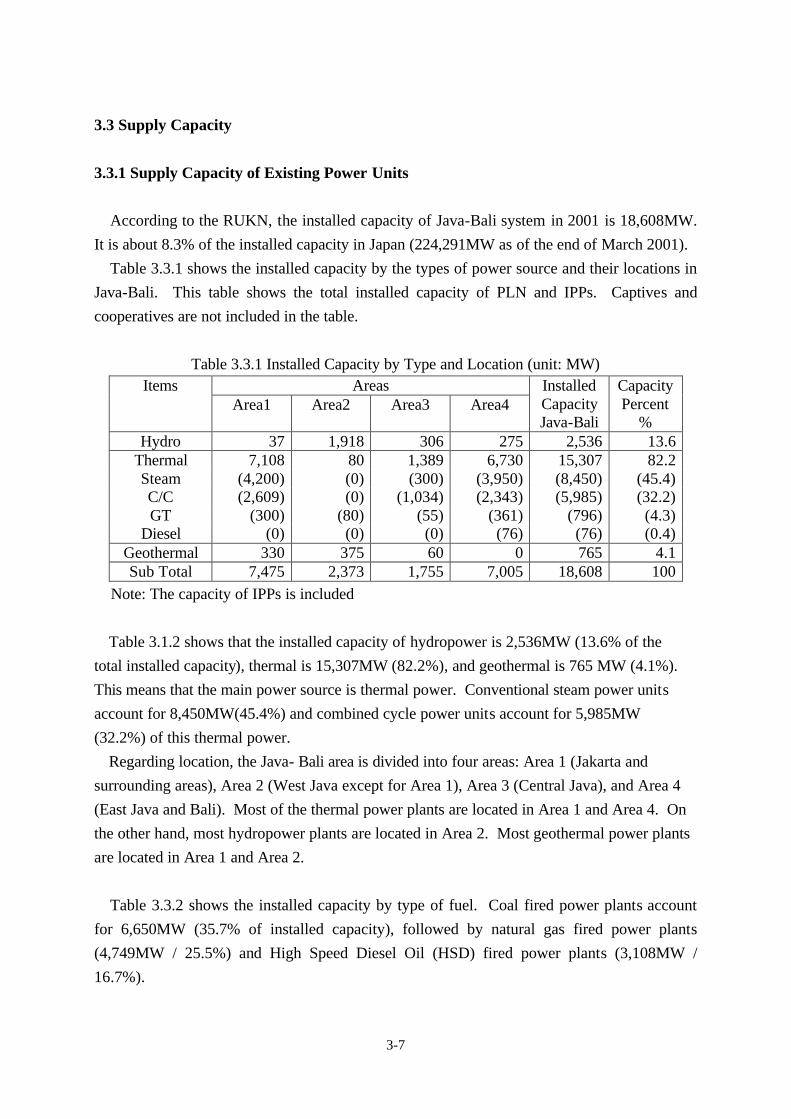
3-7
3.3 Supply Capacity
3.3.1 Supply Capacity of Existing Power Units
According to the RUKN, the installed capacity of Java-Bali system in 2001 is 18,608MW.
It is about 8.3% of the installed capacity in Japan (224,291MW as of the end of March 2001).
Table 3.3.1 shows the installed capacity by the types of power source and their locations in
Java-Bali. This table shows the total installed capacity of PLN and IPPs. Captives and
cooperatives are not included in the table.
Table 3.3.1 Installed Capacity by Type and Location (unit: MW) Areas Items
Area1 Area2 Area3 Area4 Installed Capacity Java-Bali
Capacity Percent
% Hydro 37 1,918 306 275 2,536 13.6
Thermal 7,108 80 1,389 6,730 15,307 82.2 Steam (4,200) (0) (300) (3,950) (8,450) (45.4) C/C (2,609) (0) (1,034) (2,343) (5,985) (32.2) GT (300) (80) (55) (361) (796) (4.3)
Diesel (0) (0) (0) (76) (76) (0.4) Geothermal 330 375 60 0 765 4.1 Sub Total 7,475 2,373 1,755 7,005 18,608 100
Note: The capacity of IPPs is included
Table 3.1.2 shows that the installed capacity of hydropower is 2,536MW (13.6% of the
total installed capacity), thermal is 15,307MW (82.2%), and geothermal is 765 MW (4.1%).
This means that the main power source is thermal power. Conventional steam power units
account for 8,450MW(45.4%) and combined cycle power units account for 5,985MW
(32.2%) of this thermal power.
Regarding location, the Java- Bali area is divided into four areas: Area 1 (Jakarta and
surrounding areas), Area 2 (West Java except for Area 1), Area 3 (Central Java), and Area 4
(East Java and Bali). Most of the thermal power plants are located in Area 1 and Area 4. On
the other hand, most hydropower plants are located in Area 2. Most geothermal power plants
are located in Area 1 and Area 2.
Table 3.3.2 shows the installed capacity by type of fuel. Coal fired power plants account
for 6,650MW (35.7% of installed capacity), followed by natural gas fired power plants
(4,749MW / 25.5%) and High Speed Diesel Oil (HSD) fired power plants (3,108MW /
16.7%).

3-8
It is important to point out that presently many combined cycle power plants, which are
designed to use natural gas, have to be operated as HSD fired power plants, because there is
no natural gas supply. Such examples include the Muara-Tower Thermal Power Plant (Block
I, II), the Grati Thermal Power Plant (Block I), and the Semarang Thermal Power Plant
(Block I, II).
Table 3.3.2 Installed Capacity by Fuel Type (Unit: MW) Areas Item
Area1 Area2 Area3 Area4 Installed Capacity Java-Bali
Capacity Percent
% Hydro 37 1,918 306 275 2,536 13.6
Thermal 7,108 80 1,389 6,730 15,307 82.2 (Coal) (3,400) (0) (0) (3,250) (6,650) (35.7) (Gas) (2,388) (80) (0) (2,281) (4,749) (25.5) (HSD) (920) (0) (1,089) (1,099) (3,108) (16.7) (MFO) (400) (0) (300) (100) (800) (4.3)
Geo thermal 330 375 60 0 765 4.1 Sub Total 7,475 2,373 1,755 7,005 18,608 100
Note: The capacity of IPPs is included
Table 3.3.3 shows the installed capacity by owner. Most of the generation capacity is
owned by PLN (Indonesia Power, PJB). PLN owns 15,453MW of the installed capacity
(87% of the total) and IPP owns only 3,155MW (17%).
Table 3.3.3 Installed Capacity by Owner (unit: MW) Areas Item
Area1 Area2 Area3 Area4 Installed capacity Java-Bali
Capacity Percent
% Indonesia Power 5,031 1,035 1,695 100 7,862 42.3
PJB 2,128 1,008 0 4,454 7,591 40.8 IPP 315 330 60 2,450 3,155 17.0
Sub total 7,475 2,373 1,755 7,005 18,608 100
3.3.2 Power Development Plan
As described in 3.1.4, power development projects of RUKN can be classified into two
types: ongoing / planned projects and required projects, which are based on the output of the
simulation program. In this section, we will describe both types of projects in detail.
(1) Ongoing / planned projects
There are six ongoing / planned projects with a total capacity of 4,325MW.

3-9
-Repowering of Muara-Karang (Total capacity: 720MW / Actual increase 420MW)
To efficiently use the Muara-Karan power plant in Jakarta, a new gas turbine will be
installed into the existing 1-3 unit in the plan. Since this power plant is one of the most
important plants supplying Jakarta, installation should be carried out without shutting down
the unit. The unit capacity will be about 720MW after completing the installation work.
Actual increased capacity is only about 420MW. Start of operation is expected in 2004.
The application for financial support for the engineering service and construction is
submitted to the Japanese government under the Yen credit scheme. It was discussed in the
meeting of the Consultative Group for Indonesia (CGI) in 2001.
-Extension project of "Muara-Tower Block III,IV" (Total capacity : 750MW×2)
A new combined cycle power plant (750MW×2) will be installed into the extension
area in the Muara-Tower power plant (Block III,IV) in the plan. Operation is expected in
2004-2007. The application for financial support for the engineering service is submitted
to the Japanese government with the Muara-Karang project, it was discussed in the meeting
of the Consultative Group for Indonesia (CGI) in 2001.
-Pesanggaran power plant (Actual increased capacity: 40MW)
A new steam turbine (40MW) will be installed to be combined with existing gas turbines
(42MW×2) in the Pesanggaran power plant located in Bali. Operation is expected in 2003
according to RUKN.
-Pemaron Thermal Power Plant (Actual increased capacity: 45MW)
The Pemaron power station will be a new power plant located in Bali. The existing gas
turbine (48.8MW ×2) is moved from Tanjung-Priok power station and combined with a
newly installed steam turbine(45MW). Operation is also expected in 2003 according to
RUKN
-Tanjung-Jati B (1,320MW)
Tanjung-Jati B is an IPP power plant located in central Java and will be the largest scale
coal fired thermal power plant (660MW×2) in Indonesia. Operation is expected in 2004.
Construction work started in 1996 is being interrupted because of difficulty of renegotiating
the PPA contract between PLN and the owner and constitution of financial scheme.
-Upper Chisokan pumped storage power plant (Total capacity: 1,000MW)
Upper Chisokan is a pumped storage power plant planned for west Java, west of the
existing Shagling hydropower and near the existing 500kV transmission line. Start of

3-10
operation is expected in 2009 (500MW) and in 2010 (500MW). Engineering service is
now carried out under the finance of Yen credit. The total construction cost is estimated at
about US$ 1,200 million.
(2) Required capacity (output of simulation program)
According to RUKN, a total installed capacity unidentified as specific projects is
12,840MW. It means that a yearly average installed capacity to be developed is 2,5000 MW
from 2005 until 2010. The breakdown of this figure is shown in Table 3.3.4.
Table 3.3.4 Required Capacity by Type of Power Source (Unit: MW) Items 2005 2006 2007 2008 2009 2010 Total Average
Gas turbine 840 0 480 720 0 0 2,040 340 Steam turbine 1,200 1,800 1,800 1,800 1,200 3,000 10,800 1,800
Sub total 2,040 1,800 2,280 2,520 1,200 3,000 12,840 2,140
In this table, gas turbine refers to oil fired gas turbines for peaking; and steam turbine refers
to conventional coal fired power plants.
3.3.3 Generation Reserve Margin (GRM)
Generation reserve margin is generally used in preparing the power development plan.
GRM shows the capacity required to avoid any unpredicted risk in the future. The formula to
calculate GRM is shown below.
GRM =(Installed Capacity - Peak Load) / Peak Load
RUKN is planned at a 25% GRM. The 25% GRM is recommended in the "Second Power
Transmission and Distribution Project (PLTDII)" exchanged between the World Bank and
PLN.
Table 3.3.5 shows GRM on RUKN. We can see from the table that GRM in 2001 is about
40%, and it looks enough to keep the stability of power system.
Table 3.3.5 Generation Reserve Margin of RUKN (Unit: MW,%) Year 2001 2002 2003 2004 2005 2006 2010
Maximum Peak Load (MW) 13,329 14,344 15,245 16,523 18,000 19,595 27,073 Installed Capacity (MW) 18,608 18,608 18,693 20,933 23,223 25,523 35,773 GRM (%) 39.6 29.7 22.6 26.7 29.0 30.3 32.1

3-11
On the other hand, the target reserve margin proposed by P3B that operates the actual
power system is 30%. The break down of this figure is shown below.
Hydro Power Deleting 5%
Maintenance (Periodic Repair) 12%
Thermal Power Deleting 2.7%
Rate of Forced Outage 6%
Spinning Reserve 4.3%
Total 30%
The difference between the 25% GRM used during planification and the 30% reserve
margin proposed by P3B is explained below:
-For the purpose of system planification, efficient investment is given high priority. In
other words, a lower GRM is preferred.
-For the purpose of system operation, stable power supply is given high priority. In other
words, a higher GRM is preferred
By considering the actual operation, we have to examine the difference between these
figures carefully and find the optimal generation reserve margin.
3.3.4 Fuel Consumption Plan and Financing Plan
(1) Fuel consumption plan
Table 3.3.6 shows the fuel consumption plan according to RUKN.
Table 3.3.6 Production plan / Fuel Consumption Plan of RUKN Items 2001 2005 2010
Hydro 6,976 6,976 6,976 Coal 40,147 60,934 122,697 Gas 21,419 36,873 30,793 HSD 6,763 1,809 2,559 MFD 1,051 - - Geo thermal 5,361 5,361 5,361
Production (GWh)
Sub total 81,717 111,953 168,386 Coal (10^3t) 18,096 27,465 55,304 Gas (bcf) 182 309 258 HSD (10^3kl) 1,768 693 981
Fuel consumption
MFO (10^3kl) 355 - - c.f. Coal consumption includes IPPs.

3-12
-Since the power sector in Indonesia depends on coal, the actual amount of coal
consumption is expected to be about 18,096×10^3t in 2001. This tendency continues in
the future, the amount of coal consumption in 2010 is expected to be three times as much as
the one in 2001.
-The amount of natural gas consumption is 182bcf in 2001. In the middle and long term,
consumption is expected to increase in place of oil.
-The consumption amount of oil product consumption, such as HSD or MFO, is expected
to decrease in the future.
(2) Financing Plan
Table 3.3.7 shows the financing plan according to RUKN. US$ 2,324 million is required to
develop new power sources until 2005, and for the following years US$ 10,810million is
required.
Table 3.3.7 Financing Plan in RUKN (Unit: US$ million) Items 2001~2005 2006~2010 Total
Gas turbine 336 480 816 Steam Turbine 1,080 8,640 9,720 Combined Cycle 908.5 490 1,398.5 Hydro 0 1,200 1,200 Sub Total 2,324.5 10,810 13,134.5 c.f. Hydro means the pumped storage unit.
Table 3.3.8 shows that US$ 2,861 million is required for costs related to transmission and
distribution lines.
Table 3.3.8 Construction cost for Transmission system (Unit: US$ million) Items 2001~2005
Transmission System 895 Distribution System 1,966
Total 2,861