


Final Report - Indigenous Climate Hub
177
Climate Change Impacts on Water and Wastewater Infrastructure at Moose Factory Final Report July 24, 2018 Project No. 163401448 Prepared by: Developed in partnership with:
Transcript of Final Report - Indigenous Climate Hub
Climate Change Impacts on Water and Wastewater Infrastructure at Moose FactoryFinal Report
July 24, 2018
Project No. 163401448
Prepared by: Developed in partnership with:
Sign-off Sheet
This document entitled Climate Change Impacts on Water and Wastewater Infrastructure at Moose Factory was prepared by Stantec Consulting Ltd. (“Stantec”) for the account of Ontario First Nations Technical Services Corporation (OFNTSC) (the “Client”). Any reliance on this document by any third party is strictly prohibited. The material in it reflects Stantec’s professional judgment in light of the scope, schedule and other limitations stated in the document and in the contract between Stantec and the Client. The opinions in the document are based on conditions and information existing at the time the document was published and do not take into account any subsequent changes. In preparing the document, Stantec did not verify information supplied to it by others. Any use which a third party makes of this document is the responsibility of such third party. Such third party agrees that Stantec shall not be responsible for costs or damages of any kind, if any, suffered by it or any other third party as a result of decisions made or actions taken based on this document.
Prepared by
(signature)
Guy Félio, Ph.D., P.Eng.
Prepared by
(signature)
Wayne L.E. Penno, MBA, P.Eng.
Reviewed by
(signature)
Jordan Stewart, P.Eng.
Approved by
(signature)
Adrien Comeau, M.Eng, P.Eng

CLIMATE CHANGE IMPACTS ON WATER AND WASTEWATER INFRASTRUCTURE AT MOOSE FACTORY
i
Table of Contents
EXECUTIVE SUMMARY ............................................................................................................ I
ABBREVIATIONS .....................................................................................................................III
1.0 INTRODUCTION .......................................................................................................... 1.1 1.1 COMMUNITY DESCRIPTION ...................................................................................... 1.1 1.2 SCOPE OF THE STUDY .............................................................................................. 1.3 1.3 PROJECT TIMELINE ................................................................................................... 1.3 1.4 PROJECT TEAM .......................................................................................................... 1.3
2.0 STEP 1: PROJECT DEFINITION ................................................................................. 2.1 2.1 CLIMATE RELATED CONCERNS ............................................................................... 2.1 2.2 INFRASTRUCTURE TO BE CONSIDERED................................................................. 2.3 2.3 TIME HORIZON FOR THE STUDY .............................................................................. 2.4
3.0 STEP 2: DATA COLLECTION ..................................................................................... 3.1 3.1 INVENTORY OF INFRASTRUCTURE COMPONENTS ............................................... 3.1
3.1.1 Potable Water System................................................................................. 3.1 3.1.2 Wastewater System .................................................................................... 3.6
3.2 CONDITION OF INFRASTRUCTURE COMPONENTS ................................................ 3.8 3.3 CLIMATE CONSIDERATIONS ................................................................................... 3.12
3.3.1 Climate Trends and Projections ................................................................ 3.13 3.3.2 Climate Elements Considered to Affect the Infrastructure ......................... 3.15
4.0 STEP 3: COMPLETE THE RISK ASSESSMENT ........................................................ 4.1 4.1 RISK THRESHOLDS .................................................................................................... 4.1 4.2 INFRASTRUCTURE RESPONSE ................................................................................ 4.2 4.3 CLIMATE PROBABILITY SCORING ............................................................................ 4.3 4.4 INFRASTRUCTURE SEVERITY SCORING ................................................................. 4.5 4.5 RISK ASSESSMENT .................................................................................................... 4.5
4.5.1 Infrastructure Components Evaluated ......................................................... 4.5 4.5.2 Risk Screening Process .............................................................................. 4.7 4.5.3 Summary of Risk Results ............................................................................ 4.7 4.5.4 Influence of the Infrastructure Condition ...................................................... 4.9
4.6 COMMUNITY IMPACTS FROM INFRASTRUCTURE RISKS ...................................... 4.9
5.0 CONCLUSIONS AND RECOMMENDATIONS ............................................................ 5.1
LIST OF TABLES Table 1: Timeline for the Project .............................................................................................. 1.3 Table 2: Project Team .............................................................................................................. 1.3 Table 3: INAC's ICMS, Canadian Infrastructure Report Card (CIRC) Condition Rating
Scales and Description (from City of Edmonton) ........................................................ 3.9 Table 4: ICMS Data on Assets to be Considered in the Climate Risks Assessment ............... 3.10

CLIMATE CHANGE IMPACTS ON WATER AND WASTEWATER INFRASTRUCTURE AT MOOSE FACTORY
ii
Table 5: Principal Climate Elements Selected by the Project Team for the Analysis .............. 3.15 Table 6: Risk Thresholds ......................................................................................................... 4.2 Table 7: FN PIEVC Probability Scoring .................................................................................... 4.3 Table 8: Probability Scores for Selected Climate Events .......................................................... 4.4 Table 9: Infrastructure Severity Scoring Developed by the Project Team ................................. 4.5 Table 10: Infrastructure Assessed ............................................................................................ 4.6 Table 11: Summary of Moderate and High Risks ..................................................................... 4.8 Table 12: Summary of Risks for Infrastructure Replaced at the End of its Design Life and
is Well Maintained vs. Infrastructure that is Deteriorated............................................ 4.9
LIST OF FIGURES Figure 1: Satellite view of Moose Factory and Surrounding Area (Source: Google Earth). ....... 1.2 Figure 2: Article from CBC News regarding the flooding of May 2013 ...................................... 2.2 Figure 3: Photo of 1976 Flooding in Moose Factory provided by Project Team Member .......... 2.2 Figure 4: Working List of Components of Water Treatment Plant Components Developed
at Workshop 1 .......................................................................................................... 2.3 Figure 5: Photo of Water Treatment Plant Building and Reservoir taken during the
September 26, 2017 Site Visit as part of Workshop 1 .............................................. 2.4 Figure 6: Moose Factory Water Treatment, Storage and Distribution Piping System
(Source: Moose Factory Water Treatment Plant – Feasibility Study, OCWA 2015) ........................................................................................................................ 3.2
Figure 7: Raw Water Intake and Low Lift Pump Building .......................................................... 3.3 Figure 8: Raw Water Intake Structure – River Level Fluctuations ............................................. 3.4 Figure 9: Filter System Inside the WTP .................................................................................... 3.5 Figure 10: SCADA Screen Showing the WTP Operations ........................................................ 3.6 Figure 11: Moose Factory – Sewer Main and Treatment Lagoons Layout (Source:
ACRS Report by Saulteaux Consulting and Engineering. Inspected Summer 2016) ........................................................................................................................ 3.7
Figure 12: Typical Lift Station, Lagoon Cell, Valve Chamber and Blower Building .................... 3.8 Figure 13: Average Monthly Temperature and Precipitation from Moosonee UA Station ....... 3.12 Figure 14: Mean Daily Temperature for Summer - Historical Trend and Future Climate
Projection (Moosonee Weather Station, RCP 8.5).................................................. 3.13 Figure 15: Mean Daily Temperature for Winter - Historical Trend and Future Climate
Projection (Moosonee Weather Station, RCP 8.5).................................................. 3.14 Figure 16: Summer Precipitation - Historical Trend and Future Climate Projection
(Moosonee Weather Station, RCP 8.5) .................................................................. 3.14 Figure 17: Winter Precipitation - Historical Trend and Future Climate Projection
(Moosonee Weather Station, RCP 8.5) .................................................................. 3.15 Figure 18: FN PIEVC Protocol Risk Assessment Process Flowchart ....................................... 4.1
LIST OF APPENDICES
APPENDIX A WORKSHOP PRESENTATIONS ............................................................... A.1

CLIMATE CHANGE IMPACTS ON WATER AND WASTEWATER INFRASTRUCTURE AT MOOSE FACTORY
i
Executive Summary
This report presents the results of the Climate Risk Assessment (CRA) study conducted for Moose Factory using the Ontario First Nations Technical Services Corporation (OFNTSC) First Nations PIEVC Protocol; a methodology adapted from Engineers Canada’s Public Infrastructure Engineering Vulnerability Committee (PIEVC) Engineering Protocol [https://pievc.ca/protocol]. The report identifies infrastructure vulnerabilities to current and future severe weather; focusing on Moose Factory’s Water and Wastewater systems. The report establishes a risk profile for the identified infrastructure and provides recommendations regarding mitigating the risks with the highest consequences.
The methods utilized to develop the report include reviewing background information (such as climate data, infrastructure drawings and existing infrastructure condition reports) and consultation with local personnel (such as Moose Factory Public Works staff and the Water Treatment Plant operators). The input from local expertise regarding the infrastructure is combined with the background information to develop a risk profile, in the form of a matrix, highlighting infrastructure that may be most at risk under current climate conditions, with respect to specific weather events. The findings under current climate conditions are then re-evaluated against the demands that may be placed on them under future climate scenarios, with respect to the expected change of frequency or intensity of specific weather events.
The results of this process suggest that, for the infrastructure identified under current climate conditions, there are 22 interactions between a selected infrastructure item and a particular weather event that are categorized with a “Moderate” risk threshold rating. Another 9 interactions are categorized with a “High” risk threshold rating. When evaluated against projected future climate conditions, the count of these categories of risk threshold become 34 for “Moderate” and remain at 9 for “High”. When exploring the potential for inadequate future maintenance practices, there are even more interactions between a selected infrastructure item and a particular weather event that become Moderate or High.
The water and wastewater infrastructure of Moose Factory is well maintained and provides safe drinking water and sanitation services. The Public Works Department, under budget pressures, has managed to maintain the infrastructure in a state of good repair; the maintenance practices they have adopted and implemented have resulted in resilient infrastructure.
The findings reinforce the need for regular maintenance practices and for sound asset management planning for infrastructure; including financial and engineering planning for replacing infrastructure at the end of its intended lifecycle. The specific Risk Mitigation and Adaptation Measures recommended for Moose Factory generally fall into the following categories:
• Considerations to include future climate impacts in the design of replacement infrastructure
• Expanding capacity of existing infrastructure
• Additional monitoring, inspection and maintenance of infrastructure conditions by Operations personnel

CLIMATE CHANGE IMPACTS ON WATER AND WASTEWATER INFRASTRUCTURE AT MOOSE FACTORY
ii
• Emergency preparedness in case of infrastructure failures, such as system redundancies or back-up power/supplies
• Additional training of Operations personnel
• Continuation of existing infrastructure upgrade programs
This report also acknowledges the fact that the analysis conducted has limitations. The intent of the study is to provide an overall risk profile of the infrastructure owned and managed by the Moose Cree First Nation, the recommendations do not address specific infrastructure issues. This report should not be solely relied upon as a plan to make the infrastructure of Moose Factory more resilient to changes in climate. Rather this report provides a starting point for identifying specific infrastructure that presents the greatest risks in terms of service to the community, and helps identify infrastructure that deserves a detailed analysis to ensure it can continue effectively and safely serving Moose Factory in the coming decades.

CLIMATE CHANGE IMPACTS ON WATER AND WASTEWATER INFRASTRUCTURE AT MOOSE FACTORY
iii
Abbreviations
ACRS Asset Condition Reporting System CRA
Climate Risk Assessment
COO GCR GHG
Chiefs of Ontario General Condition Rating Green House Gas
ICMS
Integrated Capital Management System
INAC
Indigenous and Northern Affairs Canada
IPCC MCFN O&M
Intergovernmental Panel on Climate Change Moose Cree First Nation Operations and Maintenance
OCCIAR OCWA
Ontario Centre for Climate Impacts and Adaptation Resources Ontario Clean Water Agency
OFNTSC
Ontario First Nations Technical Services Corporation
PIEVC PLC SCADA
Public Infrastructure Engineering Vulnerability Committee Programmable Logic Controller Supervisory Control and Data Acquisition
WTP Water Treatment Plant (potable water) WWTP
Wastewater Treatment Plant

CLIMATE CHANGE IMPACTS ON WATER AND WASTEWATER INFRASTRUCTURE AT MOOSE FACTORY
Introduction July 24, 2018
sj w:\active\1634_01448\moose factory\report\rpt_moose_factory_w_and_ww_cc_impacts_final_20180917.docx 1.1
1.0 INTRODUCTION
Severe weather and climate uncertainty represent risks to public safety in Canada and around the world, as well as to the safety of engineered systems and the services they provide. In this context, an increasing number of public agencies and organizations that provide public services address climate change adaptation as part of their primary mandate—protecting the public interest, which includes life, health, property, economy, culture and the environment.
The impacts of severe weather add to the existing stresses on infrastructure and the services it provides. In addition to factors that reduce the capacity and performance of these assets (e.g. age, increased demand, material weathering, design and construction inadequacies, lack of maintenance, or extension of service life beyond design), the increased intensity of weather events can produce an incremental load that would cause asset failure.
Infrastructure vulnerability and risk assessments are the foundations to ensure climate change is considered in engineering design, operations and maintenance of community infrastructure, buildings, and facilities. When one takes the time to identify the services and related assets that are highly vulnerable to climate change impacts, one can plan and implement cost-effective solutions to adapt to these new weather patterns.
Creating infrastructure that is resilient to climate change is of particular concern in some of Canada’s more remote communities, given that these communities already operate infrastructure under extreme weather conditions. Additionally, access to these remote communities can result in difficulty addressing and repairing infrastructure failures, should they occur. For these reasons, Moose Factory is a community that will benefit from having a sound climate change adaptation strategy.
This report presents the results of the Climate Risk Assessment (CRA) study conducted for Moose Cree First Nation using the First Nations PIEVC Protocol, a methodology adapted from Engineers Canada’s Public Infrastructure Engineering Vulnerability Committee (PIEVC) Engineering Protocol [https://pievc.ca/protocol].
1.1 COMMUNITY DESCRIPTION
Moose Factory is a community located on Moose Factory Island, near the mouth of the Moose River, at the southern end of James Bay1. The Island has an area of approximately 5.25 sq.km. This community is associated with the entire island, but politically, the island is divided into two entities:
• Factory Island 1 - Indian reserve that makes up the northern two-thirds of the island, belonging to the Moose Cree First Nation (MCFN) (population: 1451).
• Unorganized Cochrane District - Unincorporated southern third, home to the old Hudson's Bay Company post and government services, governed by the provincial Local Services Board and the federal Weeneebayko Health Ahtuskaywin that administers the hospital (population: 1007).
Moose Factory lies in the Hudson Bay Lowlands physiographic region, which is flat and underlain by sedimentary rocks, mainly limestone, dolomite, and shale. The extreme flatness of the terrain, the moisture holding quality of
1 Source: https://web.archive.org/web/20120316073824/http://www.wakenagun.ca/Adobe/moosefactory.pdf
CLIMATE CHANGE IMPACTS ON WATER AND WASTEWATER INFRASTRUCTURE AT MOOSE FACTORY
Introduction July 24, 2018
sj w:\active\1634_01448\moose factory\report\rpt_moose_factory_w_and_ww_cc_impacts_final_20180917.docx 1.2
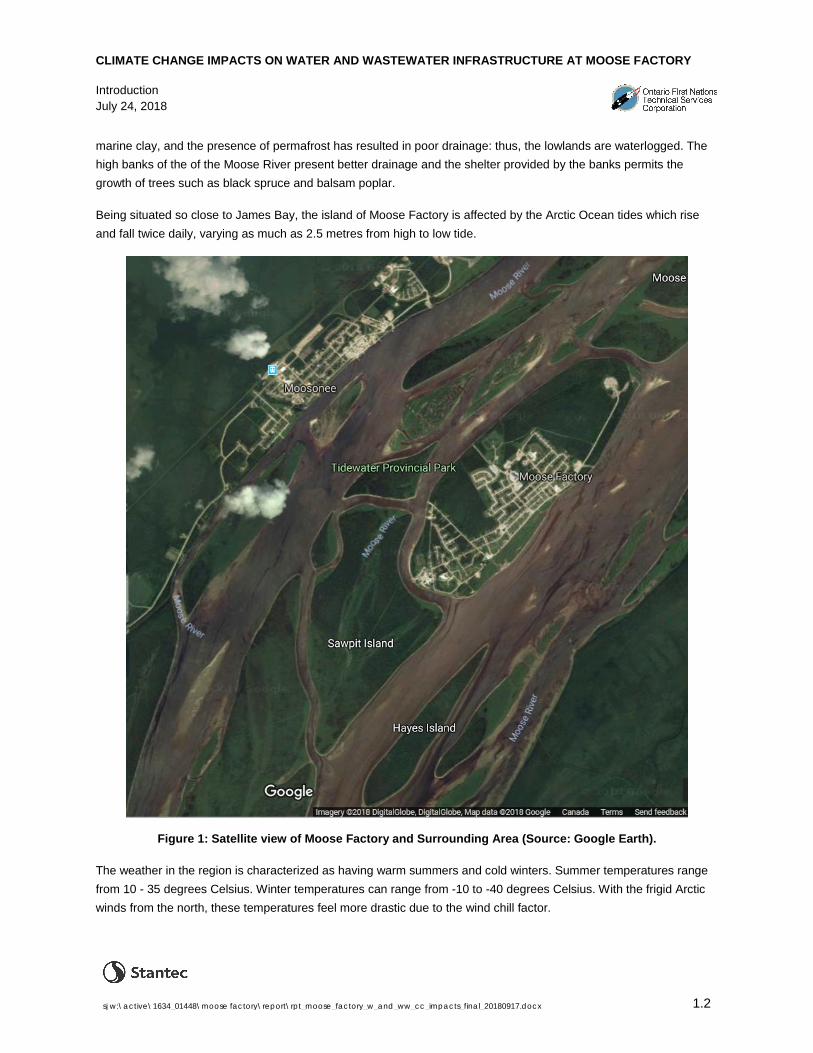
marine clay, and the presence of permafrost has resulted in poor drainage: thus, the lowlands are waterlogged. The high banks of the of the Moose River present better drainage and the shelter provided by the banks permits the growth of trees such as black spruce and balsam poplar.
Being situated so close to James Bay, the island of Moose Factory is affected by the Arctic Ocean tides which rise and fall twice daily, varying as much as 2.5 metres from high to low tide.
Figure 1: Satellite view of Moose Factory and Surrounding Area (Source: Google Earth).
The weather in the region is characterized as having warm summers and cold winters. Summer temperatures range from 10 - 35 degrees Celsius. Winter temperatures can range from -10 to -40 degrees Celsius. With the frigid Arctic winds from the north, these temperatures feel more drastic due to the wind chill factor.

CLIMATE CHANGE IMPACTS ON WATER AND WASTEWATER INFRASTRUCTURE AT MOOSE FACTORY
Introduction July 24, 2018
sj w:\active\1634_01448\moose factory\report\rpt_moose_factory_w_and_ww_cc_impacts_final_20180917.docx 1.3
1.2 SCOPE OF THE STUDY
The objectives of the study are to:
• Identify infrastructure vulnerabilities to current and future severe weather. Moose Factory infrastructure considered in the study included the community’s Water (W) and Wastewater (WW) systems.
• Establish a risk profile for the identified infrastructure • Provide recommendations regarding mitigating risks with the highest consequences to the assets, service, and
community
1.3 PROJECT TIMELINE
Table 1 shows the timeline for the project.
Table 1: Timeline for the Project
Phase Completion Date Start-up meeting September 7, 2017
Workshop 1: Define the project September 26, 2017
Workshop 2: Gather the data September 28, 2017
Workshop 3: Complete the risk assessment November 21, 2017
Request engineering analysis (optional) N/A
Workshop 4: Prepare recommendations for action November 23, 2017
Produce Climate Risk Assessment Report (this document) July 24, 2018
The workshops listed above correspond with the four steps of the First Nations PIEVC Protocol by the same name. The details of what each of these steps involves are summarized in their respective sections of this report.
1.4 PROJECT TEAM
The Project Team included key staff from Moose Factory, Ontario First Nations Technical Services Corporation (OFNTSC), the Mushkegowuk Council Technical Services, supported by subject matter experts from Stantec and Risk Sciences International (RSI). The members of the Project Team are listed below.
Table 2: Project Team
Project Team Moose Factory • Abel Wapachee, Director of Public Works • Stan Kapashesit, Director of Economic
Development
Mushkegowuk Council • Chris Seguin, Project Officer, Mushkegowuk
Council Technical Services
OFNTSC • Elmer Lickers, Senior O&M Advisor Subject Matter Experts Support Team • Guy Félio, Senior Advisor (Stantec) • Wayne Penno, Senior Engineer (Stantec) • Heather Auld, Climatologist (RSI)

CLIMATE CHANGE IMPACTS ON WATER AND WASTEWATER INFRASTRUCTURE AT MOOSE FACTORY
STEP 1: PROJECT DEFINITION July 24, 2018
sj w:\active\1634_01448\moose factory\report\rpt_moose_factory_w_and_ww_cc_impacts_final_20180917.docx 2.1
2.0 STEP 1: PROJECT DEFINITION
The Project Team met at Workshop 1 on September 26 2017 to define the project parameters.
Following a presentation on the objectives of the project, an overview of the methodology for the climate risk assessment, and the Mohawk Council of Akwesasne W/WW CRA project, the team discussed the assets to include in the study.
The Project Team decided to assess the climate (current and future) risks for the Moose Factory water supply and wastewater collection and treatment systems. For the water supply, all components from source (intake) to distribution were included. The infrastructure included in the wastewater system included collection, treatment, and release into the environment. Support assets (e.g., storage and public works buildings) and third-party suppliers (e.g., fuel, electricity, chemicals) were also included.
2.1 CLIMATE RELATED CONCERNS
Discussions focused on current concerns on meteorological events that have or are causing infrastructure and operations disruptions and/or failures, and on observations of changes in climate patterns. Following are the main points raised and discussed during Workshop 1.
• Moose Factory usually experiences three winter storms per year: February (typically a blizzard), early and late March.
• May 2013 ice jam and a “not normal” tidal event caused flooding. Flooding also occurred in Fort Albany and Kashechewan (example, Figure 2)
• Rapid snow melt in April causes road flooding (example, Figure 3)
• Gravel hauling using the winter road (the annually cleared road on frozen Moose River) could historically be done until mid or the end of March. In recent years, gravel hauling ends earlier in the year.
• The sand bars in the Moose River build up in different locations due to changes in river flow and velocity. This usually occurs in the Spring, causing increased raw water turbidity and possible damage, to the water intake.
This first step of the Climate Risks Assessment (CRA) using the FN PIEVC Protocol involves setting the general boundary conditions for the project. The CRA project team identifies the infrastructure to be assessed and its key attributes, such as location, condition, known concerns, etc. The team identifies the overall climatic elements that affect the infrastructure and past weather events that have caused disruptions or failures to the service(s) provided by the asset(s).

CLIMATE CHANGE IMPACTS ON WATER AND WASTEWATER INFRASTRUCTURE AT MOOSE FACTORY
STEP 1: PROJECT DEFINITION July 24, 2018
sj w:\active\1634_01448\moose factory\report\rpt_moose_factory_w_and_ww_cc_impacts_final_20180917.docx 2.2
Figure 2: Article from CBC News regarding the flooding of May 2013
Figure 3: Photo of 1976 Flooding in Moose Factory provided by Project Team Member

CLIMATE CHANGE IMPACTS ON WATER AND WASTEWATER INFRASTRUCTURE AT MOOSE FACTORY
STEP 1: PROJECT DEFINITION July 24, 2018
sj w:\active\1634_01448\moose factory\report\rpt_moose_factory_w_and_ww_cc_impacts_final_20180917.docx 2.3
2.2 INFRASTRUCTURE TO BE CONSIDERED
Figure 4 below shows an example of notes taken during Workshop 1 to identify the infrastructure components that will be considered in the assessment. During the Workshop, the Project Team listed the following preliminary infrastructure to be assessed.
• Water Supply system • Intake • Transmission from intake to plant • Water treatment plant • Distribution system (including hydrants, valves, watermains, the reservoir and other accessories)
• Wastewater System • Collection – sanitary mains (including lift stations) • Treatment (lagoons)
• Support buildings • Operations personnel • Third-party services
Figure 4: Working List of Components of Water Treatment Plant Components Developed at Workshop 1

CLIMATE CHANGE IMPACTS ON WATER AND WASTEWATER INFRASTRUCTURE AT MOOSE FACTORY
STEP 1: PROJECT DEFINITION July 24, 2018
sj w:\active\1634_01448\moose factory\report\rpt_moose_factory_w_and_ww_cc_impacts_final_20180917.docx 2.4
Figure 5: Photo of Water Treatment Plant Building and Reservoir taken during the September 26, 2017 Site Visit as part of Workshop 1
2.3 TIME HORIZON FOR THE STUDY
The time horizons for the study were selected as current conditions (establishing the baseline risks) and 2050s (2035 to 20652) for future conditions. Many of the infrastructure assets were built in the 1990’s and early 2000’s and will have to be replaced, undergo rehabilitation, or retrofit, or will be at an advanced stage into their service lives within the time horizon selected.
2 Climate is usually defined as the "average weather," or more rigorously, as the statistical description in terms of the mean and variability of meteorological variables such as temperature, precipitation and wind over a period of time, typically 30 years. (Source: World Meteorological Organization). The “2050s” projected climate is therefore the projected average over the 30-year period from 2035 to 2065.
CLIMATE CHANGE IMPACTS ON WATER AND WASTEWATER INFRASTRUCTURE AT MOOSE FACTORY
Step 2: Data Collection July 24, 2018
sj w:\active\1634_01448\moose factory\report\rpt_moose_factory_w_and_ww_cc_impacts_final_20180917.docx 3.1
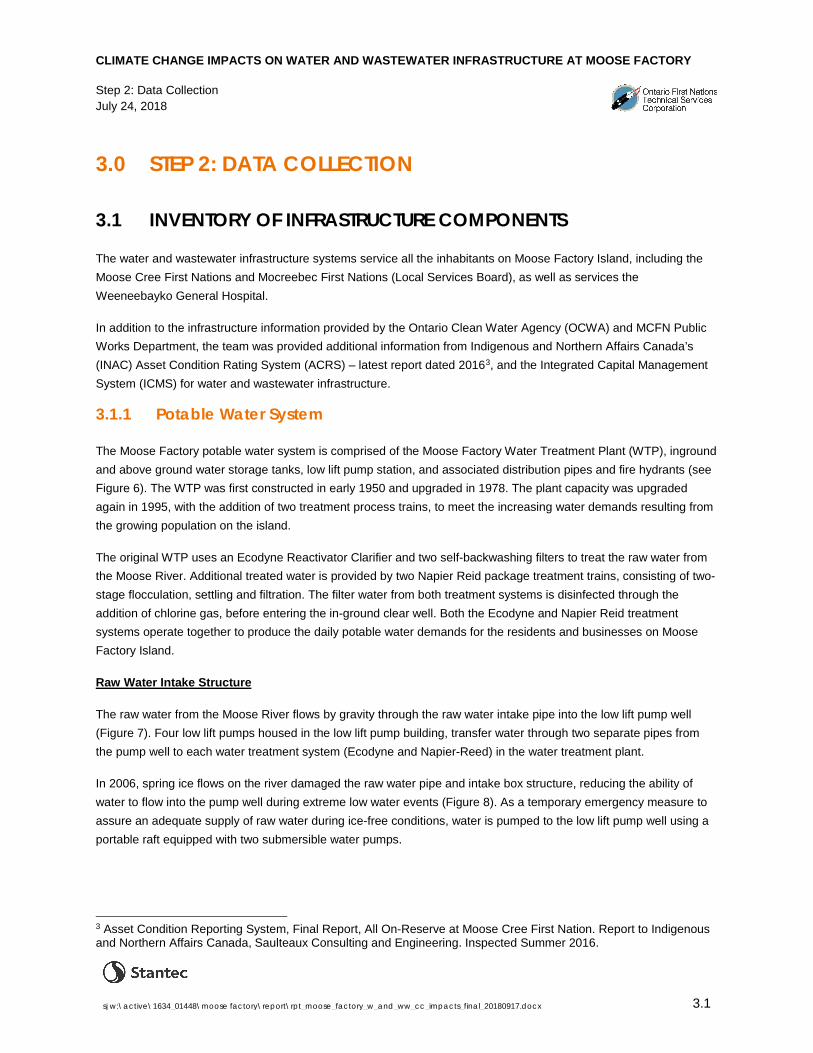
3.0 STEP 2: DATA COLLECTION
3.1 INVENTORY OF INFRASTRUCTURE COMPONENTS
The water and wastewater infrastructure systems service all the inhabitants on Moose Factory Island, including the Moose Cree First Nations and Mocreebec First Nations (Local Services Board), as well as services the Weeneebayko General Hospital.
In addition to the infrastructure information provided by the Ontario Clean Water Agency (OCWA) and MCFN Public Works Department, the team was provided additional information from Indigenous and Northern Affairs Canada’s (INAC) Asset Condition Rating System (ACRS) – latest report dated 20163, and the Integrated Capital Management System (ICMS) for water and wastewater infrastructure.
3.1.1 Potable Water System
The Moose Factory potable water system is comprised of the Moose Factory Water Treatment Plant (WTP), inground and above ground water storage tanks, low lift pump station, and associated distribution pipes and fire hydrants (see Figure 6). The WTP was first constructed in early 1950 and upgraded in 1978. The plant capacity was upgraded again in 1995, with the addition of two treatment process trains, to meet the increasing water demands resulting from the growing population on the island.
The original WTP uses an Ecodyne Reactivator Clarifier and two self-backwashing filters to treat the raw water from the Moose River. Additional treated water is provided by two Napier Reid package treatment trains, consisting of two-stage flocculation, settling and filtration. The filter water from both treatment systems is disinfected through the addition of chlorine gas, before entering the in-ground clear well. Both the Ecodyne and Napier Reid treatment systems operate together to produce the daily potable water demands for the residents and businesses on Moose Factory Island.
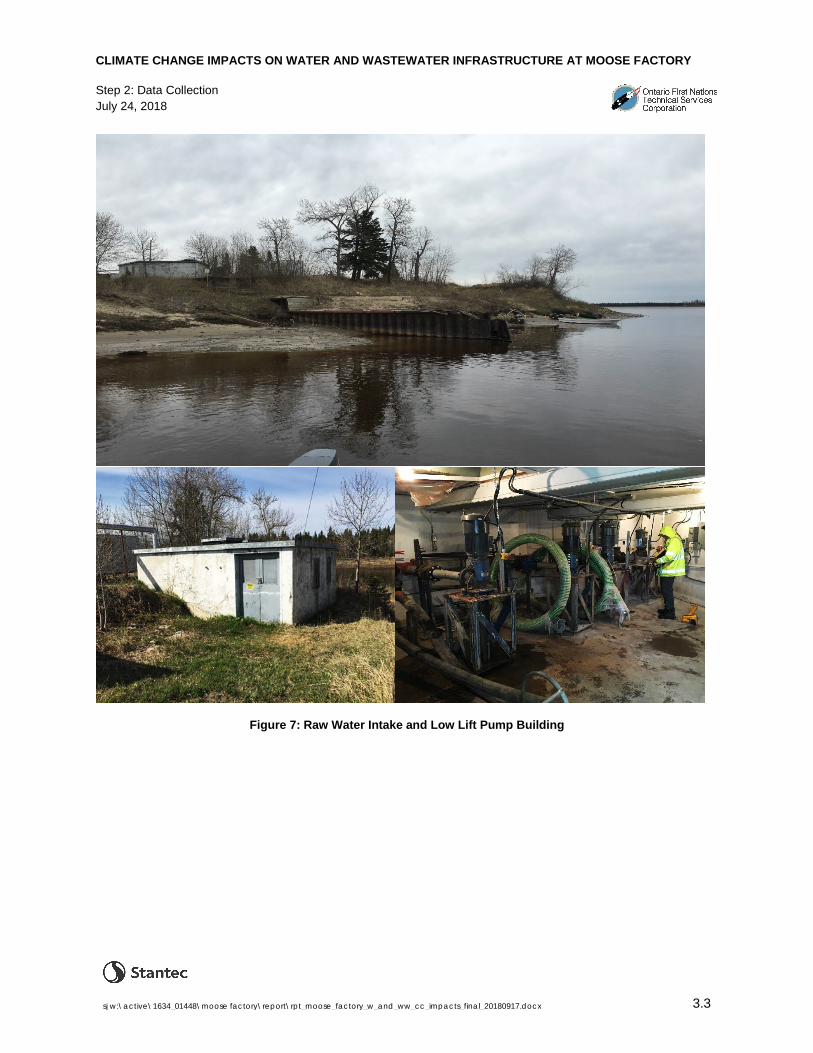
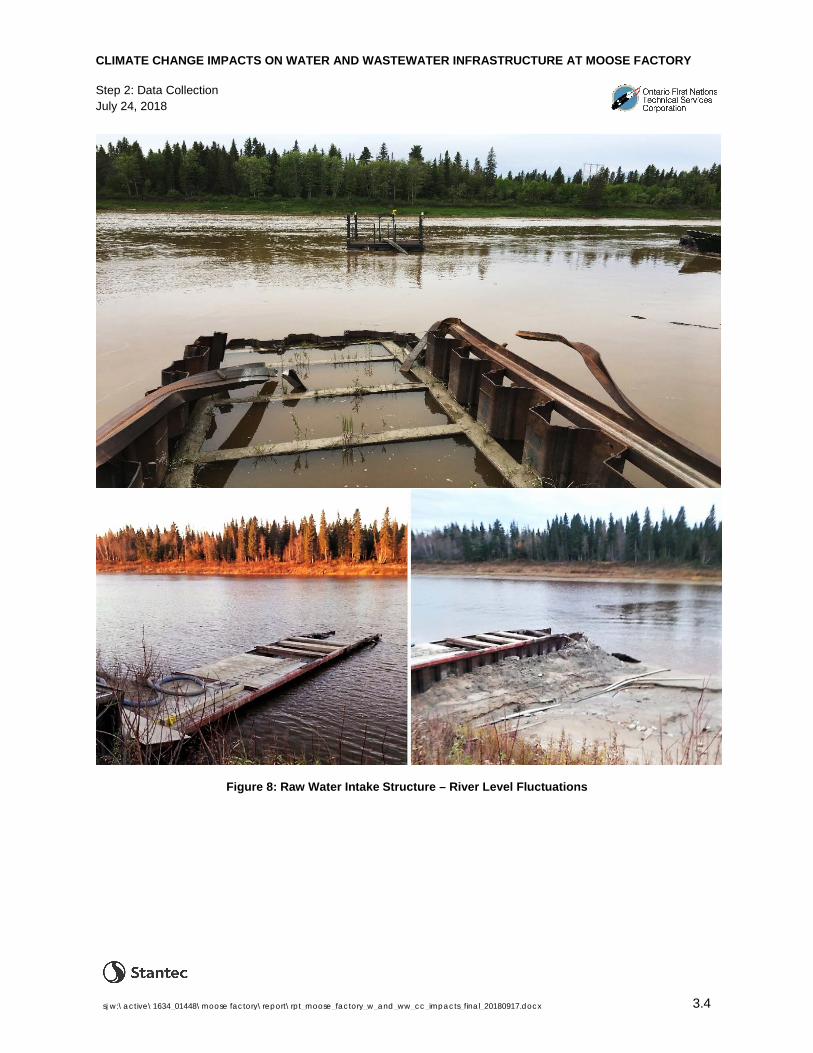
Raw Water Intake Structure
The raw water from the Moose River flows by gravity through the raw water intake pipe into the low lift pump well (Figure 7). Four low lift pumps housed in the low lift pump building, transfer water through two separate pipes from the pump well to each water treatment system (Ecodyne and Napier-Reed) in the water treatment plant.
In 2006, spring ice flows on the river damaged the raw water pipe and intake box structure, reducing the ability of water to flow into the pump well during extreme low water events (Figure 8). As a temporary emergency measure to assure an adequate supply of raw water during ice-free conditions, water is pumped to the low lift pump well using a portable raft equipped with two submersible water pumps.
3 Asset Condition Reporting System, Final Report, All On-Reserve at Moose Cree First Nation. Report to Indigenous and Northern Affairs Canada, Saulteaux Consulting and Engineering. Inspected Summer 2016.

CLIMATE CHANGE IMPACTS ON WATER AND WASTEWATER INFRASTRUCTURE AT MOOSE FACTORY
Step 2: Data Collection July 24, 2018
sj w:\active\1634_01448\moose factory\report\rpt_moose_factory_w_and_ww_cc_impacts_final_20180917.docx 3.2
Figure 6: Moose Factory Water Treatment, Storage and Distribution Piping System (Source: Moose Factory Water Treatment Plant – Feasibility Study, OCWA 2015)
CLIMATE CHANGE IMPACTS ON WATER AND WASTEWATER INFRASTRUCTURE AT MOOSE FACTORY
Step 2: Data Collection July 24, 2018
sj w:\active\1634_01448\moose factory\report\rpt_moose_factory_w_and_ww_cc_impacts_final_20180917.docx 3.3
Figure 7: Raw Water Intake and Low Lift Pump Building
CLIMATE CHANGE IMPACTS ON WATER AND WASTEWATER INFRASTRUCTURE AT MOOSE FACTORY
Step 2: Data Collection July 24, 2018
sj w:\active\1634_01448\moose factory\report\rpt_moose_factory_w_and_ww_cc_impacts_final_20180917.docx 3.4
Figure 8: Raw Water Intake Structure – River Level Fluctuations

CLIMATE CHANGE IMPACTS ON WATER AND WASTEWATER INFRASTRUCTURE AT MOOSE FACTORY
Step 2: Data Collection July 24, 2018
sj w:\active\1634_01448\moose factory\report\rpt_moose_factory_w_and_ww_cc_impacts_final_20180917.docx 3.5
Water Treatment Plant - Building
The water treatment systems are housed in the water treatment plant building, a steel framed aluminum sided building structure constructed on a poured concrete foundation. Annexed to the water plant is a separate building that houses the hot water heating system equipment for the hospital.
The Ecodyne and Napier Reid treatment units along with the chemical treatment equipment and chemical storage areas are all located on the main floor of the building. The high lift treated water pumps and fire water pumps are located in the building basement. Treated water, fire water and steam heat piping are connected to the hospital through an underground concrete tunnel.
Figure 9: Filter System Inside the WTP
Treated Water Storage
Treated and disinfected water from the Ecodyne and Napier-Reed treatment equipment is stored in an underground concrete clearwell adjacent to the water treatment building. Four transfer pumps pump water from the clearwell to an above ground storage tank. Total treated water storage for the Moose Factory WTP is approximately 1,350 m3
(410m3 underground and 940m3 above ground storage).

CLIMATE CHANGE IMPACTS ON WATER AND WASTEWATER INFRASTRUCTURE AT MOOSE FACTORY
Step 2: Data Collection July 24, 2018
sj w:\active\1634_01448\moose factory\report\rpt_moose_factory_w_and_ww_cc_impacts_final_20180917.docx 3.6
High lift Pumps and Water Distribution Piping
Water is pumped from the above ground storage tank into the distribution system by four high-lift pumps. The pumps are controlled through the WTP Programmable Logic Controller (PLC)/Supervisory Control and Data Acquisition (SCADA) system to maintain a set pressure in the distribution system. If the pressure in the distribution main drops below the low pressure set point, additional high lift pumps will start to raise the pressure in the distribution system to above the low pressure set point.
Emergency/Back-up Generator and SCADA System
Back-up electrical power is provided by two 1.5 MW diesel generators owned and operated by the Weeneebayko General Hospital. The generators are located outside the WTP building.
The WTP operations are monitored and controlled by a SCADA system as shown in Figure 10.
Figure 10: SCADA Screen Showing the WTP Operations
3.1.2 Wastewater System
The Moose Factory wastewater system is comprised of four lift stations that convey raw sewage to a three-cell lagoon located on the western side of the island. Raw sewage is collected and conveyed through the wastewater system by a network of underground sanitary sewer pipes. Operation and maintenance access to the pipes is possible through a series of manholes. Figure 11 shows the layout of the wastewater system at Moose Factory.

CLIMATE CHANGE IMPACTS ON WATER AND WASTEWATER INFRASTRUCTURE AT MOOSE FACTORY
Step 2: Data Collection July 24, 2018
sj w:\active\1634_01448\moose factory\report\rpt_moose_factory_w_and_ww_cc_impacts_final_20180917.docx 3.7
Figure 11: Moose Factory – Sewer Main and Treatment Lagoons Layout (Source: ACRS Report by Saulteaux Consulting and Engineering. Inspected Summer 2016)
Sewage Lift Stations
Each sewage lift station is comprised of submersible pumps within a buried fiberglass tank wet well with steel access hatches and vent piping in the lid, a davit crane for removal and installation of the pumps, and an electrical control panel. With the exception of one station, each lift station is equipped with two pumps that operate on a duty and standby system. Each station is equipped with an autodialer that automatically calls the operator’s cell phone when a problem with the pump station occurs.
Lagoon and Blower Building
The lagoon site is comprised of three treatment cells, a blower building and a valve chamber. The site is fully fenced. Access is by a gravel road through a locked gate.
A valve chamber at the lagoon site is used to direct raw sewage as well as control the aeration treatment system to the different cells. Blowers inside the blower building provide aeration to the raw sewage through underground piping

CLIMATE CHANGE IMPACTS ON WATER AND WASTEWATER INFRASTRUCTURE AT MOOSE FACTORY
Step 2: Data Collection July 24, 2018
sj w:\active\1634_01448\moose factory\report\rpt_moose_factory_w_and_ww_cc_impacts_final_20180917.docx 3.8
to assist the treatment process. Final treated effluent flows from the northeast most cell through the outfall into a creek which discharges into the Moose River.
Figure 12: Typical Lift Station, Lagoon Cell, Valve Chamber and Blower Building
3.2 CONDITION OF INFRASTRUCTURE COMPONENTS
In terms of condition/performance rating, no field inspection was carried out by the Project Team, and we relied exclusively on the asset condition and performance data provided by the ACRS inspection report (2016) and the Public Works and OCWA staff on the Project Team.
The ICMS data provides an overall general condition rating (GCR) for each infrastructure asset on a scale from 0 to 10, with 10 being a new asset, as shown in Table 4. The ICMS rating does not provide a description of the performance, deterioration or needs for the asset or its components. As a reference, Table 4 also shows the Canadian Infrastructure Report Card (CIRC) (see www.CanadaInfrastructure.ca) rating system commonly used by municipalities. The right-most column of the table includes a description of the rating used by the City of Edmonton to illustrate the meaning of the ratings.

CLIMATE CHANGE IMPACTS ON WATER AND WASTEWATER INFRASTRUCTURE AT MOOSE FACTORY
Step 2: Data Collection July 24, 2018
sj w:\active\1634_01448\moose factory\report\rpt_moose_factory_w_and_ww_cc_impacts_final_20180917.docx 3.9
Table 3: INAC's ICMS, Canadian Infrastructure Report Card (CIRC) Condition Rating Scales and Description (from City of Edmonton)
ICMS GENERAL CONDITION
RATING
CIRC CONDITION
RATING
DESCRIPTION (Source: City of Edmonton)
0 Closed or Critical
1 Very Poor
• The element is physically unsound and/or not performing as originally intended.
• Element has higher probability of failure or failure is imminent. • Maintenance costs are unacceptable and rehabilitation is not cost
effective. • Replacement/major refurbishment is required.
1 – 3 Poor 2 Poor • The element is showing significant signs of deterioration and is performing to a much lower level than originally intended.
• A major portion of the element is physically deficient. • Required maintenance costs significantly exceed acceptable standards
and norms. • Typically, element is approaching the end of its expected life.
4 – 6 Fair 3 Fair • The element is showing signs of deterioration and is performing at a lower level than originally intended. Some components of the element are becoming physically deficient.
• Required maintenance costs exceed acceptable standards and norms but are increasing.
• Typically, element has been used for a long time and is within the later stage of its expected life.
7 - 9 Good 4 Good • The element is physically sound and is performing its function as originally intended.
• Required maintenance costs are within acceptable standards and norms but are increasing.
• Typically, element has been used for some time but is within mid-stage of its expected life.
10 New 5 Very Good
• The element is physically sound and is performing its function as originally intended.
• Required maintenance costs are well within standards and norms. Typically, element is new or recently rehabilitated.
99 Not Inspected
The INAC and CIRC scales present similar ratings but are not comparable on a 1-to-1 basis.
CLIMATE CHANGE IMPACTS ON WATER AND WASTEWATER INFRASTRUCTURE AT MOOSE FACTORY
Step 2: Data Collection July 24, 2018
sj w:\active\1634_01448\moose factory\report\rpt_moose_factory_w_and_ww_cc_impacts_final_20180917.docx 3.10
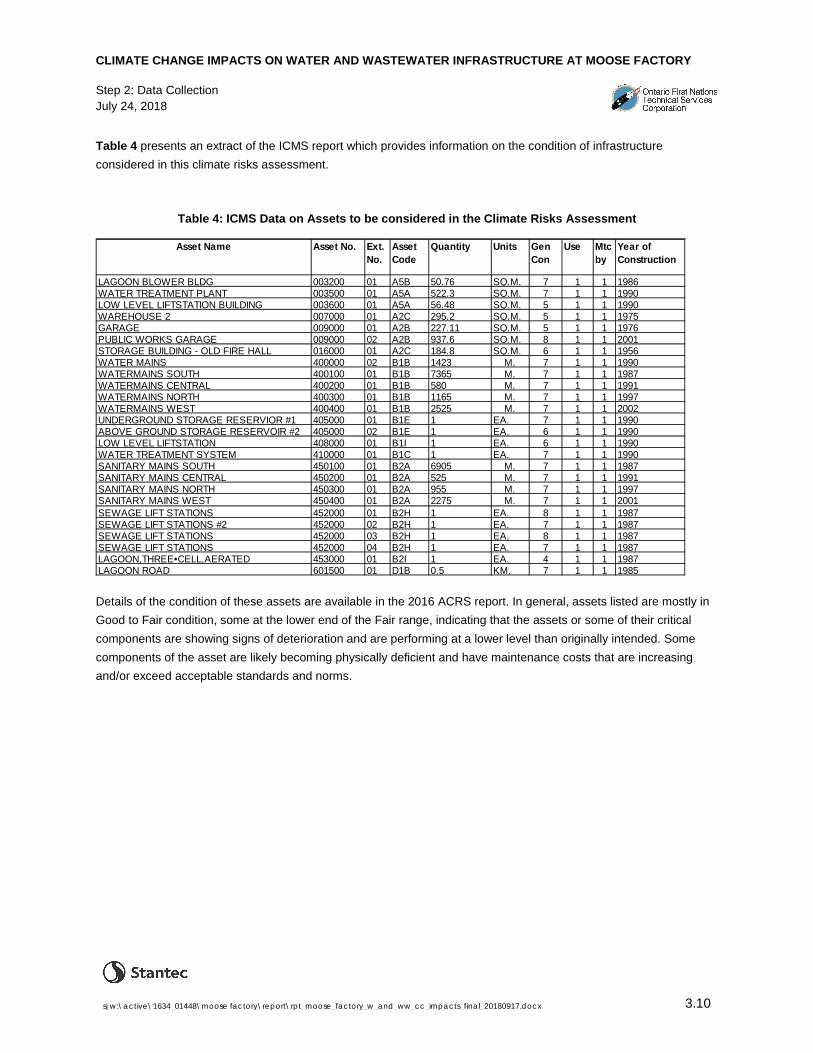
Table 4 presents an extract of the ICMS report which provides information on the condition of infrastructure considered in this climate risks assessment.
Table 4: ICMS Data on Assets to be considered in the Climate Risks Assessment
Asset Name Asset No. Ext. No.
Asset Code
Quantity Units Gen Con
Use Mtc by
Year of Construction
LAGOON BLOWER BLDG 003200 01 A5B 50.76 SQ.M. 7 1 1 1986WATER TREATMENT PLANT 003500 01 A5A 522.3 SQ.M. 7 1 1 1990LOW LEVEL LIFTSTATION BUILDING 003600 01 A5A 56.48 SQ.M. 5 1 1 1990WAREHOUSE 2 007000 01 A2C 295.2 SQ.M. 5 1 1 1975GARAGE 009000 01 A2B 227.11 SQ.M. 5 1 1 1976PUBLIC WORKS GARAGE 009000 02 A2B 937.6 SQ.M. 8 1 1 2001STORAGE BUILDING - OLD FIRE HALL 016000 01 A2C 184.8 SQ.M. 6 1 1 1956WATER MAINS 400000 02 B1B 1423 M. 7 1 1 1990WATERMAINS SOUTH 400100 01 B1B 7365 M. 7 1 1 1987WATERMAINS CENTRAL 400200 01 B1B 580 M. 7 1 1 1991WATERMAINS NORTH 400300 01 B1B 1165 M. 7 1 1 1997WATERMAINS WEST 400400 01 B1B 2525 M. 7 1 1 2002UNDERGROUND STORAGE RESERVIOR #1 405000 01 B1E 1 EA. 7 1 1 1990ABOVE GROUND STORAGE RESERVOIR #2 405000 02 B1E 1 EA. 6 1 1 1990LOW LEVEL LIFTSTATION 408000 01 B1I 1 EA. 6 1 1 1990WATER TREATMENT SYSTEM 410000 01 B1C 1 EA. 7 1 1 1990SANITARY MAINS SOUTH 450100 01 B2A 6905 M. 7 1 1 1987SANITARY MAINS CENTRAL 450200 01 B2A 525 M. 7 1 1 1991SANITARY MAINS NORTH 450300 01 B2A 955 M. 7 1 1 1997SANITARY MAINS WEST 450400 01 B2A 2275 M. 7 1 1 2001SEWAGE LIFT STATIONS 452000 01 B2H 1 EA. 8 1 1 1987SEWAGE LIFT STATIONS #2 452000 02 B2H 1 EA. 7 1 1 1987SEWAGE LIFT STATIONS 452000 03 B2H 1 EA. 8 1 1 1987SEWAGE LIFT STATIONS 452000 04 B2H 1 EA. 7 1 1 1987LAGOON,THREE•CELL,AERATED 453000 01 B2I 1 EA. 4 1 1 1987LAGOON ROAD 601500 01 D1B 0.5 KM. 7 1 1 1985
Details of the condition of these assets are available in the 2016 ACRS report. In general, assets listed are mostly in Good to Fair condition, some at the lower end of the Fair range, indicating that the assets or some of their critical components are showing signs of deterioration and are performing at a lower level than originally intended. Some components of the asset are likely becoming physically deficient and have maintenance costs that are increasing and/or exceed acceptable standards and norms.

CLIMATE CHANGE IMPACTS ON WATER AND WASTEWATER INFRASTRUCTURE AT MOOSE FACTORY
Step 2: Data Collection July 24, 2018
sj w:\active\1634_01448\moose factory\report\rpt_moose_factory_w_and_ww_cc_impacts_final_20180917.docx 3.11
Following are observations on the water and wastewater systems reported in the Moose Factory 2016 ACRS report.
General observations on the condition of assets considered in this climate risks assessment (Source: Asset Condition Reporting System, Final Report, All On-Reserve at Moose Cree First Nation. Report to Indigenous and Northern Affairs Canada, Saulteaux Consulting and Engineering. Inspected Summer 2016) Water Treatment The water treatment system consists of two separate water treatment systems located in Moose Factory. The systems are both conventional treatment systems and the oldest system has extensive rusting. There are two reservoirs, and a low lift station. The system is aged and is separated in two different buildings and is operating well. The system is operated by OCWA but two community members operate under the employment of OCWA. The fire pump is not working in Auto due to a broken watermain. The watermain is scheduled for repair but due to the pressure loss, the operators have the system in manual.
Watermains are in good condition but there are a number of hydrants not working. Sewage Sewage is disposed via a gravity sewage collection system, 4 liftstations, and a facultative lagoon. Presently the blowers for the aeration system in the lagoon is not in operation and have not been working for a number of years. All four (4) of the liftstations are working and in good condition. For the size of the population the lagoons seem undersized. The operator has had no formal training on operating the system and should be trained. The valve chamber was half full of ground water and the valves do not operate. A study should be initiated on the system to determine proper operation, treatment efficiency, and life expectancy. At the time of inspection, sewage was making its way through the 3 cells and then going out through the overflow.
Buildings The Public Works and Housing Warehouse are well maintained; however, the other garages and warehouses are in need of repairs/upgrades and are only in fair condition.
CLIMATE CHANGE IMPACTS ON WATER AND WASTEWATER INFRASTRUCTURE AT MOOSE FACTORY
Step 2: Data Collection July 24, 2018
sj w:\active\1634_01448\moose factory\report\rpt_moose_factory_w_and_ww_cc_impacts_final_20180917.docx 3.12
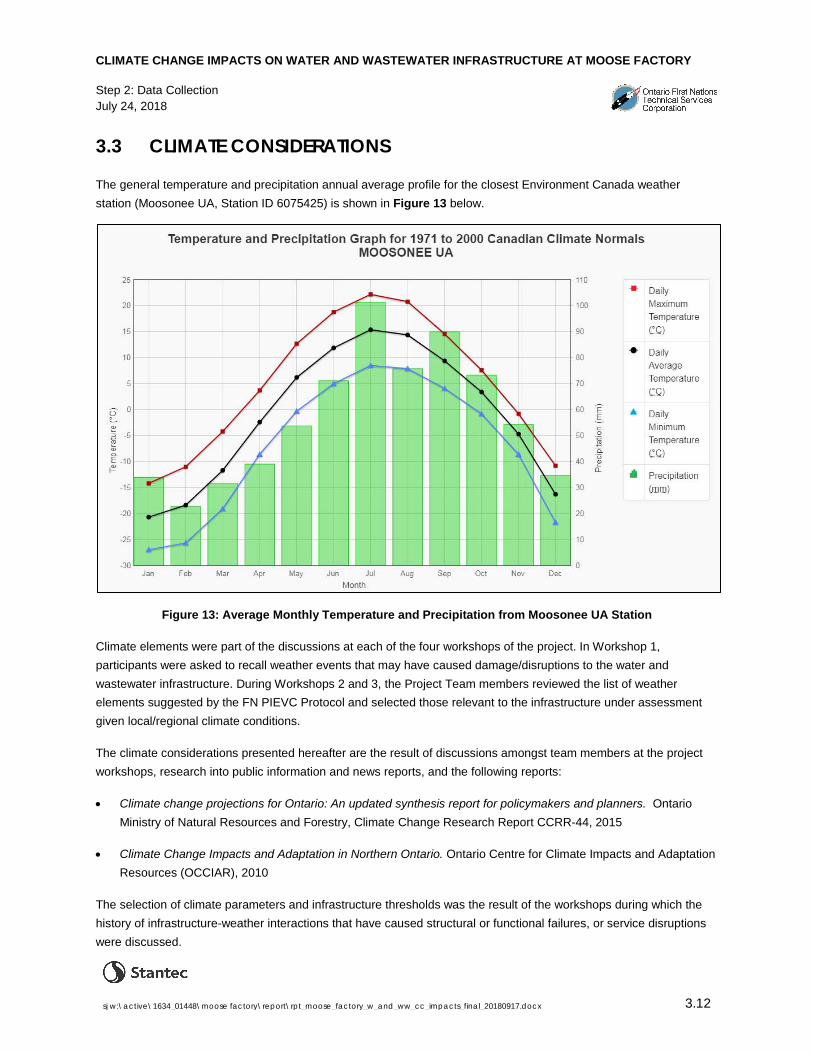
3.3 CLIMATE CONSIDERATIONS
The general temperature and precipitation annual average profile for the closest Environment Canada weather station (Moosonee UA, Station ID 6075425) is shown in Figure 13 below.
Figure 13: Average Monthly Temperature and Precipitation from Moosonee UA Station
Climate elements were part of the discussions at each of the four workshops of the project. In Workshop 1, participants were asked to recall weather events that may have caused damage/disruptions to the water and wastewater infrastructure. During Workshops 2 and 3, the Project Team members reviewed the list of weather elements suggested by the FN PIEVC Protocol and selected those relevant to the infrastructure under assessment given local/regional climate conditions.
The climate considerations presented hereafter are the result of discussions amongst team members at the project workshops, research into public information and news reports, and the following reports:
• Climate change projections for Ontario: An updated synthesis report for policymakers and planners. Ontario Ministry of Natural Resources and Forestry, Climate Change Research Report CCRR-44, 2015
• Climate Change Impacts and Adaptation in Northern Ontario. Ontario Centre for Climate Impacts and Adaptation Resources (OCCIAR), 2010
The selection of climate parameters and infrastructure thresholds was the result of the workshops during which the history of infrastructure-weather interactions that have caused structural or functional failures, or service disruptions were discussed.

CLIMATE CHANGE IMPACTS ON WATER AND WASTEWATER INFRASTRUCTURE AT MOOSE FACTORY
Step 2: Data Collection July 24, 2018
sj w:\active\1634_01448\moose factory\report\rpt_moose_factory_w_and_ww_cc_impacts_final_20180917.docx 3.13
3.3.1 Climate Trends and Projections
The main source of climate data was the Environment Canada weather station at Moosonee (Station ID: 6075425)
The figures below provide examples of data used for the study; details are provided in the Workshop presentations in Appendix A. Initial future climate projections were based on the Intergovernmental Panel on Climate Change (IPCC) RCP4 4.5 scenario - a stabilization scenario in which total radiative forcing is stabilized shortly after 21005. The analysis of global green house gas (GHG) emissions in recent years led to the decision by the Project Team to use the RCP 8.5 emissions scenario for the future climate analysis.
Figure 14: Mean Daily Temperature for Summer - Historical Trend and Future Climate Projection (Moosonee Weather Station, RCP 8.5)
4 RCP: Representative Concentration Pathways – a greenhouse gas concentration (not emissions) trajectories adopted by the Intergovernmental Panel on Climate Change (IPCC) for its fifth Assessment Report (AR5) in 2014. 5 By comparison, RCP 8.5 is characterized by increasing greenhouse gas emissions over time, representative of scenarios in the literature that lead to high greenhouse gas concentration levels, while RCP 2.6 emission pathway is representative of scenarios that lead to very low greenhouse gas concentration levels.
The IPCC is the international body for assessing the science related to climate change. The IPCC was set up in 1988 by the World Meteorological Organization (WMO) and United Nations Environment Programme (UNEP) to provide policymakers with regular assessments of the scientific basis of climate change, its impacts and future risks, and options for adaptation and mitigation. IPCC assessments provide a scientific basis for governments at all levels to develop climate related policies, and they underlie negotiations at the UN Climate Conference – the United Nations Framework Convention on Climate Change (UNFCCC). The assessments are policy-relevant but not policy-prescriptive: they may present projections of future climate change based on different scenarios and the risks that climate change poses and discuss the implications of response options, but they do not tell policymakers what actions to take.

CLIMATE CHANGE IMPACTS ON WATER AND WASTEWATER INFRASTRUCTURE AT MOOSE FACTORY
Step 2: Data Collection July 24, 2018
sj w:\active\1634_01448\moose factory\report\rpt_moose_factory_w_and_ww_cc_impacts_final_20180917.docx 3.14
Figure 15: Mean Daily Temperature for Winter - Historical Trend and Future Climate Projection (Moosonee Weather Station, RCP 8.5)
Figure 16: Summer Precipitation - Historical Trend and Future Climate Projection (Moosonee Weather Station, RCP 8.5)

CLIMATE CHANGE IMPACTS ON WATER AND WASTEWATER INFRASTRUCTURE AT MOOSE FACTORY
Step 2: Data Collection July 24, 2018
sj w:\active\1634_01448\moose factory\report\rpt_moose_factory_w_and_ww_cc_impacts_final_20180917.docx 3.15
Figure 17: Winter Precipitation - Historical Trend and Future Climate Projection
(Moosonee Weather Station, RCP 8.5)
3.3.2 Climate Elements Considered to Affect the Infrastructure
The selected climate elements for the exposure, vulnerability, and risk assessments are shown in Table 5 below.
Table 5: Principal Climate Elements Selected by the Project Team for the Analysis
Type of Climate Element
Description Comment
Temperature High Temperatures Occurrence of 10 days/year with Temp. >30°C
Extreme High Temperatures Occurrence of 1-3 days/year with Max Temp. >35°C
Seasonal temperature variations Heating and cooling degree days
Extreme cold Occurrence of Temp. of -40°C or less without windchill factor
Shift in seasonal temperatures Increase in air-only access due to ice road thaw
Precipitation 3 consecutive days of winter rain Southern Ontario Threshold for weather warning causing flood of 25 mm (May be different for Northern Ontario)
Freezing rain Estimated 15 mm causing local power line damage
Short duration - High Intensity rainfall 20 mm in one hour
Shift in seasonal precipitation Flow variability
3 consecutive days of rain Selected based on past precipitation events that have caused disruptions and/or failures, for example, rainfall July 6/86 - 122mm in approximately 12 hours
Heavy snowfall 100 cm in 3 days

CLIMATE CHANGE IMPACTS ON WATER AND WASTEWATER INFRASTRUCTURE AT MOOSE FACTORY
Step 3: Complete the Risk Assessment July 24, 2018
sj w:\active\1634_01448\moose factory\report\rpt_moose_factory_w_and_ww_cc_impacts_final_20180917.docx 4.1
4.0 STEP 3: COMPLETE THE RISK ASSESSMENT
Step 3 of the Protocol instructs the Project Team to perform the following steps, illustrated in Figure 18. Details of the process are provided in Section 4.5.2.
Figure 18: FN PIEVC Protocol Risk Assessment Process Flowchart
4.1 RISK THRESHOLDS
Risk is defined as the product of the Probability score multiplied by the Severity score. Since the probability and the severity scores are each rated from 0 to 5, the maximum risk score will be 25 as illustrated below. For this project, the Project Team selected the risk thresholds shown in Table 6 below.
CLIMATE CHANGE IMPACTS ON WATER AND WASTEWATER INFRASTRUCTURE AT MOOSE FACTORY
Step 3: Complete the Risk Assessment July 24, 2018
sj w:\active\1634_01448\moose factory\report\rpt_moose_factory_w_and_ww_cc_impacts_final_20180917.docx 4.2
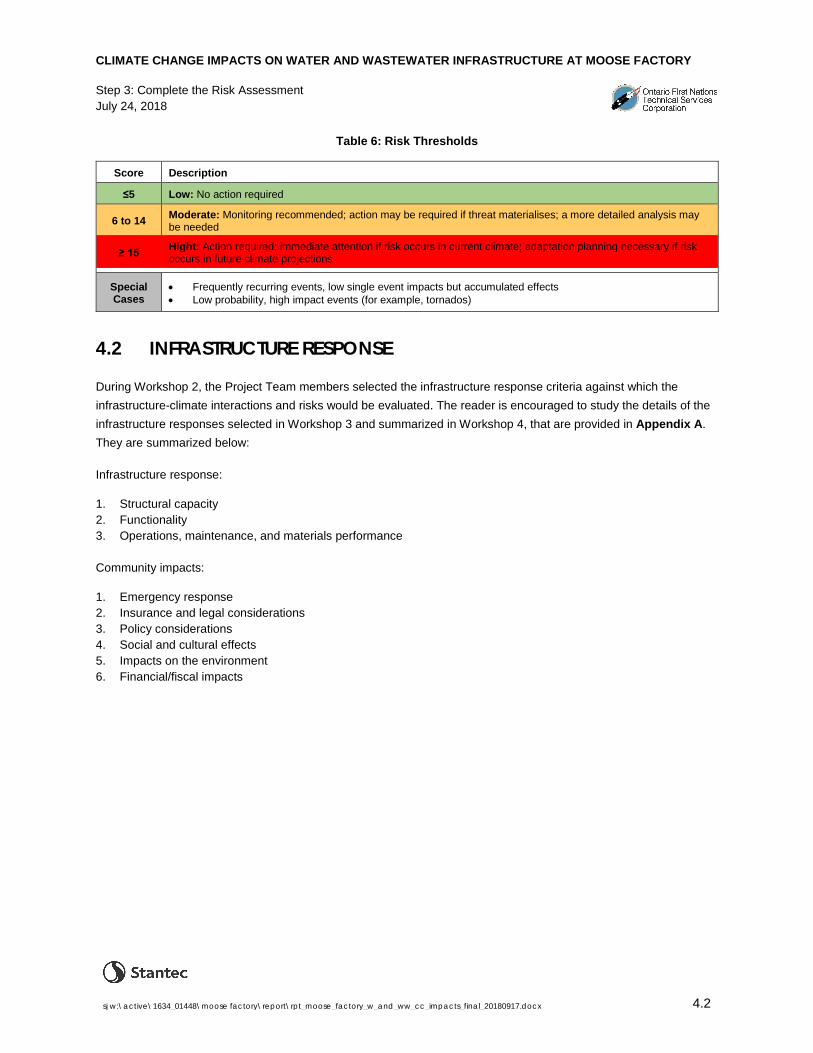
Table 6: Risk Thresholds
Score Description
≤5 Low: No action required
6 to 14 Moderate: Monitoring recommended; action may be required if threat materialises; a more detailed analysis may be needed
≥ 15 Hight: Action required; immediate attention if risk occurs in current climate; adaptation planning necessary if risk occurs in future climate projections
Special Cases
• Frequently recurring events, low single event impacts but accumulated effects • Low probability, high impact events (for example, tornados)
4.2 INFRASTRUCTURE RESPONSE
During Workshop 2, the Project Team members selected the infrastructure response criteria against which the infrastructure-climate interactions and risks would be evaluated. The reader is encouraged to study the details of the infrastructure responses selected in Workshop 3 and summarized in Workshop 4, that are provided in Appendix A. They are summarized below:
Infrastructure response:
1. Structural capacity 2. Functionality 3. Operations, maintenance, and materials performance
Community impacts:
1. Emergency response 2. Insurance and legal considerations 3. Policy considerations 4. Social and cultural effects 5. Impacts on the environment 6. Financial/fiscal impacts

CLIMATE CHANGE IMPACTS ON WATER AND WASTEWATER INFRASTRUCTURE AT MOOSE FACTORY
Step 3: Complete the Risk Assessment July 24, 2018
sj w:\active\1634_01448\moose factory\report\rpt_moose_factory_w_and_ww_cc_impacts_final_20180917.docx 4.3
4.3 CLIMATE PROBABILITY SCORING
The FN PIEVC Protocol rates the probability of the climate events occurring (current and future climate) as follows:
Table 7: FN PIEVC Probability Scoring
Score Description
0 Negligible Not applicable
1 Highly unlikely Improbable
2 Remotely possible
3 Possible Occasional
4 Somewhat likely Normal
5 Likely Frequent
The following table presents the results of the climate analysis (current trends and future projections), and the corresponding FN PIEVC probability scores used in the risk assessment.

CLIMATE CHANGE IMPACTS ON WATER AND WASTEWATER INFRASTRUCTURE AT MOOSE FACTORY
Step 3: Complete the Risk Assessment July 24, 2018
sj w:\active\1634_01448\moose factory\report\rpt_moose_factory_w_and_ww_cc_impacts_final_20180917.docx 4.4
Table 8: Probability Scores for Selected Climate Events
Current Future
High Temperatures Occurrence of 10 days/year with Temp. >30°C (Current climate = 6.1 days/year >30°C without humidex)
4 5
Extreme High Temperatures Occurrence of 1-3 days/year with Max Temp. >35°C (Current climate = 0.26 days/year >35°C without humidex)
5 5
Temperature Variations Seasonal Temp. Variations Heating and cooling degree days.(Current climate cooling = 77 degree days)
4 5
Minimum temperature Extreme cold Temp. of -40°C or less without windchill factor (Current climate = 0.5 days/year)
5 3
Seasonal Shift in seasonal temperatures. Late freeze and or early thaw
Lengthening of air only access season due to ice road thaw and other impacts on river. Professional judgement of the Project Team.
5 5
Winter rain 3 consecutive days of winter rain Southern Ontario Threshold for weather warning causing flood of 25 mm.May be different for Northern Ontario
2 3
Freezing rain Accumulation of freezing rain Estimated 15 mm causing local power line damage and damage to trees
4 5
Short Duration Rain Short Duration - High Intensity (20 mm in one hour)
Only 3 years of IDF data (2004 to 2006). Approx. equivalent to a 1:5 rain event
4 5
Long Duration Rain 3 consecutive days of rain Selected based on past precipitation events that have caused distruptions and/or failures, for example, rainfall July 6/86 - 122mm in 12 hours or less
2 4
Precipitation (snow) Heavy snowfall 100 cm or more in 3 days 4 5
Climate Event Description Comment
“Quick response” of flow in river to changes in air temperature in the Spring as evidenced from comparison of temperature and river flow data.
Temperature
Precipitation
Rating
Maximum temperature
Precipitation Variations Shift in seasonal precipitation. Changes in Moose River flow patterns
5 5
CLIMATE CHANGE IMPACTS ON WATER AND WASTEWATER INFRASTRUCTURE AT MOOSE FACTORY
Step 3: Complete the Risk Assessment July 24, 2018
sj w:\active\1634_01448\moose factory\report\rpt_moose_factory_w_and_ww_cc_impacts_final_20180917.docx 4.5
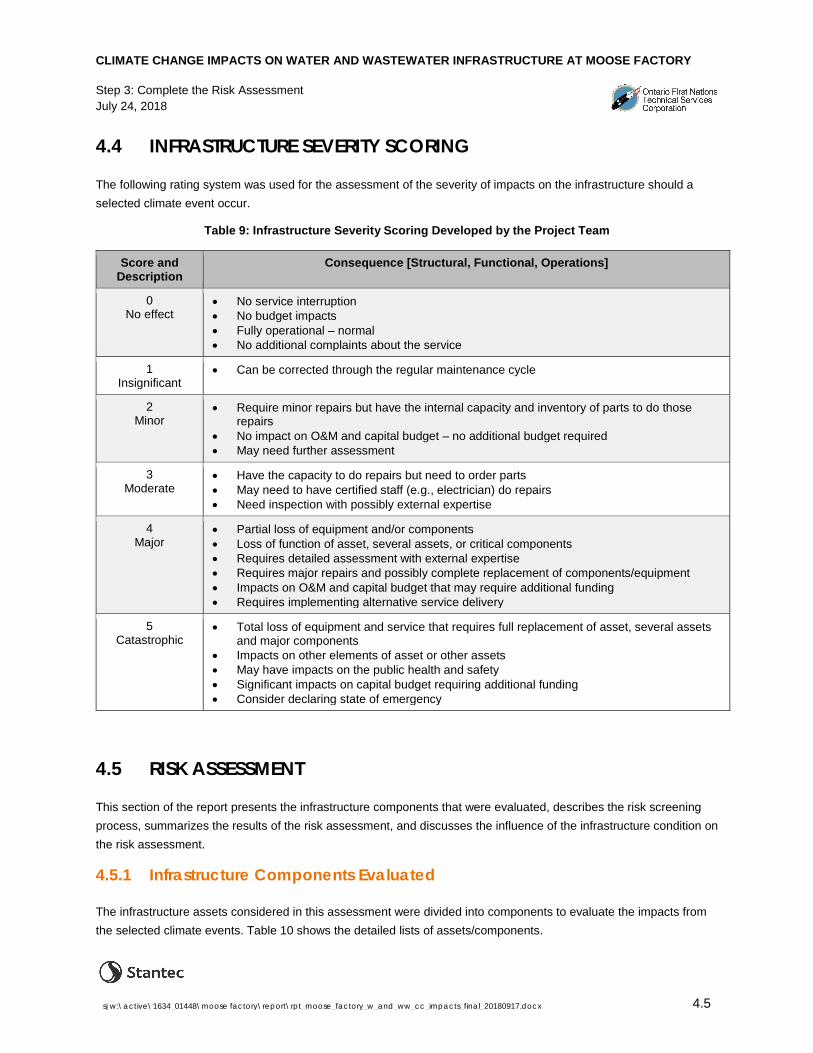
4.4 INFRASTRUCTURE SEVERITY SCORING
The following rating system was used for the assessment of the severity of impacts on the infrastructure should a selected climate event occur.
Table 9: Infrastructure Severity Scoring Developed by the Project Team
Score and Description
Consequence [Structural, Functional, Operations]
0 No effect
• No service interruption • No budget impacts • Fully operational – normal • No additional complaints about the service
1 Insignificant
• Can be corrected through the regular maintenance cycle
2 Minor
• Require minor repairs but have the internal capacity and inventory of parts to do those repairs
• No impact on O&M and capital budget – no additional budget required • May need further assessment
3 Moderate
• Have the capacity to do repairs but need to order parts • May need to have certified staff (e.g., electrician) do repairs • Need inspection with possibly external expertise
4 Major
• Partial loss of equipment and/or components • Loss of function of asset, several assets, or critical components • Requires detailed assessment with external expertise • Requires major repairs and possibly complete replacement of components/equipment • Impacts on O&M and capital budget that may require additional funding • Requires implementing alternative service delivery
5 Catastrophic
• Total loss of equipment and service that requires full replacement of asset, several assets and major components
• Impacts on other elements of asset or other assets • May have impacts on the public health and safety • Significant impacts on capital budget requiring additional funding • Consider declaring state of emergency
4.5 RISK ASSESSMENT
This section of the report presents the infrastructure components that were evaluated, describes the risk screening process, summarizes the results of the risk assessment, and discusses the influence of the infrastructure condition on the risk assessment.
4.5.1 Infrastructure Components Evaluated
The infrastructure assets considered in this assessment were divided into components to evaluate the impacts from the selected climate events. Table 10 shows the detailed lists of assets/components.

CLIMATE CHANGE IMPACTS ON WATER AND WASTEWATER INFRASTRUCTURE AT MOOSE FACTORY
Step 3: Complete the Risk Assessment July 24, 2018
sj w:\active\1634_01448\moose factory\report\rpt_moose_factory_w_and_ww_cc_impacts_final_20180917.docx 4.6
Table 10: Infrastructure Assessed
Wastewater System Lagoons
Cell 1 Cell 2 Cell 3
Lagoon blower building Lagoon Road
Sanitary mains South Sanitary mains Central Sanitary mains North Sanitary mains West
Sewage lift stations (#1-4) Sewage lift station #5 Third party services Electricity Telecommunications Fuel supply WTP chemical supply
River Raw Water Supply Transportation Corridor
Potable water system Intake Structure
Water treatment plant - Building
Building envelope Building structure
Roof Foundations Heating/Cooling system
Fuel- Heating oil (backup for heat) Backup generator Water treatment system
Underground reservoir (#1) Above-ground reservoir (#2)
Low level lift station Building
Low level lift station equipment
Watermains South
Watermains Central Watermains North
Watermains West
Hydrants
Administration and operations Operations personnel
Support buildings Old Fire Hall
Building envelope Building structure Roof Foundations Heating system
Public works garage Building envelope Building structure Roof Heating system
Garage Building envelope Building structure Roof Foundations Heating system

CLIMATE CHANGE IMPACTS ON WATER AND WASTEWATER INFRASTRUCTURE AT MOOSE FACTORY
Step 3: Complete the Risk Assessment July 24, 2018
sj w:\active\1634_01448\moose factory\report\rpt_moose_factory_w_and_ww_cc_impacts_final_20180917.docx 4.7
4.5.2 Risk Screening Process
The first step in the production of the risk matrix (illustrated in Figure 18) is to evaluate whether there is an interaction between an infrastructure component and a climate event, also referred to as establishing the exposure of the infrastructure to the climate hazards. Where an interaction exists, the Project Team identifies with respect to which infrastructure performance considerations the potential risk might exist (e.g. impacts on the structural capacity or the functionality of the asset or component) - see Section 4.2 of this report for a description of the infrastructure performance considerations selected for this study.
Furthermore, the risks associated with future climate events were evaluated with respect to two asset conditions: Condition 1 relates to the scenario where assets, over the study period (i.e., 2050s) have been maintained in a state of good repair; Condition 2 relates to the scenario where the assets have reached or passed their design life, or have not been maintained in a state of good repair. Condition 2 thus presents a higher level of vulnerability for these assets.
4.5.3 Summary of Risk Results
Table 11 presents a summary of the risk counts for the number of infrastructure-climate interactions in each risk threshold category (Moderate, and High). The table also presents the infrastructure assets or components affected, and the performance impacted if the risks occur. The general risk matrices created for this project consider infrastructure in a good state of repair, operating at the performance level for which it was designed.
The highest risks to the infrastructure and community identified by the study are:
1. Observed and projected seasonal shifts in temperature and precipitation. They impact the Moose River which is the source of raw water for the community and is an essential transportation link to the mainland.
2. Extreme cold was also identified as a threat to several infrastructure assets and services: electricity, heating systems (particularly the Old Fire Hall) and hydrants. Although annual and seasonal temperature averages are projected to increase in the future, changes in climate are projected to increase the extremes (high and low), and therefore continue to pose a threat in the future.

CLIMATE CHANGE IMPACTS ON WATER AND WASTEWATER INFRASTRUCTURE AT MOOSE FACTORY
Step 3: Complete the Risk Assessment July 24, 2018
sj w:\active\1634_01448\moose factory\report\rpt_moose_factory_w_and_ww_cc_impacts_final_20180917.docx 4.8
Table 11: Summary of Moderate and High Risks
Risk Score Counts
Main Climate Events Principal Infrastructure Affected Risk Threshold Category
Current Climate
Future (2050s) Climate
Condition 1 Infrastructure
replaced at end of design life and well maintained
Condition 2 Infrastructure
deteriorated (not replaced or poorly
maintained) Moderate 22 34 36 • Maximum temperatures
• Freezing rain • Precipitation (Rain) – short
duration/high intensity • Extreme cold • Heavy snow fall
• Heating and cooling systems in buildings • Operations personnel • Old Fire Hall roof • Telecommunications • Fuel supply • WTP chemicals supply • Sewage lift-stations • Fuel- Heating oil (backup for heat) • Backup generators • Roof WTP and Old Fire Hall • Operations Personnel • Fuel and WTP chemicals supplies
High 9 9 10 • Extreme cold • Freezing rain • Seasonal shift in temperatures • Seasonal shift in precipitation
• Electricity • Heating system – Old Fire Hall • Hydrants • Electricity • Water intake • Transportation corridor • Water intake • Raw water supply • Transportation Corridor

CLIMATE CHANGE IMPACTS ON WATER AND WASTEWATER INFRASTRUCTURE AT MOOSE FACTORY
Step 3: Complete the Risk Assessment July 24, 2018
sj w:\active\1634_01448\moose factory\report\rpt_moose_factory_w_and_ww_cc_impacts_final_20180917.docx 4.9
4.5.4 Influence of the Infrastructure Condition
The condition of the infrastructure is a key element to establishing risks. Estimating the future condition of the infrastructure is a complex process that requires predicting the operations, maintenance, and capital investments to maintain the infrastructure in a state of good repair and replacing it when it has reached the end of its service life. This is the realm of sound asset management practices.
Without knowledge of long-term capital investment plans for this infrastructure, the worst-case scenario (Condition 2) is that none will be replaced during the study time horizon and current maintenance procedures cannot be sustained due to funding pressures. This results in a higher vulnerability to the climate hazards identified, which is completed by increasing the severity scores by one for each of the climate-infrastructure interactions. Table 12 presents the comparison between the risks to the infrastructure replaced at the end of its design life and maintained in a state of good repair, and the risks with deteriorated infrastructure.
Table 12: Summary of Risks for Infrastructure Replaced at the End of its Design Life and is Well Maintained vs. Infrastructure that is Deteriorated
Future Climate Risk Score Counts | Moose Factory W/WW Infrastructure
Risk Threshold Category
Condition 1 Infrastructure replaced at end of design life and
well maintained
Condition 2 Infrastructure deteriorated
(not replaced or poorly maintained)
Percentage change in risk count
Moderate 34 36 + 6%
High 9 10 + 11%
4.6 COMMUNITY IMPACTS FROM INFRASTRUCTURE RISKS
Infrastructure loss of performance or function affects the whole community. Resilient infrastructure is necessary to provide resilient services that, in turn, contribute to the resilience of the community. The community impacts selected for this study are as follows:
1. Emergency response services can be impacted in following manners:
a. Increased demand due to higher number of emergencies or broad area covered by the event; b. Impacts to the facilities, equipment and personnel that are used to provide emergency services; and c. Loss of functionality of roads or other routes to access the locations where emergencies occur
2. Insurance and legal impacts may result from a failure in the services or damages from the collapse of public assets. For example: basement flooding due to loss of stormwater system capacity; fallen public trees on private property; failure of wastewater systems resulting in temporary facilities’ closures or environmental damage; etc.

CLIMATE CHANGE IMPACTS ON WATER AND WASTEWATER INFRASTRUCTURE AT MOOSE FACTORY
Step 3: Complete the Risk Assessment July 24, 2018
sj w:\active\1634_01448\moose factory\report\rpt_moose_factory_w_and_ww_cc_impacts_final_20180917.docx 4.10
3. Policy considerations relate to the processes, procedures and guidelines that affect the performance of the infrastructure in providing services. As indicated in the previous section, maintaining and operating the infrastructure in a state of good repair and re-capitalizing the assets in a timely manner can be part of a risk mitigation strategy.
4. Social and cultural effects result from the loss of services provided by the infrastructure. In the particular case of water and wastewater services, the impacts are multiple and varied, and can range from mere inconvenience to health and safety issues. These will compound the hardships experienced by the community in the event of extreme climate events.
5. Environmental impacts may result in short or long-term stress to the community, for example, in the event of the loss of key environmental features on a temporary or permanent basis.
6. Financial impacts may redirect resources from other planned investments or priority areas in the community. With limited sources of funding available, the Moose Cree First Nation may have to take extraordinary measures to address its financial situation. This could be in the form, for example, of lowering levels of services.

CLIMATE CHANGE IMPACTS ON WATER AND WASTEWATER INFRASTRUCTURE AT MOOSE FACTORY
Conclusions and Recommendations July 24, 2018
sj w:\active\1634_01448\moose factory\report\rpt_moose_factory_w_and_ww_cc_impacts_final_20180917.docx 5.1
5.0 CONCLUSIONS AND RECOMMENDATIONS
Infrastructure in a community exists to provide a service. Since many of the components or assets within infrastructure systems have long service lives, there are many opportunities to introduce climate change adaptation measures throughout this life-cycle.
The water and wastewater infrastructure of Moose Factory is well maintained and provides safe drinking water and sanitation services. The Public Works Department, under budget pressures, has managed to maintain the infrastructure in a state of good repair; the maintenance practices they have adopted and implemented have resulted in resilient infrastructure.
The Project Team identified adaptive and risk mitigation measures during Workshop 4. Since the intent of the study is to provide an overall risk profile of the infrastructure owned and managed by Moose Factory, the recommendations do not address specific infrastructure issues. The recommendations listed on the following page are not listed in a priority order.
As described in section 4.5.4, if infrastructure is not maintained in a state of good repair or is not replaced when it has reached at the end of its intended service life, it can become more vulnerable to the effects of climate change. The analysis for climate-infrastructure interactions for unmaintained infrastructure, yielded an increase in Moderate and High risk ratings. This reinforces the importance of proper asset management planning, including the sufficient funding of maintenance practices and proper training for operations and maintenance staff.
The impacts of severe climate events on infrastructure is shown to have far reaching consequences in many aspects of a community beyond the infrastructure itself, as detailed in section 4.6. It is recommended all these potential community impacts are considered as reinforcement for policy decisions regarding the creation of sound asset management plans.
CLIMATE CHANGE IMPACTS ON WATER AND WASTEWATER INFRASTRUCTURE AT MOOSE FACTORY
Conclusions and Recommendations July 24, 2018
sj w:\active\1634_01448\moose factory\report\rpt_moose_factory_w_and_ww_cc_impacts_final_20180917.docx 5.2
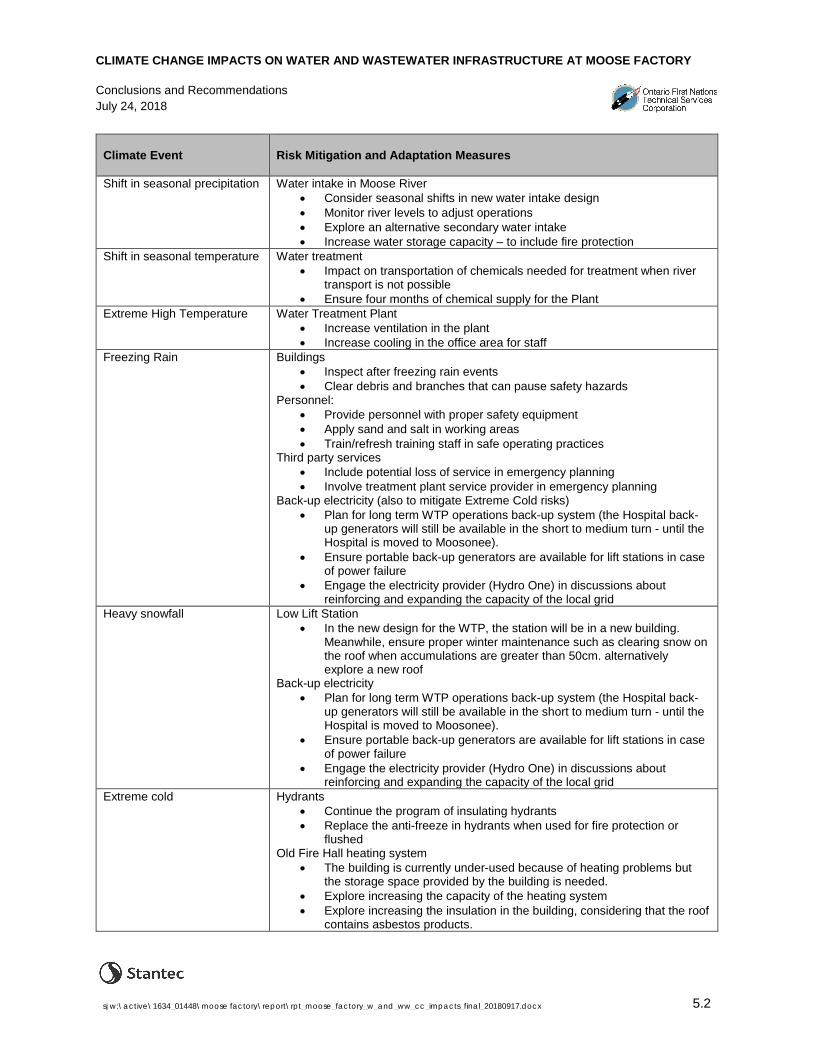
Climate Event
Risk Mitigation and Adaptation Measures
Shift in seasonal precipitation Water intake in Moose River • Consider seasonal shifts in new water intake design • Monitor river levels to adjust operations • Explore an alternative secondary water intake • Increase water storage capacity – to include fire protection
Shift in seasonal temperature Water treatment • Impact on transportation of chemicals needed for treatment when river
transport is not possible • Ensure four months of chemical supply for the Plant
Extreme High Temperature Water Treatment Plant • Increase ventilation in the plant • Increase cooling in the office area for staff
Freezing Rain Buildings • Inspect after freezing rain events • Clear debris and branches that can pause safety hazards
Personnel: • Provide personnel with proper safety equipment • Apply sand and salt in working areas • Train/refresh training staff in safe operating practices
Third party services • Include potential loss of service in emergency planning • Involve treatment plant service provider in emergency planning
Back-up electricity (also to mitigate Extreme Cold risks) • Plan for long term WTP operations back-up system (the Hospital back-
up generators will still be available in the short to medium turn - until the Hospital is moved to Moosonee).
• Ensure portable back-up generators are available for lift stations in case of power failure
• Engage the electricity provider (Hydro One) in discussions about reinforcing and expanding the capacity of the local grid
Heavy snowfall Low Lift Station • In the new design for the WTP, the station will be in a new building.
Meanwhile, ensure proper winter maintenance such as clearing snow on the roof when accumulations are greater than 50cm. alternatively explore a new roof
Back-up electricity • Plan for long term WTP operations back-up system (the Hospital back-
up generators will still be available in the short to medium turn - until the Hospital is moved to Moosonee).
• Ensure portable back-up generators are available for lift stations in case of power failure
• Engage the electricity provider (Hydro One) in discussions about reinforcing and expanding the capacity of the local grid
Extreme cold Hydrants • Continue the program of insulating hydrants • Replace the anti-freeze in hydrants when used for fire protection or
flushed Old Fire Hall heating system
• The building is currently under-used because of heating problems but the storage space provided by the building is needed.
• Explore increasing the capacity of the heating system • Explore increasing the insulation in the building, considering that the roof
contains asbestos products.

CLIMATE CHANGE IMPACTS ON WATER AND WASTEWATER INFRASTRUCTURE AT MOOSE FACTORY
Appendix A Workshop Presentations July 24, 2018
A.1
Appendix A WORKSHOP PRESENTATIONS

1
FN PIEVC Infrastructure Vulnerability AssessmentOFNTSC-Moose Cree W/WW Vulnerability Study
Infrastructure Exposure WorkshopDr. Guy Félio, P.Eng., FCSCE, IRP[Climate]
Senior Advisor, Stantec
Tuesday September 25, 2017
Funded by:
In Collaboration with:
Safety Moment

2
“Turning Words Into Action”Improving First Nations Infrastructure
Resilience to our Changing Climate David Lapp FEC, P.Eng.
Practice Lead, Globalization and Sustainable Development
and
Jamie Ricci, MS Practice Lead, Research
PIEVC Akwasasne WorkshopFebruary 8, 2017
What is Engineers Canada? STRUCTURE• National organization for the engineering profession in Canada• Members - 12 engineering regulators that regulate the practice of engineering e.g.
Professional Engineers Ontario (PEO)• Over 290,000 professional members in Canada
FUNCTIONS• Common approaches for professional qualifications, professional practice and ethical
conduct• Accredits all undergraduate engineering programs in Canada– 271 programs in 43
universities• National and international voice of the profession• Climate change work since 2001- focus on infrastructure adaptation and resilience

3
Civil Infrastructure and Engineered Buildings
The services provided by these engineering works touch all of us in many ways
ServicesShelterSanitationSafety and securityWaterHeat, Light and Power Mobility for people, goods and servicesHealth and recreation
CategoriesHomes & BuildingsTransportation networksEnergy networksWater, Waste, & Storm water networksIndustrial structuresCommunications networksLandfills and waste depots
Why Define Infrastructure Risks?• Minimize service disruptions• Protect people, property and the
environment• Optimize service
– Manage lifecycle– Manage operations– Avoid surprises– Reduce/avoid costs
• To deal with the uncertainties of future climate
• First step in risk reduction planning to improve (climate) resilience
4
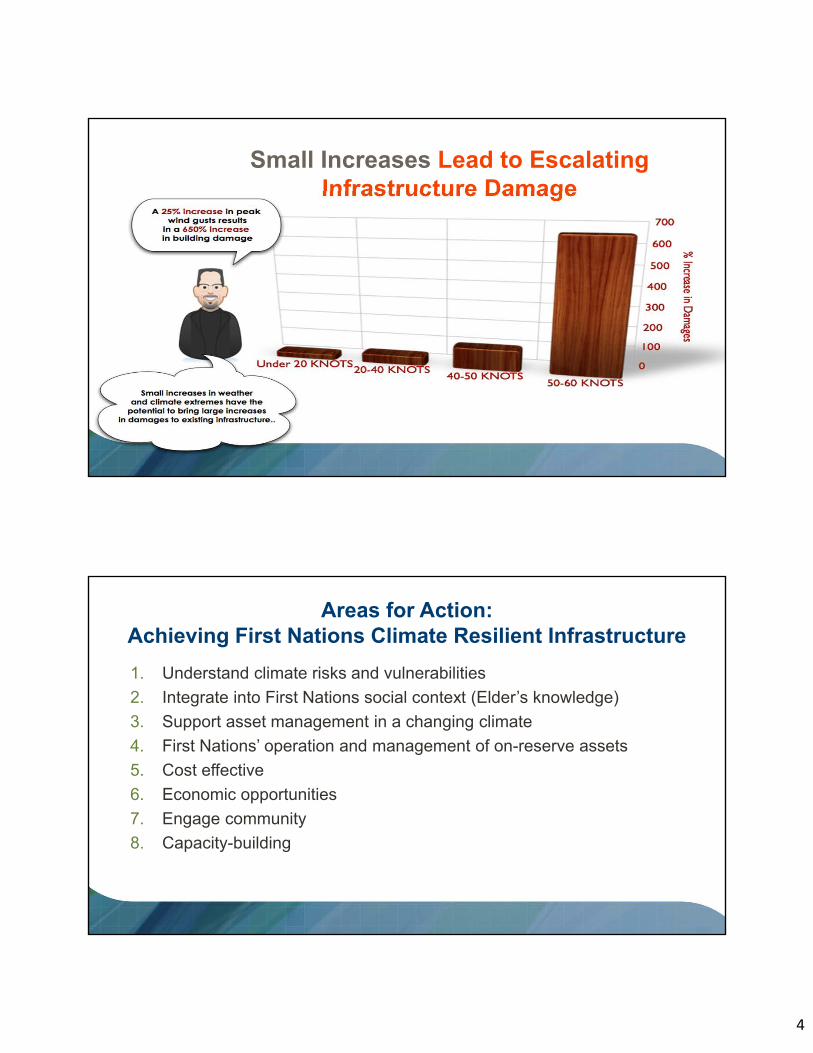
Small Increases Lead to Escalating Infrastructure Damage
Areas for Action: Achieving First Nations Climate Resilient Infrastructure1. Understand climate risks and vulnerabilities2. Integrate into First Nations social context (Elder’s knowledge)3. Support asset management in a changing climate4. First Nations’ operation and management of on-reserve assets5. Cost effective6. Economic opportunities7. Engage community8. Capacity-building
5
Thank you!For more information:
[email protected]@engineerscanada.ca
Tel 613.232.2474
engineerscanada.capievc.ca
Workshop Objectives
• Overview to the PIEVC vulnerability assessment process• Description of water and wastewater infrastructure in Moose Factory and
past weather related performance issues and concerns• Definition of the global project parameters and boundary conditions for the
vulnerability assessment.• Which infrastructure is being assessed;• Its location;• General climatic, geographic considerations; and• Uses of the infrastructure.
• Roles and responsibilities of the team members.• Identify participants for the Special Project Advisory Committee• Next steps

6
Workshop AgendaTime Description 9:00am – 9:30am Welcome and introductions Moose Cree First Nation and
OFNTSC 9:30am – 10:30am Description of the PIEVC Protocol Stantec
10:30am – 10:45am Health break 10:45am – 11:45am Description of Moose Factory W
and WW infrastructure Moose Cree First Nation
11:45am – 12:15pm Discussion: infrastructure concerns related to current climate
All participants
12:15pm – 1:00pm Lunch 1:00pm – 2:30pm Facilitated discussion: selection of
infrastructure for vulnerability assessment
All participants
2:30pm – 3:00pm Roles and responsibilities of the team members.
All participants
3:00pm – 3:30pm Next steps 3:30pm Adjourn
Project Objectives

7
• Phase 1: Vulnerability to climate change assessment of the W/WW infrastructure at Akwesasne (completed)
• Phase 2a: Development of draft FN PIEVC/Asset Management (AM) toolkit (current)
• Phase 2b: Pilot testing draft FN PIEVC/AM Toolkit (Fall 2017):• Moose Cree FN (W/WW infrastructure – Moose Factory)• Oneida Nation of the Thames (Housing)
• Phase 2c: Revise FN PIEVC/AM Toolkit; develop training material; offer training at 2 locations in Southern and Northern Ontario (Early 2018)
• Phase 3 (to be confirmed): deployment of FN PIEVC/AM Toolkit to other First Nations in Canada
FN PIEVC/AM Toolkit
• Adapt the current PIEVC Protocol and develop a FN CC Vulnerability Assessment Toolkit
• Link to asset management• Use local and existing resources (e.g., Elders’
knowledge, ACRS and ICMS data, etc.)

8
FN PIEVC/AM Toolkit Framework
• Work in progress• Common elements to PSAB 3150 Asset Accounting requirements,
Asset Management, and Risk Management:• Asset inventory• Condition• Service life/remaining life• Value of assets
• Considerations over the life-cycle of the asset
TCA Reporting (PS 3150) Inventory Condition Assessment
(Physical Condition)
Residual Life Prediction Valuation (Historical)
TCA Report
Asset Management
Inventory Condition Assessment
(Physical Condition, Capacity, Functionality)
Residual Life Prediction Valuation (Replacement) Analysis:
Needs: Capacity, Physical Condition, O&M
Cost-Benefit
Life-cycle Management Plans Additions and Upgrades Replacement and
Refurbishment Operations and
Maintenance Risk Management
Investment Plan (Capital, O&M)
Monitor, Report, Revise
Risk Management
Inventory Condition Assessment
(Physical Condition, Capacity, Functionality)
Residual Life Prediction Valuation (Replacement) Analysis:
Threats Exposure Vulnerability Risks
Risk Management plan
Monitor, Report, Revise
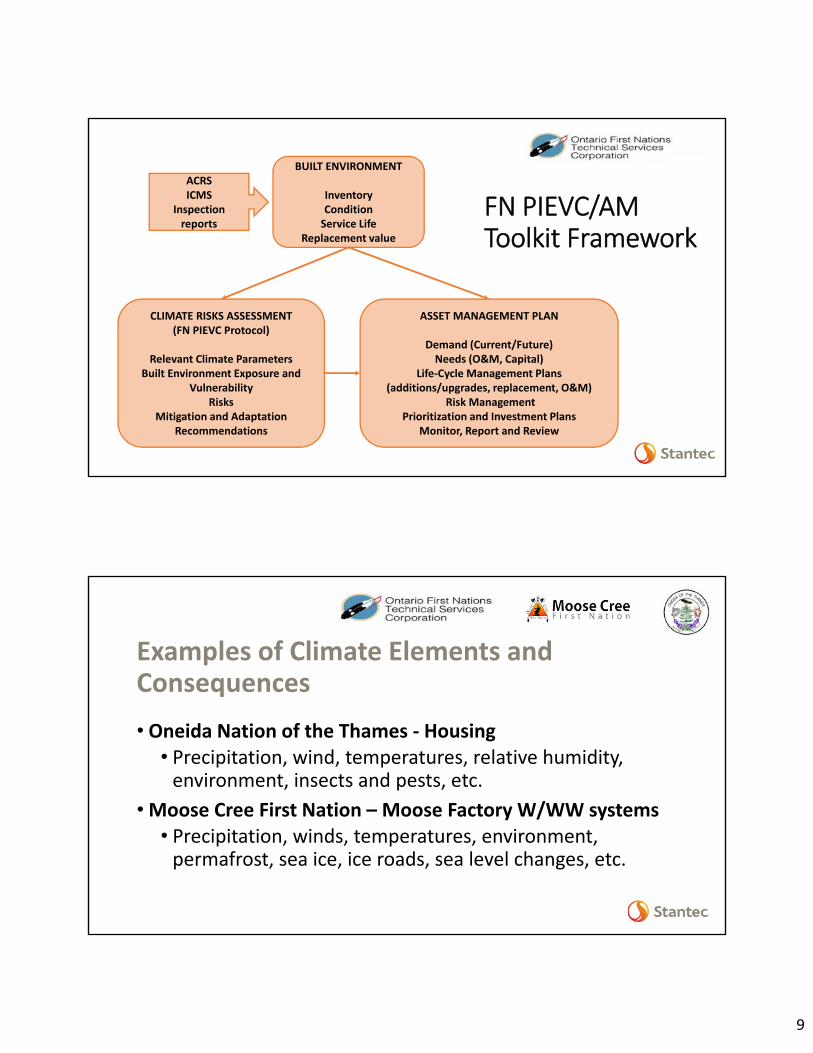
9
FN PIEVC/AM Toolkit Framework
BUILT ENVIRONMENT
InventoryCondition
Service LifeReplacement value
ACRSICMS
Inspection reports
CLIMATE RISKS ASSESSMENT(FN PIEVC Protocol)
Relevant Climate ParametersBuilt Environment Exposure and
VulnerabilityRisks
Mitigation and Adaptation Recommendations
ASSET MANAGEMENT PLAN
Demand (Current/Future)Needs (O&M, Capital)
Life-Cycle Management Plans (additions/upgrades, replacement, O&M)
Risk ManagementPrioritization and Investment Plans
Monitor, Report and Review
Examples of Climate Elements and Consequences• Oneida Nation of the Thames - Housing
• Precipitation, wind, temperatures, relative humidity, environment, insects and pests, etc.
• Moose Cree First Nation – Moose Factory W/WW systems• Precipitation, winds, temperatures, environment,
permafrost, sea ice, ice roads, sea level changes, etc.

10
• Pilots will focus on the Climate Change Risks – but link to asset management
• Next Steps:• Finalize Draft FN PIEVC/AM Toolkit• Schedule Kick-off meetings with Communities + Workshop
• Team introductions• Project schedule• Infrastructure data• Preliminary climate considerations
Infrastructure Resilience
Public Services Resilience
Community Resilience
To Ensure
To Achieve

11
FN PIEVC Climate Change Infrastructure Vulnerability Assessment - Process
Based on Engineers Canada’s PIEVC Protocol
Infrastructure Vulnerability to CC
From planning, design, operations and maintenance …
The Past is the Future
Current Trend
Un-quantifiedRisk
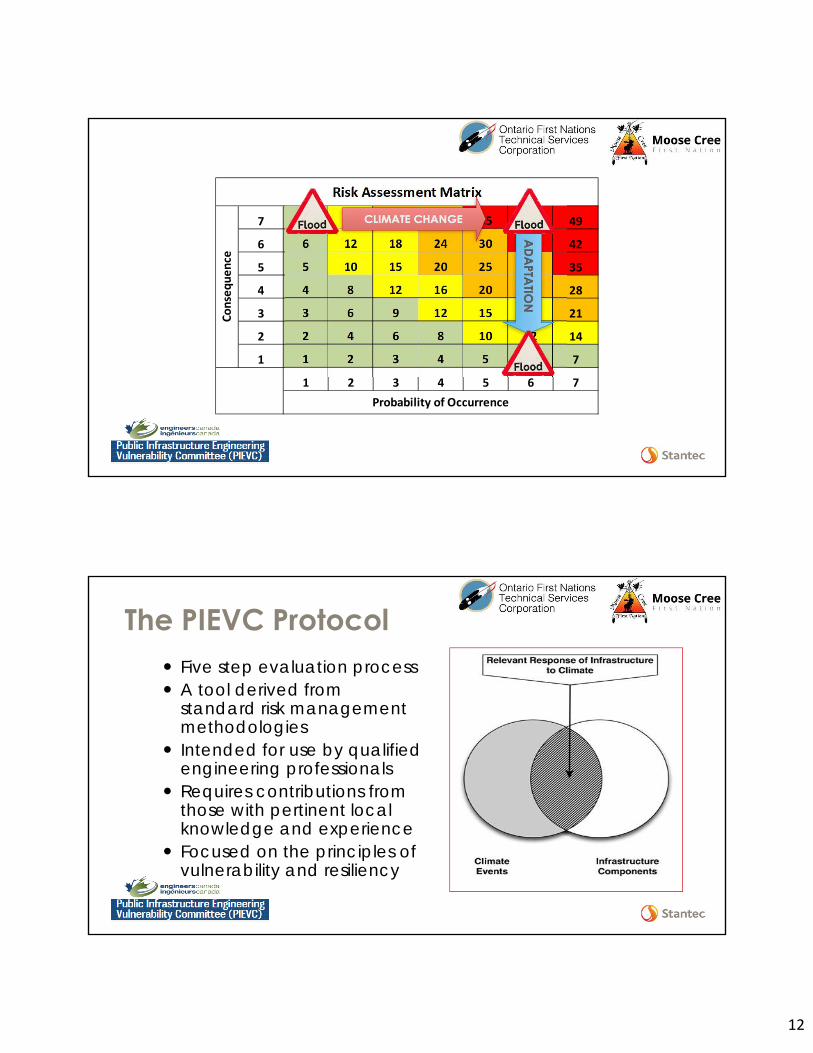
12
7 7 14 21 28 35 42 49
6 6 12 18 24 30 36 42
5 5 10 15 20 25 30 35
4 4 8 12 16 20 24 28
3 3 6 9 12 15 18 21
2 2 4 6 8 10 12 14
1 1 2 3 4 5 6 7
1 2 3 4 5 6 7
Risk Assessment Matrix
Cons
eque
nce
Probability of Occurrence
The PIEVC Protocol Five step evaluation process A tool derived from
standard risk management methodologies
Intended for use by qualified engineering professionals
Requires contributions from those with pertinent local knowledge and experience
Focused on the principles of vulnerability and resiliency

13
Not a theoretical methodologyHas been or currently applied to 45+ projects in Canada:• Water resources systems• Storm & waste water systems• Roads & bridges• Buildings (residential, ICI)• Urban transportation
infrastructure• Energy Infrastructure• Airport infrastructure• Hospital• Three projects in central America
General description of the PIEVC process

14
Climate Event Infrastructure Asset or Component
No
Interaction?
Yes
Next
Infrastructure Response Considerations
“How will the infrastructure be affected?”
• Structural• Functional• Serviceability• Watershed, Surface Water
& Groundwater• Operations, Maintenance
& Materials Performance• Environmental Effects
Risk
Probability of Occurrence ScoreX
Severity of impact on infrastructure if event occurs
Impacts on service and community?
No YesService and/or Community
impacts if infrastructure component or asset fails
• Emergency Response• Insurance and Legal• Policy considerations• Social• Environmental• Financial
Risk Mitigation / Adaptation Recommendations
Next
Using Severity and Probability Ratings in a Risk Matrix
Risk

15
Phase 1 - PIEVC Protocol Vulnerability Assessment of
Akwesasne’s W/WW Infrastructure
Funded by
Akwesasne W/WW Climate Change Vulnerability Assessment Objectives• Identify nature and severity of risks to components in a life-cycle
context – compatible with asset management plans• High level assessment of the predominant vulnerabilities to climate
change and optimize more detailed engineering analysis• Recommendations for adjustments to design, operations and
maintenance to maintain / improve levels of service• Provide a structured, documented approach that ensures consistency
and accountability.
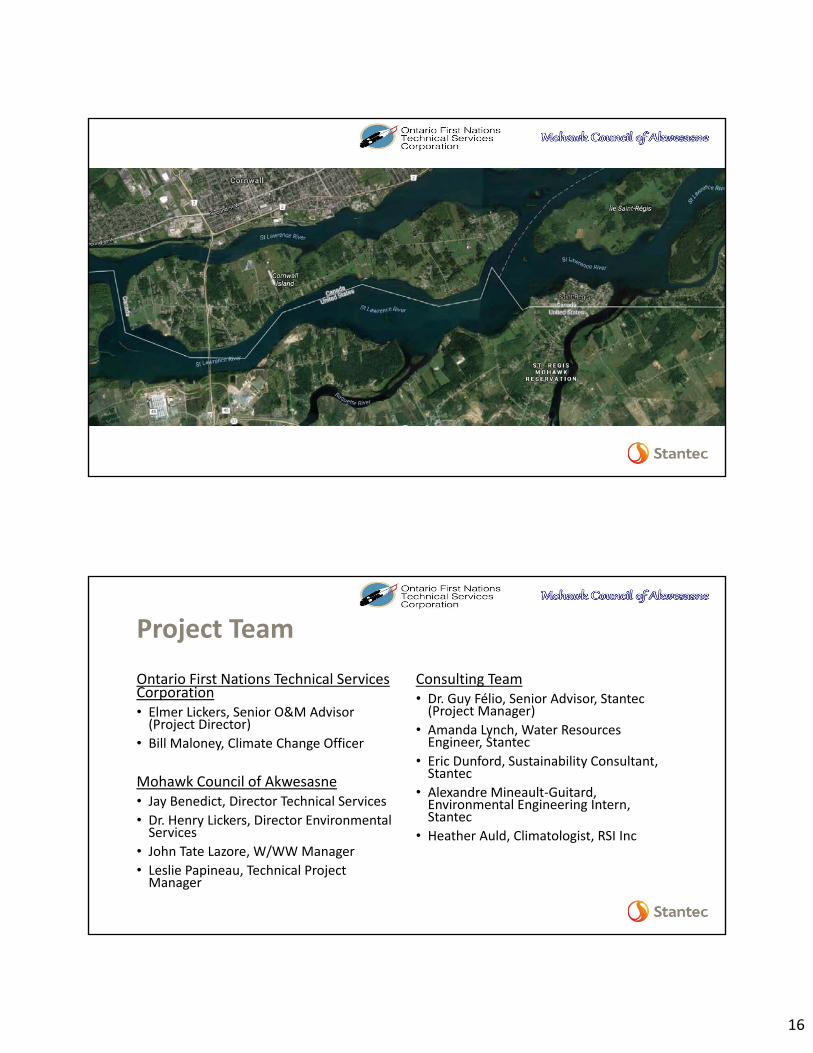
16
Project TeamOntario First Nations Technical Services Corporation• Elmer Lickers, Senior O&M Advisor
(Project Director)• Bill Maloney, Climate Change Officer
Mohawk Council of Akwesasne• Jay Benedict, Director Technical Services• Dr. Henry Lickers, Director Environmental
Services• John Tate Lazore, W/WW Manager• Leslie Papineau, Technical Project
Manager
Consulting Team• Dr. Guy Félio, Senior Advisor, Stantec
(Project Manager)• Amanda Lynch, Water Resources
Engineer, Stantec• Eric Dunford, Sustainability Consultant,
Stantec• Alexandre Mineault-Guitard,
Environmental Engineering Intern, Stantec
• Heather Auld, Climatologist, RSI Inc
17
Project Advisory Committee• Stephanie Allen, OFNTSC• Ashley Dawn Bach, COO• Marla Desat, SCC• Tom Duncan, INAC• Al Douglas, OCCIAR
• Andréanne Ferland, FNQLSDI• Caroline Larrivée, Ouranos• David Lapp, Engineers Canada• Jamie Ricci, Engineers Canada• Jacqueline Richard, OCCIAR
Project Definition - Infrastructure Components• Three Districts
• Cornwall Island• St. Regis• Snye
• All W/WW infrastructure in each district
• Infrastructure Information:• MCA Technical Services• ACRS and ICMS Data

18

19
Climate Elements
• Sources of information:• Environment Canada –
Cornwall Weather Station; Climate ID: 6101872
• US National Oceanic and Atmospheric Administration
• Massena (NY) Weather Station• Storm Events Data Base for St.
Lawrence County (NY)• Ontario Tornado Watch
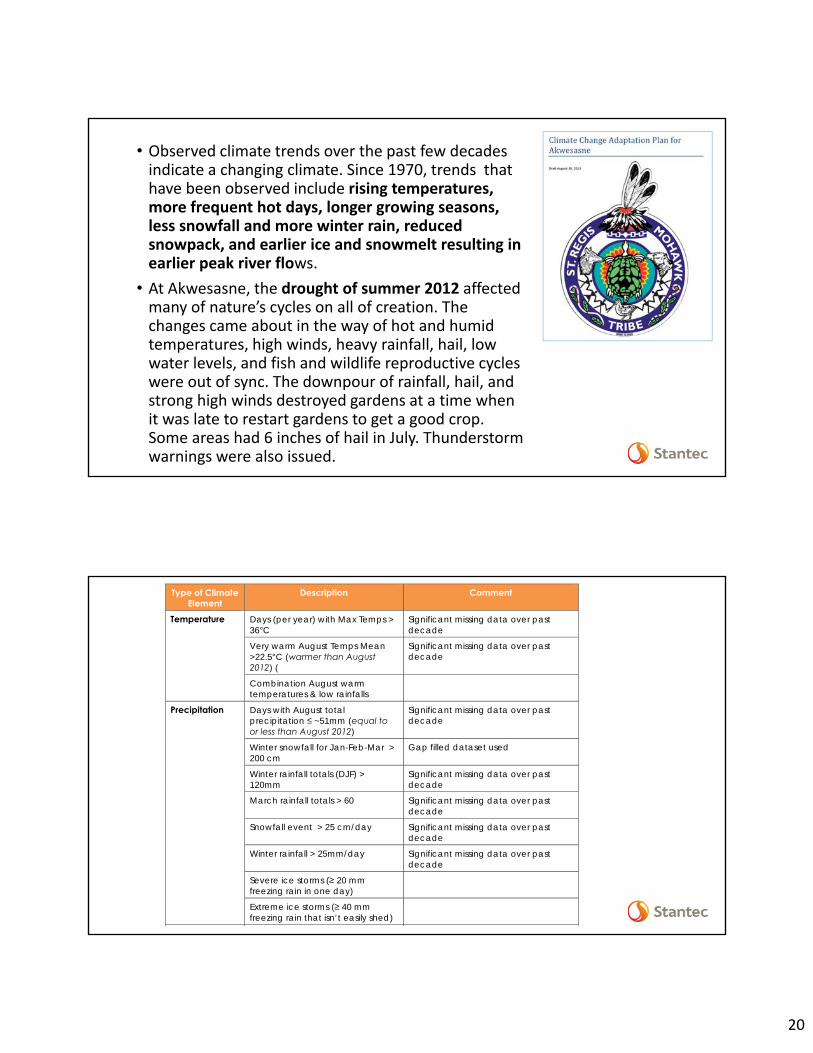
20
• Observed climate trends over the past few decades indicate a changing climate. Since 1970, trends that have been observed include rising temperatures, more frequent hot days, longer growing seasons, less snowfall and more winter rain, reduced snowpack, and earlier ice and snowmelt resulting in earlier peak river flows.
• At Akwesasne, the drought of summer 2012 affected many of nature’s cycles on all of creation. The changes came about in the way of hot and humid temperatures, high winds, heavy rainfall, hail, low water levels, and fish and wildlife reproductive cycles were out of sync. The downpour of rainfall, hail, and strong high winds destroyed gardens at a time when it was late to restart gardens to get a good crop. Some areas had 6 inches of hail in July. Thunderstorm warnings were also issued.
Type of Climate Element
Description Comment
Temperature Days (per year) with Max Temps > 36°C
Significant missing data over past decade
Very warm August Temps Mean >22.5°C (warmer than August 2012) (
Significant missing data over past decade
Combination August warm temperatures & low rainfalls
Precipitation Days with August total precipitation ≤ ~51mm (equal to or less than August 2012)
Significant missing data over past decade
Winter snowfall for Jan-Feb-Mar > 200 cm
Gap filled dataset used
Winter rainfall totals (DJF) > 120mm
Significant missing data over past decade
March rainfall totals > 60 Significant missing data over past decade
Snowfall event > 25 cm/day Significant missing data over past decade
Winter rainfall > 25mm/day Significant missing data over past decade
Severe ice storms (≥ 20 mm freezing rain in one day)
Extreme ice storms (≥ 40 mm freezing rain that isn’t easily shed)

21
Type of Climate Element
Description Comment
Fog Visibilities below ½ statute mile Reference impacts to shipping
Wind Days with gusts > 90 kph i.e., NBC 50 year return period design steady wind
Days with gusts > 125 kph i.e., NBC 50 year return period climatic design gust with wind gust factor applied
Days with gusts > 140 kph Massena A, 50 year return period wind gust
Tornado frequency within 25 km radius
Only have data for Canadian territory. Probability 2x if considering US side
Tornado frequency – within 50 km radius
Only have data for Canadian territory. Probability 2x if considering US side
Risk Score Counts Main Climate Events Principal Infrastructure Affected Current
Climate Future (2050s) Climate
Cornwall Island Moderate 140 77 • Low Precipitation (Aug.)
• Combination - Aug. High Temp. with Low precipitation
• Snowfall event • Severe Ice Storm • Extreme Ice Storm • Extreme Winds
• Environment • Personnel • Suppliers • Electricity • Light buildings • General roadworks • Emergency response • Vehicles and fleet • Communications
High 45 124 • Hail • Tornados • Strong winds • Ice storms • Snowfall events
• Light buildings • Communications • SCADA • Environment • Personnel • Vehicles and fleet • Electricity • Suppliers • General road works
Extreme 28 34 • Lightning • Tornados
• All infrastructure
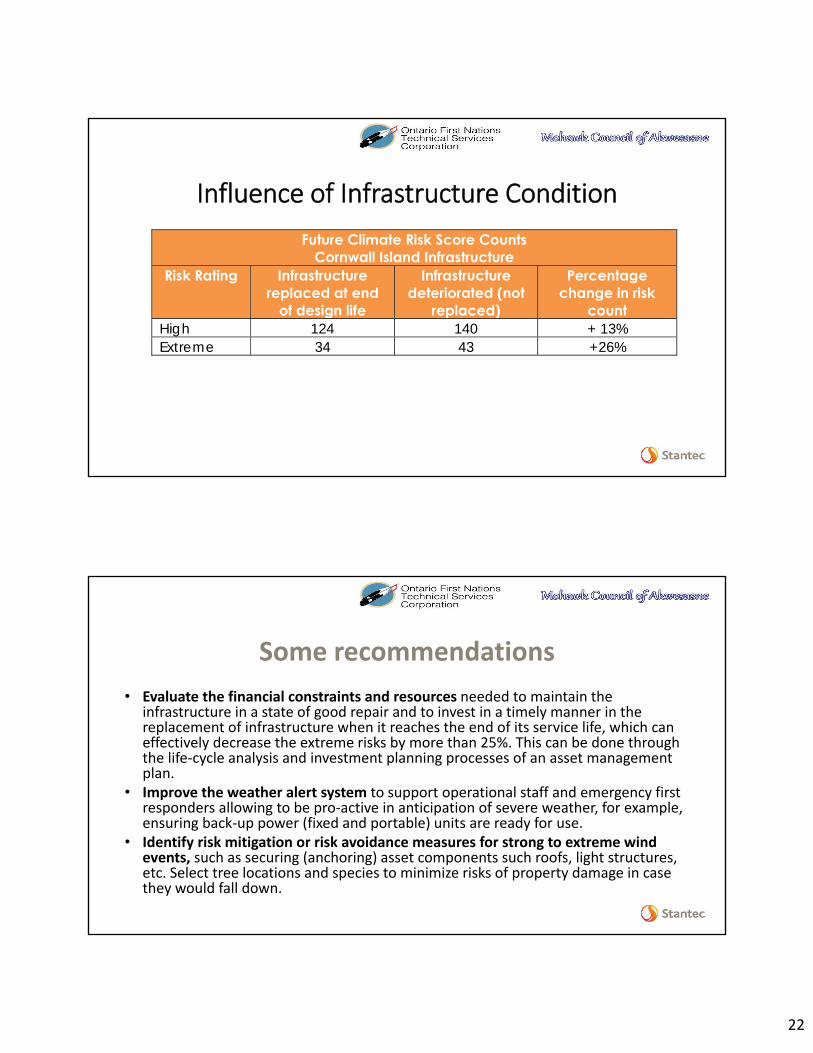
22
Influence of Infrastructure ConditionFuture Climate Risk Score Counts
Cornwall Island Infrastructure Risk Rating Infrastructure
replaced at end of design life
Infrastructure deteriorated (not
replaced)
Percentage change in risk
count High 124 140 + 13% Extreme 34 43 +26%
Some recommendations• Evaluate the financial constraints and resources needed to maintain the
infrastructure in a state of good repair and to invest in a timely manner in the replacement of infrastructure when it reaches the end of its service life, which can effectively decrease the extreme risks by more than 25%. This can be done through the life-cycle analysis and investment planning processes of an asset management plan.
• Improve the weather alert system to support operational staff and emergency first responders allowing to be pro-active in anticipation of severe weather, for example, ensuring back-up power (fixed and portable) units are ready for use.
• Identify risk mitigation or risk avoidance measures for strong to extreme wind events, such as securing (anchoring) asset components such roofs, light structures, etc. Select tree locations and species to minimize risks of property damage in case they would fall down.
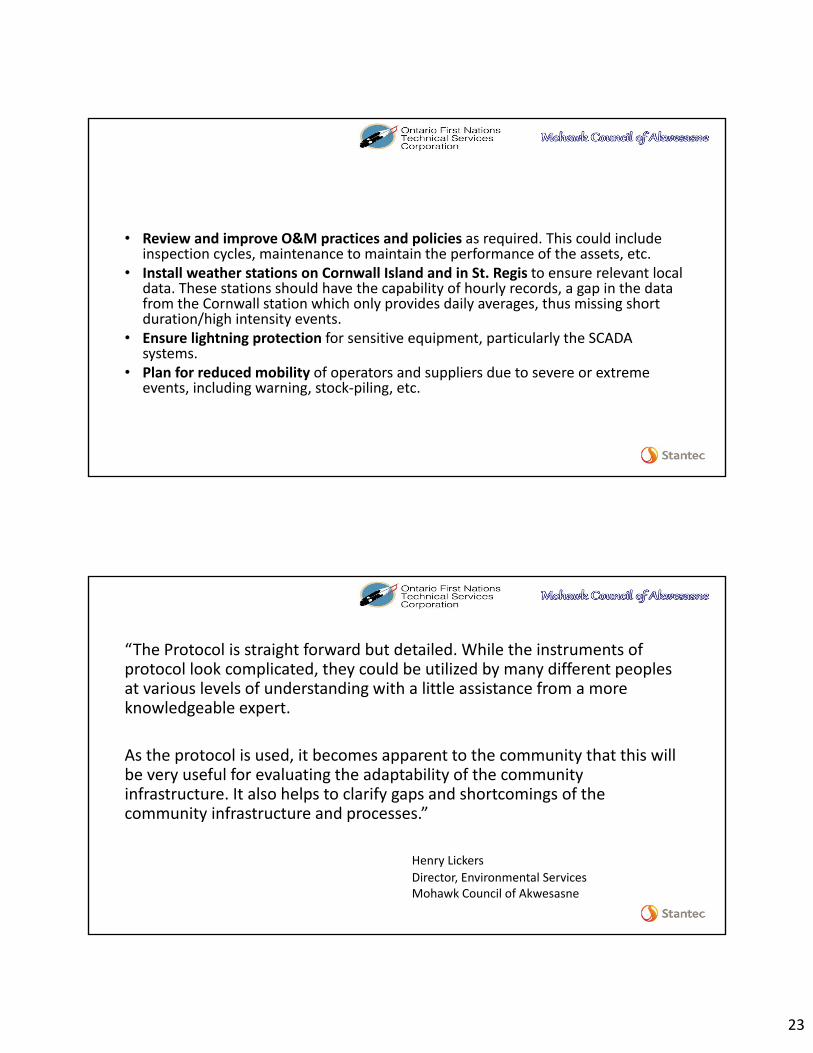
23
• Review and improve O&M practices and policies as required. This could include inspection cycles, maintenance to maintain the performance of the assets, etc.
• Install weather stations on Cornwall Island and in St. Regis to ensure relevant local data. These stations should have the capability of hourly records, a gap in the data from the Cornwall station which only provides daily averages, thus missing short duration/high intensity events.
• Ensure lightning protection for sensitive equipment, particularly the SCADA systems.
• Plan for reduced mobility of operators and suppliers due to severe or extreme events, including warning, stock-piling, etc.
“The Protocol is straight forward but detailed. While the instruments of protocol look complicated, they could be utilized by many different peoples at various levels of understanding with a little assistance from a more knowledgeable expert.
As the protocol is used, it becomes apparent to the community that this will be very useful for evaluating the adaptability of the community infrastructure. It also helps to clarify gaps and shortcomings of the community infrastructure and processes.”
Henry LickersDirector, Environmental ServicesMohawk Council of Akwesasne
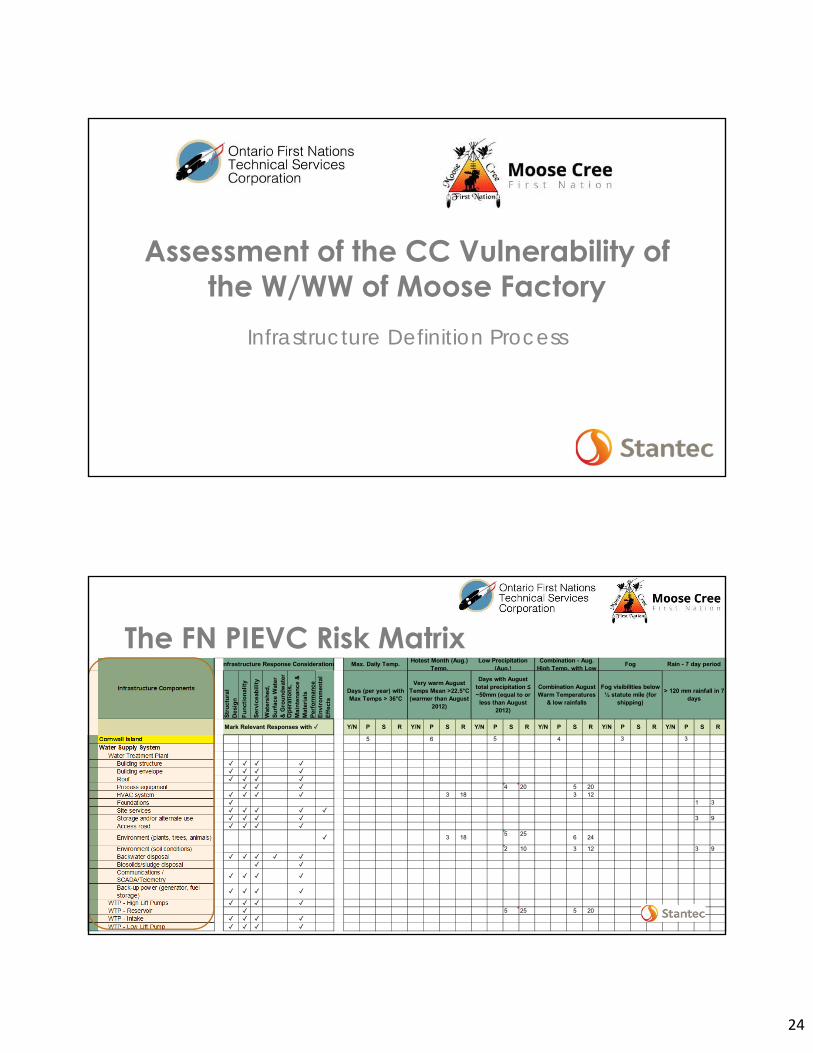
24
Assessment of the CC Vulnerability of the W/WW of Moose Factory
Infrastructure Definition Process
Stru
ctur
al
Desi
gnFu
nctio
nalit
y
Serv
icea
bilit
y
Wat
ersh
ed,
Surf
ace
Wat
er
& G
roun
dwat
erO
pera
tions
, M
aint
enan
ce &
M
ater
ials
Pe
rfor
man
ceEn
viro
nmen
tal
Effe
cts
Y/N P S R Y/N P S R Y/N P S R Y/N P S R Y/N P S R Y/N P S R
Cornwall Island 5 6 5 4 3 3Water Supply System
Water Treatment Plant Building structure ✓ ✓ ✓ ✓Building envelope ✓ ✓ ✓ ✓Roof ✓ ✓ ✓ ✓Process equipment ✓ ✓ ✓ 4 20 5 20HVAC system ✓ ✓ ✓ ✓ 3 18 3 12Foundations ✓ 1 3Site services ✓ ✓ ✓ ✓ ✓Storage and/or alternate use ✓ ✓ ✓ ✓ 3 9Access road ✓ ✓ ✓ ✓Environment (plants, trees, animals) ✓ 3 18 5 25 6 24
Environment (soil conditions) 2 10 3 12 3 9Backwater disposal ✓ ✓ ✓ ✓ ✓Biosolids/sludge disposal ✓ ✓Communications / SCADA/Telemetry ✓ ✓ ✓ ✓Back-up power (generator, fuel storage) ✓ ✓ ✓ ✓
WTP - High Lift Pumps ✓ ✓ ✓ ✓WTP - Reservoir ✓ 5 25 5 20WTP - Intake ✓ ✓ ✓ ✓WTP - Low Lift Pump ✓ ✓ ✓ ✓
Mark Relevant Responses with ✓
nfrastructure Response Considerations Max. Daily Temp. Hotest Month (Aug.) Temp.
Low Precipitation (Aug.)
Combination - Aug. High Temp. with Low Fog Rain - 7 day period
Infrastructure Components Days (per year) with Max Temps > 36°C
Very warm August Temps Mean >22.5°C (warmer than August
2012)
Days with August total precipitation ≤ ~50mm (equal to or
less than August 2012)
Combination August Warm Temperatures
& low rainfalls
Fog visibilities below ½ statute mile (for
shipping)
> 120 mm rainfall in 7 days
The FN PIEVC Risk Matrix

25
Water/Wastewater Infrastructure at Moose Factory
Identify the components of the infrastructure to be assessed in general terms
Infrastructure Definition
• Define the global project parameters and boundary conditions for the engineering vulnerability assessment. :• Which infrastructure is being assessed;• Its location;• Climatic, geographic considerations; • Define performance criteria; and• Uses of the infrastructure.
• First step of narrowing the focus to allow efficient data acquisition and vulnerability assessment.

26
Infrastructure Performance Criteria
Climate Event Infrastructure Asset or Component
No
Interaction?
Yes
Next
Infrastructure Response Considerations
“How will the infrastructure be affected?”
• Structural• Functional• Serviceability• Watershed, Surface Water
& Groundwater• Operations, Maintenance
& Materials Performance• Environmental Effects
Risk
Probability of Occurrence ScoreX
Severity of impact on infrastructure if event occurs
Impacts on service and community?
No YesService and/or Community
impacts if infrastructure component or asset fails
• Emergency Response• Insurance and Legal• Policy considerations• Social• Environmental• Financial
Risk Mitigation / Adaptation Recommendations
Next
To be selected for the infrastructure under
consideration. Add/Remove as needed
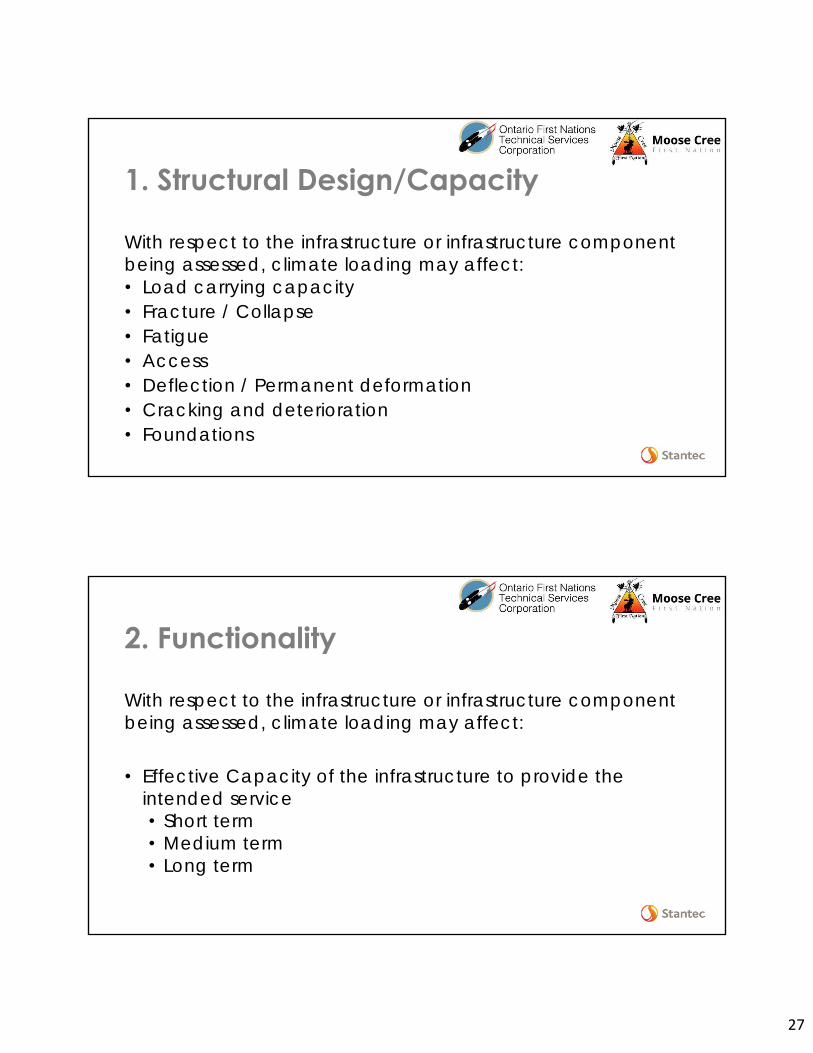
27
1. Structural Design/Capacity
With respect to the infrastructure or infrastructure component being assessed, climate loading may affect:• Load carrying capacity• Fracture / Collapse• Fatigue• Access• Deflection / Permanent deformation• Cracking and deterioration• Foundations
2. Functionality
With respect to the infrastructure or infrastructure component being assessed, climate loading may affect:
• Effective Capacity of the infrastructure to provide the intended service• Short term • Medium term• Long term

28
3. Serviceability
With respect to the infrastructure or infrastructure component being assessed, climate loading may affect:Ability to conduct routine and/or planned maintenance and
refurbishment activities• Short term • Medium term• Long term
• Equipment service life - component replacement frequencies
4. Watershed, Surface Water, and GroundwaterWith respect to the infrastructure or infrastructure component being assessed, climate loading may affect:• Erosion along streams, rivers, and ditches• Erosion scour of associated or supporting earthworks• Slope stability of embankments• Sediment transport and sedimentation• Channel realignment / meandering• Water quality• Water quantity• Run off

29
5. Operations, Maintenance, and Materials PerformanceWith respect to the infrastructure or infrastructure component being assessed, climate loading may affect:• Occupational safety• Access to worksite• Equipment performance• Maintenance and replacement cycles• Electricity demand• Fuel use• Materials Performance • Changes from design expectation
6. Environmental Effects
With respect to the infrastructure or infrastructure component being assessed, climate loading may cause:
• Release of toxic, controlled or deleterious substances• Degradation of water quality• Damage to sensitive ecosystems• Physical harm to birds and animals• Contamination of potable water supplies• Public perception and interaction
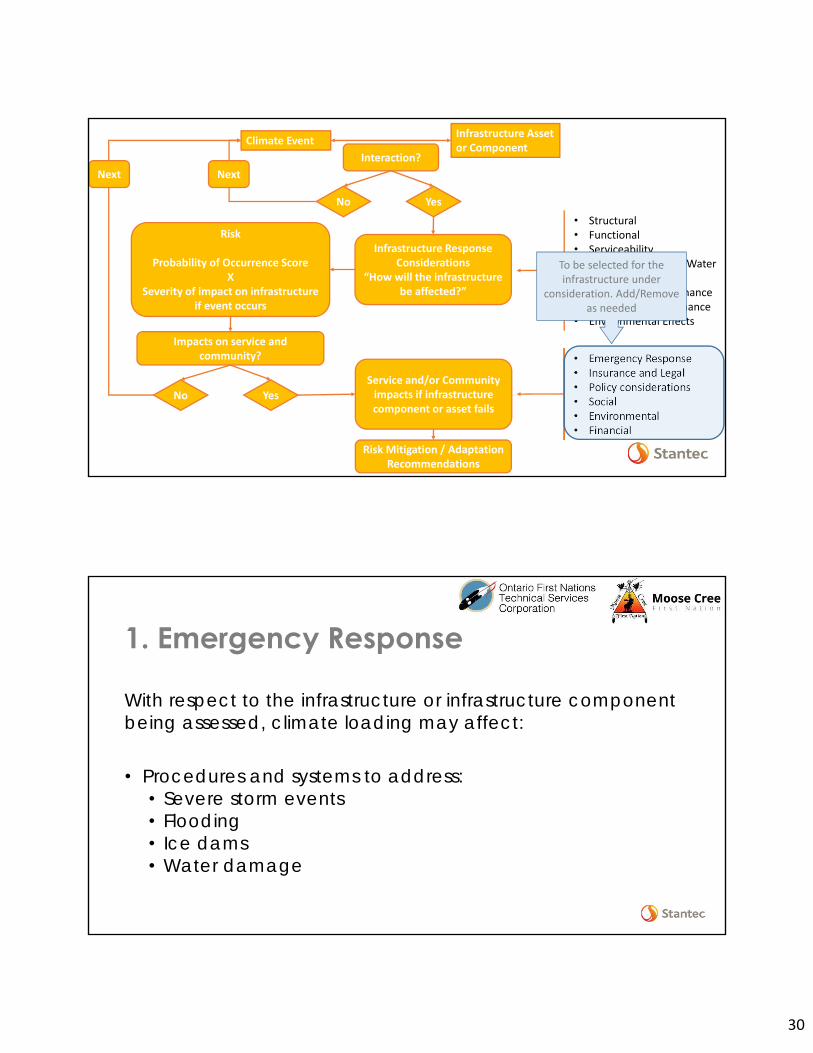
30
Climate Event Infrastructure Asset or Component
No
Interaction?
Yes
Next
Infrastructure Response Considerations
“How will the infrastructure be affected?”
• Structural• Functional• Serviceability• Watershed, Surface Water
& Groundwater• Operations, Maintenance
& Materials Performance• Environmental Effects
Risk
Probability of Occurrence ScoreX
Severity of impact on infrastructure if event occurs
Impacts on service and community?
No YesService and/or Community
impacts if infrastructure component or asset fails
• Emergency Response• Insurance and Legal• Policy considerations• Social• Environmental• Financial
Risk Mitigation / Adaptation Recommendations
Next
To be selected for the infrastructure under
consideration. Add/Remove as needed
1. Emergency Response
With respect to the infrastructure or infrastructure component being assessed, climate loading may affect:
• Procedures and systems to address:• Severe storm events• Flooding• Ice dams• Water damage

31
2. Insurance and Legal ConsiderationsWith respect to the infrastructure or infrastructure component being assessed, climate loading may affect:
• Insurance rates• The ability to acquire insurance• Insurance policy limitations and exclusions• Legal impacts and liability
3. Policy Considerations
With respect to the infrastructure or infrastructure component being assessed, climate loading may affect:
• Codes• Guidelines• Standards• Internal operations and maintenance policies and
procedures• Levels of Service policy• Land use planning

32
4. Social Effects
With respect to the infrastructure or infrastructure component, being assessed climate loading may affect:
• Accessibility to critical facilities such as hospitals, fire and police services
• Energy supply to a community• Dislocation of affected populations • Provision of basic services such as potable water distribution and
wastewater collection• Closure of schools and other public services• Destruction or damage to heritage buildings, monuments, etc. or
historically important resources
5. Environmental Effects
With respect to the infrastructure or infrastructure component being assessed, climate loading may cause:
• Release of toxic, controlled or deleterious substances• Degradation of water quality• Damage to sensitive ecosystems• Physical harm to birds and animals• Contamination of potable water supplies• Public perception and interaction

33
6. Fiscal Considerations
With respect to the infrastructure or infrastructure component being assessed, climate loading may cause:
• Drain on current/future financial resources to deal with unplanned repairs, maintenance and/or replacements
• Shifting financial resources from other community priorities
• Impacts on services and/or levels of service• Community economic impacts and/or hardships
Dr. Guy Felio, P.Eng., FCSCE, IRP[Climate][email protected]

1
FN PIEVC Infrastructure Vulnerability AssessmentOFNTSC-Moose Cree W/WW Vulnerability Study
OverviewDr. Guy Félio, P.Eng., FCSCE, IRP[Climate]
Senior Advisor, Stantec
September 28, 2017
Funded by:
In Collaboration with:
Project Objectives

2
• Phase 1: Vulnerability to climate change assessment of the W/WW infrastructure at Akwesasne (completed)
• Phase 2a: Development of draft FN PIEVC/Asset Management (AM) toolkit (current)
• Phase 2b: Pilot testing draft FN PIEVC/AM Toolkit (Fall 2017):• Moose Cree FN (W/WW infrastructure – Moose Factory)• Oneida Nation of the Thames (Housing)
• Phase 2c: Revise FN PIEVC/AM Toolkit; develop training material; offer training at 2 locations in Southern and Northern Ontario (Early 2018)
• Phase 3 (to be confirmed): deployment of FN PIEVC/AM Toolkit to other First Nations in Canada
FN PIEVC/AM Toolkit
• Adapt the current PIEVC Protocol and develop a FN CC Vulnerability Assessment Toolkit
• Link to asset management• Use local and existing resources (e.g., Elders’
knowledge, ACRS and ICMS data, etc.)

3
FN PIEVC/AM Toolkit Framework
• Work in progress• Common elements to PSAB 3150 Asset Accounting requirements,
Asset Management, and Risk Management:• Asset inventory• Condition• Service life/remaining life• Value of assets
• Considerations over the life-cycle of the asset
TCA Reporting (PS 3150) Inventory Condition Assessment
(Physical Condition)
Residual Life Prediction Valuation (Historical)
TCA Report
Asset Management
Inventory Condition Assessment
(Physical Condition, Capacity, Functionality)
Residual Life Prediction Valuation (Replacement) Analysis:
Needs: Capacity, Physical Condition, O&M
Cost-Benefit
Life-cycle Management Plans Additions and Upgrades Replacement and
Refurbishment Operations and
Maintenance Risk Management
Investment Plan (Capital, O&M)
Monitor, Report, Revise
Risk Management
Inventory Condition Assessment
(Physical Condition, Capacity, Functionality)
Residual Life Prediction Valuation (Replacement) Analysis:
Threats Exposure Vulnerability Risks
Risk Management plan
Monitor, Report, Revise

4
FN PIEVC/AM Toolkit Framework
BUILT ENVIRONMENT
InventoryCondition
Service LifeReplacement value
ACRSICMS
Inspection reports
CLIMATE RISKS ASSESSMENT(FN PIEVC Protocol)
Relevant Climate ParametersBuilt Environment Exposure and
VulnerabilityRisks
Mitigation and Adaptation Recommendations
ASSET MANAGEMENT PLAN
Demand (Current/Future)Needs (O&M, Capital)
Life-Cycle Management Plans (additions/upgrades, replacement, O&M)
Risk ManagementPrioritization and Investment Plans
Monitor, Report and Review
Examples of Climate Elements and Consequences• Oneida Nation of the Thames - Housing
• Precipitation, wind, temperatures, relative humidity, environment, insects and pests, etc.
• Moose Cree First Nation – Moose Factory W/WW systems• Precipitation, winds, temperatures, environment,
permafrost, sea ice, ice roads, sea level changes, etc.

5
• Pilots will focus on the Climate Change Risks – but link to asset management
• Next Steps:• Finalize Draft FN PIEVC/AM Toolkit• Schedule Kick-off meetings with Communities + Workshop
• Team introductions• Project schedule• Infrastructure data• Preliminary climate considerations
Infrastructure Resilience
Public Services Resilience
Community Resilience
To Ensure
To Achieve

6
FN PIEVC Climate Change Infrastructure Vulnerability Assessment - Process
Based on Engineers Canada’s PIEVC Protocol
Infrastructure Vulnerability to CC
From planning, design, operations and maintenance …
The Past is the Future
Current Trend
Un-quantifiedRisk

7
7 7 14 21 28 35 42 49
6 6 12 18 24 30 36 42
5 5 10 15 20 25 30 35
4 4 8 12 16 20 24 28
3 3 6 9 12 15 18 21
2 2 4 6 8 10 12 14
1 1 2 3 4 5 6 7
1 2 3 4 5 6 7
Risk Assessment Matrix
Cons
eque
nce
Probability of Occurrence
The PIEVC Protocol Five step evaluation process A tool derived from
standard risk management methodologies
Intended for use by qualified engineering professionals
Requires contributions from those with pertinent local knowledge and experience
Focused on the principles of vulnerability and resiliency

8
Not a theoretical methodologyHas been or currently applied to 45+ projects in Canada:• Water resources systems• Storm & waste water systems• Roads & bridges• Buildings (residential, ICI)• Urban transportation
infrastructure• Energy Infrastructure• Airport infrastructure• Hospital• Three projects in central America
General description of the PIEVC process
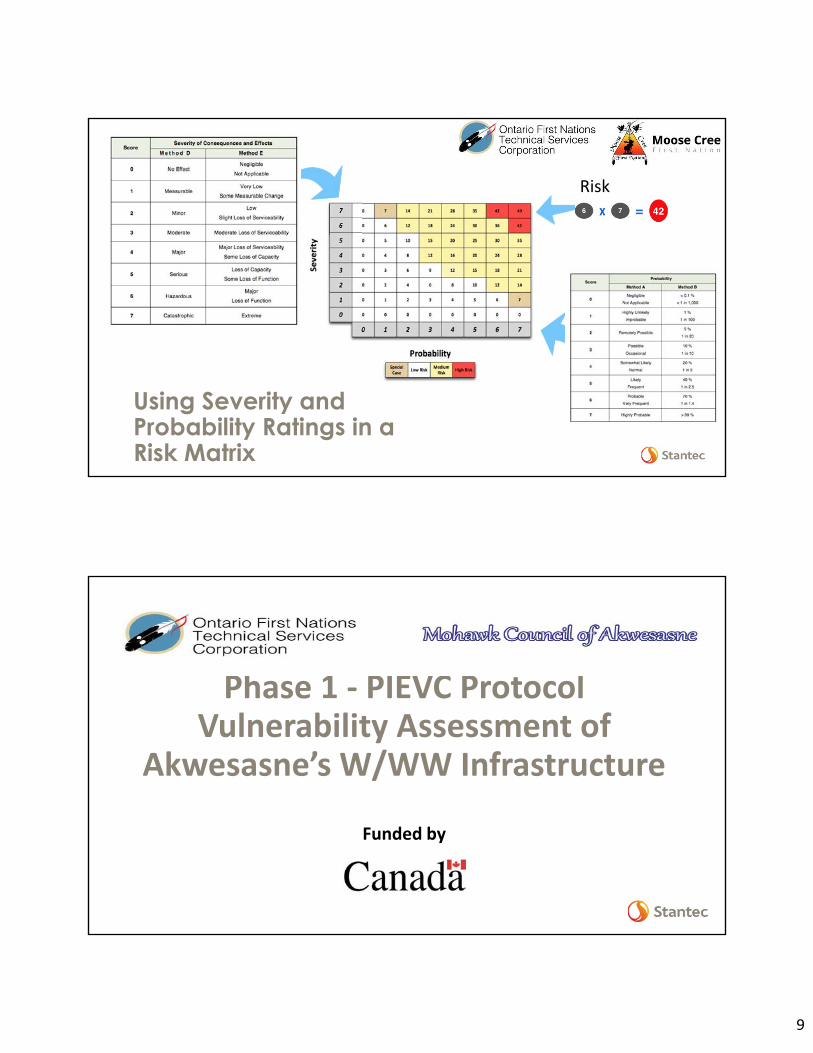
9
Using Severity and Probability Ratings in a Risk Matrix
Risk
Phase 1 - PIEVC Protocol Vulnerability Assessment of
Akwesasne’s W/WW Infrastructure
Funded by

10
Akwesasne W/WW Climate Change Vulnerability Assessment Objectives• Identify nature and severity of risks to components in a life-cycle
context – compatible with asset management plans• High level assessment of the predominant vulnerabilities to climate
change and optimize more detailed engineering analysis• Recommendations for adjustments to design, operations and
maintenance to maintain / improve levels of service• Provide a structured, documented approach that ensures consistency
and accountability.

11
Project TeamOntario First Nations Technical Services Corporation• Elmer Lickers, Senior O&M Advisor
(Project Director)• Bill Maloney, Climate Change Officer
Mohawk Council of Akwesasne• Jay Benedict, Director Technical Services• Dr. Henry Lickers, Director Environmental
Services• John Tate Lazore, W/WW Manager• Leslie Papineau, Technical Project
Manager
Consulting Team• Dr. Guy Félio, Senior Advisor, Stantec
(Project Manager)• Amanda Lynch, Water Resources
Engineer, Stantec• Eric Dunford, Sustainability Consultant,
Stantec• Alexandre Mineault-Guitard,
Environmental Engineering Intern, Stantec
• Heather Auld, Climatologist, RSI Inc
Project Advisory Committee• Stephanie Allen, OFNTSC• Ashley Dawn Bach, COO• Marla Desat, SCC• Tom Duncan, INAC• Al Douglas, OCCIAR
• Andréanne Ferland, FNQLSDI• Caroline Larrivée, Ouranos• David Lapp, Engineers Canada• Jamie Ricci, Engineers Canada• Jacqueline Richard, OCCIAR

12
Project Definition - Infrastructure Components• Three Districts
• Cornwall Island• St. Regis• Snye
• All W/WW infrastructure in each district
• Infrastructure Information:• MCA Technical Services• ACRS and ICMS Data
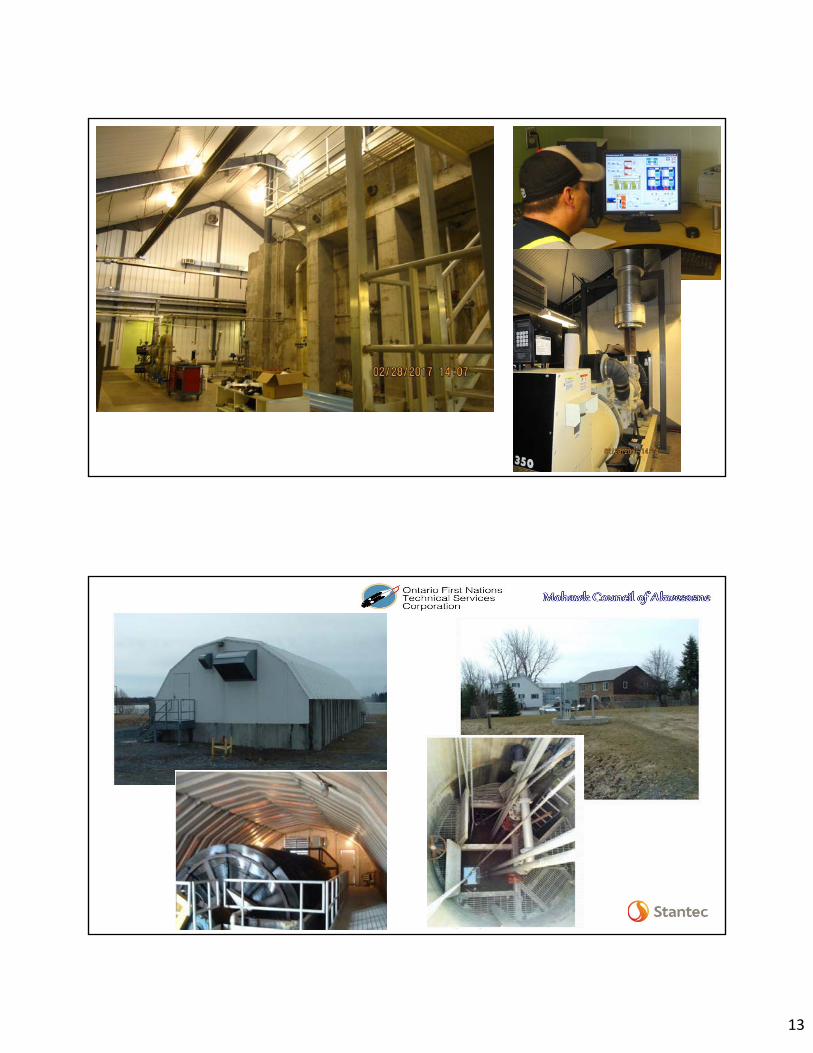
13

14
Climate Elements
• Sources of information:• Environment Canada –
Cornwall Weather Station; Climate ID: 6101872
• US National Oceanic and Atmospheric Administration
• Massena (NY) Weather Station• Storm Events Data Base for St.
Lawrence County (NY)• Ontario Tornado Watch
• Observed climate trends over the past few decades indicate a changing climate. Since 1970, trends that have been observed include rising temperatures, more frequent hot days, longer growing seasons, less snowfall and more winter rain, reduced snowpack, and earlier ice and snowmelt resulting in earlier peak river flows.
• At Akwesasne, the drought of summer 2012 affected many of nature’s cycles on all of creation. The changes came about in the way of hot and humid temperatures, high winds, heavy rainfall, hail, low water levels, and fish and wildlife reproductive cycles were out of sync. The downpour of rainfall, hail, and strong high winds destroyed gardens at a time when it was late to restart gardens to get a good crop. Some areas had 6 inches of hail in July. Thunderstorm warnings were also issued.

15
Type of Climate Element
Description Comment
Temperature Days (per year) with Max Temps > 36°C
Significant missing data over past decade
Very warm August Temps Mean >22.5°C (warmer than August 2012) (
Significant missing data over past decade
Combination August warm temperatures & low rainfalls
Precipitation Days with August total precipitation ≤ ~51mm (equal to or less than August 2012)
Significant missing data over past decade
Winter snowfall for Jan-Feb-Mar > 200 cm
Gap filled dataset used
Winter rainfall totals (DJF) > 120mm
Significant missing data over past decade
March rainfall totals > 60 Significant missing data over past decade
Snowfall event > 25 cm/day Significant missing data over past decade
Winter rainfall > 25mm/day Significant missing data over past decade
Severe ice storms (≥ 20 mm freezing rain in one day)
Extreme ice storms (≥ 40 mm freezing rain that isn’t easily shed)
Type of Climate Element
Description Comment
Fog Visibilities below ½ statute mile Reference impacts to shipping
Wind Days with gusts > 90 kph i.e., NBC 50 year return period design steady wind
Days with gusts > 125 kph i.e., NBC 50 year return period climatic design gust with wind gust factor applied
Days with gusts > 140 kph Massena A, 50 year return period wind gust
Tornado frequency within 25 km radius
Only have data for Canadian territory. Probability 2x if considering US side
Tornado frequency – within 50 km radius
Only have data for Canadian territory. Probability 2x if considering US side
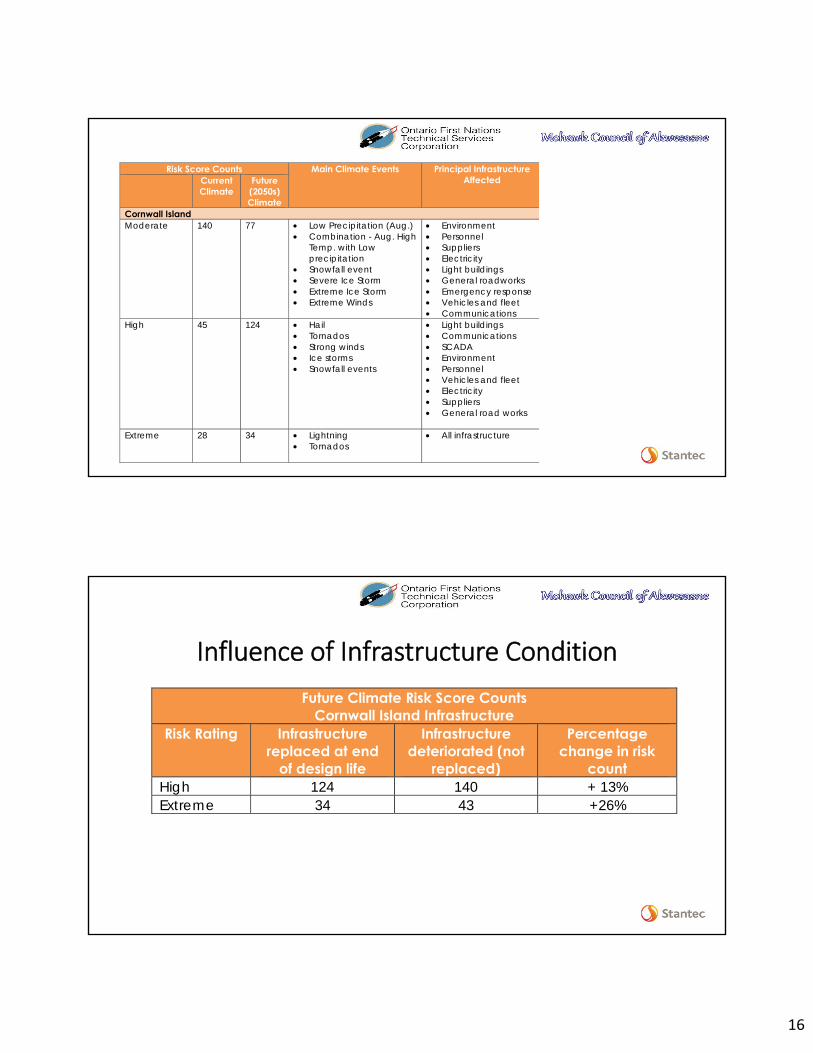
16
Risk Score Counts Main Climate Events Principal Infrastructure Affected Current
Climate Future (2050s) Climate
Cornwall Island Moderate 140 77 • Low Precipitation (Aug.)
• Combination - Aug. High Temp. with Low precipitation
• Snowfall event • Severe Ice Storm • Extreme Ice Storm • Extreme Winds
• Environment • Personnel • Suppliers • Electricity • Light buildings • General roadworks • Emergency response • Vehicles and fleet • Communications
High 45 124 • Hail • Tornados • Strong winds • Ice storms • Snowfall events
• Light buildings • Communications • SCADA • Environment • Personnel • Vehicles and fleet • Electricity • Suppliers • General road works
Extreme 28 34 • Lightning • Tornados
• All infrastructure
Influence of Infrastructure ConditionFuture Climate Risk Score Counts
Cornwall Island Infrastructure Risk Rating Infrastructure
replaced at end of design life
Infrastructure deteriorated (not
replaced)
Percentage change in risk
count High 124 140 + 13% Extreme 34 43 +26%

17
Some recommendations• Evaluate the financial constraints and resources needed to maintain the
infrastructure in a state of good repair and to invest in a timely manner in the replacement of infrastructure when it reaches the end of its service life, which can effectively decrease the extreme risks by more than 25%. This can be done through the life-cycle analysis and investment planning processes of an asset management plan.
• Improve the weather alert system to support operational staff and emergency first responders allowing to be pro-active in anticipation of severe weather, for example, ensuring back-up power (fixed and portable) units are ready for use.
• Identify risk mitigation or risk avoidance measures for strong to extreme wind events, such as securing (anchoring) asset components such roofs, light structures, etc. Select tree locations and species to minimize risks of property damage in case they would fall down.
• Review and improve O&M practices and policies as required. This could include inspection cycles, maintenance to maintain the performance of the assets, etc.
• Install weather stations on Cornwall Island and in St. Regis to ensure relevant local data. These stations should have the capability of hourly records, a gap in the data from the Cornwall station which only provides daily averages, thus missing short duration/high intensity events.
• Ensure lightning protection for sensitive equipment, particularly the SCADA systems.
• Plan for reduced mobility of operators and suppliers due to severe or extreme events, including warning, stock-piling, etc.

18
“The Protocol is straight forward but detailed. While the instruments of protocol look complicated, they could be utilized by many different peoples at various levels of understanding with a little assistance from a more knowledgeable expert.
As the protocol is used, it becomes apparent to the community that this will be very useful for evaluating the adaptability of the community infrastructure. It also helps to clarify gaps and shortcomings of the community infrastructure and processes.”
Henry LickersDirector, Environmental ServicesMohawk Council of Akwesasne
Dr. Guy Felio, P.Eng., FCSCE, IRP[Climate][email protected]

1
FN PIEVC Infrastructure Vulnerability AssessmentOFNTSC-Moose Cree W/WW Vulnerability Study
Infrastructure Exposure and Climate Considerations Workshop #2
Dr. Guy Félio, P.Eng., FCSCE, IRP[Climate]Senior Advisor, Stantec
Thursday September 28, 2017
Funded by:
In Collaboration with:
Agenda
• Project Overview• FN PIEVC infrastructure vulnerability to climate change process• Infrastructure to be considered in study• Infrastructure performance considerations• Relevant climate events• Next steps
• Project Advisory Committee• Workshops 3 (Risk Assessment) and 4 (Adaptation Measures)
• Wrap-up and close
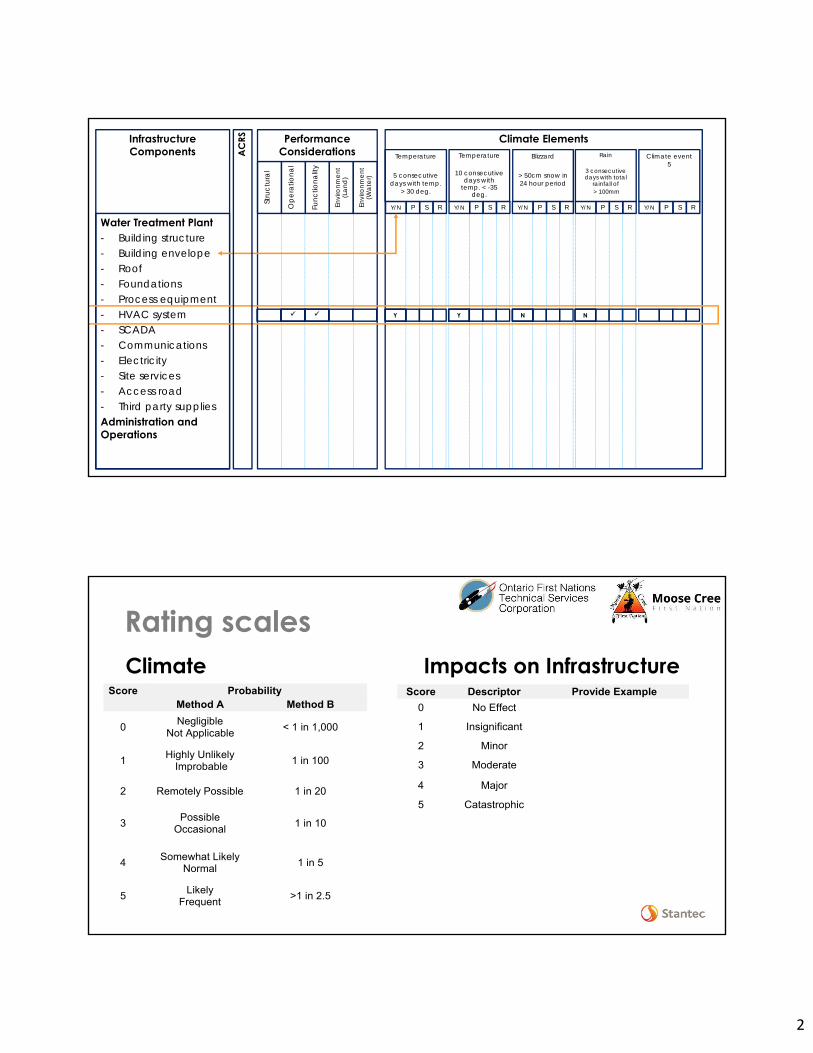
2
Infrastructure Components
Performance Considerations
Climate Elements
Water Treatment Plant- Building structure- Building envelope- Roof- Foundations- Process equipment- HVAC system- SCADA- Communications- Electricity- Site services- Access road- Third party suppliesAdministration and Operations
Stru
ctur
al
Ope
ratio
nal
Func
tiona
lity
Envi
ronm
ent
(La
nd)
Envi
ronm
ent
(Wa
ter)
Temperature
5 consecutive days with temp.
> 30 deg.
Temperature
10 consecutive days with
temp. < -35 deg.
Blizzard
> 50cm snow in 24 hour period
Rain
3 consecutive days with total
rainfall of> 100mm
Climate event 5
Y/N P S R Y/N P S R Y/N P S R Y/N P S R Y/N P S R
Y Y
AC
RS
N N
Rating scalesClimate
Score Probability Method A Method B
0 Negligible Not Applicable < 1 in 1,000
1 Highly Unlikely Improbable 1 in 100
2 Remotely Possible 1 in 20
3 Possible Occasional 1 in 10
4 Somewhat Likely Normal 1 in 5
5 Likely Frequent >1 in 2.5
Score Descriptor Provide Example 0 No Effect
1 Insignificant
2 Minor
3 Moderate
4 Major
5 Catastrophic
Impacts on Infrastructure

3
Performance Considerations
(Current) Climate Elements
Stru
ctur
al
Ope
ratio
nal
Func
tiona
lity
Envi
ronm
ent
(La
nd)
Envi
ronm
ent
(Wa
ter)
Temperature
5 consecutive days with temp.
> 30 deg.
Temperature
10 consecutive days with
temp. < -30 deg.
Blizzard
> 50cm snow in 24 hour period
Rain
3 consecutive days with total
rainfall of> 100mm
Climate event 5
Y/N P S R Y/N P S R Y/N P S R Y/N P S R Y/N P S R
N NY Y 1 33 23 6
Infrastructure Components
Water Treatment Plant- Building structure- Building envelope- Roof- Foundations- Process equipment- HVAC system- SCADA- Communications- Electricity- Site services- Access road- Third party suppliesAdministration and Operations
AC
RS
Catastrophic 5
4
3
2
1
No effect 0Negligible 0 1 2 3 4 5
Impa
ct/c
onse
quen
ce o
n in
frast
ruct
ure
if cl
imat
e ev
ent o
ccur
s
Likelyhood/probability of climate event occuring
3
6
Current Climate

4
Infrastructure Components
Performance Considerations
(Future) Climate Elements
Water Treatment Plant- Building structure- Building envelope- Roof- Foundations- Process equipment- HVAC system- SCADA- Communications- Electricity- Site services- Access road- Third party suppliesAdministration and Operations
Stru
ctur
al
Ope
ratio
nal
Func
tiona
lity
Envi
ronm
ent
(La
nd)
Envi
ronm
ent
(Wa
ter)
Temperature
5 consecutive days with temp.
> 30 deg.
Temperature
10 consecutive days with
temp. < -30 deg.
Blizzard
> 50cm snow in 24 hour period
Rain
3 consecutive days with total
rainfall of> 100mm
Climate event 5
Y/N P S R Y/N P S R Y/N P S R Y/N P S R Y/N P S R
N NY Y 3 13 29 2
Infrastructure Components
Water Treatment Plant- Building structure- Building envelope- Roof- Foundations- Process equipment- HVAC system- SCADA- Communications- Electricity- Site services- Access road- Third party supplies
AC
RS
Catastrophic 5
4
3
2
1
No effect 0Negligible 0 1 2 3 4 5
Impa
ct/c
onse
quen
ce o
n in
frast
ruct
ure
if cl
imat
e ev
ent o
ccur
s
Likelyhood/probability of climate event occuring
3
6
12
2
Future Climate
9
Impact of climate
changes
Impact of not maintaining
infrastructure in a state of good repair
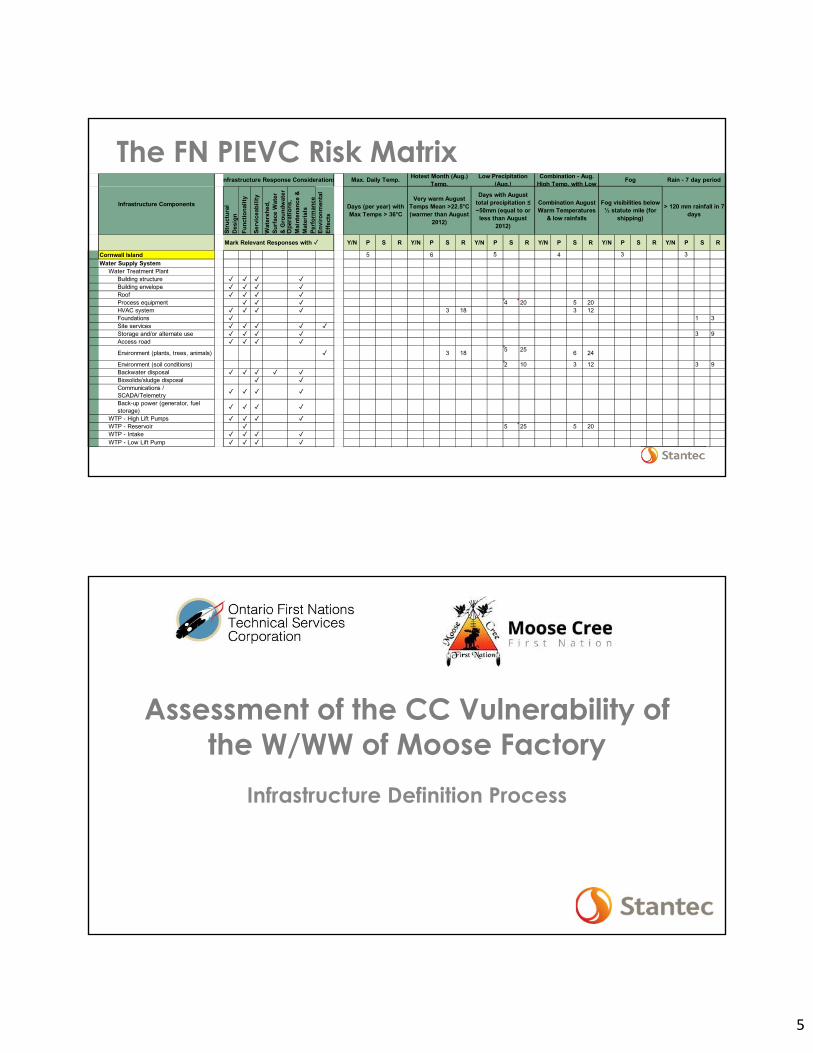
5
Stru
ctur
al
Desi
gnFu
nctio
nalit
y
Serv
icea
bilit
y
Wat
ersh
ed,
Surf
ace
Wat
er
& G
roun
dwat
erO
pera
tions
, M
aint
enan
ce &
M
ater
ials
Pe
rfor
man
ceEn
viro
nmen
tal
Effe
cts
Y/N P S R Y/N P S R Y/N P S R Y/N P S R Y/N P S R Y/N P S R
Cornwall Island 5 6 5 4 3 3Water Supply System
Water Treatment Plant Building structure ✓ ✓ ✓ ✓Building envelope ✓ ✓ ✓ ✓Roof ✓ ✓ ✓ ✓Process equipment ✓ ✓ ✓ 4 20 5 20HVAC system ✓ ✓ ✓ ✓ 3 18 3 12Foundations ✓ 1 3Site services ✓ ✓ ✓ ✓ ✓Storage and/or alternate use ✓ ✓ ✓ ✓ 3 9Access road ✓ ✓ ✓ ✓Environment (plants, trees, animals) ✓ 3 18 5 25 6 24
Environment (soil conditions) 2 10 3 12 3 9Backwater disposal ✓ ✓ ✓ ✓ ✓Biosolids/sludge disposal ✓ ✓Communications / SCADA/Telemetry ✓ ✓ ✓ ✓Back-up power (generator, fuel storage) ✓ ✓ ✓ ✓
WTP - High Lift Pumps ✓ ✓ ✓ ✓WTP - Reservoir ✓ 5 25 5 20WTP - Intake ✓ ✓ ✓ ✓WTP - Low Lift Pump ✓ ✓ ✓ ✓
Mark Relevant Responses with ✓
nfrastructure Response Considerations Max. Daily Temp. Hotest Month (Aug.) Temp.
Low Precipitation (Aug.)
Combination - Aug. High Temp. with Low Fog Rain - 7 day period
Infrastructure Components Days (per year) with Max Temps > 36°C
Very warm August Temps Mean >22.5°C (warmer than August
2012)
Days with August total precipitation ≤ ~50mm (equal to or
less than August 2012)
Combination August Warm Temperatures
& low rainfalls
Fog visibilities below ½ statute mile (for
shipping)
> 120 mm rainfall in 7 days
The FN PIEVC Risk Matrix
Assessment of the CC Vulnerability of the W/WW of Moose Factory
Infrastructure Definition Process

6
Water/Wastewater Infrastructure at Moose Factory
Identify the components of the infrastructure to be assessed in general terms
Infrastructure Definition
• Define the global project parameters and boundary conditions for the engineering vulnerability assessment. :• Which infrastructure is being assessed;• Its location;• Climatic, geographic considerations; • Define performance criteria; and• Uses of the infrastructure.
• First step of narrowing the focus to allow efficient data acquisition and vulnerability assessment.

7
Confirm the Infrastructure ListMain components• Potable Water
• Intake and transmission to plant• WTP• Distribution and appurtenances
• Wastewater• Collection• Treatment• Receiving environment
• Administration and operations
Potable Water System• Intake• Underground reservoir• Above ground reservoir• Low level lift station
• Building• Equipment
• Watermains
• Hydrants• Others?

8
Water Treatment Plant• Building Structure• Building Envelope• Roof• Foundations• Process equipment• HVAC• Electrical systems
• Scada/communications• Storage• Site services• Access road• Backup generator
Wastewater Collection and Treatment System• Sanitary Mains• Sewage lift stations
• Building• Equipment
• Lagoons• Cells• Blower building and
equipment
• Storage building (old fire hall)?
• Others?
9
Administration and Operations• Vehicles and fleet• Personnel• Records• Supplier• Emergency
procedures/personnel• Electricity
• Island access• General road network• Others?• Garage ? Public works
yard?• Others?
Establish the Infrastructure Performance Criteria
“If a climate event impacts the infrastructure, how will the condition and
performance be affected?”

10
Infrastructure Components
Performance Considerations
Climate Elements
Water Treatment Plant- Building structure- Building envelope- Roof- Foundations- Process equipment- HVAC system- SCADA- Communications- Electricity- Site services- Access road- Third party suppliesAdministration and Operations
Stru
ctur
al
Ope
ratio
nal
Func
tiona
lity
Envi
ronm
ent
(La
nd)
Envi
ronm
ent
(Wa
ter)
Temperature
5 consecutive days with temp.
> 30 deg.
Temperature
10 consecutive days with
temp. < -35 deg.
Blizzard
> 50cm snow in 24 hour period
Rain
3 consecutive days with total
rainfall of> 100mm
Climate event 5
Y/N P S R Y/N P S R Y/N P S R Y/N P S R Y/N P S R
Y Y
AC
RS
N N
1. Structural Design/Capacity
With respect to the infrastructure or infrastructure component being assessed, climate loading may affect:• Load carrying capacity• Fracture / Collapse• Fatigue• Access• Deflection / Permanent deformation• Cracking and deterioration• Foundations
11
2. Functionality
With respect to the infrastructure or infrastructure component being assessed, climate loading may affect:
• Effective Capacity of the infrastructure to provide the intended service• Short term • Medium term• Long term
3. Serviceability
With respect to the infrastructure or infrastructure component being assessed, climate loading may affect:Ability to conduct routine and/or planned maintenance and
refurbishment activities• Short term • Medium term• Long term
• Equipment service life - component replacement frequencies

12
4. Watershed, Surface Water, and GroundwaterWith respect to the infrastructure or infrastructure component being assessed, climate loading may affect:• Erosion along streams, rivers, and ditches• Erosion scour of associated or supporting earthworks• Slope stability of embankments• Sediment transport and sedimentation• Channel realignment / meandering• Water quality• Water quantity• Run off
5. Operations, Maintenance, and Materials PerformanceWith respect to the infrastructure or infrastructure component being assessed, climate loading may affect:• Occupational safety• Access to worksite• Equipment performance• Maintenance and replacement cycles• Electricity demand• Fuel use• Materials Performance • Changes from design expectation

13
6. Environmental Effects
With respect to the infrastructure or infrastructure component being assessed, climate loading may cause:
• Release of toxic, controlled or deleterious substances• Degradation of water quality• Damage to sensitive ecosystems• Physical harm to birds and animals• Contamination of potable water supplies• Public perception and interaction
Impacts on the service or the community if the infrastructure fails
14
1. Emergency Response
With respect to the infrastructure or infrastructure component being assessed, a loss of performance or failure due to climate loading may affect:
• Procedures and systems to address:• Severe storm events• Flooding• Ice dams• Water damage
2. Insurance and Legal ConsiderationsWith respect to the infrastructure or infrastructure component being assessed, a loss of performance or failure due to climate loading may affect:
• Insurance rates• The ability to acquire insurance• Insurance policy limitations and exclusions• Legal impacts and liability

15
3. Policy Considerations
With respect to the infrastructure or infrastructure component being assessed, a loss of performance or failure due to climate loading may affect:
• Codes• Guidelines• Standards• Internal operations and maintenance policies and
procedures• Levels of Service policy• Land use planning
4. Social Effects
With respect to the infrastructure or infrastructure component being assessed, a loss of performance or failure due to climate loading may affect:
• Accessibility to critical facilities such as hospitals, fire and police services
• Energy supply to a community• Dislocation of affected populations • Provision of basic services such as potable water distribution and
wastewater collection• Closure of schools and other public services• Destruction or damage to heritage buildings, monuments, etc. or
historically important resources

16
5. Environmental Effects
With respect to the infrastructure or infrastructure component being assessed, a loss of performance or failure due to climate loading may cause:• Release of toxic, controlled or deleterious substances• Degradation of water quality• Damage to sensitive ecosystems• Physical harm to birds and animals• Contamination of potable water supplies• Public perception and interaction
6. Fiscal Impacts
With respect to the infrastructure or infrastructure component being assessed, a loss of performance or failure due to climate loading may cause:
• Drain on current/future financial resources to deal with unplanned repairs, maintenance and/or replacements
• Shifting financial resources from other community priorities• Impacts on services and/or levels of service• Community economic impacts and/or hardships

17
Climate Elements to Consider
General information on projectionsDiscussion on past events that have caused
infrastructure disruptions and/or damage

18
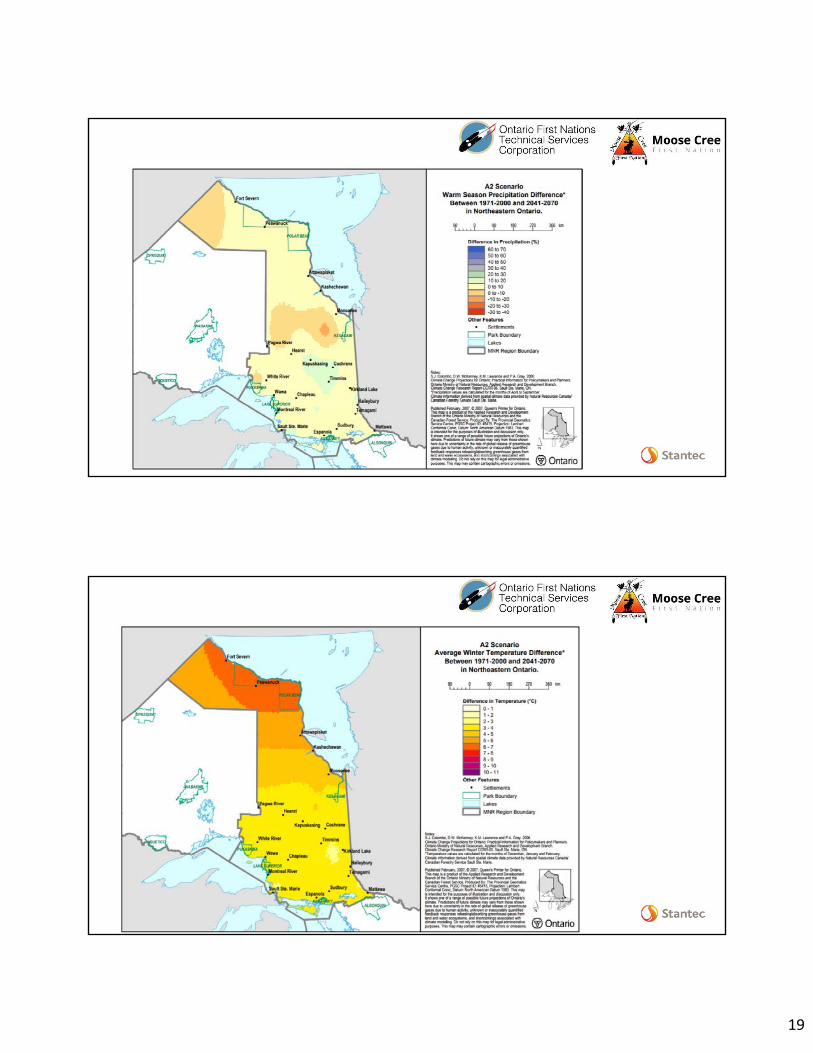
19
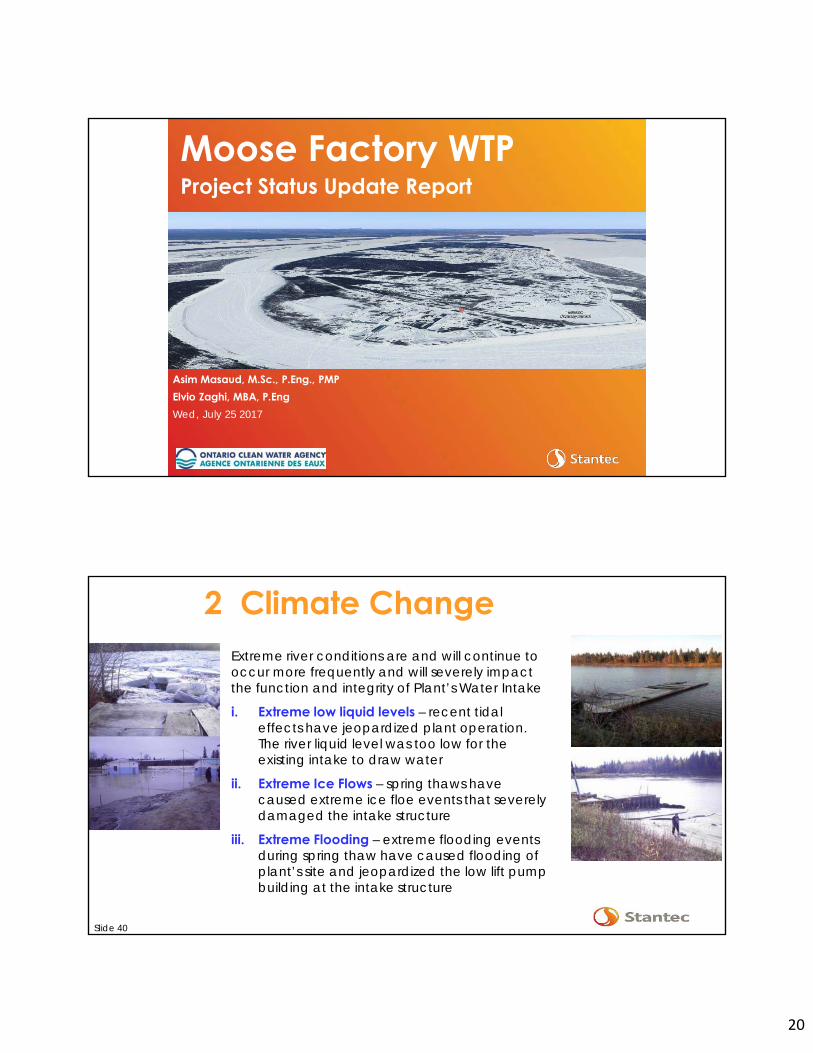
20
Asim Masaud, M.Sc., P.Eng., PMPElvio Zaghi, MBA, P.EngWed, July 25 2017
Moose Factory WTPProject Status Update Report
2 Climate ChangeExtreme river conditions are and will continue to occur more frequently and will severely impact the function and integrity of Plant’s Water Intake
i. Extreme low liquid levels – recent tidal effects have jeopardized plant operation. The river liquid level was too low for the existing intake to draw water
ii. Extreme Ice Flows – spring thaws have caused extreme ice floe events that severely damaged the intake structure
Extreme Flooding – extreme flooding events during spring thaw have caused flooding of plant’s site and jeopardized the low lift pump building at the intake structure
iii.
Slide 40

21
2 Raw Water Quality Impacts
Climate Considerations
5
0
25
20
15
10
Tem
pera
ture
(⁰C)
Temperature (2014)Temperature (2013)Temperature (2012)
18016014012010080604020
0
Turb
idity
(NTU
)
Turbidity (2014)Turbidity (2013)Turbidity (2012)
• Seasonality– Ice dams– Turbidity spikes (>140 NTU)
during spring melt
• Tidal Effects– Semi-diurnal tide (low tide
occurs twice per day)– Enhanced by wind speed
and direction– Strong winds have been
linked to extremely lowwater levels at Moose Factory Island Intake
– Flow reversals are common
Slide 41
2 Raw Water Quality Impacts
Climate Change Impacts• Warmer winter and spring temperatures
– Reduced ground frost, snow– Increased freezing rain
• Temperature variability– Late September: 4oC in morning and 25oC in afternoon is common
• Changes in precipitation– Lower water levels
• Increasing intensity of storms and wind– Flooding
• Potential increases in upstream agriculture– 1 million acres of underutilized land in the clay belt in the watershed (near
Kapuskasing)– Longer growing seasons– Greater potential for algae growth
Slide 42

22
2 Raw Water Quality ImpactsChange in AnnualAir Temperature (oC) from 1961/1990 to2050
Slide 43
Other sources
But MOST IMPORTANTLY …
... YOUR knowledge of local climate!
• Ontario Climate Data Portal
• Western Ontario U. IDF curves

1
FN PIEVC Infrastructure Vulnerability AssessmentOFNTSC-Moose Cree W/WW Vulnerability Study
Risk Assessment Workshop #3Dr. Guy Félio, P.Eng., FCSCE, IRP[Climate]
Senior Advisor, Stantec
Tuesday November 21, 2017
Funded by:
In Collaboration with:
Safety Moment

2
Objectives
• Review of Workshop 3• Identification and validation of the climate parameters for
the study• Risk matrix: infrastructure-climate interactions• Risk Matrix: climate probability ratings, severity of impacts
scores and risk calculations• Summary• Next steps - Workshop 4
AgendaTime Description 9:00am – 9:15am Welcome and introductions Moose Factory and OFNTSC
9:15am – 9:45am Review of Workshop # 2 findings and PIEVC Protocol steps and discussion
Consultant
9:45am – 10:30am Presentation of preliminary climate parameters and selection
Consultant; All
10:30am – 10:45am Health break 10:45am – 12:00noon Risk matrix: infrastructure and
climate interactions All participants
12:00pm – 12:45pm Lunch 12:45pm – 3:15pm Risk matrix: climate events’
probabilities, severity rating and risk scores
All participants
3:15pm – 3:30pm Review and next steps Consultant 3:30pm Adjourn

3
Infrastructure Components
Performance Considerations
Climate Elements
Water Treatment Plant- Building structure- Building envelope- Roof- Foundations- Process equipment- HVAC system- SCADA- Communications- Electricity- Site services- Access road- Third party suppliesAdministration and Operations
Stru
ctur
al
Ope
ratio
nal
Func
tiona
lity
Envi
ronm
ent
(La
nd)
Envi
ronm
ent
(Wa
ter)
Temperature
5 consecutive days with temp.
> 30 deg.
Temperature
10 consecutive days with
temp. < -35 deg.
Blizzard
> 50cm snow in 24 hour period
Rain
3 consecutive days with total
rainfall of> 100mm
Climate event 5
Y/N P S R Y/N P S R Y/N P S R Y/N P S R Y/N P S R
Y Y
AC
RS
N N
Rating scalesClimate
Score Probability Method A Method B
0 Negligible Not Applicable < 1 in 1,000
1 Highly Unlikely Improbable 1 in 100
2 Remotely Possible 1 in 20
3 Possible Occasional 1 in 10
4 Somewhat Likely Normal 1 in 5
5 Likely Frequent >1 in 2.5
Score Descriptor Provide Example 0 No Effect
1 Insignificant
2 Minor
3 Moderate
4 Major
5 Catastrophic
Impacts on Infrastructure

4
Performance Considerations
(Current) Climate Elements
Stru
ctur
al
Ope
ratio
nal
Func
tiona
lity
Envi
ronm
ent
(La
nd)
Envi
ronm
ent
(Wa
ter)
Temperature
5 consecutive days with temp.
> 30 deg.
Temperature
10 consecutive days with
temp. < -30 deg.
Blizzard
> 50cm snow in 24 hour period
Rain
3 consecutive days with total
rainfall of> 100mm
Climate event 5
Y/N P S R Y/N P S R Y/N P S R Y/N P S R Y/N P S R
N NY Y 1 33 23 6
Infrastructure Components
Water Treatment Plant- Building structure- Building envelope- Roof- Foundations- Process equipment- HVAC system- SCADA- Communications- Electricity- Site services- Access road- Third party suppliesAdministration and Operations
AC
RS
Catastrophic 5
4
3
2
1
No effect 0Negligible 0 1 2 3 4 5
Impa
ct/c
onse
quen
ce o
n in
frast
ruct
ure
if cl
imat
e ev
ent o
ccur
s
Likelyhood/probability of climate event occuring
3
6
Current Climate
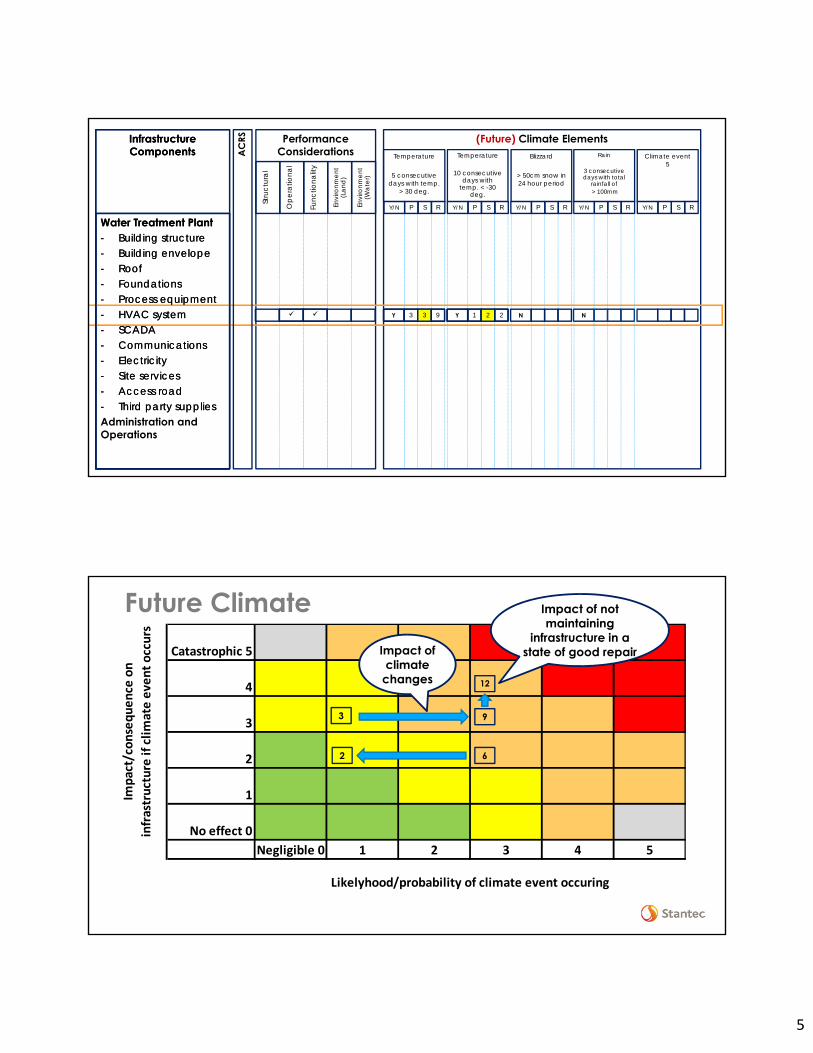
5
Infrastructure Components
Performance Considerations
(Future) Climate Elements
Water Treatment Plant- Building structure- Building envelope- Roof- Foundations- Process equipment- HVAC system- SCADA- Communications- Electricity- Site services- Access road- Third party suppliesAdministration and Operations
Stru
ctur
al
Ope
ratio
nal
Func
tiona
lity
Envi
ronm
ent
(La
nd)
Envi
ronm
ent
(Wa
ter)
Temperature
5 consecutive days with temp.
> 30 deg.
Temperature
10 consecutive days with
temp. < -30 deg.
Blizzard
> 50cm snow in 24 hour period
Rain
3 consecutive days with total
rainfall of> 100mm
Climate event 5
Y/N P S R Y/N P S R Y/N P S R Y/N P S R Y/N P S R
N NY Y 3 13 29 2
Infrastructure Components
Water Treatment Plant- Building structure- Building envelope- Roof- Foundations- Process equipment- HVAC system- SCADA- Communications- Electricity- Site services- Access road- Third party supplies
AC
RS
Catastrophic 5
4
3
2
1
No effect 0Negligible 0 1 2 3 4 5
Impa
ct/c
onse
quen
ce o
n in
frast
ruct
ure
if cl
imat
e ev
ent o
ccur
s
Likelyhood/probability of climate event occuring
3
6
12
2
Future Climate
9
Impact of climate
changes
Impact of not maintaining
infrastructure in a state of good repair

6
Stru
ctur
al
Desi
gnFu
nctio
nalit
y
Serv
icea
bilit
y
Wat
ersh
ed,
Surf
ace
Wat
er
& G
roun
dwat
erO
pera
tions
, M
aint
enan
ce &
M
ater
ials
Pe
rfor
man
ceEn
viro
nmen
tal
Effe
cts
Y/N P S R Y/N P S R Y/N P S R Y/N P S R Y/N P S R Y/N P S R
Cornwall Island 5 6 5 4 3 3Water Supply System
Water Treatment Plant Building structure ✓ ✓ ✓ ✓Building envelope ✓ ✓ ✓ ✓Roof ✓ ✓ ✓ ✓Process equipment ✓ ✓ ✓ 4 20 5 20HVAC system ✓ ✓ ✓ ✓ 3 18 3 12Foundations ✓ 1 3Site services ✓ ✓ ✓ ✓ ✓Storage and/or alternate use ✓ ✓ ✓ ✓ 3 9Access road ✓ ✓ ✓ ✓Environment (plants, trees, animals) ✓ 3 18 5 25 6 24
Environment (soil conditions) 2 10 3 12 3 9Backwater disposal ✓ ✓ ✓ ✓ ✓Biosolids/sludge disposal ✓ ✓Communications / SCADA/Telemetry ✓ ✓ ✓ ✓Back-up power (generator, fuel storage) ✓ ✓ ✓ ✓
WTP - High Lift Pumps ✓ ✓ ✓ ✓WTP - Reservoir ✓ 5 25 5 20WTP - Intake ✓ ✓ ✓ ✓WTP - Low Lift Pump ✓ ✓ ✓ ✓
Mark Relevant Responses with ✓
nfrastructure Response Considerations Max. Daily Temp. Hotest Month (Aug.) Temp.
Low Precipitation (Aug.)
Combination - Aug. High Temp. with Low Fog Rain - 7 day period
Infrastructure Components Days (per year) with Max Temps > 36°C
Very warm August Temps Mean >22.5°C (warmer than August
2012)
Days with August total precipitation ≤ ~50mm (equal to or
less than August 2012)
Combination August Warm Temperatures
& low rainfalls
Fog visibilities below ½ statute mile (for
shipping)
> 120 mm rainfall in 7 days
The FN PIEVC Risk Matrix
Assessment of the CC Vulnerability of the W/WW of Moose Factory
Infrastructure Definition Process
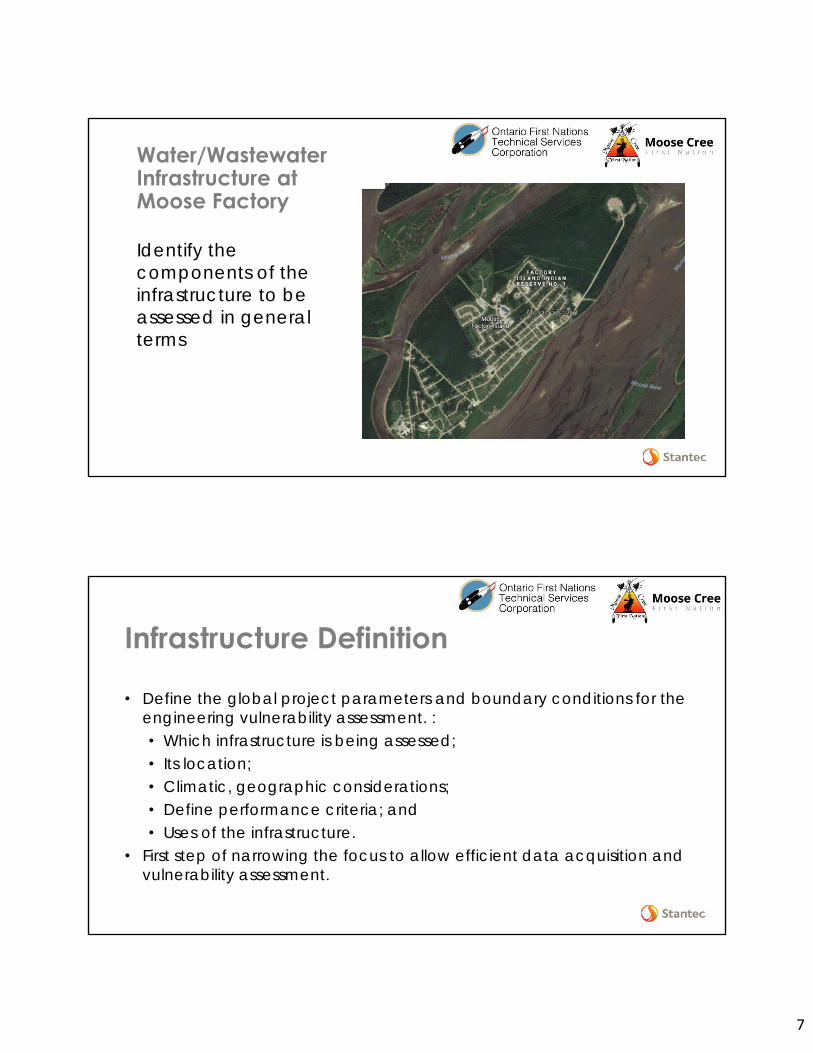
7
Water/Wastewater Infrastructure at Moose Factory
Identify the components of the infrastructure to be assessed in general terms
Infrastructure Definition
• Define the global project parameters and boundary conditions for the engineering vulnerability assessment. :• Which infrastructure is being assessed;• Its location;• Climatic, geographic considerations; • Define performance criteria; and• Uses of the infrastructure.
• First step of narrowing the focus to allow efficient data acquisition and vulnerability assessment.

8
Infrastructure to be Assessed
Main components• Potable Water• Wastewater• Administration and operations• Third party services
• Telecommunications• Electricity• Fuel supply
Potable Water System• Intake• Low lift station (at intake)• Water treatment plant• Storage tanks
(underground and above-ground)
• Transmission main (250mm)• Distribution mains (150mm)• Hydrants
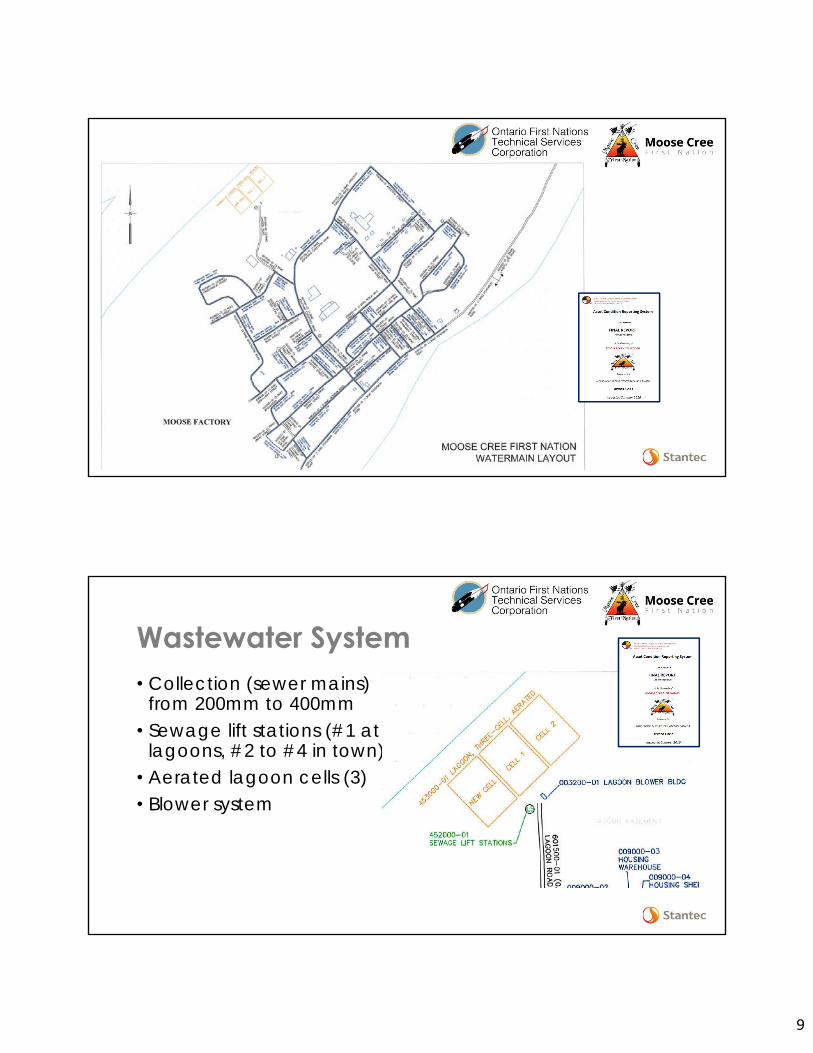
9
Wastewater System• Collection (sewer mains)
from 200mm to 400mm• Sewage lift stations (#1 at
lagoons, #2 to #4 in town)• Aerated lagoon cells (3)• Blower system
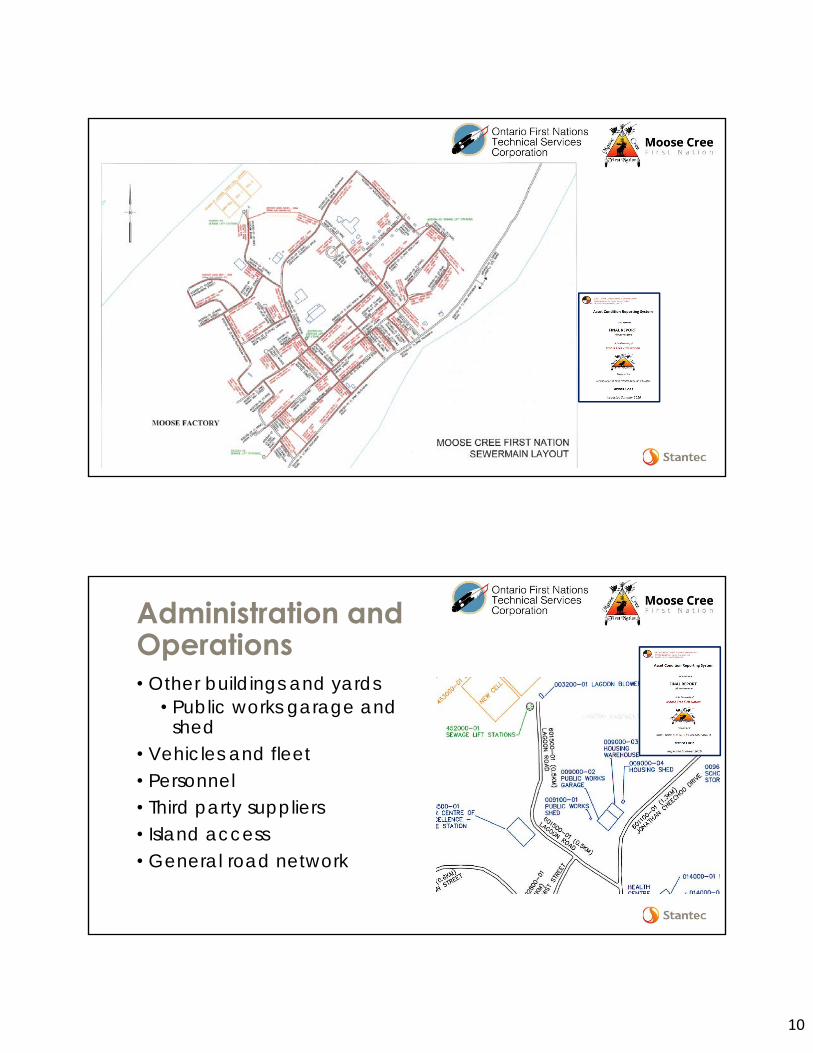
10
Administration and Operations• Other buildings and yards
• Public works garage and shed
• Vehicles and fleet• Personnel• Third party suppliers• Island access• General road network

11
Buildings – general breakdown (not all apply)• Building Structure• Building Envelope• Roof• Foundations• Process equipment• HVAC• Electrical systems
• Scada/communications• Storage• Site services• Access road• Backup generator
Establish the Infrastructure Performance Criteria
“If a climate event impacts the infrastructure, how will the condition and
performance be affected?”

12
Infrastructure Components
Performance Considerations
Climate Elements
Water Treatment Plant- Building structure- Building envelope- Roof- Foundations- Process equipment- HVAC system- SCADA- Communications- Electricity- Site services- Access road- Third party suppliesAdministration and Operations
Stru
ctur
al
Ope
ratio
nal
Func
tiona
lity
Envi
ronm
ent
(La
nd)
Envi
ronm
ent
(Wa
ter)
Temperature
5 consecutive days with temp.
> 30 deg.
Temperature
10 consecutive days with
temp. < -35 deg.
Blizzard
> 50cm snow in 24 hour period
Rain
3 consecutive days with total
rainfall of> 100mm
Climate event 5
Y/N P S R Y/N P S R Y/N P S R Y/N P S R Y/N P S R
Y Y
AC
RS
N N
1. Structural CapacityWith respect to the infrastructure or infrastructure component being assessed, climate loading may affect:
• Load carrying capacity• Fracture / Collapse• Fatigue• Access• Deflection / Permanent deformation• Cracking and deterioration• Foundations

13
2. FunctionalityWith respect to the infrastructure or infrastructure component being assessed, climate loading may affect:
• Effective Capacity of the infrastructure to provide the intended service
• Short term • Medium term• Long term
3. OperationsWith respect to the infrastructure or infrastructure component being assessed, climate loading may affect:
• Occupational safety• Access to worksite• Equipment performance• Maintenance and replacement cycles• Electricity demand• Fuel use• Materials Performance • Changes from design expectation
14
4. Environment (Land)With respect to the infrastructure or infrastructure component being assessed, climate loading may affect:
• Vegetation cover• Absorption properties• Trees• External elements (not attached to building)• Erosion
5. Environment (Water)With respect to the infrastructure or infrastructure component being assessed, climate loading may affect:
• Erosion along streams, rivers, and ditches• Erosion scour of associated or supporting earthworks• Slope stability of embankments• Sediment transport and sedimentation• Channel realignment / meandering• Water quality• Water quantity• Run off

15
Confirm Rating scales
Score Probability Method A Method B
0 Negligible Not Applicable < 1 in 1,000
1 Highly Unlikely Improbable 1 in 100
2 Remotely Possible 1 in 20
3 Possible Occasional 1 in 10
4 Somewhat Likely Normal 1 in 5
5 Likely Frequent >1 in 2.5
Score Descriptor Provide Example 0 No Effect
1 Insignificant
2 Minor
3 Moderate
4 Major
5 Catastrophic
Impacts on InfrastructureClimate
Example - OneidaScore and Description Consequence0No effect
No DamageFully functional – continues to perform as intended
1Insignificant
Can be corrected through the regular maintenance cycle
2Minor
Requires sending repair crewNo replacement of major components or assetRepair parts usually stocked and readily availableMay need further assessment
3Moderate
Needs attentionRequires repair crew and replacement of componentsRepair parts may not be available and require orderingWill need further assessment
4Major
Collapse. Total loss that requires full replacement.Little or no impacts on other elements of asset or other assets
5Catastrophic
Collapse. Total loss that requires full replacement.Will require relocating people and/or functionsImpacts on other elements of asset or other assetsMay have impacts on health and safety

16
Impacts on the service or the community if the infrastructure fails
1. Emergency Response
With respect to the infrastructure or infrastructure component being assessed, a loss of performance or failure due to climate loading may affect:
• Procedures and systems to address:• Severe storm events• Flooding• Ice dams• Water damage

17
2. Insurance and Legal ConsiderationsWith respect to the infrastructure or infrastructure component being assessed, a loss of performance or failure due to climate loading may affect:
• Insurance rates• The ability to acquire insurance• Insurance policy limitations and exclusions• Legal impacts and liability
3. Policy Considerations
With respect to the infrastructure or infrastructure component being assessed, a loss of performance or failure due to climate loading may affect:
• Codes• Guidelines• Standards• Internal operations and maintenance policies and
procedures• Levels of Service policy• Land use planning

18
4. Social Effects
With respect to the infrastructure or infrastructure component being assessed, a loss of performance or failure due to climate loading may affect:
• Accessibility to critical facilities such as hospitals, fire and police services
• Energy supply to a community• Dislocation of affected populations • Provision of basic services such as potable water distribution and
wastewater collection• Closure of schools and other public services• Destruction or damage to heritage buildings, monuments, etc. or
historically important resources
5. Environmental Effects
With respect to the infrastructure or infrastructure component being assessed, a loss of performance or failure due to climate loading may cause:• Release of toxic, controlled or deleterious substances• Degradation of water quality• Damage to sensitive ecosystems• Physical harm to birds and animals• Contamination of potable water supplies• Public perception and interaction

19
6. Fiscal Impacts
With respect to the infrastructure or infrastructure component being assessed, a loss of performance or failure due to climate loading may cause:
• Drain on current/future financial resources to deal with unplanned repairs, maintenance and/or replacements
• Shifting financial resources from other community priorities• Impacts on services and/or levels of service• Community economic impacts and/or hardships
Application of the Draft FN PIEVC/AM Toolkit:Moose Factory
Climate Considerations – Weather Station Data and Projections
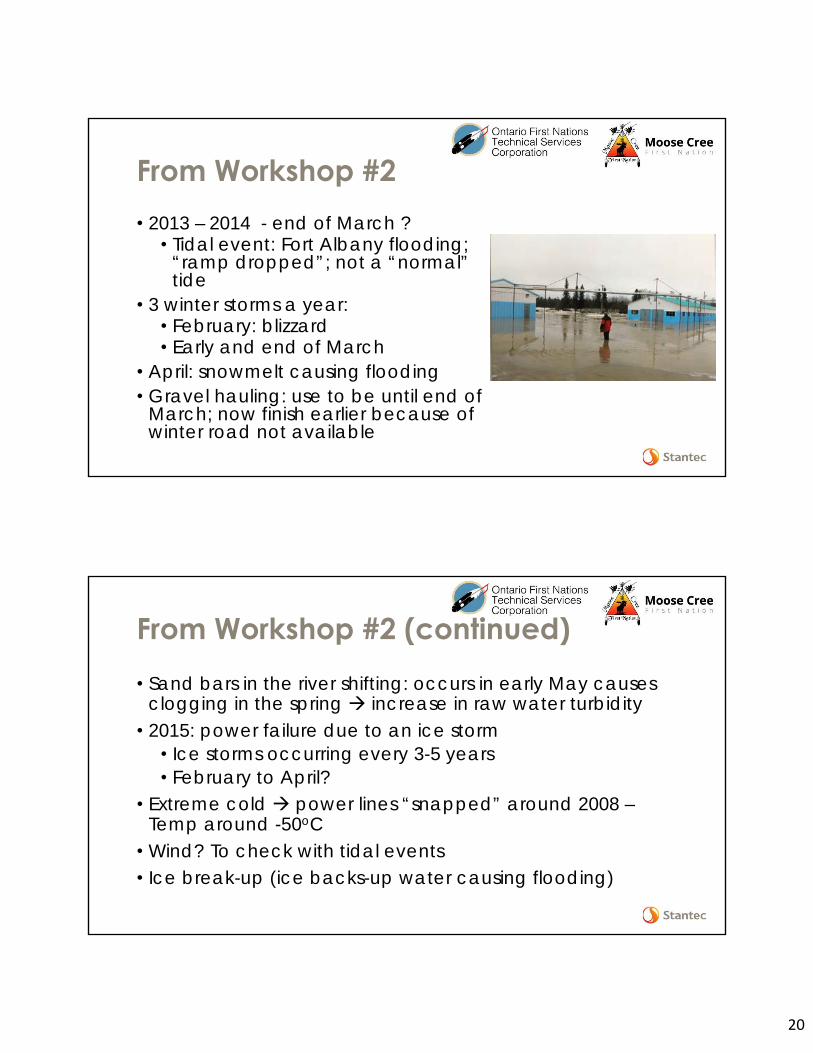
20
From Workshop #2• 2013 – 2014 - end of March ?
• Tidal event: Fort Albany flooding; “ramp dropped”; not a “normal” tide
• 3 winter storms a year: • February: blizzard• Early and end of March
• April: snowmelt causing flooding• Gravel hauling: use to be until end of
March; now finish earlier because of winter road not available
From Workshop #2 (continued)• Sand bars in the river shifting: occurs in early May causes
clogging in the spring increase in raw water turbidity• 2015: power failure due to an ice storm
• Ice storms occurring every 3-5 years• February to April?
• Extreme cold power lines “snapped” around 2008 –Temp around -50oC
• Wind? To check with tidal events• Ice break-up (ice backs-up water causing flooding)

21
From Workshop #2 (continued)• Occurrence of winter lightning
– unusual but more frequent now
• Increase occurrences of winter rain events: increases loads on roofs; fire hydrants [ice cover?]
• Winters getting warmer
What we also heardTrevor Koostachin, Public Works Manager of Attawapiskat First Nation• During the past 10 years cold weather has been occurring
later in the calendar year while warmer weather has been occurring earlier in the Spring. Shorter winter season overall.
• Usually the area would receive 1 instance of warm weather in March followed by colder weather to carry out in the Spring until late April. The past few years the area has received 2-3 instances of warm weather in the winter as early as January.
• Generally experienced high winds from 2015-2016.• Rainfall was extremely low Summer of 2017.
22
What we also heardLeo Metatawabin , Environmental Steward - Fort Albany• Occasions of thunder in 2016 generally high. Lightning
occurred February 2016.• Summer 2017 unusually dry. The area has generally been
receiving continuously less rainfall year after year.• 2006 Kashechewan flooding.• Shortened winter road seasons. Late winter, early spring.
Climate Elements to Consider
General information on projectionsDiscussion on past events that have caused
infrastructure disruptions and/or damage

23
Asim Masaud, M.Sc., P.Eng., PMPElvio Zaghi, MBA, P.EngWed, July 25 2017
Moose Factory WTPProject Status Update Report
2 Climate ChangeExtreme river conditions are and will continue to occur more frequently and will severely impact the function and integrity of Plant’s Water Intake
i. Extreme low liquid levels – recent tidal effects have jeopardized plant operation. The river liquid level was too low for the existing intake to draw water
ii. Extreme Ice Flows – spring thaws have caused extreme ice floe events that severely damaged the intake structure
Extreme Flooding – extreme flooding events during spring thaw have caused flooding of plant’s site and jeopardized the low lift pump building at the intake structure
iii.
Slide 46
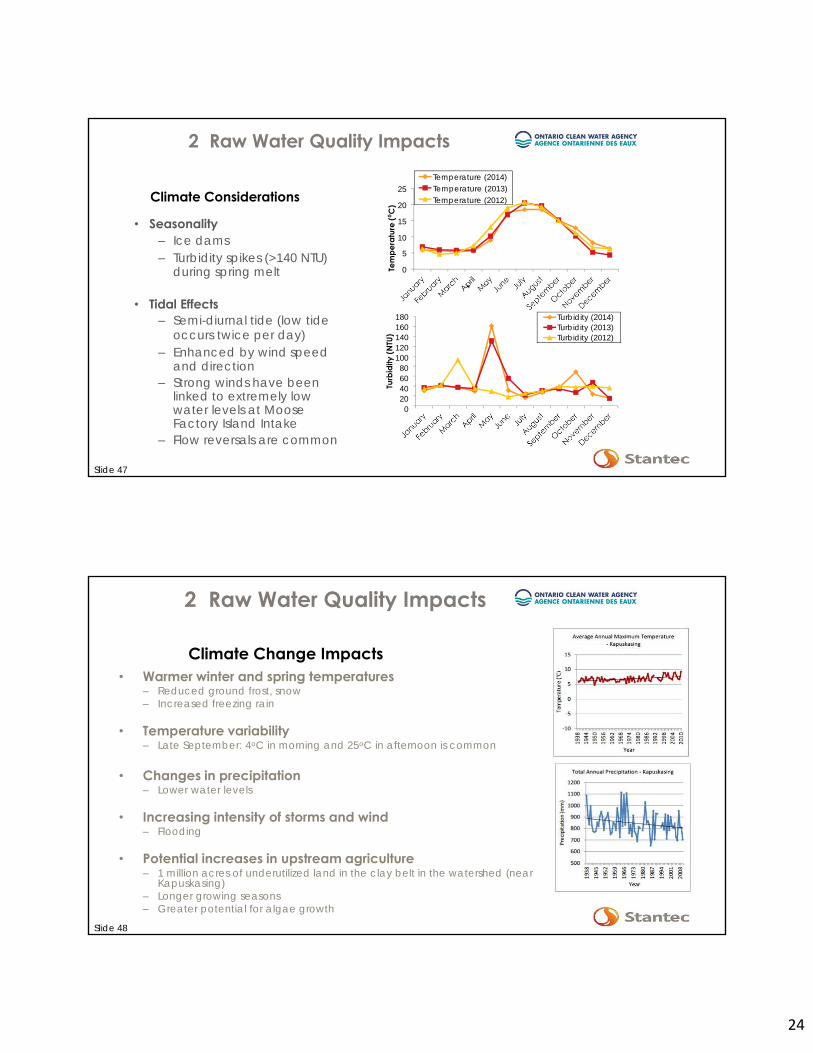
24
2 Raw Water Quality Impacts
Climate Considerations
5
0
25
20
15
10
Tem
pera
ture
(⁰C)
Temperature (2014)Temperature (2013)Temperature (2012)
18016014012010080604020
0
Turb
idity
(NTU
)
Turbidity (2014)Turbidity (2013)Turbidity (2012)
• Seasonality– Ice dams– Turbidity spikes (>140 NTU)
during spring melt
• Tidal Effects– Semi-diurnal tide (low tide
occurs twice per day)– Enhanced by wind speed
and direction– Strong winds have been
linked to extremely lowwater levels at Moose Factory Island Intake
– Flow reversals are common
Slide 47
2 Raw Water Quality Impacts
Climate Change Impacts• Warmer winter and spring temperatures
– Reduced ground frost, snow– Increased freezing rain
• Temperature variability– Late September: 4oC in morning and 25oC in afternoon is common
• Changes in precipitation– Lower water levels
• Increasing intensity of storms and wind– Flooding
• Potential increases in upstream agriculture– 1 million acres of underutilized land in the clay belt in the watershed (near
Kapuskasing)– Longer growing seasons– Greater potential for algae growth
Slide 48
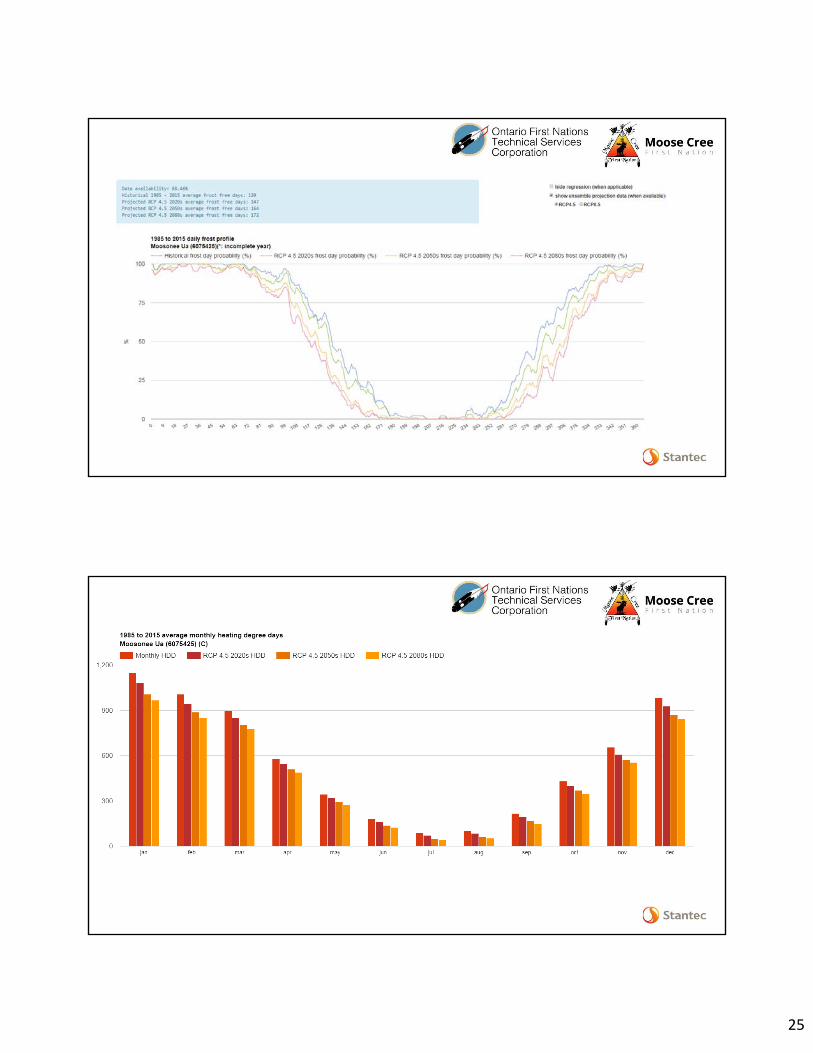
25

26
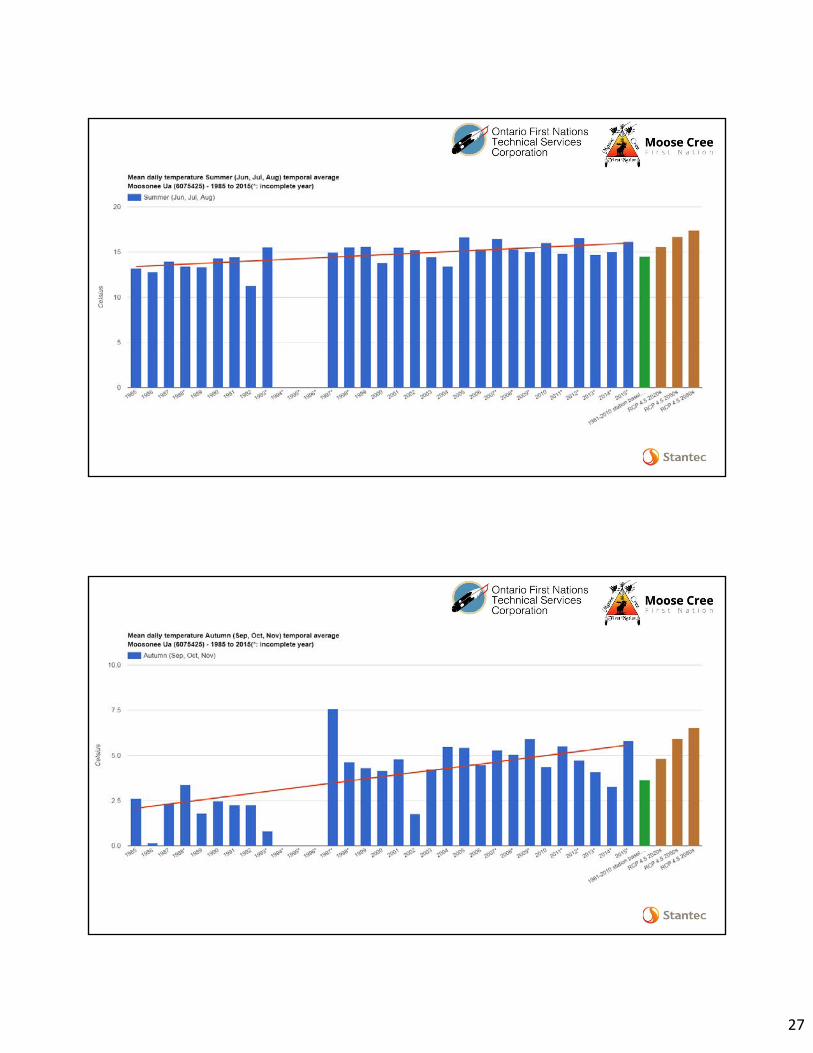
27
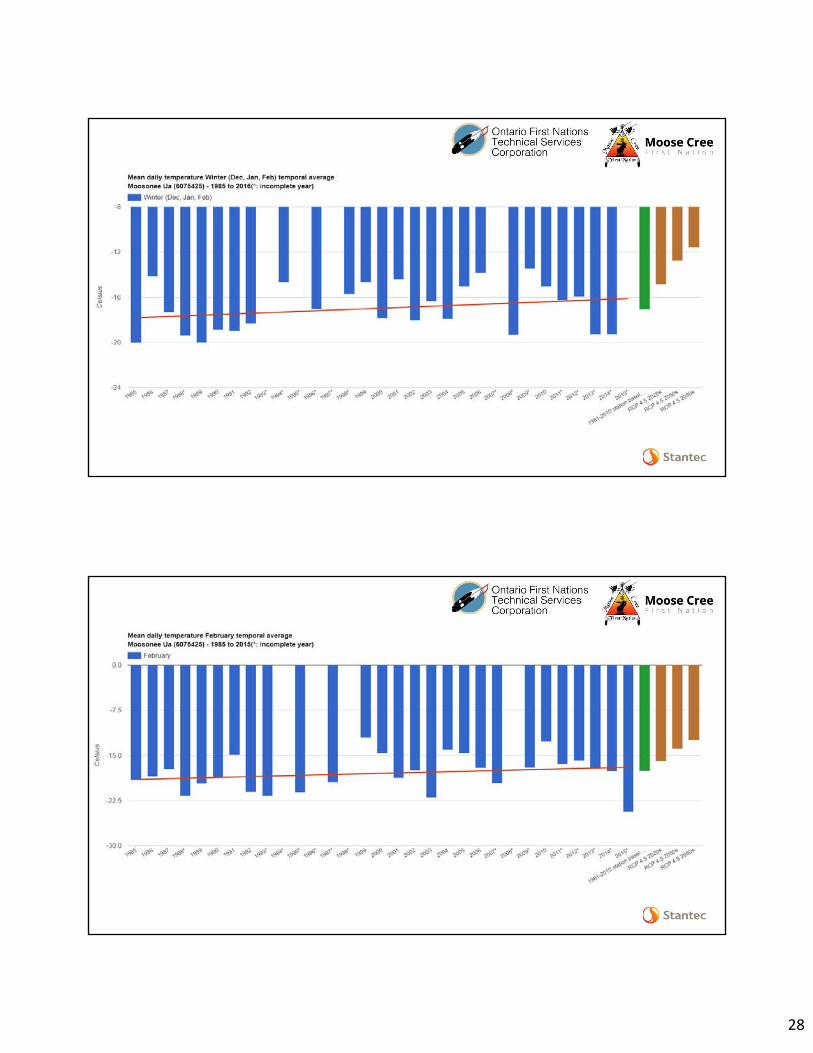
28

29

30
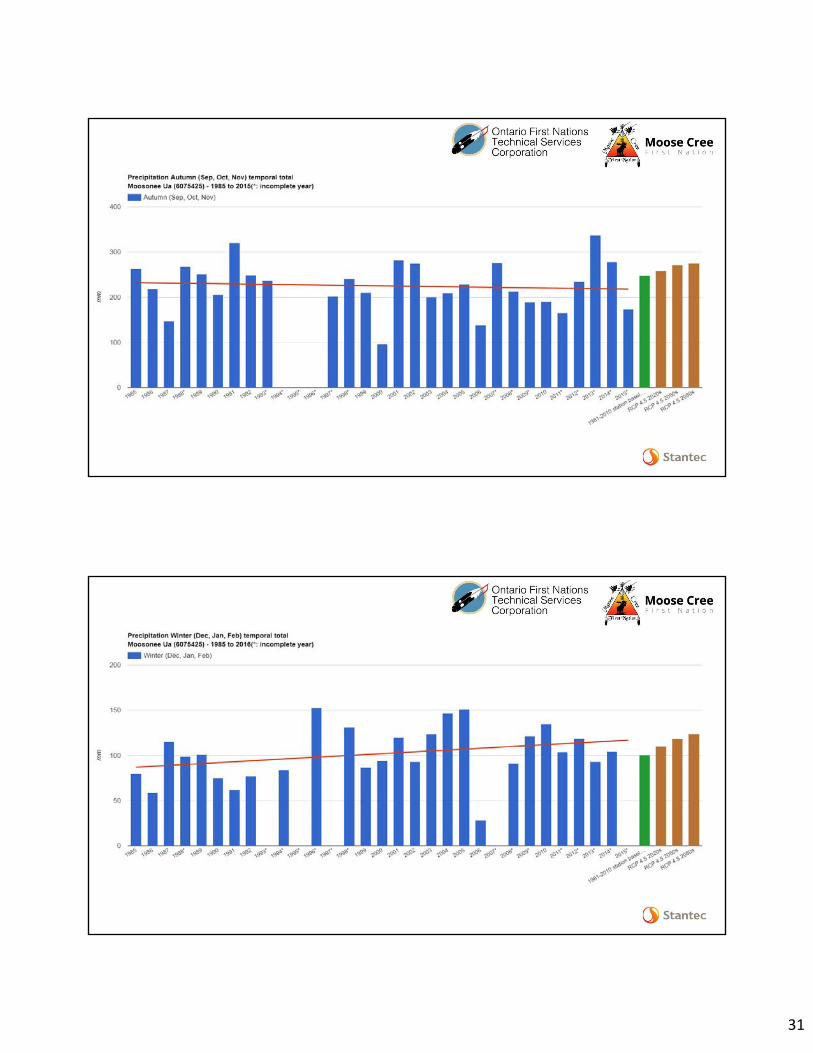
31
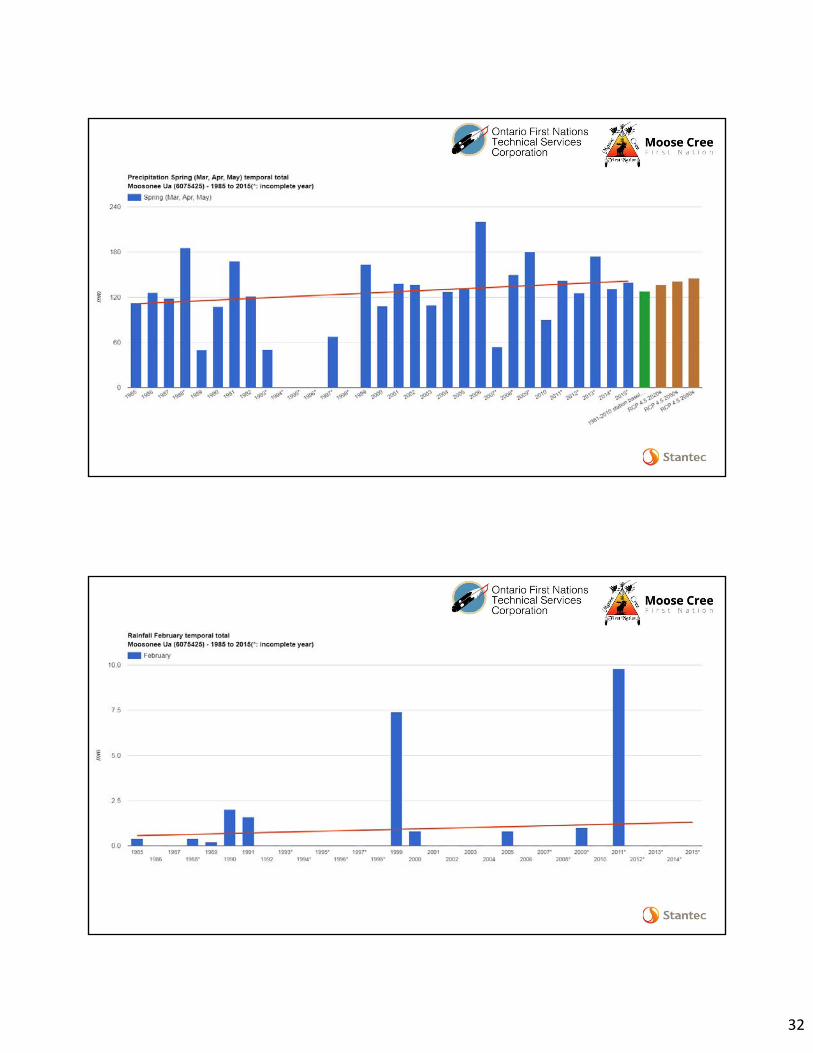
32

33
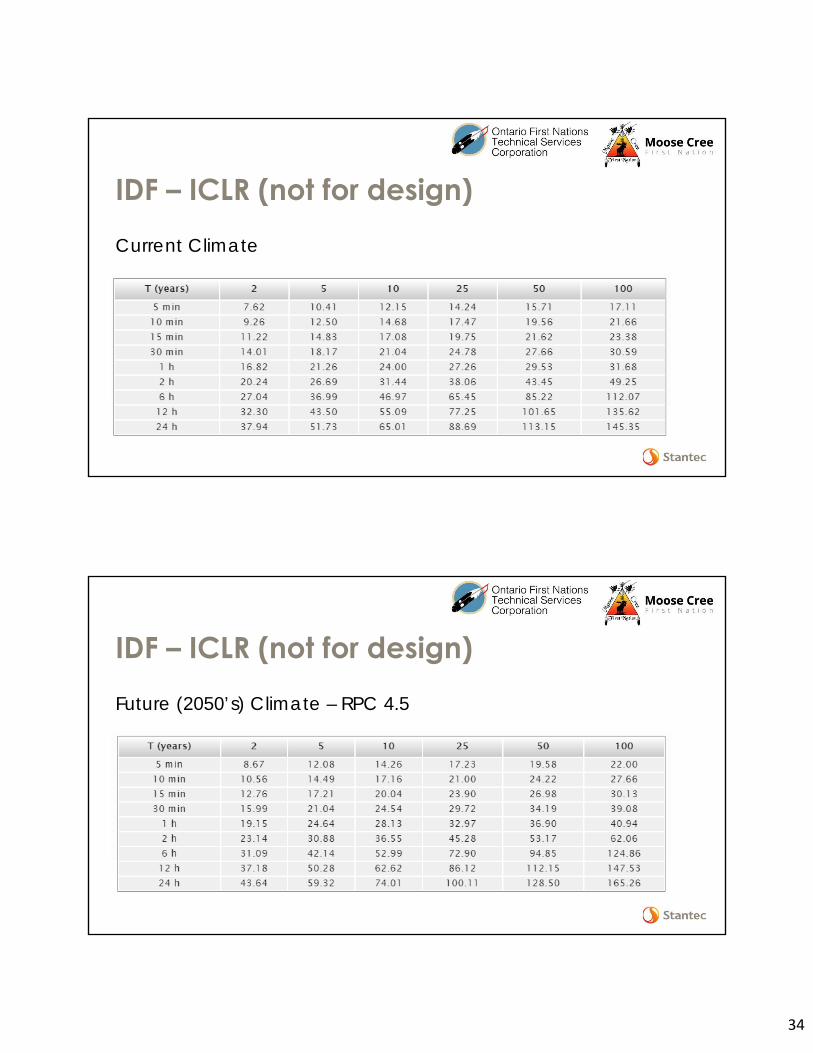
34
IDF – ICLR (not for design)Current Climate
IDF – ICLR (not for design)Future (2050’s) Climate – RPC 4.5

35
Work on the Risk MatrixInfrastructure listPerformance considerationsClimate parameters and probabilitiesInteractions: Y/NSeverity if climate event occursRisk
Asse
t #
Quan
tity
Units
Year
cons
truct
ed
Gene
ral c
ondi
tion
Stru
ctur
al
Oper
atio
ns
Func
tiona
l
Envi
ronm
ent (
Land
)
Envi
ronm
ent (
Wat
er)
Y/N P S R Y/N P S R Y/N P S R
Wastewater SystemLagoons 453000 1987 4Lagoon blower building 003200 1986 7Lagoon Road 601500 1985 7
Sanitary mains South 450100 1987 7Sanitary mains Central 450200 1991 7Sanitary mains North 450300 1997 7Sanitary mains West 450400 2001 7
Sewage lift stations (4) 452000 1987 7-8
Potable water system
Intake structure
Water treatment plant - Building 003500 1990 7
Building envelope
Days with Temp >XX deg. C
1 2
Heating and cooling degree
days
3
Exceeding XX km.p.h
Asset/Infrastructure ElementsMax. Temp Seasonal Temp
variaionsWind
ACRS/ICMS Information Performance Considerations
Dr. Guy Felio, P.Eng., FCSCE, IRP[Climate][email protected]

1
Risk Sciences International700-55 Metcalfe Street, Ottawa, Canada
www.risksciences.com
The Changing Climate of the Moose River Area
Heather AuldRisk Sciences International
The Changing Climate of the Moose River Area
©Risk Sciences International 20172
• Warming over recent decades • Fewer cold days – but falls and winters likely
more variable• More hots days > 30°C and 35°C; more summer
humidity• Summer rainfall – varying; may be more of the
heavy rainfall days. thunderstorms• Later fall freeze-up and earlier spring break-up • Shorter winter road seasons – bridging the water
taxi and winter road seasons• More ice jam potential in spring?? More warm
days in April, heavier rainfall events• Winter snowfall varies from year-to-year• Bigger snow storms? Ice storms
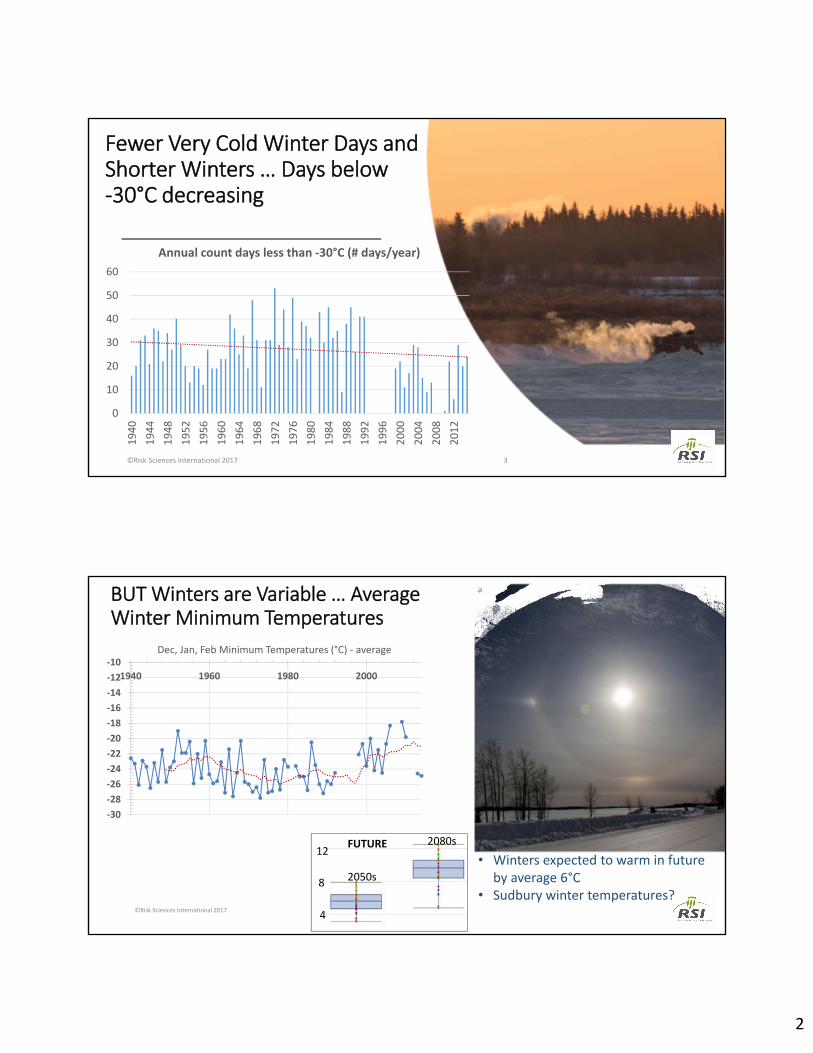
2
Fewer Very Cold Winter Days and Shorter Winters … Days below -30°C decreasing
©Risk Sciences International 2017 3
0
10
20
30
40
50
60
1940
1944
1948
1952
1956
1960
1964
1968
1972
1976
1980
1984
1988
1992
1996
2000
2004
2008
2012
Annual count days less than -30°C (# days/year)
BUT Winters are Variable … Average Winter Minimum Temperatures
©Risk Sciences International 2017 4
-30-28-26-24-22-20-18-16-14-12-10
1940 1960 1980 2000
Dec, Jan, Feb Minimum Temperatures (°C) - average
4
8
12
2050s
2080sFUTURE• Winters expected to warm in future
by average 6°C• Sudbury winter temperatures?
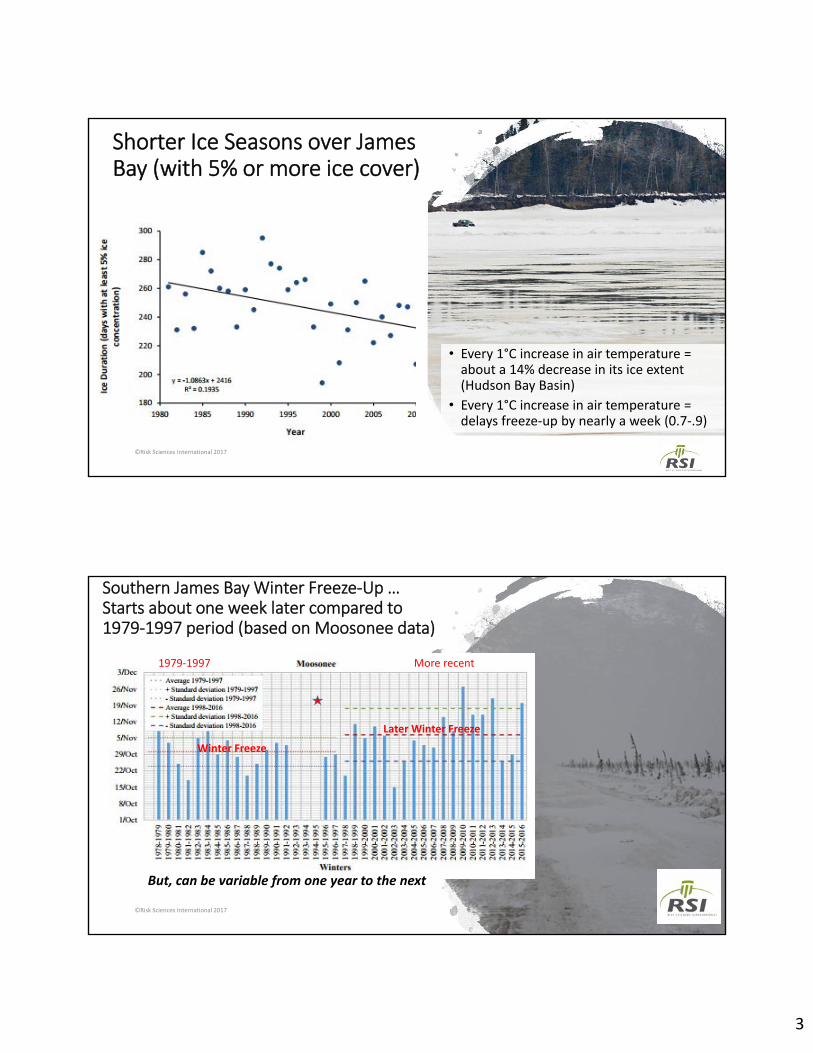
3
Shorter Ice Seasons over James Bay (with 5% or more ice cover)
©Risk Sciences International 2017 5
• Every 1°C increase in air temperature = about a 14% decrease in its ice extent (Hudson Bay Basin)
• Every 1°C increase in air temperature = delays freeze-up by nearly a week (0.7-.9)
Southern James Bay Winter Freeze-Up … Starts about one week later compared to 1979-1997 period (based on Moosonee data)
©Risk Sciences International 2017 6
Later Winter FreezeWinter Freeze
1979-1997 More recent
But, can be variable from one year to the next

4
Earlier Spring Break-up (shallow water) … Estimated from Moosonee data
©Risk Sciences International 2017 7
Earlier Spring ThawSpring Thaw
1979-1997 More recent
But, can be variable from one year to the next
Dec-Jan-Feb Snowfall Totals/year … James Bay open longer? Variable?
©Risk Sciences International 2017 8
0
50
100
150
200
250
300
350
1940 1950 1960 1970 1980 1990 2000 2010
Dec, Jan, Feb Total Snowfall (cm) - Moosonee UA
Recent mix of low snowfall and some heavier snow years.
1996-97
2010-11
1952-53
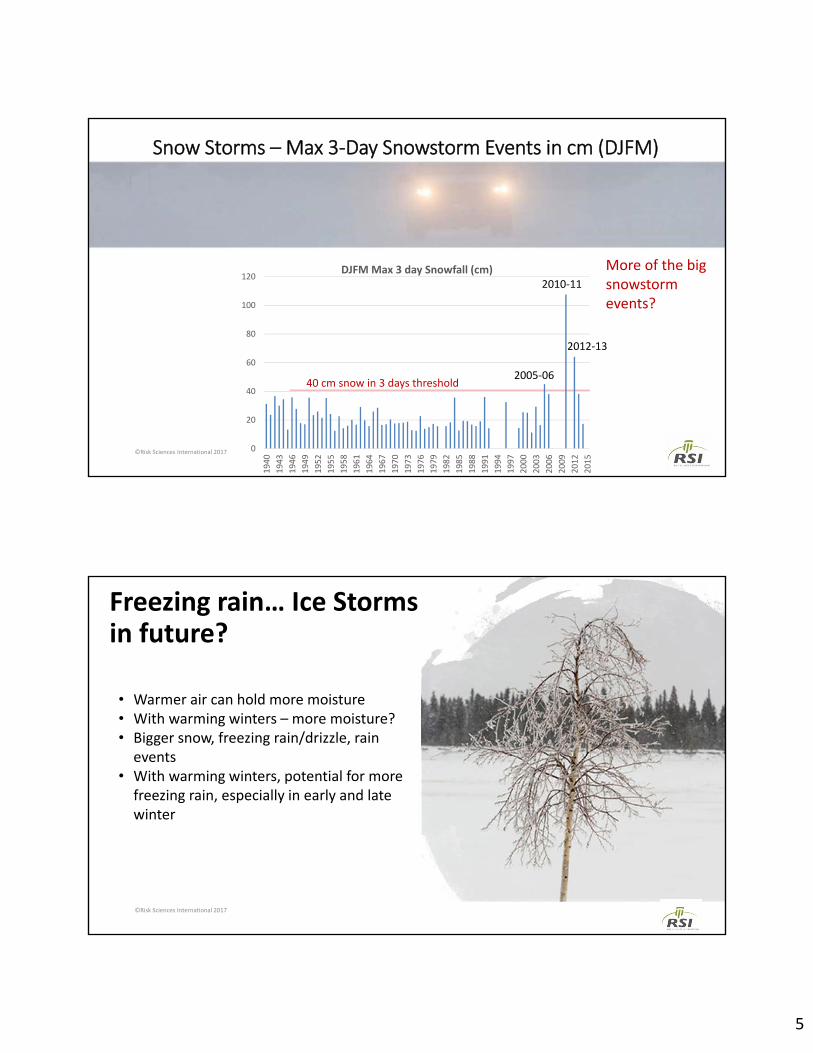
5
Snow Storms – Max 3-Day Snowstorm Events in cm (DJFM)
©Risk Sciences International 2017 9
40 cm snow in 3 days threshold
More of the big snowstorm events?
0
20
40
60
80
100
12019
4019
4319
4619
4919
5219
5519
5819
6119
6419
6719
7019
7319
7619
7919
8219
8519
8819
9119
9419
9720
0020
0320
0620
0920
1220
15
DJFM Max 3 day Snowfall (cm)2010-11
2012-13
2005-06
Freezing rain… Ice Storms in future?
©Risk Sciences International 2017 10
• Warmer air can hold more moisture • With warming winters – more moisture?• Bigger snow, freezing rain/drizzle, rain
events• With warming winters, potential for more
freezing rain, especially in early and late winter

6
March-April-May Warming … with more to come
©Risk Sciences International 2017 11-8
-6
-4
-2
0
2
4
1940
1944
1948
1952
1956
1960
1964
1968
1972
1976
1980
1984
1988
1992
1996
2000
2004
2008
2012
Mar, Apr, May - average (Celsius)
0
10
15
5
2050s
2080s
Future Warming – Mar-Apr-May
Climate and Ice Jams on the Moose River?
©Risk Sciences International 201712
• Weather triggers include rapid warming and melting, intense rainfalls, heavy snowpacks, previous high water
• Potential to increase under changing climate?
0
5
10
15
20
25
1940
1945
1950
1955
1960
1965
1970
1975
1980
1985
1990
1995
2000
2005
2010
2015
April # Days with Max Temps over 5°C
05
10152025303540
1940
1945
1950
1955
1960
1965
1970
1975
1980
1985
1990
2000
2005
2010
2015
April Max 3-Day rainfalls

7
Summer Max Temperatures Warming since 1940: … more to come
©Risk Sciences International 2017 13
Moosonee UA17
18
19
20
21
22
23
24
1940 1960 1980 2000 2020
Jun-Jul-Aug Average Max Temperatures (°C)
2.5
7.52050s
2080s10
5
FUTURE
Future North Bay summer temperatures by 2050s?
More Hot Days: Days hotter than 30°C increasing
©Risk Sciences International 2017 14
0
2
4
6
8
10
12
14
16
18
1940
1942
1944
1946
1948
1950
1952
1954
1956
1958
1960
1962
1964
1966
1968
1970
1972
1974
1976
1978
1980
1982
1984
1986
1988
1990
1992
1994
1996
1998
2000
2002
2004
2006
2008
2010
2012
2014
# Days/year Max Temperatures over 30°CMoosonee UA
Days > 35°C increasing too (1-3 days many years)
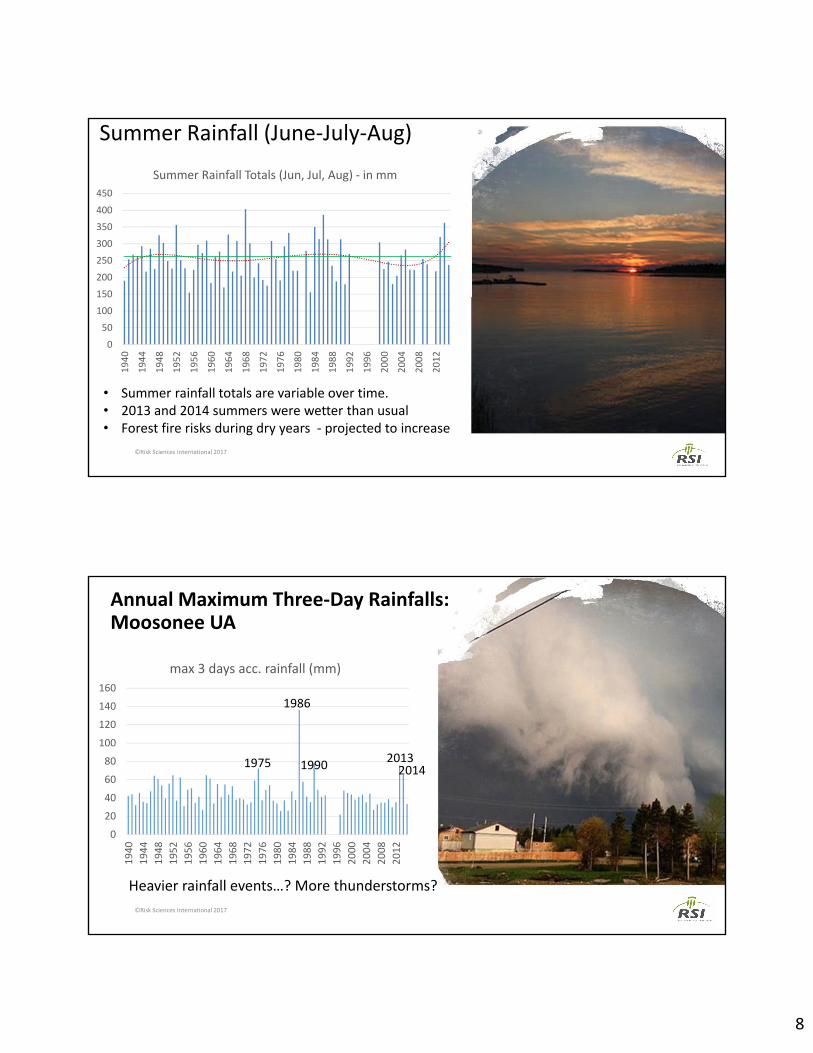
8
Summer Rainfall (June-July-Aug)
©Risk Sciences International 2017 15
050
100150200250300350400450
1940
1944
1948
1952
1956
1960
1964
1968
1972
1976
1980
1984
1988
1992
1996
2000
2004
2008
2012
Summer Rainfall Totals (Jun, Jul, Aug) - in mm
• Summer rainfall totals are variable over time. • 2013 and 2014 summers were wetter than usual • Forest fire risks during dry years - projected to increase
Annual Maximum Three-Day Rainfalls: Moosonee UA
©Risk Sciences International 2017 16
020406080
100120140160
1940
1944
1948
1952
1956
1960
1964
1968
1972
1976
1980
1984
1988
1992
1996
2000
2004
2008
2012
max 3 days acc. rainfall (mm)
1986
1990 201320141975
Heavier rainfall events…? More thunderstorms?

9
Summer Thunderstorms, Lightning
• Average of 24 days/year with lightning with 25 Km (less over James Bay) – similar to Edmonton, and more than northwestern Ontario
• Likely to increase – Longer thunderstorm season• Slight evidence of higher winds in summer?• Warmer air can hold more moisture, potential for heavier rainfall events
Fall (Sept-Oct-Nov) Temperatures – Variable over the years
©Risk Sciences International 2017 18
From: Moose Cree First Nations
-5
-4
-3
-2
-1
0
1
2
3
1940 1960 1980 2000 2020
Sep-Oct-Nov Minimum Temperatures - average (°C)

10
Weather-related Emergencies
©Risk Sciences International 2017 19
Under climate change:• Forest fire potential in northeastern Ontario to
increase (as much as 300% northwestern Ontario)• Heavy rainfall events to increase; Ice jamming (?)
Moose Factory’s Climate in the next few decades
©Risk Sciences International 2017 20
2050s
More like Sudbury, North Bay for temperatures?
Hudson Bay could slow the warming in some seasons.

11
Uncertainties in Climate Change Projections
21
Most Confident
Least / Less Confident
More winter precipitation
Increase in wind extremes
More severe ice, snow storms
More heat waves More
intense rainfall
More CERTAINTY Less CERTAINTY
Longer growing season
Warmer winters
Thank You!!
For further information, contact:
Heather AuldPrincipal Climate ScientistRisk Sciences International
Email: [email protected]: 905-737-6026

1
FN PIEVC Infrastructure Vulnerability AssessmentOFNTSC-Moose Cree W/WW Vulnerability Study
Mitigation of Risks and Adaptation MeasuresWorkshop #4
Dr. Guy Félio, P.Eng., FCSCE, IRP[Climate]Senior Advisor, Stantec
Thursday November 23, 2017
Funded by:
In Collaboration with:

2
Safety Moment
Objectives
• Review, revise as necessary, and agree on the current and future climate risk (risk matrices)
• Identify risk mitigation measures for the highest risks• Recommend actions for immediate risks• Discuss potential adaptation measures to attenuate
the risks under future climate conditions• Next steps

3
AgendaTime Description 9:00am – 9:15am Welcome and introductions Moose Factory and OFNTSC
9:15am – 10:30am Review of risk matrices All participants
10:30am – 10:45am Health break 10:45am – 12:00noon Review of risk matrices All participants
12:00pm – 12:45pm Lunch 12:45pm – 3:15pm Risk mitigation and adaptation
measures All participants
3:15pm – 3:30pm Review Consultant 3:30pm Adjourn
Infrastructure Components
Performance Considerations
Climate Elements
Water Treatment Plant- Building structure- Building envelope- Roof- Foundations- Process equipment- HVAC system- SCADA- Communications- Electricity- Site services- Access road- Third party suppliesAdministration and Operations
Stru
ctur
al
Ope
ratio
nal
Func
tiona
lity
Envi
ronm
ent
(La
nd)
Envi
ronm
ent
(Wa
ter)
Temperature
5 consecutive days with temp.
> 30 deg.
Temperature
10 consecutive days with
temp. < -35 deg.
Blizzard
> 50cm snow in 24 hour period
Rain
3 consecutive days with total
rainfall of> 100mm
Climate event 5
Y/N P S R Y/N P S R Y/N P S R Y/N P S R Y/N P S R
Y Y
AC
RS
N N

4
InfrastructureWastewater System• Lagoons• Lagoon blower building• Lagoon Road
• Sanitary mains South• Sanitary mains Central• Sanitary mains North• Sanitary mains West
• Sewage lift stations (5)• Administration and operations• Operations personnel
Third party services• Electricity• Telecommunications• Fuel supply• WTP chemical supply
River• Raw Water Supply• Transportation Corridor
Potable water system
• Intake Structure
• Water treatment plant - Building• Building envelope• Building structure• Roof• Foundations• Heating/Cooling system• Fuel (oil Heat)• Backup generator
• Water treatment system
• Underground reservoir (#1)• Above-ground reservoir (#2)
• Low level lift station Building• Low level lift station equipment
• Watermains• Watermains South• Watermains Central• Watermains North• Watermains West
• Hydrants
Administration and operations• Operations personnel
Support buildings• Warehouse 2
• Building envelope• Building structure• Roof• Foundations
• Public works garage• Building envelope• Building structure• Roof• Heating/Cooling system
• Garage• Building envelope• Building structure• Roof• Foundations
Rating scalesClimate
Score Probability Method A Method B
0 Negligible Not Applicable < 1 in 1,000
1 Highly Unlikely Improbable 1 in 100
2 Remotely Possible 1 in 20
3 Possible Occasional 1 in 10
4 Somewhat Likely Normal 1 in 5
5 Likely Frequent >1 in 2.5
Score Descriptor Provide Example 0 No Effect
1 Insignificant
2 Minor
3 Moderate
4 Major
5 Catastrophic
Impacts on Infrastructure

5
Score and Description
Consequence [Structural, Functional, Operations]
0 No effect
• No service interruption • No budget impacts • Fully operational – normal • No additional complaints about the service
1 Insignificant
• Can be corrected through the regular maintenance cycle
2 Minor
• Require minor repairs but have the internal capacity and inventory of parts to do those repairs
• No impact on O&M and capital budget – no additional budget required • May need further assessment
3 Moderate
• Have the capacity to do repairs but need to order parts • May need to have certified staff (e.g., electrician) do repairs • Need inspection with possibly external expertise
4 Major
• Partial loss of equipment and/or components • Loss of function of asset, several assets, or critical components • Requires detailed assessment with external expertise • Requires major repairs and possibly complete replacement of
components/equipment • Impacts on O&M and capital budget that may require additional funding • Requires implementing alternative service delivery • May have impacts on public health and safety
5 Catastrophic
• Total loss of equipment and service that requires full replacement of asset, several assets and major components
• Impacts on other elements of asset or other assets • Impacts on public health and safety
Impacts on Infrastructure
Climate EventsRCP 8.5 scenario for future climateClimate Event Description Comment Rating
CurrentRatingFuture
Maximum temperature
• 10 days/year with Temp. > 30oC• Occurrences of Days with Temp.
>35oC (1-3 days)
45
55
Seasonal Temp.Variations
• Heating and cooling degree days Current cooling = 77 degree days
4 5
3 consecutivedays of winter rain
• Southern Ontario Threshold for weather warning causing flood of 25 mm
May be different for Northern Ontario
2 3
Freezing rain • Estimated 15 mm causing local power line damage and damage to trees
4 5
Precipitation (rain)
• Short Duration - High Intensity (20 mm in one hour)
Only 3 years of IDF data (2004 to 2006). Approx. equivalent to a 1:5 rain event
4 5

6
Climate Events (cont’d)RCP 8.5 scenario for future climate
Climate Event Description Comment RatingCurrent
RatingFuture
Precipitation (rain) • >100 mm rain in 12 hours July 6/86 - 122mm in 12 hours or less
2 4
Minimum temperature
• Extreme cold: - 40oC without windchill
5 3
Shift in seasonal temperatures
• Lengthening of air only access season
? ? ?
Shift in seasonal precipitation
• Low flow ? See following slides“Quick response” of low in river to changes in air temperature
? ?
Precipitation (snow) • Heavy snow: 100 cm in 3 days 4 5

7

8
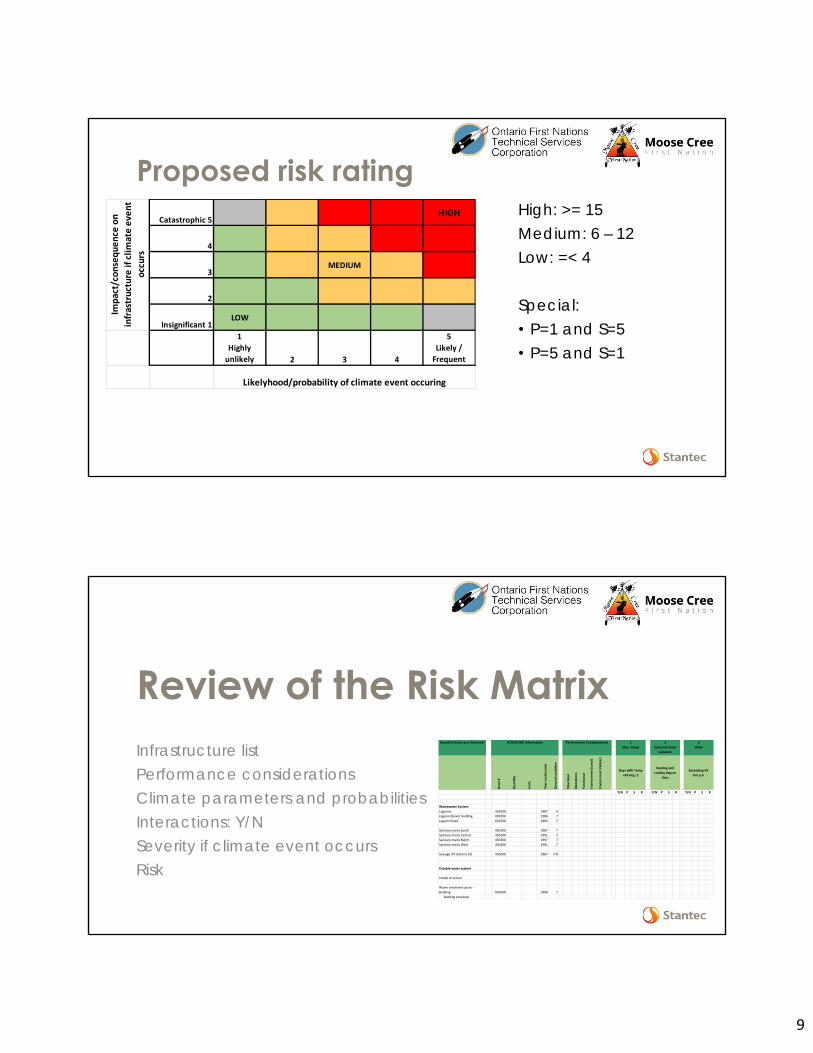
9
Proposed risk ratingHigh: >= 15Medium: 6 – 12Low: =< 4
Special: • P=1 and S=5• P=5 and S=1
Catastrophic 5HIGH
4
3MEDIUM
2
Insignificant 1LOW
1Highly
unlikely 2 3 4
5Likely /
Frequent
Impa
ct/c
onse
quen
ce o
n in
frast
ruct
ure
if cl
imat
e ev
ent
occu
rs
Likelyhood/probability of climate event occuring
Review of the Risk MatrixInfrastructure listPerformance considerationsClimate parameters and probabilitiesInteractions: Y/NSeverity if climate event occursRisk
Asse
t #
Quan
tity
Units
Year
cons
truct
ed
Gene
ral c
ondi
tion
Stru
ctur
al
Oper
atio
ns
Func
tiona
l
Envi
ronm
ent (
Land
)
Envi
ronm
ent (
Wat
er)
Y/N P S R Y/N P S R Y/N P S R
Wastewater SystemLagoons 453000 1987 4Lagoon blower building 003200 1986 7Lagoon Road 601500 1985 7
Sanitary mains South 450100 1987 7Sanitary mains Central 450200 1991 7Sanitary mains North 450300 1997 7Sanitary mains West 450400 2001 7
Sewage lift stations (4) 452000 1987 7-8
Potable water system
Intake structure
Water treatment plant - Building 003500 1990 7
Building envelope
Days with Temp >XX deg. C
1 2
Heating and cooling degree
days
3
Exceeding XX km.p.h
Asset/Infrastructure ElementsMax. Temp Seasonal Temp
variaionsWind
ACRS/ICMS Information Performance Considerations
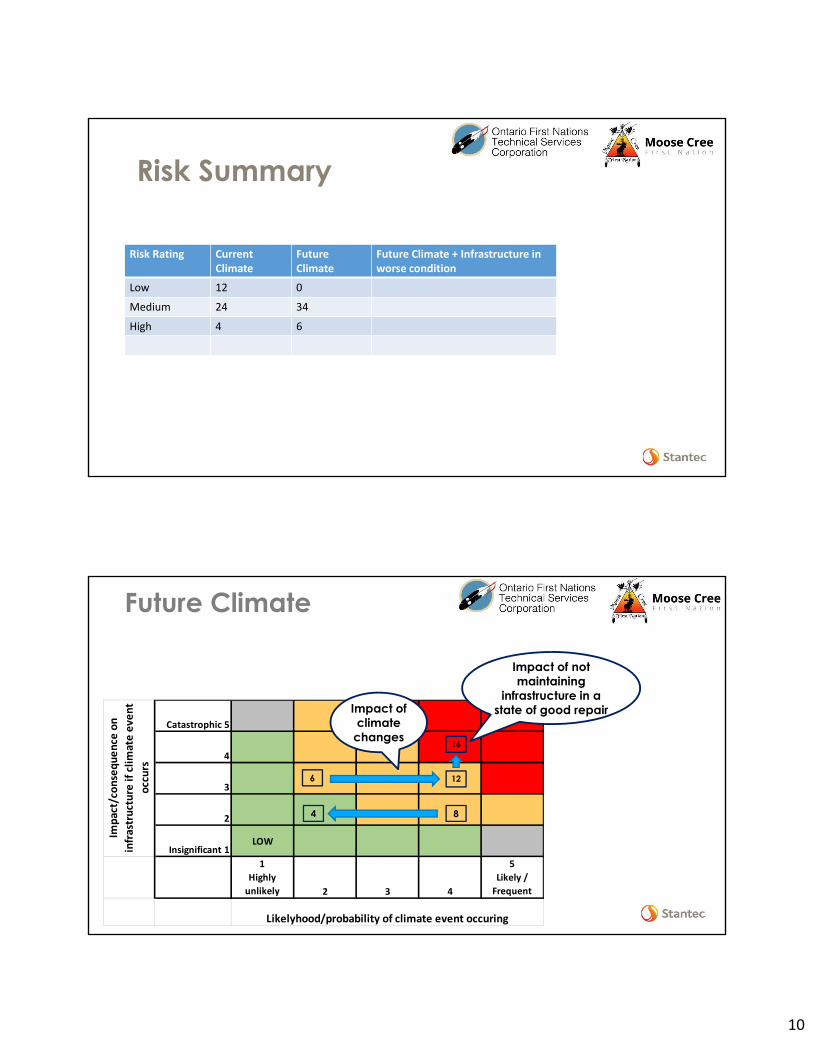
10
Risk Summary
Risk Rating CurrentClimate
Future Climate
Future Climate + Infrastructure in worse condition
Low 12 0Medium 24 34High 4 6
Catastrophic 5HIGH
4
3MEDIUM
2
Insignificant 1LOW
1Highly
unlikely 2 3 4
5Likely /
Frequent
Impa
ct/c
onse
quen
ce o
n in
frast
ruct
ure
if cli
mat
e ev
ent
occu
rs
Likelyhood/probability of climate event occuring
6
8
16
4
Future Climate
12
Impact of climate
changes
Impact of not maintaining
infrastructure in a state of good repair

11
Impacts on the service or the community if the infrastructure fails
1. Emergency Response
With respect to the infrastructure or infrastructure component being assessed, a loss of performance or failure due to climate loading may affect:
• Procedures and systems to address:• Severe storm events• Flooding• Ice dams• Water damage

12
2. Insurance and Legal ConsiderationsWith respect to the infrastructure or infrastructure component being assessed, a loss of performance or failure due to climate loading may affect:
• Insurance rates• The ability to acquire insurance• Insurance policy limitations and exclusions• Legal impacts and liability
3. Policy Considerations
With respect to the infrastructure or infrastructure component being assessed, a loss of performance or failure due to climate loading may affect:
• Codes• Guidelines• Standards• Internal operations and maintenance policies and
procedures• Levels of Service policy• Land use planning

13
4. Social Effects
With respect to the infrastructure or infrastructure component being assessed, a loss of performance or failure due to climate loading may affect:
• Accessibility to critical facilities such as hospitals, fire and police services
• Energy supply to a community• Dislocation of affected populations • Provision of basic services such as potable water distribution and
wastewater collection• Closure of schools and other public services• Destruction or damage to heritage buildings, monuments, etc. or
historically important resources
5. Environmental Effects
With respect to the infrastructure or infrastructure component being assessed, a loss of performance or failure due to climate loading may cause:• Release of toxic, controlled or deleterious substances• Degradation of water quality• Damage to sensitive ecosystems• Physical harm to birds and animals• Contamination of potable water supplies• Public perception and interaction

14
6. Fiscal Impacts
With respect to the infrastructure or infrastructure component being assessed, a loss of performance or failure due to climate loading may cause:
• Drain on current/future financial resources to deal with unplanned repairs, maintenance and/or replacements
• Shifting financial resources from other community priorities• Impacts on services and/or levels of service• Community economic impacts and/or hardships
Mitigating Risks and Adaptation Measures